if families matter most, where do schools come in? · if families matter most, where do schools...
TRANSCRIPT
chapter 5
If Families Matter Most,Where Do Schools Come In?
Caroline M. Hoxby
Families and Schools
Most people believe that a child’s family is the most importantdeterminant of his or her life outcomes—not just family-relatedoutcomes like marriage but also achievement outcomes like testscores, whether the child graduates from college, and wages laterin life. Most people are right: the widespread belief in families’importance is amply supported by statistical evidence, some ofwhich I review in this chapter. Nonfamily influences on childrenhave much less powerful effects on childrens’ outcomes—by atleast an order of magnitude.
Some people find such evidence profoundly discouraging be-cause they would like children’s outcomes to be largely indepen-dent of family circumstances. Such people tend to react to theevidence in one of two ways. Some resist the statistics and hopethat, by combining the numbers in some new way, they will findthat families are not very important (and that nonfamily factors,such as schools, are). Others decide that policy efforts should befocused on improving family circumstances (through incometransfers, antidrug programs, and so forth) instead of reforming
89
.......................... 8774$$ $CH5 09-10-01 10:07:29 PS

90 Caroline M. Hoxby
schools or other institutions that affect children more directly. Nei-ther of these reactions is very productive. On the one hand, familyeffects are of such great magnitude that varying how statistics arecomputed has little effect on the central conclusion that familiesare extremely important. On the other hand, a key family factorthat affects children is parents’ own education, so that it is hard toimprove one generation’s achievement without having first im-proved the achievement of the previous generation!
Moreover, both of these reactions are misguided because it iswrong to think of families and schools as alternative influences onchildren—so that, if families are important, schools are not. Infact, one of the ways in which ‘‘good’’ families benefit their chil-dren is by choosing good schools for them. On the one hand, it isright to attribute this ‘‘good school’’ effect to families becauseschool quality is a resource that they choose to provide (like nutri-tious meals or comfortable living space). On the other hand, if nogood schools were available, a family’s ability to benefit its chil-dren would be limited. Moreover, well-planned school reforms canexploit the power of families, making their influence better. Essen-tially, the logic of such a reform is to improve parents’ influenceby giving them incentives to be better, more informed, more activeconsumers of education. Reforms can also make parents betterconsumers by eliminating arbitrary constraints on their choices.Finally, a reform can improve parents’ effects by raising their in-centives to make investments in their children’s education that arecomplementary to schools.
An example unrelated to schools may help with the essentiallogic. Families produce good nutritional status by being good con-sumers at the grocery store and by preparing food wisely. If achange in the grocery store industry—say, better labeling of foodand availability of nutritious recipes—made families into bettergrocery consumers and better producers of meals, nutritionalstatus would increase. The improvement in nutrition would takeplace even though the vast majority of nutritional status was deter-mined within the family, both before and after the change in theindustry.
.......................... 8774$$ $CH5 09-10-01 10:07:29 PS

91If Families Matter Most
This chapter is about the links between families and schools. Iexplore the importance of families for children’s outcomes, payingparticular attention to the school-related channels through whichfamily effects work. I also describe how family effects work betterunder some schooling institutions than under others. This descrip-tion naturally leads toward some discussion about school reform,but the primary purpose of the chapter is evidentiary.
The Importance of the Family
From precolonial times onward, observers of American children haveseen widely differing levels of achievement, regardless of whetherthe measure was literacy, numeracy, familiarity with literary andscientific works, or the ability to prepare and write sophisticatedarguments. Observers attributed the variation in achievement toseveral sources: differences in children’s ability and motivation,differences in the schooling resources available to children, anddifferences in children’s home environments.1 By the early 1960s,however, many people who were concerned about disparateachievement had become focused on the idea that schooling re-sources accounted for most of the disparity. In particular, they be-lieved that differences in resources accounted for most of theachievement disparities among ethnic groups and income groups.For instance, they thought that, although there were more- andless-able white students and more- and less-able black students,the difference between the achievement of the average white stu-dent and the average black student was largely attributable to theblack students’ attending schools with lower spending, fewer text-books, fewer teachers, and so on.
1. The United States Bureau of Education (later the Office of Education andthen the Department of Education) published numerous studies comparing thepersistence, promotion, educational attainment, and achievement of differentgroups of students, especially urban, rural, black, white, and immigrant children.The Bureau of Education also published studies comparing resources (spending,buildings, books, teachers, and so on) across different schools. See the Bulletinsof the Bureau of Education—for instance, no. 39 (1916).
.......................... 8774$$ $CH5 09-10-01 10:07:29 PS

92 Caroline M. Hoxby
Into this (rather complacent) belief system was dropped, in1966, the Equality of Educational Opportunity Commission(EEOC) report. The EEOC report revealed that, once researcherscontrolled for differences in students’ family backgrounds, differ-ences in school resources accounted for almost none of the dispar-ity in achievement. That is, the report concluded that familiesmattered a lot and that schools hardly mattered at all:
It is known that socioeconomic factors bear a strong relation to aca-demic achievement. When these factors are statistically controlled,however, it appears that differences between schools account for onlya small fraction of differences in pupil achievement.2
Reviewing the EEOC report, Mosteller and Moynihan noted that,if anything, the above statement greatly understated the results:
The pathbreaking quality of the EEOC had to do with its analysis ofthe relation of variation in school facilities to variation in levels ofacademic achievement. It reported so little relation as to make it al-most possible to say there was none.3
Because the report had been expected to verify existing beliefs, itsconclusions were shocking to the very groups that had proposedthat it be commissioned: educators, civil rights leaders, and muchof the United States Congress. (The 1964 Civil Rights Act includedthe commission for a study which became the EEOC project. Be-cause the survey and analysis was conducted by a team headed byJames Coleman of Johns Hopkins University, the report is oftencalled the ‘‘Coleman Report.’’)
The basic statistics contained in the Coleman Report were valid.
2. James S. Coleman, Ernest Q. Campbell, Carol J. Hobson, James McPart-land, Alexander M. Mood, Frederic D. Weinfeld, and Robert L. York, Equalityof Educational Opportunity (Washington, D.C.: United States GovernmentPrinting Office for the National Center for Education Statistics, 1966), pp.21–22.
3. Frederick Mosteller and Daniel P. Moynihan, ‘‘A Pathbreaking Report:Further Studies of the Coleman Report,’’ in Frederick Mosteller and Daniel P.Moynihan, eds., On Equality of Educational Opportunity (New York: RandomHouse, 1972), p. 15.
.......................... 8774$$ $CH5 09-10-01 10:07:30 PS

93If Families Matter Most
In fact, when the report was issued, a number of scholars scram-bled to reanalyze the EEOC data and found (somewhat to theirsurprise) that their analyses broadly confirmed the statistics in thereport.4 Moreover, the report’s statistics remain largely valid: aresearcher could generate similar statistics today using up-to-dateeducational surveys. Despite the general accuracy of its statistics,however, the Coleman Report created untold confusion aboutfamilies and schools. This was because James Coleman misinter-preted the statistics. Unfortunately, Coleman’s problems with in-terpretation were followed by nearly everyone who commented onor reanalyzed the EEOC data in the fifteen years following thereport’s release.
The interpretation problem began with the fact that Coleman(and his followers and critics) largely failed to recognize (and cer-tainly did nothing to account for) the fact that school resourcesare not randomly assigned to families. The school that a child at-tends is determined by her or his own family’s income, job loca-tion, tastes, knowledge about educational opportunities, and soon. In 1964, it was no accident that the children of bankers andeducators tended to attend schools replete with resources, whilethe children of poor farmers tended to attend schools with meagerresources.
One consequence of not recognizing that family characteristicsdetermine children’s schools was that Coleman underestimated theimportance of families relative to schools! That is, it is not enoughto compare two families who appear to be similar but whose chil-dren attend schools with widely different resources. The familywhose child attends the well-financed schools is likely to, say, have
4. See, for instance, Eric Hanushek and John F. Kain, ‘‘On the Value ofEquality of Educational Opportunity as a Guide to Public Policy,’’ in Mostellerand Moynihan, eds., On Equality of Educational Opportunity; David J. Armor,‘‘School and Family Effects on Black and White Achievement: A Reexaminationof the USOE Data,’’ in Mosteller and Moynihan, eds., On Equality of Educa-tional Opportunity; and Marshall S. Smith, ‘‘Equality of Educational Opportu-nity: The Basic Findings Reconsidered,’’ in Mosteller and Moynihan, eds., OnEquality of Educational Opportunity.
.......................... 8774$$ $CH5 09-10-01 10:07:31 PS

94 Caroline M. Hoxby
more wealth (a variable not measured by the EEOC survey) thanthe family whose child attends the poorly financed one. In otherwords, Coleman and his contemporaries attributed the effects ofmany unobserved family characteristics to schools.
This first flaw in Coleman’s interpretation did not greatly alterreception of the EEOC report because readers were alreadyshocked by the degree to which families, instead of schools, ac-counted for the variation in achievement. If a thoughtful critic hadrevealed that Coleman’s statistics understated the importance offamilies and overstated the importance of schools, it is doubtfulwhether he would have intensified the (already strong) reaction tothe report.
The second consequence of Coleman’s neglecting the fact thatfamily circumstances determine children’s schools was far moreserious. He (and his followers and critics) ignored the fact that oneof the key ways in which families affect their children is throughchoosing or determining the schools that they attend. What arethe implications of this fact?
• First, giving parents information and resources that enablethem to choose schools more wisely is likely to improve stu-dent achievement significantly.
• Second, relaxing arbitrary institutional or resource con-straints on parents that prevent them from sending their chil-dren to the school they prefer is likely to improve studentachievement significantly.
What Coleman’s evidence did show was that simply giving moreresources to schools (in the absence of interaction between familiesand those resources) was unlikely to improve student achievementsignificantly.
Put another way, Coleman (and those who followed him)framed the question as families versus schools, perhaps becausetheir implicit agenda was to find support for policies that workedby imposing resources on schools, regardless of the cooperation of
.......................... 8774$$ $CH5 09-10-01 10:07:31 PS
95If Families Matter Most
local families. They therefore ignored the implications of evidencethat families who sought high achievement consistently soughtgood schools as a mechanism for achieving their goals. If achieve-ment-prone families could have attained their goals withoutschools, it is not likely that they would have consistently soughtout some schools and avoided others. A better way to have framedthe question would have been to hypothesize that there is (1) someachievement that a school can create without any interaction withfamilies; (2) some achievement that families can create withoutusing a school as a learning device; and (3) some achievement thatis created in a school when the families it serves are ‘‘invested’’ init, help determine how its resources are used, and support its activ-ities. It is the goal of this chapter to focus on the last of these threechannels by which achievement can be improved. I describe theinteractions between families and schools and point out policiesthat are likely to improve such interactions. In this, the chapterdeparts from much of the ongoing literature on families andschools, which is still (unproductively) obsessed with families ver-sus schools.
There is substantial evidence that his or her family is the mostimportant determinant of a student’s outcomes. In practice, socialscientists rely on a limited number of relatively crude measures offamily background: parents’ education, family income, number ofchildren in the family, race/Hispanic ethnicity, parental involve-ment with the school, and availability of learning-related resources(like books) in the home. It is possible to augment this list, ofcourse, but even this short list of variables explains far more varia-tion in student outcomes than is explained by school input vari-ables, such as per-pupil spending, class size, teachers’ salaries,teachers’ credentials, books per student, and computer availabilityin the school. Indeed, the combined explanatory power of schoolinput variables and neighborhood variables (such as the educa-tional, income, and racial composition of the local population)does not come close to matching that of family background vari-ables.
.......................... 8774$$ $CH5 09-10-01 10:07:32 PS

96 Caroline M. Hoxby
Some of the most recent evidence on this point comes from theNational Educational Longitudinal Survey (NELS), which beganfollowing a group of 24,599 eighth-graders in 1988.5 The studentsare still too young to have finished their education or earned wagesthat reflect their likely careers, but they were tested in May 1992(at the end of the twelfth grade for the typical student) in foursubjects: reading, mathematics, history, and science. One can useregression to apportion the explained variation in the students’test scores among family background variables, school input vari-ables, and neighborhood variables. I used a regression that in-cluded, specifically:
Family variables: the maximum of parents’ years of completed educa-tion, family income, indicators for race and Hispanic ethnicity, num-ber of siblings; indicators for parents’ having attended a school event,parents’ having planned courses with child, parents’ knowing gradua-tion requirements, having more than 50 books at home, having a cal-culator available for child’s use with homework, family having usedthe library, family having visited a museum.
School input variables: per-pupil spending, average class size, mini-mum teacher salary, average teacher salary, maximum teacher salary,percentage of teachers who are certified in their teaching area, percent-age of teachers who have masters’ degrees, average experience ofteachers, number of books per student, number of computers per stu-dent, number of counselors per student.
Neighborhood variables: in addition to indicators for census regionin which the family lives, the following variables are used, both at thelevel of the school district in which the family lives and at the level ofthe metropolitan area in which it lives: mean household income, anindex of income inequality, percentage of households below poverty,percentage of households with incomes above $50,000, percentage ofpopulation who are black, percentage of the population who are His-panic, percentage of the population who are Asian, percentage of theadult population with a high school degree, percentage of adult popu-
5. The NELS used a complex sampling scheme, which called for purposefuldropping of some students and ‘‘freshening’’ the sample with other students. Asa result, the 1988 wave of the survey contained 24,599 eighth-graders, but the1990 wave contained 19,402 students and the 1992 wave contained 16,315 stu-dents.
.......................... 8774$$ $CH5 09-10-01 10:07:32 PS

97If Families Matter Most
lation with some college education, percentage of adult populationwith a baccalaureate degree.6
In the regression just described, the family variables account for34 to 105 times as much variation as the school input variablesdo. (There is a range of estimates because family variables accountfor different amounts of variation on different subject tests.) Fam-ily variables account for 12 to 24 times as much variation as neigh-borhood variables (income, educational attainment, and racialcomposition of the school’s district population; region of the coun-try) do.7 Put another way, family variables explain 11 to 14 timesas much variation in students’ test scores as school inputs andneighborhood variables combined. See figure 1 for a summary ofhow the explained variation in students’ mathematics scores is ap-portioned among family, school, and neighborhood variables.
Of course, test scores have their limitations as outcomes. Theadvantage of using test scores is that they are available for peoplewho were students only a few years ago. The disadvantage of testscores is that they are an intermediate outcome—that is, one caresabout test scores not so much for themselves, but because they aregood predictors of other, later outcomes about which one caresmore directly: a student’s ultimate educational attainment, occu-pation, income, and so on.
To examine some later outcomes, I turn to the National Longi-
6. There are nine census regions. The Gini coefficient is the index of house-hold income inequality.
7. Author’s calculations using United States Department of Education, Na-tional Center for Education Statistics, National Education Longitudinal Study,1988: Third Follow-up, restricted access computer file (Washington, D.C.: Na-tional Center for Education Statistics, 1996). It may be useful to know that theF14,8345-statistic for the hypothesis that the family variables are jointly equal tozero is 146 for reading and language arts, 213 for mathematics, 157 for history,and 178 for science. The F11,8345-statistic for the hypothesis that the school inputvariables are jointly equal to zero is 5 for reading and language arts, 6 for mathe-matics, 5 for history, and 8 for science. The F30,8345-statistic for the hypothesisthat the neighborhood variables are jointly equal to zero is 2 for reading andlanguage arts, 7 for mathematics, 4 for history, and 3 for science.
.......................... 8774$$ $CH5 09-10-01 10:07:32 PS

98 Caroline M. Hoxby
Figure 1. Variations in Twelfth-Graders’ Math ScoresThat Are Explained by Family, School Input, and
Neighborhood Variables
93.4%
3.8%
2.8%
Family Variables
NeighborhoodVariables
School InputVariables
tudinal Survey of Youth (NLSY), another representative surveythat began following 12,686 young Americans in their teens andhas continued through their middle thirties.8 I examine their out-comes at age thirty-three, by which age most have completed theireducation and settled into a job that is reasonably indicative oftheir career prospects. The two later outcomes that are most oftenexamined are income and completed years of education. If oneuses regression to explain these two outcomes with the family,school, and neighborhood variables described above, one findsthat family variables explain fourteen times as much variation inincome as school input variables do and that family variables ex-plain twenty-three times as much variation in income as neighbor-
8. Specifically, the NLSY began in 1979 with 12,686 young people betweenthe ages of 14 and 21 (inclusive). The NLSY respondents have been resurveyedevery year since then, and the most recent available data are from the 1998 sur-vey, when the respondents were aged 33 to 40.
.......................... 8774$$ $CH5 09-10-01 10:07:33 PS

99If Families Matter Most
hood variables do.9 Also, one finds that family variables explainnineteen times as much variation in educational attainment asschool input variables do and that family variables explain twenty-four times as much variation in educational attainment as neigh-borhood variables do.10 Summarized another way, family variablesgenerally account for nine to eleven times as much variation inlater outcomes as school inputs and neighborhood variables com-bined. See figures 2 and 3 for how the explained variation in stu-dents’ later income and educational attainment is apportionedamong family, school, and neighborhood variables.11
If one is interested in school reform, is it useful to know howmuch of the variation in outcomes is accounted for by family ef-fects? The answer is yes if school reform can affect the relation-ships between families and schools and can thereby alter familyeffects. Because family effects explain so much more variation inoutcomes than do school effects, a small improvement in familyconduct that comes about through school reform may be muchmore useful than a relatively large change in school inputs. In otherwords, family effects are so important that school reformers areneglectful if they do not attempt to partly improve family effects.
Channels for Family Effects
One can distinguish between three types of family variables: (1)those that are not under the family’s control (race, ethnicity); (2)
9. Author’s calculations using United States Department of Labor, Bureauof Labor Statistics, The National Longitudinal Survey of Youth, 1979–1998, re-lease 10.0, restricted access computer file (Columbus, Ohio: Center for HumanResource Research, Ohio State University, 1999).
10. For the regression in which completed years of education is the dependentvariable, the F-statistic for the hypothesis that the family variables are jointlyequal to zero is 205, the F-statistic for the hypothesis that the school input vari-ables are jointly equal to zero is 3, and the F-statistic for the hypothesis that theneighborhood variables are jointly equal to zero is 3.
11. The NLSY does not have a twelfth-grade test, but its respondents didtake the Armed Services Vocational Aptitude Battery (ASVAB) set of tests. It isinteresting to note that if one takes students’ standardized scores on the languagearts and mathematics components of the ASVAB tests and regresses these scores
.......................... 8774$$ $CH5 09-10-01 10:07:33 PS
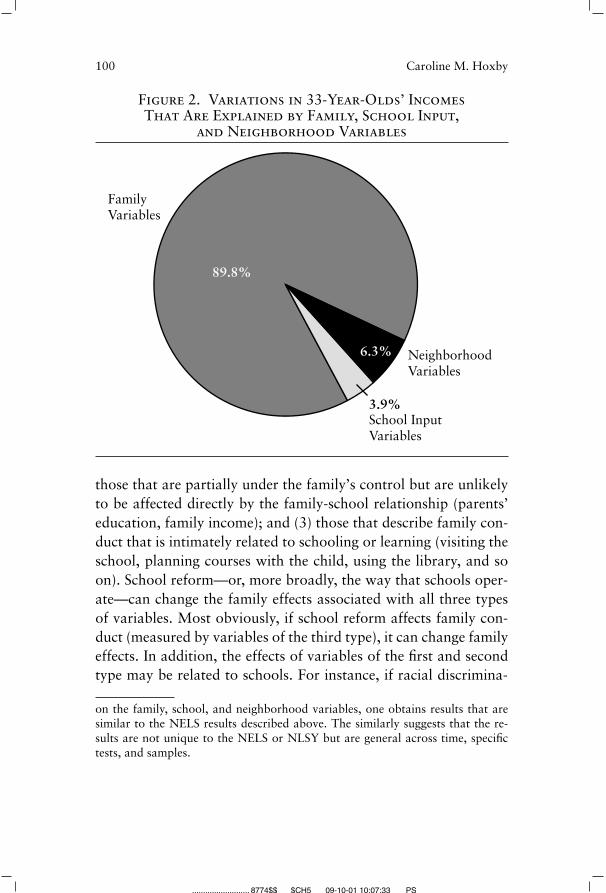
100 Caroline M. Hoxby
Figure 2. Variations in 33-Year-Olds’ IncomesThat Are Explained by Family, School Input,
and Neighborhood Variables
89.8%
6.3%
3.9%
Family Variables
NeighborhoodVariables
School InputVariables
those that are partially under the family’s control but are unlikelyto be affected directly by the family-school relationship (parents’education, family income); and (3) those that describe family con-duct that is intimately related to schooling or learning (visiting theschool, planning courses with the child, using the library, and soon). School reform—or, more broadly, the way that schools oper-ate—can change the family effects associated with all three typesof variables. Most obviously, if school reform affects family con-duct (measured by variables of the third type), it can change familyeffects. In addition, the effects of variables of the first and secondtype may be related to schools. For instance, if racial discrimina-
on the family, school, and neighborhood variables, one obtains results that aresimilar to the NELS results described above. The similarly suggests that the re-sults are not unique to the NELS or NLSY but are general across time, specifictests, and samples.
.......................... 8774$$ $CH5 09-10-01 10:07:33 PS
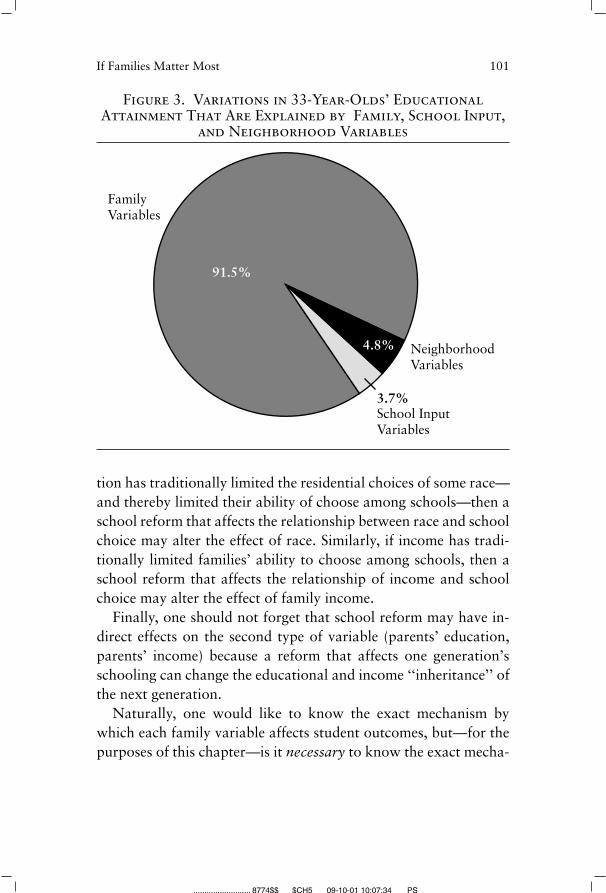
101If Families Matter Most
Figure 3. Variations in 33-Year-Olds’ EducationalAttainment That Are Explained by Family, School Input,
and Neighborhood Variables
91.5%
4.8%
3.7%
Family Variables
NeighborhoodVariables
School InputVariables
tion has traditionally limited the residential choices of some race—and thereby limited their ability of choose among schools—then aschool reform that affects the relationship between race and schoolchoice may alter the effect of race. Similarly, if income has tradi-tionally limited families’ ability to choose among schools, then aschool reform that affects the relationship of income and schoolchoice may alter the effect of family income.
Finally, one should not forget that school reform may have in-direct effects on the second type of variable (parents’ education,parents’ income) because a reform that affects one generation’sschooling can change the educational and income ‘‘inheritance’’ ofthe next generation.
Naturally, one would like to know the exact mechanism bywhich each family variable affects student outcomes, but—for thepurposes of this chapter—is it necessary to know the exact mecha-
.......................... 8774$$ $CH5 09-10-01 10:07:34 PS

102 Caroline M. Hoxby
nisms? The answer to this question is no because it turns out that,on the whole, the reforms that are likely to improve some familyeffects are also likely to improve other family effects. The fact thatvarious family effects are affected in the same direction is not purecoincidence. Intuitively, a reform will tend to improve family ef-fects of many kinds if it makes parents more informed, more ac-tive, and less constrained by arbitrary factors.
Nevertheless, we may be interested in the family characteristicsthat are associated, statistically, with a child’s being successful aca-demically. Although the effect of a given characteristic does varyslightly with the outcome that one uses to measure a child’s suc-cess—test scores, educational attainment, income, and so on—thefamily characteristics that are important statistically for one out-come are important statistically for other outcomes. All the familycharacteristics included in the regression described above are typi-cally statistically significant predictors of outcomes.12
Parents’ completed years of education is the family characteris-tic that typically has the greatest statistical significance in regres-sions like that described above. Family income has less importancebut is another significant predictor of a child’s achievement.13 Notsurprisingly, parents who are more educated and families withhigher incomes tend to have children who are higher achievers.Family conduct variables that are statistically significant predictorsof good student outcomes include owning an atlas, owning a dic-tionary, owning more than fifty books, having a computer forchild’s use with homework, having a calculator for child’s use with
12. In a regression, t-statistics are commonly used to measure the statisticalsignificance of effects. If an effect has a t-statistic with an absolute value of 1.96,then it has only a 5 percent probability of being a zero effect. A t-statistic that islarger than 1.96 in absolute value has an even smaller probability of being a zeroeffect.
13. For instance, when test scores are the outcome, parents’ education has at-statistic between 19 and 22 while parents’ income (which is also important) hasa t-statistic between 9 and 11. When students’ later educational attainment is theoutcome, parents’ education has a t-statistic of 29, while parents’ income has at-statistic of 2. When students’ later income is the outcome, parents’ educationhas a t-statistic of 8 while parents’ income has a t-statistic of 5.
.......................... 8774$$ $CH5 09-10-01 10:07:34 PS

103If Families Matter Most
homework, having attended a school event, parents’ checking thathomework is done, parents’ planning course-taking with child,using the library, visiting science or history museums, parents’knowing what courses child is taking, parents’ knowing how wellchild is doing in school, and parents’ knowing graduation require-ments.14
Does it really matter if each of the above-mentioned family con-duct variables has an independent, causal effect on children? Forinstance, it may be that using the library and having a calculatoravailable are symptoms of parent’s knowing more about their chil-dren’s schooling. For the purposes of this chapter, it does not mat-ter which family conduct variables have a causal effect so long assome alterable behaviors or attitudes have a causal effect. Whydoes it not matter? First, in each case in which I present evidencethat schools can affect family conduct, I rely on a source of varia-tion in schools’ operation that does not depend on the decisions ofindividual families. This is an important distinction that will be-come clear through examples. Second, when I present evidencethat schools’ operations foster a particular family behavior (suchas attending school events), I am not attempting to focus attentionon that particular behavior. Indeed, the conduct variables are
14. The t-statistics for these family characteristics are owning an atlas, t-statisticof about 3; owning a dictionary, t-statistic of about 5; owning more than fiftybooks, t-statistic of about 5; having a computer for child’s use with homework,t-statistic of about 3; having a calculator for child’s use with homework, t-statisticof about 5; having attended a school event, t-statistic of about 4; parents’ check-ing that homework is done, t-statistic of about 4; parents’ planning course-takingwith child, t-statistic of about 7; using the library, t-statistic of about 11; visitingscience or history museums, t-statistic of about 9; parents’ knowing what courseschild is taking, t-statistic of about 4; parents’ knowing how well child is doing inschool, t-statistic of about 3; and parents’ knowing graduation requirements,t-statistic of about 3.
The effects described come from regressions in which the explanatory vari-ables are the relevant family conduct variable plus all the other family, schoolinput, and neighborhood variables listed on pages 95–96. The dependent vari-ables are twelfth-grade reading scores, twelfth-grade mathematics scores, educa-tional attainment at age 33, and income at age 33. The t-statistics areapproximate because they vary slightly with the outcome.
.......................... 8774$$ $CH5 09-10-01 10:07:35 PS

104 Caroline M. Hoxby
highly correlated, and the effect is probably on several related be-haviors.
Parents’ Choosing Better Schools
Some commentators doubt whether most families make inten-tional choices about their children’s education. Other commenta-tors assert that, to the extent that families do make intentionalchoices, they are guided by superficial characteristics such as theappearance of buildings or success in sports.
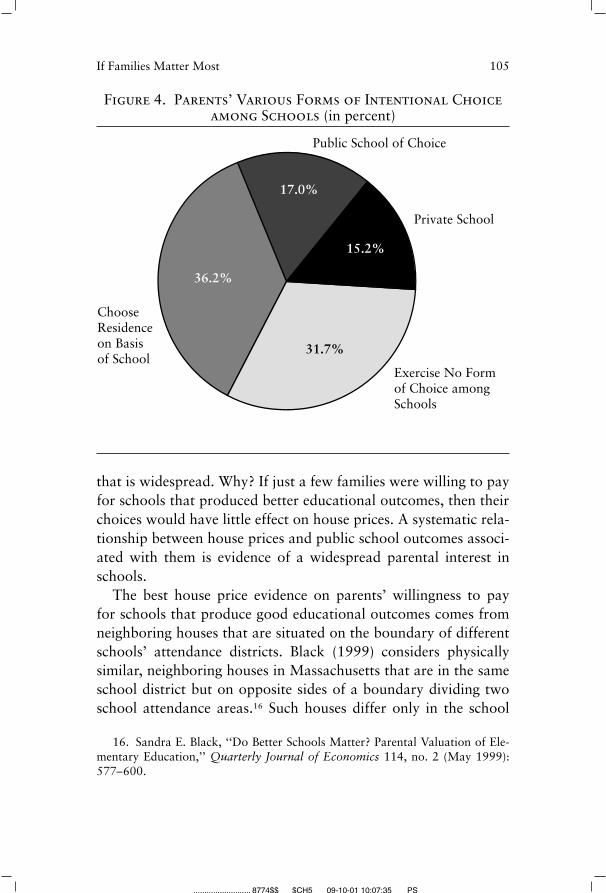
Survey evidence suggests that the majority of parents do makeintentional choices about schools. Among nonrural parents sur-veyed in the 1996 National Household Education Survey (NHES),15.0 percent chose their child’s school by selecting a privateschool, another 16.8 percent chose their child’s school by selectinga magnet school or other public school of choice (that is, someform of public school choice was available in their area and theytook advantage of it), and the remaining parents sent their childrento the school assigned to their residence. Within this last categoryof parents, however, 54 percent exercised some choice amongschools by choosing their residence partly in order to choose aschool. All in all, 68.6 percent of parents made an intentionalchoice about their child’s school.15 See figure 4 for a summary ofthese statistics.
Another type of evidence—and a type that suggests that parentscare about achievement and not just buildings or sports—comesfrom the amount that families are willing to pay for schools thatproduce better educational outcomes. House prices are the mainform by which such payments are made in the United States. Whenthe price of a house reflects the quality of the school associatedwith it, it is evidence of a demand for school quality among parents
15. Author’s calculation using United States Department of Education, Na-tional Center for Education Statistics, National Household Education Survey,1996, restricted access computer file (Washington, D.C.: National Center for Ed-ucation Statistics, 1998). I exclude rural parents from this analysis because, inmany rural areas, there is only one school that is reasonably nearby.
.......................... 8774$$ $CH5 09-10-01 10:07:35 PS
105If Families Matter Most
Figure 4. Parents’ Various Forms of Intentional Choiceamong Schools (in percent)
36.2%
17.0%
15.2%
31.7%
Choose Residence on Basis of School
Public School of Choice
Private School
Exercise No Form of Choice among Schools
that is widespread. Why? If just a few families were willing to payfor schools that produced better educational outcomes, then theirchoices would have little effect on house prices. A systematic rela-tionship between house prices and public school outcomes associ-ated with them is evidence of a widespread parental interest inschools.
The best house price evidence on parents’ willingness to payfor schools that produce good educational outcomes comes fromneighboring houses that are situated on the boundary of differentschools’ attendance districts. Black (1999) considers physicallysimilar, neighboring houses in Massachusetts that are in the sameschool district but on opposite sides of a boundary dividing twoschool attendance areas.16 Such houses differ only in the school
16. Sandra E. Black, ‘‘Do Better Schools Matter? Parental Valuation of Ele-mentary Education,’’ Quarterly Journal of Economics 114, no. 2 (May 1999):577–600.
.......................... 8774$$ $CH5 09-10-01 10:07:35 PS

106 Caroline M. Hoxby
that their residents’ children must attend; they share the sameneighborhood, the same property tax rates, and local public goodsother than schools (such as police, fire, and recreation services).She finds that a house associated with school that has test scoresthat are 5 percent higher carries a market price that is 2.5 percenthigher. She does not find evidence that people are willing to payfor superficial characteristics of schools such as newer buildings.
Other evidence from house prices comes from school financeequalization programs, some of which force districts to invest infewer school inputs than local taxpayers are willing to purchase.In districts that are constrained to spend less than they voluntarilyspent, the response to the imposition of an equalization programis a fall in house prices—showing that local families valued theability to choose (and pay for) the resources in their school.17
Moreover, Brunner and Sonstelie show that, in such districts,foundations arise that solicit donations from local families and payfor the school inputs banned by the school finance equalizationprograms.18 In short, the evidence from the housing market sug-gests that many parents do value their ability to choose betterschools—and are willing to pay for them.
Although the survey and house price evidence suggests thatmany parents do make intentional choices about schools, the evi-dence does not imply that all parents are equally able to exerta ‘‘good’’ family effect by making the investment in their child’seducation that they would like to make. A better school costsmore—within the public sector as well as the private sector. Fami-lies may have restricted school choices because they can affordonly a limited range of housing, because they would face racial or
17. See Caroline M. Hoxby, ‘‘All School Finance Equalizations Are Not Cre-ated Equal,’’ Quarterly Journal of Economics, 2001. Such districts exist espe-cially in states like California and New Mexico that effectively imposed bindingrestrictions on per-pupil spending as part of their school finance equalizationprograms.
18. Eric Brunner and Jon Sonstelie, ‘‘Coping with Serrano: Voluntary Contri-butions to California’s Local Public Schools,’’ in 1996 Proceedings of the Eighty-Ninth Conference on Taxation, held under the auspices of the National Tax Asso-ciation, 1996, 372–81.
.......................... 8774$$ $CH5 09-10-01 10:07:36 PS

107If Families Matter Most
ethnic discrimination outside of a limited range of housing, be-cause they cannot afford private school tuition, or simply becausethere are few public school districts and/or few private schools intheir area.
For instance, in the NHES survey, the probability that a familyexercised some choice over their child’s school varied with thefamily’s income and race. For instance, among nonrural familieswith incomes between $10,000 and $15,000, 5.3 percent selecteda private school, 21.4 percent took advantage of a local publicschool choice program, and 26.6 percent chose their residencepartly on the basis of the school. In contrast, among nonrural fam-ilies with incomes of $75,000 or more, 28.8 percent selected aprivate school, 10.4 percent took advantage of a local publicschool choice program, and 42.2 percent chose their residence onthe basis of the school19 (see figure 5).
Controlling for income, black and Hispanic families are morelikely than white families to make intentional school choices byselecting a private school or a public school of choice, but they areless likely than white families to make intentional school choicesby choosing their residence on the basis of the school. This sug-gests that discrimination that differs across residential areas mayindeed be a constraint on black and Hispanic families. That is,their ability to exercise choice among public schools may be lim-ited by residential housing patterns. For instance, consider a rela-tively narrow income band such as $30,000 to $35,000—that is,examine racial differences in school choice while effectively hold-ing income constant; 14.8 percent of black families, 14.1 percentof Hispanic families, 4.6 percent of Asian families, and 12.1 per-cent of white families with incomes of $30,000 to $35,000 useprivate schools. Within the same income band, 25.6 percent ofblack families, 17.0 percent of Hispanic families, 36.4 percent ofAsian families, and 10.3 percent of white families use publicschools of choice. Finally, within the same income band, 29.9 per-
19. These calculations and those in the next two paragraphs are author’scalculations using the NHES, United States Department of Education, 1998.
.......................... 8774$$ $CH5 09-10-01 10:07:36 PS

108 Caroline M. Hoxby
Figure 5. Parents’ Various Income Ranges Who ExerciseForms of Choice among Schools (in percent)
5.3%26.6%
46.8%
21.4%
Choose Residence on Basis of School
Public School of Choice
Private School
No Intentional Choice among Schools
Family Income $10,000–$15,000
31.7%
37.0%
12.6%
18.8%
Choose Residence on Basis of School
Public School of Choice
Private School
No Intentional Choice among Schools
Family Income $25,000–$30,000
35.9%
31.9%
15.9%
16.4%
Choose Residence on Basis of School
Public School of Choice
Private School
No Intentional Choice among Schools
Family Income $40,000–$50,000
42.2% 18.7%
28.8%10.4%
Choose Residence on Basis of School
Public School of Choice Private
School
No Intentional Choice among Schools
Family Income $75,000 or More
cent of black families, 30.4 percent of Hispanic families, 31.8 per-cent of Asian families, and 48.4 percent of white families choosetheir residence on the basis of the school (see figure 6).
Of course, income constraints and discrimination do not ac-count for all the parents who make no intentional choices aboutschools. For instance, when one looks just at white parents withincomes of $35,000 to $40,000, one finds that parents who havemore education are more likely to make intentional school choices:
.......................... 8774$$ $CH5 09-10-01 10:07:37 PS

109If Families Matter Most
Figure 6. Parents of Various Races/Ethnicities WhoExercise Forms of Choice among Schools
(in percent)
14.7%
29.5%
30.1%
25.6%
Choose Residence on Basis of School
Public School of Choice
Private School
No Intentional Choice among Schools
Black Families with Income $30,000–35,000
30.4%
38.5%
14.1%
17.0%
Choose Residence on Basis of School
Public School of Choice
Private School
No Intentional Choice among Schools
Hispanic Families with Income $30,000–35,000
31.8%
27.3%4.6%
36.4%
Choose Residence on Basis of School
Public School of Choice
Private School
No Intentional Choice among Schools
Asian Families with Income $30,000–35,000
48.4%
29.2%
12.1%
10.3%
Choose Residence on Basis of School
Public School of Choice
Private School
No Intentional Choice among Schools
White Families with Income $30,000–35,000
55 percent of parents who have only a high school degree do sowhile 63 percent of parents with a baccalaureate degree do so.Perhaps more educated parents are more informed or more moti-vated to purposefully choose a school for their children. One mustbe cautious, however, before jumping to the conclusion that par-ents who do not currently seek much information about variousschools’ quality have little inclination to choose good-quality
.......................... 8774$$ $CH5 09-10-01 10:07:37 PS

110 Caroline M. Hoxby
schools. Many families that appear to be disinclined to focus onschool quality are also families that have a restricted set of choices.A family with a restricted set of schools from which to choose haslittle incentive to invest in information about schools.
In short, some family effects that appear to be income effects orracial/ethnic effects are probably not direct effects of income orrace/ethnicity but indirect effects of parents’ limited ability tochoose a school for their children. Can one measure the share offamily income and race/ethnicity effects that is related to schoolsthrough this channel? It is difficult to get a perfect measure, but acrude measure of the public school choice available to a family isa count of the number of districts in its metropolitan area wherethe family would be likely to be able to afford housing and thefamily would not be more than twice as racially/ethnically isolatedas its racial/ethnic group generally is in its metropolitan area.20 Ifone controls for just this crude measure of ability to exercisechoice among public school districts, the explanatory power offamily income and race/ethnicity drops by a third.21 Thus, a goodshare of the family effect of income and race/ethnicity is probablyrelated to schools. A reform that extended school choice to fami-lies who currently have restricted choice would likely decrease thenegative effect (on achievement) of coming from a low-income ora minority family.
20. Specifically, one counts the number of districts that a family could chooseif it were restricted to choose districts in which at least 20 percent of the housingis such that the annual rent or estimated annual mortgage payments would be nomore than 0.3 of the family’s annual income. One also counts the number ofdistricts that a family could choose if its racial group in the district has at least0.5 of the share of the district population that it would have if its racial groupwere spread evenly over the metropolitan area. For instance, if blacks represented10 percent of a metropolitan area’s population, then a district in that metropoli-tan area would be counted as ‘‘available’’ to black families if the district’s popu-lation were at least 5 percent black. If blacks represented 12 percent of ametropolitan area’s population, then a district would be counted as ‘‘available’’to black families if the district’s population were at least 6 percent black.
21. Author’s calculations using the NELS, United States Department of Edu-cation, 1996.
.......................... 8774$$ $CH5 09-10-01 10:07:37 PS

111If Families Matter Most
Parents’ Influence on Curriculum and Pedagogy
Family effects also work through parents’ choosing schools partlybased on curriculum and pedagogy. What are parents’ prefer-ences? The evidence suggests that parents are results-oriented(their liking for a pedagogical technique depends on how theirchild reacts, not on the educational theory that underlies it) andskeptical about pedagogical and curricular innovations. For in-stance, Hess shows that, in schools where parents effectively exer-cise choice, they forestall the rapid introduction and discarding ofcurricular and pedagogical fads.22 Center city schools (over whichlocal parents have little influence) are likely to have ‘‘policychurn,’’ Hess’s term for frequent and erratic changes in pedagogy,curriculum, and school rules. Even the best school policies arelikely to be ineffective if introduced with little consistency. Thus,one means by which parents can have a good family effect on theirchildren is by preventing them from being subjected to policychurn.
In addition, parents are a force that tends to keep schools ori-ented toward student outcomes, rather than educational theories.Some evidence about parents’ being results-oriented comes fromsurveys. For instance, Redfield describes a survey of parents, teach-ers, students, and principals in a school district.23 Among thesegroups, only the parents favored evaluating a school on achieve-ment outcomes such as standardized test scores, the dropout rate,and the share of students who attend college. The ‘‘teachers weremore concerned with non-academic outcomes that might be attrib-utable to themselves,’’ and the principals were too worried about
22. Frederick M. Hess, ‘‘Policy Churn and the Plight of Urban School Re-form,’’ in Learning from School Choice, ed. Bryan C. Hassel and Paul E. Peterson(Washington, D.C.: Brookings Institution, 1998).
23. Doris L. Redfield, ‘‘A Comparison of the Perspectives of Teachers, Stu-dents, Parents, and Principals Concerning the Influences of Teaching on Studentsand the Use of Student Outcomes to Evaluate Teaching,’’ Kentucky Departmentof Education Research Report, 1987 (available through EDRS, accession numberED290765).
.......................... 8774$$ $CH5 09-10-01 10:07:38 PS

112 Caroline M. Hoxby
the legitimacy of various tests to favor their use.24 Redfield’s find-ings are confirmed by the NELS parent surveys in which the major-ity of parents reported that they wanted a greater role in decidingwhether schools, teachers, and administrators were meeting stan-dards. In contrast, most parents were content to let schools man-age themselves internally with regard to textbooks, teachingstrategies, and so on.25
Additional evidence about parents’ preferences, however, comesfrom schools that have incentives to submit to parents’ preferencesbecause they (the schools) are affected by parents’ choices. This isevidence based on parents’ revealed preferences—that is, the pref-erences revealed by their behavior. If we compare metropolitanareas in which parents exercise little choice (because there are onlya few school districts, given the size of the metropolitan area) tothose in which parents exercise significant choice (because thereare many school districts, given the size of the metropolitan area),we can learn about the average parent’s preferences. Choiceamong school districts is particularly good to examine because,though a limited form of choice, it is by far the most pervasiveform of choice in the United States. Also, different metropolitanareas have very different amounts of this form of choice—mainlydue to accidents of history and geography. The diverse experiencesof different metropolitan areas provide variation that is useful em-pirically. Finally, choice among districts is important because dis-tricts are autonomous, both in control and finance. This meansthat they have to compete for parents in a meaningful way.26
24. Apparently, the students perceived the questions somewhat differentlyfrom the other groups since they were mainly worried about random factors(such as illness) that might have affected individual performance.
25. Author’s calculations using NELS base year and second follow-up parentsurveys, United States Department of Education, 1996.
26. For instance, consider the extremes—metropolitan areas with no choiceamong school districts and metropolitan areas that given their size have the maxi-mum amount of district choice that is available in the United States. A goodmeasure of school choice is an index equal to the probability that two randomlyselected students in a metropolitan area attend the same district. Of course, in ametropolitan area like Miami that has only one district, the index is equal to 1.In a metropolitan area like Boston that has more than 90 districts, the index is
.......................... 8774$$ $CH5 09-10-01 10:07:38 PS

113If Families Matter Most
Compared with schools in metropolitan areas with minimalchoice among districts, schools with maximum choice are 35 per-cent more likely to have a curriculum that fulfills the New Basicscriteria in English, math, science, social studies, and foreign lan-guage.27 Such schools are also more likely to ‘‘emphasize disci-pline’’ (an increase of 0.6 on a scale of 1 to 3), have classroomactivities that are ‘‘highly structured’’ (an increase of 1.2 on a scaleof 1 to 3), and have principals who are evaluated (in part) onstudents’ standardized test scores (an increase of 0.4 on a scale of1 to 3). In summary, according to their revealed preferences, theaverage parent prefers a curriculum that is oriented toward coresubjects like reading, writing, mathematics, history, and science;uses outcomes like test scores to evaluate school administrators;
approximately equal to 0.01. The source of these statistics is the United StatesDepartment of Education, School District Data Book: 1990 Census School Dis-trict Special Tabulation, computer file (Washington, D.C.: National Center forEducation Statistics, 1995).
One can compare metropolitan areas with varying degrees of choice amongpublic school districts—minimal, average, maximal. Moreover, one can guaran-tee that the variation among metropolitan areas is generated by local geography,rather than a layout of school districts designed in response to parents’ behavior.One guarantees this by instrumenting for the choice index with the metropolitanarea’s number of natural boundaries—streams and rivers turn out to be the mostimportant natural boundaries, in practice. Instrumenting for choice is importantbecause it allows us to see the long-term, causal effect of school choice on paren-tal behavior. Instrumenting prevents us from mistaking an association betweenchoice and parental behavior for a causal effect of choice on parental behavior.Intuitively, the instrumenting identifies the causal effect of choice because naturalboundaries can (through choice) affect parent behavior but parental behaviorcannot affect the existence of streams, rivers, or other natural boundaries. In thischapter, the effect of choice among public school districts is always estimatedusing the index of choice, instrumental variables based on natural geographicfeatures, and numerous variables that control for metropolitan area characteris-tics such as population, land area, and demographics. Hoxby (2000) containsmuch more detail about the empirical strategy that is briefly described here, in-cluding details on data sources, measures of public and private school choice,and the effects of using instrumental variables.
27. The New Basics standard in question is equivalent to that used for theNational Assessment of Educational Progress (NAEP). To attain the standard, aschool’s high school curriculum must contain four Carnegie units of English,three Carnegie units of mathematics, three Carnegie units of science, three Carne-gie units of social studies, and two Carnegie units of foreign language.
.......................... 8774$$ $CH5 09-10-01 10:07:38 PS

114 Caroline M. Hoxby
and has a school environment that provides structure and disci-pline.28
Parents’ Interacting with and ControllingTheir Child’s School
One means by which parents can have a good ‘‘family effect’’ ontheir child is by judicious control of their child’s experience atschool. Parents know a substantial amount about their child’s abil-ities and how their child is reacting to school, and a child’s schoolexperience is likely to be better if the school makes use of parents’knowledge. For instance, a parent may be able to help a schoolidentify a child’s learning style, interests, or disability. In addition,parents can reinforce their child’s teacher—for instance, by em-phasizing the importance of the subject that the teacher has identi-fied as most needing work. Finally, parents can get directly involvedin their child’s schooling—by participating in school activities,steering their child away from incompetent teachers, planningtheir child’s course of study, being an advocate for their child’sneeds, and so on.
To interact successfully, parents and schools must communicateeffectively and share a sense of common purpose. Why are com-munication and common purpose more prevalent in some schoolsthan others? Both logic and evidence suggest that decentralizationof school decision making is one prerequisite for communicationand common purpose. Simply put, parents can effectively interactwith decision makers at their child’s school, particularly if it is areasonably small school. Most parents cannot effectively interactwith decision makers who preside over many schools because they(the parents) have little or no direct access to such high-ranking
28. In fact, there is evidence that parents may like good grades to a fault.That is, there is more grade inflation (measured by the relationship of a school’sletter grades to its scores on national, standardized tests) in schools that facesignificant parental choice. It may be, however, that parents are not fooled by theinflated letter grades but believe that college admissions officers or employers willbe fooled.
.......................... 8774$$ $CH5 09-10-01 10:07:39 PS

115If Families Matter Most
administrators. In short, if a school is not allowed to make impor-tant curricular or other decisions because authority is centralized,then parents have little incentive to interact with the only schoolstaff to whom they have access (school-level staff).
It is possible that another prerequisite for communication andcommon purpose is parents’ being at least somewhat able tochoose their child’s school. Choice may matter for two reasons.First, when families are able to choose among schools, they aremore likely to end up in a school with other families who sharetheir preferences. Such schools naturally have more communityfeeling and shared purpose. Second, families who have to makechoices among schools tend to force schools to communicate in-formation to them that is relevant to their decision making. Natu-rally, a school prefers to inform parents about its (the school’s)successes and prefers to remain silent about its failings. If parentsneed to decide how well a school is performing relative to the otherlocal schools, they are more likely to insist upon the school’s com-municating information like performance on statewide tests, col-lege admissions, and so on. Moreover, because schools are morelikely to listen to parents in an environment where schools have toremain attractive to parents, parents are more likely to speak upin such an environment.
Evidence on the relationship between parental interaction andschool decentralization comes from data on school consolidations.For instance, consider school consolidations in the state of Con-necticut between 1988 and 1992. Parent surveys before and afterthe period show that parental involvement fell and parent-schoolcommunication deteriorated in schools that were consolidated orotherwise reorganized so that they grew substantially (an enroll-ment increase of at least 25 percent). Relative to parents in thesame schools in prior years, parents in the consolidated schoolswere 12 percent less likely to respond to questionnaires from theschool, 7 percent less likely to say that their school ‘‘communi-cate[d] well’’ with them, 10 percent less likely to participate inparent-teacher organizations, 10 percent less likely to attend a
.......................... 8774$$ $CH5 09-10-01 10:07:40 PS
116 Caroline M. Hoxby
school open house, and 5 percent less likely to check their chil-dren’s homework.29
Evidence on the relationship between parents’ being able tochoose a school and parents’ being involved with a school comesfrom comparing metropolitan areas in which families have moreand less choice among school districts. Compared with parentswho have no choice among districts, parents who live in metropol-itan areas with maximum choice are 70 percent less likely to beignorant of the courses their children are taking and 59 percentless likely to be ignorant of the graduation requirements of theirchild’s school. Compared to parents with no choice, parents withmaximum choice are also 16 percent more likely to be sent stan-dardized test scores whenever the school administers a test, 43percent more likely to have attended a meeting at their child’sschool, 19 percent more likely to have attended a school event,and 50 percent more likely to plan their child’s courses with himover multiple conversations.30
As additional evidence, people often cite differences in parentalconduct between regular public schools and private schools—sinceparents must choose private schools. On the one hand, the differ-ences in parental conduct are striking. For instance, 47 percent ofparents visit their child’s regular public school, while 85 percentof parents visit their child’s private school. On the other hand, itis difficult to interpret this evidence because parents who wouldinteract more with schools under any circumstances may be morelikely to send their child to a private school. Therefore, it is hardto give much weight to such evidence, intriguing though it is.Much more convincing evidence on this front comes from compar-ing parents who are ‘‘lotteried in’’ and ‘‘lotteried out’’ of voucherprograms: see Paul Peterson’s chapter in this volume.
29. Author’s calculations, based on Strategic School Profiles 1992 through1998 and Town and School District Profiles 1987 through 1992, ConnecticutState Department of Education, Bureau of Research, Evaluation, and StudentAssessment, Strategic School Profiles, 1992–93 through 1997–98, computer file(Hartford, Conn.: Connecticut State Department of Education, 1999).
30. The calculations in this and the following three paragraphs are author’scalculations using the NELS, United States Department of Education, 1996.
.......................... 8774$$ $CH5 09-10-01 10:07:40 PS

117If Families Matter Most
Finally, can parents be sufficiently informed about their child’sschool to be a force for good? Consider, for example, whetherparents can discern a school’s value added—that is, how much theschool is adding to children’s learning each year, taking accountof their learning at the end of the previous year. In the NELS sur-vey, parents rate their school on whether it ‘‘places a high priorityon learning,’’ whether they are ‘‘satisfied’’ with the education, andwhether ‘‘the teaching is good.’’ There is a correlation betweenparents’ rating and their school’s value added. In the NELS, aschool’s value added is based on a school-level average of individ-ual students’ value added—specifically, the difference between astudent’s tenth- and eighth-grade knowledge in reading and math,as measured by standardized tests. For instance, in schools withvalue added in the lowest quartile, only 19 percent of parents‘‘strongly agree’’ that their school places a priority on learningand 25 percent of parents ‘‘disagree’’ or ‘‘strongly disagree.’’ Incontrast, in schools with value added in the highest quartile, 32percent of parents ‘‘strongly agree’’ that their school places a pri-ority on learning and only 10 percent of parents ‘‘disagree’’ or‘‘strongly disagree.’’ In schools with value added in the lowestquartile, only 15 percent of parents are ‘‘very satisfied’’ with theeducation; but, in schools with value added in the highest quartile,44 percent of parents are ‘‘very satisfied.’’
Interestingly, the correlation between parents’ ratings andschools’ value added is much higher in metropolitan areas whereparents have a high degree of choice among districts. In fact, re-gression results support the hypothesis that the correlation be-tween parents’ rating and schools’ value added only exists inmetropolitan areas with an above-average degree of choice. Thereis no evidence of a correlation in metropolitan areas with little ofno choice among districts. For instance, in metropolitan areas withmaximum choice, raising a school’s value-added from the lowestto the highest quartiles raises its ‘‘teaching is good’’ rating 2 cate-gories (from ‘‘disagree’’ to ‘‘strongly agree’’ or from ‘‘strongly dis-agree’’ to ‘‘agree’’) and raises its ‘‘satisfied with education’’ rating3 categories (from ‘‘very dissatisfied’’ to ‘‘very satisfied’’). In met-
.......................... 8774$$ $CH5 09-10-01 10:07:41 PS

118 Caroline M. Hoxby
ropolitan areas with no choice among districts, raising a school’svalue-added has no statistically significant effect on its rating.31
Homes That Complement School Activities
Even if one compares families that are equally supportive of theirchildren’s emotional well-being and equally ready to devote re-sources to their children, one still finds differences in the degree towhich families create home environments that actively comple-ment their children’s school activities. Parents may create studyspace or play space for their child; may provide their children withbooks or with toys; may spend time with their children at librariesor shopping malls; and so on. For instance, compared with chil-dren who score in the bottom quartile on reading and math tests,children who score in the top quartile are more likely to use librar-ies with their parents (79 percent versus 48 percent) and visit sci-ence museums with their parents (63 percent versus 27 percent).They are also more likely to come from homes with more thanfifty books (96 percent versus 76 percent), with an atlas (81 per-cent versus 55 percent), with a calculator (98 percent versus 89percent), and with a computer (60 percent versus 27 percent).
Clearly, parents differ in the degree to which they create a homeenvironment that complements a child’s schooling. The relevantquestion is, then, are there schools that increase parents’ inclina-tion to create an environment that complements school? One hy-pothesis is that parents who have made a personal investment intheir child’s schooling are more likely to complement the school athome, in order to increase the value of the investment they havealready made. Evidence that supports this hypothesis comes fromtwo main sources: parents who are aware of having made a per-
31. The results described are from regressions of the parental ratings on ameasure of district choice, an interaction of the choice measure with the school’svalue added, the school’s value added, and a number of metropolitan-level demo-graphic variables. The choice measure and its interaction are instrumented usingmeasures of natural boundaries in the metropolitan area.
.......................... 8774$$ $CH5 09-10-01 10:07:41 PS

119If Families Matter Most
sonal investment because they have just shifted their children frompublic to private school, and parents who are aware of making apersonal investment because they have a lot of choice among pub-lic school districts (and, thus, are aware of paying—either throughtheir house price or through their local taxes—for a better school).
Parents who shift their children from public to private schoolstend to be especially aware of making an investment in their chil-dren’s education—simply because they have to start paying tu-ition. It is interesting to see whether families alter their homeenvironment at the same time. Moreover, it is useful to look withinthe same family over time (rather than across private school andpublic school families at a point in time) in order to hold the fami-ly’s underlying characteristics constant. In the NELS, 192 familiesswitched their children from public to private schools over thecourse of the survey (that is, between eighth and twelfth grades).Although this is a small sample of families and we observe only asmall number of variables both before and after the school move,it is nevertheless possible to see some statistically significantchanges in family behavior. After switching to private schools, thefamilies are 4 percent more likely to own an atlas and 5 percentmore likely to have a specific place for their children to study.
In metropolitan areas where families have a lot of choice amongschool districts, parents are aware of making a personal invest-ment when they choose to live in a high-performing district. Thisis because, as described above, they have to pay for the district—through their house price, their property taxes, or both. Are par-ents in such metropolitan areas more likely to make their homeenvironments complement their children’s schools? Data from theNELS suggest that they are. Compared to metropolitan areas withminimal choice, in metropolitan areas with maximum choice 8percent more parents provide a home environment that supportstheir children’s school experience—according to their school’sprincipal. In addition, 14 percent more parents use libraries withtheir children, 5 percent more visit science museums with their
.......................... 8774$$ $CH5 09-10-01 10:07:42 PS

120 Caroline M. Hoxby
children, 4 percent more have an atlas, 4 percent more have acalculator, and 18 percent more have a computer.32
Family Influence, not the Force forGood That It Could Be
This chapter is by no means the first work to note the importanceof families in student outcomes or to suggest that school reformcan be most efficacious when parents are ‘‘co-opted.’’ There is along tradition of trying to involve parents in their children’s educa-tion. These attempts often take the form of parent training. TheTitle I program, for instance, attempts to train parents so that theycan be school aides. The Comer school program uses moral sua-sion to get parents to learn along with their children.33 Anotherapproach to ‘‘co-opting’’ parents is getting them into the school totalk about their careers, help with projects, or accompany extra-curricular activities. It is not the purpose of this chapter to dismisssuch approaches to parents, but it is important to recognize thatthey essentially try to expand the school to include parents—making them into ‘‘extension students’’ of a sort. It is natural thatschools should try to extend themselves in this way—after all,some parents have plenty to learn and teaching is what schools do.But we have seen that school effects on students are not verystrong. Should we suppose that school effects will be muchstronger on parents, who cannot spend much time at school andwhose habits may be more fixed?
School reforms can only exploit family effects in a significantway if they concede the primacy of families as consumers ofschools and investors in their children’s education. If a reform con-cedes such primacy, how does it operate? It gives parents incen-
32. All these estimates control for family background characteristics, controlfor metropolitan areas’ demographic characteristics, and use instruments forpublic school choice based on natural boundaries.
33. James P. Comer, School Power: Implications of an Intervention Project(New York: Free Press; New York: Maxwell Macmillan International, 1995,�1993).
.......................... 8774$$ $CH5 09-10-01 10:07:42 PS

121If Families Matter Most
tives to be savvy, demanding consumers of schools by making thereward for wise decisions greater and by reducing barriers thatconstrain parents’ choices arbitrarily. In other words, if parentscan gain a lot in terms of their children’s education by engaging inwise conduct, they have incentives to conduct themselves well. If,on the other hand, the system is such that the school that can beobtained by even the best consumer parent is only slightly betterthan the one obtained by the worst, parents will not have muchincentive to alter their conduct. In summary, a school reform thatunreservedly tries to exploit the power of family effects does so byallowing families that conduct themselves well to earn big re-wards. This is essentially different from a reform that tries to ex-ploit the power of school effects by extending schools into theparental domain.
Even within reforms that give parents incentives to exert posi-tive family effects, one can differentiate among a few types of re-form. Some simply give parents a greater range of choices; somego further and make parents more aware of their investment ineducation; and some go even further and pressure schools to beresponsive to parents. The first type of reform—for example, de-centralization of authority—increases parents’ incentives to begood consumers by adding variety to their menu of schools. Thesecond type of reform—for example, a voucher supplied by a pri-vate foundation (so that no money is withdrawn from the regularpublic school budget when a student takes a voucher)—increasesparents’ incentives to compare schools’ efficiency. That is, parentsshould begin comparing schools on the basis of their value addedfor cost. The second type of reform also gives parents incentives tomake investments that are complementary to school, such as fam-ily visits to libraries or a computer for their child’s use. The thirdtype of reform—for example, a charter school program in whichcharter fees come from the regular public school district that losesthe students—makes parents’ more likely to be heard when theyhave concerns and, therefore, increases parents’ incentives to bedemanding consumers, even in regular public schools.
Currently, not all parents are able to earn better education for
.......................... 8774$$ $CH5 09-10-01 10:07:43 PS

122 Caroline M. Hoxby
their children by engaging in wise conduct. As described above,parents currently differ substantially in their ability to exercisechoice, and the evidence suggests that these differences account forat least some—possibly a substantial minority—of the effects offamily income and family race/ethnicity. There is no structural rea-son why poorer families should not be able to choose among nu-merous schools, just as richer families do. To be sure, withoutdrastic changes in school finance, richer families may always beable to spend more on their children’s education than poorer fami-lies do. But it is essentially arbitrary that richer, nonminority fami-lies are more likely to face numerous, small districts while poorand minority families tend to face huge districts from which it iscostly to move. Even under a scenario in which families get perma-nently stuck with the level of per-pupil spending that they cur-rently have, the degree of choice available to poor and minorityfamilies could be made much more similar to that of richer, nonmi-nority families. All that would be required is the breaking downof the residentially based monopoly power of huge school dis-tricts—through district partition or (more easily) charter schoolsor vouchers.
Systematic differences by family income and race account, how-ever, for only some of the many limits on parents’ ability to chooseamong schools—and, thus, account for only some of the weaknessin the incentives for parents to be good consumers and investors.Many well-off, nonminority families have limited choice becausethey live in metropolitan areas with only a few districts. Moreover,choice among public school districts is a weak form of choice, evenin metropolitan areas with the maximum amount of such choice.It is a weak form of choice because families have limited flexibilityonce they have made an initial residential decision and because themechanisms for rewarding effective schools and penalizing ineffec-tive ones are indirect at best.34 Also, public schools are controlled
34. The mechanisms, such as they are, operate through the property tax. SeeCaroline Hoxby, ‘‘The Effects of School Choice on Curriculum and Atmo-sphere,’’ in Earning and Learning: How Schools Matter, ed. Susan E. Mayer andPaul E. Peterson (Washington, D.C.: Brookings Institution, 1999), for a discus-
.......................... 8774$$ $CH5 09-10-01 10:07:44 PS

123If Families Matter Most
politically, and parents are a less concentrated (and thus less effec-tive) interest group than teachers, especially if teachers are union-ized. In areas where regular public schools are constrained byregulations or unions, they may be so much of a kind that parents’do not face meaningfully different alternatives. Many of these lim-its on parents’ ability to be good consumers are relaxed by schoolreforms such as vouchers and charter schools.
Finally, it is currently difficult for a parent to be an informedconsumer. Schools retain as much control of their students’ out-come data as they can. Even schools that face incentives to supplyparents with information prefer to release performance informa-tion selectively. Parents will not be really informed consumers untilschools have incentives to provide information and states (orparent coalitions) create consistent standards about the sort of in-formation that schools should release. In fact, it appears that theinformation environment is currently improving because of arecent upsurge in mandatory, statewide testing and statewide pub-lication of school ‘‘report cards’’ and ‘‘profiles.’’ Such state initia-tives are consequences of public frustration over achievement,evinced in statehouses (where there is increasing discussion ofschool accountability) and in federal commissions like Goals2000.
One may be wary of reforms that attempt to improve familyeffects by giving parents greater choice because one might worrythat, while the reform would make many parents better consum-ers, it might give other parents greater opportunities to makeschool-related choices that are unwise or that have negative spill-overs. For instance, one might worry that a minority of parentshave bizarre ideas about curriculum and would give their childrenlittle knowledge of core subjects if they were allowed more choice.To take another simple example, one might worry that parentswould leave a school that was financially burdened because it con-tained disabled students, without giving any consideration to
sion of rewards and penalties for regular public schools that operate through theproperty tax.
.......................... 8774$$ $CH5 09-10-01 10:07:45 PS

124 Caroline M. Hoxby
whether their behavior would induce flight by still other parents.Happily, choice-based reforms lend themselves to mechanisms thatcontrol such potential problems. In particular, the prices in choice-based reforms (such as the size of the voucher or the charter schoolfee) can be set to discourage choices that have negative spilloversor are otherwise undesirable, while still allowing latitude for arange of desirable consumer behavior on the part of parents.35 Infact, command-and-control programs that attempt to commandparents tend to fail because parents find ways to sidestep regula-tions. Parents do not even feel guilty about contraverting regula-tions if they think the regulations ignore the information that they(parents) have about the children’s needs. Programs that workthrough parents’ choices but make parents face the ‘‘social prices’’of their actions may be the most efficient, least resisted way tomanage problematic family behavior.
Ultimately, the argument that school reform needs to make thebest use of families does not rely on reformers’ liking families’preferences. Instead, the argument is practical. While a reformermay—in a deep sense—prefer schools to families as sources of in-
35. The price mechanisms in question are the subject of other work, but anexample may be helpful. Consider a school district that is going to implement acharter school program that will be available to all its students. Suppose that thedistrict is afraid that its schools will become more segregated and that it has atarget for racial/ethnic desegregation in its schools. Its target might be the racial/ethnic composition of the district as a whole—say, 20 percent African American,15 percent Hispanic, and 65 percent white non-Hispanic. The following pricemechanism will allow charter schools to be widely available and will also encour-age schools to reach the segregation target. The per-pupil payment to a charterschool should be set at a level that is adequate so long as the school does notdiverge egregiously from the district’s target. The payment should, however, in-crease substantially as a school gets closer to the target. With such payments, thedistrict effectively sets a price that parents and school staff have to pay if theymake choices that cause their school to deviate from the target. Charter schoolstaff have an incentive to reach out to (and make their program attractive to)students who would make their school more desegregated. Parents can obtainbetter funding for their children by moving them from schools where their raceis overrepresented to schools where their race is underrepresented. Schools havean incentive to keep working toward the target but do not go out of business ifthey fall short in a particular year.
.......................... 8774$$ $CH5 09-10-01 10:07:45 PS

125If Families Matter Most
fluence on children, she or he might still choose reforms that im-prove family effects for the practical reason that a small, plausiblyobtainable improvement in family effects would swamp a large,hopelessly optimistic improvement in school effects. According tothe estimates described above, a reform that improved family ef-fects by 5 percent would probably do more for students’ outcomesthan a reform that improved school effects by 70 percent. It islikely that school reform is capable of achieving at least small im-provements in family effects because some of the key channelsthrough which families affect their children are related to schools:choice of schools, pressure on schools to be achievement oriented,control of their children’s school experiences through interactingwith teachers and administrators, and creation of home environ-ments that complement school.
.......................... 8774$$ $CH5 09-10-01 10:07:46 PS