ifla columbus • 13– - oclc · ifla columbus • 13–19 august 2016 optimizing for great...
TRANSCRIPT

IFLA Columbus • 13 – 19 August 2016
Optimizing for great experiences, Web Analytics and More
Cathy King
Sr. Product Manager
OCLC Discovery Services
“It is not enough that we build
products that function, that are
understandable and usable, we also
need to build products that bring joy
and excitement, pleasure and fun,
and, yes, beauty to people’s lives.” –
Don Norman


The Admont Library, Admont, AustriaClementinum National Library, Czech RepublicBibliotheque Sainte-Genevieve, France

Optimized
ExperiencesWeb
Analytics
Best
PracticesUX Studies

Agenda
• Web Design & Analytics Survey
• Importance of Digital Presence Optimization
• Applying Web Analytics
• Emerging Patterns & Trends / Best Practices
• Q & A

What is web analytics?
“Web analytics is the measurement,
collection, analysis and reporting
of web data for purposes of understanding
and optimizing web usage.”
Wikipedia

SURVEY SAYS…

Interest in redesigning library website (n=194)
30% 28% 26%16%
0%
5%
10%
15%
20%
25%
30%
35%
40%
45%
50%
Recently completed awebsite redesign
Considering a websiteredesign
Working on a websiteredesign now
Not interested in changingour library's website at
this time
Interest in Redesigning Library’s Website (n=194)
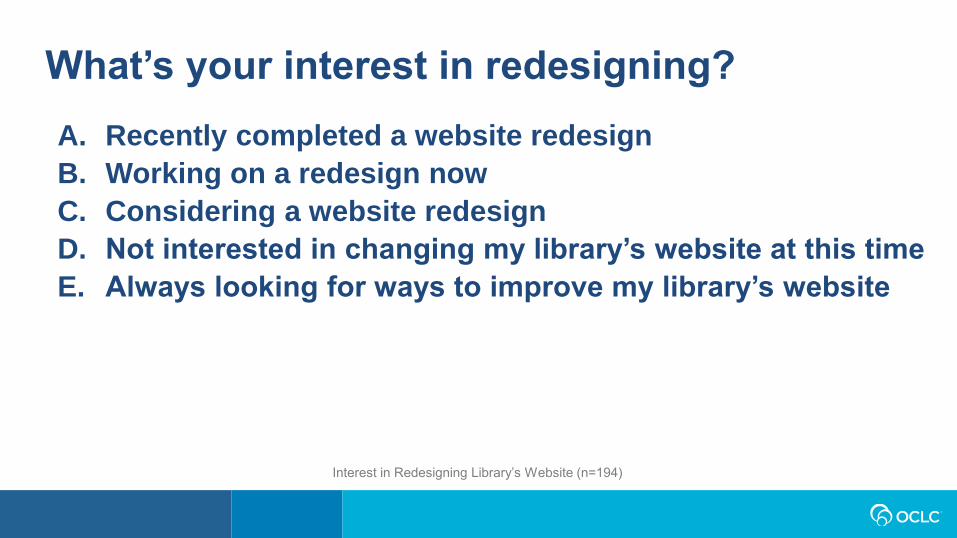
What’s your interest in redesigning?
Interest in Redesigning Library’s Website (n=194)
A. Recently completed a website redesign
B. Working on a redesign now
C. Considering a website redesign
D. Not interested in changing my library’s website at this time
E. Always looking for ways to improve my library’s website
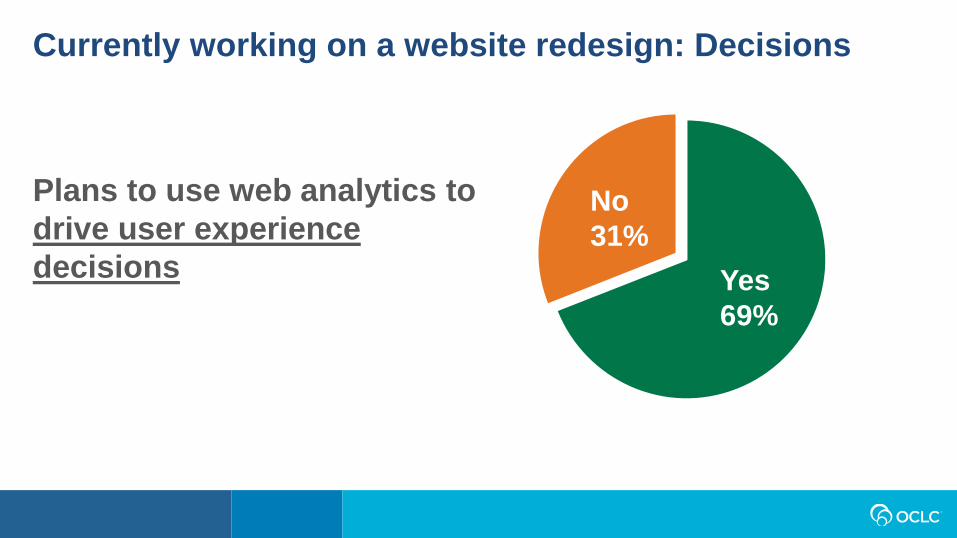
Currently working on a website redesign: Decisions
Plans to use web analytics to
drive user experience
decisions
No
31%
Yes
69%
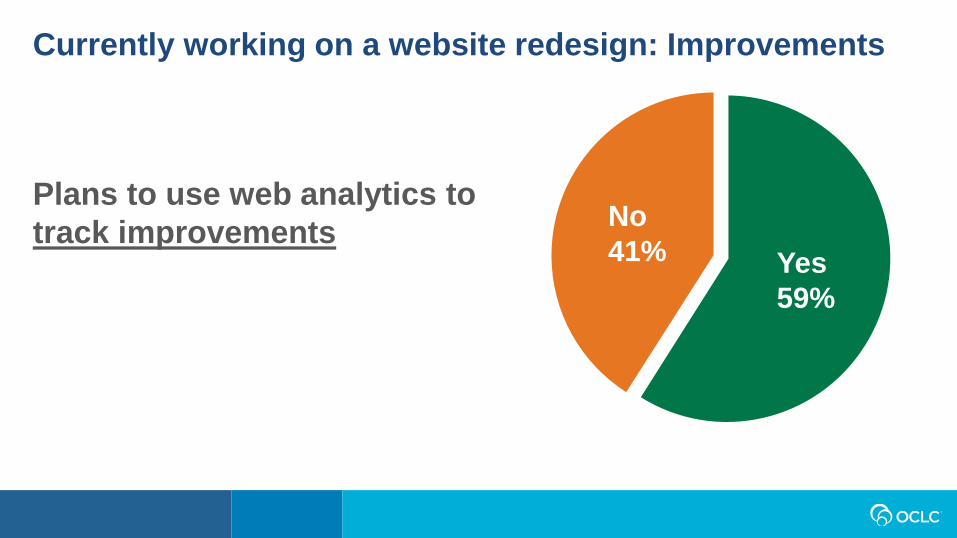
Currently working on a website redesign: Improvements
Plans to use web analytics to
track improvementsNo
41% Yes
59%

SO WHAT?


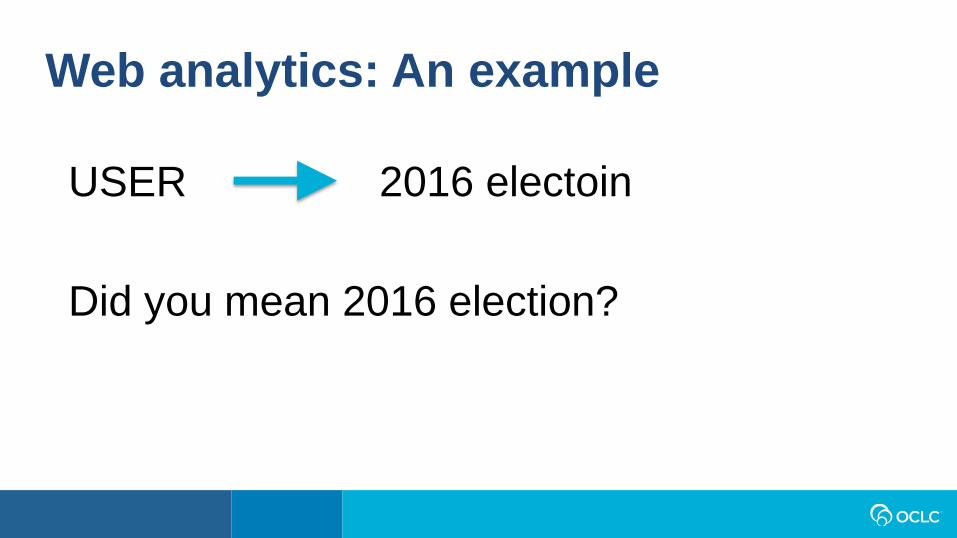
Web analytics: An example
USER 2016 electoin
Did you mean 2016 election?

Web analytics: An example
10%
Click
Rate

Web analytics: An example
20% Click Rate!
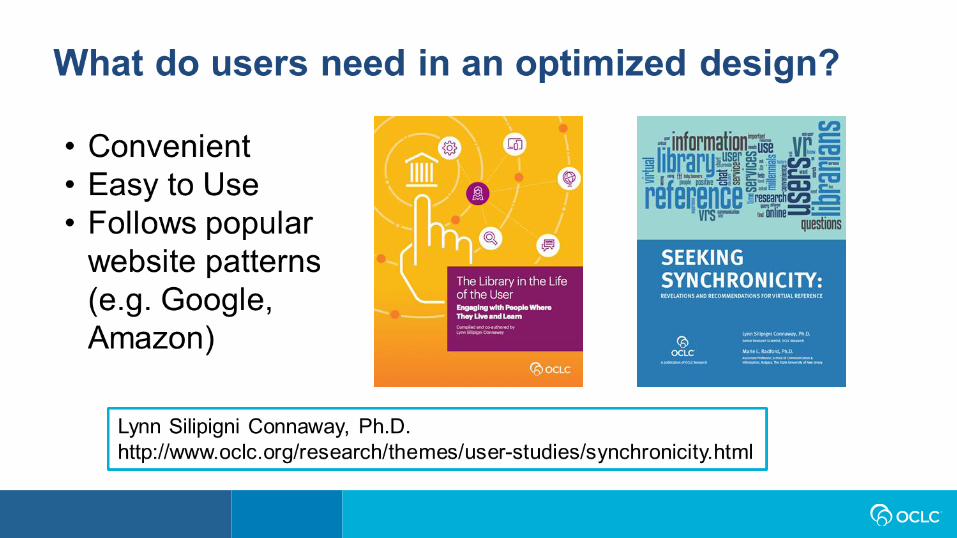

Convenience as central theme…“users want their library systems to be as easy to use as Google”
“in order to be one of the first choices for information, library systems and
interfaces need to look familiar to people by resembling popular web
interfaces”
“people lack patience to wade through content silos and indexing and
abstracting databases.”
“the centrality of convenience is especially prevalent among the younger
(“Millennial”) subjects… but is true across all demographic categories - age,
gender, academic role, user or non-user..”

In their own words…“Well, I have our library [Web page] here open and... there’s a lot of information
and there’s nowhere to search. This is the opening to the catalog but there’s no
box to search” ~ Undergraduate student
“I don’t use the university online system. Don’t like it.” ~Graduate Student
“You need to know which database with abstracting, indexing… Google, I don’t
have to know, I go to one spot.” ~Graduate Student
HOW CAN ANALYTICS
HELP OPTIMIZE?

What kind of metrics do you use?
Interest in Redesigning Library’s Website (n=194)
A.Page views
B.Length of visit to each page
C.“Click from” location (where was a visitor before coming
to your site?
D.“Click to” location (where did a visitor go after viewing
your site?
E. We don’t use any metrics at this time

Types of Metrics
Page views 44%
Analytics service (e.g. Google Analytics,
Crazy Egg)25%
Not sure yet 13%
Keyword Usage 6%
Location (geographic) 6%
Where losing visitors 6%

Abandon rate: Going beyond page views
• Abandonment rate measures the failure rate of steps in a process
• Identifying points of failure across key steps can improve success

Example: Measuring database success
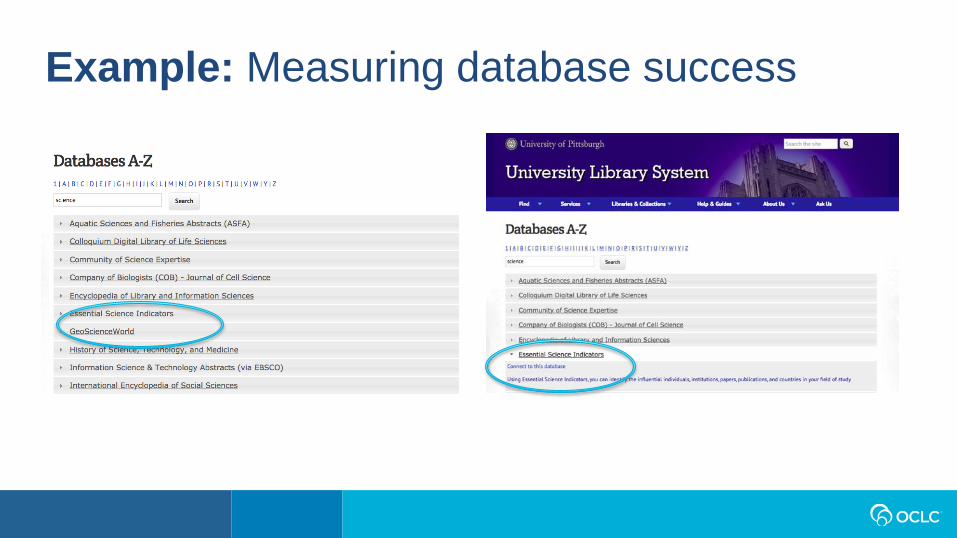
Example: Measuring database success

Example: Abandonment rates at each step
Click on Database Tab - 1,000
Search for database - 800
Expand link - 300
“Connect to Database” - 100
Abandonment Rate Calculation:
(1 - (Users at current step / number at previous step)) * 100
20%
63%
67%

Example: Steps as a “conversion” funnel
Click on Database Tab - 1,000
Search for database - 800
Expand link - 300
“Connect to Database” - 100
10% Conversion Rate

Improve success of your key workflows
IMPROVING SUCCESS STEPS
1. Identify key work flows
2. Identify steps in the work flows
3.Tag pages & establish a baseline
4.Tweak to address points of failure
5.Measure against the baseline

2 ways to think about it…
1. Added something new?
• How many people visited new page?
• How many clicked on the new link?
2. Changed the way something looks?
– More Clicks / Visits against your baseline for the thing?
– Did other related things change unexpectedly?

Added & then changed

Deciding what to use as a KPI
Best Practice: Choose 3 main goals• Finding information
– abandonment rates
– conversion rates
• Increase engagement
– number of page views per visit
– time on site
• Grow user base
– Traffic (page views, visitors)
– Traffic Origination (Direct, Referral, Search)

EMERGING TRENDS & PATTERNS
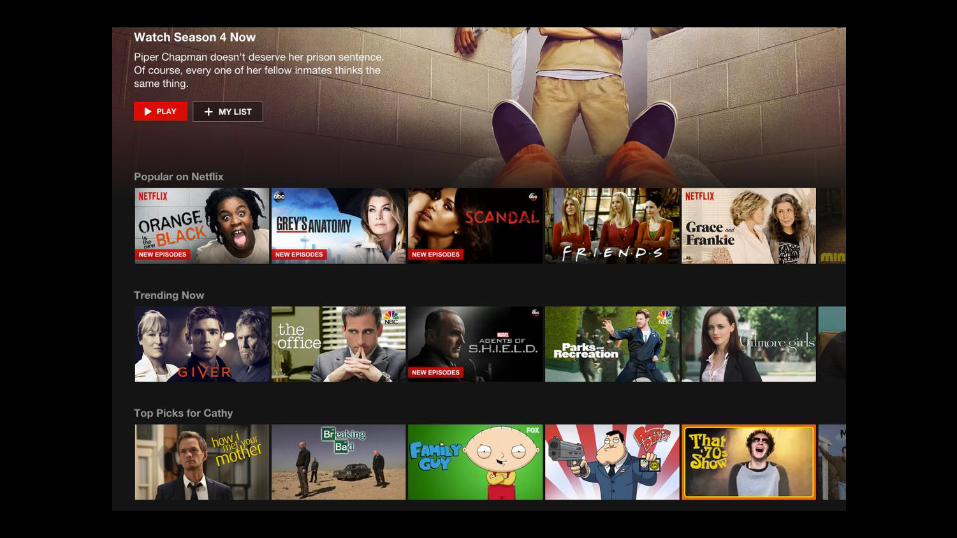
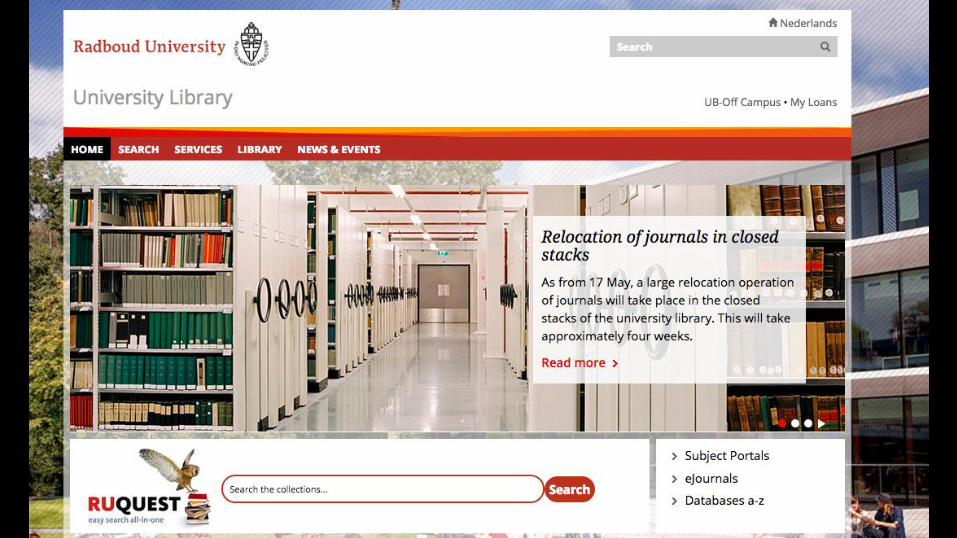
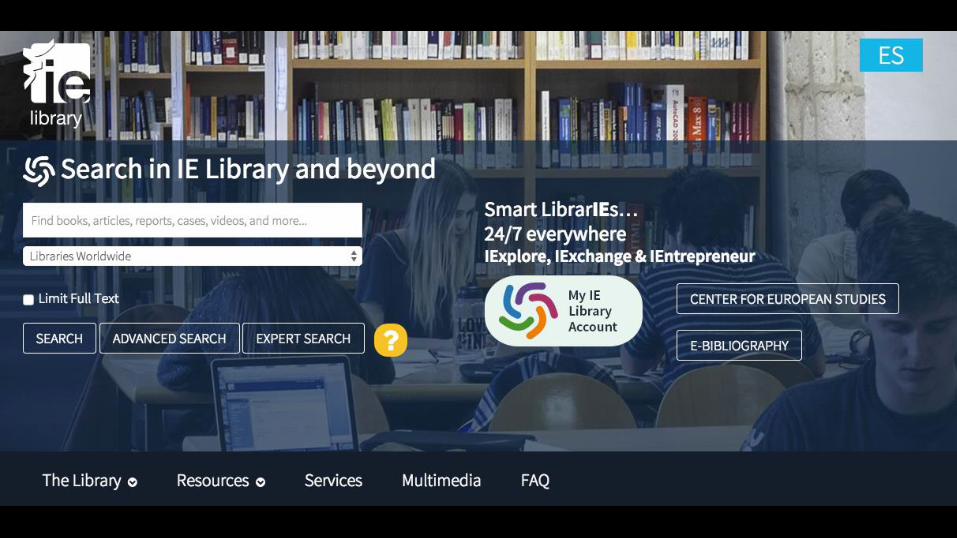
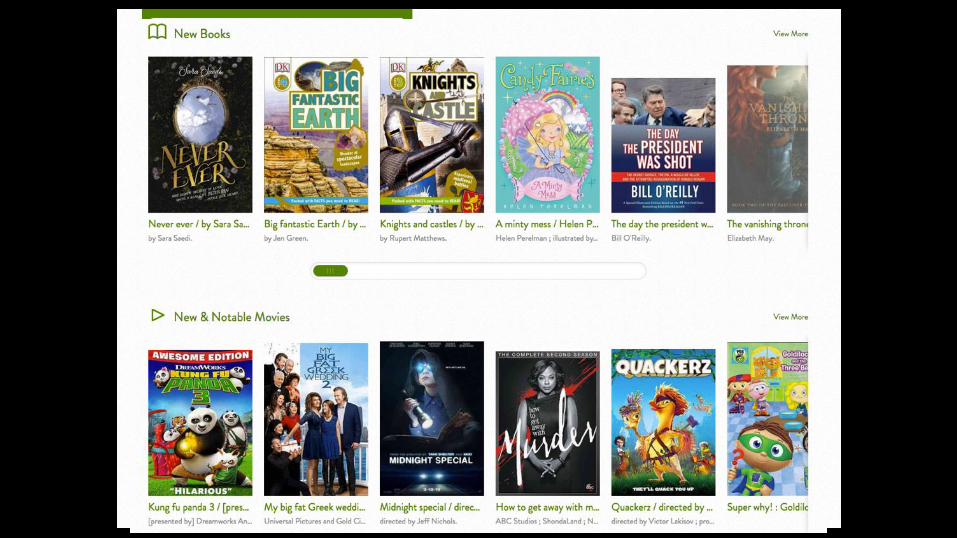
Inspiration from around the web

• No advanced search option
• Needed to “google” advanced search!
• Only 3% of searches are advanced in WorldCat Discovery
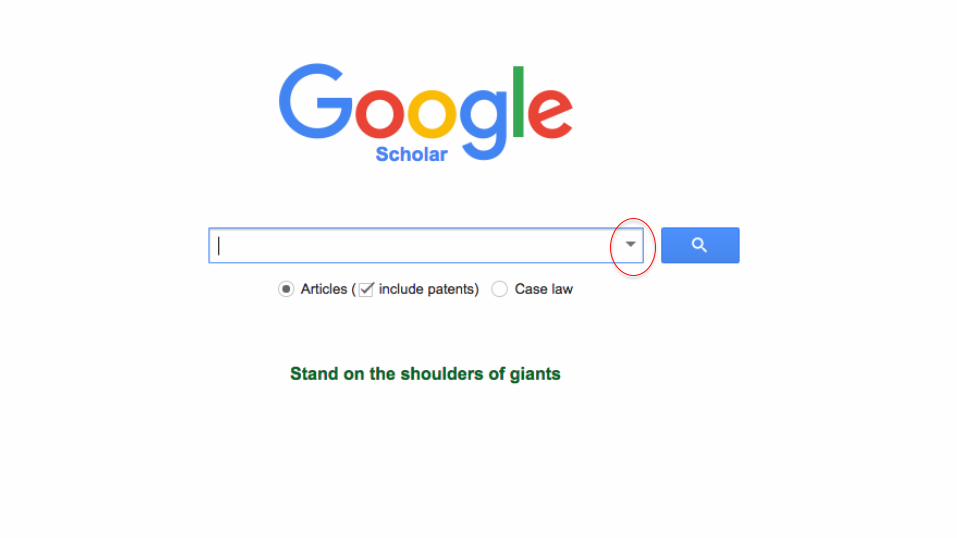


“Anything we can do to make things simpler and more transparent is
a plus.”– Cap Watkins, Sr. Design Manager at Etsy
EMERGING TRENDS & PATTERNS
Library website patterns

Options surrounding the search box

Number of Search Box Options
• Complexity search box
options correlates with
institution type
• Database links are the
most common across all
segments
0
1
2
3
“Rule of thumb for UX: More options more
problems.”– Scott Belsky, Vice President of Products & Community at Adobe
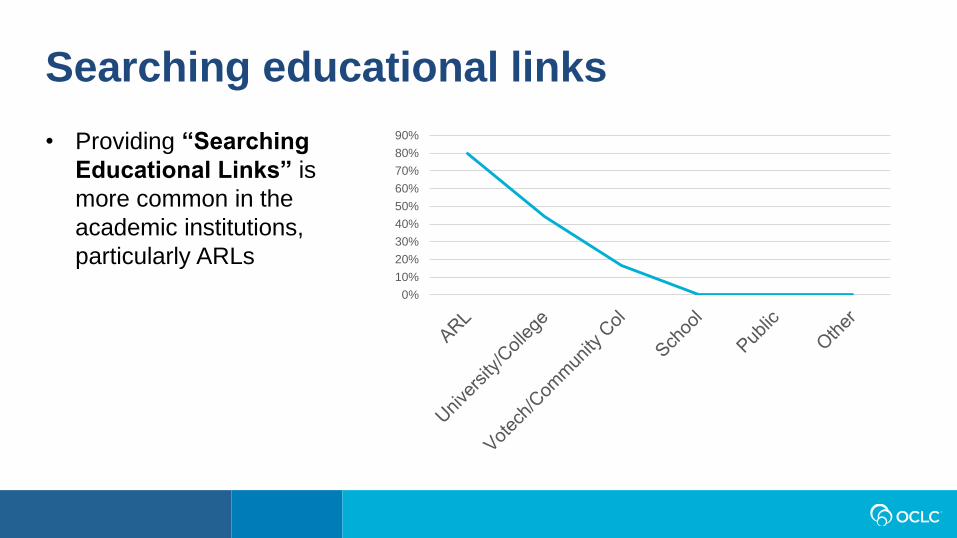
Searching educational links
• Providing “Searching
Educational Links” is
more common in the
academic institutions,
particularly ARLs
0%
10%
20%
30%
40%
50%
60%
70%
80%
90%

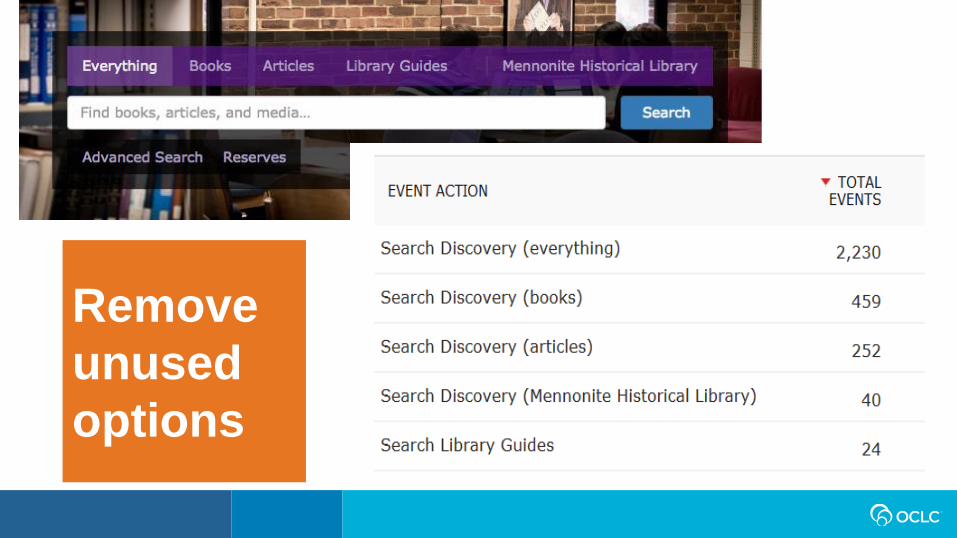
Remove
unused
options


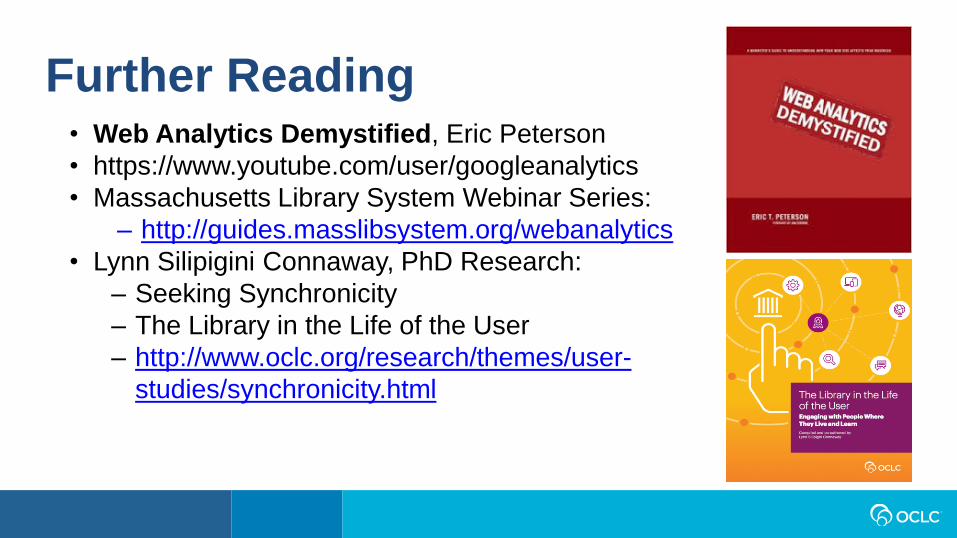
Further Reading• Web Analytics Demystified, Eric Peterson
• https://www.youtube.com/user/googleanalytics
• Massachusetts Library System Webinar Series:
– http://guides.masslibsystem.org/webanalytics
• Lynn Silipigini Connaway, PhD Research:
– Seeking Synchronicity
– The Library in the Life of the User
– http://www.oclc.org/research/themes/user-
studies/synchronicity.html