ighlights of the wage and salary workers …€¦ · · 2011-12-28this issue of labstat provides...
TRANSCRIPT

Office of the Deputy Director General for Sectoral TVET
Planning Office
TESDA Complex, East Service Road, South Superhighway
Taguig City, Metro Manila
Tel. No. (02) 888 5652 ; 817 2675 ; 893 1966
www.tesda.gov.ph
CODE: ST-PO 24–12–2011
LABOR MARKET INTELLIGENCE REPORT
HIGHLIGHTS OF THE WAGE AND SALARY
WORKERS EMPLOYED IN
GOVERNMENT/GOVERNMENT
CORPORATIONS
( Last of 5-part series on Wage and Salary Workers of the Bureau of Labor and Employment Statistics. LABSTAT updates Vol. 15 No. 19 of Nov. 2011 )
and
WAGE RATES IN INDUSTRIES
( Fourth and last of a five-part series of Basic Pay and Allowance in Major Economic Activities and Benchmark Occupations of the Bureau of Labor and Employment
LABSTAT Updates Vol. 15 No. 32 and 33 of Nov. 2011 )
TECHNICAL EDUCATION AND SKILLS DEVELOPMENT AUTHORITY

1
This issue of LABSTAT provides a summary of the demographic and economic characteristics of the
wage and salary workers working for government/government corporations in 2010. Specific examples of these workers are employees of national government agencies and local government units, employees of government owned/controlled corporations and financial institutions, e..g. Government Service Insurance System (GSIS), Social Security System (SSS), National Power Corporation (NPC), Bangko Sentral ng Pilipinas (BSP), and civilian and military personnel and the Armed forces of the Philippines (AFP) (including chaplains, doctors, nurses, and dentists).
This is the last of a five-part series of the Department of Labor and Employment’s Bureau of Labor and
Employment Statistics (DOLE/BLES) wage and salary data through the Occupational Wages Survey (OWS). The OWS is one of the designated statistical activities per E.O. 352 (s. 1996) that requires the generation
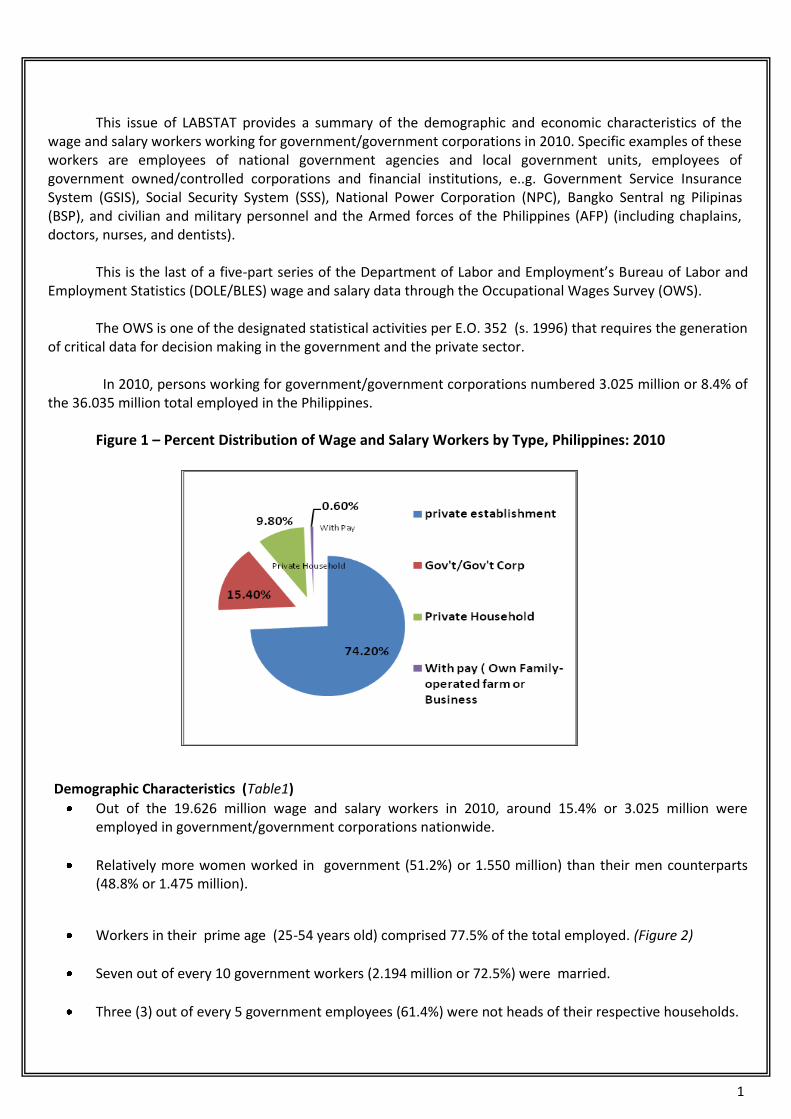
of critical data for decision making in the government and the private sector. In 2010, persons working for government/government corporations numbered 3.025 million or 8.4% of
the 36.035 million total employed in the Philippines.
Figure 1 – Percent Distribution of Wage and Salary Workers by Type, Philippines: 2010
Demographic Characteristics (Table1)
Out of the 19.626 million wage and salary workers in 2010, around 15.4% or 3.025 million were employed in government/government corporations nationwide.
Relatively more women worked in government (51.2%) or 1.550 million) than their men counterparts (48.8% or 1.475 million).
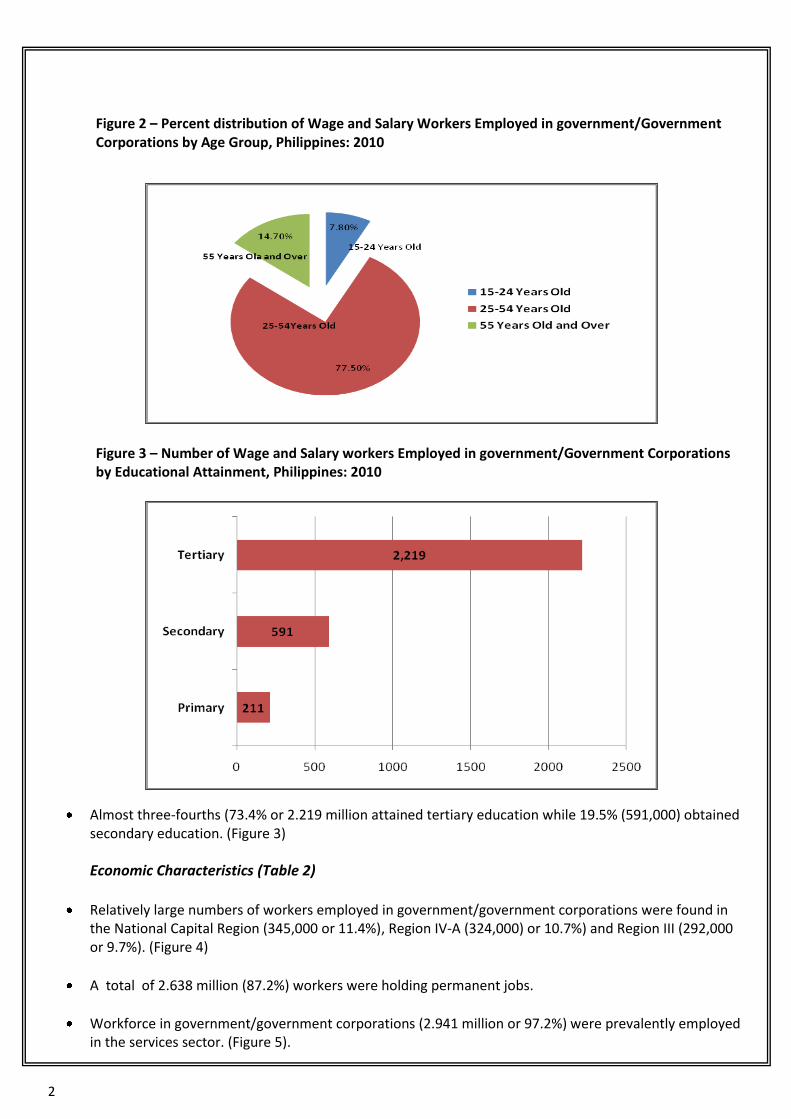
Workers in their prime age (25-54 years old) comprised 77.5% of the total employed. (Figure 2)
Seven out of every 10 government workers (2.194 million or 72.5%) were married.
Three (3) out of every 5 government employees (61.4%) were not heads of their respective households.
2
Figure 2 – Percent distribution of Wage and Salary Workers Employed in government/Government Corporations by Age Group, Philippines: 2010
Figure 3 – Number of Wage and Salary workers Employed in government/Government Corporations by Educational Attainment, Philippines: 2010
Almost three-fourths (73.4% or 2.219 million attained tertiary education while 19.5% (591,000) obtained secondary education. (Figure 3)
Economic Characteristics (Table 2)
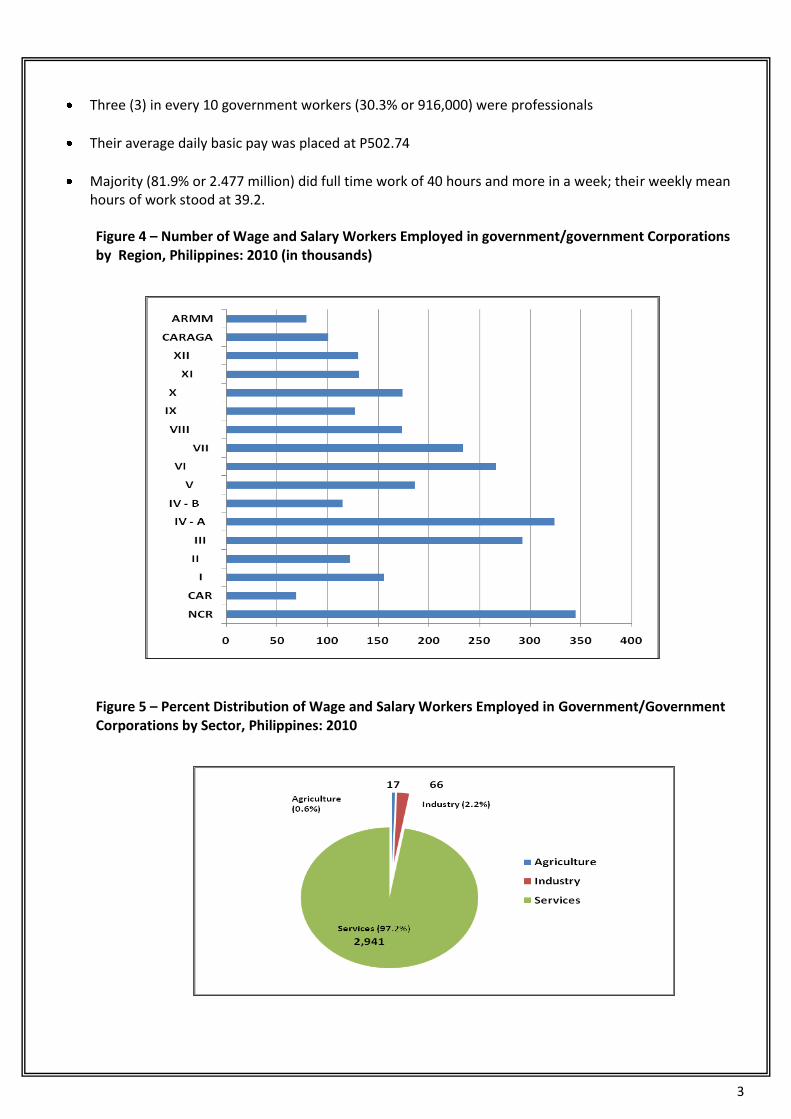
Relatively large numbers of workers employed in government/government corporations were found in the National Capital Region (345,000 or 11.4%), Region IV-A (324,000) or 10.7%) and Region III (292,000 or 9.7%). (Figure 4)
A total of 2.638 million (87.2%) workers were holding permanent jobs.
Workforce in government/government corporations (2.941 million or 97.2%) were prevalently employed in the services sector. (Figure 5).
3
Three (3) in every 10 government workers (30.3% or 916,000) were professionals
Their average daily basic pay was placed at P502.74
Majority (81.9% or 2.477 million) did full time work of 40 hours and more in a week; their weekly mean hours of work stood at 39.2.
Figure 4 – Number of Wage and Salary Workers Employed in government/government Corporations by Region, Philippines: 2010 (in thousands)
Figure 5 – Percent Distribution of Wage and Salary Workers Employed in Government/Government Corporations by Sector, Philippines: 2010
4
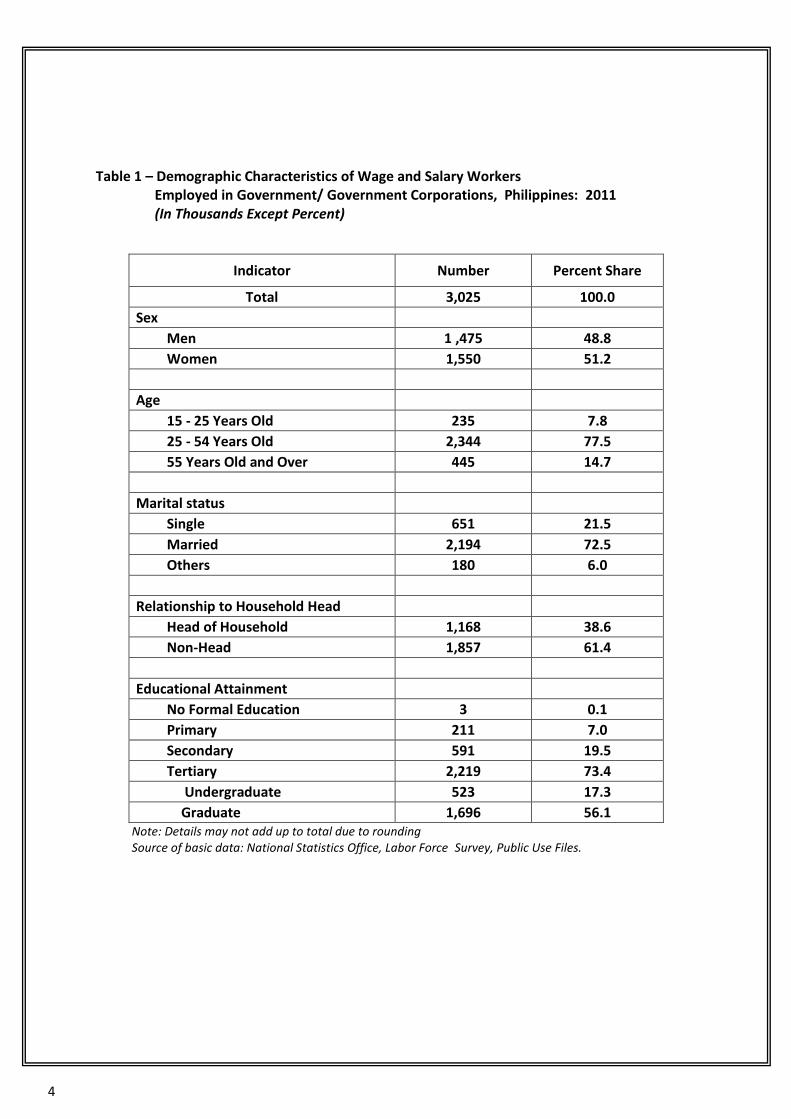
Table 1 – Demographic Characteristics of Wage and Salary Workers Employed in Government/ Government Corporations, Philippines: 2011 (In Thousands Except Percent)
Indicator Number Percent Share
Total 3,025 100.0
Sex
Men 1 ,475 48.8
Women 1,550 51.2
Age
15 - 25 Years Old 235 7.8
25 - 54 Years Old 2,344 77.5
55 Years Old and Over 445 14.7
Marital status
Single 651 21.5
Married 2,194 72.5
Others 180 6.0
Relationship to Household Head
Head of Household 1,168 38.6
Non-Head 1,857 61.4
Educational Attainment
No Formal Education 3 0.1
Primary 211 7.0
Secondary 591 19.5
Tertiary 2,219 73.4
Undergraduate 523 17.3
Graduate 1,696 56.1 Note: Details may not add up to total due to rounding Source of basic data: National Statistics Office, Labor Force Survey, Public Use Files.

5
Table 2 – Economic Characteristics of Wage and Salary Workers Employed in
Government/Government corporations, Philippines: 2010 ( In Thousands Except Percent)
Indicator Number Percent Share
Total 3,025 100.0
Nature of Employment
Permanent Job 2,638 87.2
Short Term 384 12.7
Different Employer 2 0.1
Full/Part-Time Employment
Worked Less Than 40 Hours 485 16.0
Worked 40 Hours and Over 2,477 81.9
With a Job, Not at Work 62 2.0
Sector
Agriculture 17 0.6
Industry 66 2.2
Services 2,941 97.2
Major Occupation (Top 5)
Professionals 919 30.3
Clerks 486 16.1
Service Workers and Shop and Market Sales Workers
472 15.6
Officials of the Government and Special Interest Organizations, Corporate Executives, Managers, Managing Proprietors and Supervisors
360 11.9
Laborers and Unskilled Workers 293 9.7
Others 498 16.5
Basic Pay ( in pesos) 502.74
Mean Hours of work 39.2
Note: Details may not add up to totals due to rounding Source of basic data: National Statistics Office, Labor Force Survey, Public Use Files.

6
WAGE RATES IN INDUSTRIES… BASIC PAY AND ALLOWANCE IN MAJOR ECONOMIC ACTIVITIES
(FOURTH OF A SERIES)
This fourth issue of LABSTAT updates compares the monthly median basic pay and median allowances received by time-rate workers on full time basis in July 2008 and August 2010. The metadata and the statistical tables of the survey are posted at the BLES website.
Average basic pay highest in financial intermediation in 2008 and 2010
In August 2010, the average basic pay was estimated at P10,762, higher by 8.5% than P9,922 in July 2008.
Highest average basic pay was observed in financial intermediation at P16,639 in August 2010 and P15,571 in July 2008.
Five industry groups exhibited growth in basic pay of more than 10.0%, namely: mining and quarrying (26.5%); manufacturing (15.7%); health and social work except public medical, dental and other health activities (12.5%); wholesale and retail trade (11.9%); and electricity, gas, and water supply (10.9%).
Only real estate, renting and business activities posted a decline in the monthly basic pay (2.8%). (Figure 1)
Figure 1 – Median Monthly Basic Pay of Time-Rate Workers on Full-Time Basis by Major Industry Group, Philippines: July 2008 and August 2010 (In Pesos)
All Ind. C D E F G H I J K M N O
Aug-10 0,762 10,790 10,419 15,516 10,413 10,425 10,349 12,980 16,639 11,335 12,687 9,933 10,635
Jul-08 9,922 8,533 9,007 13,993 9,693 9,320 9,436 11,969 15,571 11,662 12,335 8,829 9,782
C Mining and Quarrying I Transport, Storage and Communications
D Manufacturing J Financial Intermediation
E Electricity, Gas and Water Supply K Real Estate, Renting and Business Activities
F Construction L Public Administration and Defense, Compulsory
G Wholesale and Retail Trade, Repair of Motor Vehicles, Motorcycles and Personal and Household Goods
Social Security
M Education
N Health and Social Work
H Hotels and Restaurants O Other Community, Social and Personal Service Activities

7
Growth in average basic pay highest in Region VIII
Across regions, median basic pay increased in majority of the regions with the highest growth registered in Region VIII at 40.0%.
Other regions with more than 10.0% growth in basic pay were region X (12.1%) and Region II (11.2%).
Only three regions had decreased in basic pay, namely: Region I (11.8%); Region VI (3.8%); and Region XII (1.5%). (Figure 2)
Figure 2 – Median Basic Pay of Time-Rate Workers on Full-time Basis by Region, Philippines: July 2008 and August 2010 ( In Pesos)
Proportion of workers receiving higher basic pay intervals increased
The number of time-rate workers on full-time basis in non-agricultural establishments decreased slightly from 2.780 million in July 2008 to 2.752 million in August 2010.
About one-third (35.8%) of workers in 2008 was located at higher pay interval of P12,000 and over. The proportion increased to 40.1% in August 2010.
Monthly Basic Pay August 2010
(In %) July 2008 (In %)
Below P3,000 0.1 0.1
P3,000 - P5,999 3.6 4.1
P6,000 - P8,999 27.9 32.2
P9,000 - P11,999 28.3 27.8
P12,000 - P14,999 12.5 12.0
P15,000 - and over 27.6 23.8
NCR I II III IV - A VI VII VIII IX X XII CARAGA
Aug-10 12,597 7,042 10,486 9,028 9,782 7,246 7,799 10,613 6,583 7,833 6,648 6,529
Jul-08 12,121 7,985 9,431 8,320 8,683 7,533 7,507 7,533 6,070 6,986 6,751 6,131
-
2,000
4,000
6,000
8,000
10,000
12,000
14,000
8
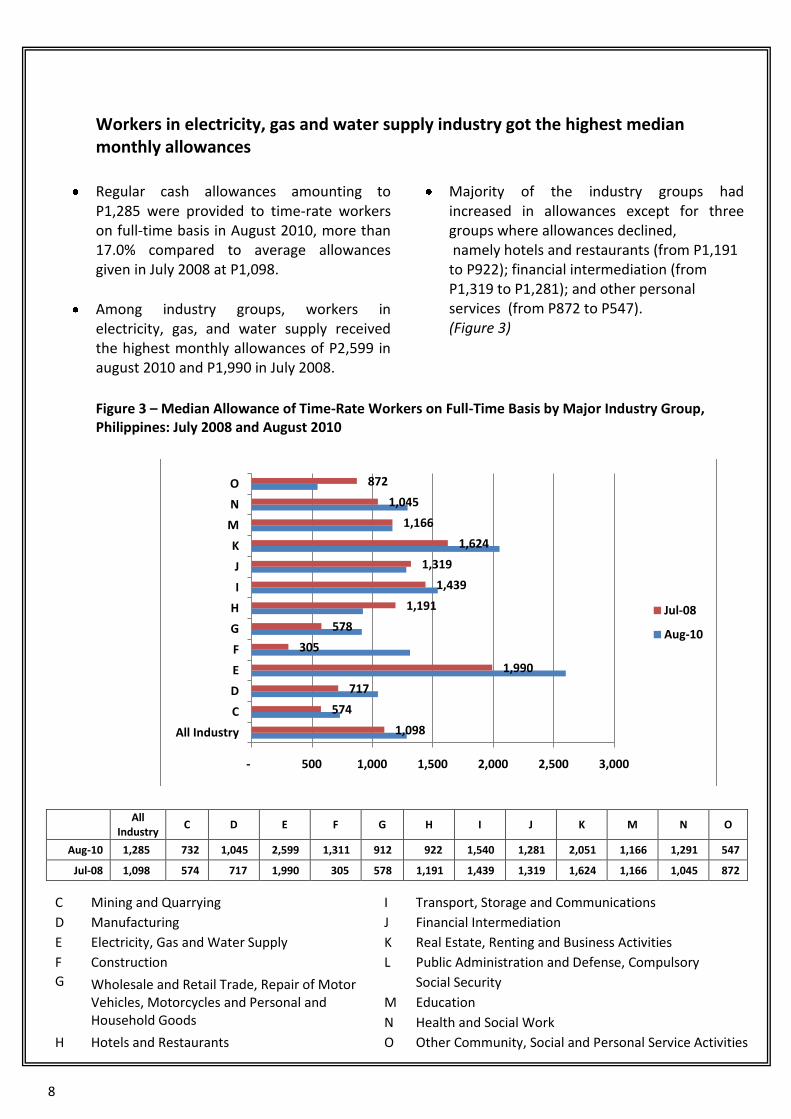
Workers in electricity, gas and water supply industry got the highest median monthly allowances
Regular cash allowances amounting to
P1,285 were provided to time-rate workers on full-time basis in August 2010, more than 17.0% compared to average allowances given in July 2008 at P1,098.
Among industry groups, workers in electricity, gas, and water supply received the highest monthly allowances of P2,599 in august 2010 and P1,990 in July 2008.
Majority of the industry groups had increased in allowances except for three groups where allowances declined, namely hotels and restaurants (from P1,191 to P922); financial intermediation (from P1,319 to P1,281); and other personal services (from P872 to P547). (Figure 3)
Figure 3 – Median Allowance of Time-Rate Workers on Full-Time Basis by Major Industry Group, Philippines: July 2008 and August 2010
All
Industry C D E F G H I J K M N O
Aug-10 1,285 732 1,045 2,599 1,311 912 922 1,540 1,281 2,051 1,166 1,291 547
Jul-08 1,098 574 717 1,990 305 578 1,191 1,439 1,319 1,624 1,166 1,045 872
C Mining and Quarrying I Transport, Storage and Communications
D Manufacturing J Financial Intermediation
E Electricity, Gas and Water Supply K Real Estate, Renting and Business Activities
F Construction L Public Administration and Defense, Compulsory
G Wholesale and Retail Trade, Repair of Motor Vehicles, Motorcycles and Personal and Household Goods
Social Security
M Education
N Health and Social Work
H Hotels and Restaurants O Other Community, Social and Personal Service Activities
1,098
574
717
1,990
305
578
1,191
1,439
1,319
1,624
1,166
1,045
872
- 500 1,000 1,500 2,000 2,500 3,000
All Industry
C
D
E
F
G
H
I
J
K
M
N
O
Jul-08
Aug-10
9
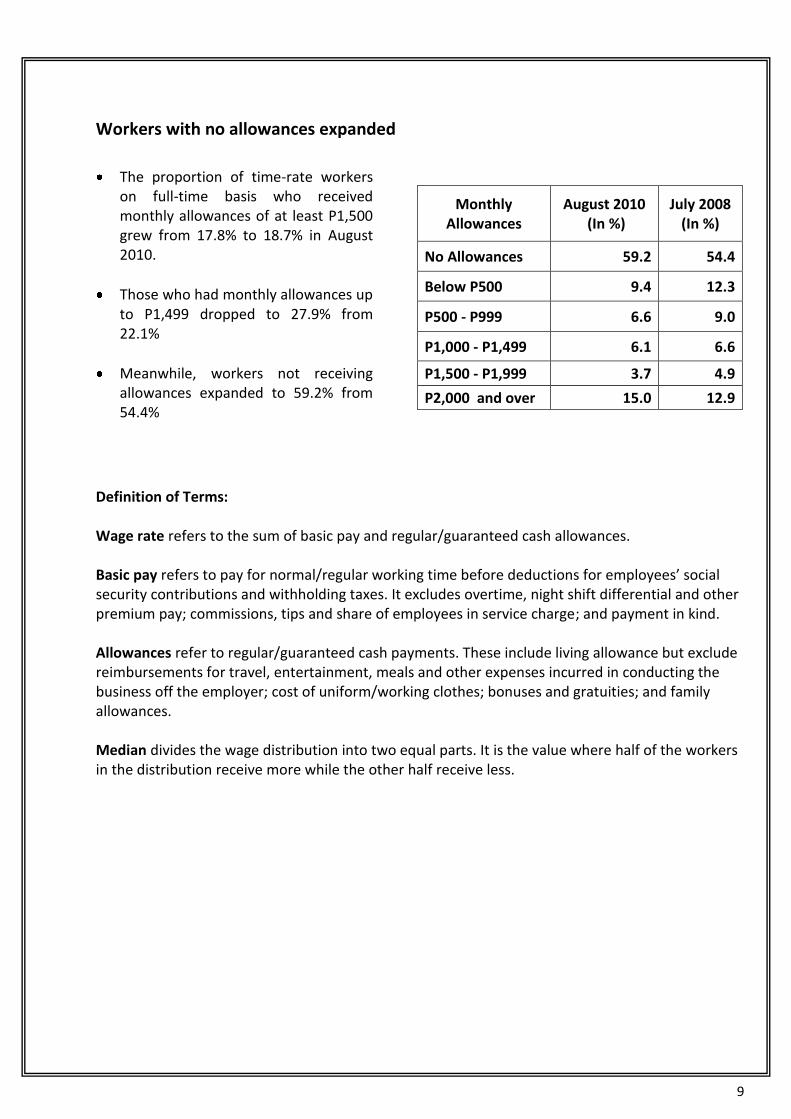
Workers with no allowances expanded
The proportion of time-rate workers
on full-time basis who received monthly allowances of at least P1,500 grew from 17.8% to 18.7% in August 2010.
Those who had monthly allowances up to P1,499 dropped to 27.9% from 22.1%
Meanwhile, workers not receiving allowances expanded to 59.2% from 54.4%
Monthly Allowances
August 2010 (In %)
July 2008 (In %)
No Allowances 59.2 54.4
Below P500 9.4 12.3
P500 - P999 6.6 9.0
P1,000 - P1,499 6.1 6.6
P1,500 - P1,999 3.7 4.9
P2,000 and over 15.0 12.9
Definition of Terms: Wage rate refers to the sum of basic pay and regular/guaranteed cash allowances. Basic pay refers to pay for normal/regular working time before deductions for employees’ social security contributions and withholding taxes. It excludes overtime, night shift differential and other premium pay; commissions, tips and share of employees in service charge; and payment in kind. Allowances refer to regular/guaranteed cash payments. These include living allowance but exclude reimbursements for travel, entertainment, meals and other expenses incurred in conducting the business off the employer; cost of uniform/working clothes; bonuses and gratuities; and family allowances. Median divides the wage distribution into two equal parts. It is the value where half of the workers in the distribution receive more while the other half receive less.

10
WAGE RATE IN INDUSTRIES IN BENCHMARK OCCUPATIONS
(LAST OF A FIVE-PART SERIES)
This fifth issue of LABSTAT updates highlights the average monthly wage rates of benchmark occupations ( accounting and bookkeeping clerks; and unskilled workers except janitors, messengers and freight handlers) considered as benchmark for wage setting. Wage data on these two occupations have been collected for all industries covered by the OWS since 2002.
Average monthly wage rates of accounting and bookkeeping clerks decreased only in hotels and restaurants industry
Accounting and bookkeeping clerks are vital in various financial transactions of the establishments as they assist in activities such as record keeping and computations of wages, production cost and other cash payments.
The national average monthly wage rate of accounting and bookkeeping clerks was estimated at P12,708 in August 2010, higher by 9.6% than the average monthly wage rate in July 2008 at P11,591.
Majority of the industry groups exhibited higher average monthly wage rates than the national wage rates in both periods.
All industry groups posted growth in monthly wage rates except for hotels and restaurants which declined by 3.8% (P11,938) in August 2010 vs. P11,499 in July 2008.
The highest growth was observed in health and social work except public, medical, dental and other health activities at 25.8%. (Figure 1)
Figure 1- Average Monthly Wage Rates of Accounting and Bookkeeping Clerks by Major Industry Groups, Philippines: July 2008 and August 2010 (In Pesos)
-
2,000
4,000
6,000
8,000
10,000
12,000
14,000
16,000
C D E F G H I J K M N O
Aug-10
Jul-08

11
C D E F G H I J K M N O
Aug-10 13,275
13,535
15,906
13,141
11,020
11,499
12,976
13,571
13,825
12,349
11,656
12,645
Jul-08 11,816
12,105
15,571
10,651
9,903
11,938
11,659
12,183
12,707
12,118
9,264
10,853
C Mining and Quarrying I Transport, Storage and Communications
D Manufacturing J Financial Intermediation
E Electricity, Gas and Water Supply K Real Estate, Renting and Business Activities
F Construction L Public Administration and Defense, Compulsory
G Wholesale and Retail Trade, Repair of Motor Vehicles, Motorcycles and Personal and Household Goods
Social Security
M Education
N Health and Social Work
H Hotels and Restaurants O Other Community, Social and Personal Service Activities
Source of data: Bureau of labor and Employment Statistics, Occupational Wages Survey
Average wage rates of accounting and bookkeeping clerks decreased in Region II only
Across regions, average monthly wage rates of accounting and bookkeeping clerks declined only in Region II from P12,470 in July 2008 to 9,772 in August 2010.
The rest of the regions reported notable growth with Region VIII as the highest at 57.9%. This was followed by Region X at 36.1% and CARAGA at 19.3%. (Note: Data for CAR, Regions IV-B, V and XI in 2008; and Region IV-B and ARMM in 2010 were suppressed due to low response rates).
Region August 2010(P) July 2008 (P)
Phils. 12,708 11,591
NCR 13,927 13,150
Region I 10,257 9,585
Region II 9,772 12,470
Region III 13,307 11,609
Region IV - A 12,785 11,828
Region VI 9,772 9,382
Region VII 11,080 9,868
Region VIII 13,264 8,401
Region IX 8,237 7,847
Region X 11,954 8,794
Region XII 9,431 8,538
CARAGA 9,300 7,793
Average wage rates of unskilled workers increased by 8.6%
Unskilled workers (except janitors, messengers and freight handlers) refer to those workers who perform simple and routine manual tasks requiring mainly physical effort with little or no previous experience, and whose tasks are not performed by other workers in the establishments
In August 2010, the national average monthly wage rate of unskilled workers was estimated at P9,120.,higher by 8.6% than the average monthly wage rate in July 2008 at P8,394.
Only two industry groups posted declines in monthly wage rates. These were financial intermediation (5.7%); and health and social work except public medical, dental and other health activities (5.3%).
The highest growth was observed in mining and quarrying industry at 46.6%.
The lowest growth was recorded in construction industry at 0.8% (Figure 2).

12
Figure 2- Average Monthly Wage Rates of Unskilled Workers by Major Industry Group, Philippines: July 2008 and August 2010 (in Pesos)
Aug-10
9,406
9,288
8,886
9,051
8,526
8,360
9,702
8,363
9,382
8,338
8,664
11,394
Jul-08 6,415
8,763
6,784
8,981
7,772
8,116
9,345
8,868
8,082
7,616
9,146
8,523
C Mining and Quarrying I Transport, Storage and Communications
D Manufacturing J Financial Intermediation
E Electricity, Gas and Water Supply K Real Estate, Renting and Business Activities
F Construction L Public Administration and Defense, Compulsory
G Wholesale and Retail Trade, Repair of Motor Vehicles, Motorcycles and Personal and Household Goods
Social Security
M Education
N Health and Social Work
H Hotels and Restaurants O Other Community, Social and Personal Service Activities
-
2,000
4,000
6,000
8,000
10,000
12,000
C D E F G H I J K M N O
Aug-10
Jul-08
13
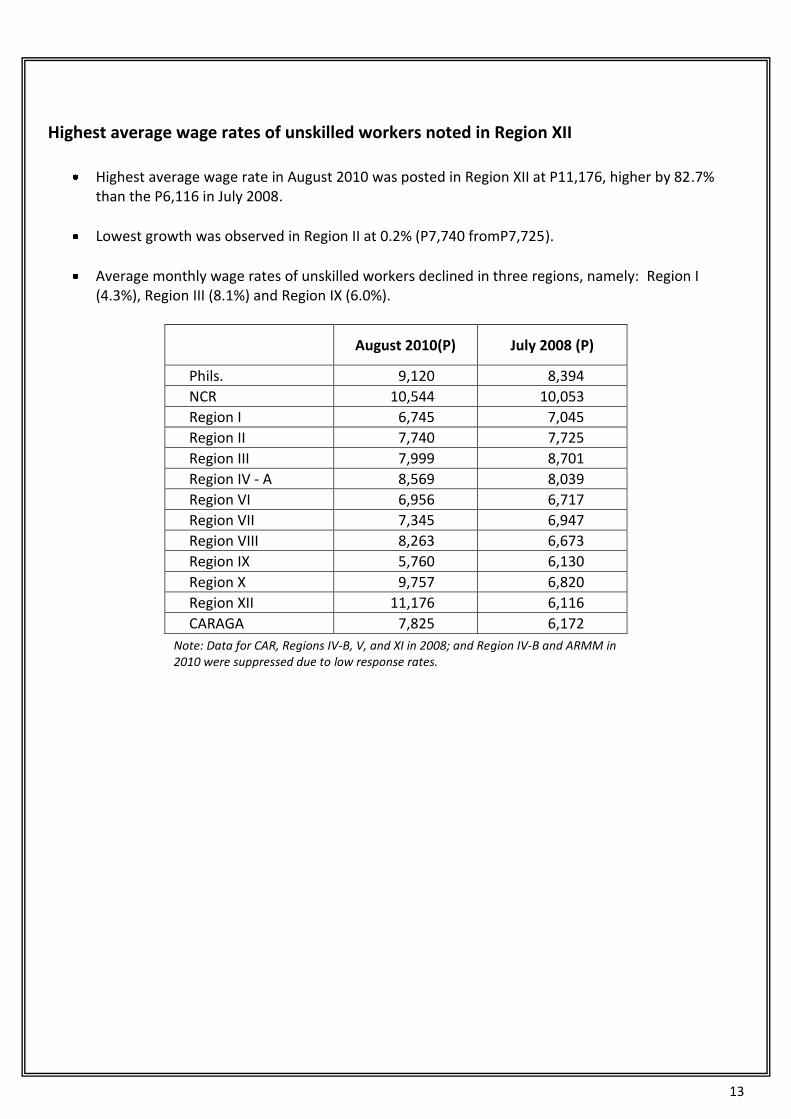
Highest average wage rates of unskilled workers noted in Region XII
Highest average wage rate in August 2010 was posted in Region XII at P11,176, higher by 82.7% than the P6,116 in July 2008.
Lowest growth was observed in Region II at 0.2% (P7,740 fromP7,725).
Average monthly wage rates of unskilled workers declined in three regions, namely: Region I (4.3%), Region III (8.1%) and Region IX (6.0%).
August 2010(P) July 2008 (P)
Phils. 9,120 8,394
NCR 10,544 10,053
Region I 6,745 7,045
Region II 7,740 7,725
Region III 7,999 8,701
Region IV - A 8,569 8,039
Region VI 6,956 6,717
Region VII 7,345 6,947
Region VIII 8,263 6,673
Region IX 5,760 6,130
Region X 9,757 6,820
Region XII 11,176 6,116
CARAGA 7,825 6,172
Note: Data for CAR, Regions IV-B, V, and XI in 2008; and Region IV-B and ARMM in 2010 were suppressed due to low response rates.