igu - 2016 world lng report
TRANSCRIPT
Sponsored by
2016 World LNG ReportLNG 18 Conference & Exhibition Edition


Table of Contents
Message from the President of the International Gas Union 3
2. State of the LNG Industry 4
3. LNG Trade 6
3.1 Overview 6
3.2. LNG Exports by Country 7
3.3. LNG Imports by Country 9
3.4. LNG Interregional Trade 11
3.5. Spot, Medium and Long-Term Trade 13
3.6. LNG Pricing Overview 14
4. Liquefaction Plants 17
4.1. Overview 17
4.2. Global Liquefaction Capacity and Utilisation 17
4.3. Liquefaction Capacity by Country 18
4.4. Liquefaction Processes 20
4.5. Floating Liquefaction 21
4.6. Project Capital Expenditures (CAPEX) 23
4.7. Risks to Project Development 24
4.8. Update on New Liquefaction Plays 27
5. LNG Carriers 34
5.1. Overview 34
5.2. Vessel Characteristics 35
5.3. Charter Market 38
5.4. Fleet Voyages and Vessel Utilisation 40
5.5. Fleet and Newbuild Orders 40
5.6. Vessel Costs and Delivery Schedule 41
5.7. Near-Term Shipping Developments 42
About the cover: Liquefied Natural Gas membrane system tank for a LNG carrier using GTT Membrane - No 96 Containment System. Copyright © 1997 Gaztransport & Technigaz All Rights Reserved.
1
IGU World Gas LNG Report — 2016 Edition

6. LNG Receiving Terminals 45
6.1. Overview 45
6.2. Receiving Terminal Capacity and Utilisation Globally 45
6.3. Receiving Terminal Capacity and Utilisation by Country 46
6.4. Receiving Terminal LNG Storage Capacity 49
6.5. Receiving Terminal Berthing Capacity 49
6.6. Receiving Terminals with Reloading and Transshipment Capabilities 50
6.7. Comparison of Floating and Onshore Regasification 51
6.8. Project Capex 52
6.9. Risks to Project Development 53
7. The LNG Industry in Years Ahead 56
8. References Used in the 2016 Edition 59
8.1. Data Collection 59
8.2. Definitions 59
8.3. Regions and Basins 59
8.4. Acronyms 60
8.5. Units 60
8.6. Conversion Factors 60
Appendix 1: Table of Liquefaction Plants 61
Appendix 2: Table of Liquefaction Plants Under Construction 64
Appendix 3: Table of LNG Receiving Terminals 65
Appendix 4: Table of LNG Receiving Terminals Under Construction 68
Appendix 5: Table of Active LNG Fleet 69
Appendix 6: Table of LNG Vessel Orderbook 81
Appendix 7: Table of FSRU and Laid-up Vessels 85
2
IGU World Gas LNG Report — 2016 Edition

Dear colleagues:
As we launch the 2016 IGU World LNG Report, I am struck by the remarkable changes in our industry over the past year. When we released last year’s report we could see the writing on the wall – my predecessor noted “the spectacular and unexpected tumble in oil prices” – but today there is growing evidence of fundamental changes in the energy industry.
Global energy pricing has entered a new paradigm; while $70 (and higher) crude was the norm for many years, we’re now uncertain about when to expect a rebound to historical trading ranges. Gas industry dynamics are also changing. Projects
approved several years ago in a more robust pricing environment are now coming on stream. This supply abundance has affected gas hub and spot LNG pricing levels. LNG contract prices are trending downward, driven by traditional oil-linked formulas.
Nevertheless, the LNG industry remains vibrant, with four liquefaction projects reaching final investment decision in 2015, representing 20 MTPA of new capacity by the end of the decade. New regasification markets formed in Egypt, Jordan, Pakistan and Poland, just in time to benefit from near record-low prices. The United States is about to ride its shale technology revolution to increasing exports of both crude oil and LNG.
In another development affecting the energy industry, the results of COP21 in Paris provided some uncertainty and hinted at some potentially exciting opportunities for natural gas. While the overall message of COP21 was a desire to move the world economy away from fossil fuels and toward renewables, news from Paris also highlighted a nearer term challenge, the detrimental effects of poor air quality on public health and economic development.
The global social and political groundswell illustrated by the COP21 agreements suggest that gas can be a critical part of the globe’s future energy mix. Gas has many important benefits – it’s abundant, flexible and is the perfect complement to intermittent renewables for electricity production. Gas provides clean affordable heating for industrial processes and for commercial and residential customers around the world. Natural gas also has benefits relative to coal and oil – in terms of lower carbon emissions of course, but also in terms of particulates and other emissions that contribute to poor air quality and ensuing health concerns.
IGU is strongly promoting the myriad benefits of gas, and the worldwide LNG industry is playing a key role in expanding access to this important energy resource that leads to a lower carbon future, cleaner air in metropolitan areas, and a prosperous economic future.
The World LNG Report, a flagship publication of IGU first published in 2010, provides key insights into LNG industry developments through the first quarter of 2016. While the Report’s focus remains, as in years past, upon recent historical data on world LNG activity, the Report also provides key insights on issues addressing world LNG activity going forward. Now published on an annual basis, the Report serves many in the international energy business as a standard desk reference for information on the LNG industry.
Yours sincerely,
Message from the President of the International Gas Union
…the LNG industry remains vibrant, with four liquefaction projects reaching final investment decision in 2015, representing 20 MTPA of new capacity by the end of the decade.
David Carroll President of the International Gas Union
3
IGU World Gas LNG Report — 2016 Edition

Short-, Medium- and Long-term LNG Market (as defined in Chapter 8): In 2015, the start-up of new projects in Australia and Indonesia contributed
meaningfully to the growth in non long-term trade (all those volumes traded under contracts of less than 5 years), as the delivery of commissioning cargoes plus the prevalence of more flexible contracts allowed short- and medium term trade to grow in both countries by over 3 MT year-on-year (YOY). In total, all non long-term LNG trade reached 71.9 MT in 2015, accounting for 29% of total gross LNG trade.
Liquefaction Plants: In 2015 global liquefaction nameplate capacity reached 301.5 MTPA as two new projects began commercial operations: the 8.5 MTPA
Queensland Curtis LNG (QCLNG) project in Australia and the 2 MTPA Donggi-Senoro plant in Indonesia. Gladstone LNG (GLNG) in Australia also sent out commissioning cargoes in 2015, but commercial operations are stated to begin in 2016. Arun LNG in Indonesia transitioned to an import terminal in early 2015 after the final two trains were decommissioned in late 2014, while Algeria’s Skikda plant decommissioned two trains in early 2014. A further 142 MTPA of liquefaction capacity was under construction world-wide as of January 2016. Final investment decisions (FID) occurred for a combined 20 MTPA at Sabine Pass T5, Corpus Christi T1-2, Freeport LNG T3, and Cameroon FLNG.
2. State of the LNG Industry1
Global Trade: Total LNG trade reached 244.8 MT in 2015, up 4.7 MT from 2014. This marks the largest year ever for LNG trade, surpassing the previous
high of 241.5 set in 2011. The startup of several new projects in Australia and Indonesia drove higher supply, ramping up significantly enough to offset outages in Yemen, Egypt and Angola. Although the Pacific Basin remains the largest source of demand, growth was driven by Europe and the Middle East; both regions saw new countries become importers in 2015.
Global Prices: The decline in oil prices and growing weakness in Pacific demand led all global LNG price markers to fall in 2015, from an average $15.60/MMBtu in
2014 to $9.77/MMBtu in 2015. Japanese import prices, which are primarily linked to oil, fell most dramatically, dropping 78% between January and December 2015. Northeast Asian spot prices also dropped sharply, which led the differential between the Pacific and Atlantic Basins to narrow to an average $1.32/MMBtu throughout the year, down from the average $6.80/MMBtu differential in 2014. As a result of this price signal, Atlantic to Pacific basin trade declined.
244.8 MTGlobal trade in 2015
$9.77/MMBtuAverage LNG import price
in Japan, 2015
71.9 MTNon long-term trade, 2015
301.5 MTPA Global nominal liquefaction
capacity, January 2016
1 The scope of this report is limited only to international LNG trade, excluding small-scale projects, unless explicitly stated. Small-scale projects are defined as anything less than 0.5 MTPA for liquefaction and less than 1.0 MTPA for regasification.
Gorgon. Photo courtesy Chevron
4
IGU World Gas LNG Report — 2016 Edition

Floating Regasification: Floating regasification continued to gain popularity in 2015; 20.4 MTPA of new terminals were added during the year to bring total global
floating capacity to 77 MTPA, which accounts for 10% of the total 757 MTPA in the market. Two floating storage and regasification units (FSRU) were added in Egypt, along with one in Jordan and one in Pakistan in 2015, as four out of the seven new terminals that started commercial operations in 2015 were FSRUs. Furthermore, five FSRU projects (in Ghana, Colombia, Puerto Rico, Uruguay and Chile) are in advanced stages.
Shipping Fleet: The global LNG shipping fleet consisted of 410 vessels as of January 2016, with a total capacity of 60 mmcm. The 28 LNG vessels (including the FSRU Golar Tundra that initially
acted as an LNG vessel) delivered in 2015 far outweighed the shipping requirements from the additional 4.7 MT of incremental LNG trade, exacerbating the oversupply in the LNG shipping market and leading charter rates to fall 49% between January and December 2015.
LNG Positioning: Natural gas accounts for roughly a quarter of global energy demand, of which 9.8% is supplied as LNG. Although LNG supply has grown faster
than any other supply source – averaging 6% per annum from 2000 to 2014 – its market share growth has stalled since 2010 as growth in domestic production has accelerated. However, a major expansion of LNG supply through 2020 positions LNG to further expand its share.
New Liquefaction Frontiers: Over the last several years, proposed liquefaction capacity has expanded dramatically and totalled 890 MTPA
by January 2016. Only some of these projects will come to fruition as market demand expectations are much lower than that volume. Activity has already slowed considerably in 2015 as a result of market oversupply and demand uncertainty in key import markets. Key emerging regions include the US Gulf Coast and Canada (where proposals are spurred by the increase in shale gas production), East Africa (owing to large gas discoveries), floating LNG globally (to take advantage of stranded gas and potentially lower liquefaction unit costs), Asia Pacific brownfield expansions, and Arctic projects in Russia and Alaska.
Regasification Terminals: Global onshore and floating regasification capacity reached 757 MTPA in 2015. The year saw the majority of new terminals constructed
in emerging markets, including Egypt, Jordan and Pakistan, though the world’s largest importer – Japan – did bring online two new terminals. In addition to the three markets above, which brought the number of countries with regasification capacity to 33, Poland received its first commissioning cargo in December 2015 and its onshore terminal is expected to achieve commercial operations in early 2016. As of January 2016, 15 new terminals were reported to be under construction, 8 of which are located in China, for an increase in total global capacity of 73 MTPA expected online by 2019.
410 Vessels LNG fleet, January 2016
10% of SupplyShare of LNG
in global gas supply
757 MTPA Global nominal regasification
capacity, January 2016
77 MTPA FSRU capacity, end-2014
890 MTPA Proposed liquefaction capacity in
new LNG frontiers
Prelude FLNG. Courtesy Photographic Services, Shell International Limited
5
IGU World Gas LNG Report — 2016 Edition
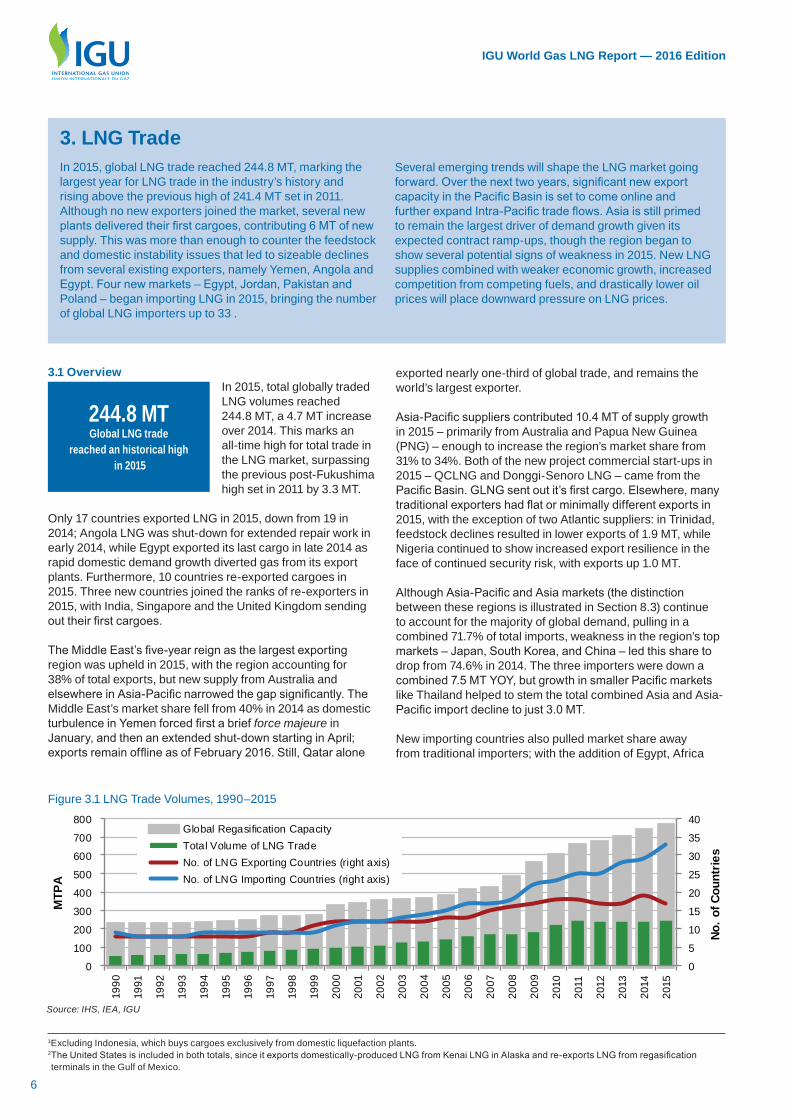
3.1 OverviewIn 2015, total globally traded LNG volumes reached 244.8 MT, a 4.7 MT increase over 2014. This marks an all-time high for total trade in the LNG market, surpassing the previous post-Fukushima high set in 2011 by 3.3 MT.
Only 17 countries exported LNG in 2015, down from 19 in 2014; Angola LNG was shut-down for extended repair work in early 2014, while Egypt exported its last cargo in late 2014 as rapid domestic demand growth diverted gas from its export plants. Furthermore, 10 countries re-exported cargoes in 2015. Three new countries joined the ranks of re-exporters in 2015, with India, Singapore and the United Kingdom sending out their first cargoes.
The Middle East’s five-year reign as the largest exporting region was upheld in 2015, with the region accounting for 38% of total exports, but new supply from Australia and elsewhere in Asia-Pacific narrowed the gap significantly. The Middle East’s market share fell from 40% in 2014 as domestic turbulence in Yemen forced first a brief force majeure in January, and then an extended shut-down starting in April; exports remain offline as of February 2016. Still, Qatar alone
3. LNG TradeIn 2015, global LNG trade reached 244.8 MT, marking the largest year for LNG trade in the industry’s history and rising above the previous high of 241.4 MT set in 2011. Although no new exporters joined the market, several new plants delivered their first cargoes, contributing 6 MT of new supply. This was more than enough to counter the feedstock and domestic instability issues that led to sizeable declines from several existing exporters, namely Yemen, Angola and Egypt. Four new markets – Egypt, Jordan, Pakistan and Poland – began importing LNG in 2015, bringing the number of global LNG importers up to 33 .
Several emerging trends will shape the LNG market going forward. Over the next two years, significant new export capacity in the Pacific Basin is set to come online and further expand Intra-Pacific trade flows. Asia is still primed to remain the largest driver of demand growth given its expected contract ramp-ups, though the region began to show several potential signs of weakness in 2015. New LNG supplies combined with weaker economic growth, increased competition from competing fuels, and drastically lower oil prices will place downward pressure on LNG prices.
244.8 MT Global LNG trade
reached an historical high in 2015
exported nearly one-third of global trade, and remains the world’s largest exporter.
Asia-Pacific suppliers contributed 10.4 MT of supply growth in 2015 – primarily from Australia and Papua New Guinea (PNG) – enough to increase the region’s market share from 31% to 34%. Both of the new project commercial start-ups in 2015 – QCLNG and Donggi-Senoro LNG – came from the Pacific Basin. GLNG sent out it’s first cargo. Elsewhere, many traditional exporters had flat or minimally different exports in 2015, with the exception of two Atlantic suppliers: in Trinidad, feedstock declines resulted in lower exports of 1.9 MT, while Nigeria continued to show increased export resilience in the face of continued security risk, with exports up 1.0 MT.
Although Asia-Pacific and Asia markets (the distinction between these regions is illustrated in Section 8.3) continue to account for the majority of global demand, pulling in a combined 71.7% of total imports, weakness in the region’s top markets – Japan, South Korea, and China – led this share to drop from 74.6% in 2014. The three importers were down a combined 7.5 MT YOY, but growth in smaller Pacific markets like Thailand helped to stem the total combined Asia and Asia-Pacific import decline to just 3.0 MT.
New importing countries also pulled market share away from traditional importers; with the addition of Egypt, Africa
1Excluding Indonesia, which buys cargoes exclusively from domestic liquefaction plants.2 The United States is included in both totals, since it exports domestically-produced LNG from Kenai LNG in Alaska and re-exports LNG from regasification terminals in the Gulf of Mexico.
Source: IHS, IEA, IGU
0
5
10
15
20
25
30
35
40
0
100
200
300
400
500
600
700
800
1990
1991
1992
1993
1994
1995
1996
1997
1998
1999
2000
2001
2002
2003
2004
2005
2006
2007
2008
2009
2010
2011
2012
2013
2014
2015
No. o
f Cou
ntrie
s
MTP
A
Global Regasification CapacityTotal Volume of LNG TradeNo. of LNG Exporting Countries (right axis)No. of LNG Importing Countries (right axis)
Figure 3.1 LNG Trade Volumes, 1990–2015
6
IGU World Gas LNG Report — 2016 Edition

imported LNG for the first time in 2015, while three other markets (Pakistan, Jordan, and Poland) also took in their first cargoes this year. In total, these new markets pulled in 6.0 MT in 2015 as Egypt set a new record for the fastest import ramp-up ever. The four new markets added to the 29 existing markets in 2014 to bring the total number of importing countries to 33 (excluding Indonesia, which has only consumed domestically-produced LNG).
The decline in European LNG consumption that has occurred since 2011 appears to have ended, with 2015 imports rising by 4.6 MT as supply was redirected away from weaker Asian markets and Asia-NBP price differentials narrowed significantly. All but one European importer (France) registered a YOY gain in 2015, with the UK showing the third-largest gain overall at 1.3 MT), causing the region to have the highest global YOY growth. In contrast, imports in many North American and Latin American countries fell, owing to increased pipeline supply availability (Mexico), improved hydroelectric power generation (Brazil), and general economic weakness (Argentina and Brazil). The two regions were down a combined 1.8 MT.
Near-term LNG demand will reflect many of the same trends that occurred in 2015. The Pacific basin will likely remain the primary driver of demand growth despite recent signs of weakness, owing to contracted supply ramp-ups. However there are potential downsides to the outlook from more nuclear restarts in Japan and additional economic weakness in Northeast Asia (particularly China). European demand fundamentals are set to remain weak, but a large increase in Intra-Pacific trade will likely shift more Atlantic and Middle East volumes to Europe, giving it significant growth potential. Downward pressure on LNG prices from an expected abundance of supply and lower oil prices could lead more countries – and potentially higher-risk countries – to quickly enter the market, particularly through the utilization of FSRUs.
On the supply side, the first cargoes from the US Gulf of Mexico will be exported in 2016, but the majority of
the increase in supply will come from the Pacific Basin, particularly southeast Asia and Australia. The majority of under-construction capacity in the US is not expected to be completed until 2017 and later.
3.2. LNG Exports by CountryOnly 17 countries exported LNG in 2015, down from 19 in 2014. This is owing to the suspension in exports from Angola and Egypt, which were shut down for repair work and feedstock loss, respectively. Despite the decrease in number of exporting countries, several new plants started up in 2015 which helped to increase total LNG trade by 4.7 MT. In Australia, QCLNG started commercial operations in early 2015 and GLNG delivered its first commissioning cargo in October. Indonesia’s Donggi-Senoro LNG also began operations in the second half of 2015. In total, new plants added 6.0 MT to the market in 2015, which were delivered to Asia, Asia-Pacific, and the Middle East.
Figure 3.2. LNG Exports and Market Share by Country (in MTPA)
Qatar, 77.8, 31.8%Australia, 29.4, 12%Malaysia, 25, 10.2%Nigeria, 20.4, 8.3%Indonesia, 16.1, 6.6%Trinidad, 12.5, 5.1%Algeria, 12.1, 5%Russia, 10.9, 4.5%Oman, 7.8, 3.2%PNG, 7, 2.9%Brunei, 6.6, 2.7%UAE, 5.6, 2.3%Norway, 4.2, 1.7%Eq. Guinea, 3.8, 1.6%Peru, 3.7, 1.5%Yemen, 1.5, 0.6%US, 0.3, 0.1%
Note: Numbers in the legend represent total 2015 exports in MT, followed by market share. Sources: IHS, IGU
2014-2015 LNG Trade in Review
Global LNG Trade
+4.7 MTPAGrowth of
global LNG trade
LNG Exporters & Importers
+4Number of new LNG markets in
2015
LNG Re-Exports
-1.7 MTContraction in
re-exports in 2015
LNG Prices
-$7.18Change in average Northeast
Asian spot price in MMBtu
Global LNG trade reached an all-time high of 247 MT, rising above the previous high of 242 MT set in 2011
For the first time since 2010, Europe led overall demand growth, followed by the Middle East
No new countries began exporting in 2015, but 4 new markets – Egypt, Jordan, Pakistan, and Poland –imported their first cargoes
Two markets – Egypt and Angola – ceased sending out cargoes in 2015, though Angola is expected to return to the market in early 2016
Although three new markets re-exported cargoes in 2015, total re-exports fell owing to diminished cross-basin arbitrage potential
The number of countries re-exporting LNG in 2015 rose to 12 with the addition of the UK, Singapore, and India
The drop in oil prices and a looser supply market led to a ~50% decline in Northeast Asian spot prices in 2015, falling from an average $15.01/MMBtu in 2014 to $7.83
Although the Pacific basin maintained its premium over Atlantic markets, differentials narrowed significantly
7
IGU World Gas LNG Report — 2016 Edition
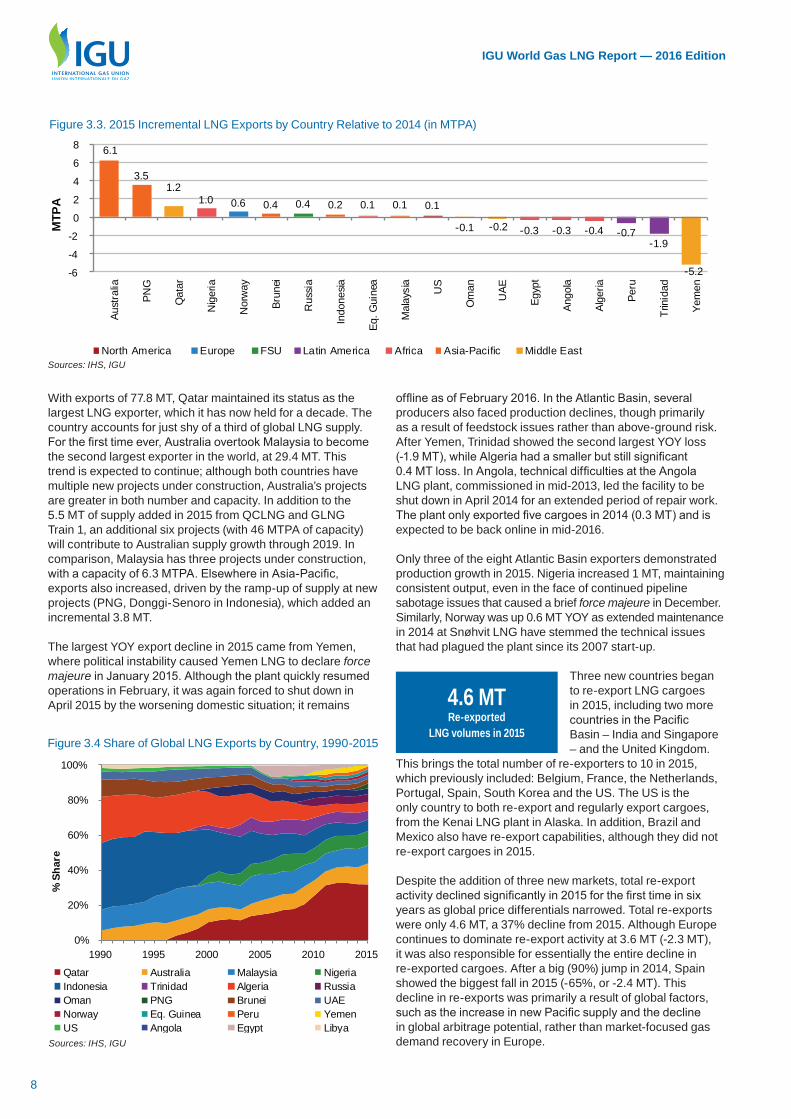
With exports of 77.8 MT, Qatar maintained its status as the largest LNG exporter, which it has now held for a decade. The country accounts for just shy of a third of global LNG supply. For the first time ever, Australia overtook Malaysia to become the second largest exporter in the world, at 29.4 MT. This trend is expected to continue; although both countries have multiple new projects under construction, Australia’s projects are greater in both number and capacity. In addition to the 5.5 MT of supply added in 2015 from QCLNG and GLNG Train 1, an additional six projects (with 46 MTPA of capacity) will contribute to Australian supply growth through 2019. In comparison, Malaysia has three projects under construction, with a capacity of 6.3 MTPA. Elsewhere in Asia-Pacific, exports also increased, driven by the ramp-up of supply at new projects (PNG, Donggi-Senoro in Indonesia), which added an incremental 3.8 MT.
The largest YOY export decline in 2015 came from Yemen, where political instability caused Yemen LNG to declare force majeure in January 2015. Although the plant quickly resumed operations in February, it was again forced to shut down in April 2015 by the worsening domestic situation; it remains
offline as of February 2016. In the Atlantic Basin, several producers also faced production declines, though primarily as a result of feedstock issues rather than above-ground risk. After Yemen, Trinidad showed the second largest YOY loss (-1.9 MT), while Algeria had a smaller but still significant 0.4 MT loss. In Angola, technical difficulties at the Angola LNG plant, commissioned in mid-2013, led the facility to be shut down in April 2014 for an extended period of repair work. The plant only exported five cargoes in 2014 (0.3 MT) and is expected to be back online in mid-2016.
Only three of the eight Atlantic Basin exporters demonstrated production growth in 2015. Nigeria increased 1 MT, maintaining consistent output, even in the face of continued pipeline sabotage issues that caused a brief force majeure in December. Similarly, Norway was up 0.6 MT YOY as extended maintenance in 2014 at Snøhvit LNG have stemmed the technical issues that had plagued the plant since its 2007 start-up.
Three new countries began to re-export LNG cargoes in 2015, including two more countries in the Pacific Basin – India and Singapore – and the United Kingdom.
This brings the total number of re-exporters to 10 in 2015, which previously included: Belgium, France, the Netherlands, Portugal, Spain, South Korea and the US. The US is the only country to both re-export and regularly export cargoes, from the Kenai LNG plant in Alaska. In addition, Brazil and Mexico also have re-export capabilities, although they did not re-export cargoes in 2015.
Despite the addition of three new markets, total re-export activity declined significantly in 2015 for the first time in six years as global price differentials narrowed. Total re-exports were only 4.6 MT, a 37% decline from 2015. Although Europe continues to dominate re-export activity at 3.6 MT (-2.3 MT), it was also responsible for essentially the entire decline in re-exported cargoes. After a big (90%) jump in 2014, Spain showed the biggest fall in 2015 (-65%, or -2.4 MT). This decline in re-exports was primarily a result of global factors, such as the increase in new Pacific supply and the decline in global arbitrage potential, rather than market-focused gas demand recovery in Europe.
4.6 MT Re-exported
LNG volumes in 2015
Sources: IHS, IGU
1.2
-0.1 -0.2
-5.2
6.1
3.5
0.4 0.2 0.11.0 0.1
-0.3 -0.3 -0.4 -0.7-1.9
0.40.6 0.1
-6
-4
-2
0
2
4
6
8
Aust
ralia
PNG
Qat
ar
Nig
eria
Nor
way
Brun
ei
Rus
sia
Indo
nesia
Eq. G
uine
a
Mal
aysi
a
US
Om
an
UAE
Egyp
t
Ango
la
Alge
ria
Peru
Trin
idad
Yem
en
MTP
A
North America Europe FSU Latin America Africa Asia-Pacific Middle East
Figure 3.3. 2015 Incremental LNG Exports by Country Relative to 2014 (in MTPA)
Figure 3.4 Share of Global LNG Exports by Country, 1990-2015
0%
20%
40%
60%
80%
100%
1990 1995 2000 2005 2010 2015
% S
hare
Qatar Australia Malaysia NigeriaIndonesia Trinidad Algeria RussiaOman PNG Brunei UAENorway Eq. Guinea Peru YemenUS Angola Egypt Libya
Sources: IHS, IGU
8
IGU World Gas LNG Report — 2016 Edition

Looking ahead, the re-export trade may face even more pressure as new LNG supplies enter the market, exerting pressure on spot prices and limiting arbitrage opportunities. However, as traditional Asian markets face increased demand uncertainty ahead of major contracted supply ramp-ups, additional Pacific markets may add or increase their re-export capabilities.
Regionally, LNG trade is still dominated by the Middle East (92.7 MT), owing to Qatar’s large role in the market. However, growth was driven by Asia-Pacific (84.1 MT), which increased by 10.4 MT YOY. As Yemen went offline for most of the year, the Middle East fell to a 38% market share, while new plants in Australia and Indonesia pushed Asia-Pacific up to a 34% market share – the closest the two regions have been since 2010. Although overall production was largely flat in Africa, growth elsewhere led its market share to fall slightly, to 14.8%.
3.3. LNG Imports by CountryIn contrast to the declining number of exporters, the number of importers grew in 2015 as four new markets took in LNG cargoes. The addition of Jordan, Pakistan, Poland and Egypt – the first importer in Africa – brought the number of importing countries to 33.
Although Asia Pacific was still by far the largest market in 2015 at 139.8 MT, it also showed the biggest decline, falling by 5.1 MT to 57% of global LNG consumption. Japan is the largest market in the region (and globally), followed by South Korea and Taiwan. After narrowly outstripping Europe as the second largest LNG market in 2014, Asia once again fell to third place in 2015. Although both markets showed significant YOY growth. China, India, and Pakistan imported a combined 35.6 MT, just under 15% of global trade. European imports stood at 37.5 MT, up 4.6 MT from 2014 as re-export activity slowed.
In a strong reversal of recent trends, Europe had by far the largest growth globally in 2015 (+4.6 MT), as weaker Pacific
Figure 3.5: Re-Exports by Country, 2005-2015
0
1
2
3
4
5
6
7
2005 2007 2009 2011 2013 2015
MTP
A
United Kingdom, 3Singapore, 3India, 4South Korea, 4Netherlands, 15Portugal, 5Mexico, 0France, 6Brazil, 0US, 4Belgium, 12Spain, 23
Note: Number in legend represents number of international re-exports in 2015. Re-exports figures exclude volumes that were reloaded and discharged within the same country. Source: IHS
Figure 3.6: LNG Exports by Region, 1990-2015
Note: FSU = Former Soviet Union. Sources: IHS, IGU
0
50
100
150
200
250
300
1990 1995 2000 2005 2010 2015
MTP
A
North AmericaEuropeFSULatin AmericaAfricaAsia PacificMiddle East
Musel LNG Terminal. Photo courtesy of Enagas
9
IGU World Gas LNG Report — 2016 Edition

demand led Atlantic and Middle Eastern producers to supply more volumes into the region. This is the first year that Europe had positive LNG import growth since 2011 (which was only +0.2 MT); out of all 11 European importers, only France had a net YOY decline (-0.2 MT). Not including new markets, the UK had the largest YOY growth of any LNG importer, taking in an extra 1.3 MT over 2014 even as it began to re-export cargoes. It was followed closely by Belgium, which more than doubled its LNG imports to grow to 1.9 MT. New market entrant Poland added only very slightly to Europe’s import gain, as it took its first LNG cargo at the end of December.
After Europe, the second and third largest demand increases came from emerging regions: Africa and the Middle East. Jordan added 1.8 MT of new imports in its first year in the market as it looked to alleviate both its own gas shortage as well as that of neighbouring Egypt. A portion of its imports went to feed the gas-short market in a reversal of historical pipeline flows. Existing importers Kuwait and the UAE also had significant incremental growth (+0.8 MT), as they capitalized on lower import prices to feed growing demand.
With the start-up of Egypt’s two FSRU’s, Africa imported LNG for the first time ever. Egypt had the fastest ramp-up of any importer ever, taking in over 1 MT within just four months of its first cargo in April, and reaching 3.0 MT by the end of the year. This is significantly higher than the previous record for fastest ramp-up, set by India in 2004 with 1.9 MT of imports in its first year.
The largest decline came from Asia-Pacific (-5.1 MT). The return of the first nuclear plant online in Japan since 2013, as well as weaker electricity demand and increased competition from competing fuels led to a 3.1 MT decline. Increased fuel competition in the power sector was also a major factor in South Korea’s 4.5 MT drop, as coal is increasingly being favoured for new power generation. As additional nuclear and coal generation come online (or return) in Japan and South Korea, their LNG demand weakness can be expected to continue over the next several years.
Although Chinese LNG demand growth did not decline in 2015 (+0.02 MT), growth far underperformed expectations based on contracted supplies. Still, total Asia demand grew by 2.0 MT in 2015, propped up by the addition of Pakistan (+1.1 MT) as an
importer and slightly higher imports in India (+0.2 MT). While contracted supplies from new projects in the Pacific Basin have positioned China for strong LNG import growth in 2016-17, uncertainty remains regarding China’s ability to absorb the contracted supply ramp-up into its market. This could lead to additional volumes moving to the Atlantic Basin.
Both Latin American and North American LNG imports fell in 2015. In Latin America, economic performance and better hydroelectric stocks contributed to a 0.8 MT decline, though it still maintained a 7.1 MT lead over North America. A weak economic outlook for the region, particularly in Brazil, weighs heavily on Latin America’s LNG outlook, and could usher in a further decline in LNG imports in the Americas. Mexico – since 2012 by far the largest importer in North America – had the third largest decline after Japan and South Korea. The completion of a new pipeline from the United States allowed for a ramp-up in pipeline imports, displacing 1.7 MT of LNG imports. Additional new midstream projects are set to allow for a further increase in low-cost pipeline supply from the US, pushing out more LNG in years ahead.
Globally, domestic production and pipeline trade still account for the majority of gas supplies, at 70.6% and 19.6% of the total, respectively. LNG made rapid gains in the late 1990s and 2000s, but its share has stabilized around 10% since 2010; in 2014 LNG accounted for 9.8% of global gas consumption. Still, LNG retains the highest growth rate of the three gas supply sources, expanding by an average 6.6% since 2000, though this dropped to just 2.2% between 2010 and 2014.
LNG imports have developed around the world for a variety of reasons. In the largest markets in Asia Pacific, geographic and geologic restrictions make LNG the
only viable source of gas supply. Asia Pacific countries are by far the most dependent on LNG imports to meet gas demand, with LNG making up the majority of gas supply compared
Table 3.1: LNG Trade between Basins, 2015, MT
Exporting Region
Importing Region
Africa 0.5 0.1 0.1 0.1 1.7 0.6 3.0Asia 4.4 14.6 0.1 0.2 0.4 15.5 0.7 0.3 35.6
Asia-Pacif ic 9.7 68.5 0.3 10.7 0.4 49.4 0.3 1.1 0.5 139.8Europe 15.8 2.3 2.1 20.8 0.2 3.6 37.5Latin
America 3.2 1.3 7.5 1.6 0.9 14.6
Middle East 1.2 0.8 0.9 3.0 1.0 6.9North
America 1.5 0.2 0.3 4.8 0.6 0.1 0.2 7.4
Total 36.3 84.1 4.2 10.9 16.2 92.7 0.3 4.6 -4.6 244.8
Afric
a
Asia
-Pac
ific
Euro
pe
Form
er S
ovie
t U
nion
Latin
Am
eric
a
Mid
dle
East
Nor
th A
mer
ica
Ree
xpor
ts
Rec
eive
d
Ree
xpor
ts L
oade
d
Tota
l Sources: IHS, EIA, IGU
Figure 3.7. LNG Imports and Market Share by Country (in MTPA)Japan, 85.6, 34%S. Korea, 33.4, 13.2%China, 19.8, 7.9%India, 14.7, 5.8%Taiwan, 14.6, 5.8%UK, 9.8, 3.9%Spain, 8.9, 3.5%Turkey, 5.6, 2.2%Brazil, 5.2, 2.1%Mexico, 5.1, 2%France, 4.5, 1.8%Italy, 4.2, 1.7%Argentina, 4.2, 1.7%Egypt, 3, 1.2%Chile, 3, 1.2%Kuwait, 2.9, 1.2%Thailand, 2.6, 1%UAE, 2, 0.8%Singapore, 2.1, 0.8%Other, 13.6, 5.4%
Note: Number legend represents total imports in MT, followed by market share %. “Other” includes countries with exports less than 2.0 MT: Belgium, US, Jordan, Malaysia, Puerto Rico, Portugal, Pakistan, Dominican Republic, Netherlands, Canada, Greece, Lithuania, Israel, and Poland. Sources: IHS, IGU
+ 6.6% p.a.Average yearly growth rate of LNG
demand since 2000
10
IGU World Gas LNG Report — 2016 Edition

to Latin America and Europe. With little to no domestic production and no pipeline import capacity, Japan, South Korea and Taiwan – the three most important LNG markets in Asia Pacific – rely on LNG to meet nearly 100% of gas demand.
In other major gas markets, countries used LNG to offset maturing domestic gas production or pipeline supply, as has been the case in traditional gas producers like the UK, the Netherlands, Egypt and Argentina. Other markets without or with limited domestic production such as Belgium, Greece, and France have also turned to LNG chiefly to supplement pipeline imports. LNG imports have also evolved in gas-producing markets like Kuwait, Thailand and the UAE where stable or growing domestic production has been unable to keep up with rapidly increasing domestic demand.
In other markets, LNG is used to increase gas supply security. Italy and Turkey are examples of firmly established pipeline markets that have used LNG to augment gas supply diversity. LNG has also served to fortify supply for countries with historically unstable pipeline gas supply, such as Israel and Jordan, which have completely lost pipeline supply from Egypt.
Over the past few years, shifting market dynamics have changed the import requirements of several countries, allowing several markets to essentially wean off LNG imports. The US shale revolution has allowed the US to become self-
Note: “Other” includes countries with incremental imports of less than ±0.2 MT: Portugal, India, Kuwait, France, Netherlands, Poland, Canada, Puerto Rico, Dominican Republic, Malaysia, Greece, China, and Israel. Sources: IHS, IGU
3.0
1.11.3 1.00.2
-3.1-4.5
1.3 1.0 0.9 0.7 0.2 0.20.2
-0.5 -0.5
1.8
0.60.6
-1.7
0.7
-6
-4
-2
0
2
4Eg
ypt
Jord
an UK
Thai
land
Pak
ista
n
Taiw
an
Bel
gium Ita
ly
Spa
in
Oth
er US
UA
E
Turk
ey
Chi
le
Lith
uani
a
Sin
gapo
re
Bra
zil
Arg
entin
a
Mex
ico
Japa
n
S. K
orea
MTP
A
Africa Asia Asia-Pacific Europe Latin America Middle East North America Other
Figure 3.8: Incremental 2015 LNG Imports by Country Relative to 2014 (in MTPA)
sufficient in gas and sharply reduced the LNG requirements of Canada and Mexico owing to the interconnectivity of the North American grid.
3.4. LNG Interregional TradeThe largest global trade flow route is Inter-Pacific trade, which accounts for 39% of all global trade. Historically, this share was much higher (over 70% in the early 1990s), but supply from Qatar and other Middle East and Atlantic suppliers diminished the Pacific’s share to hit a low of 34% in 2012. The start-up of PNG and new Australian projects added significantly to Inter-Pacific trade in 2015 (+9.4 MT) and will continue to do so over the next few years.
The biggest decline in regional flows in 2015 was in Middle East-Pacific trade, as new Pacific projects and stagnating Pacific demand combined to displace Qatari volumes from the Pacific Basin; as a result, Middle East-Atlantic and Intra-Middle East trade had the second and third highest annual growth, at 3.0 MT and 2.5 MT, respectively. Atlantic-Pacific trade declined considerably (-4.0 MT) with the fall in European re-exports. Once US projects ramp-up in 2017 and beyond, this trend may reverse.
Figure 3.9: Global Gas Trade, 2000-2014
Figure 3.10: Inter-Basin Trade Flows 1964-2015
0
500
1,000
1,500
2,000
2,500
3,000
3,500
4,000
2000 2002 2004 2006 2008 2010 2012 2014
Bcm
LNG Pipeline Consumed where produced
CAGR(2000-2014)
6.6%
3.0%
1.8% 0%
20%
40%
60%
80%
100%
64 67 70 73 76 79 82 85 88 91 94 97 00 03 06 09 12 15
% S
hare
Intra-Pacific Intra-AtlanticIntra-Middle East Middle East-PacificMiddle East-Atlantic Atlantic-PacificAtlantic-Middle East Pacific-Middle East
Note: CAGR = Compound Annual Growth Rate Sources: IHS, BP Statistical Review of World Energy
Sources: IHS, IGU
11
IGU World Gas LNG Report — 2016 Edition

Algeria
Angola
Australia
Brunei
Egypt
Equatorial Guinea
Indonesia
Malaysia
Nigeria
Norway
Oman
Papua New Guinea
Peru
Qatar
Russia
Trinidad
United Arab Emirates
United States
Yemen
Re-exports Received
Re-exports Loaded
2015 Net Imports
2014 Net Imports
2013 Net Imports
2012 Net Imports
2011 Net Imports
Egy
pt0.
35
-
0.07
-
-
0.
13
-
-
0.07
0.
06
-
-
-
1.
70
-
0.
06
-
-
-
0.
59
-
3.02
-
-
-
-
A
frica
0.35
-
0.
07
-
-
0.13
-
-
0.
07
0.06
-
-
-
1.70
-
0.06
-
-
-
0.59
-
3.
02
-
-
-
-
Chi
na0.
38
-
5.73
-
-
0.
20
2.90
2.
98
0.44
0.
06
0.06
1.
47
-
4.
93
0.19
0.
06
-
-
0.30
0.
14
-
19.8
3
19.8
1
18.6
0
14
.77
12.8
4
In
dia
-
-
0.84
-
-
0.
79
0.32
0.
13
2.22
-
0.59
0.
07
0.07
8.
81
-
0.
24
0.12
-
0.32
0.
41
(0.2
7)
14
.67
14
.48
12
.92
13.9
9
12
.74
Pak
ista
n-
-
0.
19
-
-
0.19
-
-
0.
19
-
-
-
-
0.41
-
-
-
-
-
0.13
-
1.
11
-
-
-
-
Asi
a 0.
38
-
6.76
-
-
1.
18
3.22
3.
11
2.85
0.
06
0.65
1.
53
0.07
14
.15
0.
19
0.30
0.
12
-
0.
63
0.69
(0
.27)
35.6
1
34.2
9
31.5
2
28
.76
25.5
8
Ja
pan
0.75
-
18
.71
4.
30
-
0.
46
6.02
15
.56
4.
56
0.06
2.
36
3.97
0.
15
14.5
9
7.78
0.
06
5.42
0.
16
0.22
0.
46
-
85.5
8
88.6
9
87.7
9
87
.26
78.7
6
M
alay
sia
0.40
-
0.
33
0.19
-
0.06
-
-
0.
19
0.14
0.
13
-
-
0.13
-
-
-
-
-
-
-
1.
57
1.
60
1.
62
-
-
Sin
gapo
re-
-
0.
65
-
-
0.66
0.
26
0.07
-
-
-
-
-
0.48
-
0.11
-
-
-
0.06
(0
.21)
2.10
1.89
0.94
-
-
K
orea
0.37
-
1.
93
1.29
-
0.72
3.
90
3.69
1.
29
-
4.
12
0.21
-
12.3
6
2.69
0.
05
-
-
0.53
0.
47
(0.2
8)
33
.36
37
.98
40
.86
36.7
8
35
.73
Taiw
an-
-
0.
26
0.69
-
0.07
2.
33
2.39
0.
06
0.07
-
1.28
-
6.99
0.
26
-
-
0.17
-
0.06
-
14
.63
13
.59
12
.83
12.7
8
12
.18
Thai
land
-
-
0.20
-
-
-
0.07
0.
13
0.13
-
-
-
-
2.
06
-
-
-
-
-
-
-
2.58
1.31
1.42
0.
98
0.72
A
sia-
Pac
ific
1.52
-
22
.09
6.
48
-
1.
96
12.5
8
21.8
5
6.22
0.
27
6.61
5.
47
0.15
36
.61
10
.73
0.
23
5.42
0.
33
0.75
1.
05
(0.4
8)
13
9.82
14
5.05
14
5.46
137.
80
12
7.40
Bel
gium
-
-
-
-
-
-
-
-
-
-
-
-
-
2.
62
-
-
-
-
-
-
(0.7
3)
1.
89
2.
13
1.
10
1.91
4.
45
Fran
ce3.
27
-
-
-
-
-
-
-
0.80
0.
35
-
-
0.20
0.
28
-
-
-
-
-
-
(0.3
5)
4.
54
5.
17
5.
80
7.48
10
.68
Gre
ece
0.27
-
-
-
-
0.06
-
-
0.
09
-
-
-
-
-
-
-
-
-
-
-
-
0.
42
0.
40
0.
51
1.07
0.
95
Italy
0.03
-
-
-
-
-
-
-
-
-
-
-
-
4.13
-
-
-
-
-
0.04
-
4.
21
3.
35
4.
25
5.23
6.
43
Lith
uani
a-
-
-
-
-
-
-
-
-
0.33
-
-
-
-
-
-
-
-
-
-
-
0.
33
0.
11
-
-
-
N
ethe
rland
s0.
17
-
-
-
-
-
-
-
-
0.
70
-
-
-
0.
60
-
-
-
-
-
-
(0.8
4)
0.
63
0.
80
0.
32
0.61
0.
56
Pol
and
-
-
-
-
-
-
-
-
-
-
-
-
-
0.
08
-
-
-
-
-
-
-
0.08
-
-
-
-
P
ortu
gal
0.17
-
-
-
-
-
-
-
0.
93
0.06
-
-
-
0.17
-
0.06
-
-
-
-
(0
.23)
1.16
1.25
1.32
1.
66
2.21
S
pain
2.81
-
-
-
-
-
-
-
2.
92
0.54
0.
06
-
0.
73
2.27
-
0.84
-
-
-
-
(1
.27)
8.91
11.8
5
9.36
14
.22
17.2
2
Tu
rkey
2.86
-
-
-
-
-
-
-
1.
10
0.14
-
-
-
1.20
-
0.12
-
-
-
0.13
-
5.
55
5.
32
4.
24
5.74
4.
58
Uni
ted
Kin
gdom
0.32
-
-
-
-
-
-
-
-
0.13
-
-
-
9.35
-
0.20
-
-
-
-
(0
.20)
9.79
8.47
6.84
10
.45
18.6
3
E
urop
e9.
89
-
-
-
-
0.
06
-
-
5.85
2.
26
0.06
-
0.93
20
.70
-
1.22
-
-
-
0.17
(3
.63)
37.5
1
38.8
5
33.7
4
48
.37
65.7
2
A
rgen
tina
-
-
-
-
-
0.
12
-
-
0.83
0.
50
-
-
-
0.
31
-
1.
94
-
-
-
0.
50
-
4.19
4.68
4.93
3.
82
3.19
B
razi
l-
-
-
-
-
0.19
-
-
1.
75
0.64
-
-
-
1.25
-
0.95
0.
06
-
-
0.38
-
5.
22
5.
78
4.
44
2.52
0.
62
Chi
le-
-
-
-
-
0.13
-
-
-
0.13
-
-
-
-
-
2.74
-
-
-
-
-
3.
01
2.
78
2.
86
3.03
2.
80
Dom
inic
an R
epub
lic-
-
-
-
-
-
-
-
-
-
-
-
-
-
-
0.95
-
-
-
-
-
0.
95
0.
92
1.
09
0.96
0.
72
Pue
rto R
ico
-
-
-
-
-
-
-
-
0.19
-
-
-
-
-
-
0.
94
-
-
-
0.
07
-
1.19
1.24
1.20
0.
97
0.54
La
tin A
mer
ica
-
-
-
-
-
0.
44
-
-
2.77
1.
27
-
-
-
1.
56
-
7.
52
0.06
-
-
0.
94
-
14.5
6
15.4
1
14.5
1
11
.30
7.88
Is
rael
-
-
-
-
-
-
-
-
-
-
-
-
-
-
-
0.
12
-
-
-
0.
01
-
0.13
0.12
1.56
2.
11
2.42
Jo
rdan
-
-
0.07
-
-
-
-
-
0.71
-
-
-
-
0.
58
-
0.
20
-
-
-
0.
25
-
1.81
-
-
-
-
K
uwai
t-
-
0.
20
0.13
-
0.07
0.
07
0.07
0.
42
-
0.
46
-
-
0.69
-
0.41
-
-
-
0.40
-
2.
90
2.
73
1.
08
1.24
1.
18
Uni
ted
Ara
b E
mira
tes
-
-
0.21
-
-
-
0.06
-
-
-
-
-
-
1.
26
-
0.
17
-
-
-
0.
34
-
2.03
1.39
0.41
-
-
M
iddl
e E
ast
-
-
0.47
0.
13
-
0.
07
0.13
0.
07
1.12
-
0.46
-
-
2.
53
-
0.
90
-
-
-
1.
00
-
6.88
4.24
3.06
3.
35
3.61
C
anad
a-
-
-
-
-
-
-
-
-
-
-
-
-
-
-
0.41
-
-
-
0.06
-
0.
47
0.
42
0.
75
1.28
2.
42
Mex
ico
-
-
-
-
-
-
0.19
-
1.49
0.
06
-
-
2.54
0.
50
-
0.
30
-
-
-
0.
07
-
5.13
6.87
5.97
3.
55
2.92
U
nite
d S
tate
s-
-
-
-
-
-
-
-
-
0.25
-
-
-
-
-
1.60
-
-
0.
15
-
(0
.18)
1.82
1.23
1.83
3.
26
5.93
N
orth
Am
eric
a-
-
-
-
-
-
0.
19
-
1.
49
0.31
-
-
2.
54
0.50
-
2.31
-
-
0.
15
0.13
(0
.18)
7.43
8.53
8.54
8.
09
11.2
7
20
15 E
xpor
ts
12.1
4
-
29
.39
6.
61
-
3.
84
16.1
2
25.0
3
20.3
6
4.23
7.
78
7.00
3.
68
77.7
5
10.9
2
12.5
3
5.60
0.
33
1.53
4.
57
(4.5
7)
24
4.84
20
14 E
xpor
ts
12.5
8
0.34
23
.25
6.
18
0.33
3.
72
15.8
8
24.9
0
19.3
7
3.68
7.
86
3.49
4.
33
76.5
7
10.5
7
14.3
8
5.78
0.
25
6.68
6.
23
(6.2
3)
24
0.13
20
13 E
xpor
ts
10.9
0
0.33
22
.18
7.
05
2.81
3.
89
17.0
3
24.6
8
16.8
9
2.97
8.
63
-
4.
26
77.1
8
10.7
6
14.6
3
5.40
-
7.23
4.
59
(4.5
9)
23
6.83
2012
Exp
orts
11.0
3
-
20
.78
6.
85
5.08
3.
75
18.1
2
23.1
1
19.9
5
3.41
8.
08
-
3.
89
77.4
1
10.9
2
14.4
0
5.57
0.
19
5.13
3.
45
(3.4
5)
23
7.67
2011
Exp
orts
12.5
9
-
19
.19
6.
84
6.42
3.
89
21.4
3
24.9
9
18.7
5
2.86
7.
90
-
3.
76
75.4
9
10.4
9
13.9
4
5.85
0.
33
6.65
2.
33
(2.3
3)
24
1.39
Tabl
e 3.
2: L
NG
Tra
de V
olum
es b
etw
een
Cou
ntrie
s, 2
015
(in M
TPA)
Not
e: In
done
sia,
Mal
aysi
a, a
nd th
e U
AE
cond
ucte
d do
mes
tic L
NG
trad
e in
201
2- 2
015.
The
se v
olum
es a
re n
ot in
clud
ed a
bove
as
they
do
not r
eflec
t int
erna
tiona
l tra
de b
etw
een
coun
tries
. Sou
rces
: IH
S, I
GU
12
IGU World Gas LNG Report — 2016 Edition

3.5. Spot, Medium and Long-Term Trade For a large part of the industry’s history, LNG was primarily traded under long-term, fixed destination contracts. In recent years, the proliferation of flexible-destination contracts and an emergence of portfolio players and traders has allowed for the growth of “non long-term” LNG trade, which was accelerated by shocks like those that resulted from the Fukushima crisis and the growth of shale gas in the United States.
Of all volumes traded without a long-term contract, the majority of growth has come from short-term trade, here defined as all volumes traded under agreements of less
than two years. In 2015, short-term trade reached 65.9 MT, or 26% of total gross traded LNG (including re-exports). Although price differentials between basins declined significantly in 2015, the emergence of several new importers, primarily dependent on spot imports, and the commissioning of three new liquefaction plants helped increase short-term trade by 4.1 MT over 2014.
Figure 3.11: Inter-Basin Trade, 2000 v. 2015 Figure 3.13: Non Long-Term Volumes, 1995-2015
Figure 3.12: Short, Medium and Long-Term Trade, 2010-2014
56.3
15.4
26.0
1.8
0.0
0.0
0.0
0.0
0.2
97.0
64.9
29.8
23.0
19.2
4.7
4.1
1.1
0.9
0 50 100
Intra-Pacific
Middle East-Pacific
Intra-Atlantic
Middle East-Atlantic
Atlantic-Pacific
Intra-Middle East
Atlantic-Middle East
Pacific-Middle East
Pacific-AtlanticMT
2000
2015
0%
5%
10%
15%
20%
25%
30%
35%
40%
0
10
20
30
40
50
60
70
80
1995 1999 2003 2007 2011 2015
% S
hare
MTP
A
Non Long-Term Trade
% of Total LNG Trade(right axis)
0%
5%
10%
15%
20%
25%
30%
0
50
100
150
200
250
300
2010 2011 2012 2013 2014 2015
MTP
A
Short-termMedium-termLong-term% Spot and Short-term (right)
Sources: IHS, IGU Sources: IHS, IGU
Sources: IHS, IGU
71.9 MTNon long-term trade
in 2015; 29% of total gross trade
3As defined in Section 8.4 “Non long-term” trade refers to all volumes traded under contracts of less than 5 years duration (spot/short-term + medium-term trade). To truly capture the size of the market, volumes are considered non long-term if at any point they were traded under anything other than a long-term contract (e.g., volumes procured from the spot market but delivered under a long-term portfolio contract would be considered spot).
Medium-term contracts (between 2 and <5 years) have also become a more prevalent part of the non long-term LNG trade, though they remain small compared to short-term volumes. Volumes delivered under medium-term contracts actually declined, from 9.7 MT in 2014 to 6.0 MT in 2015, as several contracts expired and others were filled increasingly with short-term volumes. Medium term contracts offer countries with uncertain future LNG needs, more security of supply for their minimum requirements than would be provided by short-term imports. They are favoured by buyers hesitant to sign long-term contracts because of the availability of uncontracted and flexible supply.
In total, all non long-term LNG trade reached 71.9 MT in 2015 (+0.4 MT YOY) and accounted for 29% of total gross LNG trade. The non long-term market grew rapidly over the past decade; in 2005, only 8% of volumes were traded outside of long-term contracts. This fast growth is the result of several key factors:
y The growth in LNG contracts with destination flexibility, which has facilitated diversions to higher priced markets.
y The increase in the number of exporters and importers, which has amplified the complexity of the industry and introduced new permutations and linkages between buyers and sellers. In 2015, 28 countries (including re-exporters) exported spot volumes to 29 end-markets. This compares to 6 spot exporters and 8 spot importers in 2000.
y The lack of domestic production or pipeline imports in Japan, South Korea and Taiwan, which has pushed these countries and others to rely on the spot market to cope with any sudden changes in demand like the Fukushima crisis.
y The decline in competitiveness of LNG relative to coal (chiefly in Europe) and shale gas (North America) that has freed up volumes to be re-directed elsewhere.
y The large disparity between prices in different basins from 2010 to 2014, which made arbitrage an important and lucrative monetisation strategy.
13
IGU World Gas LNG Report — 2016 Edition

y The faster development timeline and lower initial capital costs of FSRUs compared to onshore regasification, which allow new countries to enter the LNG market.
y The large growth in the LNG fleet, especially vessels ordered without a long-term charter, which has allowed low-cost inter-basin deliveries.
The start-up of new projects in Australia and Indonesia contributed meaningfully to the growth in non long-term trade in 2015, as the delivery of commissioning cargoes plus the prevalence of more flexible contracts allowed short- and medium-term trade to grow in both countries by over 3 MT YOY. The expiration of several contracts at older plants in Indonesia also contributed to its increase in short-term trade. The addition of reload capacity at several importers – India, Singapore and the UK – added a combined 0.7 MT of non long-term trade.
The outage at Yemen LNG was a major downside factor for the short-term market, but since over 55% of the plant’s exports in 2014 were delivered under long-term contract, this only pulled 2.3 MT off the short- and medium-term market. European re-exports also had a 2.3 MT decline as they responded strongly to the sharp decline in price differentials between basins; this was strongly influenced by Spain, which accounted for only 35% of all European re-exports in 2015, down from 62% in 2014.
Among import markets, by far the largest gain relative to 2014 came from new market Egypt, which imported its entire 2.8 MT via short-term contracts. Similarly, Pakistan also imported its entire 1.1 MT from the short-term market, while Jordan’s one long-term contract provided only 36% of its 1.9 MT total imports in 2015. Several countries in the Middle East and Asia Pacific took advantage of the loosening of the market and lower spot prices to increase their imports – the UAE, Singapore, Taiwan and Kuwait all had moderate YOY short-term gains of between 0.5 and 1.2 MT.
The biggest decline in non long-term imports came from Japan, as the start-up of new contracts plus lower overall LNG demand led it to pull back on short-term imports by 4.4 MT. The start-up of new contracts drove the second and third
Figure 3.14: Non Long-Term Cargo Market Development, 1995-2015
Figure 3.15: European Import Price Formation, 2005 to 2014
0
10
20
30
0
200
400
600
800
1,000
1,200
1,400
1995 1999 2003 2007 2011 2015
No.
of C
ount
ries
No.
of C
argo
es
No. of Non Long-Term Cargoes TradedNo. of Countries Importing Non Long-Term LNG (right axis)No. of Countries Exporting Non Long-Term LNG (right axis)
0%
20%
40%
60%
80%
100%
Oil Price Escalation Gas-on-Gas Competition
% S
hare
of p
rice
form
atio
n m
echa
nism
2005 2007 2009 2010 2012 2013 2014
Sources: IHS, IGU
Note: Oil Price Escalation = prices linked, usually through a base price and an escalation clause, to competing fuels, typically crude oil, gas oil and/or fuel oil. Gas-on-Gas Competition = prices determined by the interplay of supply and demand – gas-on-gas competition – that are traded at physical or notional hubs.Sources: IGU Wholesale Gas Price Survey - 2015 Edition
largest decrease in non long-term imports, in China (-1.9 MT) and Thailand (-0.8 MT), even though both countries had overall positive LNG growth in 2015. In contrast, despite a continued decline in LNG demand in South Korea, its short-term imports increased slightly (+0.2 MT) as several long-term contracts expired. In Latin America, weaker economic performance and hydropower recovery led to total import declines in Argentina and Brazil, which was reflected in their short-term imports (which fell by 0.5 MT and 0.7 MT, respectively) as both import exclusively from the non long-term market.
3.6. LNG Pricing Overview Although the average prices of various regional LNG markets remain driven by different dynamics, they began to converge in 2015 as multiple factors exerted downward pressure on prices around the globe. Gas prices in North America are largely set at liquid trading hubs, the largest and most important of which is Henry Hub in Louisiana. In Europe, wholesale gas is sold mainly via long-term contracts.
These contracts variously take into account gas hub-based or oil-linked pricing, and often both. In Asia and many emerging markets without established and liquid gas trading markets, the price of LNG is for the most part set via oil-linkages, supplemented by a smaller share of spot imports.
Following the events of the Fukushima disaster and the rise of global oil price benchmarks, oil-linked and spot prices rose rapidly, keeping arbitrage potentials between the Atlantic and Pacific basins high for most of 2011-2014. However, as oil prices fell in late 2014 and throughout 2015, traditionally oil-linked prices in Europe and Asia also declined. From an average of over $100/bbl in the first eight months of 2014, crude prices fell rapidly to below $50/bbl in January 2015. Given that most oil-indexed contracts have a three to six month time lag against the oil price, Asian term import prices remained relatively steady through the end of 2014, with Japanese imports holding at the $15/MMBtu level. However, by 2015 the impact of lower prices took effect; average Japanese import prices dropped more than $6/MMBtu throughout 2015, with December prices landing at $8.13/MMBtu.
14
IGU World Gas LNG Report — 2016 Edition

Offshore Platform in Qatar. Photo courtesty RASGAS
Additionally, the increased availability of LNG – particularly flexible Pacific LNG – in conjunction with stalled demand growth in China and demand loss in Japan began to draw down average Asian short-term prices as well. These two drivers helped to push short-term prices in Northeast Asia down to a low of $6.81/MMBtu in November, a level not seen since early 2010, after the global financial crisis. Lower oil prices, increased LNG supply, and lower demand growth will be key factors in shaping LNG prices.
The majority of Asian gas contracts are linked to oil prices at a multi-month lag. Over the past five years, Asian buyers have increasingly sought to diversify the pricing structures of their LNG portfolios, shifting away from the traditional fixed-destination, long-term, oil-linked LNG contract. Over the past five years, the sustained growth of shale gas production in North America has seen Henry Hub trade at a discount to other major gas benchmarks in the Pacific Basin and Europe, and as a result, Japanese, South Korean and Indian companies signed a number of offtake agreements based on Henry Hub pricing. However, a lower priced oil environment may alter the economic rationale driving buyers to secure US LNG contracts, and contracting activity from the US had already slowed in 2014 and 2015. While Henry Hub linked LNG contracts will continue to offer buyer’s portfolio diversification, the perception that these contracts will result in lower priced LNG relative to oil-linked contracts is less assured.
Since 2009, European gas contracts have increasingly been signed or renegotiated to include hub gas price indexation (particularly in the Northwest), dropping the historically dominant links to crude and fuel oil. Due to European Union energy policies and market dynamics, major gas suppliers have since increased the share of hub pricing in the formulation of pipeline export prices for certain contracts.
Similar to contracted Japanese LNG prices, the German border gas price – a proxy for contracted European gas import prices – began to reflect the fall in oil prices in 2015, averaging $6.80/MMBtu for the year. This is a continuation of the declining trend from 2014, though the two periods were driven by different factors; the multi-month lag built into oil-linked contracts meant that 2014’s fall from $10.7/MMBtu in January
Figure 3.16: Monthly Average Regional Gas Prices, 2009 - January 2016
0
5
10
15
20
Jan-09 Jan-10 Jan-11 Jan-12 Jan-13 Jan-14 Jan-15 Jan-16
$/m
mB
tu
US (Henry Hub) UK (NBP)German Border Price Japan (based on LNG)NE Asia Spot Price
Sources: IHS, Cedigaz, US DOE
to around $8/MMBtu at year-end represented not oil price weakness but the greater presence of European hub indexing.
As weakness in Pacific demand and new Pacific supply combined to move more Atlantic and Middle Eastern volumes into the United Kingdom, which has one of Europe’s most liquid trading hubs, the National Balancing Point (NBP), saw gas prices decline significantly in the second half of 2015. A normal 2014-15 winter left NBP averaging around $7/MMBtu in the first half of the year; meanwhile, the decline in Northeast Asian spot prices brought the average differential between the two to a low of just $0.37/MMBtu by June 2015. By December, NBP began to reflect the influx of new LNG supply, falling sharply to $5.14/MMBtu – a five-year low – and with Asian spot prices at $7.25/MMBtu, the basis differential ended the year at $2.11/MMBtu. Although higher than the summer low, this still represents a significant drop from differentials in 2014, which averaged $6.80/MMBtu during the year.
In North America, overall market fundamentals drive gas price movements much more than changes in the oil price. Although lower activity in oil and wet gas plays resulting from weaker oil prices is set to reduce the growth of associated gas production, the effect will be minimal relative to the size of US gas production. Further, reduced liquids activity has and will continue to reduce the costs of rigs, crews and equipment, which will benefit operators. Moreover, Henry Hub prices are expected to be primarily determined by gas supply and demand fundamentals such as improved pipeline access to growing Marcellus shale and Utica shale production and end-market fuel competition with coal or renewables in the power sector, all of which put downward pressure on prices. For the first time in over 15 years, Henry Hub prices averaged below $3.00/MMBtu in every month in 2015, with an annual average of $2.61/MMBtu. Lower oil prices may have decreased the spread between oil-linked and US LNG contracts in the near-term, but the lower starting point of US prices and abundant downside market fundamentals risks mean that US LNG contracts may offer buyers reduced price volatility over the next few years.
15
IGU World Gas LNG Report — 2016 Edition

Looking AheadConsiderable new LNG supplies will enter the market in 2016 and beyond. The supply growth from new plants that already happened in 2015 will be amplified by additional production capacity commissioned in 2016-2018. Supply growth will mainly come from the Pacific Basin in 2016 and early 2017, filling Pacific markets with intra-basin supply and reducing arbitrage potential for Atlantic and Middle-East suppliers, particularly re-export markets. However, starting in mid-2017 and beyond, the ramp-up of currently under-construction US capacity will start to balance out the new Pacific push with more flexible Atlantic supply.
How much of an impact will economic weakness have on LNG demand in 2016? Going into 2015, China was set to be the main driver of LNG demand based on its contracted ramp-up, but weak economic performance left it with very limited demand growth. Contract ramp-ups are expected to increase in 2016, but sustained economic uncertainty could dampen the country’s ability to absorb
these new supplies. Similarly, 2014 may have been a near-term peak year for LNG demand in Latin America, as Brazil has recession risk in 2016. In addition to these macroeconomic factors, financial difficulties and related payment risks in emerging markets may mute demand growth in some of the bigger new entrants in 2015.
Will low LNG prices usher in another set of new LNG importing countries? After adding four new importers in 2015, the expansion of the LNG market is set to slow in 2016. Only one new large-scale market – the Philippines – currently expects to complete construction of new LNG import infrastructure. Low prices helped to bring 2015’s new markets like Egypt and Pakistan online mostly according to schedule. If global demand proves to be weaker than expected, placing further downward pressure on prices, other proposed markets may accelerate their plans to add import capacity, potentially providing an unexpected outlet for new flexible LNG supply.
Artistic rendition of LNG Bunkering Ship. Courtesy ENGIE.
16
IGU World Gas LNG Report — 2016 Edition

LNG T5 – are located on the US Gulf Coast, with the fourth being Cameroon FLNG in West Africa.
With 53.8 MTPA under construction, Australia is likely to become the largest LNG exporter by the end of the decade. Growth in the US, where 62 MTPA is under construction, will follow a few years behind Australia.
The number of proposed liquefaction projects has increased significantly over the last several years and now totals 890 MTPA. The vast majority of this capacity (75%) has been proposed in the US and Canada.
However, many of these projects face considerable hurdles and have made limited commercial progress, with only 36% of proposed capacity at or beyond the pre-front end engineering and design (FEED) stage.
Outside the US and Canada, significant liquefaction capacity has also been proposed in Australia, East Africa, and Russia. Timelines for many of these projects – especially those with higher costs – have been pushed back due to market oversupply, weaker demand growth in key import markets, and decreased capital budgets owing to lower oil prices.
Feedstock availability and security concerns impacted several projects in 2015. Both liquefaction projects in Egypt, Egyptian LNG (ELNG) and Damietta LNG, remained offline due to limited feedgas production. Egypt became an LNG importer in 2015 and is not expected to resume exports in the near term. In Yemen, LNG production was halted in early 2015 and remains offline as of January 2016 as a result of political instability.
4.2. Global Liquefaction Capacity and UtilisationIn 2015, global liquefaction capacity utilisation averaged 84%2. Utilisation has remained relatively consistent over the last several years, averaging 86% since 2010.
Slightly lower rates in 2014 and 2015 were driven by three main factors. Egypt reduced exports in 2014, stopping LNG production fully in 2015, to meet growing domestic demand.
4.1. OverviewAs of January 2016, global nominal liquefaction capacity totalled 301.5 MTPA, an increase from 291 MTPA at end-2014. In 2015, two new projects began commercial operations: the 8.5 MTPA QCLNG project in Australia
and the 2 MTPA Donggi-Senoro plant in Indonesia. GLNG in Australia also sent out commissioning cargoes in 2015, with commercial operations beginning in 2016.
The pace of the capacity ramp-up that began in 2015 will accelerate in 2016 as a series of under-construction projects in Australia and the first of the US projects begin operations. Based on announced start dates, 41.5 MTPA of nominal capacity is expected to come online in 2016 in the US, Australia and Malaysia. Under-construction LNG capacity stood at 141.5 MTPA as of January 2016, with four projects (20.3 MTPA of capacity) reaching FID in 2015. Three – Freeport LNG T3, Corpus Christi LNG T1-2, and Sabine Pass
4. Liquefaction PlantsMarking the beginning of a wave of new supply expected online over the next several years, global nominal liquefaction capacity increased by approximately 10.5 MTPA in 2015. As of January 2016, 141.5 MTPA of projects were under construction, primarily in the United States and Australia. Though Qatar remained the largest liquefaction capacity holder as of January 2016, Australia is expected to become the largest source of capacity by 2018.
The majority of new LNG proposals stem from North America, where 670 MTPA of capacity has been announced in the US and Canada, excluding 62 MTPA of projects
already under construction in the United States. Many proposals in North America as well as globally, particularly high-cost greenfield developments, will face significant challenges in reaching FID in the medium-term due to impending market oversupply and the slower pace of contracting activity. As a result, the actual capacity buildout will likely be significantly lower than announced, though some lower-cost projects, such as brownfield expansions or small-scale floating liquefaction projects, may be able to secure buyers and move forward in 2016. Nevertheless, the LNG business is long term in nature and there will be demand growth in the future due to market rebalancing.
301.5 MTPA Global nominal
liquefaction capacity, January 2016
141.5 MTPA Global liquefaction capacity
under construction, January 2016
1Nominal liquefaction capacity refers to projects’ nameplate capacities and is not prorated based on project start dates.2Includes exports within Indonesia, as well as offline capacity in Angola, Egypt, and Yemen. If offline capacity is excluded, average 2015 utilisation is 92%.
Note: “FID” does not include the 10.8 MTPA stated to be under construction in Iran, nor is the project included in totals elsewhere in the report. Sources: IHS, Company Announcements
0
100
200
300
400
500
600
700
Afric
a
Asia
Paci
fic
Euro
pe
FSU
Latin
Amer
ica
Mid
dle
East
Nor
thAm
eric
a
MTP
A
Existing FID Pre-FID
Figure 4.1: Nominal Liquefaction Capacity by Status and Region, as of January 2016
17
IGU World Gas LNG Report — 2016 Edition

Australia retained its position as the second-largest LNG capacity holder in 2015, behind only Qatar, and will be a major source of incremental supply growth over the next two years. Six projects are under construction in the country and all are expected online by 2018.
With five projects (62 MTPA) under construction on the US Gulf of Mexico and East Coast, the United States will be the predominant source of new liquefaction capacity over the next five years5. Through 2016, the US only exported small volumes from the Kenai LNG project in Alaska. This will change soon as Sabine Pass T1 produced it’s commissioning cargo in February 2016. Three of the under-construction projects, both expansions and new-builds, were sanctioned in 2015, and all are expected online by 2019. Apart from Corpus Christi LNG, the under-construction projects are brownfield developments associated with existing regasification terminals.
In Russia, Yamal LNG has been under construction since late 2013. The first train is announced to come online in 2017, with all trains scheduled to be operational by 2019. The project is challenged by the difficult Arctic environment as well as possible financing issues related to sanctions against Russia, which may cause delays. However, once completed, it will bring Russia’s total liquefaction capacity to 26.1 MTPA6.
ProposedOver the last several years, proposed liquefaction capacity has expanded significantly and totalled 890 MTPA by January 2016. Proposal activity slowed considerably in 2015 as a result of market oversupply and demand uncertainty in key import markets.
North America accounts for the bulk of this proposed capacity, where more than 60 liquefaction projects or expansion trains have been announced totalling nearly 680 MTPA7. Despite aggressive development timelines put forward by project sponsors, the actual capacity buildout will likely be significantly
No timeline has been established for the resumption of Egyptian exports. A force majeure at Yemen LNG owing to increased political violence forced the stoppage of exports in mid-2015. The project remained offline as of January 2016. In Angola, the 5.2 MTPA project experienced a series of technical difficulties and produced only a few cargoes in 2014 before being taken offline for repairs. The project did not export cargoes in 2015 but is expected to resume exports in 2016.
These losses were offset by significant production growth and high utilisation from new projects in Australia (+6.1 MTPA) and Papua New Guinea (+3.5 MTPA) as well as continued strong output from legacy producers Qatar, Malaysia, Russia, and Nigeria, all of which operated at or near full capacity in 2015.
4.3. Liquefaction Capacity by CountryExistingNineteen3 countries held LNG export capacity as of January 2016. No countries became new exporters in 2015. Papua New Guinea, the newest exporter, joined the list in 2014. Sixty percent of the world’s nominal liquefaction capacity is held in just five countries: Qatar, Indonesia, Australia, Malaysia, and Nigeria. Qatar alone holds 25% of the total capacity. While aging trains in Algeria have been taken offline over the past few years, the country recently added new replacement trains to offset the decline in capacity.
Under ConstructionAs of January 2016, 141.5 MTPA of liquefaction capacity was under construction. The majority of this capacity is being constructed in the US (62 MTPA) and Australia (53.8 MTPA). Additional
projects are under construction in Russia (16.5 MTPA), Malaysia (6.3 MTPA), Indonesia (0.5 MTPA), and Cameroon (2.4 MTPA)4.
Sources: IHS, Public Announcements Sources: IHS, Company Announcements
0%
10%
20%
30%
40%
50%
60%
70%
80%
90%
100%
0
50
100
150
200
250
300
350
400
450
1990 1995 2000 2005 2010 2015 2020
MTP
A
Global Liquefaction Capacity% of Capacity Utilised (right axis)
Fore
cast
0
7
14
21
28
35
0
1
2
3
4
5
1964
-197
0
1971
-197
5
1976
-198
0
1981
-198
5
1986
-199
0
1991
-199
5
1996
-200
0
2001
-200
5
2006
-201
0
2011
-201
5
2016
-202
1
No.
of T
rain
s
MTP
A
Average Gross Capacity of Trains Commissioned, MTPANo. of New Trains Commissioned (right axis)
Fore
cast
Figure 4.2: Global Liquefaction Capacity Build-Out, 1990-2021 Figure 4.3: Number of Trains Commissioned vs. Average Train Capacity, 1964-2021
+46% by 2021 Expected growth in global liquefaction
capacity
3Includes Angola and Egypt, which did not export cargoes in 2015.4See Appendix II for a detailed list of under-construction liquefaction projects.5Excludes proposed liquefaction capacity with announced start dates prior to 2021 that has not been sanctioned as of January 2016.6Excludes proposed liquefaction capacity with announced start dates prior to 2021 that has not been sanctioned as of January 2016.7 See Tables 4.3 through 4.7 for a breakdown of proposed projects in North America, including the US Lower 48 (4.3), Alaska (4.4), Western Canada (4.5), Eastern Canada (4.6), and Mexico (4.7).
18
IGU World Gas LNG Report — 2016 Edition

Sources: IHS, Company Announcements
0%
20%
40%
60%
80%
100%
120%
0102030405060708090
100A
lger
ia
Ang
ola
Cam
eroo
n
Egyp
t
Eq. G
uine
a
Nig
eria
Aus
tralia
Bru
nei
Indo
nesi
a
Mal
aysi
a
PN
G
Nor
way
Rus
sia
Peru
Trin
idad US
Om
an
Qat
ar
UA
E
Yem
en
MTP
A
2015 2021 Utilisation, 2015 (right axis)
Asia Pacific Americas
Europe and FSU
Middle East
Africa
Figure 4.4: Nominal Liquefaction Capacity by Country in 2015 and 2021
lower than expected as only a limited number of projects have made meaningful commercial progress.
Most of the 330 MTPA of proposed capacity in the US is located on the Gulf of Mexico coast and will face significant competition for a limited number of offtakers in an oversupplied market.
Most of the proposed 340 MTPA of capacity in Canada is planned for British Columbia on the country’s West coast. Though several of these projects have large LNG buyers as equity partners, their interest in securing large volumes in a weak market environment may wane. Furthermore, many of these projects, unlike those in the US, require large upstream and pipeline investments, adding to project costs.
Several projects have also been proposed in eastern Canada and Mexico. Apart from market supply and demand dynamics,
these projects face feedstock availability challenges. In the case of Canada, they will likely require pipeline reversal and capacity expansion in order to proceed. In Mexico, surging gas demand has prompted an increased reliance on US pipeline (and, to a lesser extent, LNG) imports as domestic production declines. As a result, the country’s two proposed liquefaction projects (7 MTPA) are longer-term opportunities.
The discovery of large gas reserves offshore East Africa has resulted in multiple liquefaction proposals in Mozambique (44 MTPA) and Tanzania (20 MTPA). Due to additional clarity in 2015 on field development plans and commercial momentum, some East African projects could begin operations in the first half of the next decade. However, project risks in both countries include evolving domestic demand requirements, a lack of infrastructure, and regulatory uncertainty.
Kenai plant. Photo courtesy ConocoPhillips.
19
IGU World Gas LNG Report — 2016 Edition
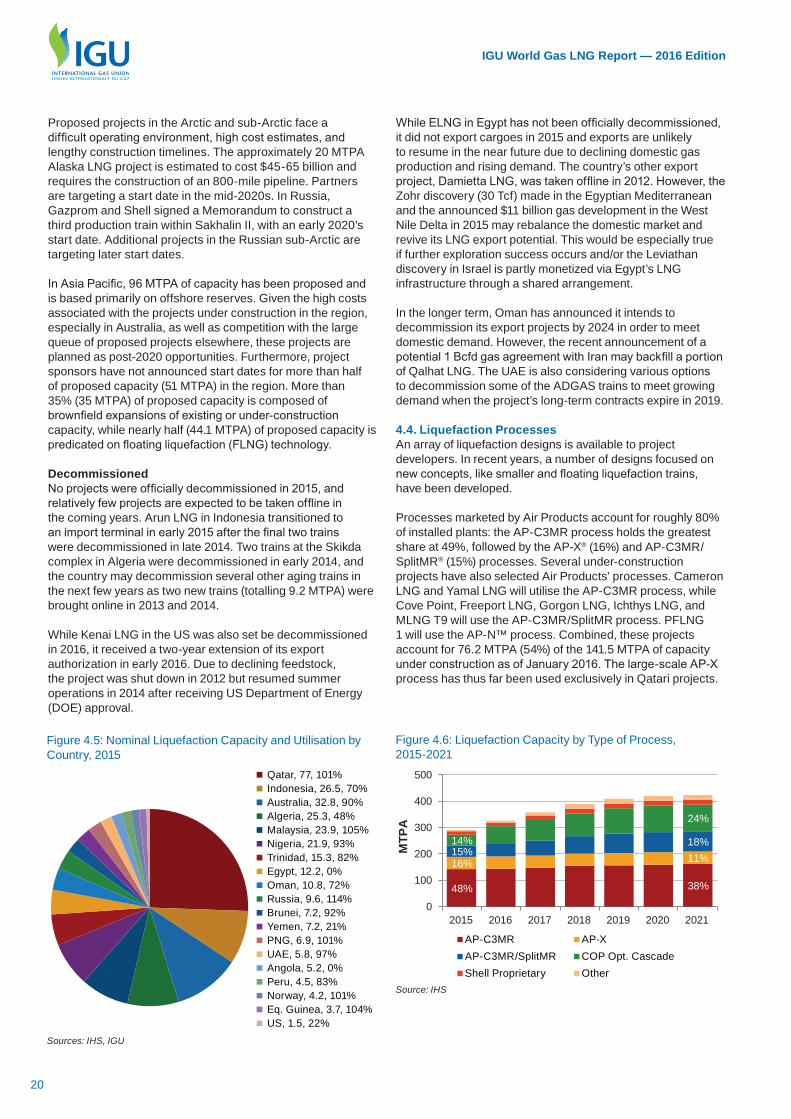
Proposed projects in the Arctic and sub-Arctic face a difficult operating environment, high cost estimates, and lengthy construction timelines. The approximately 20 MTPA Alaska LNG project is estimated to cost $45-65 billion and requires the construction of an 800-mile pipeline. Partners are targeting a start date in the mid-2020s. In Russia, Gazprom and Shell signed a Memorandum to construct a third production train within Sakhalin II, with an early 2020’s start date. Additional projects in the Russian sub-Arctic are targeting later start dates.
In Asia Pacific, 96 MTPA of capacity has been proposed and is based primarily on offshore reserves. Given the high costs associated with the projects under construction in the region, especially in Australia, as well as competition with the large queue of proposed projects elsewhere, these projects are planned as post-2020 opportunities. Furthermore, project sponsors have not announced start dates for more than half of proposed capacity (51 MTPA) in the region. More than 35% (35 MTPA) of proposed capacity is composed of brownfield expansions of existing or under-construction capacity, while nearly half (44.1 MTPA) of proposed capacity is predicated on floating liquefaction (FLNG) technology.
DecommissionedNo projects were officially decommissioned in 2015, and relatively few projects are expected to be taken offline in the coming years. Arun LNG in Indonesia transitioned to an import terminal in early 2015 after the final two trains were decommissioned in late 2014. Two trains at the Skikda complex in Algeria were decommissioned in early 2014, and the country may decommission several other aging trains in the next few years as two new trains (totalling 9.2 MTPA) were brought online in 2013 and 2014.
While Kenai LNG in the US was also set be decommissioned in 2016, it received a two-year extension of its export authorization in early 2016. Due to declining feedstock, the project was shut down in 2012 but resumed summer operations in 2014 after receiving US Department of Energy (DOE) approval.
While ELNG in Egypt has not been officially decommissioned, it did not export cargoes in 2015 and exports are unlikely to resume in the near future due to declining domestic gas production and rising demand. The country’s other export project, Damietta LNG, was taken offline in 2012. However, the Zohr discovery (30 Tcf) made in the Egyptian Mediterranean and the announced $11 billion gas development in the West Nile Delta in 2015 may rebalance the domestic market and revive its LNG export potential. This would be especially true if further exploration success occurs and/or the Leviathan discovery in Israel is partly monetized via Egypt’s LNG infrastructure through a shared arrangement.
In the longer term, Oman has announced it intends to decommission its export projects by 2024 in order to meet domestic demand. However, the recent announcement of a potential 1 Bcfd gas agreement with Iran may backfill a portion of Qalhat LNG. The UAE is also considering various options to decommission some of the ADGAS trains to meet growing demand when the project’s long-term contracts expire in 2019.
4.4. Liquefaction ProcessesAn array of liquefaction designs is available to project developers. In recent years, a number of designs focused on new concepts, like smaller and floating liquefaction trains, have been developed.
Processes marketed by Air Products account for roughly 80% of installed plants: the AP-C3MR process holds the greatest share at 49%, followed by the AP-X® (16%) and AP-C3MR/SplitMR® (15%) processes. Several under-construction projects have also selected Air Products’ processes. Cameron LNG and Yamal LNG will utilise the AP-C3MR process, while Cove Point, Freeport LNG, Gorgon LNG, Ichthys LNG, and MLNG T9 will use the AP-C3MR/SplitMR process. PFLNG 1 will use the AP-N™ process. Combined, these projects account for 76.2 MTPA (54%) of the 141.5 MTPA of capacity under construction as of January 2016. The large-scale AP-X process has thus far been used exclusively in Qatari projects.
Source: IHS
0
100
200
300
400
500
2015 2016 2017 2018 2019 2020 2021
MTP
A
48% 38%
16% 11%15%18%14%
24%
AP-C3MR AP-XAP-C3MR/SplitMR COP Opt. CascadeShell Proprietary Other
Figure 4.6: Liquefaction Capacity by Type of Process, 2015-2021
Sources: IHS, IGU
Qatar, 77, 101%Indonesia, 26.5, 70%Australia, 32.8, 90%Algeria, 25.3, 48%Malaysia, 23.9, 105%Nigeria, 21.9, 93%Trinidad, 15.3, 82%Egypt, 12.2, 0%Oman, 10.8, 72%Russia, 9.6, 114%Brunei, 7.2, 92%Yemen, 7.2, 21%PNG, 6.9, 101%UAE, 5.8, 97%Angola, 5.2, 0%Peru, 4.5, 83%Norway, 4.2, 101%Eq. Guinea, 3.7, 104%US, 1.5, 22%
Figure 4.5: Nominal Liquefaction Capacity and Utilisation by Country, 2015
20
IGU World Gas LNG Report — 2016 Edition
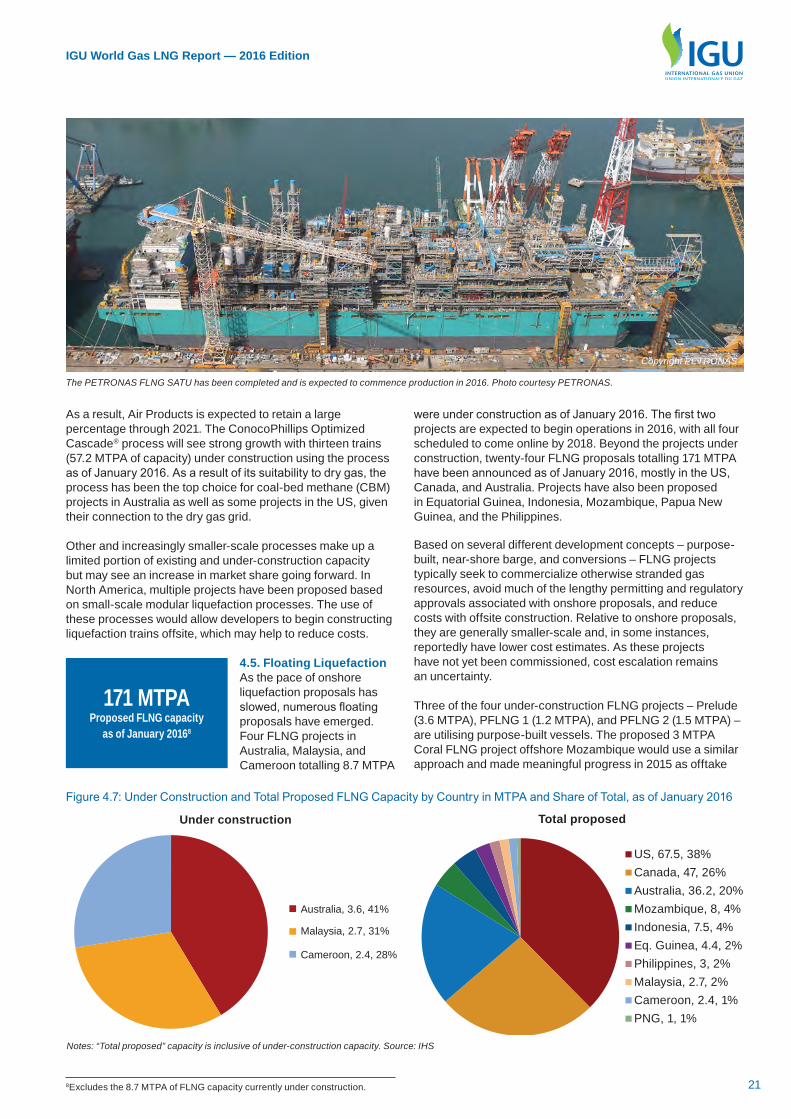
were under construction as of January 2016. The first two projects are expected to begin operations in 2016, with all four scheduled to come online by 2018. Beyond the projects under construction, twenty-four FLNG proposals totalling 171 MTPA have been announced as of January 2016, mostly in the US, Canada, and Australia. Projects have also been proposed in Equatorial Guinea, Indonesia, Mozambique, Papua New Guinea, and the Philippines.
Based on several different development concepts – purpose-built, near-shore barge, and conversions – FLNG projects typically seek to commercialize otherwise stranded gas resources, avoid much of the lengthy permitting and regulatory approvals associated with onshore proposals, and reduce costs with offsite construction. Relative to onshore proposals, they are generally smaller-scale and, in some instances, reportedly have lower cost estimates. As these projects have not yet been commissioned, cost escalation remains an uncertainty.
Three of the four under-construction FLNG projects – Prelude (3.6 MTPA), PFLNG 1 (1.2 MTPA), and PFLNG 2 (1.5 MTPA) – are utilising purpose-built vessels. The proposed 3 MTPA Coral FLNG project offshore Mozambique would use a similar approach and made meaningful progress in 2015 as offtake
As a result, Air Products is expected to retain a large percentage through 2021. The ConocoPhillips Optimized Cascade® process will see strong growth with thirteen trains (57.2 MTPA of capacity) under construction using the process as of January 2016. As a result of its suitability to dry gas, the process has been the top choice for coal-bed methane (CBM) projects in Australia as well as some projects in the US, given their connection to the dry gas grid.
Other and increasingly smaller-scale processes make up a limited portion of existing and under-construction capacity but may see an increase in market share going forward. In North America, multiple projects have been proposed based on small-scale modular liquefaction processes. The use of these processes would allow developers to begin constructing liquefaction trains offsite, which may help to reduce costs.
4.5. Floating LiquefactionAs the pace of onshore liquefaction proposals has slowed, numerous floating proposals have emerged. Four FLNG projects in Australia, Malaysia, and Cameroon totalling 8.7 MTPA
171 MTPA Proposed FLNG capacity
as of January 20168
8Excludes the 8.7 MTPA of FLNG capacity currently under construction.
The PETRONAS FLNG SATU has been completed and is expected to commence production in 2016. Photo courtesy PETRONAS.
Notes: “Total proposed” capacity is inclusive of under-construction capacity. Source: IHS
Under construction
Australia, 3.6, 41%
Malaysia, 2.7, 31%
Cameroon, 2.4, 28%
Total proposed
US, 67.5, 38%Canada, 47, 26%Australia, 36.2, 20%Mozambique, 8, 4%Indonesia, 7.5, 4%Eq. Guinea, 4.4, 2%Philippines, 3, 2%Malaysia, 2.7, 2%Cameroon, 2.4, 1%PNG, 1, 1%
Figure 4.7: Under Construction and Total Proposed FLNG Capacity by Country in MTPA and Share of Total, as of January 2016
Copyright PETRONAS
21
IGU World Gas LNG Report — 2016 Edition

Note: Further information on each of these plants can be found in Appendix I, identified by reference number in parenthesis. Source: IHS
Figure 4.8: Global Liquefaction Plants, 2015
© 2
016
IHS
IGU
Wor
ld L
NG
Rep
ort /
201
6
Glo
bal l
ique
fact
ion
proj
ects
Ken
ai
LNG
* (1)
Peru
LN
G
(20)
Atla
ntic
LN
G
(11)
Snøh
vit
LNG
(16)
Arze
w/S
kikd
a (5
)
ELN
G/D
amie
tta
LNG
* (13
)
Nig
eria
LN
G
(10)
Eq
uato
rial
Gui
nea
LNG
(1
5) An
gola
LN
G
(22)
Qat
arga
s/R
asG
as
(9)
ADG
AS
(4)
Om
an L
NG
(1
2)
Yem
en L
NG
* (1
9)
Plut
o LN
G
(21)
Dar
win
LN
G
(14)
Nor
th W
est
Shel
f LN
G (8
)
Sakh
alin
2
LNG
(18)
Bru
nei L
NG
(3)
Mal
aysi
a LN
G (7
)
Bon
tang
LN
G
(6)
Tang
guh
LNG
(17)
Figu
re 4
.8: G
loba
l Liq
uefa
ctio
n Pl
ants
, 201
5 S
ourc
e: IH
S
Mar
sa E
l Bre
ga
LNG
* (2)
PNG
LN
G
(23)
QC
LNG
(2
5)
Don
ggi-S
enor
o LN
G (2
6)
22
IGU World Gas LNG Report — 2016 Edition

discussions reached an advanced stage. The developer is seeking to sanction the project in 2016 and have the purpose-built vessel online by 2020.
Smaller-scale FLNG projects based on vessel conversions gained particular momentum in 2015 due to their reportedly lower cost, shorter development timelines, and ability to commercialize a wide range of smaller resources. The most recent project, floating or otherwise, to take FID in 2015 was Cameroon FLNG, a 2.4 MTPA FLNG conversion design that was first proposed in mid-2014. The Fortuna FLNG project in Equatorial Guinea, also based on a vessel conversion, is being developed in a similar manner. The project developer aims to reach FID in 2016 and expects the project online in mid-2019.
Near-shore barge-based FLNG developments generally seek to commercialize onshore reserves while minimizing onshore infrastructure. Being permanently moored without navigation ability reduces project complexity and thus potentially reduces costs, though, like other floating development designs, the potential for cost overruns exists.
The 0.5 MTPA Caribbean FLNG project offshore Colombia was originally slated to be the first floating project online in mid-2015, though in early 2015 project developers announced delays due to the low oil price environment. Developers are reportedly working to place the vessel elsewhere for liquefaction work.
Though several FLNG projects are in advanced discussions with offtakers, only two under-construction projects have announced binding agreements so far. Given estimated construction timelines and weak market fundamentals, a significant buildout beyond the four FLNG projects under construction is unlikely before 2020. That said, despite an increasingly oversupplied LNG market, floating projects have
a smaller parcel size, and may find it easier to secure offtakers and reach FID in 2016, than large land-based projects.
4.6. Project Capital Expenditures (CAPEX)9 With market oversupply likely to increase in 2016 and oil prices expected to remain weak in the near term, cost will be a major factor in determining which proposed LNG projects are ultimately sanctioned.
Liquefaction projects have faced considerable cost escalation since 2000, with several projects reporting cost overruns in the range of 30-50%. Unit costs10 for liquefaction plants increased from an average of $379/tonne in the 2000-2007 period to $807/tonne from 2008-2015. Between the same time periods, greenfield projects have increased from $495/tonne to $1,162/tonne, while brownfield projects have only increased to $502/tonne, up from $297/tonne, due to the advantage of existing infrastructure.
Plant costs vary widely and depend on location, capacity, liquefaction process (including choice of compressor driver), the number of storage tanks, access to skilled labour, and regulatory and permitting costs. Large amounts of steel, cement, and other bulk materials are required. Investment in gas processing varies depending on the composition of the upstream resource. Gas treatment includes acid gas, natural gas liquids (NGL), and mercury removal; and dehydration. Figures 4.9 and 4.12 include additional information on average liquefaction project costs by construction component and expense category.
Higher input and labour costs became common over the last decade due to global competition for engineering, procurement and construction (EPC) services as many projects began construction simultaneously. Cost escalation has been pervasive in both the Atlantic and Pacific Basins, but
9 CAPEX figures reflect the complete cost of building the liquefaction facilities, including site preparation, gas processing, liquefaction, LNG storage, and other related infrastructure costs. Upstream and financial costs are excluded.
10All unit costs are in real 2014 dollars.
2014-2015 Liquefaction in Review
Capacity Additions
+10.5 MTPAYear-over-year growth of global
liquefaction capacity in 2015
New LNG Exporters
1Number of new LNG exporters
since 2014
US Build-out Begins
5US projects sanctioned
since 2014
Floating Liquefaction
8.7 MTPAFLNG capacity under construction
as of January 2016
Global liquefaction capacity increased from 291 MTPA in 2014 to 301.5 MTPA in 2015
141.5 MTPA was under construction as of January 2016
890 MTPA of new liquefaction projects have been proposed as of January 2016, primarily in North America
PNG joined the list of countries with LNG export capacity in 2014
A number of project proposals in emerging regions such as Canada and Sub-Saharan Africa could lead to the emergence of several new exporters in coming years
Previously expected to be one of the largest LNG importers, 62 MTPA of export capacity was under construction in the US as of January 2016
Several additional US projects made regulatory and commercial progress. In total, 332 MTPA of capacity is proposed in the US, excluding under-construction projects
Since 2014, 69 MTPA of floating liquefaction capacity has been proposed. Four projects have been sanctioned, totalling 8.7 MTPA
Many proposals announced in the past few years aim to market gas from smaller, stranded offshore fields
23
IGU World Gas LNG Report — 2016 Edition

Australia has been particularly affected due to exchange rate fluctuations and skilled labour shortages.
Several completed or sanctioned projects over the last few years have been located in difficult operating environments and are associated with complex upstream resources, including CBM in Eastern Australia, deepwater fields in Asia Pacific, and Arctic environments in Norway and Russia. The complexity has resulted in considerable delays, which have further driven up costs.
However, costs may begin to stabilize going forward due to significant technological advancements that have reduced upstream costs by improving well productivity. Steel costs have fallen dramatically over the last several years and may reduce overall capital expenditure requirements. EPC costs may also face downward pressure if the pace of FIDs slows over the next several years.
The average unit cost for Atlantic Basin LNG projects increased to $1,292/tonne from 2008-2015, compared to $441/tonne from 2000-2007. Projects in Asia Pacific fared only marginally better, with costs increasing from
$293/tonne to $1,011/tonne between the same periods. Comparatively, Middle Eastern projects averaged $456/tonne from 2008-2015, largely due to the lower cost of brownfield expansions in Qatar and Oman.
Based on announced costs, greenfield projects will remain at a significant cost premium to brownfield projects. Greenfield projects expected to come online from 2016-2021 have an average unit cost of $1,611/tonne.
Brownfield developments offer much more favourable project economics. Notably, four of the five liquefaction projects under construction in the US are brownfield projects associated with existing regasification terminals. Unit costs for these brownfield projects average $862/tonne, well below the $1,569/tonne associated with under-construction greenfield projects globally.
Most US projects will source dry gas, which will reduce costs by limiting the need for gas treatment infrastructure. In addition, US projects may be less exposed to cost escalation because most EPC contracts associated with the projects were signed on a lump-sum turnkey basis as opposed to the cost-plus contracts used for some global projects.
Numerous greenfield proposals that have not yet been sanctioned have high project costs with economics that are challenged by low oil prices. For most greenfield projects to move forward, developers will need to secure long-term contracts to underpin project financing. Low oil prices and weaker demand growth in major import markets make this task a more difficult undertaking. As a result, high costs are expected to be a major source of delay for future projects.
Apart from high liquefaction costs, greenfield projects proposed in Western Canada and Alaska require lengthy (300 miles or more) pipeline infrastructure. Fully integrated Western Canadian projects have announced cost estimates of up to $40 billion, while in Alaska the estimate ranges from $45-65 billion.
4.7. Risks to Project DevelopmentAlthough liquefaction projects face a variety of risks common with other types of large infrastructure projects, low oil prices and challenging LNG market fundamentals have exacerbated
Sources: IHS, Company Announcements
0
200
400
600
800
1,000
1,200
1,400
1,600
1,800
2000-2007 2008-2015 2016-2021
$/to
nne
Greenfield Brownfield Floating
Figure 4.10: Average Liquefaction Unit Costs in $/tonne (real 2014) by Project Type, 2000-2021
Sources: IHS, Company Announcements
0
500
1,000
1,500
2,000
2,500
3,000
Bro
wnf
ield
Gre
enfie
ld
Floa
ting
Bro
wnf
ield
Gre
enfie
ld
Floa
ting
Bro
wnf
ield
Gre
enfie
ld
Pacific Atlantic-Mediterranean Middle East
$/to
nne
2000-20072008-20152016-2021
Figure 4.11: Average Liquefaction Unit Costs in $/tonne (real 2014) by Basin and Project Type, 2000-2021
$1,611/tonne Weighted average expected cost
for greenfield projects announced to come online
between 2016 and 2021
Source: Oxford Institute for Energy Studies
10%
8%
30%
20%
32%
Owner's Costs
Engineering
Equipment
Bulk Materials
Construction
Figure 4.9: Average Cost Breakdown of Liquefaction Project by Construction Component
24
IGU World Gas LNG Report — 2016 Edition

several of these risk factors, especially project economics and contracting. Timelines for a number of projects, particularly those with high cost estimates and no buyers, have been pushed back by several years. Several projects face such high risks that they are likely to be delayed or cancelled.
Major liquefaction project risks include project economics, politics and geopolitics, environmental regulation, partner priorities and partners’ ability to execute, business cycles, domestic gas needs and fuel competition, feedstock availability, and marketing and contracting challenges.
Project EconomicsAs noted in Section 4.6, high cost estimates have been a leading obstacle to project development, particularly as the LNG market has become increasingly oversupplied and oil prices remain low. Adding to this is the risk associated with uncertain fiscal and regulatory regimes, especially in emerging liquefaction regions.
Politics, Geopolitics, and Environmental Regulation The permitting and regulatory approval processes, even in developed markets such as the US, can be time consuming and costly. Gaining full regulatory approval remains a critical challenge for many proposed projects. Even for US brownfield developments, environmental permitting is likely to continue to take nearly two years or more. However, with several projects having now moved through the process, greater certainty has emerged on expected timelines and costs.
Canada’s environmental approval process is well established but still takes nearly two years to complete. Only a few projects have been approved; the majority of proposals have not yet begun the process. Furthermore, project developers in Canada need to secure approvals from First Nations groups impacted by the project, including those along associated pipeline routes, which can prove difficult as an agreement must be negotiated with each group separately. The British Columbia government has been persistent in its support for LNG development. It provided clarity on taxation in 2014 and 2015 via a new LNG export-specific tax and royalty regime, which was previously a major uncertainty. Similarly,
Source: Oxford Institute for Energy Studies
7%3%
28%
14%20%
27%
1%
Gas Treatment
Fractionation
Liquefaction
Refrigeration
Utilities
Offsites (storage, etc)
Site Preparation
Figure 4.12: Average Cost Breakdown of Liquefaction Project by Expense Category
Wheatstone. Photo courtesy Chevron
25
IGU World Gas LNG Report — 2016 Edition

in Sub-Saharan Africa, both the Mozambican and Tanzanian governments support the development of liquefaction projects and have actively worked to establish new gas-specific legislation in 2015, though this has been a lengthy process, particularly in Tanzania.
Persistent political volatility can pose a serious risk to project development, and it can continue to impact steady operations after construction has completed. Political instability has hampered existing projects, such as in Yemen, and has delayed the development of additional liquefaction capacity in Nigeria and several other countries.
Iran’s LNG sector has been hampered by the imposition of US and European Union (EU) sanctions. The country has not been able to do business with most firms operating in the LNG industry, nor has it been able to access US liquefaction processes, which maintain a majority of market share. Although many nuclear-related sanctions were lifted in January 2016, there is a possibility that sanctions could be reintroduced depending on political developments, and most non-nuclear sanctions remain in place. These uncertainties may impact the development of Iran’s several proposed large-scale liquefaction projects that were previously abandoned due to the imposition of sanctions.
Partner Priorities, Ability to Execute, and Business CyclesDivergent priorities among project partners, even in established liquefaction regions, have resulted in project delays, especially for large-scale projects. Not all partners are equally committed to a project. Smaller companies may be unable or unwilling to commit to investments on that scale, while larger players are frequently in the position of high-grading opportunities in their respective portfolios.
Though project proposals slowed in 2015, the number of projects under consideration has nonetheless increased considerably over the past several years. However, many are being developed by project sponsors with no experience in liquefaction, particularly in North America. This is an emerging theme as new players enter the LNG business. Developers must have the technical, operational, and logistical capabilities to execute a project. Concerns over a company’s ability to execute on any component of an LNG project will also make it more difficult for that company to secure sufficient project financing.
Even for experienced developers, their ability or willingness to sanction a liquefaction project may be impacted by overarching business cycles. Low oil prices have caused many companies to reduce capital spending, resulting in numerous project
Table 4.1: Liquefaction Project Development Risks
Risk Factors Impact on LNG Project DevelopmentProject Economics High project costs require developers to sign long-term sales contracts that will allow for a
sufficient return. Cost overruns and changing market prices can have a large impact on when or if a project is sanctioned.
Politics & Geopolitics Permitting may be time consuming. Federal or local governments may not be supportive of exports and could levy additional taxes on LNG projects or establish stringent local content requirements. Political instability or sanctions could inhibit project development or operations.
Environmental Regulation Regulatory approval may be costly and extends to the approval of upstream development and pipeline construction. Local environmental opposition, including from indigenous groups, may also arise.
Partner Priorities Not all partners are equally committed to a project and face different constraints depending on their respective portfolios. Ensuring alignment in advance of FID may be difficult.
Ability to Execute Partners must have the technical, operational, financial, and logistical capabilities to fully execute a project. Certain complex projects may present additional technical hurdles that could impact project feasibility.
Business Cycle Larger economic trends (e.g., declining oil prices, economic downturns) could limit project developers’ ability or willingness to move forward on a project.
Feedstock Availability The overall availability of gas to supply an LNG project may be limited by technical characteristics of the associated fields or the requirement of long-distance pipelines.
Fuel Competition Interest in a project may wane if project developers or end-markets instead seek to develop or consume competing fuels, including coal, oil, or renewables.
Domestic Gas Needs Countries with high or rising gas demand may choose to use gas domestically rather than for exports. This often results in new or existing liquefaction projects being required to dedicate a share of production to meet domestic demand.
Marketing/Contracting Project developers need to secure LNG buyers for a large portion of project capacity before sanctioning a project. Evolving or uncertain market dynamics may make this task more difficult.
Source: IHS
26
IGU World Gas LNG Report — 2016 Edition

11 Four of the five projects under construction are brownfield projects associated with existing regasification terminals, while the fifth is a former regasification proposal.12Excludes contracts deemed to have been canceled or lapsed.
deferments pending a price recovery. Coinciding with the beginning of market oversupply, shifts in demand fundamentals due to economic country-specific factors (e.g., economic downturn in China or structural changes in the Japanese power sector) have reduced several countries’ LNG import requirements, which may also slow the pace of project sanctioning.
Many Asian buyers have equity stakes and offtake from proposed projects in Western Canada, East Africa, and Russia. Weakening demand in their home markets may reduce their willingness to commit to higher-cost offtake.
Feedstock Availability, Domestic Gas Needs, and Fuel CompetitionThe prioritization of gas for domestic consumptions remains strong in several countries, especially in those with declining feedstock production.
In Egypt, the domestic market has increasingly diverted feedstock from the country’s export plants, resulting in the closure of Damietta LNG in late 2012, and the cessation of exports at ELNG in 2014. Production from fields associated with these projects is set to continue to decline over time, although the $11 billion West Nile Delta development and the large discovery Zohr made in 2015 offer the potential for longer-term domestic production growth.
While not as immediate as the situation in Egypt, Indonesia, UAE, Malaysia, Oman, and Trinidad also face rising domestic demand that may combine with declining feedstock production to eventually result in lower LNG exports. New or brownfield export proposals, including those in Malaysia, Mexico, and Algeria may also be impacted.
Moreover, the competitiveness of LNG relative to alternate fuels – both in terms of project returns and downstream economics – remains a major factor that can affect liquefaction project investment decisions worldwide as other commodity prices, including coal and oil, remain depressed.
Marketing and Contracting A major challenge to the development of future projects is the looming supply from Australia and the US set to come online over the next five years. With 141.5 MTPA under construction and announced to come online before 2020, LNG supply is expected to expand considerably during this time, making it more difficult for project developers to secure commitments from long-term buyers.
Some under-construction projects have not yet signed offtake contracts for their full capacities. The inability to secure buyers has also been a major impediment to the development of many LNG projects in Western Canada.
In the US, most projects are being developed as tolling facilities, in which the market risk is shifted to the tolling customer. In reserving capacity, the tolling customer agrees to pay a flat liquefaction fee to the terminal owner for the life of the contract, regardless of whether it elects to actually offtake volumes. While this take-or-pay model offers developers and lenders greater revenue certainty, tolling customers may face
difficulties in marketing volumes if demand fundamentals shift in their domestic markets or globally.
Flexible short-term contracts have become increasingly common over the last several years. If this trend continues, proposed projects may find it difficult to secure foundational buyers, particularly those that are established and creditworthy players.
4.8. Update on New Liquefaction PlaysIn 2015, construction continued at eleven projects in Australia (53.8 MTPA) and the US (62 MTPA), representing the largest sources of incremental supply over the next several years. A substantial capacity buildout in either country beyond what is already under construction is unlikely in the near term.
As of January 2016, an additional 670 MTPA of capacity has been proposed in the US and Canada, another large emerging liquefaction region, though proposal activity in both countries dropped off in 2015. Given the lengthy timelines associated with receiving regulatory approval, finding LNG buyers, and securing financing, it is likely that only a few more advanced projects with committed buyers will come online by the early 2020s. While several new projects and brownfield expansion trains in Australia have also been proposed, the country’s high-cost environment and the challenges of CBM-to-LNG production make it unlikely many of these proposals will advance in the near term.
There was limited momentum elsewhere in 2015, as proposals stagnated or faced delays due to marketing constraints, high project costs, and regulatory hurdles. Once a key emerging liquefaction region, progress has slowed in the Eastern Mediterranean due to regulatory uncertainty and market conditions. However, regulatory and fiscal certainty improved in several supply regions, including Canada and East Africa.
In contrast, notable progress was made on several FLNG projects in West Africa, with Cameroon FLNG reaching FID during the year. While small in terms of capacity, this commercial momentum indicates the ability of some projects to move forward in an oversupplied market.
Project Economics and MarketingSustained low oil and LNG prices continue to test the competitiveness of many LNG projects as margins become compressed and impact project economics.
The US has been widely touted as among the lowest-cost sources of LNG due to the brownfield nature of many developments11 and inexpensive feedstock. However, the arbitrage potential between US Henry Hub-linked supply and other global gas hubs diminished in 2015. Furthermore, the price of oil-linked contracts has fallen, narrowing the price differential with Henry Hub-linked contracts.
These shifts present a major development risk for US projects that have yet to make contracting progress. Around 112 MTPA12 of binding and non-binding agreements have been signed for offtake from US projects, of which only 9.5 MTPA were signed in 2015. Given market conditions, it may be difficult for additional projects to secure customers in the near term.
27
IGU World Gas LNG Report — 2016 Edition

Note: This build-out only takes into account existing and under construction projects. Sources: IHS, Company Announcements
050
100150200250300350400450
2015 2016 2017 2018 2019 2020 2021
MTP
A
United States Australia Qatar Other
Figure 4.13: Post-FID Liquefaction Capacity Build-Out, 2016-2021
Compared to the US, Canadian projects – all greenfield proposals and mostly integrated developments – face the additional costs of considerable upstream and lengthy pipeline infrastructure. Several projects have offtakers as upstream and liquefaction equity partners. However, pressure on companies to reduce capital spending over the next few years combined with the availability of potentially more cost-effective sources of supply and weakened demand growth in buyers’ home markets may reduce momentum at these projects. As a result, only a few binding offtake contracts have been signed to date. One project, Pacific Northwest LNG, reached only a conditional FID in 2015.
Several LNG projects, totalling 55 MTPA of capacity13, have also been proposed in Eastern Canada. Given long shipping distances to Asia, most project sponsors appear to be targeting European importers. However, few have achieved significant commercial momentum, and the projects may find it difficult to secure LNG buyers in the near term. Most of the East Coast projects will also depend on pipeline reversal and expansion, subject to regulatory approval from both Canada and the US.
In Australia, additional projects and brownfield expansion trains have been proposed at both east and west coasts, based on CBM and conventional off-shore resources, respectively. With costs likely to remain high, partly due to expected greater competition for EPC services, as well as impending market oversupply, many proposals face marketing challenges; several have been delayed or cancelled. Apart from Prelude FLNG, most floating proposals are considered longer-term options.
Although large dry gas discoveries offshore Mozambique and Tanzania transformed the region into a new frontier for LNG supply, no binding contracts have been announced. High midstream costs and dry gas reserves will likely translate to higher breakeven costs, which could make projects more challenged as new supply comes online. Potentially divergent
partner priorities in a low-price environment may slow progress in Tanzania.
Regulatory and Fiscal CertaintyContracting activity will continue to be the major driver of commercial momentum, but regulatory certainty generally improved in major liquefaction regions in 2015.
US LNG export projects need to receive two major sets of regulatory approvals to move forward: environmental/construction approval, primarily from the Federal Energy Regulatory Commission (FERC), and export approval from the DOE. The US regulatory approval process, particularly FERC, remains time-consuming and costly. However, several projects have now moved through the process, and greater certainty has emerged regarding expected timelines and costs. Lake Charles LNG received FERC approval in late 2015, with several more expected in 2016. DOE approval has two phases. Approval to export to countries with which the US holds a free trade agreement (FTA) is issued automatically.
13See Table 4.6 at the end of this chapter.
Ras Laffan Industrial City. Photo courtesy RASGAS
28
IGU World Gas LNG Report — 2016 Edition

Note: Liquefaction capacity only refers to existing and under-construction projects. Sources: IHS, Company Announcements
0
20
40
60
80
100
120
140
160
180
Africa Asia Pacific Europe FSU Latin America North America Middle East
MTP
A
2009 2015 2021 (Anticipated)
Figure 4.14: Liquefaction Capacity by Region in 2009, 2015, and 2021
Table 4.2: Nominal Liquefaction Capacity by Region in 2009, 2015, and 2021
Region 2009 2015 2021 (Anticipated)
% Growth 2009-2015 (Actual)
% Growth 2015-2021
(Anticipated)Africa 61.2 68.3 62.8 12% -8%Asia Pacific 88.8 97.3 157.9 10% 62%Europe 4.2 4.2 4.2 0% 0%FSU 9.6 9.6 26.1 0% 172%Latin America 15.3 19.8 19.8 29% 0%North America 1.5 1.5 62.0 0% 4030%Middle East 73.8 100.8 100.8 37% 0%Total Capacity 254.4 301.5 433.5 19% 44%
Note: Liquefaction capacity only refers to existing and under construction projects. Sources: IHS, Company Announcements
For non-FTA approved countries, a permit will be issued only after the project receives full FERC approval. Some expansion trains at projects already under construction in the US may be able to move more quickly through the regulatory process.
In Canada, projects must receive environmental and export approval from the Canadian Environmental Assessment Agency (CEAA) and the National Energy Board (NEB), respectively, among others. The process is fairly well established but is nonetheless rigorous and requires approval from First Nations groups impacted by the projects, which has emerged as a significant hurdle in some instances. The British Columbia government provided clarity on taxation in 2014 and 2015 via an LNG export-specific tax and royalty regime. Although important, these steps are unlikely to have a major impact on the overall pace of project development.
Projects in Mozambique gained some momentum in 2015 due to additional clarity on field development plans. Multiple floating and onshore projects have been proposed based on standalone Area 1 and Area 4 reserves as well as one that draws from both blocks. The Mozambique government in 2014 set out favourable taxation terms and required companies developing LNG proposals to submit plans for unitization, which occurred in late 2015 as discussions with offtakers continued to advance. As of January 2016, independent
developments appear to have been prioritized, though a joint development is still proposed as well.
LNG exports from Tanzania are a longer-term opportunity. In 2015, the country enacted the first of a series of policy and regulatory reforms to the oil and gas sector, which must be implemented before projects can reach FID. The Petroleum Bill, passed in 2015, provides more regulatory independence and establishes royalty and profit-sharing rates; additional bills are still under consideration.
The Yamal LNG (16.5 MTPA) project is under construction in Russia. Despite having buyers for most of its offtake, the project has faced financing challenges due to the imposition of US and EU sanctions on Russia. Alternative sources of debt and equity financing have been sought to fund the remaining balance of the project cost; in December 2015, Silk Road Fund (China) acquired a 9.9% equity stake. Several other proposals in the country remain longer-term opportunities and may face similar challenges if sanctions remain in place.
Previously considered a large new LNG export frontier, momentum in the Eastern Mediterranean has slowed due to a greater focus on pipeline exports, significant regulatory uncertainty over upstream licenses, and the prioritization of gas for domestic uses.
29
IGU World Gas LNG Report — 2016 Edition

Table 4.3: Proposed Liquefaction Projects in the US Lower 48, as of January 2016
Project Capacity Status Latest Company
Announced Start Date
DOE/FERC Approval
FTA/non-FTA Approval
Operator
United States Lower 48
Sabine Pass LNG
T1-2 9 UC** 2016 DOE/FERC FTA/ non-FTA
Cheniere EnergyT3-4 9 UC** 2016-17 DOE/FERC FTA/ non-FTAT5 4.5 UC** 2019 DOE/FERC FTA/ non-FTAT6 4.5 Pre-FID 2019 DOE/FERC FTA/ non-FTA
Freeport LNGT1-2 8.8 UC** 2018 DOE/FERC FTA/ non-FTA Freeport LNG
Liquefaction T3 4.4 UC** 2019 DOE/FERC FTA/ non-FTA
Cameron LNGT1-3 12 UC** 2018 DOE/FERC FTA/ non-FTA
Sempra EnergyT4-5 8 Pre-FID 2019-21 DOE FTA
Cove Point LNG 5.25 UC** 2017 DOE/FERC FTA/ non-FTA Dominion Resources
Elba Island LNG T1-2 2.5 Pre-FID 2017 DOE FTA Kinder Morgan
Corpus Christi LNGT1-2 9 UC** 2019 DOE/FERC FTA/ non-FTA Cheniere EnergyT3 4.5 Pre-FID 2020 DOE/FERC FTA/ non-FTA Cheniere Energy
Magnolia LNG T1-4 8 Pre-FID 2019 DOE FTA LNG LimitedJordan Cove LNG T1-4 6 Pre-FID 2019 DOE FTA/ non-FTA Veresen
Calcasieu Pass LNG T1-2 10 Pre-FID 2019 DOE FTA Venture Global Partners
Texas LNG T1-2 4 Pre-FID 2020 DOE FTA Texas LNGAnnova LNG T1-6 6 Pre-FID 2020 DOE FTA Exelon
Downeast LNG 3 Pre-FID 2020 N/A N/A Downeast LNG
CE FLNG T1-2 (OS) 8 Pre-FID 2020 DOE FTA Cambridge Energy Holdings
Main Pass Energy Hub FLNG T1-6
24 Pre-FID 2020 DOE FTA Freeport-McMoran Energy
Delfin FLNG 1-4 13 Pre-FID 2020 DOE FTA Delfin FLNG
Plaquemines LNG 20 Pre-FID 2020 N/A N/A Venture Global Partners
Oregon LNG T1-2 9 Pre-FID 2020-21 DOE FTA/ non-FTA Oregon LNG
Lake Charles LNG T1-3 15 Pre-FID 2020-21 DOE/FERC FTA/ non-FTA Energy Transfer/BG
Golden Pass LNG T1-3 15.6 Pre-FID 2020-21 DOE FTA Golden Pass Products
Gulf LNG T1-2 10 Pre-FID 2020-21 DOE FTA Gulf LNG
Rio Grande LNG 27 Pre-FID 2020-21 N/A N/A NextDecade International
G2 LNG 13.4 Pre-FID 2020-21 DOE FTA G2 LNGMississippi River LNG T1-4 2 Pre-FID 2021 DOE FTA Louisiana LNG
Live Oak LNG 5 Pre-FID 2021 N/A N/A Parallax EnergyBarca FLNG 1-3 12 Pre-FID 2021 DOE FTA Barca LNG
Gulf Coast LNG T1-4 21 Pre-FID 2021 DOE FTA Gulf Coast LNGEos FLNG 1-3 12 Pre-FID 2021 DOE FTA Eos LNG
General American LNG T1-2 4 Pre-FID 2022 N/A N/A General American LNG
Port Arthur LNG 10 Pre-FID 2022-23 DOE FTA Sempra EnergyMonkey Island LNG T1-6 12 Pre-FID N/A DOE FTA SCT&E
30
IGU World Gas LNG Report — 2016 Edition

Project Capacity Status Latest Company
Announced Start Date
DOE/FERC Approval
FTA/non-FTA Approval
Operator
United States Lower 48Alturas LNG 1.5 Pre-FID N/A N/A N/A WesPac
Waller Point FLNG 1.3 Pre-FID N/A DOE FTA Waller Marine, IncPelican Island LNG 6 Pre-FID N/A N/A N/A NextDecade
InternationalLavaca Bay FLNG 8 Cancelled N/A DOE FTA Excelerate
EnergySouth Texas FLNG T1-2 8 Cancelled N/A DOE FTA NextDecade
InternationalGasfin LNG 1.5 Cancelled N/A DOE FTA Gasfin
Development
Note: UC** denotes under construction. Sources: IHS, Company Announcements
Table 4.4: Proposed Liquefaction Projects in Alaska, as of January 2016
Project Capacity Status Latest Company
Announced Start Date
DOE/FERC Approval
FTA/non-FTA Approval
Operator
AlaskaREI Alaska 1 Pre-FID 2020 N/A N/A Resources
Energy Inc.Alaska LNG T1-3 20 Pre-FID 2024-25 DOE FTA/ non-FTA BP,
ConocoPhillips, ExxonMobil
Note: UC** denotes under construction. Sources: IHS, Company Announcements
Table 4.5: Proposed Liquefaction Projects in Western Canada, as of January 2016
Project Capacity Status Latest Company
Announced Start Date
NEB Application
Status
Operator
Western Canada
LNG Canada T1-2 12 Pre-FID 2021-22 Approved
Royal Dutch ShellT3-4 12 Pre-FID N/A Approved
Kitimat LNG T1 5 Pre-FID N/A Approved
ChevronT2 5 Pre-FID N/A
Pacific Northwest LNGT1-2 12 Pre-FID 2020-21 Approved
PETRONAST3 6 Pre-FID N/A Approved
WCC LNG T1-3 15 Pre-FID 2024 Approved
ExxonMobilT4-6 15 Pre-FID N/A Approved
Prince Rupert LNG T1-3 T1-2 14 Pre-FID N/A Approved
BG GroupT3 7 Pre-FID N/A Approved
Woodfibre LNG 2.1 Pre-FID 2017 Approved Pacific Oil and GasDouglas Channel FLNG 0.55 Pre-FID N/A Approved AltaGas
Kitsault FLNG 1-2 8 Pre-FID 2018-19 Approved Kitsault Energy
Orca FLNGT1 4 Pre-FID 2019 Approved
Orca LNGT2-6 20 Pre-FID N/A Approved
Malahat FLNG 6 Pre-FID N/A Approved Steelhead Group
31
IGU World Gas LNG Report — 2016 Edition

Project Capacity Status Latest Company
Announced Start Date
NEB Application
Status
Operator
Western CanadaSarita Bay LNG 24 Pre-FID N/A Approved Steelhead Group
Aurora LNG T1-4T1-2 12 Pre-FID 2023 Approved
Nexen (CNOOC)T1-4 12 Pre-FID 2028 Approved
Stewart Energy LNGT1 5 Pre-FID 2018 Approved
Stewart Energy GroupT2-6 25 Pre-FID 2020-25 Approved
Discovery LNG T1-4 20 Pre-FID 2021-24 Approved Quicksilver ResourcesGrassy Point LNG T1-4 20 Pre-FID 2021 Approved Woodside
Cedar FLNG 6.4 Pre-FID N/A Approved Haisla First NationTilbury LNG 3 Pre-FID N/A Approved WesPac LNG
NewTimes Energy LNG 12 Pre-FID 2019 Approved NewTimes Energy LNGTriton FLNG 2 Pre-FID N/A Approved AltaGasSK E&S LNG N/A Pre-FID N/A Not Filed SK E&S
Watson Island LNG N/A Pre-FID N/A Not Filed Watson Island LNG Corp.
Sources: IHS, Company Announcements
Table 4.6: Proposed Liquefaction Projects in Eastern Canada, as of January 2016
Project Capacity Status Latest Company
Announced Start Date
NEB Application
Status
Operator
Eastern CanadaGoldboro LNG T1-2 10 Pre-FID 2019-20 Approved Pierdae Energy
Bear Head LNG T1-6 12 Pre-FID 2019-24 Approved LNG LimitedCanaport LNG 5 Pre-FID N/A Approved RepsolAC LNG T1-3 15.5 Pre-FID 2020 Approved H-Energy
Saguenay LNG T1-2 11 Pre-FID 2020 Approved GNL QuebecNorth Shore LNG 1 Pre-FID 2018 Approved SLNGaz
Sources: IHS, Company Announcements
Table 4.7: Proposed and Under Construction Liquefaction Projects in Mexico, as of January 2016
Project Capacity Status Latest Company
Announced Start Date
Operator
MexicoPEMEX LNG 5 Pre-FID 2021 PEMEX
Costa Azul LNG 2 Pre-FID N/A Sempra Energy
Sources: IHS, Company Announcements
32
IGU World Gas LNG Report — 2016 Edition

Looking AheadHow will shifts in market fundamentals impact FIDs in 2016? Project sanctioning is expected to remain relatively muted in 2016. With CAPEX budgets under pressure due to low oil prices, project developers will likely hesitate to commit to capital-intensive liquefaction projects. The prospect of inadequate margins on oil-linked LNG sales will give developers further pause until greater certainty is established over long-term price expectations. Buyers, particularly those with weak demand in their home markets, may be equally hesitant to commit to costly long-term offtake agreements and may instead choose to opt for increasingly flexible short-term contracts. That said, security of supply remains a priority for some buyers who may seek additional long-term volumes. Projects with compelling economics that are able to offer competitive contract terms in an oversupplied market are more likely to reach FID in 2016.
Will floating projects be cost-competitive in a low price environment? FLNG projects are utilising various development concepts, each of which offers certain advantages. In terms of project economics, smaller-scale FLNG projects, including those based on barges or vessel conversions, have reportedly lower cost structures and the
potential ability to be diverted to other markets. As a result, FLNG projects in Cameroon and Equatorial Guinea based on the vessel conversion concept have made commercial progress, with Cameroon FLNG reaching FID in 2015. Numerous other floating proposals, especially those in North America, have yet to find buyers and are longer-term opportunities. The commissioning and operational timelines of the several larger FLNG vessels under construction will closely inform the industry as to the scale and pace at which FLNG could progress.
How will exporters adjust to low LNG prices? Despite lower LNG term and spot prices, outages in Yemen and Angola in 2015, and longer-term suspension of exports from Egypt, global LNG trade grew by 2% and utilisation remained consistent at 84%. Output from legacy producers Qatar, Malaysia, Russia, and Nigeria remained particularly strong, with Australia and Papua New Guinea contributing substantial new volumes. In response to downward pressure on prices, legacy assets – many of which are at least partially depreciated and have low breakeven costs – have maintained high utilisation.
Table 4.8: Proposed and Under Construction Liquefaction Projects in Australia, as of January 2016
Project Capacity Status Latest Company
Announced Start Date
Operator
Eastern Australia (CBM)Australia Pacific LNG T1-2 9 UC** 2016 ConocoPhillips
GLNG T1-2 7.8 UC** 2016 Santos
Abbot Point LNGT1-2 1 Pre-FID 2020
EWCT3-4 1 Pre-FID N/A
Fisherman’s Landing LNG T1-2 3.8 Pre-FID N/A LNG LimitedOffshore Australia
Gorgon LNGT1-3 15.6 UC** 2016-17
ChevronT4 5.2 Pre-FID N/A
Wheatstone LNGT1-2 8.9 UC** 2017
ChevronT3-5 13.35 Pre-FID N/A
Prelude FLNG 3.6 UC** 2017 Royal Dutch ShellIchthys LNG T1-2 8.9 UC** 2017-18 INPEX
Scarborough FLNG 6.5 Pre-FID 2021 ExxonMobilBrowse FLNG 1-3 11.7 Pre-FID 2021-24 WoodsideBonaparte FLNG 2 Pre-FID N/A ENGIE
Crux FLNG 2 Pre-FID N/A ShellDarwin LNG T2 3.6 Pre-FID N/A ConocoPhillipsPoseidon FLNG 3.9 Pre-FID N/A ConocoPhillipsSunrise FLNG 4 Pre-FID N/A Shell/Woodside
Timor Sea FLNG 2.5 Pre-FID N/A ConocoPhillipsTimor Sea LNG 3 Pre-FID N/A MEO
** UC denotes “Under Construction” Sources: IHS, Company Announcements
33
IGU World Gas LNG Report — 2016 Edition

5.1. OverviewThe 29 LNG carriers1 (including the FSRU Golar Tundra that initially acted as an LNG carrier) delivered in 2015 far outweighed additional shipping requirements from the additional 4.7 MT of incremental LNG trade, exacerbating the oversupply in the LNG shipping market. In addition, inter-basin trade diminished due to a narrowed arbitrage, reducing the number of extra-long haul deliveries. In total, the active global fleet comprised 410 vessels – excluding vessels equal to or less than 60,000 cm in capacity – for a combined capacity of 63 mmcm by the end of 2015.
A new wave of newbuild orders began in late 2012 and 2013. Unlike LNG demand factors that drove orders in past years, LNG supply factors largely led to the current cycle, with newbuild orders primarily tied to projects in Australia and the United States. The delayed ramp-up of new liquefaction plants led to the deepening of the tonnage glut in the shipping market in 2015. Speculative building was also a major contributor to the oversupply. Many vessels ordered in 2012 and 2013 had no specific work at the time of order, and today more than 40 vessels remain unchartered to a specific project or have other means of long-term employment.
Appetite for larger LNG carriers has increased the average capacity of delivered newbuild vessels since 2012. The average capacity of vessels delivered in 2015 was 163,813 cm, a 10% increase over vessels delivered in 2012. Based on the current orderbook, the average capacity of a delivered vessel is set to increase to 175,000 cm (+7%) by 2020.
With the expansion of the Panama Canal expected in 2016, conventional carriers with capacities between 170,000 cm
5. LNG CarriersThere have been significant changes in the LNG sector over the past decade that affected LNG shipping, particularly in the Pacific Basin. The LNG shipping sector, like most shipping markets, is cyclical in nature and 2015 marked a new depth of the oversupply in tonnage.
Estimated average spot charter rates fell as low as ~$20,000/day for steam vessels and $27,000/day for dual-fuel diesel electric (DFDE)/ tri-fuel diesel electric (TFDE) tankers in 2015 as demand for Atlantic volumes in the Pacific
Basin weakened and re-exports subsequently declined. The continuous wave of newbuilds hitting the market in 2016 will further push the LNG shipping market deeper into a period of oversupply, maintaining the current trend for spot charter rates in the near term. Additionally, the charter market evolved into a clear two tier market, with older steam vessels competing with more efficient newbuilds to find fixtures. However, with the deflation of oil prices, the cost spread between the propulsion systems narrowed, diminishing the competitive advantage of the more fuel-efficient vessels.
1A tank ship designed for transporting LNG can interchangeably be referred to as an LNG carrier, tanker, or vessel.
and 180,000 cm (also known as New Panamax carriers) have become the new standard for newbuild LNG vessels. Out of the 23 vessels ordered in 2015, 87% are registered as the New Panamax class. These ships will be able to pass through the expanded Panama Canal and will offer greater flexibility – especially compared to the Q-Class – when it comes to accessing the main discharge ports, particularly in Asia.
As of January 2016, 146 LNG carriers were in the orderbook with deliveries stretching to 2022. About 75% of the vessels in the orderbook are associated with charters that extend beyond a year. By contrast, 46 vessels are open for charter upon delivery (i.e. available).
For 2016 specifically, another 46 tankers, including FSRU’s, are scheduled to be delivered from the shipyards, though only 10.5 MTPA of additional liquefaction is slated to come online. With significant supply ramp-up delayed, the oversupply conditions in the LNG tanker market will persist given the additional tonnage. With the orderbook representing around 40% of the existing fleet, this state of affairs is unprecedented and this oversupply will impact the LNG shipping spot market for years to come.
To create value from the older vessels, ships considered for retirement have often been converted to FSRUs or even used as units for floating storage purposes. Additionally, companies – specifically Golar LNG – are exploring the value of converting Moss-type steam designs into FLNG units for smaller (0.5-2.5 MTPA) export projects.
Shipowners long on tonnage may be pinning their hopes on vessel retirements via scrappage or conversions to FSRUs
Photo courtesy GATE Terminal B.V.
34
IGU World Gas LNG Report — 2016 Edition
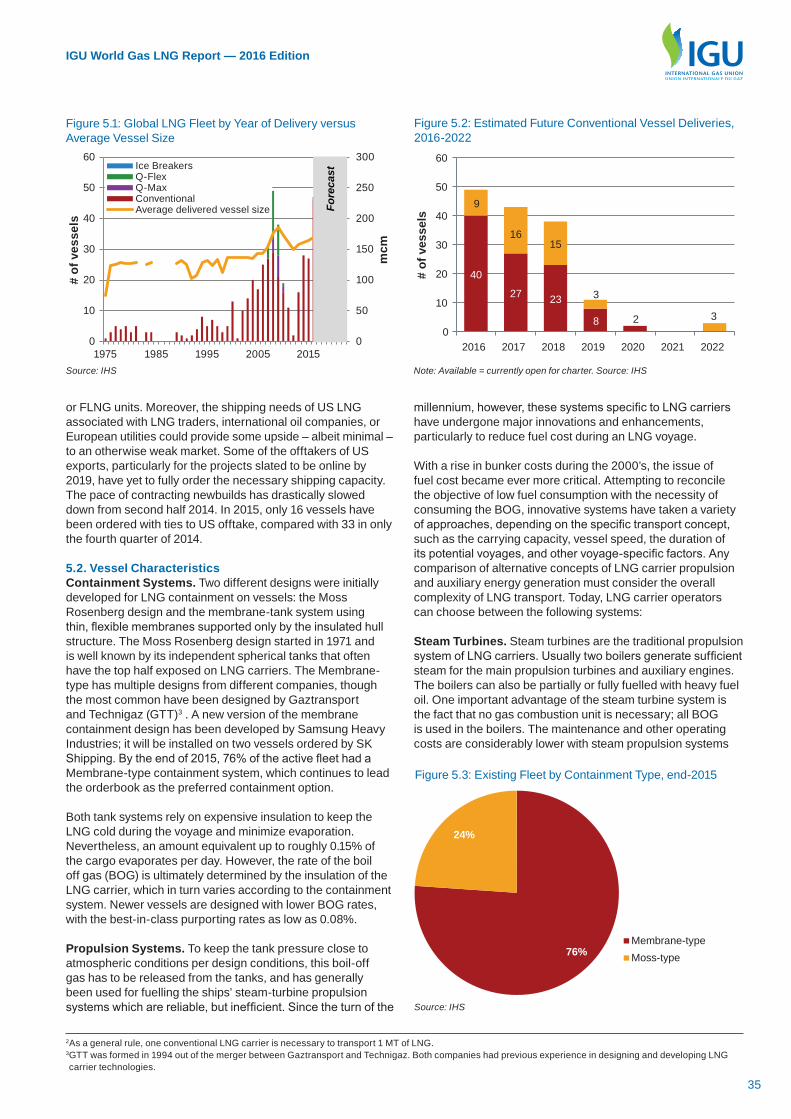
millennium, however, these systems specific to LNG carriers have undergone major innovations and enhancements, particularly to reduce fuel cost during an LNG voyage.
With a rise in bunker costs during the 2000’s, the issue of fuel cost became ever more critical. Attempting to reconcile the objective of low fuel consumption with the necessity of consuming the BOG, innovative systems have taken a variety of approaches, depending on the specific transport concept, such as the carrying capacity, vessel speed, the duration of its potential voyages, and other voyage-specific factors. Any comparison of alternative concepts of LNG carrier propulsion and auxiliary energy generation must consider the overall complexity of LNG transport. Today, LNG carrier operators can choose between the following systems:
Steam Turbines. Steam turbines are the traditional propulsion system of LNG carriers. Usually two boilers generate sufficient steam for the main propulsion turbines and auxiliary engines. The boilers can also be partially or fully fuelled with heavy fuel oil. One important advantage of the steam turbine system is the fact that no gas combustion unit is necessary; all BOG is used in the boilers. The maintenance and other operating costs are considerably lower with steam propulsion systems
2As a general rule, one conventional LNG carrier is necessary to transport 1 MT of LNG.3 GTT was formed in 1994 out of the merger between Gaztransport and Technigaz. Both companies had previous experience in designing and developing LNG carrier technologies.
or FLNG units. Moreover, the shipping needs of US LNG associated with LNG traders, international oil companies, or European utilities could provide some upside – albeit minimal – to an otherwise weak market. Some of the offtakers of US exports, particularly for the projects slated to be online by 2019, have yet to fully order the necessary shipping capacity. The pace of contracting newbuilds has drastically slowed down from second half 2014. In 2015, only 16 vessels have been ordered with ties to US offtake, compared with 33 in only the fourth quarter of 2014.
5.2. Vessel CharacteristicsContainment Systems. Two different designs were initially developed for LNG containment on vessels: the Moss Rosenberg design and the membrane-tank system using thin, flexible membranes supported only by the insulated hull structure. The Moss Rosenberg design started in 1971 and is well known by its independent spherical tanks that often have the top half exposed on LNG carriers. The Membrane-type has multiple designs from different companies, though the most common have been designed by Gaztransport and Technigaz (GTT)3 . A new version of the membrane containment design has been developed by Samsung Heavy Industries; it will be installed on two vessels ordered by SK Shipping. By the end of 2015, 76% of the active fleet had a Membrane-type containment system, which continues to lead the orderbook as the preferred containment option.
Both tank systems rely on expensive insulation to keep the LNG cold during the voyage and minimize evaporation. Nevertheless, an amount equivalent up to roughly 0.15% of the cargo evaporates per day. However, the rate of the boil off gas (BOG) is ultimately determined by the insulation of the LNG carrier, which in turn varies according to the containment system. Newer vessels are designed with lower BOG rates, with the best-in-class purporting rates as low as 0.08%.
Propulsion Systems. To keep the tank pressure close to atmospheric conditions per design conditions, this boil-off gas has to be released from the tanks, and has generally been used for fuelling the ships’ steam-turbine propulsion systems which are reliable, but inefficient. Since the turn of the
Note: Available = currently open for charter. Source: IHS
Source: IHS
40
27 23
8 2
9
1615
3
30
10
20
30
40
50
60
2016 2017 2018 2019 2020 2021 2022
# of
ves
sels
Available Term chartered
76%
24%
Membrane-typeMoss-type
Figure 5.2: Estimated Future Conventional Vessel Deliveries, 2016-2022
Figure 5.3: Existing Fleet by Containment Type, end-2015
Source: IHS
0
50
100
150
200
250
300
0
10
20
30
40
50
60
1975 1985 1995 2005 2015
mcm
Ice BreakersQ-FlexQ-MaxConventionalAverage delivered vessel size
# of
ves
sels
Fore
cast
Figure 5.1: Global LNG Fleet by Year of Delivery versus Average Vessel Size
35
IGU World Gas LNG Report — 2016 Edition
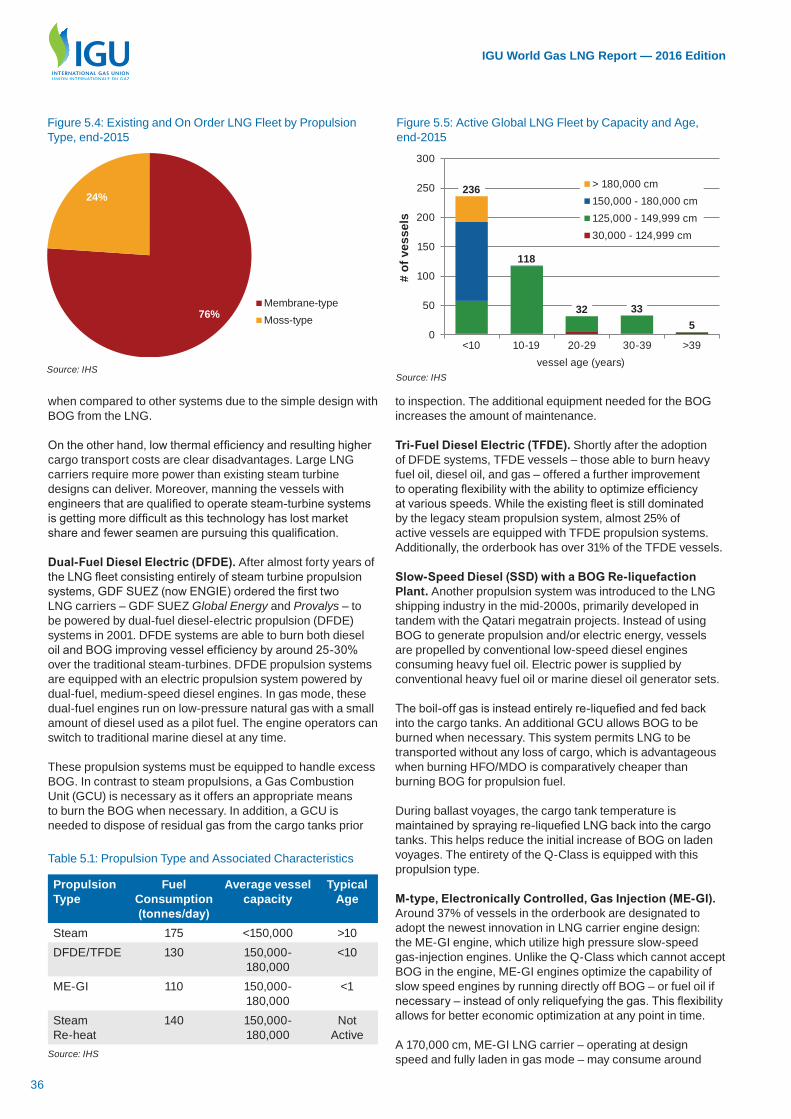
when compared to other systems due to the simple design with BOG from the LNG.
On the other hand, low thermal efficiency and resulting higher cargo transport costs are clear disadvantages. Large LNG carriers require more power than existing steam turbine designs can deliver. Moreover, manning the vessels with engineers that are qualified to operate steam-turbine systems is getting more difficult as this technology has lost market share and fewer seamen are pursuing this qualification.
Dual-Fuel Diesel Electric (DFDE). After almost forty years of the LNG fleet consisting entirely of steam turbine propulsion systems, GDF SUEZ (now ENGIE) ordered the first two LNG carriers – GDF SUEZ Global Energy and Provalys – to be powered by dual-fuel diesel-electric propulsion (DFDE) systems in 2001. DFDE systems are able to burn both diesel oil and BOG improving vessel efficiency by around 25-30% over the traditional steam-turbines. DFDE propulsion systems are equipped with an electric propulsion system powered by dual-fuel, medium-speed diesel engines. In gas mode, these dual-fuel engines run on low-pressure natural gas with a small amount of diesel used as a pilot fuel. The engine operators can switch to traditional marine diesel at any time.
These propulsion systems must be equipped to handle excess BOG. In contrast to steam propulsions, a Gas Combustion Unit (GCU) is necessary as it offers an appropriate means to burn the BOG when necessary. In addition, a GCU is needed to dispose of residual gas from the cargo tanks prior
Source: IHSSource: IHS
76%
24%
Membrane-typeMoss-type
236
118
32 335
0
50
100
150
200
250
300
<10 10-19 20-29 30-39 >39vessel age (years)
> 180,000 cm150,000 - 180,000 cm125,000 - 149,999 cm30,000 - 124,999 cm
# of
ves
sels
Figure 5.4: Existing and On Order LNG Fleet by Propulsion Type, end-2015
Figure 5.5: Active Global LNG Fleet by Capacity and Age, end-2015
to inspection. The additional equipment needed for the BOG increases the amount of maintenance.
Tri-Fuel Diesel Electric (TFDE). Shortly after the adoption of DFDE systems, TFDE vessels – those able to burn heavy fuel oil, diesel oil, and gas – offered a further improvement to operating flexibility with the ability to optimize efficiency at various speeds. While the existing fleet is still dominated by the legacy steam propulsion system, almost 25% of active vessels are equipped with TFDE propulsion systems. Additionally, the orderbook has over 31% of the TFDE vessels.
Slow-Speed Diesel (SSD) with a BOG Re-liquefaction Plant. Another propulsion system was introduced to the LNG shipping industry in the mid-2000s, primarily developed in tandem with the Qatari megatrain projects. Instead of using BOG to generate propulsion and/or electric energy, vessels are propelled by conventional low-speed diesel engines consuming heavy fuel oil. Electric power is supplied by conventional heavy fuel oil or marine diesel oil generator sets.
The boil-off gas is instead entirely re-liquefied and fed back into the cargo tanks. An additional GCU allows BOG to be burned when necessary. This system permits LNG to be transported without any loss of cargo, which is advantageous when burning HFO/MDO is comparatively cheaper than burning BOG for propulsion fuel.
During ballast voyages, the cargo tank temperature is maintained by spraying re-liquefied LNG back into the cargo tanks. This helps reduce the initial increase of BOG on laden voyages. The entirety of the Q-Class is equipped with this propulsion type.
M-type, Electronically Controlled, Gas Injection (ME-GI). Around 37% of vessels in the orderbook are designated to adopt the newest innovation in LNG carrier engine design: the ME-GI engine, which utilize high pressure slow-speed gas-injection engines. Unlike the Q-Class which cannot accept BOG in the engine, ME-GI engines optimize the capability of slow speed engines by running directly off BOG – or fuel oil if necessary – instead of only reliquefying the gas. This flexibility allows for better economic optimization at any point in time.
A 170,000 cm, ME-GI LNG carrier – operating at design speed and fully laden in gas mode – may consume around
Table 5.1: Propulsion Type and Associated Characteristics
Propulsion Type
Fuel Consumption (tonnes/day)
Average vessel capacity
Typical Age
Steam 175 <150,000 >10DFDE/TFDE 130 150,000-
180,000 <10
ME-GI 110 150,000-180,000
<1
Steam Re-heat
140 150,000-180,000
Not Active
Source: IHS
36
IGU World Gas LNG Report — 2016 Edition

15-20% less fuel than the same vessel with a TFDE propulsion system. While there is an improvement in fuel consumption, the reliability and extent of operational flexibility is still to be determined as the first LNG carrier with a ME-GI propulsion system was only delivered in the second half of 2015.
Others. In order to improve the performance of a traditional steam-turbine propulsion system, the Steam Reheat engine design was developed. The design is based on a reheat cycle, where the steam used in the turbine is reheated to improve its efficiency. This improvement in the steam adaptation maintained the benefits of the simple steam-turbine while improving overall engine efficiency.
Wärtsilä introduced its low-speed 2-stroke dual-fuel engine in 2014. This alternative to DFDE propulsion systems offers capital expenditure reductions of 15-20% via a simpler and lower cost LNG and gas handling system. On the operating expenditure side of the equation, significant gains can be achieved because no high pressure gas compression system external to the engine needs to be operated onboard the vessel, and NOx abatement systems are not required.
Vessel Size. Conventional LNG vessels typically vary significantly in size, though more recent additions to the fleet demonstrate a bias toward vessels with larger capacities. Prior to the introduction of the Q-Class in 2008-2010, the standard capacity of the fleet was between 125,000 cm and 150,000 cm. As of end-2015, 56% of active LNG carriers had a capacity within this range, making it the most common vessel size in the existing fleet.
Conversely, the Q-Flex (210,000-217,000 cm) and Q-Max (261,700-266,000 cm) LNG carriers that make up the Qatari Q-Class offer the largest available capacities. The Q-Class (43 vessels in total) accounted for 16% of the active tonnage at the end of 2015.
4 The New Panamax is defined by length, breadth, and draught. The maximum capacity which still fits these dimensions has thus far come to about 180,000cm, but there is no specific limitation on capacity.
The cargo capacity of the vessels has continued to progress and is now focused above 170,000 cm. This is partly related to the upcoming expansion of the Panama Canal, which will accommodate vessels of up to 180,000 cm and redefine the Panamax vessel class known as the New Panamax. By the end of 2015, 31% of the active global fleet was in the 150,000 to 180,000 cm4 range. This share will grow rapidly in the years ahead with the average capacity in the orderbook standing at approximately 170,000 cm at the end of 2015.
Vessel Age. At the end of 2015, 55% of the fleet was under 10 years of age, a reflection of the newbuild order boom that accompanied liquefaction capacity growth in the mid-2000s, and again in the early 2010s. Generally, shipowners primarily consider safety, reliability and operating economics when considering whether to retire a vessel after it reaches the age of 35, although some vessels have operated for approximately 40 years. Around 9% of active LNG carriers were over 30 years of age in 2015; these carriers will continue to be pushed out of the market as the younger, larger, and more efficient vessels continue to be added to the existing fleet.
Typically, as a shipowner considers options for older vessels – either conversion or scrappage – the LNG carrier is laid-up. However, the vessel can re-enter the market. At the end of 2015, 19 vessels (all Moss-type steam tankers with a capacity of under 150,000 cm) were laid-up. Approximately 80% of these vessels were over 30 years old, and all were older than 10.
As the newbuilds are delivered from the shipyards, shipowners can consider conversion opportunities to lengthen the operational ability of a vessel if it is no longer able to compete in the charter market. In 2015, only three vessels were retired from the fleet by selling the tanker for scrap. However, four vessels were flagged for conversion to liquefaction production units, while an additional tanker underwent maintenance to solely operate as a floating storage unit for employment in Malta.
2014-2015 LNG Trade in Review
Global LNG Fleet
+27Conventional carriers added to
the global fleet in 2015
Propulsion systems
~30%Active vessels with DFDE/TFDE
propulsion systems
Charter Market
$30,000Spot charter rate per day in 2015
Orderbook Growth
+24Conventional carriers
ordered in 2015
The active fleet expanded to 410 carriers in 2015
The average ship capacity increased by 2% to 164,000 cm compared to the average in 2014
Seven vessels – all over 35 years of age – were either retired or flagged for conversion in 2015
In 2014, over 75% of the fleet was steam-based; by 2015, DFDE/TFDE ships accounted for almost 30% of the fleet
The orderbook has a variety of vessels with new propulsion systems including ME-GI, and Steam Reheat designs
The increase in cross-basin trade following the years after the 2011 Fukushima crisis prompted spot charter rates to skyrocket in 2013 to over $100,000/day
In 2014-15, +55 vessels entered the market during a period of minimal incremental growth in LNG supply, pushing charter rates almost to operating costs
Newbuild orders skyrocketed in 2014 (68 vessels ordered) as buyers moved to secure shipping tonnage for the upcoming growth in LNG supply, primarily from the US
However, in 2015, only 24vessels were ordered as liquefaction project sanctions dropped off
37
IGU World Gas LNG Report — 2016 Edition

5.3. Charter MarketCharter rates fell and stayed low for the entirety of 2015. Older ships with higher costs (smaller capacity and less efficient steam turbine propulsion) often received lower rates; thus, there has been an emergence of a “spot” charter market at two distinct levels – the “premium” younger DFDE/TFDE vessel market (which is also typically associated with a larger capacity) and the steam based market with vessels associated with a smaller cargo capacity (i.e. <150,000 cm).
A total of 27 conventional LNG tankers and 2 FSRUs (temporarily open for charter) were delivered from the yard in 2015, yet 22 tankers were laid-up or scrapped. Only two liquefaction projects supported additional demand for shipping tonnage during the year – QCLNG and Donggi-Senoro LNG. However, these projects required minimal tonnage from the spot charter market since the majority of vessels used to deliver the additional volumes were already ordered and chartered on a long-term basis. Spot charter rates continued their downward trajectory in 2015 as growth of shipping supply far outpaced demand growth due to:
y The 2014 addition of 28 new vessels into the global fleet plus another 27 by end-2015 was far more than the supply growth of only 5.7 MT.
y Lower call for long-distance shipping caused both by the overall weakness of Northeast Asian spot purchasing in 2015 and additional LNG volumes introduced to the Pacific basin.
y Delays in the completion of new LNG projects plus shut-ins at Yemen and Angola led the vessels tied to those projects to seek employment in the short-term market, further increasing available shipping supply.
After the first quarter of 2015, estimated average monthly charter rates for steam vessels fell to about $20,000/day as Northeast Asian spot demand weakened while shipyards continued to deliver vessels. Although the majority of DFDE/TFDE vessels have been able to outperform their steam counterparts in the majority of the charter market due to their better fuel efficiency, a growing number of recently delivered DFDE/TFDE tankers were forced to remain idle because of insufficient charter opportunities. Many shipowners who had
Source: IHS
0
1
2
3
4
5
6
0
30
60
90
120
150
180
Jan-11 Jan-12 Jan-13 Jan-14 Jan-15
# of
ves
sels
Vessels delivered (right) Steam DFDE/TFDE
$'00
0/da
y
Figure 5.6: Average LNG Spot Charter Rates versus Vessel Deliveries, 2011 – December 2015
hoped to secure premium rates for their newer and more fuel efficient tankers found it difficult to charter their respective carriers in a ‘warm’ state. Instead, the vessels were forced to load cool-down volumes and accept rates below the already weak market day-rate.
Otherwise, without cold tanks, the vessels were market-limited, reducing the number of ships that were available on short notice. Also, the number of tankers with expired Ship Inspection Report documents continued to grow, which prevented some of these vessels from loading and unloading cargoes entirely, even if the demand for the tankers emerged. This reduced the number of tankers available on short notice, yet charter rates continued to remain low.
The oversupplied carrier market provided traders additional flexibility to bid on short-term Free On Board (FOB) supply tenders. In contrast, during periods of shipping shortages, LNG suppliers typically require the buyer to nominate a tanker before being able to bid on an FOB cargo. With plenty of shipping tonnage available for short-term chartering, traders were able to bid on tenders without specified shipping capacity.
Al Khuwair. Photo courtesy RASGAS.
38
IGU World Gas LNG Report — 2016 Edition
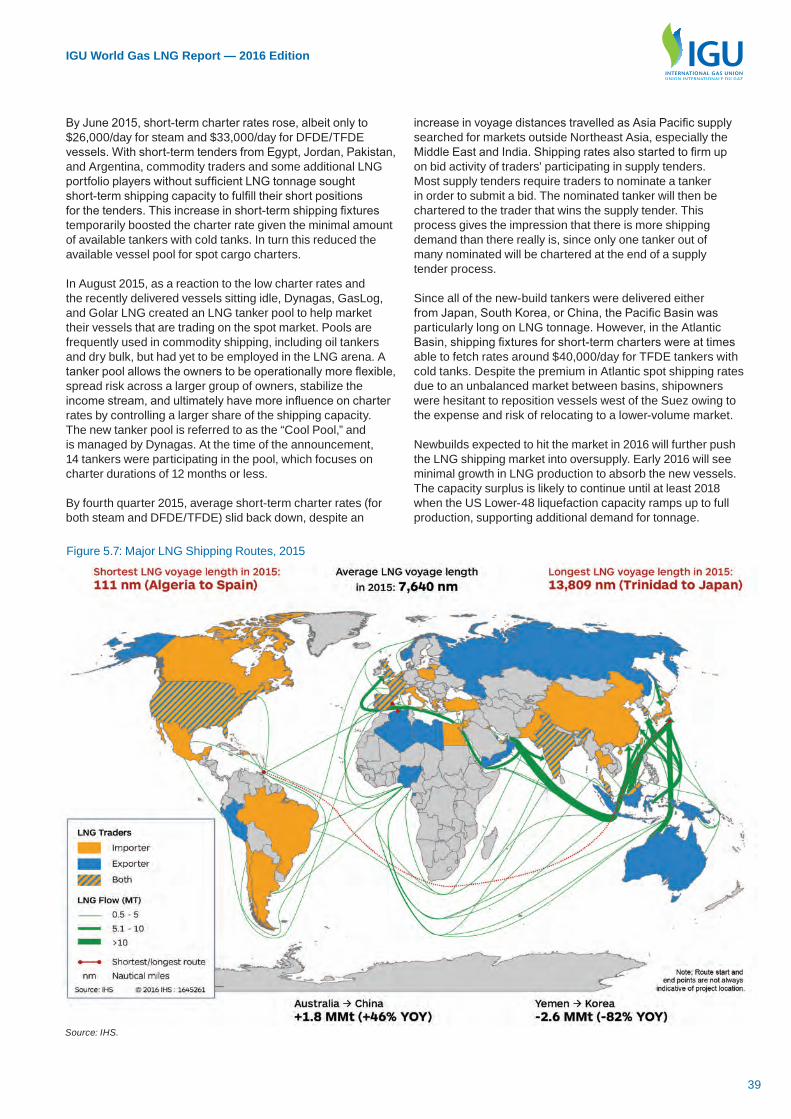
Source: IHS.
Figure 5.7: Major LNG Shipping Routes, 2015
By June 2015, short-term charter rates rose, albeit only to $26,000/day for steam and $33,000/day for DFDE/TFDE vessels. With short-term tenders from Egypt, Jordan, Pakistan, and Argentina, commodity traders and some additional LNG portfolio players without sufficient LNG tonnage sought short-term shipping capacity to fulfill their short positions for the tenders. This increase in short-term shipping fixtures temporarily boosted the charter rate given the minimal amount of available tankers with cold tanks. In turn this reduced the available vessel pool for spot cargo charters.
In August 2015, as a reaction to the low charter rates and the recently delivered vessels sitting idle, Dynagas, GasLog, and Golar LNG created an LNG tanker pool to help market their vessels that are trading on the spot market. Pools are frequently used in commodity shipping, including oil tankers and dry bulk, but had yet to be employed in the LNG arena. A tanker pool allows the owners to be operationally more flexible, spread risk across a larger group of owners, stabilize the income stream, and ultimately have more influence on charter rates by controlling a larger share of the shipping capacity. The new tanker pool is referred to as the “Cool Pool,” and is managed by Dynagas. At the time of the announcement, 14 tankers were participating in the pool, which focuses on charter durations of 12 months or less.
By fourth quarter 2015, average short-term charter rates (for both steam and DFDE/TFDE) slid back down, despite an
increase in voyage distances travelled as Asia Pacific supply searched for markets outside Northeast Asia, especially the Middle East and India. Shipping rates also started to firm up on bid activity of traders’ participating in supply tenders. Most supply tenders require traders to nominate a tanker in order to submit a bid. The nominated tanker will then be chartered to the trader that wins the supply tender. This process gives the impression that there is more shipping demand than there really is, since only one tanker out of many nominated will be chartered at the end of a supply tender process.
Since all of the new-build tankers were delivered either from Japan, South Korea, or China, the Pacific Basin was particularly long on LNG tonnage. However, in the Atlantic Basin, shipping fixtures for short-term charters were at times able to fetch rates around $40,000/day for TFDE tankers with cold tanks. Despite the premium in Atlantic spot shipping rates due to an unbalanced market between basins, shipowners were hesitant to reposition vessels west of the Suez owing to the expense and risk of relocating to a lower-volume market.
Newbuilds expected to hit the market in 2016 will further push the LNG shipping market into oversupply. Early 2016 will see minimal growth in LNG production to absorb the new vessels. The capacity surplus is likely to continue until at least 2018 when the US Lower-48 liquefaction capacity ramps up to full production, supporting additional demand for tonnage.
39
IGU World Gas LNG Report — 2016 Edition
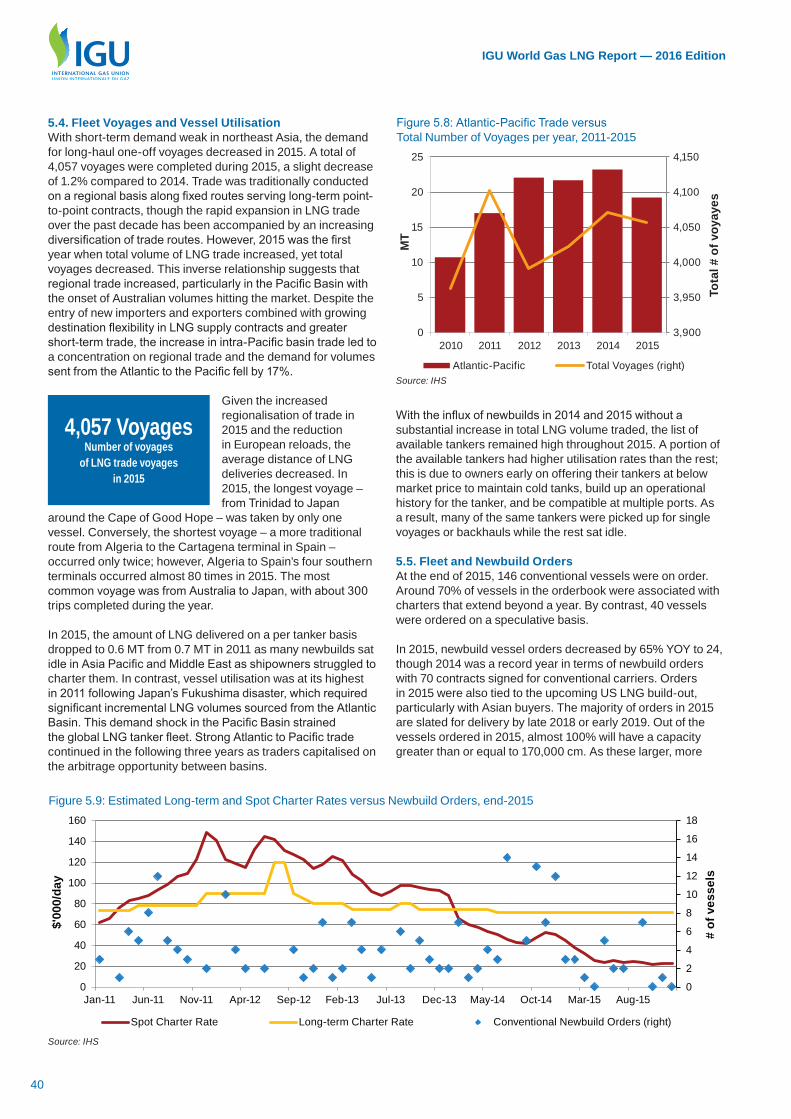
5.4. Fleet Voyages and Vessel UtilisationWith short-term demand weak in northeast Asia, the demand for long-haul one-off voyages decreased in 2015. A total of 4,057 voyages were completed during 2015, a slight decrease of 1.2% compared to 2014. Trade was traditionally conducted on a regional basis along fixed routes serving long-term point-to-point contracts, though the rapid expansion in LNG trade over the past decade has been accompanied by an increasing diversification of trade routes. However, 2015 was the first year when total volume of LNG trade increased, yet total voyages decreased. This inverse relationship suggests that regional trade increased, particularly in the Pacific Basin with the onset of Australian volumes hitting the market. Despite the entry of new importers and exporters combined with growing destination flexibility in LNG supply contracts and greater short-term trade, the increase in intra-Pacific basin trade led to a concentration on regional trade and the demand for volumes sent from the Atlantic to the Pacific fell by 17%.
Given the increased regionalisation of trade in 2015 and the reduction in European reloads, the average distance of LNG deliveries decreased. In 2015, the longest voyage – from Trinidad to Japan
around the Cape of Good Hope – was taken by only one vessel. Conversely, the shortest voyage – a more traditional route from Algeria to the Cartagena terminal in Spain – occurred only twice; however, Algeria to Spain’s four southern terminals occurred almost 80 times in 2015. The most common voyage was from Australia to Japan, with about 300 trips completed during the year.
In 2015, the amount of LNG delivered on a per tanker basis dropped to 0.6 MT from 0.7 MT in 2011 as many newbuilds sat idle in Asia Pacific and Middle East as shipowners struggled to charter them. In contrast, vessel utilisation was at its highest in 2011 following Japan’s Fukushima disaster, which required significant incremental LNG volumes sourced from the Atlantic Basin. This demand shock in the Pacific Basin strained the global LNG tanker fleet. Strong Atlantic to Pacific trade continued in the following three years as traders capitalised on the arbitrage opportunity between basins.
4,057 Voyages Number of voyages
of LNG trade voyages in 2015
Source: IHS
Source: IHS
0
2
4
6
8
10
12
14
16
18
0
20
40
60
80
100
120
140
160
Jan-11 Jun-11 Nov-11 Apr-12 Sep-12 Feb-13 Jul-13 Dec-13 May-14 Oct-14 Mar-15 Aug-15
# of
ves
sels
$'00
0/da
y
Spot Charter Rate Long-term Charter Rate Conventional Newbuild Orders (right)
3,900
3,950
4,000
4,050
4,100
4,150
0
5
10
15
20
25
2010 2011 2012 2013 2014 2015
Tota
l # o
f voy
ayes
Atlantic-Pacific Total Voyages (right)
MT
Figure 5.9: Estimated Long-term and Spot Charter Rates versus Newbuild Orders, end-2015
Figure 5.8: Atlantic-Pacific Trade versus Total Number of Voyages per year, 2011-2015
With the influx of newbuilds in 2014 and 2015 without a substantial increase in total LNG volume traded, the list of available tankers remained high throughout 2015. A portion of the available tankers had higher utilisation rates than the rest; this is due to owners early on offering their tankers at below market price to maintain cold tanks, build up an operational history for the tanker, and be compatible at multiple ports. As a result, many of the same tankers were picked up for single voyages or backhauls while the rest sat idle.
5.5. Fleet and Newbuild OrdersAt the end of 2015, 146 conventional vessels were on order. Around 70% of vessels in the orderbook were associated with charters that extend beyond a year. By contrast, 40 vessels were ordered on a speculative basis.
In 2015, newbuild vessel orders decreased by 65% YOY to 24, though 2014 was a record year in terms of newbuild orders with 70 contracts signed for conventional carriers. Orders in 2015 were also tied to the upcoming US LNG build-out, particularly with Asian buyers. The majority of orders in 2015 are slated for delivery by late 2018 or early 2019. Out of the vessels ordered in 2015, almost 100% will have a capacity greater than or equal to 170,000 cm. As these larger, more
40
IGU World Gas LNG Report — 2016 Edition

Sources: IHS, Shipyard Reports
Source: IHS
1 2 2 4 3
1711
59
3 410 10 9
27 6 5
15
24
4 5 11
210
5
1 63 4 4
4
8
5 26 2
0
10
20
30
40
Q1 2010 Q3 2010 Q1 2011 Q3 2011 Q1 2012 Q3 2012 Q1 2013 Q3 2013 Q1 2014 Q3 2014 Q1 2015 Q3 2015
# of
ves
sels Speculative Term-chartered
05
101520253035
Teek
ayN
akila
tM
aran
Gas
Mar
itim
eM
ISC
Gas
Log
BW
NY
KB
PM
OL
J4 C
onso
rtiu
mG
olar
LN
GK
nuts
en O
AS
Sov
com
flot
Dyn
agas
Hyu
ndai
LN
G S
hipp
ing
Gol
ar L
NG
Par
tner
sN
YK
, K L
ine,
MO
L,…
Nat
iona
l Gas
Shi
ppin
g…H
oegh
Nak
ilat,
Teek
ayM
itsui
& C
oB
GT
Ltd.
Nor
th W
est S
helf…
SK
Shi
ppin
gM
aran
G.M
, Nak
ilat
Che
vron
K L
ine
Kore
a Li
neC
hina
Shi
ppin
g G
roup
Nig
eria
LN
G L
tdB
G G
roup
Bru
nei G
as C
arrie
rsTe
ekay
, Mar
uben
iS
hell
Chi
na L
NG
Shi
p M
gmt.
Exc
eler
ate
Ene
rgy
PE
TRO
NA
SN
akila
t, O
SC
Com
mer
z R
eal,…
TEP
CO
, NY
K, M
itsub
ishi
Son
atra
chM
OL,
Chi
na L
NG
Car
diff
Mar
ine
Mits
ui, N
YK
, Tee
kay
ICB
CH
anjin
Shi
ppin
g C
o.H
YP
RO
CO
SC
, MO
L
# of
ves
sels On Order
Delivered in 2015Active
Figure 5.10: Firm Conventional Newbuild Orders by Quarter
Figure 5.11: LNG Fleet by Respective Company Interests
efficient newbuilds are added to the active fleet, older smaller vessels will be increasingly retired.
Many independent shipping companies made moves to dramatically grow their fleet sizes in the aftermath of the Fukushima nuclear crisis. While Golar ordered newbuilds primarily on a speculative basis, competitors such as Maran Gas Maritime and GasLog LNG chiefly placed orders based on term charter agreements with international oil companies.
Out of the 100 vessels on charter in the orderbook, 35% are tied to companies that are considered an LNG producer (e.g., Nigeria LNG, Yamal LNG, etc.). LNG buyers are driving a third of the new-build orders as the companies gear up for their Australian and US offtake. The remaining charters comprise companies that span multiple market strategies, particularly IOCs and portfolio players.
5.6. Vessel Costs and Delivery ScheduleDuring the 2000s, LNG carrier costs remained within a narrow range once controlled for capacity. However, the rapid growth in demand for innovative vessels in 2014 pushed average vessel costs, particularly vessels with TFDE propulsion, to rise from $1,300/cm in 2005 to $1,770/cm in 2014. This was mainly
driven by the Yamal LNG icebreakers vessels which are more expensive than a typical carrier. However, in 2015, the costs for TFDE vessels dropped back to $1,420/cm.
With few exceptions, vessels have historically been delivered between 30 and 50 months after the order is placed. However, the delivery timeline has varied depending on overall demand and the type of propulsion system. For instance, when DFDE vessels were first ordered in the early 2000s, the time to delivery was expanded as shipyards had to adapt to the new ship specifications and had to do so with limited shipyard capacity. DFDE tankers delivered in 2006 saw an average time of 60 months between order and delivery.
Yamal’s three liquefaction trains are under construction. Upon completion, the project will require up to 17 ice-breaker LNG carriers, and 15 have already been ordered. Eventually, these ships will have the capacity to transport LNG in summer via the North Sea Route (NSR) and in winter by the western route to European terminals, including Zeebrugge and Dunkirk. The 15 under construction ice-class tankers each cost approximately $320 million. The first of these vessels commenced its initial sea trials in January 2016.
41
IGU World Gas LNG Report — 2016 Edition

5.7. Near-Term Shipping Developments New charter contract structure – LNGVOY. A new contract for voyage chartering of LNG vessels is expected to be published in May 2016. As most of the chartering agreements within the LNG space are based on a day charter rate, the LNG Carrier Voyage Charter Party (LNGVOY) was developed specifically for the spot LNG market which typically only includes a single voyage.
Traditionally, a time charter agreement stipulates that the voyage can use the natural boil-off as fuel up to a certain amount; under this contract type, the loss of gas is typically allocated between both the charterer and shipowner if the cap is exceeded. The new LNGVOY contract, stipulates provisions for cost allocation of fuel oil/gasoil and/or forced boil-off to best meet the charterer’s needs. Conversely, at loading and discharging ports, any additional boil-off beyond that cap will be on the charterer. Provisions relating to heel5 vary in importance. When a charter is spot, or for a single voyage, owners will want to know more precisely the quantity of heel that will be returned in order to plan for the vessel’s next employment opportunity.
The contract adds flexibility to the spot market and gives parties alternative means to manage the associated risks, and more importantly, control costs. The flexibility and effectiveness of LNGVOY will be tested in 2016 once the new contract structure is finalized and made available for the LNG space.
Propulsion. Shipowners may increasingly convert their previous orders to include the new propulsion system, as was done in 2015. The flexibility to burn gas or fuel oil depending on market conditions could offer ME-GI propulsion vessels a distinct competitive advantage in the market. In early 2015, Flex LNG notably opted to convert its DFDE propulsion for two newbuilds to ME-GI types. Additionally, one Q-Max vessel was retrofitted and converted to ME-GI propulsion in 2015 during a
Source: IHS
10152025303540455055
9001,0001,1001,2001,3001,4001,5001,6001,7001,800
2005 2007 2009 2011 2013 2015
Mon
ths
$/cm
Avg. Delivery (right) SteamSSD TFDEDFDE MEGI
Figure 5.12: Average Delivery and Cost per Cubic Meter in Ordered Year by LNG Carrier Type, 2005-2015
5Heel = LNG remaining on board in tanks.
dry docking. If the retrofit proves economical and reliable over the following months, all the Q-Class is under consideration to be converted to ME-GI.
Suez Canal. In 2015, Suez Canal transit tolls for LNG carriers were increased, as the 35% historical discount was reduced to 25%. The previous discount rate had been in place since 1994. The discount specifically for LNG tankers was determined based on formula – which measures the height and length of the tanker to determine cargo space – that dictates the fee. The toll gross tonnage causes the Moss-type to pay 25% to 30% higher fees than the Membrane-type when comparing on the same cubic meter carrying capacity since the non-cargo space between the tanks would mistakenly be considered cargo space. The original discount attempted to normalize this issue since the majority of tankers in 1994 had spherical tanks. Since membrane-type vessels are now the majority of the fleet, the discount has been adjusted accordingly.
Asia Excellence. Photo courtesy Chevron.
42
IGU World Gas LNG Report — 2016 Edition

Panama Canal. The $5.25 billion expansion of the Panama Canal – which will allow around 90% of the existing LNG fleet to transit the canal – was reported to commence operations in April 2016. But some of the newly installed locks began to leak in the second half of 2015, and repairs are announced to be extensive. However, the canal authority has said Grupo Unidos Por el Canal, the consortium building the locks, has not changed the opening date for the new locks, despite seepage in a sill tied to a problem with steel enforcement.
Although the start-up will come years behind the initial schedule, the 48-mile artery of the Panama Canal connecting the Atlantic and Pacific oceans will become the primary inter-basin route for US LNG exports. For shipowners from Gulf Coast LNG projects, the attractiveness of the canal is clear. The trip from the US Gulf Coast to Japan and back through Panama will take 43 days, shaving almost 20 days off the roundtrip voyage compared to going through the Suez Canal.
The Panama Canal Authority (PCA) released the LNG vessel tariff structure in early 2015. The tariffs are to be calculated based on cargo volume and not vessel tonnage or length. This tariff structure removes any inherent transit pricing differential between Moss-type and Membrane-type vessels that is considered when passing through the Suez Canal.
Based on those announcements, the fee charged to a laden6 173,000 cm LNG vessel will equal $380,480. Additionally, the PCA outlined its proposal to incentivize vessels to also use the Panama Canal on its return voyage, by charging around $34,000 less than the standard ballast7 fee for a 173,000 cm vessel. Importantly, a vessel will be considered to be in
ballast unless it has in excess of 10% of its cargo carrying capacity as heel.
The canal widening will accept LNG vessels as large as 180,000 cm based on current length, width, and draught dimension for vessels of this volume. This excludes the passage of only the Q-Class. Initially, the expanded Panama Canal will support the transit of six to eight vessels per day – of all vessel types – in both directions. Slot nomination will need to be scheduled months in advance. This notification requirement could make scheduling LNG trade more challenging.
Yamal ice-breaking vessels. The Azimutal Thruster system – where the electric motor is mounted inside the propulsion unit and the propeller is connected directly to the motor shaft – has been adopted by the 15 Yamal LNG project-specific vessels. These powerful units (3 units of 15 MW each) allow the vessels to navigate the Arctic conditions along the Northern Sea Route (NSR) with greater hydrodynamic and mechanical efficiency which will be needed in addition to the ice-breaking abilities.
Blue Amazon. BG Group developed a new generation of LNG carrier design. Codenamed Blue Amazon, the project involves the adjustment of the shape of the hull and cargo tanks which is crucial in reducing resistance through the water, reducing theoretical fuel consumption. According to BG, the new design should cut fuel use and corresponding emissions by between 3% and 5%. The final design, which is undergoing review by Korean shipyards, should emerge in March 2016.
6Laden = a vessel that is loaded with a cargo.7Ballast = a vessel that does not have a delivery cargo onboard.
Table 5.2: Tariff Structure for LNG Vessels Travelling via the Suez Canal
Proposed LNG vessel toll structureBands in cm Laden Ballast Ballast
(roundtrip)First 60,000 $2.50 $2.23 $2.00 Next 30,000 $2.15 $1.88 $1.75 Next 30,000 $2.07 $1.80 $1.60 Remaining Volume
$1.96 $1.71 $1.50
Note: A vessel is considered to be in a ballast voyage if it has LNG from its previous cargo equal to no more than 2% of the ship’s Summer Deadweight (different from SCNT). Prices are reported in Special Drawing Rights (SDRs), not US Dollars (SDRs per currency unit are published by the International Monetary Fund). Tug fees must be added for an LNG vessel that does not provide a Gas Free Certificate. Sources: IHS, Suez Canal
Table 5.3: Announced Tariff Structure for LNG Vessels Travelling via the Panama Canal
LNG vessel toll structure (without discount)Bands in cm Laden Ballast
First 5,000 $7.88 $6.70 Next 5,000 $6.13 $5.21 Next 10,000 $5.30 $4.51 Next 20,000 $4.10 $3.49 Next 30,000 $3.80 $3.23 Next 50,000 $3.63 $3.09 Remaining tonnage
$3.53 $3.00
Note: A vessel is considered to be in ballast unless it has an excess of 10% of its cargo carrying capacity as heel. To be considered a roundtrip voyage, vessels must transit on ballast passage within 60 days of completion of the laden passage. There could be other additional costs not factored in like security, tugboats, and reservation fees. Sources: IHS, Panama Canal Authority
43
IGU World Gas LNG Report — 2016 Edition

Looking AheadWhen will the shipping market recover from the current oversupply in tonnage? Aside from the near-term oversupply dynamics, a tightening in the shipping market may still occur by the turn of the decade as liquefaction capacity is set to increase by nearly 50% by 2021, particularly from the US Gulf Coast. These volumes required significant shipping tonnage based on the long-haul voyages to Asia via the Panama Canal.
When LNG carriers with ME-GI propulsion systems are delivered, will the spot charter market evolve into a three-tier market? With the potential growing number of ME-GI tankers being delivered from the shipyards, a three-tiered charter rate system, instead of the current two-tier system, could develop. In 2015, TFDE held a consistent premium in the spot charter market over steam tankers, despite the fall in the price of oil derivatives. However, as the global fleet becomes more diverse in propulsion systems and other key characteristics, rates may break out further to include ME-GI systems. The varying degrees of propulsion system efficiency in the global fleet – which provides potential charterers with more operational flexibility – will drive more options in the LNG charter market over the coming years.
Do commodity traders in the LNG market have more opportunity to participate in supplying volumes given the lower barriers of entry in shipping? With the LNG vessel market saturated with speculatively ordered tonnage, a healthy supply of LNG, and buyers looking for shorter contract durations, the environment is set for traders to grow in their participation of the market, potentially aiding the development of a more prolific spot charter system. These players need spot tonnage as they typically do not have their own tankers or charter on a long-term basis. The oversupplied LNG tanker market has provided traders additional flexibility to bid on short-term FOB supply tenders from liquefaction projects, being certain they could charter a vessel at short notice, if they had the winning bid. In contrast, LNG projects previously required the prospective buyer to nominate a tanker before being able to bid on an FOB cargo, propping up spot charter rates as a result. This trading pattern will ultimately boost much needed demand for spot tonnage, though the magnitude will ultimately depend on the buyer’s appetite for uncontracted cargoes.
Photo courtesy Chevron.
44
IGU World Gas LNG Report — 2016 Edition

regions like Europe continue to join the global LNG market, countries in emerging, higher credit risk markets comprise the majority of the next round of new LNG importers.
In 2015, a total of 7 new regasification terminals were completed worldwide. Three of these were onshore terminals: in Japan (Hachinohe and Shin-Sendai) and Indonesia (Arun, which was converted from
a decommissioned liquefaction plant). The other four were FSRUs completed in new LNG markets: in Egypt (Ain Sokhna BW and Ain Sokhna Hoegh), Jordan (Aqaba) and Pakistan (Engro). In addition, China is expected to complete the Yuedong LNG (Jieyang) terminal in early 2016.
Two existing importers completed capacity expansions in 2015. Chile brought online a 1.3 MTPA expansion project at its Quintero LNG project in March 2015. The Dubai LNG project
6.1. OverviewAlthough Japan, the world’s largest LNG importer, brought two new regasification terminals online in 2015, the year saw the majority of new terminals constructed in emerging markets, including Egypt, Jordan, Pakistan and the UAE, which added a much larger FSRU to replace an existing vessel at Dubai LNG. In January 2015, Indonesia successfully converted a former liquefaction plant, Arun LNG, into a regasification terminal. Poland received its first commissioning cargo in December 2015 and its onshore terminal is expected to achieve commercial operations in early 2016. Overall, total global regasification capacity grew by 24 MTPA (+3.3% YOY) in 2015, bringing total capacity worldwide to 757.1 MTPA in 33 countries.1
The Asia and Asia Pacific regions have continued to maintain the global LNG market’s largest regasification capacities in recent years, as capacity has grown in both established markets, such as Japan and
South Korea, and in rising LNG importers, including China and India. Outside of North America, all other regions have increased regasification capacity over the last few years, especially through the development of FSRUs in the Middle East and Latin America. FSRUs are expected to continue playing an important role for bringing new importing countries to the LNG market quickly provided there is sufficient pipeline and offloading infrastructure in place. However, onshore regasification terminals offer the stability of a permanent solution when there is less of a rush to add LNG import capacity.
6.2. Receiving Terminal Capacity and Utilisation GloballyThe LNG market continues to grow, particularly as new import countries have access to floating vessels for regasification and flexible trade increases amid falling global prices, unlocking demand in markets previously unable to secure LNG supply. The number of LNG importing countries has tripled over the past 15 years. Although countries in some traditional importing
6. LNG Receiving TerminalsRegasification capacity continues to expand, both for existing LNG importers as well as in emerging markets. Import capacity grew world-wide to 757 MTPA by end-2015. In 2015, three new countries added regasification capacity: Egypt, Pakistan and Jordan. Poland received its first commissioning cargo in December 2015, but commercial capacity has not yet started. The prospects of sustained low prices allowed these new markets to fast-track their projects, as they could secure regasification capacity relatively quickly, through the utilisation of offshore FSRUs. Many established LNG import markets have focused on growing import, storage and vessel berthing capacities through the development of larger onshore terminals and expansion projects. Further, many terminals are expanding services to include small-scale reloading and bunkering.
As multiple new liquefaction plants come online in the 2016-2018 time frame, a well-supplied market with lower prices could provide benefits to some LNG importers, potentially replacing competing fuels. Further, market conditions could continue to unlock more demand from new, less mature LNG markets. Onshore regasification projects are the key consideration for new markets like Croatia, Panama, or Morocco that are looking to add LNG import capacity over the longer term. In addition, Colombia, Ghana, Bangladesh, Benin and Uruguay all have proposals to bring their first regasification terminals online via FSRUs over the next two years. With new markets able to secure supply quickly by chartering FSRUs, producers may face challenges predicting LNG demand moving forward.
757 MTPA Global LNG
receiving capacity, end-2015
7 terminals Number of
new receiving terminals brought online in 2015
0
50
100
150
200
250
300
350
Existing FID Pre-FID
MTP
A
Asia Pacific EuropeNorth America Latin AmericaAsia Middle EastAfrica Former Soviet Union
Figure 6.1: LNG Receiving Capacity by Status and Region, as of January 2016
1 This count, along with all other totals within this section, only includes countries with large-scale LNG import capacity (1 MTPA and above). This includes countries that only import domestically-produced LNG, which may cause totals to differ from those reported in Chapter 3. Refer to Chapter 8 for a description of the categorization of small-scale versus large-scale LNG.
Sources: IHS, Company Announcements
45
IGU World Gas LNG Report — 2016 Edition

in UAE received a new FSRU capable of handling 6 MTPA in April 2015, which replaced the existing vessel’s 3 MTPA throughput. Furthermore, a 3 MTPA expansion project at the Rudong Jiangsu LNG terminal in China is expected to come online in early 2016.
As of January 2016, 16 new terminals were reported to be under construction, 8 of which were located in China, (including the Yuedong LNG (Jieyang) terminal, expected online in early 2016). Two countries, Poland and the Philippines, were set to begin commercial operations at their first regasification terminals, with onshore projects expected in both countries in the first half of 2016. Existing importers France, India, Japan and South Korea all had onshore regasification projects under construction as well, with two each in India and Japan. Five capacity expansion projects were also under construction, including two projects in China
0%
10%
20%
30%
40%
50%
60%
70%
80%
90%
0
100
200
300
400
500
600
700
800
900
2000
2002
2004
2006
2008
2010
2012
2014
2016
2018
2020
MTP
A
Under Construction in 2016ExistingUtilization (right axis)
Forecast
0
6
12
18
24
30
36
0
2
4
6
8
10
12
1980
1982
1984
1986
1988
1990
1992
1994
1996
1998
2000
2002
2004
2006
2008
2010
2012
2014
2016
2018
2020
No.
of C
ount
ries
New
Ter
min
als
or E
xpan
sion
Phas
es O
nlin
e
FloatingOnshoreNo. of Countries with LNG Receiving Terminals (right axis) Forecast
Figure 6.2: Global Receiving Terminal Capacity, 2000-2021
Figure 6.3: Start-Ups of LNG Receiving Terminals, 1980-2021
Note: The above forecast only includes projects sanctioned as of end-2015. Owing to short construction timelines for regasification terminals, additional projects that have not yet been sanctioned may still come online in the forecast period, as indicated by the diagonal bars. Although several FSRU contracts will expire over this time period, this forecast assumes that the capacity will remain in the global market. Sources: IHS, Public Announcements
Note: The decline in number of countries with LNG receiving terminals is the result of FSRU charter expirations. Sources: IHS, Company Announcements
and one each in Greece, India and Thailand. In total, 73 MTPA of onshore regasification capacity, including expansion projects, was under construction, 95% of which is located in existing LNG import markets.
Furthermore, five FSRU projects (in Ghana, Colombia, Puerto Rico, Uruguay and Chile) are in advanced stages as developers have selected an FSRU provider.2 These projects have a total combined capacity of 18.9 MTPA. Only 40% of this figure stems from countries with established regasification capacity.
Global LNG regasification utilisation rates averaged 33% in 2015, essentially equal to 2014 levels. If mothballed terminals3 are excluded, this number would reach 35% in 2015. Due to the requirement to meet peak
seasonal demand and ensure security of supply, regasification terminal capacity far exceeds liquefaction capacity, causing average utilisation rates below 50%. Global utilisation levels have stayed flat, despite adding 24 MTPA of new receiving capacity in 2015. However, if the US is removed, global utilisation reached 39% in 2015. The United States’ imported LNG volumes in 2015 equated to just 1% of the country’s 129 MTPA capacity as the availability of domestic shale gas has led to a dramatic fall in US LNG imports.
Over the past few years, average peak send-out capacity at global regasification terminals has declined, from 12.2 bcm/yr (8.9 MTPA) in 2011 to 10.9 bcm/yr (7.9 MTPA) in 2015. This is largely a result of small to medium-sized terminals coming online in smaller markets, as well as the growing use of floating terminals, whose capacity is generally below 6 MTPA.
6.3. Receiving Terminal Capacity and Utilisation by Country The LNG market’s largest importer, both in terms of capacity and actual imports, continues to be Japan. The country comprises 26% of the world’s total regasification capacity in
2 Although these projects technically have binding agreements in place with FSRU providers, they are still considered as “Pre-FID” until on-site construction is confirmed.
3Including El Musel, Cameron, Golden Pass, Gulf LNG, and Lake Charles.
54.9 MTPA New receiving capacity
under-construction, Q1 2016
46
IGU World Gas LNG Report — 2016 Edition
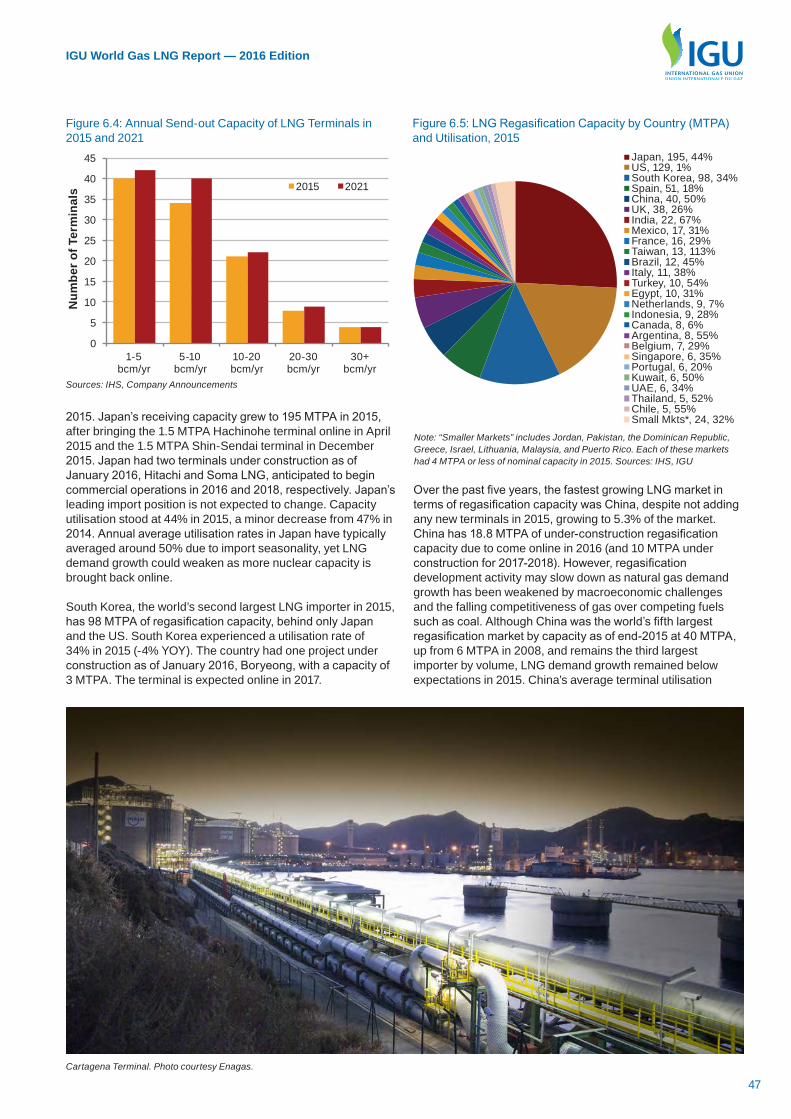
0
5
10
15
20
25
30
35
40
45
1-5bcm/yr
5-10bcm/yr
10-20bcm/yr
20-30bcm/yr
30+bcm/yr
Num
ber o
f Ter
min
als 2015 2021
Japan, 195, 44%US, 129, 1%South Korea, 98, 34%Spain, 51, 18%China, 40, 50%UK, 38, 26%India, 22, 67%Mexico, 17, 31%France, 16, 29%Taiwan, 13, 113%Brazil, 12, 45%Italy, 11, 38%Turkey, 10, 54%Egypt, 10, 31%Netherlands, 9, 7%Indonesia, 9, 28%Canada, 8, 6%Argentina, 8, 55%Belgium, 7, 29%Singapore, 6, 35%Portugal, 6, 20%Kuwait, 6, 50%UAE, 6, 34%Thailand, 5, 52%Chile, 5, 55%Small Mkts*, 24, 32%
Figure 6.4: Annual Send-out Capacity of LNG Terminals in 2015 and 2021
Figure 6.5: LNG Regasification Capacity by Country (MTPA) and Utilisation, 2015
Sources: IHS, Company Announcements
Note: “Smaller Markets” includes Jordan, Pakistan, the Dominican Republic, Greece, Israel, Lithuania, Malaysia, and Puerto Rico. Each of these markets had 4 MTPA or less of nominal capacity in 2015. Sources: IHS, IGU
2015. Japan’s receiving capacity grew to 195 MTPA in 2015, after bringing the 1.5 MTPA Hachinohe terminal online in April 2015 and the 1.5 MTPA Shin-Sendai terminal in December 2015. Japan had two terminals under construction as of January 2016, Hitachi and Soma LNG, anticipated to begin commercial operations in 2016 and 2018, respectively. Japan’s leading import position is not expected to change. Capacity utilisation stood at 44% in 2015, a minor decrease from 47% in 2014. Annual average utilisation rates in Japan have typically averaged around 50% due to import seasonality, yet LNG demand growth could weaken as more nuclear capacity is brought back online.
South Korea, the world’s second largest LNG importer in 2015, has 98 MTPA of regasification capacity, behind only Japan and the US. South Korea experienced a utilisation rate of 34% in 2015 (-4% YOY). The country had one project under construction as of January 2016, Boryeong, with a capacity of 3 MTPA. The terminal is expected online in 2017.
Over the past five years, the fastest growing LNG market in terms of regasification capacity was China, despite not adding any new terminals in 2015, growing to 5.3% of the market. China has 18.8 MTPA of under-construction regasification capacity due to come online in 2016 (and 10 MTPA under construction for 2017-2018). However, regasification development activity may slow down as natural gas demand growth has been weakened by macroeconomic challenges and the falling competitiveness of gas over competing fuels such as coal. Although China was the world’s fifth largest regasification market by capacity as of end-2015 at 40 MTPA, up from 6 MTPA in 2008, and remains the third largest importer by volume, LNG demand growth remained below expectations in 2015. China’s average terminal utilisation
Cartagena Terminal. Photo courtesy Enagas.
47
IGU World Gas LNG Report — 2016 Edition

steadied at 50% in 2015, falling 1% YOY from 2014. As a result of the high number of regasification projects coming online in 2016-2017, coupled with slowing demand growth, China’s regasification utilisation is expected to decline in this period.
India, forecasted to be a significant growth market for LNG imports, had 22 MTPA of regasification capacity as of January 2016. Although the country did not add any new terminals in 2015, it is reported to complete a 5 MTPA expansion project at the Dahej terminal and potentially add a 4.5 MTPA FSRU at Kakinada in end-2016. Indeed, India’s regasification capacity could reach as high as 100 MTPA by 2020 based on the number of announced project proposals. Eastern India requires additional supply since domestic upstream projects have been delayed considerably relative to expectations. However, there was consolidation in terms of the number of
terminals proposed in eastern India in 2015; a few proposals have been cancelled or consolidated with other projects. Despite this strong activity behind new regasification developments, new pipeline connections will be needed to maximize gas penetration in this part of the country. The lack of connectivity near the Kochi terminal has severely limited throughput thus far.
Utilisation rates have been low across Europe, reaching an average of only 25% in 2015 (+3% YOY), ranging between 7% and 54% by country. Despite holding 20% of global LNG import capacity, imports have been down in recent years as LNG has faced competition from pipeline gas, coal and renewables. However, European imports in 2015 grew significantly, as sustained low LNG prices are increasing Europe’s role as an LNG importing region, which could lead to higher utilisation
2014-2015 Receiving Terminals in Review
Receiving Capacity
+24 MTPAGrowth of
global LNG receiving capacity
Number of LNG Import Markets
+7Number of
new LNG import terminals
New LNG Importers
+3New
regasification markets
Offshore Terminals
+4Number of
new offshore LNG terminals
Regasification capacity grew by 24 MTPA (+3.3%), from 733.1 MTPA in 2014 to 757.1 MTPA in 2015.
New importers Egypt, Jordan and Pakistan led capacity growth in 2015.
New terminals in Indonesia and Japan (existing markets), and Egypt, Jordan and Pakistan (new importers) brought the total number of active regasification terminals from 101 to 108.
The number of LNG importing countries increased from 30 to 33 as Egypt, Pakistan and Jordan added new terminals. Poland is expected to begin commercial operations at its first terminal in early 2016.
Ghana, Colombia and the Philippines plan to bring their first regasification capacity online in 2016, though not all have reached official FID.
Two FSRUs were added in Egypt, along with one in Jordan and one in Pakistan in 2015, as four out of the seven new terminals that started commercial operations in 2015 were FSRUs.
FSRUs have offered a cost-effective solution to bring online regasification capacity quickly and potentially temporarily, making them an attractive option for new and less-mature import markets
0%
30%
60%
90%
120%
0
50
100
150
200
Egyp
tC
hina
Indi
aP
akis
tan
Japa
nKo
rea
Taiw
anIn
done
sia
Mal
aysi
aS
inga
pore
Thai
land
Phi
lippi
nes
Bel
gium
Fran
ceG
reec
eIta
lyP
ortu
gal
Spa
inTu
rkey UK
Lith
uani
aN
ethe
rland
sP
olan
dD
om. R
ep.
Pue
rto R
ico
Arg
entin
aB
razi
lC
olom
bia
Chi
leU
rugu
ayIs
rael
Jord
anK
uwai
tU
AE
Mex
ico
US
Can
ada
MTP
A
20152021Utilisation 2015 (right axis)
Latin America
Asia Europe
Middle East
Asia - Pacific
NorthAmerica
Afr
ica
Figure 6.6: Receiving Terminal Import Capacity and Utilisation Rate by Country in 2015 and 2021
Sources: IHS, IGU, Company Announcements
48
IGU World Gas LNG Report — 2016 Edition

levels. Yet with low utilisation rates at existing regasification terminals, Western Europe may not require significant amounts of new regasification capacity despite the expected increase in LNG imports. Indeed, out of the 10 existing LNG importing markets in Europe, only France is currently constructing a new regasification terminal. France’s 10 MTPA Dunkirk LNG terminal, set to reach commercial operations in 2016, will be one of the largest import terminals to come online in recent years. Still, new import markets, particularly in Southeast Europe, could continue to develop as countries attempt to diversify their natural gas supply away from pipeline imports, supported by the EU commission’s LNG strategy. In addition, Lithuania began LNG imports in 2014, and Poland received a commissioning cargo in December 2015 with commercial operations expected to commence in early 2016.
Behind Japan, the US still holds the second most regasification capacity in the world. However, the country’s terminals remain minimally utilised, if at all; the country averaged 1% utilisation in 2015. In fact, four regasification terminals in the US were completely unutilised in 2015. The prospect of ample, price-competitive domestic gas production means that this is unlikely to change going forward. Many terminal operators have focused on adding export liquefaction capacity to take advantage of the shale gas boom. Canada had one of the lowest utilisation levels in 2015 (6%), also due to the availability of domestic production. Taiwan (113%) and Puerto Rico (105%) registered the highest regasification terminal utilisation in 2015.
6.4. Receiving Terminal LNG Storage Capacity Global LNG storage capacity grew marginally in 2015 to 55 mmcm on the back of seven new terminals starting up over the course of the year. The average storage size for the 108 existing terminals worldwide is slightly under 500 mcm. The strategic importance of gas storage is set to grow, given the current market environment, particularly in Europe as US volumes come online.
Japan, 16.7, 30%Korea, 10, 18%China, 5.3, 10%United States, 4.8, 9%Spain, 3.8, 7%United Kingdom, 2.1, 4%India, 1.7, 3%Taiwan, 1.2, 2%Indonesia, 1, 2%Mexico, 0.9, 2%France, 0.8, 2%Singapore, 0.6, 1%Netherlands, 0.5, 1%Turkey, 0.5, 1%Chile, 0.5, 1%Italy, 0.5, 1%Canada, 0.5, 1%Brazil, 0.5, 1%Portugal, 0.4, 1%Belgium, 0.4, 1%Thailand, 0.3, 1%Smaller Markets*, 2.1, 4%
0
2
4
6
8
10
12
14
16
Africa Asia AsiaPacific
Europe LatinAmerica
MiddleEast
NorthAmerica
Num
ber
of T
erm
inal
s
ConventionalQ-FlexQ-Max
Figure 6.7: LNG Storage Tank Capacity by Country (mmcm) and % of Total, as of Q1 2016
Figure 6.8: Maximum Berthing Capacity of LNG Receiving Terminals by Region, 20154
Note: “Smaller Markets” includes Egypt, Pakistan, Jordan, Lithuania, Argentina, the Dominican Republic, Greece, Israel, Kuwait, Malaysia, Puerto Rico and the UAE. Each of these markets had 0.3 mmcm or less of capacity as of January 2016. Sources: IHS, Company Announcements Sources: IHS, Company Announcements
Many of the largest terminal LNG storage capacities are in Asia, where developers have prioritized LNG supply security and flexibility through greater storage capacity to manage seasonal demand cycles. Importers like China, Japan, India and South Korea also have little gas storage available outside of LNG terminals. Capacity at the 20 largest LNG storage terminals range from 0.5 to 3.3 mmcm and account for 44% of the world’s total. Fourteen of these terminals are located in South Korea and Japan. South Korea’s Samcheok LNG terminal, which started operations in the third quarter of 2014, is undergoing a storage expansion project to add to the 0.8 mmcm currently in operation. An additional 1.0 mmcm of storage is expected online by mid-2016. The final phase of the project, which is expected to be completed in 2017, will add another 0.8 mmcm in three tanks of 270,000 cm each – the world’s largest capacity for a single storage tank. The final capacity of Samcheok will be 2.62 mmcm.
Although LNG storage capacity in traditional countries continues to grow, particularly in Asia, emerging markets utilising FSRUs generally have lower storage capacity. Figures for floating projects usually stand between 125 to 170 mcm, compared to 200 to 600 mcm observed in most established onshore terminals. With a storage capacity of 263 mcm, Uruguay’s GNL del Plata FRSU – reported to come online in 2017 – will become the world’s largest FSRU to enter operations.
6.5. Receiving Terminal Berthing Capacity Ship berthing capacities at LNG terminals experienced two separate trends over the last few years, as observed with the evolution of LNG storage capacity. Newer importing countries, and those with lower-demand, generally have smaller berthing capacities, only capable of receiving conventional ships (under 200,000 cm capacity). More established markets with higher demand have worked to expand the berthing capacities of their terminals to accommodate Q-Class carriers with capacities over 217,000 cm.
Q-Max vessels, the largest of LNG carriers, have capacities of 261,700-266,000 cm. Fifteen different import markets (40 out of 108 existing regasification terminals) were known to be capable of receiving Q-Max ships as of January 2016. Twenty of these terminals were located in Asia and Asia Pacific, and none in Latin America, Africa or the Middle East.
4Terminals that can receive deliveries from more than one size of vessel are only included under the largest size that they can accept.
49
IGU World Gas LNG Report — 2016 Edition

Seventeen out of thirty-three import markets were confirmed to have at least one terminal capable of receiving Q-Class vessels. Notably, Taiwan, the world’s fifth largest LNG importer in 2015, is only able to receive conventional vessels. Of the 46 terminals that are reported to be limited to receive conventional vessels, 17 are FSRUs. Some terminals are capable of receiving even smaller LNG ships as small-scale LNG facilities continue to develop worldwide.
6.6. Receiving Terminals with Reloading and Transshipment Capabilities LNG re-exports developed as importers with access to sufficient piped natural gas were able to use LNG to capture arbitrage opportunities between basins. Additionally, re-exports have developed for logistical reasons. Spain continues to be the world’s largest re-exporter, owing to its insufficient connectivity with mainland Europe and available pipeline gas supply from North Africa. All seven of the country’s regasification terminals are equipped with re-export infrastructure. Out of 24 regasification terminals in Europe, 54% have re-export capabilities.
Three terminals re-exported cargoes for the first time in 2015, all from countries new to re-exports: Grain (UK), Kochi (India) and Singapore LNG. Additionally, China reloaded a cargo from its Zhuhai terminal, for delivery within the domestic
market. This brings the total number of terminals able to reload cargoes to 23 in 13 different countries.
Although three of the four new reloading countries in 2015 were located in Asia, non-European reloads remain limited, at only a few cargoes per year. For example, South Korea’s Gwangyang terminal, which has had reloading capacity since 2013, re-exported only four cargoes in 2015. Other facilities, such as Cove Point in the US or Canaport in Canada, have been authorized to re-export, but decided not to pursue this option as they have instead focused on adding liquefaction capacity.
Some regasification terminals that have two jetties, such as the Montoir-de-Bretagne (France) terminal, can complete direct transhipments and bunkering services. GATE LNG in the Netherlands has also been offering this functionality since the second half of 2015 (for ships as small as 5,000 cm).
Beyond the ship unloading and reloading capabilities, several terminals have also added truck loading capabilities, such as the Isle of Grain terminal, since the summer of 2015. LNG continues to grow as a transportation fuel and LNG consumption has increased on a small-scale basis for consumers in remote areas or not connected to the main pipeline infrastructure. For more information on this topic, see the 2015 edition of the IGU World LNG Report.
Table 6.1: Regasification Terminals with Reloading Capabilities in 2015
Country Terminal Reloading Capability
Storage (mcm)
No. of Jetties
Start of Re-Exports
Belgium Zeebrugge 4-5 mcm/h 380 1 2008Brazil Rio de Janeiro 10.0 mcm/h 171 2 2011Brazil Bahia Blanca 5 mcm/h 136 1 N/ABrazil Pecém 10 mcm/h 127 2 N/AFrance FosMax LNG 4.0 mcm/h 330 1 2012France Montoir 5.0 mcm/h 360 2 2012India Kochi N/A 320 1 2015Mexico Costa Azul N/A 320 1 2011Netherlands GATE LNG 10 mcm/h 540 2 2013Portugal Sines 3.0 mcm/h 390 1 2012Singapore Singapore LNG 8.0 mcm/h 540 2 2015S. Korea Gwangyang N/A 530 1 2013Spain Cartagena 3.5 mcm/h 587 2 2011Spain Huelva 3.7 mcm/h 620 1 2011Spain Mugardos 2.0 mcm/h 300 1 2011Spain Barcelona 3.5 mcm/h 760 2 2014Spain Bilbao 3.0 mcm/h 450 1 2015Spain Sagunto 6.0 mcm/h 300 1 2013Spain El Musel 6.0 mcm/h 300 1 N/AUK Isle of Grain Ship-dependent 960 1 2015USA Freeport 2.5 mcm/h* 320 1 2010USA Sabine Pass 1.5 mcm/h* 800 2 2010USA Cameron 0.9 mcm/h* 480 1 2011
*Reloading capacity permitted by the US DOE. Sources: IHS, IGU
50
IGU World Gas LNG Report — 2016 Edition

6.7. Comparison of Floating and Onshore Regasification While onshore terminals continue to be developed, particularly in established LNG markets, FSRUs have been the most common pathway for new markets to enter the LNG market recently. Egypt, Jordan and Pakistan joined the ranks of LNG importing countries in 2015 via the commissioning of FSRUs. Fourteen out of 33 current import markets had floating capacity as of January 2016. Five of these 14 had onshore capacity as well. In 2016, three FSRU projects have already selected an FSRU contractor and plan to come online, totaling 12.3 MTPA (in Colombia and Ghana, both new LNG markets, and Puerto Rico). A number of other projects have been proposed for 2016, including in India and Egypt. Furthermore, multiple FSRUs have been announced for 2017, particularly in Bangladesh, Benin and Uruguay, all of which would be new import markets if the terminals were to come online. Nevertheless, there are still several new importers, such as Croatia, Panama and Morocco, which plan to enter the LNG market using onshore proposals in order to establish a more permanent solution for gas imports.
Four new FSRUs began operations in 2015: Pakistan’s Engro LNG in May, Jordan’s Aqaba LNG in June and Egypt’s Ain Sokhna Hoegh and Ain Sokhna BW in May and October, respectively. Moreover, one other terminal completed an expansion of floating capacity: a larger FSRU replaced a smaller unit at the Dubai LNG terminal in UAE. At the end of January 2016, total active floating import capacity stood at 77 MTPA at 20 terminals.
There are several advantages for implementing floating regasification in comparison to onshore projects. FSRUs allow for more rapid fuel switching, as projects can often be brought online faster than an onshore option. Furthermore, these projects are typically less expensive (see Section 6.8. for further information). Without the need to construct significant onshore facilities, floating solutions in many cases offer greater flexibility when there are either space constraints
0
5
10
15
20
25
30
35
40
2000
2001
2002
2003
2004
2005
2006
2007
2008
2009
2010
2011
2012
2013
2014
2015
2016
2017
2018
2019
2020
2021
Num
ber o
f Cou
ntri
es
Onshore-only importersBoth onshore & FSRUFSRU-only importers
Forecast
0
5
10
15
20
25
0102030405060708090
100
2005
2006
2007
2008
2009
2010
2011
2012
2013
2014
2015
2016
2017
2018
2019
2020
2021
MTP
A
FID
Existing
Total chartered FloatingTerminals (right)
Forecast
Figure 6.9: Rise of FSRUs among Import Markets, 2000-2021 Figure 6.10: Floating Regasification Capacity by Status and Number of Terminals, 2005-2021
Note: The above graph only includes importing countries that had existing or under construction LNG import capacity as of end-2015. Owing to short construction timelines for regasification terminals, additional projects that have not yet been sanctioned may still come online in the forecast period, as indicated by the diagonal bars. The decline in number of countries at the end of the forecast period is the result of short FSRU contract expirations. Sources: IHS, Company Announcements
Note: The above forecast only includes floating capacity sanctioned as of end-2015. Owing to short construction timelines for FSRUs, additional projects that have not yet been sanctioned may still come online in the forecast period, as indicated by the diagonal bars. The decline in number of chartered floating terminals at the end of the forecast period is the result of short FSRU contract expirations. Sources: IHS, Company Announcements
onshore or no suitable ports. FSRU vessels can also be linked to an offshore buoy that connects into a subsea gas pipeline system and can therefore operate further offshore than conventional terminals. Additional advantages include a possibly easier and shorter permitting process, as well as much lower CAPEX as FSRUs are normally chartered from a third party. However, onshore terminals offer a number of benefits as well, such as providing significantly more storage capacity, which could be strategically important given the current market environment.
On the other hand, FSRUs face potential risks related to the terminal’s operability, including vessel performance, heavy seas or meteorological conditions, and a longer LNG deliverability downtime. There are also limitations in terms of both send-out and storage capacity, which for FSRUs are typically much lower than for larger onshore facilities – and can thus create impediments and limitations for onloading operations. In addition, despite generally lower capital expenditure, operating expenditure can be significantly greater, simply because of the vessel’s time charter assigned to the project.
Table 6.2: Onshore Regasification Terminals and FSRUs
Onshore Terminals FSRUsProvides a more permanent solution
Allows for quicker fuel switching
Offers longer-term supply security
Greater flexibility if there are space constraints or no useable ports
Greater gas storage capacity Capable of operating further offshore
Generally requires lower operating expenditures (OPEX)
Generally requires less CAPEX
Option for future expansions Less land regulations
51
IGU World Gas LNG Report — 2016 Edition

Floating terminals can be separated into two functional groups based on engine capability. The first FSRUs came in the form of converted old vessels with limited propulsion that are permanently moored and act as long-term regasification terminals. Other floating terminals are mobile vessels which can be contracted for short periods. These FSRUs can function as standard LNG carriers when not under contract, and also have the possibility to come to a port loaded and stay only for the time required to regasify their cargo.
As of January 2016, eight FSRUs (greater than 60,000 cubic meters) were in the orderbook. However, there are only a few existing FSRUs that could become available in the near term, including the sub-charter from Dubai LNG (the Golar Freeze) and the Golar Tundra, though this is earmarked for Ghana. Excelerate typically keeps one of its vessels in order to support its trading activities; however, its only open vessel may be sent to Puerto Rico’s under-development floating terminal, Aguirre GasPort. Based on the limited immediate availability of FSRUs, significant near-term expansions in regasification capacity via FSRU employment beyond what is already delivered and on order is limited through mid-2017. Given the near-term limitations, shipping companies have been open to ordering newbuild FSRUs and converting existing conventional vessels on a speculative basis, underlining the perceived importance of FSRUs in supporting new markets enter the LNG market in the long term.
6.8. Project Capex CAPEX for regasification terminals typically consists of costs associated with vessel berthing, storage tanks, regasification equipment, send-out pipelines and metering of new facilities. Between 2006 and 2012, CAPEX for new regasification capacity remained fairly steady. However, CAPEX costs have increased significantly since this time, nearly doubling for onshore terminals. Floating projects experienced a large jump in CAPEX costs in 2009 and 2010 as the active number of floating terminals increased from four to ten, a few of which were capital intensive projects.
In 2015, the weighted average unit cost of onshore regasification capacity that came online during the year was $245/tonne (based on a three-year moving average). While this value is somewhat lower than the 2014 average
($276/tonne)5, it was still significantly higher than the average for onshore regasification terminals between 2006 and 2012 ($115/tonne). The rise in onshore regasification costs is closely associated with the trend of increased LNG storage capacity. As countries – mainly in high-demand regions like Asia and Asia Pacific – add larger storage tanks to allow for higher imports and greater supply stability, the storage capacity size per unit of regasification capacity has increased. However, several new onshore terminals with smaller storage units are expected online in 2016 and 2017, bringing down overall costs. CAPEX for onshore capacity under construction are set to fall to $235/tonne in 2016 and $172/tonne in 2017. However, a number of proposed projects that may soon reach construction milestones have higher CAPEX, which could ultimately bring these averages higher.
CAPEX for floating terminals are considerably lower than onshore facilities simply owing to the limited infrastructure developments involved in bringing an FSRU online. Furthermore, project developers consider the vessel charter as an OPEX instead of including it in CAPEX. It is generally accepted that OPEX for FSRUs is higher than for onshore terminals.
New floating terminals’ CAPEX have remained roughly steady over the past three years, declining from a high of $153/tonne in 2011. In 2015, the weighted average unit cost of floating regasification based on a three-year moving average was $109/tonne. As of January 2016, there were no FSRUs considered to be under construction, but three of the five forthcoming FSRU projects that have selected an FSRU provider have notably high CAPEX, particularly the Uruguay and Chile proposals, indicating that average FSRU costs
BBG Terminal (Bilbao). Photo courtesy Enagas.
5Revised from the 2015 edition of the IGU World LNG Report
$245/tonne Average costs of
new onshore LNG import capacity
in 2015
52
IGU World Gas LNG Report — 2016 Edition

0
20
40
60
80
100
120
0
50
100
150
200
250
300
2005 2007 2009 2011 2013 2015
Stor
age/
mm
cm o
f cap
acity
$/to
nne
Onshore Floating Onshore Storage/Capacity
Figure 6.11: Regasification Costs Based on Project Start Dates, 2005-2015
*Indicates the size of onshore storage relative to onshore terminal capacity. Sources: IHS, Company Announcements
could be rising moving forward. As with onshore terminals, larger vessels – and thus greater storage and send-out capacity – have accompanied higher CAPEX. Still, overall CAPEX for floating terminals are generally less volatile than for onshore facilities, which is partly a reflection of fewer variations in capacity and storage size for vessel-based terminal solutions.
6.9. Risks to Project DevelopmentRegasification projects face a number of risks throughout the development process, albeit generally on a smaller scale in comparison to the challenges of liquefaction plants. Particularly with FSRUs, new regasification projects can reach commercial operations without substantial land-based construction and at a significantly faster pace. However, developers of regasification terminals still must deal with factors that can obstruct or delay the successful implementation of planning and construction schedules, similar to those that typically affect liquefaction projects. This includes:
y Project and equity financing, which are required for terminal plans to advance. Bangladesh’s Petrobangla FSRU project has faced multiple delays, largely due to financing challenges given the country’s low sovereign credit rating. The latest announcement indicated a 2017 target start date for commercial operations.
y Permitting, approval and fiscal regime. New regasification terminals can face significant delays in countries with complicated government approval processes or lengthy permit authorization periods. The Port Ambrose floating regasification project, proposed for offshore US, experienced numerous regulatory delays and was stalled indefinitely in November 2015 after the Governor of New York vetoed the project.
y Challenging conditions in the surrounding environment could lead to delays or cancellations of regasification projects. A floating terminal was cancelled in South Africa in 2014 following FEED studies indicating intricate met-ocean conditions in Mossel Bay.
y Reliability and liquidity of contractors and engineering firms during the construction process. Uruguay’s FSRU project, the first for the country, was initially set to come online in late 2015. However, the project has encountered challenges stemming from financial issues plaguing the Brazilian contractor chosen to construct the project, pushing the target start date back multiple times. The latest announced start date is in 2017.
y Securing long-term regasification and offtake contracts with terminal capacity holders and downstream consumers, particularly as the market shifts toward shorter-term contracting. As of January 2016, Lithuania’s Klaipeda LNG has booked only 0.4 MTPA of the terminal’s 3 MTPA capacity; securing offtake from domestic consumers has been challenging since LNG faces competition from oil-linked Russian pipeline imports. The terminal has been under-utilised, and as a result, its owners were seeking to reduce operation costs and secure re-export capabilities. For the development of new terminals, political support could be needed if long-term commitments are not secured.
y Associated terminal and downstream infrastructure including pipelines or power plant construction required to connect a terminal with end-users, which are often separate infrastructure projects that are not planned and executed by the terminal owners themselves. The Penco Lirquen FSRU planned for Chile in 2018 could have a slow ramp-up as the project waits for the completion of a new gas-fired power plant and associated infrastructure to absorb the imported volumes. The Kochi terminal in India continues to limit receiving capabilities due to the lack of completed pipeline connections to downstream users.
Looking AheadWill the majority of new regasification markets continue to be emerging markets? Egypt, Jordan and Pakistan joined the ranks of LNG import markets in 2015 by adding FSRUs in a relatively short period of time, fast-tracked by the prospects of low LNG prices. Despite recent capacity additions and proposals from established gas markets, such as Lithuania, Poland, and Croatia, the majority of expected new LNG importers continue to be emerging markets. Indeed, Colombia, Ghana, Panama, the Philippines and Uruguay all have projects in advanced phases of development. Further down the road, Bangladesh, Bahrain, Benin, Myanmar, Morocco and Ukraine all have proposals for regasification capacity in the medium to long term.
Will the recent growth in floating regasification capacity continue to gain momentum? Egypt, Jordan and Pakistan became LNG importers in 2015 through floating regasification, and of the seven countries with proposed projects to become new importers in 2016-2017, five will have an FSRU as their first import terminal. While it is clear that FSRUs have played a vital role in bringing new countries to the global LNG markets, floating terminals also face constraints: their storage and berthing capacity is generally much lower than that of onshore facilities and OPEX are much higher because of the time charter vessel. As nascent LNG markets mature, they may ultimately seek to move to onshore solutions. In spite of this, demand for floating regasification capacity will persist, particularly for countries in emerging markets securing LNG for the first time.
53
IGU World Gas LNG Report — 2016 Edition

Note: Terminal numbers correspond to Appendix III: Table of LNG Receiving Terminals. Source: IHS
Figure 6.12: Global LNG Receiving Terminal Locations
54
IGU World Gas LNG Report — 2016 Edition

55
IGU World Gas LNG Report — 2016 Edition

7. The LNG Industry in Years AheadWhat factors will impact short-term LNG activity? With gas price benchmarks around the world facing pressure, supply-demand fundamentals will continue to adjust. Globally, macroeconomic decline has impacted most importing countries, reducing the need for energy, including natural gas. In particular, buyers in northeast Asia are finding that they are overcommitted in terms of contracted LNG relative to demand. Several emerging market countries demonstrated a healthy appetite for LNG as short-term prices collapsed in 2015, which partially offset the imbalance caused by weaker-than-anticipated Northeast Asian LNG demand. However, these new importers are less established as buyers and are not likely to have sufficient growth to offset the imbalance.
Another key determinant of buyers’ response to low gas prices is inter-fuel competition with coal, and to some extent oil. Low oil prices have resulted in low oil-linked LNG contract prices. However, despite lower LNG prices, countries that use oil products and coal in power and industry may be slower to substitute for gas.
Given current LNG price levels, suppliers will face lower revenue generation than in the recent past. The gradual trend toward more flexible trade arrangements, coupled with the supply-demand imbalance, means that variable cost may be the price setting mechanism in the short-term market. Contract prices may see a dislocation to this level if Brent and/or Henry Hub, as the key indices, see appreciation. These are key contracting considerations of both buyers and sellers.
Will under-construction projects stay the course? Most under-construction projects remain active toward planned schedules. There are four key reasons:
y Many project builders – the engineering, construction, and procurement contractors – have committed to construction schedules and could incur a penalty if they are late.
y Similarly, many projects have coordinated upstream feedstock arrangements that would incur higher costs or take-or-pay penalties if production is not received.
y The sponsors of new projects are eager to start generating cash flow to start recovery of large capital outlays. New projects have the signal to produce so long as the price is above variable cost, even if they do not achieve full cost recovery.
y LNG project owners have a long-term time horizon when viewing an asset’s performance. Near-term revenue challenges might put pressure on operators, but should be viewed in the context of a 20-30 year project life.
However, there could be some setbacks to timely start-up due to technical issues. More broadly, failure of any single project to meet its scheduled start-up would not fundamentally alter the supply-demand imbalance.
How will trade optimization evolve in 2016? The world’s short-term gas price benchmarks all fell substantially in 2015, shaping cross-basin LNG trade. The entry of new Australian capacity in 2015 has put downward pressure on Asian short-term LNG demand as more Asian customers are meeting their portfolios with newly online contracted supply. This trend will continue in 2016 with the commercial start-up of APLNG and Gorgon LNG, as well as the continued ramp-up of GLNG. Atlantic Basin and Middle East cargoes that had been moving east to meet this Asian demand in recent years will have more incentive to remain in the Atlantic Basin, which among other factors will contribute to European hub price formation.
56
IGU World Gas LNG Report — 2016 Edition

1This analysis is based on a grouping of Shell, BG Group, BP, TOTAL, ENGIE, Gas Natural Fenosa, and Gazprom.
While this paints a picture of partitioned LNG markets in the Atlantic and Pacific basins, there are some notable trends that could make this trade balance more uncertain. First, if Henry Hub stays at current low levels, some US LNG sales to Asia may become attractive, especially under sunk cost treatment of capacity.
Second, LNG portfolio players, and to a lesser degree traders, will be forced to bring in supply from their respective portfolios in another basin to meet contractual end-market obligations. For the largest portfolio players in 2016, 60% of their contracted supply is sourced from Atlantic Basin producers, but 60% of their re-contracted volumes are with Asian buyers (and this rises to 75% if Middle Eastern buyers are also included).1 To optimize shipping costs, market participants are more actively engaging in cross-basin swap agreements, minimizing long-haul physical flows.
How will Europe’s role in the LNG market evolve? European LNG imports are poised for a second year of growth following three years of declines from 2011 to 2014. Europe’s role as a key backstop for excess cargoes in the global LNG market is likely to expand as other consuming regions are unable to absorb new demand as quickly as supply is being added.
The introduction of US LNG in 2016 marks the launch of another supply source for Europe given that the Pacific Basin is better balanced in the second part of this decade, and US LNG is regarded as highly flexible. Reaction by established pipeline gas and LNG suppliers to Europe will be of interest. Will supply continue to flow at unhindered rates, or will a low price see reduced deliveries? Will gas demand rebound due to low prices?
EU policy formation regards energy security as a cornerstone and is expected to call on more gas and LNG. New policies by the European Commission regarding “Security of Gas Supply Regulation” and “Strategy for Liquefied Natural Gas and Storage,” will address the role of LNG in helping to meet EU energy security. The final strategy document is anticipated to call on expanded use of LNG, particularly in eastern and southern Europe, where markets are less diversified, to promote a more liquid gas market. This may require new import terminals, pipeline connections and a diversified portfolio of sellers.
Preparing for the influx of LNG into the market, several European utilities and aggregators sought direct and re-contracted volumes from US LNG offtakers in 2015 to lock in expected deliveries for the upcoming years.
Will there be any new liquefaction FIDs? What types of projects might be able to move forward? Low prices and weak demand have caused buyers to take a wait-and-see approach to long-term contracts, which does not bode well for reaching FID at new, large-scale LNG projects. Historically, having contracts for the majority of the project’s capacity was a pre-requisite to reach FID. Under the current supply-demand imbalance, this continues to be very important to project developers.
In the current environment, the largest LNG consumers appear to be over-committed with several new contracts ramping
up and are thus not aggressively searching for new contract positions. In recent years, the most attractive supply source has been the United States, owing to the economics of Henry Hub-based pricing. However this commercial impetus has significantly faded now that US LNG is not as cheap as most oil-indexed supply. Thus US FIDs are unlikely to occur at the same pace as in 2015. Three US projects – Freeport LNG T3, Sabine Pass LNG T5, and Corpus Christi LNG T1-2 – reached FID earlier in 2015, but these were well advanced, with marketing arrangements locked in before the fall in oil prices began in November 2014. While there are several projects that are relatively advanced in the regulatory queue, offtake obligations have yet to be finalized.
In Canada, Pacific Northwest LNG reached conditional FID in 2015 and may reach full FID in 2016 pending the clearance of all remaining regulatory permits. Cameroon FLNG took FID in 2015 as a relatively low-cost development based on a tanker conversion. The projects that proceed will be cost competitive and likely to have committed buyers.
Will Northeast Asian LNG demand recover? Japan and South Korea, the world’s two largest consumers of LNG, reduced their imports by 7 MT in 2015. This decline offset all growth from the rest of the Pacific Basin, leading to the first year-on-year fall in Asian LNG demand since the 2009 recession. How these major markets develop in 2016 is critical not only for short-term oversupply, but also for LNG project seeking long-term contracts to underpin new developments. Overall, it appears unlikely that demand in this region will fully recover in the near term.
Japanese buyers face great uncertainty in assessing their LNG needs, even just a few months ahead. While uncertainty about the nuclear power plant re-starts depends greatly on regulatory and legislative issues, weakening electricity consumption growth remains a chief structural threat to LNG demand in the years to come. Japan is increasingly focused on improving energy efficiency. The LNG demand loss is also due to weak manufacturing growth. Moreover, solar power continues to expand, both displacing thermal generation and bringing intermittency factors. In response to the near-term LNG oversupply in the Japanese market, buyers have begun re-selling LNG volumes both domestically and internationally to reduce their individual exposure.
Following rapid growth through 2013, expectations for South Korea’s LNG demand have been reset. The Ministry of Trade, Industry and Energy’s 7th Basic Plan for Long-term Electricity Supply and Demand, published in July 2015, confirmed the favoured role of coal in meeting incremental electricity needs over the next five years. Around 7–8 GW of new coal capacity is due to come online by the end of 2016. With power consumption growth below expectations, and high nuclear availability, utilization of gas-fired generation plants is expected to continue to fall. In addition, economic growth has slowed more than anticipated, further impacting overall power demand. These factors suggest that the decline in South Korea’s LNG imports in 2015 is unlikely to be reversed over the next decade.
Taiwan provides a bright spot for LNG demand in Northeast Asia – but not enough to offset the weak outlook for Japan
57
IGU World Gas LNG Report — 2016 Edition

and South Korea. With less reliance on nuclear power, Taiwan plans LNG imports to drive power sector growth. Imports increased in 2015 with further plans to increase short and medium-term buying activity in light of opportunistic market conditions for relatively cheap LNG.
How are China and India responding to the LNG oversupply? LNG contract ramp up are already in full swing for China. However this occurs at a time when natural gas demand growth has been significantly weakened by broad macroeconomic challenges as well as reforms that have increased local gas prices. As a result, the NOC buyers will need to employ several different strategies to minimise their exposure to potentially large financial losses if enough local demand cannot be created. In response, the National Development and Reform Council (NDRC) has already lowered domestic wholesale prices to incentivise demand.
y In 2015, the most effective tactic was working with existing suppliers to adjust contract terms. Already, Chinese NOCs have been successful in delaying delivery to later points in the year – particularly pushing summer deliveries to the winter months.
y Companies have also resorted to selling LNG on the international market. The profitability of doing this in 2016 with a weak spot price may not be as attractive and would not do much to minimise losses.
y The Chinese NOCs are also able to optimise between domestic supplies in their home market. The domestic gas producers have reportedly limited production at several major conventional fields in the past year. In terms of pipeline imports, China imported noticeably less from its Central Asian suppliers. However, there are contractual and financing terms that will prevent such extreme deferments from occurring consistently in the future.
India’s LNG demand has fared relatively well despite general economic weakness in Asia. The underutilised gas-fired power sector saw much improved performance in 2015 on the back of subsidies for LNG imports. Although how long this can be sustained is a major uncertainty. Nevertheless, in a low short-term price environment, Indian consumers have absorbed additional volumes from the global LNG market.
Will the LNG shipping market begin to recover? Little relief to the oversupplied LNG shipping market is expected in 2016 with the growth in new LNG supply from Australia. These new volumes will target mostly Asian buyers and are likely to decrease the average global delivery route. One counter-argument – though less likely – is the idea that buyers and portfolio players seeking to divert cargoes due to weak demand, could cause average distances to increase in search of a new buyer in farther markets. Nevertheless, more collaboration between parties is starting to increase shipping efficiency, which decreases shipping demand. Also, 2016 will see 48 vessel deliveries, 40 on charter and 8 available for employment – which would tie the largest number ever delivered (in 2008) – are the largest harbinger of continued low day-rates.
Recovery might come through continued deceleration of new vessel orders and the large ramp-up of US volumes, which requires more shipping tonnage per ton of LNG delivered because of the longer distance from markets. However, these factors are not expected to outweigh the large number of ship deliveries through the second half of 2017. In the meantime, some vessels could be used for alternative uses such as FSRU conversions and floating storage.
How much more regasification capacity is needed globally? Three key factors will promote new regasification terminals around the world. First, the growth of new flexible liquefaction capacity mainly from the United States adds to an abundance of uncommitted supply that could find delivery in previously under-served markets. Second, the growth in global liquefaction capacity will put downward pressure on prices making LNG imports more affordable not only for emerging markets, but also for new industries and regions in mature markets. Lastly, for countries that have short-term visibility in terms of their own natural gas demand requirements, FSRUs could be quickly procured to provide import capacity for as little or as long as needed. One possible limitation on how much new capacity is actually brought online is potentially higher credit risks in emerging markets. In any case, emerging markets will play an increasing role in development of new regasification capacity.
58
IGU World Gas LNG Report — 2016 Edition
8. References Used in the 2016 Edition
8.1. Data CollectionData in the 2016 World LNG Report is sourced from a variety of public and private domains, including the BP Statistical Review of World Energy, Cedigaz, the International Energy Agency (IEA), the Oxford Institute for Energy Studies (OIES), the US Energy Information Agency (EIA), the US Department of Energy (DOE), GIIGNL, IHS, company reports and announcements. This report should be read in conjunction with the 2014 and 2015 World LNG Reports, available on the IGU website at www.igu.org.
The data and associated comments have been reviewed and verified by IGU.
The IGU wishes to thank the following organisations for providing their expert staff to be a member of the Task Force which has been entrusted to oversee the preparation and publication of this report:
y Chevron, USA y American Gas Association (AGA), USA y Enagas, Spain y TOTAL, France y Osaka Gas, Japan y RasGas, Qatar y Anadarko, USA y Bureau Veritas, France y GIIGNL, France
8.2. DefinitionsBrownfield Liquefaction Project: A land-based LNG project at a site with existing LNG infrastructure, including but not limited to storage tanks, liquefaction facilities and regasification facilities.
Forecasted Data: Forecasted liquefaction and regasification capacity data only takes into account existing and under construction capacity (criteria being FID taken), and is based on publically announced start dates.
Greenfield Liquefaction Project: A land-based LNG project at a site where no previous LNG infrastructure has been developed.
Large-Scale vs. Small-Scale LNG: IGU defines the large-scale LNG industry as every LNG business above 1 MTPA of LNG production and/or consumption. Conversely, small-scale LNG is any business under 1 MTPA.
Liquefaction and Regasification Capacity: Unless otherwise noted, liquefaction and regasification capacity throughout the document refers to nominal capacity. It must
be noted that re-loading and storage activity can significantly reduce the effective capacity available for regasification.
LNG Carriers: For the purposes of this report, only Q-Class and conventional LNG vessels with a capacity greater than 30,000 cm are considered part of the global fleet discussed in the “LNG Carriers” chapter (Chapter 5). Vessels with a capacity of under 30,000 cm are considered small-scale LNG carriers.
Northeast Asian Spot Prices: Northeast Asian spot prices are calculated based on the observed average price for spot cargoes imported into Japan and South Korea in a given month.
Project CAPEX: Liquefaction plant CAPEX figures reflect the complete cost of building the facilities, including site preparation, gas processing, liquefaction, LNG storage and other related infrastructure costs. Regasification terminal CAPEX figures are based on company announcements and may therefore only include selected infrastructure components.
Short-term, Medium-term and Long-term Trade: y Short-term trade = volumes traded on a spot basis or under contracts of less than 2 years
y Medium-term trade = volumes traded under a 2 to <5 year contract
y Long-term trade = volumes traded under a 5+ year contract
Traded LNG Volumes: Trade figures are measured according to the volume of LNG imported at the regasification level. Only international trade is taken into account. Domestic LNG trade in Indonesia is thus excluded from the global figures.
8.3. Regions and BasinsThe IGU regions referred to throughout the report are defined as per the colour coded areas in the map on the next page. The report also refers to three basins: Atlantic, Pacific and Middle East. The Atlantic Basin encompasses all countries that border the Atlantic Ocean or Mediterranean Sea, while the Pacific Basin refers to all countries bordering the Pacific and Indian Oceans. However, these two categories do not include the following countries, which have been differentiated to compose the Middle East Basin: Bahrain, Iran, Iraq, Israel, Jordan, Kuwait, Oman, Qatar, UAE and Yemen. IGU has also taken into account countries with liquefaction or regasification activities in multiple basins and has adjusted the data accordingly.
59
IGU World Gas LNG Report — 2016 Edition

Short-term trade = volumes traded on a spot basis or under contracts of less than 2 years
Medium-term trade = volumes traded under a 2 to <5 year contract
Long-term trade = volumes traded under a 5+ year contract
Traded LNG Volumes: Trade figures are measured according to the volume of LNG imported at the regasification level. Only international trade is taken into account. Domestic LNG trade in Indonesia is thus excluded from the global figures.
8.3. REGIONS AND BASINS
The IGU regions referred to throughout the report are defined as per the colour coded areas in the map above. The report also refers to three basins: Atlantic, Pacific and Middle East. The Atlantic Basin encompasses all countries that border the Atlantic Ocean or Mediterranean Sea, while the Pacific Basin refers to all countries bordering the Pacific and Indian Oceans. However, these two categories do not include the following countries, which have been differentiated to compose the Middle East Basin: Bahrain, Iran, Iraq, Israel, Jordan, Kuwait, Oman, Qatar, UAE and Yemen. IGU has also taken into account countries with liquefaction or regasification activities in multiple basins and has adjusted the data accordingly.
8.4. ACRONYMS
BOG = Boil-Off Gas BOR = Boil-Off Rate CBM = Coalbed methane DFDE = Dual-Fuel Diesel Electric LNG vessel EPC = Engineering, Procurement and Construction FEED = Front-End Engineering and Design FERC = Federal Energy Regulatory Commission FID = Final Investment Decision FOB = Free On Board FTA = Free-Trade Agreement FLNG = Floating Liquefaction FSRU = Floating Storage and Regasification Unit FSU = Former Soviet Union GHG = Greenhouse gas ISO = International Standards Organization
LCA = Life Cycle Assessment LCI = Life Cycle Inventory ME-GI = M-type, Electronically Controlled, Gas Injection PCA = Panama Canal Authority PNG = Papua New Guinea SPA = Sales and Purchase Agreement SSD = Slow Speed Diesel SSLNG = Small-scale LNG TFDE = Tri-Fuel Diesel Electric LNG vessel UAE = United Arab Emirates UK = United Kingdom US = United States US DOE = US Department of Energy US Lower 48 = United States excluding Alaska and Hawaii YOY = Year-on-Year
8.5. UNITS
MT = million tonnes MTPA = million tonnes per annum KTPA = thousand tonnes per annum
Africa
North America
Latin America
Europe
Former Soviet Union
Asia
Asia Pacific
Middle East
8.3 Regions and Basins
8.4. Acronyms BOG = Boil-Off Gas BOR = Boil-Off RateCBM = Coalbed methaneDFDE = Dual-Fuel Diesel Electric LNG vesselEPC = Engineering, Procurement and Construction FEED = Front-End Engineering and Design FERC = Federal Energy Regulatory CommissionFID = Final Investment DecisionFOB = Free On BoardFTA = Free-Trade Agreement FLNG = Floating LiquefactionFSRU = Floating Storage and Regasification UnitFSU = Former Soviet Union GHG = Greenhouse gasISO = International Standards Organization
LCA = Life Cycle AssessmentLCI = Life Cycle InventoryME-GI = M-type, Electronically Controlled, Gas Injection PCA = Panama Canal AuthorityPNG = Papua New GuineaSPA = Sales and Purchase Agreement SSD = Slow Speed DieselSSLNG = Small-scale LNG TFDE = Tri-Fuel Diesel Electric LNG vesselUAE = United Arab EmiratesUK = United KingdomUS = United StatesUS DOE = US Department of Energy US Lower 48 = United States excluding Alaska and Hawaii YOY = Year-on-Year
8.5. Units Bcfd = billion cubic feet per daybcm = billion cubic meterscm = cubic metersKTPA = thousand tonnes per annummcm = thousand cubic meters
MMBtu = million British thermal units mmcm = million cubic meters MT = million tonnesMTPA = million tonnes per annumTcf = trillion cubic feet
8.6. Conversion Factors
Tonnes LNG cm LNG cm gas cf gas MMBtu boeTonnes LNG 2.222 1,300 45,909 53.38 9.203cm LNG 0.450 585 20,659 24.02 4.141cm gas 7.692 x 10⁻⁴ 0.0017 35.31 0.0411 0.0071cf gas 2.178 x 10⁻⁵ 4.8 x 10⁻⁵ 0.0283 0.0012 2.005 x 10⁻⁴MMBtu 0.0187 0.0416 24.36 860.1 0.1724boe 0.1087 0.2415 141.3 4,989 5.8
Multiply by
60
IGU World Gas LNG Report — 2016 Edition

Appendix 1: Table of Global Liquefaction Plants
Reference Number
Country Project Name Start Year Nameplate Capacity (MTPA)
Owners* Liquefaction Technology
1 US Kenai LNG** 1969 1.5 ConocoPhillips ConocoPhillips Optimized Cascade®
2 Libya Marsa El Brega*** 1970 3.2 LNOC APC C3MR3 Brunei Brunei LNG T1-5 1972 7.2 Government of Brunei, Shell,
MitsubishiAPC C3MR
4 United Arab Emirates
ADGAS LNG T1-2
1977 2.6 ADNOC, Mitsui, BP, TOTAL APC C3MR
5 Algeria Arzew - GL1Z (T1-6)
1978 7.9 Sonatrach APC C3MR
5 Algeria Arzew - GL2Z (T1-6)
1981 8.2 Sonatrach APC C3MR
6 Indonesia Bontang LNG T3-4
1983 5.4 Pertamina APC C3MR
7 Malaysia MLNG Satu (T1-3)
1983 8.1 PETRONAS, Mitsubishi, Sarawak State Government
APC C3MR
8 Australia North West Shelf T1
1989 2.5 BHP Billiton, BP, Chevron, Shell, Woodside, Mitsubishi,
Mitsui
APC C3MR
8 Australia North West Shelf T2
1989 2.5 BHP Billiton, BP, Chevron, Shell, Woodside, Mitsubishi,
Mitsui
APC C3MR
6 Indonesia Bontang LNG T5 1989 2.9 Pertamina APC C3MR8 Australia North West Shelf
T31992 2.5 BHP Billiton, BP, Chevron,
Shell, Woodside, Mitsubishi, Mitsui
APC C3MR
6 Indonesia Bontang LNG T6 1994 2.9 Pertamina APC C3MR4 United Arab
EmiratesADGAS LNG T3 1994 3.2 ADNOC, Mitsui, BP, TOTAL APC C3MR
7 Malaysia MLNG Dua (T1-3) 1995 7.8 PETRONAS, Shell, Mitsubishi, Sarawak State Government
APC C3MR
9 Qatar Qatargas I (T1) 1997 3.2 Qatar Petroleum, ExxonMobil, TOTAL,, Marubeni, Mitsui
APC C3MR
9 Qatar Qatargas I (T2) 1997 3.2 Qatar Petroleum, ExxonMobil, TOTAL, Marubeni, Mitsui
APC C3MR
6 Indonesia Bontang LNG T7 1998 2.7 Pertamina APC C3MR9 Qatar Qatargas I (T3) 1998 3.1 Qatar Petroleum, ExxonMobil,
TOTAL, Mitsui, MarubeniAPC C3MR
6 Indonesia Bontang LNG T8 1999 3 Pertamina APC C3MR10 Nigeria NLNG T1 1999 3.3 NNPC, Shell, TOTAL, Eni APC C3MR9 Qatar RasGas I (T1) 1999 3.3 Qatar Petroleum, ExxonMobil,
KOGAS, Itochu, LNG JapanAPC C3MR
11 Trinidad ALNG T1 1999 3.3 BP, BG, Shell, CIC, NGC Trinidad
ConocoPhillips Optimized Cascade®
10 Nigeria NLNG T2 2000 3.3 NNPC, Shell, TOTAL, Eni APC C3MR12 Oman Oman LNG T1 2000 3.55 Omani Govt, Shell, TOTAL,
Korea LNG, Partex, Mitsubishi, Mitsui, Itochu
APC C3MR
12 Oman Oman LNG T2 2000 3.55 Omani Govt, Shell, TOTAL, Korea LNG, Partex, Mitsubishi,
Mitsui, Itochu
APC C3MR
61
IGU World Gas LNG Report — 2016 Edition

9 Qatar RasGas I (T2) 2000 3.3 Qatar Petroleum, ExxonMobil, KOGAS, Itochu, LNG Japan
APC C3MR
10 Nigeria NLNG T3 2002 3 NNPC, Shell, TOTAL, Eni APC C3MR11 Trinidad ALNG T2 2002 3.4 BP, BG, Shell ConocoPhillips
Optimized Cascade®
7 Malaysia MLNG Tiga (T1-2) 2003 6.8 PETRONAS, Shell, Nippon, Sarawak State Government,
Mitsubishi
APC C3MR
11 Trinidad ALNG T3 2003 3.4 BP, BG, Shell ConocoPhillips Optimized Cascade®
8 Australia North West Shelf T4
2004 4.4 BHP Billiton, BP, Chevron, Shell, Woodside, Mitsubishi,
Mitsui
APC C3MR
9 Qatar RasGas II (T1) 2004 4.7 Qatar Petroleum, ExxonMobil APC C3MR/ Split MR™
13 Egypt ELNG T1*** 2005 3.6 BG, PETRONAS, EGAS, EGPC, ENGIE
ConocoPhillips Optimized Cascade®
13 Egypt ELNG T2*** 2005 3.6 BG, PETRONAS, EGAS, EGPC
ConocoPhillips Optimized Cascade®
13 Egypt Damietta LNG T1***
2005 5 Gas Natural Fenosa, Eni, EGPC, EGAS
APC C3MR/
Split MR™9 Qatar RasGas II (T2) 2005 4.7 Qatar Petroleum, ExxonMobil APC C3MR/
Split MR™14 Australia Darwin LNG T1 2006 3.6 ConocoPhillips, Santos,
INPEX, Eni, TEPCO, Tokyo Gas
ConocoPhillips Optimized Cascade®
10 Nigeria NLNG T4 2006 4.1 NNPC, Shell, TOTAL, Eni APC C3MR10 Nigeria NLNG T5 2006 4.1 NNPC, Shell, TOTAL, Eni APC C3MR12 Oman Qalhat LNG 2006 3.7 Omani Govt, Oman LNG,
Union Fenosa Gas, Itochu, Mitsubishi, Osaka Gas
APC C3MR
11 Trinidad ALNG T4 2006 5.2 BP, BG, Shell, NGC Trinidad ConocoPhillips Optimized Cascade®
15 Equatorial Guinea
EG LNG T1 2007 3.7 Marathon, Sonagas, Mitsui, Marubeni
ConocoPhillips Optimized Cascade®
16 Norway Snøhvit LNG T1 2007 4.2 Statoil, Petoro, TOTAL, ENGIE, RWE
Linde MFC
9 Qatar RasGas II (T3) 2007 4.7 Qatar Petroleum, ExxonMobil APC C3MR/Split MR™
8 Australia North West Shelf T5
2008 4.4 BHP Billiton, BP, Chevron, Shell, Woodside, Mitsubishi,
Mitsui
APC C3MR
10 Nigeria NLNG T6 2008 4.1 NNPC, Shell, TOTAL, Eni APC C3MR17 Indonesia Tangguh LNG T1 2009 3.8 BP, CNOOC, Mitsubishi,
INPEX, JOGMEC, JX Nippon Oil & Energy, LNG Japan,
Talisman Energy, Kanematsu, Mitsui
APC C3MR/Split MR™
62
IGU World Gas LNG Report — 2016 Edition

17 Indonesia Tangguh LNG T2 2009 3.8 BP, CNOOC, Mitsubishi, INPEX, JOGMEC, JX Nippon
Oil & Energy, LNG Japan, Talisman Energy, Kanematsu,
Mitsui
APC C3MR/Split MR™
9 Qatar Qatargas II (T1) 2009 7.8 Qatar Petroleum, ExxonMobil APC AP-X9 Qatar Qatargas II (T2) 2009 7.8 Qatar Petroleum, ExxonMobil,
TOTALAPC AP-X
9 Qatar RasGas III (T1) 2009 7.8 Qatar Petroleum, ExxonMobil APC AP-X18 Russia Sakhalin 2 (T1) 2009 4.8 Gazprom, Shell, Mitsui,
MitsubishiShell DMR
18 Russia Sakhalin 2 (T2) 2009 4.8 Gazprom, Shell, Mitsui, Mitsubishi
Shell DMR
19 Yemen Yemen LNG T1 2009 3.6 TOTAL, Hunt Oil, Yemen Gas Co., SK Corp, KOGAS,
GASSP, Hyundai
APC C3MR/Split MR™
7 Malaysia MLNG Dua Debottleneck
2010 1.2 PETRONAS, Shell, Mitsubishi, Sarawak State Government
APC C3MR
20 Peru Peru LNG 2010 4.45 Hunt Oil, Shell, SK Corp, Marubeni
APC C3MR/Split MR™
9 Qatar Qatargas III 2010 7.8 Qatar Petroleum, ConocoPhillips, Mitsui
APC AP-X
9 Qatar RasGas III (T2) 2010 7.8 Qatar Petroleum, ExxonMobil APC AP-X19 Yemen Yemen LNG T2 2010 3.6 TOTAL, Hunt Oil, Yemen
Gas Co., SK Corp, KOGAS, GASSP, Hyundai
APC C3MR/
9 Qatar Qatargas IV 2011 7.8 Qatar Petroleum, Shell APC AP-X21 Australia Pluto LNG T1 2012 4.3 Woodside, Kansai Electric,
Tokyo GasShell propane
pre-cooled mixed refrigerant design
5 Algeria Skikda - GL1K Rebuild
2013 4.5 Sonatrach APC C3MR
22 Angola Angola LNG T1 2013 5.2 Chevron, Sonangol, BP, Eni, TOTAL
ConocoPhillips Optimized Cascade®
23 Papua New Guinea
PNG LNG T1 2014 3.45 ExxonMobil, Oil Search, Govt. of PNG, Santos, Nippon Oil, PNG Landowners (MRDC), Marubeni, Petromin PNG
APC C3MR
23 Papua New Guinea
PNG LNG T2 2014 3.45 ExxonMobil, Oil Search, Govt. of PNG, Santos, JX Nippon Oil & Energy, MRDC, Marubeni,
Petromin PNG
APC C3MR
5 Algeria Arzew - GL3Z (Gassi Touil)
2014 4.7 Sonatrach APC C3MR/Split MR™
24 Australia QCLNG T1 2014 4.3 BG, CNOOC ConocoPhillips Optimized Cascade®
24 Australia QCLNG T2 2015 4.3 BG, Tokyo Gas ConocoPhillips Optimized Cascade®
25 Indonesia Donggi-Senoro LNG
2015 2 Mitsubishi, Pertamina, KOGAS, Medco
APC C3MR
Sources: IHS, Company Announcements * Companies are listed by size of ownership stake, starting with the largest stake ** Kenai LNG was scheduled to be decommissioned in 2016 but has applied for an additional two-year export license.*** Damietta LNG in Egypt has not operated since the end of 2012; operations at ELNG in Egypt were greatly reduced in 2014, and the plant did not export cargoes in 2015. The Marsa El Brega plant in Libya is included for reference although it has not been operational since 2011.
63
IGU World Gas LNG Report — 2016 Edition

Appendix 2: Table of Liquefaction Plants Under Construction
Country Project Name Start Year
Nameplate Capacity (MTPA)
Owners* Liquefaction Technology
Australia APLNG T1 2016 4.5 ConocoPhillips, Origin Energy, Sinopec
ConocoPhillips Optimized Cascade®
Australia APLNG T2 2016 4.5 ConocoPhillips, Origin Energy, Sinopec
ConocoPhillips Optimized Cascade®
Australia GLNG T1 2016 3.9 Santos, PETRONAS, TOTAL, KOGAS
ConocoPhillips Optimized Cascade®
Australia Gorgon LNG T1-2 2016 10.4 Chevron, ExxonMobil, Shell, Osaka
Gas, Tokyo Gas, Chubu Electric APC C3MR/Split MR™
Malaysia MLNG 9 2016 3.6 PETRONAS APC Split MR™Malaysia PFLNG 1 2016 1.2 PETRONAS APC AP-N™
Australia GLNG T2 2016 3.9 Santos, PETRONAS, TOTAL, KOGAS
ConocoPhillips Optimized Cascade®
US Sabine Pass T1-2 2016 9 Cheniere ConocoPhillips Optimized
Cascade®
Australia Wheatstone LNG T1 2016 4.45
Chevron, Apache, Pan Pacific Energy, KUFPEC, Shell,
Kyushu Electric
ConocoPhillips Optimized Cascade®
Indonesia Senkang LNG T1 2016 0.5 EWC Siemens
Australia Gorgon LNG T3 2017 5.2 Chevron, ExxonMobil, Shell, Osaka Gas, Tokyo Gas, Chubu Electric APC C3MR/Split MR™
Australia Ichthys LNG T1 2017 4.45INPEX, TOTAL, Tokyo Gas,
CPC, Osaka Gas, Chubu Electric, Toho Gas
APC Split MR™
Australia Prelude FLNG 2017 3.6 Shell, INPEX, KOGAS, CPC Shell Floating LNG
Australia Wheatstone LNG T2 2017 4.45
Chevron, Apache, Pan Pacific Energy, KUFPEC, Shell,
Kyushu Electric
ConocoPhillips Optimized Cascade®
Russia Yamal LNG T1 2017 5.5 Novatek, TOTAL, CNPC APC C3MR™US Cove Point LNG 2017 5.25 Dominion APC C3MR/Split MR™
US Sabine Pass T3-4 2017 9 Cheniere ConocoPhillips Optimized
Cascade®
Cameroon Cameroon FLNG 2017 2.4 Golar, Keppel GoFLNG
Australia Ichthys LNG T2 2018 4.45INPEX, TOTAL, Tokyo Gas,
CPC, Osaka Gas, Chubu Electric, Toho Gas
APC Split MR™
Malaysia PFLNG 2 2018 1.5 PETRONAS, MISC, Murphy Oil APC AP-N™Russia Yamal LNG T2 2018 5.5 Novatek, TOTAL, CNPC APC C3MR™
US Cameron LNG T1-3 2018 12 Sempra, Mitsubishi/NYK JV,
Mitsui, ENGIE APC C3MR™
US Freeport LNG T1 2018 4.4 Freeport LNG, Osaka Gas, Chubu Electric APC C3MR/Split MR™
Russia Yamal LNG T3 2019 5.5 Novatek, TOTAL, CNPC APC C3MR™US Freeport LNG T2 2019 4.4 Freeport LNG, IFM Investors APC C3MR/Split MR™
US Sabine Pass T5 2019 4.5 Cheniere ConocoPhillips Optimized Cascade®
US Freeport LNG T3 2019 4.4 Freeport LNG APC C3MR/Split MR™
US Corpus Christi LNG T1-2 2019 9 Cheniere ConocoPhillips Optimized
Cascade®
Sources: IHS, Company Announcements * Companies are listed by size of ownership stake, starting with the largest stake. List excludes the stalled Caribbean FLNG project offshore Colombia.
64
IGU World Gas LNG Report — 2016 Edition

Appendix 3: Table of LNG Receiving Terminals
Reference Number
Country Terminal Name Start Year Nameplate Receiving Capacity (MTPA)
Owners* Concept
1 Spain Barcelona 1969 12.8 ENAGAS 100% Onshore2 Japan Negishi 1969 12 TEPCO 50%;
Tokyo Gas 50%Onshore
3 US Everett 1971 5.4 GDF SUEZ 100% Onshore4 Italy Panigaglia (La Spezia) 1971 2.5 Eni 100% Onshore5 France Fos Tonkin 1972 4 GDF SUEZ 100% Onshore6 Japan Senboku 1972 15.3 Osaka Gas 100% Onshore7 Japan Sodegaura 1973 29.4 TEPCO 50%;
Tokyo Gas 50%Onshore
8 Japan Chita LNG Joint/ Chita Kyodo
1977 8 Chubu Electric 50%; Toho Gas 50%
Onshore
9 Japan Tobata 1977 6.8 Kitakyushu LNG 100% Onshore10 US Cove Point 1978 11 Dominion 100% Onshore11 US Elba Island 1978 12.4 KM LNG Operating
Partnership 100%Onshore
12 Japan Himeji 1979 13.3 Osaka Gas 100% Onshore13 France Montoir-de-Bretagne 1980 7.3 GDF SUEZ 100% Onshore14 US Lake Charles 1982 17.3 Southern Union 75%; AIG
Highstar (Private Equity) 25%Onshore
15 Japan Chita 1983 12 Chubu Electric 50%; Toho Gas 50%
Onshore
16 Japan Higashi-Ohgishima 1984 14.7 TEPCO 100% Onshore17 Japan Nihonkai (Niigata) 1984 8.9 Nihonkai LNG 58.1%;
Tohoku Electric 41.9%Onshore
18 Japan Futtsu 1985 16 TEPCO 100% Onshore19 Korea Pyeong-Taek 1986 34.5 KOGAS 100% Onshore20 Japan Yokkaichi LNG Works 1987 7.1 Chubu Electric 100% Onshore21 Belgium Zeebrugge 1987 6.6 Publigas 89.97%;
Fluxys 10.03%Onshore
22 Spain Huelva 1988 8.9 ENAGAS 100% Onshore23 Spain Cartagena 1989 7.6 ENAGAS 100% Onshore24 Japan Oita 1990 5.1 Kyushu Electric 100% Onshore25 Japan Yanai 1990 2.4 Chugoku Electric 100% Onshore26 Taiwan Yong an (Kaohsiung) 1990 10 CPC 100% Onshore27 Turkey Marmara Ereglisi 1994 5.9 Botas 100% Onshore28 Korea Incheon 1996 38 KOGAS 100% Onshore29 Japan Sodeshi/Shimizu LNG 1996 1.6 Shizuoka Gas 65%;
TonenGeneral 35%Onshore
30 Japan Kawagoe 1997 7.7 Chubu Electric 100% Onshore31 Japan Ohgishima 1998 6.7 Tokyo Gas 100% Onshore32 Puerto Rico Peñuelas
(EcoElectrica)2000 1.2 Gas Natural Fenosa 47.5%;
International Power 25%; Mitsui 25%; GE Capital 2.5%
Onshore
33 Greece Revithoussa 2000 3.3 DEPA 100% Onshore34 Japan Chita Midorihama
Works2001 8.3 Toho Gas 100% Onshore
35 Korea Tong-Yeong 2002 17 KOGAS 100% Onshore
65
IGU World Gas LNG Report — 2016 Edition

36 Dominican Republic
AES Andrés 2003 1.9 AES 100% Onshore
37 Spain Bilbao (BBG) 2003 5.3 ENAGAS 40%; EVE 30%; RREEF Infrastructure 30%
Onshore
38 India Dahej LNG 2004 10 Petronet LNG 100% Onshore39 Portugal Sines LNG 2004 5.8 REN 100% Onshore40 UK Grain LNG 2005 15 National Grid Transco 100% Onshore41 Korea Gwangyang 2005 1.8 Posco 100% Onshore42 India Hazira LNG 2005 5 Shell 74%; TOTAL 26% Onshore43 Japan Sakai 2005 2 Kansai Electric 70%; Cosmo
Oil 12.5%; Iwatani 12.5%; Ube Industries 5%
Onshore
44 Turkey Aliaga LNG 2006 4.4 Egegaz 100% Onshore45 Mexico Altamira LNG 2006 5.4 Vopak 60%; ENAGAS 40% Onshore46 China Guangdong Dapeng
LNG I2006 6.7 Local companies 37%;
CNOOC 33%; BP 30%Onshore
47 Japan Mizushima LNG 2006 1.7 Chugoku Electric 50%; JX Nippon Oil & Energy 50%
Onshore
48 Spain Saggas (Sagunto) 2006 6.7 RREEF Infrastructure 30%; Eni 21.25%; Gas Natural
Fenosa 21.25%; Osaka Gas 20%; Oman Oil 7.5%
Onshore
49 Spain Mugardos LNG (El Ferrol)
2007 2.6 Grupo Tojeiro 36.5%; Gas Natural Fenosa 21%; Comunidad Autonoma de
Galicia 17.5%; Other Companies 15%;
Sonatrach 10%
Onshore
50 UK Teesside GasPort 2007 3 Excelerate Energy 100% Floating51 Mexico Costa Azul 2008 7.5 Sempra 100% Onshore52 US Freeport LNG 2008 11.3 Michael S Smith Cos 45%;
ZHA FLNG Purchaser 30%; Dow Chemical 15%;
Osaka Gas 10%
Onshore
53 China Fujian (Putian) 2008 5 CNOOC 60%; Fujian Investment and Development Co 40%
Onshore
54 US Northeast Gateway 2008 3 Excelerate Energy 100% Floating55 US Sabine Pass 2008 30.2 Cheniere Energy 100% Onshore56 Argentina Bahia Blanca GasPort 2008 3.8 YPF 100% Floating57 Italy Adriatic LNG/Rovigo 2009 5.8 ExxonMobil 46.35%;
Qatar Petroleum 46.35%; Edison 7.3%
Offshore
58 US Cameron LNG 2009 11.3 Sempra 50.2%; GDF SUEZ 16.6%; Mitsubishi 16.6%;
Mitsui 16.6%
Onshore
59 Canada Canaport 2009 7.5 Repsol 75%; Irving Oil 25% Onshore60 UK Dragon LNG 2009 4.4 BG Group 50%;
PETRONAS 30%; 4Gas 20%Onshore
61 Kuwait Mina Al-Ahmadi 2009 5.8 Kuwait Petroleum Corporation 100%
Floating
62 Brazil Pecém 2009 1.9 Petrobras 100% Floating63 Chile Quintero LNG 2009 2.7 ENAGAS 20.4%; ENAP 20%;
ENDESA 20%; Metrogas 20%; Oman Oil 19.6%
Onshore
66
IGU World Gas LNG Report — 2016 Edition

64 China Shanghai (Yangshan) 2009 3 Shenergy Group 55%; CNOOC 45%
Onshore
65 UK South Hook 2009 15.6 Qatar Petroleum 67.5%; ExxonMobil 24.15%;
TOTAL 8.35%
Onshore
66 Taiwan Taichung LNG 2009 3 CPC 100% Onshore67 UAE Dubai 2010 3 Dubai Supply Authority
(Dusup) 100%Floating
68 France FosMax LNG (Fos Cavaou)
2010 6 GDF SUEZ 71.97%; TOTAL 28.03%
Onshore
69 Chile Mejillones LNG 2010 1.5 GDF SUEZ 63%; Codelco 37%
Onshore
70 China Dalian 2011 3 CNPC 75%; Dalian Port 20%; Dalian Construction
Investment Corp 5%
Onshore
71 Netherlands GATE LNG 2011 8.8 Gasunie 40%; Vopak 40%; Dong 5%; EconGas OMV 5%;
EON 5%; RWE 5%
Onshore
72 US Golden Pass 2011 15.6 Qatar Petroleum 70%; ExxonMobil 17.6%;
ConocoPhillips 12.4%
Onshore
73 US Gulf LNG (formerly Clean Energy
Terminal)
2011 11.3 KM LNG Operating Partnership 50%; GE Energy
Financial Services 30%; Sonangol 20%
Onshore
74 Argentina Puerto Escobar 2011 3.8 Enarsa 100% Floating75 Thailand Map Ta Phut LNG 2011 5 PTT 100% Onshore76 China Rudong Jiangsu LNG 2011 3.5 PetroChina 55%;
Pacific Oil and Gas 35%; Jiangsu Guoxin 10%
Onshore
77 Brazil Guanabara LNG/Rio de Janeiro
2012 6 Petrobras 100% Floating
78 Indonesia Nusantara 2012 3.8 Pertamina 60%; PGN 40% Floating79 Japan Ishikari LNG 2012 1.4 Hokkaido Gas 100% Onshore80 Japan Joetsu 2012 2.3 Chubu Electric 100% Onshore81 Mexico Manzanillo 2012 3.8 Mitsui 37.5%; Samsung 37.5%;
KOGAS 25%Onshore
82 China Dongguan 2012 1 Jovo Group 100% Onshore83 Israel Hadera Gateway 2013 3 Israel Natural Gas Lines
100%Floating
84 India Dabhol 2013 2 GAIL 31.52%; NTPC 31.52%; Indian financial institutions
20.28%; MSEB Holding Co. 16.68%
Onshore
85 Spain El Musel 2013 5.4 ENAGAS 100% Onshore86 Singapore Singapore LNG 2013 6 Singapore Energy Market
Authority 100%Onshore
87 Malaysia Lekas LNG (Malacca) 2013 3.8 PETRONAS 100% Onshore88 China Ningbo, Zhejiang 2013 3 CNOOC 51%; Zhejiang
Energy Group Co Ltd 29%; Ningbo Power Development
Co Ltd 20%
Onshore
89 China Zhuhai (CNOOC) 2013 3.5 CNOOC 30%; Guangdong Gas 25%;
Guangdong Yuedian 25%; Local companies 20%
Onshore
67
IGU World Gas LNG Report — 2016 Edition

Appendix 4: Table of LNG Receiving Terminals Under Construction
Reference Number
Country Terminal or Phase Name
Start Year Nameplate Receiving Capacity (MTPA)
Owners* Concept
109 China Rudong Jiangsu LNG Phase 2
2016 3 CNPC 55%; Pacific Oil and Gas 35%; Jiangsu Guoxin 10%
Onshore
110 China Yuedong LNG (Jieyang)
2016 2 Shenergy Group 55%; CNOOC 45%
Onshore
111 China Beihai, Guangxi LNG 2016 3 Sinopec 100% Onshore112 Philippines Pagbilao LNG Hub 2016 3 Energy World Corporation
100%Onshore
113 France Dunkirk LNG 2016 10 EDF 65%; Fluxys 25%; TOTAL 10%
Onshore
114 Poland Swinoujscie 2016 3.6 GAZ-SYSTEM SA 100% Onshore115 China Dalian Phase 2 2016 3 CNPC 75%; Dalian Port
20%; Dalian Construction Investment Corp 5%
Onshore
116 China Tianjin (onshore) 2016 3.5 CNOOC 100% Onshore117 China Yantai, Shandong
Phase 12016 1.5 CNOOC 100% Onshore
118 Greece Revithoussa (Expansion Phase 2)
2016 1.9 DEPA 100% Onshore
90 Italy Livorno/LNG Toscana 2013 2.7 EON 46.79%; IREN 46.79%; OLT Energy 3.73%;
Golar 2.69%
Floating
91 China Tangshan Caofeidian LNG
2013 3.5 PetroChina 100% Onshore
92 China Tianjin 2013 2.2 CNOOC 100% Floating93 Japan Naoetsu (Joetsu) 2013 2 INPEX 100% Onshore94 India Kochi LNG 2013 5 Petronet LNG 100% Onshore95 Brazil Bahia/TRBA 2014 3.8 Petrobras 100% Floating96 Indonesia Lampung LNG 2014 1.8 PGN 100% Floating97 Korea Samcheok 2014 6.8 KOGAS 100% Onshore98 China Hainan LNG 2014 2 CNOOC 65%;
Hainan Development Holding Co 35%
Onshore
99 Japan Hibiki LNG 2014 3.5 Saibu Gas 90%; Kyushu Electric 10%
Onshore
100 China Shandong LNG 2014 3 Sinopec 99%; Qingdao Port Group 1%
Onshore
101 Lithuania Klaipeda LNG 2014 3 Klaipedos Nafta 100% Floating102 Indonesia Arun LNG 2015 3 Pertamina 70%; Aceh
Regional Government 30%Onshore
103 Japan Hachinohe LNG 2015 1.5 JX Nippon Oil & Energy 100%
Onshore
104 Egypt Ain Sokhna Hoegh 2015 4.1 EGAS 100% Floating105 Pakistan Engro LNG 2015 3.8 Engro Corp. 100% Floating106 Jordan Aqaba LNG 2015 3.8 Jordan Ministry of Energy
and Mineral Resources (MEMR) 100%
Floating
107 Egypt Ain Sokhna BW 2015 5.7 EGAS 100% Floating108 Japan Shin-Sendai 2015 1.5 Tohoku Electric 100% Onshore
Sources: IHS, Company Announcements
68
IGU World Gas LNG Report — 2016 Edition

119 India Dahej LNG (Phase 3-A1)
2016 5 Petronet LNG 100% Onshore
120 China Tianjin (Sinopec) Phase 1
2016 2.9 Sinopec 100% Onshore
121 Thailand Map Ta Phut Phase 2 2017 5 PTT 100% Onshore122 India Mundra 2017 5 Adani Group 50%; GSPC 50% Onshore123 Korea Boryeong 2017 3 GS Energy 50%;
SK Energy 50%Onshore
124 China Shenzhen (Diefu) 2017 4 CNOOC 70%; Shenzhen Energy Group 30%
Onshore
125 China Fujian (Zhangzhou) 2018 3 CNOOC 60%; Fujian Investment and Development Co. 40%
Onshore
126 Japan Soma LNG 2018 1.5 Japex 100% Onshore127 China Zhoushan 2018 3 ENN Energy 100% Onshore128 India Ennore LNG 2019 5 Indian Oil Corporation
95%; Tamil Nadu Industrial Development Corporation 5%
Onshore
Sources: IHS, Company Announcements
Appendix 5: Table of Active LNG Fleet
Ship Name Shipowner Shipbuilder Type Delivery Year
Capacity (cm)
Propulsion Type
IMO #
AAMIRA Nakilat Samsung Q-Max 2010 260,912 SSD 9443401ABADI Brunei Gas
CarriersMitsubishi Conventional 2002 135,269 Steam 9210828
ADAM LNG Oman Shipping Co (OSC)
Hyundai Conventional 2014 162,000 TFDE 9501186
AL AAMRIYA NYK, K Line, MOL, Iino, Mitsui, Nakilat
Daewoo Q-Flex 2008 206,958 SSD 9338266
AL AREESH Nakilat, Teekay Daewoo Conventional 2007 148,786 Steam 9325697AL BAHIYA Nakilat Daewoo Q-Flex 2010 205,981 SSD 9431147AL BIDDA J4 Consortium Kawaski Conventional 1999 135,466 Steam 9132741AL DAAYEN Nakilat, Teekay Daewoo Conventional 2007 148,853 Steam 9325702AL DAFNA Nakilat Samsung Q-Max 2009 261,988 SSD 9443683AL DEEBEL MOL, NYK, K Line Samsung Conventional 2005 142,795 Steam 9307176AL GATTARA Nakilat, OSC Hyundai Q-Flex 2007 216,200 SSD 9337705AL GHARIYA Commerz Real,
Nakilat, PRONAVDaewoo Q-Flex 2008 205,941 SSD 9337987
AL GHARRAFA Nakilat, OSC Hyundai Q-Flex 2008 216,200 SSD 9337717AL GHASHAMIYA Nakilat Samsung Q-Flex 2009 211,885 SSD 9397286AL GHUWAIRIYA Nakilat Daewoo Q-Max 2008 257,984 SSD 9372743AL HAMLA Nakilat, OSC Samsung Q-Flex 2008 211,862 SSD 9337743AL HAMRA National Gas
Shipping CoKvaerner
MasaConventional 1997 137,000 Steam 9074640
AL HUWAILA Nakilat, Teekay Samsung Q-Flex 2008 214,176 SSD 9360879AL JASRA J4 Consortium Mitsubishi Conventional 2000 135,855 Steam 9132791AL JASSASIYA Maran G.M,
NakilatDaewoo Conventional 2007 142,988 Steam 9324435
AL KARAANA Nakilat Daewoo Q-Flex 2009 205,988 SSD 9431123AL KHARAITIYAT Nakilat Hyundai Q-Flex 2009 211,986 SSD 9397327AL KHARSAAH Nakilat, Teekay Samsung Q-Flex 2008 211,885 SSD 9360881AL KHATTIYA Nakilat Daewoo Q-Flex 2009 205,993 SSD 9431111
69
IGU World Gas LNG Report — 2016 Edition

AL KHAZNAH National Gas Shipping Co
Mitsui Conventional 1994 137,540 Steam 9038440
AL KHOR J4 Consortium Mitsubishi Conventional 1996 135,295 Steam 9085613AL KHUWAIR Nakilat, Teekay Samsung Q-Flex 2008 211,885 SSD 9360908AL MAFYAR Nakilat Samsung Q-Max 2009 261,043 SSD 9397315AL MARROUNA Nakilat, Teekay Daewoo Conventional 2006 149,539 Steam 9325685AL MAYEDA Nakilat Samsung Q-Max 2009 261,157 SSD 9397298AL NUAMAN Nakilat Daewoo Q-Flex 2009 205,981 SSD 9431135AL ORAIQ NYK, K Line, MOL,
Iino, Mitsui, NakilatDaewoo Q-Flex 2008 205,994 SSD 9360790
AL RAYYAN J4 Consortium Kawaski Conventional 1997 134,671 Steam 9086734AL REKAYYAT Nakilat Hyundai Q-Flex 2009 211,986 SSD 9397339AL RUWAIS Commerz Real,
Nakilat, PRONAVDaewoo Q-Flex 2007 205,941 SSD 9337951
AL SADD Nakilat Daewoo Q-Flex 2009 205,963 SSD 9397341AL SAFLIYA Commerz Real,
Nakilat, PRONAVDaewoo Q-Flex 2007 210,100 SSD 9337963
AL SAHLA NYK, K Line, MOL, Iino, Mitsui, Nakilat
Hyundai Q-Flex 2008 211,842 SSD 9360855
AL SAMRIYA Nakilat Daewoo Q-Max 2009 258,054 SSD 9388821AL SHAMAL Nakilat, Teekay Samsung Q-Flex 2008 213,536 SSD 9360893AL SHEEHANIYA Nakilat Daewoo Q-Flex 2009 205,963 SSD 9360831AL THAKHIRA K Line, Qatar
Shpg.Samsung Conventional 2005 143,517 Steam 9298399
AL THUMAMA NYK, K Line, MOL, Iino, Mitsui, Nakilat
Hyundai Q-Flex 2008 216,235 SSD 9360843
AL UTOURIYA NYK, K Line, MOL, Iino, Mitsui, Nakilat
Hyundai Q-Flex 2008 211,879 SSD 9360867
AL WAJBAH J4 Consortium Mitsubishi Conventional 1997 134,562 Steam 9085625AL WAKRAH J4 Consortium Kawaski Conventional 1998 134,624 Steam 9086746AL ZUBARAH J4 Consortium Mitsui Conventional 1996 135,510 Steam 9085649ALTO ACRUX TEPCO, NYK,
MitsubishiMitsubishi Conventional 2008 147,798 Steam 9343106
AMADI Brunei Gas Carriers
Hyundai Conventional 2015 155,000 Steam Reheat
9682552
AMALI Brunei Gas Carriers
Daewoo Conventional 2011 147,228 TFDE 9496317
AMANI Brunei Gas Carriers
Hyundai Conventional 2014 155,000 TFDE 9661869
AMUR RIVER Dynagas Hyundai Conventional 2008 146,748 Steam 9317999ARCTIC AURORA Dynagas Hyundai Conventional 2013 154,880 TFDE 9645970ARCTIC DISCOVERER
K Line, Statoil, Mitsui, Iino
Mitsui Conventional 2006 139,759 Steam 9276389
ARCTIC LADY Hoegh Mitsubishi Conventional 2006 147,835 Steam 9284192ARCTIC PRINCESS Hoegh, MOL,
StatoilMitsubishi Conventional 2006 147,835 Steam 9271248
ARCTIC SPIRIT Teekay I.H.I. Conventional 1993 87,305 Steam 9001784ARCTIC VOYAGER K Line, Statoil,
Mitsui, IinoKawaski Conventional 2006 140,071 Steam 9275335
ARKAT Brunei Gas Carriers
Daewoo Conventional 2011 147,228 TFDE 9496305
ARWA SPIRIT Teekay, Marubeni Samsung Conventional 2008 163,285 DFDE 9339260
70
IGU World Gas LNG Report — 2016 Edition

ASEEM MOL, NYK, K Line, SCI, Nakilat,
Petronet
Samsung Conventional 2009 154,948 TFDE 9377547
ASIA ENDEAVOUR Chevron Samsung Conventional 2015 154,948 TFDE 9610779ASIA ENERGY Chevron Samsung Conventional 2014 154,948 TFDE 9606950ASIA EXCELLENCE Chevron Samsung Conventional 2015 154,948 TFDE 9610767ASIA VISION Chevron Samsung Conventional 2014 154,948 TFDE 9606948ATLANTIC ENERGY Sinokor Merchant
MarineKockums Conventional 1984 132,588 Steam 7702401
BACHIR CHIHANI Sonatrach CNIM Conventional 1979 129,767 Steam 7400675BARCELONA KNUTSEN
Knutsen OAS Daewoo Conventional 2009 173,400 TFDE 9401295
BEBATIK Shell Chantiers de l’Atlantique
Conventional 1972 75,056 Steam 7121633
BEIDOU STAR MOL, China LNG Hudong-Zhonghua
Conventional 2015 172,000 MEGI 9613159
BELANAK Shell Ch.De La Ciotat
Conventional 1975 75,000 Steam 7347768
BERGE ARZEW BW Daewoo Conventional 2004 138,089 Steam 9256597BILBAO KNUTSEN Knutsen OAS IZAR Conventional 2004 135,049 Steam 9236432BRITISH DIAMOND BP Hyundai Conventional 2008 151,883 DFDE 9333620BRITISH EMERALD BP Hyundai Conventional 2007 154,983 DFDE 9333591BRITISH INNOVATOR
BP Samsung Conventional 2003 136,135 Steam 9238040
BRITISH MERCHANT
BP Samsung Conventional 2003 138,517 Steam 9250191
BRITISH RUBY BP Hyundai Conventional 2008 155,000 DFDE 9333606BRITISH SAPPHIRE BP Hyundai Conventional 2008 155,000 DFDE 9333618BRITISH TRADER BP Samsung Conventional 2002 138,248 Steam 9238038BROOG J4 Consortium Mitsui Conventional 1998 136,359 Steam 9085651BU SAMRA Nakilat Samsung Q-Max 2008 260,928 SSD 9388833BW GDF SUEZ BOSTON
BW, ENGIE Daewoo Conventional 2003 138,059 Steam 9230062
BW GDF SUEZ BRUSSELS
BW Daewoo Conventional 2009 162,514 TFDE 9368314
BW GDF SUEZ EVERETT
BW Daewoo Conventional 2003 138,028 Steam 9243148
BW GDF SUEZ PARIS
BW Daewoo Conventional 2009 162,524 TFDE 9368302
BW PAVILION LEEARA
BW Hyundai Conventional 2015 161,880 TFDE 9640645
BW PAVILION VANDA
BW Pavilion LNG Hyundai Conventional 2015 161,880 TFDE 9640437
BW SINGAPORE BW Samsung FSRU 2015 170,000 TFDE 9684495CADIZ KNUTSEN Knutsen OAS IZAR Conventional 2004 135,240 Steam 9246578CASTILLO DE SANTISTEBAN
Anthony Veder STX Conventional 2010 173,673 TFDE 9433717
CASTILLO DE VILLALBA
Anthony Veder IZAR Conventional 2003 135,420 Steam 9236418
CATALUNYA SPIRIT Teekay IZAR Conventional 2003 135,423 Steam 9236420CELESTINE RIVER K Line Kawaski Conventional 2007 145,394 Steam 9330745CHEIKH BOUAMAMA
HYPROC, Sonatrach, Itochu,
MOL
Universal Conventional 2008 74,245 Steam 9324344
71
IGU World Gas LNG Report — 2016 Edition

CHEIKH EL MOKRANI
HYPROC, Sonatrach, Itochu,
MOL
Universal Conventional 2007 73,990 Steam 9324332
CLEAN ENERGY Dynagas Hyundai Conventional 2007 146,794 Steam 9323687CLEAN HORIZON Avoca Maritime
Corp LtdHyundai Conventional 2015 162,000 TFDE 9655444
CLEAN OCEAN Dynagas Hyundai Conventional 2014 162,000 TFDE 9637492CLEAN PLANET Dynagas Hyundai Conventional 2014 162,000 TFDE 9637507COOL EXPLORER Thenamaris Samsung Conventional 2015 160,000 TFDE 9640023COOL RUNNER Thenamaris Samsung Conventional 2014 160,000 TFDE 9636797COOL VOYAGER Thenamaris Samsung Conventional 2013 160,000 TFDE 9636785CORCOVADO LNG Cardiff Marine Daewoo Conventional 2014 159,800 TFDE 9636711CUBAL Mitsui, NYK,
TeekaySamsung Conventional 2012 154,948 TFDE 9491812
CYGNUS PASSAGE TEPCO, NYK, Mitsubishi
Mitsubishi Conventional 2009 145,400 Steam 9376294
DAPENG MOON China LNG Ship Mgmt.
Hudong-Zhonghua
Conventional 2008 147,200 Steam 9308481
DAPENG STAR China LNG Ship Mgmt.
Hudong-Zhonghua
Conventional 2009 147,200 Steam 9369473
DAPENG SUN China LNG Ship Mgmt.
Hudong-Zhonghua
Conventional 2008 147,200 Steam 9308479
DISHA MOL, NYK, K Line, SCI, Nakilat
Daewoo Conventional 2004 136,026 Steam 9250713
DOHA J4 Consortium Mitsubishi Conventional 1999 135,203 Steam 9085637DUHAIL Commerz Real,
Nakilat, PRONAVDaewoo Q-Flex 2008 210,100 SSD 9337975
DUKHAN J4 Consortium Mitsui Conventional 2004 137,672 Steam 9265500DWIPUTRA P.T. Humpuss
TransMitsubishi Conventional 1994 127,386 Steam 9043677
EAST ENERGY Sinokor Merchant Marine
Chantiers de l’Atlantique
Conventional 1977 122,255 Steam 7360136
ECHIGO MARU NYK Mitsubishi Conventional 1983 125,568 Steam 8110203EJNAN K Line, MOL, NYK,
Mitsui, NakilatSamsung Conventional 2007 143,815 Steam 9334076
EKAPUTRA 1 P.T. Humpuss Trans
Mitsubishi Conventional 1990 136,400 Steam 8706155
ENERGY ADVANCE Tokyo Gas Kawaski Conventional 2005 144,590 Steam 9269180ENERGY ATLANTIC Alpha Tankers STX Conventional 2015 157,521 TFDE 9649328ENERGY CONFIDENCE
Tokyo Gas, NYK Kawaski Conventional 2009 152,880 Steam 9405588
ENERGY FRONTIER Tokyo Gas Kawaski Conventional 2003 144,596 Steam 9245720ENERGY HORIZON NYK, TLTC Kawaski Conventional 2011 177,441 Steam 9483877ENERGY NAVIGATOR
Tokyo Gas, MOL Kawaski Conventional 2008 147,558 Steam 9355264
ENERGY PROGRESS
MOL Kawaski Conventional 2006 144,596 Steam 9274226
ESSHU MARU Mitsubishi, MOL, Chubu Electric
Mitsubishi Conventional 2014 155,300 Steam 9666560
EXCALIBUR Excelerate, Teekay Daewoo Conventional 2002 138,000 Steam 9230050EXCEL Exmar, MOL Daewoo Conventional 2003 135,344 Steam 9246621EXCELERATE Exmar, Excelerate Daewoo FSRU 2006 135,313 Steam 9322255EXCELLENCE Excelerate Energy Daewoo FSRU 2005 138,124 Steam 9252539EXCELSIOR Exmar Daewoo FSRU 2005 138,000 Steam 9239616
72
IGU World Gas LNG Report — 2016 Edition

EXEMPLAR Excelerate Energy Daewoo FSRU 2010 151,072 Steam 9444649EXPEDIENT Excelerate Energy Daewoo FSRU 2010 147,994 Steam 9389643EXPERIENCE Excelerate Energy Daewoo FSRU 2014 173,660 TFDE 9638525EXPLORER Exmar, Excelerate Daewoo FSRU 2008 150,900 Steam 9361079EXPRESS Exmar, Excelerate Daewoo FSRU 2009 150,900 Steam 9361445EXQUISITE Excelerate Energy Daewoo FSRU 2009 151,035 Steam 9381134FORTUNE FSU Compass Energy Dunkerque
NormandieConventional 1981 130,000 Steam 7428471
FRAIHA NYK, K Line, MOL, Iino, Mitsui, Nakilat
Daewoo Q-Flex 2008 205,950 SSD 9360817
FSRU TOSCANA OLT Offshore LNG Toscana
Hyundai Converted FSRU
2004 137,500 Steam 9253284
FUJI LNG Cardiff Marine Kawaski Conventional 2004 144,596 Steam 9275359FUWAIRIT K Line, MOL, NYK,
NakilatSamsung Conventional 2004 138,262 Steam 9256200
GALEA Shell Mitsubishi Conventional 2002 135,269 Steam 9236614GALICIA SPIRIT Teekay Daewoo Conventional 2004 137,814 Steam 9247364GALLINA Shell Mitsubishi Conventional 2002 135,269 Steam 9236626GANDRIA Golar LNG HDW Conventional 1977 123,512 Steam 7361934GASELYS GDF SUEZ, NYK Chantiers de
l’AtlantiqueConventional 2007 151,383 DFDE 9320075
GASLOG CHELSEA GasLog Hanjin H.I. Conventional 2010 153,000 DFDE 9390185GASLOG SALEM GasLog Samsung Conventional 2015 155,000 TFDE 9638915GASLOG SANTIAGO GasLog Samsung Conventional 2013 154,948 TFDE 9600530GASLOG SARATOGA
GasLog Samsung Conventional 2014 155,000 TFDE 9638903
GASLOG SAVANNAH
GasLog Samsung Conventional 2010 154,948 TFDE 9352860
GASLOG SEATTLE GasLog Samsung Conventional 2013 154,948 TFDE 9634086GASLOG SHANGHAI
GasLog Samsung Conventional 2013 154,948 TFDE 9600528
GASLOG SINGAPORE
GasLog Samsung Conventional 2010 154,948 TFDE 9355604
GASLOG SKAGEN GasLog Samsung Conventional 2013 154,948 TFDE 9626285GASLOG SYDNEY GasLog Samsung Conventional 2013 154,948 TFDE 9626273GDF SUEZ CAPE ANN
Hoegh, MOL, TLTC
Samsung FSRU 2010 145,130 DFDE 9390680
GDF SUEZ GLOBAL ENERGY
GDF SUEZ Chantiers de l’Atlantique
Conventional 2004 74,130 Steam 9269207
GDF SUEZ NEPTUNE
Hoegh, MOL, TLTC
Samsung FSRU 2009 145,130 Steam 9385673
GDF SUEZ POINT FORTIN
MOL, Sumitomo, LNG JAPAN
Imabari Conventional 2010 154,982 Steam 9375721
GEMMATA Shell Mitsubishi Conventional 2004 135,269 Steam 9253222GHASHA National Gas
Shipping CoMitsui Conventional 1995 137,100 Steam 9038452
GIGIRA LAITEBO MOL, Itochu Hyundai Conventional 2010 173,870 TFDE 9360922GIMI Golar LNG Rosenberg
VerftConventional 1976 122,388 Steam 7382732
GOLAR ARCTIC Golar LNG Daewoo Conventional 2003 137,814 Steam 9253105GOLAR BEAR Golar LNG Samsung Conventional 2014 160,000 TFDE 9626039GOLAR CELSIUS Golar LNG Samsung Conventional 2013 160,000 TFDE 9626027GOLAR CRYSTAL Golar LNG Samsung Conventional 2014 160,000 TFDE 9624926
73
IGU World Gas LNG Report — 2016 Edition

GOLAR ESKIMO Golar LNG Samsung FSRU 2014 160,000 TFDE 9624940GOLAR FREEZE Golar LNG
PartnersHDW Converted
FSRU1977 126,000 Steam 7361922
GOLAR FROST Golar LNG Samsung Conventional 2014 160,000 TFDE 9655042GOLAR GLACIER ICBC Hyundai Conventional 2014 162,500 TFDE 9654696GOLAR GRAND Golar LNG
PartnersDaewoo Conventional 2005 145,700 Steam 9303560
GOLAR ICE ICBC Samsung Conventional 2015 160,000 TFDE 9637325GOLAR IGLOO Golar LNG
PartnersSamsung FSRU 2014 170,000 TFDE 9633991
GOLAR KELVIN ICBC Hyundai Conventional 2015 162,000 TFDE 9654701GOLAR MARIA Golar LNG
PartnersDaewoo Conventional 2006 145,700 Steam 9320374
GOLAR MAZO Golar LNG Partners
Mitsubishi Conventional 2000 135,000 Steam 9165011
GOLAR PENGUIN Golar LNG Samsung Conventional 2014 160,000 TFDE 9624938GOLAR SEAL Golar LNG Samsung Conventional 2013 160,000 TFDE 9624914GOLAR SNOW ICBC Samsung Conventional 2015 160,000 TFDE 9635315GOLAR SPIRIT Golar LNG
PartnersKawasaki Sakaide
Converted FSRU
1981 129,000 Steam 7373327
GOLAR TUNDRA Golar LNG Samsung FSRU 2015 170,000 TFDE 9655808GOLAR VIKING PT Equinox Hyundai Conventional 2005 140,000 Steam 9256767GOLAR WINTER Golar LNG
PartnersDaewoo Converted
FSRU2004 138,000 Steam 9256614
GRACE ACACIA NYK Hyundai Conventional 2007 146,791 Steam 9315707GRACE BARLERIA NYK Hyundai Conventional 2007 146,770 Steam 9315719GRACE COSMOS MOL, NYK Hyundai Conventional 2008 146,794 Steam 9323675GRACE DAHLIA NYK Kawaski Conventional 2013 177,425 Steam 9540716GRAND ANIVA NYK, Sovcomflot Mitsubishi Conventional 2008 145,000 Steam 9338955GRAND ELENA NYK, Sovcomflot Mitsubishi Conventional 2007 147,968 Steam 9332054GRAND MEREYA MOL, K Line,
PrimorskMitsui Conventional 2008 145,964 Steam 9338929
HANJIN MUSCAT Hanjin Shipping Co.
Hanjin H.I. Conventional 1999 138,366 Steam 9155078
HANJIN PYEONG TAEK
Hanjin Shipping Co.
Hanjin H.I. Conventional 1995 130,366 Steam 9061928
HANJIN RAS LAFFAN
Hanjin Shipping Co.
Hanjin H.I. Conventional 2000 138,214 Steam 9176008
HANJIN SUR Hanjin Shipping Co.
Hanjin H.I. Conventional 2000 138,333 Steam 9176010
HISPANIA SPIRIT Teekay Daewoo Conventional 2002 137,814 Steam 9230048HOEGH GALLANT Hoegh Hyundai FSRU 2014 170,000 TFDE 9653678HYUNDAI AQUAPIA Hyundai LNG
ShippingHyundai Conventional 2000 134,400 Steam 9179581
HYUNDAI COSMOPIA
Hyundai LNG Shipping
Hyundai Conventional 2000 134,308 Steam 9155157
HYUNDAI ECOPIA Hyundai LNG Shipping
Hyundai Conventional 2008 146,790 Steam 9372999
HYUNDAI GREENPIA
Hyundai LNG Shipping
Hyundai Conventional 1996 125,000 Steam 9075333
HYUNDAI OCEANPIA
Hyundai LNG Shipping
Hyundai Conventional 2000 134,300 Steam 9183269
HYUNDAI TECHNOPIA
Hyundai LNG Shipping
Hyundai Conventional 1999 134,524 Steam 9155145
74
IGU World Gas LNG Report — 2016 Edition

HYUNDAI UTOPIA Hyundai LNG Shipping
Hyundai Conventional 1994 125,182 Steam 9018555
IBERICA KNUTSEN Knutsen OAS Daewoo Conventional 2006 135,230 Steam 9326603IBRA LNG OSC, MOL Samsung Conventional 2006 145,951 Steam 9326689IBRI LNG OSC, MOL,
MitsubishiMitsubishi Conventional 2006 145,173 Steam 9317315
INDEPENDENCE Hoegh Hyundai FSRU 2014 170,132 TFDE 9629536ISH National Gas
Shipping CoMitsubishi Conventional 1995 137,512 Steam 9035864
K. ACACIA Korea Line Daewoo Conventional 2000 138,017 Steam 9157636K. FREESIA Korea Line Daewoo Conventional 2000 138,015 Steam 9186584K. JASMINE Korea Line Daewoo Conventional 2008 142,961 Steam 9373008K. MUGUNGWHA Korea Line Daewoo Conventional 2008 148,776 Steam 9373010KITA LNG Cardiff Marine Daewoo Conventional 2014 159,800 TFDE 9636723LALLA FATMA N’SOUMER
HYPROC Kawaski Conventional 2004 144,888 Steam 9275347
LARBI BEN M’HIDI HYPROC CNIM Conventional 1977 129,500 Steam 7400663LENA RIVER Dynagas Hyundai Conventional 2013 154,880 TFDE 9629598LIJMILIYA Nakilat Daewoo Q-Max 2009 258,019 SSD 9388819LNG ADAMAWA BGT Ltd. Hyundai Conventional 2005 142,656 Steam 9262211LNG AKWA IBOM BGT Ltd. Hyundai Conventional 2004 142,656 Steam 9262209LNG AQUARIUS Hanochem General
DynamicsConventional 1977 126,750 Steam 7390181
LNG BARKA OSC, OG, NYK, K Line
Kawaski Conventional 2008 152,880 Steam 9341299
LNG BAYELSA BGT Ltd. Hyundai Conventional 2003 137,500 Steam 9241267LNG BENUE BW Daewoo Conventional 2006 142,988 Steam 9267015LNG BONNY II Nigeria LNG Ltd Hyundai Conventional 2015 177,000 DFDE 9692002LNG BORNO NYK Samsung Conventional 2007 149,600 Steam 9322803LNG CROSS RIVER BGT Ltd. Hyundai Conventional 2005 142,656 Steam 9262223LNG DREAM NYK Kawaski Conventional 2006 147,326 Steam 9277620LNG EBISU MOL, KEPCO Kawaski Conventional 2008 147,546 Steam 9329291LNG ENUGU BW Daewoo Conventional 2005 142,988 Steam 9266994LNG FINIMA II Nigeria LNG Ltd Samsung Conventional 2015 170,000 DFDE 9690145LNG FLORA NYK, Osaka Gas Kawaski Conventional 1993 125,637 Steam 9006681LNG IMO BW Daewoo Conventional 2008 148,452 Steam 9311581LNG JAMAL NYK, Osaka Gas Mitsubishi Conventional 2000 136,977 Steam 9200316LNG JUPITER Osaka Gas, NYK Kawaski Conventional 2009 152,880 Steam 9341689LNG JUROJIN MOL, KEPCO Mitsubishi Conventional 2015 155,300 Steam
Reheat 9666998
LNG KANO BW Daewoo Conventional 2007 148,565 Steam 9311567LNG KOLT STX Pan Ocean Hanjin H.I. Conventional 2008 153,595 Steam 9372963LNG LERICI ENI Sestri Conventional 1998 63,993 Steam 9064085LNG LIBRA Hoegh General
DynamicsConventional 1979 126,000 Steam 7413232
LNG LOKOJA BW Daewoo Conventional 2006 148,471 Steam 9269960LNG MALEO MOL, NYK, K Line Mitsui Conventional 1989 127,544 Steam 8701791LNG OGUN NYK Samsung Conventional 2007 149,600 Steam 9322815LNG ONDO BW Daewoo Conventional 2007 148,478 Steam 9311579LNG OYO BW Daewoo Conventional 2005 142,988 Steam 9267003LNG PIONEER MOL Daewoo Conventional 2005 138,000 Steam 9256602
75
IGU World Gas LNG Report — 2016 Edition

LNG PORT-HARCOURT II
Nigeria LNG Ltd Samsung Conventional 2015 170,000 MEGI 9690157
LNG PORTOVENERE
ENI Sestri Conventional 1996 65,262 Steam 9064073
LNG RIVER NIGER BGT Ltd. Hyundai Conventional 2006 142,656 Steam 9262235LNG RIVER ORASHI BW Daewoo Conventional 2004 142,988 Steam 9266982LNG RIVERS BGT Ltd. Hyundai Conventional 2002 137,500 Steam 9216298LNG SOKOTO BGT Ltd. Hyundai Conventional 2002 137,500 Steam 9216303LNG VENUS Osaka Gas, MOL Mitsubishi Conventional 2014 155,300 Steam 9645736LOBITO Mitsui, NYK,
TeekaySamsung Conventional 2011 154,948 TFDE 9490961
LUCKY FSU Compass Energy Dunkerque Normandie
Conventional 1981 127,400 Steam 7428469
LUSAIL K Line, MOL, NYK, Nakilat
Samsung Conventional 2005 142,808 Steam 9285952
MADRID SPIRIT Teekay IZAR Conventional 2004 135,423 Steam 9259276MAGELLAN SPIRIT Teekay, Marubeni Samsung Conventional 2009 163,194 DFDE 9342487MALANJE Mitsui, NYK,
TeekaySamsung Conventional 2011 154,948 TFDE 9490959
MARAN GAS ACHILLES
Maran Gas Maritime
Hyundai Conventional 2015 174,000 MEGI 9682588
MARAN GAS ALEXANDRIA
Maran Gas Maritime
Hyundai Conventional 2015 164,000 TFDE 9650054
MARAN GAS APOLLONIA
Maran Gas Maritime
Hyundai Conventional 2014 164,000 TFDE 9633422
MARAN GAS ASCLEPIUS
Maran G.M, Nakilat
Daewoo Conventional 2005 142,906 Steam 9302499
MARAN GAS CORONIS
Maran G.M, Nakilat
Daewoo Conventional 2007 142,889 Steam 9331048
MARAN GAS DELPHI
Maran Gas Maritime
Daewoo Conventional 2014 159,800 TFDE 9633173
MARAN GAS EFESSOS
Maran Gas Maritime
Daewoo Conventional 2014 159,800 TFDE 9627497
MARAN GAS LINDOS
Maran Gas Maritime
Daewoo Conventional 2015 159,800 TFDE 9627502
MARAN GAS MYSTRAS
Maran Gas Maritime
Daewoo Conventional 2015 159,800 TFDE 9658238
MARAN GAS POSIDONIA
Maran Gas Maritime
Hyundai Conventional 2014 164,000 TFDE 9633434
MARAN GAS SPARTA
Maran Gas Maritime
Hyundai Conventional 2015 162,000 TFDE 9650042
MARAN GAS TROY Maran Gas Maritime
Daewoo Conventional 2015 159,800 TFDE 9658240
MARIB SPIRIT Teekay Samsung Conventional 2008 163,280 DFDE 9336749MATTHEW GDF SUEZ Newport
NewsConventional 1979 126,540 Steam 7391214
MEKAINES Nakilat Samsung Q-Max 2009 261,137 SSD 9397303MERIDIAN SPIRIT Teekay, Marubeni Samsung Conventional 2010 163,285 TFDE 9369904MESAIMEER Nakilat Hyundai Q-Flex 2009 211,986 SSD 9337729METHANE ALISON VICTORIA
BG Group Samsung Conventional 2007 145,000 Steam 9321768
METHANE BECKI ANNE
GasLog Samsung Conventional 2010 167,416 TFDE 9516129
METHANE HEATHER SALLY
BG Group Samsung Conventional 2007 142,702 Steam 9321744
76
IGU World Gas LNG Report — 2016 Edition

METHANE JANE ELIZABETH
GasLog Samsung Conventional 2006 145,000 Steam 9307190
METHANE JULIA LOUISE
GasLog Samsung Conventional 2010 167,416 TFDE 9412880
METHANE LYDON VOLNEY
BG Group Samsung Conventional 2006 145,000 Steam 9307205
METHANE MICKIE HARPER
BG Group Samsung Conventional 2010 167,400 TFDE 9520376
METHANE NILE EAGLE
BG, GasLog Samsung Conventional 2007 145,000 Steam 9321770
METHANE PATRICIA CAMILA
BG Group Samsung Conventional 2010 167,416 TFDE 9425277
METHANE PRINCESS
Golar LNG Partners
Daewoo Conventional 2003 136,086 Steam 9253715
METHANE RITA ANDREA
GasLog Samsung Conventional 2006 145,000 Steam 9307188
METHANE SHIRLEY ELISABETH
BG Group Samsung Conventional 2007 142,800 Steam 9321756
METHANE SPIRIT Teekay, Marubeni Samsung Conventional 2008 163,195 TFDE 9336737METHANIA Distrigas Boelwerf Conventional 1978 131,235 Steam 7357452MILAHA QATAR Nakilat, Qatar
Shpg., SocGenSamsung Conventional 2006 145,140 Steam 9321732
MILAHA RAS LAFFAN
Nakilat, Qatar Shpg., SocGen
Samsung Conventional 2004 136,199 Steam 9255854
MIN LU China LNG Ship Mgmt.
Hudong-Zhonghua
Conventional 2009 145,000 Steam 9305128
MIN RONG China LNG Ship Mgmt.
Hudong-Zhonghua
Conventional 2009 145,000 Steam 9305116
MOSTEFA BEN BOULAID
Sonatrach Ch.De La Ciotat
Conventional 1976 125,260 Steam 7359955
MOURAD DIDOUCHE
Sonatrach Chantiers de l’Atlantique
Conventional 1980 126,190 Steam 7400704
MOZAH Nakilat Samsung Q-Max 2008 261,988 SSD 9337755MRAWEH National Gas
Shipping CoKvaerner
MasaConventional 1996 135,000 Steam 9074638
MUBARAZ National Gas Shipping Co
Kvaerner Masa
Conventional 1996 135,000 Steam 9074626
MURWAB NYK, K Line, MOL, Iino, Mitsui, Nakilat
Daewoo Q-Flex 2008 205,971 SSD 9360805
NEO ENERGY Tsakos Hyundai Conventional 2007 146,838 Steam 9324277NIZWA LNG OSC, MOL Kawaski Conventional 2005 145,469 Steam 9294264NKOSSA II AP Moller Mitsubishi Conventional 1992 78,488 Steam 9003859NORTHWEST SANDERLING
North West Shelf Venture
Mitsubishi Conventional 1989 125,452 Steam 8608872
NORTHWEST SANDPIPER
North West Shelf Venture
Mitsui Conventional 1993 125,042 Steam 8913150
NORTHWEST SEAEAGLE
North West Shelf Venture
Mitsubishi Conventional 1992 125,541 Steam 8913174
NORTHWEST SHEARWATER
North West Shelf Venture
Kawaski Conventional 1991 125,660 Steam 8608705
NORTHWEST SNIPE
North West Shelf Venture
Mitsui Conventional 1990 127,747 Steam 8608884
NORTHWEST STORMPETREL
North West Shelf Venture
Mitsubishi Conventional 1994 125,525 Steam 9045132
77
IGU World Gas LNG Report — 2016 Edition

NORTHWEST SWAN
North West Shelf Venture
Daewoo Conventional 2004 140,500 Steam 9250725
NUSANTARA REGAS SATU
Golar LNG Partners
Rosenberg Verft
Converted FSRU
1977 125,003 Steam 7382744
OB RIVER Dynagas Hyundai Conventional 2007 146,791 Steam 9315692ONAIZA Nakilat Daewoo Q-Flex 2009 205,963 SSD 9397353PACIFIC ARCADIA NYK Mitsubishi Conventional 2014 145,400 Steam 9621077PACIFIC ENLIGHTEN
Kyushu Electric, TEPCO,
Mitsubishi, Mitsui, NYK, MOL
Mitsubishi Conventional 2009 147,800 Steam 9351971
PACIFIC EURUS TEPCO, NYK, Mitsubishi
Mitsubishi Conventional 2006 135,000 Steam 9264910
PACIFIC NOTUS TEPCO, NYK, Mitsubishi
Mitsubishi Conventional 2003 137,006 Steam 9247962
PALU LNG Cardiff Marine Daewoo Conventional 2014 159,800 TFDE 9636735PAPUA MOL, China LNG Hudong-
ZhonghuaConventional 2015 172,000 TFDE 9613135
PGN FSRU LAMPUNG
Hoegh Hyundai FSRU 2014 170,000 TFDE 9629524
POLAR SPIRIT Teekay I.H.I. Conventional 1993 88,100 Steam 9001772PROVALYS GDF SUEZ Chantiers de
l’AtlantiqueConventional 2006 151,383 DFDE 9306495
PSKOV Sovcomflot STX Conventional 2014 170,200 TFDE 9630028PUTERI DELIMA MISC Chantiers de
l’AtlantiqueConventional 1995 127,797 Steam 9030814
PUTERI DELIMA SATU
MISC Mitsui Conventional 2002 134,849 Steam 9211872
PUTERI FIRUS MISC Chantiers de l’Atlantique
Conventional 1997 127,689 Steam 9030840
PUTERI FIRUS SATU
MISC Mitsubishi Conventional 2004 134,865 Steam 9248502
PUTERI INTAN MISC Chantiers de l’Atlantique
Conventional 1994 127,694 Steam 9030802
PUTERI INTAN SATU
MISC Mitsubishi Conventional 2002 134,770 Steam 9213416
PUTERI MUTIARA SATU
MISC Mitsui Conventional 2005 134,861 Steam 9261205
PUTERI NILAM MISC Chantiers de l’Atlantique
Conventional 1995 127,756 Steam 9030826
PUTERI NILAM SATU
MISC Mitsubishi Conventional 2003 134,833 Steam 9229647
PUTERI ZAMRUD MISC Chantiers de l’Atlantique
Conventional 1996 127,751 Steam 9030838
PUTERI ZAMRUD SATU
MISC Mitsui Conventional 2004 134,870 Steam 9245031
RAAHI MOL, NYK, K Line, SCI, Nakilat
Daewoo Conventional 2004 138,077 Steam 9253703
RAMDANE ABANE Sonatrach Chantiers de l’Atlantique
Conventional 1981 126,190 Steam 7411961
RASHEEDA Nakilat Samsung Q-Max 2010 260,912 MEGI 9443413RIBERA DEL DUERO KNUTSEN
Knutsen OAS Daewoo Conventional 2010 173,400 TFDE 9477593
SALALAH LNG OSC, MOL Samsung Conventional 2005 148,174 Steam 9300817SCF MELAMPUS Sovcomflot STX Conventional 2015 170,200 TFDE 9654878
78
IGU World Gas LNG Report — 2016 Edition

SCF MITRE Sovcomflot STX Conventional 2015 170,200 TFDE 9654880SEISHU MARU Mitsubishi, NYK,
Chubu ElectricMitsubishi Conventional 2014 155,300 Steam 9666558
SENSHU MARU MOL, NYK, K Line Mitsui Conventional 1984 125,835 Steam 8014473SERI ALAM MISC Samsung Conventional 2005 145,572 Steam 9293832SERI AMANAH MISC Samsung Conventional 2006 142,795 Steam 9293844SERI ANGGUN MISC Samsung Conventional 2006 145,100 Steam 9321653SERI ANGKASA MISC Samsung Conventional 2006 142,786 Steam 9321665SERI AYU MISC Samsung Conventional 2007 143,474 Steam 9329679SERI BAKTI MISC Mitsubishi Conventional 2007 149,886 Steam 9331634SERI BALHAF MISC Mitsubishi Conventional 2009 154,567 TFDE 9331660SERI BALQIS MISC Mitsubishi Conventional 2009 154,747 TFDE 9331672SERI BEGAWAN MISC Mitsubishi Conventional 2007 149,964 Steam 9331646SERI BIJAKSANA MISC Mitsubishi Conventional 2008 149,822 Steam 9331658SESTAO KNUTSEN Knutsen OAS IZAR Conventional 2007 135,357 Steam 9338797SEVILLA KNUTSEN Knutsen OAS Daewoo Conventional 2010 173,400 TFDE 9414632SHAGRA Nakilat Samsung Q-Max 2009 261,988 SSD 9418365SHAHAMAH National Gas
Shipping CoKawaski Conventional 1994 137,756 Steam 9035852
SHEN HAI China LNG, CNOOC,
Shanghai LNG
Hudong-Zhonghua
Conventional 2012 142,741 Steam 9583677
SIMAISMA Maran G.M, Nakilat
Daewoo Conventional 2006 142,971 Steam 9320386
SK SPLENDOR SK Shipping Samsung Conventional 2000 135,540 Steam 9180231SK STELLAR SK Shipping Samsung Conventional 2000 135,540 Steam 9180243SK SUMMIT SK Shipping Daewoo Conventional 1999 135,933 Steam 9157624SK SUNRISE Iino Kaiun Kaisha Samsung Conventional 2003 135,505 Steam 9247194SK SUPREME SK Shipping Samsung Conventional 2000 136,320 Steam 9157739SOHAR LNG OSC, MOL Mitsubishi Conventional 2001 135,850 Steam 9210816SOLARIS GasLog Samsung Conventional 2014 154,948 TFDE 9634098SONANGOL BENGUELA
Mitsui, Sonangol, Sojitz
Daewoo Conventional 2011 160,500 Steam 9482304
SONANGOL ETOSHA
Mitsui, Sonangol, Sojitz
Daewoo Conventional 2011 160,500 Steam 9482299
SONANGOL SAMBIZANGA
Mitsui, Sonangol, Sojitz
Daewoo Conventional 2011 160,500 Steam 9475600
SOUTHERN CROSS MOL, China LNG Hudong-Zhonghua
Conventional 2015 169,295 Steam Reheat
9613147
SOYO Mitsui, NYK, Teekay
Samsung Conventional 2011 154,948 TFDE 9475208
SPIRIT OF HELA MOL, Itochu Hyundai Conventional 2009 173,800 TFDE 9361639STENA BLUE SKY Stena Bulk Daewoo Conventional 2006 142,988 Steam 9315393STENA CLEAR SKY Stena Bulk Daewoo Conventional 2011 173,593 TFDE 9413327STENA CRYSTAL SKY
Stena Bulk Daewoo Conventional 2011 173,611 TFDE 9383900
SUNRISE Shell Dunkerque Ateliers
Conventional 1977 126,813 Steam 7359670
TAITAR NO. 1 CPC, Mitsui, NYK Mitsubishi Conventional 2009 144,627 Steam 9403669TAITAR NO. 2 MOL, NYK Kawaski Conventional 2009 144,627 Steam 9403645TAITAR NO. 3 MOL, NYK Mitsubishi Conventional 2010 144,627 Steam 9403671TAITAR NO. 4 CPC, Mitsui, NYK Kawaski Conventional 2010 144,596 Steam 9403657
79
IGU World Gas LNG Report — 2016 Edition
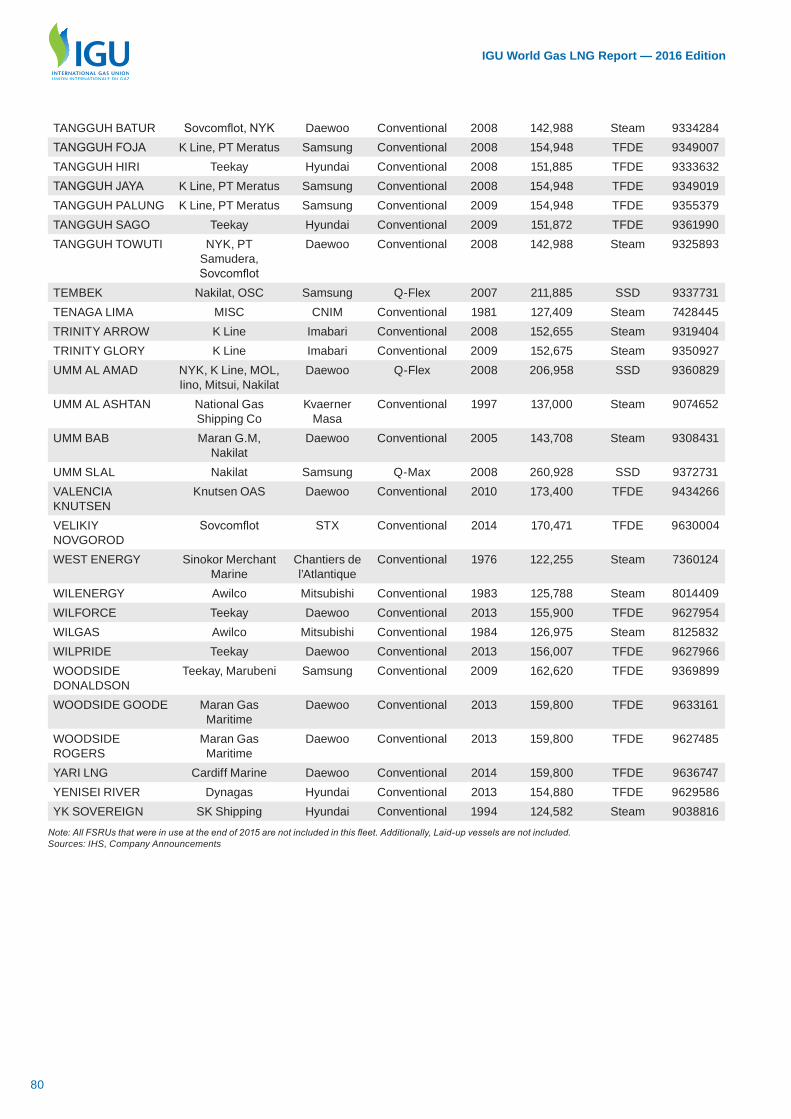
TANGGUH BATUR Sovcomflot, NYK Daewoo Conventional 2008 142,988 Steam 9334284TANGGUH FOJA K Line, PT Meratus Samsung Conventional 2008 154,948 TFDE 9349007TANGGUH HIRI Teekay Hyundai Conventional 2008 151,885 TFDE 9333632TANGGUH JAYA K Line, PT Meratus Samsung Conventional 2008 154,948 TFDE 9349019TANGGUH PALUNG K Line, PT Meratus Samsung Conventional 2009 154,948 TFDE 9355379TANGGUH SAGO Teekay Hyundai Conventional 2009 151,872 TFDE 9361990TANGGUH TOWUTI NYK, PT
Samudera, Sovcomflot
Daewoo Conventional 2008 142,988 Steam 9325893
TEMBEK Nakilat, OSC Samsung Q-Flex 2007 211,885 SSD 9337731TENAGA LIMA MISC CNIM Conventional 1981 127,409 Steam 7428445TRINITY ARROW K Line Imabari Conventional 2008 152,655 Steam 9319404TRINITY GLORY K Line Imabari Conventional 2009 152,675 Steam 9350927UMM AL AMAD NYK, K Line, MOL,
Iino, Mitsui, NakilatDaewoo Q-Flex 2008 206,958 SSD 9360829
UMM AL ASHTAN National Gas Shipping Co
Kvaerner Masa
Conventional 1997 137,000 Steam 9074652
UMM BAB Maran G.M, Nakilat
Daewoo Conventional 2005 143,708 Steam 9308431
UMM SLAL Nakilat Samsung Q-Max 2008 260,928 SSD 9372731VALENCIA KNUTSEN
Knutsen OAS Daewoo Conventional 2010 173,400 TFDE 9434266
VELIKIY NOVGOROD
Sovcomflot STX Conventional 2014 170,471 TFDE 9630004
WEST ENERGY Sinokor Merchant Marine
Chantiers de l’Atlantique
Conventional 1976 122,255 Steam 7360124
WILENERGY Awilco Mitsubishi Conventional 1983 125,788 Steam 8014409WILFORCE Teekay Daewoo Conventional 2013 155,900 TFDE 9627954WILGAS Awilco Mitsubishi Conventional 1984 126,975 Steam 8125832WILPRIDE Teekay Daewoo Conventional 2013 156,007 TFDE 9627966WOODSIDE DONALDSON
Teekay, Marubeni Samsung Conventional 2009 162,620 TFDE 9369899
WOODSIDE GOODE Maran Gas Maritime
Daewoo Conventional 2013 159,800 TFDE 9633161
WOODSIDE ROGERS
Maran Gas Maritime
Daewoo Conventional 2013 159,800 TFDE 9627485
YARI LNG Cardiff Marine Daewoo Conventional 2014 159,800 TFDE 9636747YENISEI RIVER Dynagas Hyundai Conventional 2013 154,880 TFDE 9629586YK SOVEREIGN SK Shipping Hyundai Conventional 1994 124,582 Steam 9038816
Note: All FSRUs that were in use at the end of 2015 are not included in this fleet. Additionally, Laid-up vessels are not included. Sources: IHS, Company Announcements
80
IGU World Gas LNG Report — 2016 Edition

Appendix 6: Table of LNG Vessel Orderbook
Ship Name Shipowner Shipbuilder Type Delivery Year
Capacity (cm)
Propulsion Type
IMO #
ASIA INTEGRITY Chevron Samsung Conventional 2016 154,948 TFDE 9680188ASIA VENTURE Chevron Samsung Conventional 2016 154,948 TFDE 9680190BISHU MARU Trans Pacific
ShippingKawasaki Sakaide
Conventional 2016 164,700 Steam Reheat
9691137
CASTILLO DE CALDELAS
Elcano Imabari Conventional 2017 178,000 MEGI 9742819
CASTILLO DE MERIDA
Elcano Imabari Conventional 2017 178,000 MEGI 9742807
CESI GLADSTONE China Shipping Group
Hudong-Zhonghua
Conventional 2016 174,000 TFDE 9672820
CLEAN VISION Dynagas Hyundai Conventional 2016 162,000 TFDE 9655456CREOLE SPIRIT Teekay Daewoo Conventional 2016 173,400 MEGI 9681687DAEWOO 2411 Teekay Daewoo Conventional 2016 173,400 MEGI 9721401DAEWOO 2415 Maran Gas
MaritimeDaewoo Conventional 2016 173,400 TFDE 9732371
DAEWOO 2416 Teekay Daewoo Conventional 2017 173,400 MEGI 9705641DAEWOO 2417 Teekay Daewoo Conventional 2017 173,400 MEGI 9705653DAEWOO 2421 Dynagas Daewoo Conventional 2017 172,000 TFDE 9768368DAEWOO 2422 Dynagas Daewoo Conventional 2017 172,000 TFDE 9768370DAEWOO 2423 Teekay Daewoo Conventional 2017 172,000 TFDE 9750696DAEWOO 2424 Teekay Daewoo Conventional 2018 172,000 TFDE 9750701DAEWOO 2425 Teekay Daewoo Conventional 2018 172,000 TFDE 9750713DAEWOO 2426 MOL Daewoo Conventional 2018 172,000 TFDE 9750658DAEWOO 2427 Dynagas Daewoo Conventional 2018 172,000 TFDE 9768382DAEWOO 2428 Dynagas Daewoo Conventional 2018 172,000 TFDE 9768394DAEWOO 2429 Dynagas Daewoo Conventional 2018 172,000 TFDE 9768526DAEWOO 2430 Teekay Daewoo Conventional 2019 172,000 TFDE 9750725DAEWOO 2431 Teekay Daewoo Conventional 2019 172,000 TFDE 9750737DAEWOO 2432 MOL Daewoo Conventional 2018 172,000 TFDE 9750660DAEWOO 2433 Teekay Daewoo Conventional 2020 172,000 TFDE 9750749DAEWOO 2434 MOL Daewoo Conventional 2019 172,000 TFDE 9750672DAEWOO 2435 BW Daewoo Conventional 2017 174,300 MEGI 9758064DAEWOO 2436 BW Daewoo Conventional 2018 174,300 MEGI 9758076DAEWOO 2441 BP Daewoo Conventional 2018 174,000 MEGI 9766530DAEWOO 2442 BP Daewoo Conventional 2018 174,000 MEGI 9766542DAEWOO 2443 BP Daewoo Conventional 2018 174,000 MEGI 9766554DAEWOO 2444 BP Daewoo Conventional 2018 174,000 MEGI 9766566DAEWOO 2445 BP Daewoo Conventional 2019 174,000 MEGI 9766578DAEWOO 2446 BP Daewoo Conventional 2019 174,000 MEGI 9766580DAEWOO 2447 Frontline
ManagementDaewoo Conventional 2017 173,400 MEGI 9762261
DAEWOO 2448 Frontline Management
Daewoo Conventional 2017 174,000 MEGI 9762273
DAEWOO 2449 Korea Line Daewoo Conventional 2017 174,000 MEGI 9761827DAEWOO 2450 Korea Line Daewoo Conventional 2017 174,000 MEGI 9761839DAEWOO 2451 Hyundai LNG
ShippingDaewoo Conventional 2017 174,000 MEGI 9761841
81
IGU World Gas LNG Report — 2016 Edition
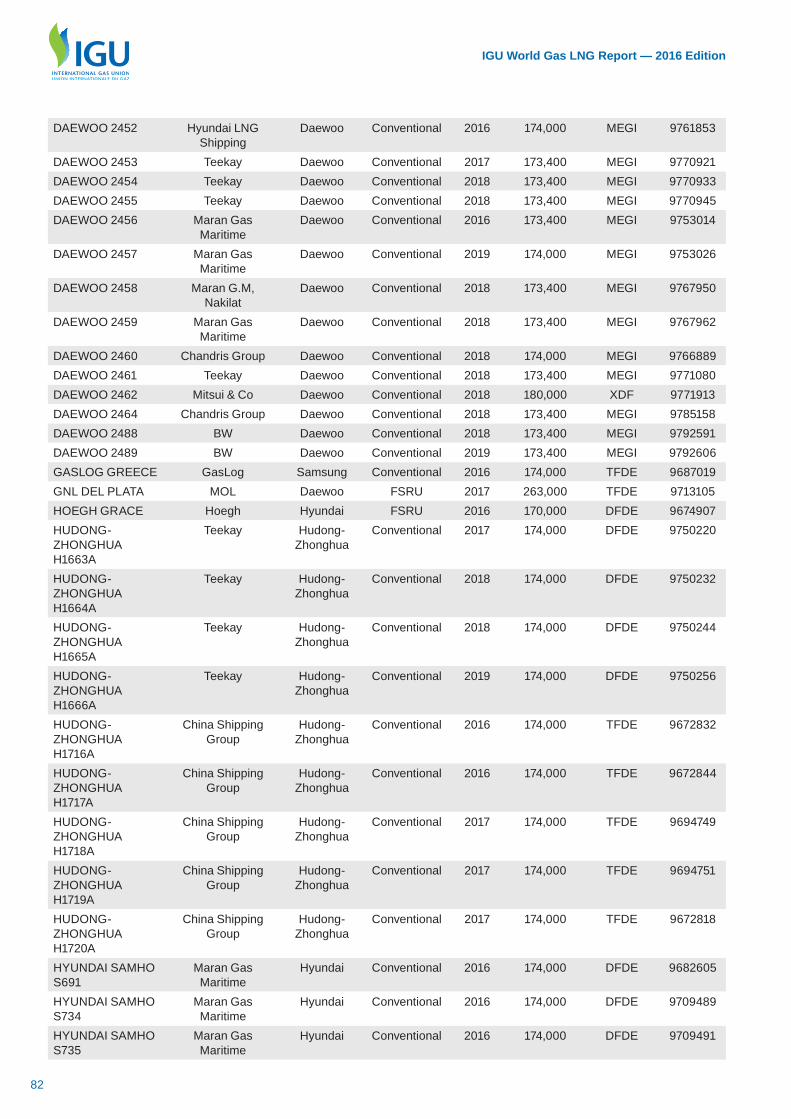
DAEWOO 2452 Hyundai LNG Shipping
Daewoo Conventional 2016 174,000 MEGI 9761853
DAEWOO 2453 Teekay Daewoo Conventional 2017 173,400 MEGI 9770921DAEWOO 2454 Teekay Daewoo Conventional 2018 173,400 MEGI 9770933DAEWOO 2455 Teekay Daewoo Conventional 2018 173,400 MEGI 9770945DAEWOO 2456 Maran Gas
MaritimeDaewoo Conventional 2016 173,400 MEGI 9753014
DAEWOO 2457 Maran Gas Maritime
Daewoo Conventional 2019 174,000 MEGI 9753026
DAEWOO 2458 Maran G.M, Nakilat
Daewoo Conventional 2018 173,400 MEGI 9767950
DAEWOO 2459 Maran Gas Maritime
Daewoo Conventional 2018 173,400 MEGI 9767962
DAEWOO 2460 Chandris Group Daewoo Conventional 2018 174,000 MEGI 9766889DAEWOO 2461 Teekay Daewoo Conventional 2018 173,400 MEGI 9771080DAEWOO 2462 Mitsui & Co Daewoo Conventional 2018 180,000 XDF 9771913DAEWOO 2464 Chandris Group Daewoo Conventional 2018 173,400 MEGI 9785158DAEWOO 2488 BW Daewoo Conventional 2018 173,400 MEGI 9792591DAEWOO 2489 BW Daewoo Conventional 2019 173,400 MEGI 9792606GASLOG GREECE GasLog Samsung Conventional 2016 174,000 TFDE 9687019GNL DEL PLATA MOL Daewoo FSRU 2017 263,000 TFDE 9713105HOEGH GRACE Hoegh Hyundai FSRU 2016 170,000 DFDE 9674907HUDONG-ZHONGHUA H1663A
Teekay Hudong-Zhonghua
Conventional 2017 174,000 DFDE 9750220
HUDONG-ZHONGHUA H1664A
Teekay Hudong-Zhonghua
Conventional 2018 174,000 DFDE 9750232
HUDONG-ZHONGHUA H1665A
Teekay Hudong-Zhonghua
Conventional 2018 174,000 DFDE 9750244
HUDONG-ZHONGHUA H1666A
Teekay Hudong-Zhonghua
Conventional 2019 174,000 DFDE 9750256
HUDONG-ZHONGHUA H1716A
China Shipping Group
Hudong-Zhonghua
Conventional 2016 174,000 TFDE 9672832
HUDONG-ZHONGHUA H1717A
China Shipping Group
Hudong-Zhonghua
Conventional 2016 174,000 TFDE 9672844
HUDONG-ZHONGHUA H1718A
China Shipping Group
Hudong-Zhonghua
Conventional 2017 174,000 TFDE 9694749
HUDONG-ZHONGHUA H1719A
China Shipping Group
Hudong-Zhonghua
Conventional 2017 174,000 TFDE 9694751
HUDONG-ZHONGHUA H1720A
China Shipping Group
Hudong-Zhonghua
Conventional 2017 174,000 TFDE 9672818
HYUNDAI SAMHO S691
Maran Gas Maritime
Hyundai Conventional 2016 174,000 DFDE 9682605
HYUNDAI SAMHO S734
Maran Gas Maritime
Hyundai Conventional 2016 174,000 DFDE 9709489
HYUNDAI SAMHO S735
Maran Gas Maritime
Hyundai Conventional 2016 174,000 DFDE 9709491
82
IGU World Gas LNG Report — 2016 Edition

HYUNDAI SAMHO S856
Teekay Hyundai Conventional 2019 174,000 MEGI 9781918
HYUNDAI SAMHO S857
Teekay Hyundai Conventional 2019 174,000 MEGI 9781920
HYUNDAI ULSAN Hoegh Hyundai FSRU 2017 170,000 TFDE 9762962HYUNDAI ULSAN 2800
GasLog Hyundai Conventional 2017 174,000 XDF 9748899
HYUNDAI ULSAN 2801
GasLog Hyundai Conventional 2017 174,000 XDF 9748904
Hyundai Ulsan 2865 Hoegh Hyundai FSRU 2019 170,000 - 9780354IMABARI SAIJO 8200
K Line Imabari Conventional 2020 178,000 Steam 9778923
IMABARI SAIJO 8215
Imabari Conventional 2022 178,000 Steam 9789037
IMABARI SAIJO 8216
Imabari Conventional 2022 178,000 Steam 9789049
IMABARI SAIJO 8217
Imabari Conventional 2022 178,000 Steam 9789051
JAPAN MARINE UNITED TSU 5074
MOL Japan Marine Conventional 2018 165,000 Steam 9758856
JMU TSU 5070 MOL Japan Marine Conventional 2017 165,000 TFDE 9736092JMU TSU 5071 NYK Japan Marine Conventional 2017 165,000 TFDE 9752565JMU TSU 5072 MOL Japan Marine Conventional 2017 165,000 Steam 9758832JMU TSU 5073 MOL Japan Marine Conventional 2018 165,000 Steam 9758844KALININGRAD Gazprom JSC Hyundai FSRU 2017 174,000 TFDE 9778313KAWASAKI SAKAIDE 1718
K Line Kawaski Conventional 2016 182,000 TFDE 9698123
KAWASAKI SAKAIDE 1720
Kawasaki Kawaski Conventional 2016 164,700 Steam Reheat
9749609
KAWASAKI SAKAIDE 1728
Mitsui & Co Kawasaki Sakaide
Conventional 2017 155,000 TFDE 9759240
KAWASAKI SAKAIDE 1729
Mitsui & Co Kawasaki Sakaide
Conventional 2017 155,000 TFDE 9759252
KAWASAKI SAKAIDE 1731
Kawasaki Sakaide
Conventional 2017 177,000 TFDE 9774135
KAWASAKI SAKAIDE 1734
Kawasaki Sakaide
Conventional 2018 177,000 DFDE 9791200
KAWASAKI SAKAIDE 1735
Kawasaki Sakaide
Conventional 2018 177,000 DFDE 9791212
KAWASAKI SAKAIDE 3
K Line Kawasaki Sakaide
Conventional 2016 164,700 Steam Reheat
9766023
KUMUL MOL, China LNG Hudong-Zhonghua
Conventional 2016 172,000 SSD 9613161
LA MANCHA KNUTSEN
Knutsen OAS Hyundai Conventional 2016 176,300 MEGI 9721724
LNG ABALAMABIE Nigeria LNG Ltd Samsung Conventional 2016 170,000 TFDE 9690171LNG ABUJA II Nigeria LNG Ltd Samsung Conventional 2016 170,000 DFDE 9690169LNG FUKUROKUJU
MOL, KEPCO Kawasaki Sakaide
Conventional 2016 164,700 Steam Reheat
9666986
LNG LAGOS Nigeria LNG Ltd Hyundai Conventional 2016 177,000 DFDE 9692014LNG MARS Osaka Gas, MOL Mitsubishi Conventional 2016 153,000 Steam
Reheat 9645748
LNG SATURN MOL Mitsubishi Conventional 2016 153,000 Steam Reheat
9696149
83
IGU World Gas LNG Report — 2016 Edition
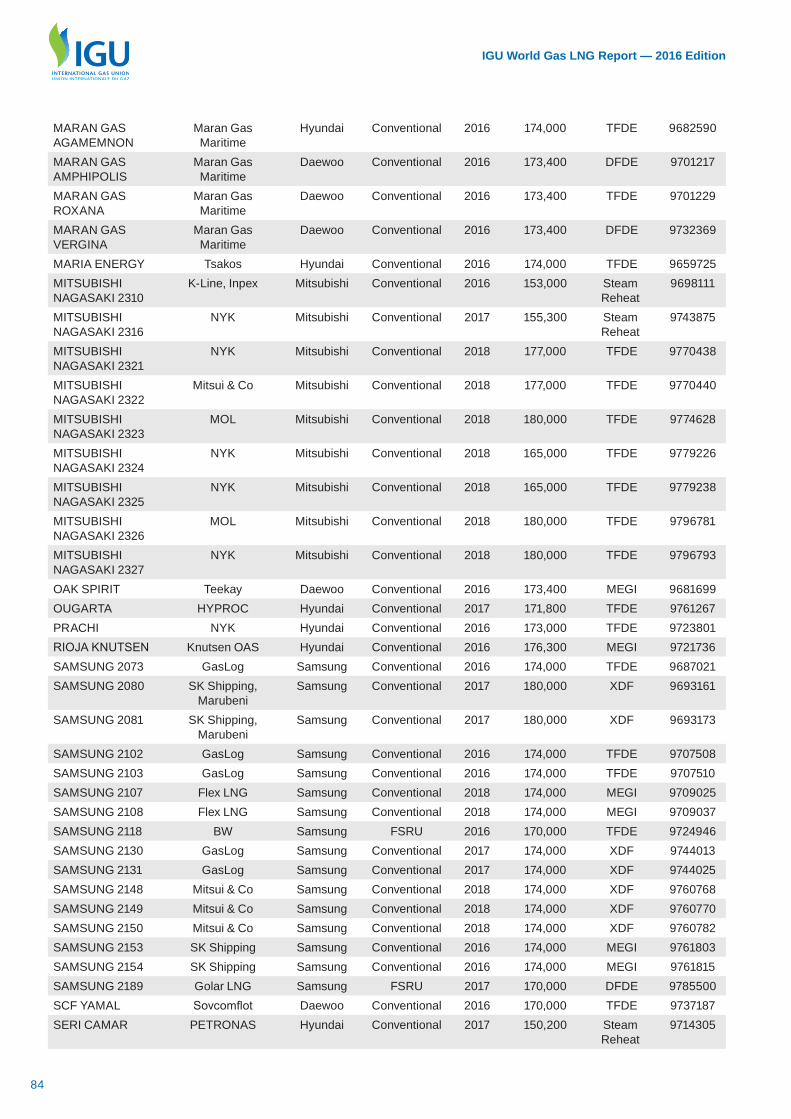
MARAN GAS AGAMEMNON
Maran Gas Maritime
Hyundai Conventional 2016 174,000 TFDE 9682590
MARAN GAS AMPHIPOLIS
Maran Gas Maritime
Daewoo Conventional 2016 173,400 DFDE 9701217
MARAN GAS ROXANA
Maran Gas Maritime
Daewoo Conventional 2016 173,400 TFDE 9701229
MARAN GAS VERGINA
Maran Gas Maritime
Daewoo Conventional 2016 173,400 DFDE 9732369
MARIA ENERGY Tsakos Hyundai Conventional 2016 174,000 TFDE 9659725MITSUBISHI NAGASAKI 2310
K-Line, Inpex Mitsubishi Conventional 2016 153,000 Steam Reheat
9698111
MITSUBISHI NAGASAKI 2316
NYK Mitsubishi Conventional 2017 155,300 Steam Reheat
9743875
MITSUBISHI NAGASAKI 2321
NYK Mitsubishi Conventional 2018 177,000 TFDE 9770438
MITSUBISHI NAGASAKI 2322
Mitsui & Co Mitsubishi Conventional 2018 177,000 TFDE 9770440
MITSUBISHI NAGASAKI 2323
MOL Mitsubishi Conventional 2018 180,000 TFDE 9774628
MITSUBISHI NAGASAKI 2324
NYK Mitsubishi Conventional 2018 165,000 TFDE 9779226
MITSUBISHI NAGASAKI 2325
NYK Mitsubishi Conventional 2018 165,000 TFDE 9779238
MITSUBISHI NAGASAKI 2326
MOL Mitsubishi Conventional 2018 180,000 TFDE 9796781
MITSUBISHI NAGASAKI 2327
NYK Mitsubishi Conventional 2018 180,000 TFDE 9796793
OAK SPIRIT Teekay Daewoo Conventional 2016 173,400 MEGI 9681699OUGARTA HYPROC Hyundai Conventional 2017 171,800 TFDE 9761267PRACHI NYK Hyundai Conventional 2016 173,000 TFDE 9723801RIOJA KNUTSEN Knutsen OAS Hyundai Conventional 2016 176,300 MEGI 9721736SAMSUNG 2073 GasLog Samsung Conventional 2016 174,000 TFDE 9687021SAMSUNG 2080 SK Shipping,
MarubeniSamsung Conventional 2017 180,000 XDF 9693161
SAMSUNG 2081 SK Shipping, Marubeni
Samsung Conventional 2017 180,000 XDF 9693173
SAMSUNG 2102 GasLog Samsung Conventional 2016 174,000 TFDE 9707508SAMSUNG 2103 GasLog Samsung Conventional 2016 174,000 TFDE 9707510SAMSUNG 2107 Flex LNG Samsung Conventional 2018 174,000 MEGI 9709025SAMSUNG 2108 Flex LNG Samsung Conventional 2018 174,000 MEGI 9709037SAMSUNG 2118 BW Samsung FSRU 2016 170,000 TFDE 9724946SAMSUNG 2130 GasLog Samsung Conventional 2017 174,000 XDF 9744013SAMSUNG 2131 GasLog Samsung Conventional 2017 174,000 XDF 9744025SAMSUNG 2148 Mitsui & Co Samsung Conventional 2018 174,000 XDF 9760768SAMSUNG 2149 Mitsui & Co Samsung Conventional 2018 174,000 XDF 9760770SAMSUNG 2150 Mitsui & Co Samsung Conventional 2018 174,000 XDF 9760782SAMSUNG 2153 SK Shipping Samsung Conventional 2016 174,000 MEGI 9761803SAMSUNG 2154 SK Shipping Samsung Conventional 2016 174,000 MEGI 9761815SAMSUNG 2189 Golar LNG Samsung FSRU 2017 170,000 DFDE 9785500SCF YAMAL Sovcomflot Daewoo Conventional 2016 170,000 TFDE 9737187SERI CAMAR PETRONAS Hyundai Conventional 2017 150,200 Steam
Reheat 9714305
84
IGU World Gas LNG Report — 2016 Edition

SERI CAMELLIA PETRONAS Hyundai Conventional 2016 150,200 Steam Reheat
9714276
SERI CEMARA PETRONAS Hyundai Conventional 2017 150,200 Steam Reheat
9756389
SERI CEMPAKA PETRONAS Hyundai Conventional 2017 150,200 Steam Reheat
9714290
SERI CENDERAWASIH
PETRONAS Hyundai Conventional 2016 150,200 Steam Reheat
9714288
TESSALA HYPROC Hyundai Conventional 2016 171,800 TFDE 9761243WOODSIDE CHANEY
Maran Gas Maritime
Hyundai Conventional 2016 174,000 TFDE 9682576
XIAMEN Landmark Capital Ltd
Xiamen Shipbuilding
Industry
Conventional 2017 45,000 9769855
Note: All Converted FLNG and FSU vessels are not included in this fleet. However, FSRU - not converted FSRUs - are included as the tankers could act as conventional carriers if necessary. Sources: IHS, Company Announcements.
Appendix 7: Table of FSRU and Laid-up Vessels
Ship Name Shipowner Shipbuilder Type Delivery Year
Capacity (cm)
Propulsion Type
IMO # Status at end-2015
BW SINGAPORE BW Samsung FSRU 2015 170,000 TFDE 9684495 Chartered as FSRU
EXCELLENCE Excelerate Energy
Daewoo FSRU 2005 138,124 Steam 9252539 Chartered as FSRU
EXEMPLAR Excelerate Energy
Daewoo FSRU 2010 151,072 Steam 9444649 Chartered as FSRU
EXPEDIENT Excelerate Energy
Daewoo FSRU 2010 147,994 Steam 9389643 Chartered as FSRU
EXPERIENCE Excelerate Energy
Daewoo FSRU 2014 173,660 TFDE 9638525 Chartered as FSRU
EXPLORER Exmar, Excelerate
Daewoo FSRU 2008 150,900 Steam 9361079 Chartered as FSRU
EXQUISITE Excelerate Energy
Daewoo FSRU 2009 151,035 Steam 9381134 Chartered as FSRU
FSRU TOSCANA OLT Offshore
LNG Toscana
Hyundai Converted FSRU
2004 137,500 Steam 9253284 Chartered as FSRU
GDF SUEZ CAPE ANN
Hoegh, MOL, TLTC
Samsung FSRU 2010 145,130 DFDE 9390680 Chartered as FSRU
GOLAR ESKIMO Golar LNG Samsung FSRU 2014 160,000 TFDE 9624940 Chartered as FSRU
GOLAR FREEZE Golar LNG Partners
HDW Converted FSRU
1977 126,000 Steam 7361922 Chartered as FSRU
GOLAR IGLOO Golar LNG Partners
Samsung FSRU 2014 170,000 TFDE 9633991 Chartered as FSRU
GOLAR SPIRIT Golar LNG Partners
Kawasaki Sakaide
Converted FSRU
1981 129,000 Steam 7373327 Chartered as FSRU
GOLAR WINTER Golar LNG Partners
Daewoo Converted FSRU
2004 138,000 Steam 9256614 Chartered as FSRU
HOEGH GALLANT Hoegh Hyundai FSRU 2014 170,000 TFDE 9653678 Chartered as FSRU
INDEPENDENCE Hoegh Hyundai FSRU 2014 170,132 TFDE 9629536 Chartered as FSRU
NUSANTARA REGAS SATU
Golar LNG Partners
Rosenberg Verft
Converted FSRU
1977 125,003 Steam 7382744 Chartered as FSRU
85
IGU World Gas LNG Report — 2016 Edition

PGN FSRU LAMPUNG
Hoegh Hyundai FSRU 2014 170,000 TFDE 9629524 Chartered as FSRU
BALTIC ENERGY Sinokor Merchant Marine
Kawaski Conventional 1983 125,929 Steam 8013950 Laid-up
GAEA Golar LNG General Dynamics
Conventional 1980 126,530 Steam 7619575 Laid-up
GRACE ENERGY Sinokor Merchant Marine
Mitsubishi Conventional 1989 127,580 Steam 8702941 Laid-up
LNG CAPRICORN Nova Shipping & Logistics
General Dynamics
Conventional 1978 126,750 Steam 7390208 Laid-up
LNG GEMINI General Dynamics
General Dynamics
Conventional 1978 126,750 Steam 7390143 Laid-up
LNG LEO General Dynamics
General Dynamics
Conventional 1978 126,750 Steam 7390155 Laid-up
LNG TAURUS BGT Ltd. General Dynamics
Conventional 1979 126,750 Steam 7390167 Laid-up
LNG VESTA Tokyo Gas, MOL, Iino
Mitsubishi Conventional 1994 127,547 Steam 9020766 Laid-up
LNG VIRGO General Dynamics
General Dynamics
Conventional 1979 126,750 Steam 7390179 Laid-up
METHANE KARI ELIN
BG Group Samsung Conventional 2004 136,167 Steam 9256793 Laid-up
PACIFIC ENERGY Sinokor Merchant Marine
Kockums Conventional 1981 132,588 Steam 7708948 Laid-up
SOUTH ENERGY Sinokor Merchant Marine
General Dynamics
Conventional 1980 126,750 Steam 7619587 Laid-up
HILLI Golar LNG Rosenberg Verft
Converted FLNG
2017 124,890 Steam 7382720 Under conversion
WAKABA MARU Bumi Armada Berhad
Mitsui FSU 2016 127,209 Steam 8125868 Under conversion
TENAGA EMPAT MISC CNIM FSU 1981 130,000 Steam 7428433 Converted FSU
TENAGA SATU MISC Dunkerque Chantiers
FSU 1982 130,000 Steam 7428457 Converted FSU
Note: All vessels that are not participating in the Active Fleet and Orderbook are included here. These vessels are not included in the total available or eventually available shipping tonnage. Sources: IHS, Company Announcements
86
IGU World Gas LNG Report — 2016 Edition

Notes
__________________________________________________________________________________________________________
__________________________________________________________________________________________________________
__________________________________________________________________________________________________________
__________________________________________________________________________________________________________
__________________________________________________________________________________________________________
__________________________________________________________________________________________________________
__________________________________________________________________________________________________________
__________________________________________________________________________________________________________
__________________________________________________________________________________________________________
__________________________________________________________________________________________________________
__________________________________________________________________________________________________________
__________________________________________________________________________________________________________
__________________________________________________________________________________________________________
__________________________________________________________________________________________________________
__________________________________________________________________________________________________________
__________________________________________________________________________________________________________
__________________________________________________________________________________________________________
__________________________________________________________________________________________________________
__________________________________________________________________________________________________________
__________________________________________________________________________________________________________
__________________________________________________________________________________________________________
__________________________________________________________________________________________________________
__________________________________________________________________________________________________________
__________________________________________________________________________________________________________
__________________________________________________________________________________________________________
__________________________________________________________________________________________________________
__________________________________________________________________________________________________________
__________________________________________________________________________________________________________
__________________________________________________________________________________________________________
__________________________________________________________________________________________________________
__________________________________________________________________________________________________________
__________________________________________________________________________________________________________
__________________________________________________________________________________________________________
__________________________________________________________________________________________________________
__________________________________________________________________________________________________________
__________________________________________________________________________________________________________
__________________________________________________________________________________________________________
__________________________________________________________________________________________________________
__________________________________________________________________________________________________________
__________________________________________________________________________________________________________
__________________________________________________________________________________________________________
__________________________________________________________________________________________________________
87
IGU World Gas LNG Report — 2016 Edition

Enagás’ large experience as independent Transmission System Operator, TSO accredited by the EU, and leader in liquefi ed natural gas infrastuctures at the service of diversity of supply in Europe.
International leader in LNG infrastructures
Enagás supports the diversity of supply in Europe
Enagas_Europa_LNG_2016_inglés_210x297.indd 1 18/2/16 18:15
Notes
__________________________________________________________________________________________________________
__________________________________________________________________________________________________________
__________________________________________________________________________________________________________
__________________________________________________________________________________________________________
__________________________________________________________________________________________________________
__________________________________________________________________________________________________________
__________________________________________________________________________________________________________
__________________________________________________________________________________________________________
__________________________________________________________________________________________________________
__________________________________________________________________________________________________________
__________________________________________________________________________________________________________
__________________________________________________________________________________________________________
__________________________________________________________________________________________________________
__________________________________________________________________________________________________________
__________________________________________________________________________________________________________
__________________________________________________________________________________________________________
__________________________________________________________________________________________________________
__________________________________________________________________________________________________________
__________________________________________________________________________________________________________
__________________________________________________________________________________________________________
__________________________________________________________________________________________________________
__________________________________________________________________________________________________________
__________________________________________________________________________________________________________
__________________________________________________________________________________________________________
__________________________________________________________________________________________________________
__________________________________________________________________________________________________________
__________________________________________________________________________________________________________
__________________________________________________________________________________________________________
__________________________________________________________________________________________________________
__________________________________________________________________________________________________________
__________________________________________________________________________________________________________
__________________________________________________________________________________________________________
__________________________________________________________________________________________________________
__________________________________________________________________________________________________________
__________________________________________________________________________________________________________
__________________________________________________________________________________________________________
__________________________________________________________________________________________________________
__________________________________________________________________________________________________________
__________________________________________________________________________________________________________
__________________________________________________________________________________________________________
__________________________________________________________________________________________________________
__________________________________________________________________________________________________________
88
IGU World Gas LNG Report — 2016 Edition

Enagás’ large experience as independent Transmission System Operator, TSO accredited by the EU, and leader in liquefi ed natural gas infrastuctures at the service of diversity of supply in Europe.
International leader in LNG infrastructures
Enagás supports the diversity of supply in Europe
Enagas_Europa_LNG_2016_inglés_210x297.indd 1 18/2/16 18:15

IGU The International Gas Union (IGU), founded in 1931, is a worldwide non-profit organisation promoting the political, technical and economic progress of the gas industry with the mission to advocate gas as an integral part of a sustainable global energy system. The members are national associations and corporations of the gas industry. The working organisation of IGU covers the complete value chain of the gas industry upstream to downstream. For more information please visit www.igu.org.
International Gas UnionOffice of the Secretary Generalc/o Statoil ASAP.O. Box 3NO - 1330 FornebuNorwayTelephone: +47 51 99 00 00Fax: +47 67 80 56 01Email: [email protected]: www.igu.org
Published by the International Gas Union (IGU) Copyright © 2016 The entire content of this publication is protected by copyright, full details of which are available from the publisher. All rights reserved. No part of this part of this publication may be reproduced, stored in retrieval systems or transmitted in any form or by any means – electronic, mechanical, photocopying, recording or otherwise – without the prior permission of the copyright owner.