i’he of biological chemistry vol. issue february … · i’he journal of biological chemistry...
TRANSCRIPT

I ’ H E JOURNAL OF BIOLOGICAL CHEMISTRY Vol. 262, No. 6, Issue of February 25, pp. 2696-2703,1987 Printed in U.S.A.
Degradation in Vitro of Bacteriophage X N Protein by Lon Protease from Escherichia coZi*
(Received for publication, August 12, 1986)
Michael R. Maurizi From the Laboratory of Molecular Biology, National Cancer Institute, National Institutes of Health, Bethesda, Maryland 20892
Lon protease from Escherichia coli degraded X N protein in a reaction mixture consisting of the two homogeneous proteins, ATP, and MgCls in 50 mM Tris, Ph 8.0. Genetic and biochemical data had previously indicated that N protein is a substrate for Lon protease in vivo (Gottesman, S., Gottesman, M., Shaw, J. E., and Pearson, M. L. (1981) Cell 24, 225-233). Under conditions used for N protein degradation, several X and E. coli proteins, including native proteins, oxida- tively modified proteins, and cloned fragments of na- tive proteins, were not degraded by Lon protease. Deg- radation of N protein occurred with catalytic amounts of Lon protease and required the presence of ATP or an analog of ATP. This is the first demonstration of the selective degradation of a physiological substrate by Lon protease in vitro.
The turnover number for N protein degradation was -60 * 10 min” at pH 8.0 in 50 mM Tris/HCl, 25 m M MgC12 and 4 mM ATP. By comparison the turnover number for oxidized insulin B chain was 20 min” under these conditions. Kinetic studies suggest that N protein (So.s = 13 +, 5 FM) is intermediate between oxidized insulin B chain (So.5 = 160 -C 10 WM) and methylated casein (So.5 = 2.5 f 1 FM) in affinity for Lon protease. N protein was extensively degraded by Lon protease with an average of approximately six bonds cleaved per molecule. In N protein, as well as in oxidized insulin B chain and glucagon, Lon protease preferentially cut at bonds at which the carboxy group was contributed by an amino acid with an aliphatic side chain (leucine or alanine). However, not all such bonds of the substrates were cleaved, indicating that sequence or conformational determinants beyond the cleavage site affect the ability of Lon protease to de- grade a protein.
Lon protease is an ATP-dependent. protease coded by the lon gene of Escherichia coli (1, 2). In vivo lon mutants are defective in the degradation of certain missense and nonsense proteins (3) and in the degradation of abnormal proteins containing amino acid analogs (4, 5 ) . Lon mutants have well- defined phenotypes that can be explained by the decreased ability to degrade specific regdatory proteins-the SulA pro- tein in the case of UV sensitivity and the RcsA protein in the case of overproduction of capsular polysaccharide. Radioac- tive labeling in intact cells has provided direct evidence for the rapid degradation of SulA (6) and RcsA ( 7 ) in wild-type cells and a 4- to 30-fold reduced rate of degradation of these proteins in Lon cells. lon. also affects the stability in uiuo of
* The costs of publication of this article were defrayed in part by the payment of page charges. This article must therefore be hereby marked “aduertisenzent” in accordance with 18 U.S.C. Section 1734 solely to indicate this fact.
I_” -
the h N protein, as determined by both functional and bio- chemical assays of N levels (8). It appears likely then that Lon protease may be responsible for the rate-limiting step in the degradation of certain important regulatory proteins in vivo.
Purified Lon protease is a tetrameric enzyme (subunit M, = 90,000) that has an ATPase activity as well as an ATP- stimulated endoproteol-ytic activity (1, 2). Lon protease will cleave denatured proteins at multiple sites with the simulta- neous hydrolysis of 2 eq of ATP to ADP and inorganic phosphate per peptide bond cleaved (9,lO). Lon protease also cleaves small peptides (e.g. glucagon) and peptidyl naphthyl amides in the presence of nonhydrolyzable analogs of ATP (11). Waxman and Goldberg (10) have proposed that ATP and ADP bind allosterically to Lon protease and that the hydrolysis of ATP to ADP on the enzyme converts the Lon protease from an active to an inactive form. Studies with peptide substrates suggest that Lon protease has a substrate specificity similar to that of chymotrypsin (11).
This is the first detailed report on the activity in vitro of Lon protease on a physiological substrate. Homogeneous Lon protease has been isolated from a transformant of E. coli carrying multiple copies of the lon gene on a plasmid, and the degradation of purified X N protein by Lon protease in vitro has been studied. The results indicate N protein is selectively degraded by Lon protease and that the characteristics of the degradation reaction are similar to those described with casein or oxidized insulin B chain as substrates.
EXPERIMENTAL PROCEDURES
Materials-Casein, oxidized insulin B chain, glucagon, P-mercap- toethanol, o-phthalaldehyde and ATP were obtained from Sigma, high pressure liquid chromatography grade acetonitrile and meth- anol from Burdick and Jackson, amino acid standard H and trifluoro- acetic acid from Pierce Chemical Co. and micrococcal nuclease, ad- enylyl-P,y-methylene diphosphate, adenylyl-imidodiphosphate, and ATPyS’ from Boehringer-Mannheim. Water was distilled and further purified on a Milli-Q reagent grade system. Radionuclides were ob- tained from New England Nuclear. All other reagents were reagent grade. 0 protein and a mutant 0 protein comprising the amino terminal half of the wild-type protein were provided by Sue Wickner and the GalR protein of E. coli was a gift from A. Majumdar, both from National Cancer Institute, Bethesda, MD. The cI and Cro proteins as well as amino- and carboxyl-terminal fragments of cI protein were kindly provided by A. Pakula, Harvard University, Boston, MA.
Reverse Phase Chromatography-The peptide column used was a Vydac C18 column, 7.6 mm X 25 cm. Peptides were separated at room temperature with linear gradients of acetonitrile and HZ0 containing 0.05% trifluoroacetic acid at constant flow rate maintained by Beck- man lOOA and 110 pumps. A dual chamber dynamic mixer was used
* The abbreviations used are: ATPrS, adenosine 5’-(3-thio)tri- phosphate; Hepes, 4-(2-hydroxyethyl)-l-piperazineethanesulfonic acid; AMPPNP, adenyl-5’-yl imidodiphosphate; AMPPCP, adenyl- 5”yl (6,y-methylene) diphosphate.
2696

N Protein Degradation by Lon Protease 2697
for mixing the solvents which were deaerated by purging with helium. The detector was a Hitachi variable wavelength spectrophotometer equipped with a 20-pl analytical flow cell.
Preparation of Tritiated Casein-The procedure of Rice and Means was adapted (12). To a-casein, 1 ml of 5 mg/ml dissolved in 0.2 M sodium borate, pH 9.5, was added 40 p1 of 40 mM [3H]H&0 (100 pCi) on ice. After 2-3 min, 8-pl aliquots of 5 mg/ml NaBH, in 1 mM NaOH were added at 2-min intervals for 10 min. A final aliquot of 32 rl of NaBH, was added and after -30 min on ice, the sample was passed over a Bio-Rad PI0 column equilibrated in H20. The fractions with [met/~yl-~H]casein were frozen and stored at -20 "C. Acid-soluble radioactivity in this preparation was usually -2% of the total and increased slowly during storage. [meth~l-~HICasein contained 3000- 8000 dpmlpg depending on the preparation.
13646 lon 146 X cI857 ABam AH1) (5,8) carrying the plasmid pKC30 Preparation of N Protein-N protein was induced in cells (SG
(13) by raising the temperature of end log phase cultures (A6w = 1- 1.5) from 30 to 42 "C for 1 h. Cells were harvested in the presence of 5 mM NaN3 and stored at -20 "C until used. N protein was prepared by the method of Greenblatt et al. (14) with some modifications. Frozen cells (25 g) were evenly suspended in 100 ml of buffer (14) and broken in a French pressure cell a t 20,000 psi. After centrifugation for 1 h at 16,000 rpm, the extract was mixed with -40 ml of settled phosphocellulose and gently agitated for 2 h in the cold. This suspen- sion was then passed through a 5-cm diameter sinterred-glass funnel containing a 0.5-cm bed of phosphocellulose. The phosphocellulose was washed with 200 ml of buffer with 0.1 M potassium acetate and then with 100 ml of buffer containing 0.75 M potassium acetate. N protein was eluted with 4 (25 ml each) aliquots of buffer with 1 M potassium acetate. Ammonium sulfate precipitation and hydroxy apatite chromatography were done as described by Greenblatt et al. (14). Further purification was obtained by repeating the hydroxy apatite chromatography using the high performance column from Bio-Rad (Bio-Gel HPHT, 100 X 7.8 mm) with up to 3 mg of N protein. N protein appeared nearly homogeneous by SDS-gel electro- phoresis and by reverse phase chromatography and was active in the antitermination of RNA transcription assay described by Goda and Greenblatt (15). N protein was stored at -80 "C.
Assay and Detection of N Protein-Antitermination activity of N protein was assayed as described by Goda and Greenblatt (15). Routine detection of N protein was accomplished by spotting serial dilutions of the fractions on nitrocellulose, incubating the paper with rabbit anti-N protein antibody, and detecting the bound antibody with horseradish peroxidase conjugated-goat anti-rabbit IgG. Rabbit anti-N protein antibody was produced by subcutaneous injection of 0.45 mg of purified N protein followed by a second injection after 4 weeks. The antibody protein was purified by ammonium sulfate precipitation from serum (50% saturation followed by a second pre- cipitation with 45% saturation). Antibody was dissolved in 50 mM Tris, 100 mM NaCl, 1 mM EDTA, pH 8.0, and stored at 4 "C. The N protein used for antibody production was generously provided by J. Greenblatt, University of Toronto, Toronto, Canada.
Preparation and Assay of Lon Protease-Lon protease was pro- duced in cells (SG1094 Ion+) carrying a pBR322 derivative containing the lon gene (5). Cells were grown at 30 "C with gentle agitation and
and DEAE chromatography as described by Zehnbauer et al. (16). harvested at A, = 0.7. Lon protease was purified by phosphocellulose
Futher purification of 5-10 mg of Lon protease was obtained by chromatography on a high performance column (Bio-Gel TSK-5-PW, 75 X 7.5 mm) in Tris buffer, pH 7.5, using a gradient of NaCl for elution. Lon protease was >95% pure as seen by Coomassie Blue staining after gel electrophoresis in the presence of sodium dodecyl sulfate. Lon protease was stored at -20 "C in Tris buffer, pH 7.5, with 300 mM NaCI, 10% glycerol, 2 mM EDTA, and 2 mM dithio- threitol. Concentrations of Lon protease were estimated from the absorbance at 280 nm and an absorption coefficient of 1.0 (mg/ml"). Lon protease was initially assayed by measuring the appearance of trichloroacetic acid-soluble radioactivity following incubation of [methyL3H]casein in 50 mM Tris, pH 8.0, 25 mM MgC12, 4 mM ATP, and 0.2-1.0 pg of Lon protease for 1 h at 37 "C.
Isolation of Degradation Products of N Protein, Glucagon, and Oxidized Insulin B Chain-Substrates were incubated in 50 mM Tris, pH 8.0, with 25 mM MgC12, and 4 mM ATP and varying amounts of Lon protease. At desired times, samples were mixed with an equal volume of 7.4 M guanidine hydrochloride and injected onto a Vydac C18 column equilibrated with 0.05% trifluoroacetic acid in H,O. Peptides were eluted with gradients of acetonitrile containing 0.05% trifluoroacetic acid. Alternate peaks were pooled and reverse phase
chromatography was repeated using a flow rate of 0.5 ml/min and a gradient of 0.5% acetonitrile/min.
Amino Acid Analysis of Peptides-The amino terminal amino acids were determined by the dansylation method essentially as described by Weiner et a!. (17). Amino acid analysis was performed following hydrolysis at 155 "C for 45 min in 6 N HC1. For cysteine determination as cysteic acid, the peptides or the amino acid hydrolysate was treated a t room temperature for 4 h with performic acid (181, and the reagent was removed by centrifugal evaporation. Amino acids were reacted with o-phthalaldehyde for 1 min a t room temperature by mixing equal volumes of the amino acids in H 2 0 and the following reagent: 20 mM o-phthalaldehyde, 70 mM 0-mercaptoethanol, 1.5% (v/v) methanol, in 0.5 M K+ borate, pH 10.5. Separation of the amino acid derivatives was accomplished on a 5-pm IBM C18 column (4.5 X 150 mm) at 30 "C with a gradient of methanol and 0.075 M NaC1. A Gilson Spectro/glo Flow Fluorometer was used for detection and a Shimadzu C-R1A integrator was used for quantitation of peak areas.
Sodium Dodecyl Sulfate-Acrylamide Gel Electrophoresis-The buffer system of Laemmli (19) was used. Gels were 12% acrylamide, 0.32% bisacrylamide. Samples were prepared in the upper gel buffer (19) with 2% sodium dodecyl sulfate and 5% P-mercaptoethanol added.
RESULTS
Several bacteriophage X proteins are unstable in vivo or are degraded under specific physiological conditions (8, 20). A number of these A proteins as well as a stable E. coli protein were examined as substrates in vitro by incubating the purified proteins for 90 min a t 37 "C with purified Lon protease. Of the native proteins tested, only X N protein was degraded to a significant extent in the presence of Lon protease but was completely stable in the absence of Lon protease (Fig. 1, Panel A). The X repressors, cI and Cro, the X replication protein, 0 , and the E. coli galactose repressor were not degraded even after heat denaturation (Fig. 1, Panel B ) , although more drastic denaturation with trichloroacetic acid did cause Cro to become slightly sensitive to Lon protease (not shown). Proteolytic fragments of the CI repressor were also resistant to degradation by Lon protease, but a truncated 0 protein consisting of the amino terminal half of the protein was slowly degraded (at 4 0 % the rate of N protein) and when heat denatured was more rapidly degraded. N protein was degraded before and after heat denaturation. These results indicate that Lon protease is quite selective in proteolytically attacking native proteins and that denaturation or partial proteolytic cleavage is not sufficient to convert a protein into a good substrate for Lon protease. Goldberg and Waxman (10) have shown that proteins that are poor substrates for degradation by Lon protease also do not stimulate the ATPase activity of Lon protease.
A further indication of the weak interaction between Lon protease and nonsubstrate proteins was obtained by measur- ing casein degradation in the presence of 5- to 10-fold molar excesses of the different proteins. As shown in Table I, N protein effectively inhibited casein degradation by Lon pro- tease, but most of the proteins that were not substrates were not inhibitory. N protein has a K, of approximately 5 p~ for inhibition of casein degradation (data not shown), a value somewhat lower than the K , of N protein as a substrate (see Table 111). Cro protein also inhibited casein degradation al- though it is not a good substrate for Lon protease unless denatured. Most of the nonsubstrates have much lower affin- ity for Lon protease than has casein.
Activity of N Protein-Degradation of N protein by Lon protease has been observed in Tris, Hepes, and phosphate buffers, at pH 8 and 7, and at 37 or 4 "C. Under these various conditions, degradation of N protein showed similar require- ments for Lon protease and ATP (see below) and resulted in very similar peptide profiles when the degradation products

2698 N Protein Degradation by Lon Protease
N +Lon -Lon - - + - + - + - + - + - + - + - + - chea t denaturation
(2 rnin at 100 C)
I
FIG. 1. Degradation 50 mM Tris/HCl, pH 8.0, 25 mM MgCl,, 2 mM ATP, and -2 pg of one of the protein substrates indicated in the
of native and denatured proteins by Lon protease. All reaction mixtures contained
final volume of 15 pl. After 90-min incubations at 37 “C, an equal volume of 2 X electrophoresis sample buffer was added to each tube and the entire sample was prepared and run on 12% polyacrylamide gels in the presence of 0.1% sodium dodecyl sulfate by the standard procedure (see “Experimental Procedures”). The proteins used in
protein ( M , 33,000); cro, site-specific DNA-binding protein from X (M. 7,300); CIN, cloned fragment of cI (amino addition to N protein were: GalR, E. coli galactose repressor (M, 37,000); cI, X repressor ( M , 26,200); 0, X replication
Panel A , N protein was incubated with or without Lon protease (0.1 pg) as indicated. Panel B, all incubations acids 1-102); CIC, thermolysin fragment of CI (amino acids 122-236); 0/2, mutant 0 protein (amino acids 1-162).
contained Lon protease (0.1 pg). Incubations were performed in duplicate, but in each case one sample was heated at 100 “C for 2 min prior to addition of Lon protease and ATP. (+) samples heated prior to incubation; (-) samples not heated.
TABLE I Inhibition of casein degradation by alternative substrates
Addition” Casein degraded
cpm % None 1460 100 N 820 56 CI 1448 99 cro 860 59 CIN 1450 99 CIC 1470 101 GalR 1400 96
Degradation of casein was measured after incubation of a solution containing 5 pg of casein (3000 cpm/pg) and 1 pg of Lon protease with 50 pg of the indicated proteins for 30 min at 37 “C. The incubations were carried out in 100 pl of standard assay buffer containing 4 mM ATP. The identities of the proteins are given in the legend to Fig. 1.
were analyzed by reverse phase chromatography (see Fig. 3). Although there is no adequate assay for determining how much of the N protein is “native,” Goda and Greenblatt (15) have described an assay in which RNA transcription in uitro is increased in the presence of N protein presumably because N protein acts as an antiterminator and allows transcription through the tL1 terminator present on the plasmid DNA used as the template in uitro. The N protein prepared in this laboratory had the same activity per microgram as N protein prepared by Goda and Greenblatt. This activity was destroyed upon degradation of N protein by Lon protease but was not
lost during incubation of N protein without Lon protease. These results suggest N protein does not undergo irreversible denaturation prior to degradation and that Lon protease attacks the native N protein.
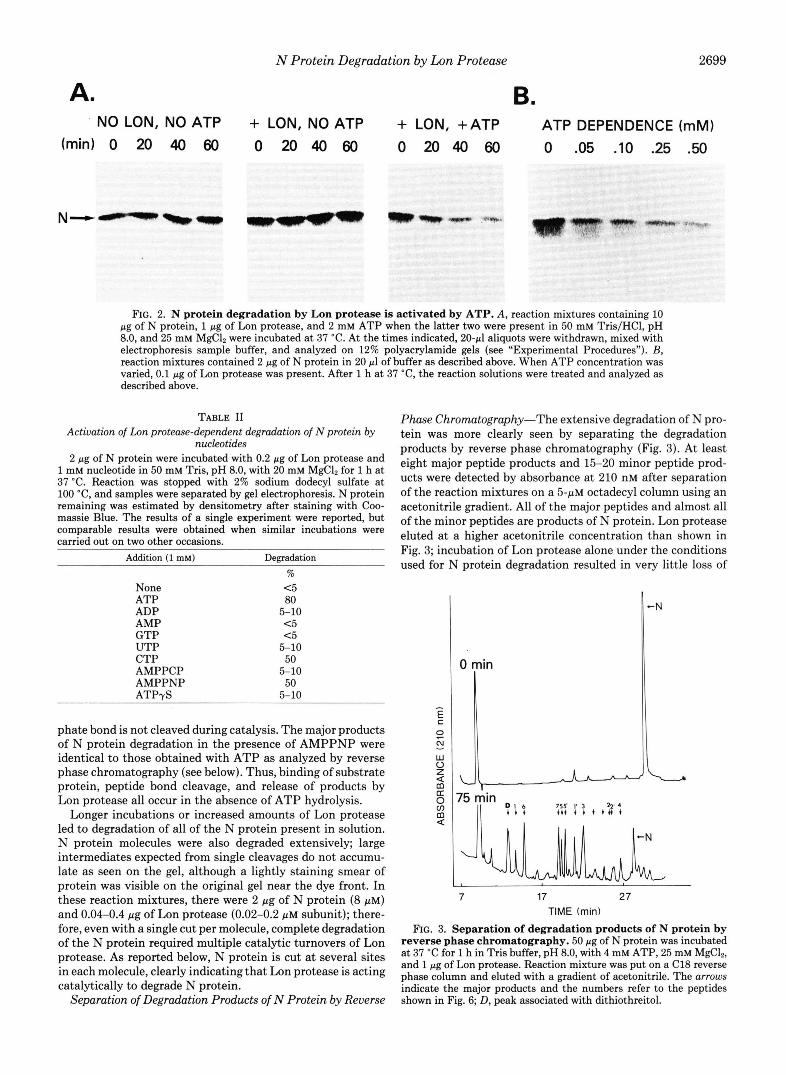
Nucleotide Requirement for N Protein Degradation by Lon Protease-Fig. 2A shows a time-dependent loss of intact N protein during incubation with Lon protease and ATP. In the absence of protease, the N protein was indefinitely stable. In the presence of Lon protease, omission of ATP resulted in no detectable degradation of N protein during 1 h of incubation. Under these conditions quite high concentrations of ATP were required to stimulate N protein degradation; below 0.5 mM ATP, the degradation is very slow (Fig. 2B). A partial explanation for the high concentration of ATP required is the presence of -20 mM phosphate in these incubations. Elimi- nation of phosphate slightly reduced the apparent So.s for ATP (data not shown).
N protein degradation was stimulated by several other ribonucleoside triphosphates in addition to ATP, as well as by the nonhydrolyzable analogs, AMPPNP, and to a lesser extent AMPPCP (Table 11). The rate of N protein degradation in the presence of AMPPMP was about half that observed with ATP, indicating that hydrolysis of ATP to ADP and Pi is not an absolute requirement for protein degradation by Lon protease. There was also no detectable breakdown of AMPPNP, AMPPCP, or ATP to AMP during incubations of N protein with Lon protease, indicating that the a,@ phos-
A. NO LON, NO ATP
(mid 0 20 40 60
N""
N Protein Degradation by Lon Protease 2699
B. + LON, NO ATP + LON, +ATP ATP DEPENDENCE (mM) 0 2 0 4 0 6 0 0 2040 60 0 .05 .10 .25 .50
FIG. 2. N protein degradation by Lon protease is activated by ATP. A, reaction mixtures containing 10 pg of N protein, 1 pg of Lon protease, and 2 mM ATP when the latter two were present in 50 mM Tris/HCl, pH 8.0, and 25 mM MgC& were incubated at 37 "C. At the times indicated, 2 0 4 aliquots were withdrawn, mixed with electrophoresis sample buffer, and analyzed on 12% polyacrylamide gels (see "Experimental Procedures"). B, reaction mixtures contained 2 pg of N protein in 20 pl of buffer as described above. When ATP concentration was varied, 0.1 pg of Lon protease was present. After 1 h at 37 "C, the reaction solutions were treated and analyzed as described above.
TABLE I1 Activation of Lon protease-dependent degradatwn of N protein by
nucleotides 2 pg of N protein were incubated with 0.2 pg of Lon protease and
1 mM nucleotide in 50 mM Tris, pH 8.0, with 20 mM MgC12 for 1 h at 37 "C. Reaction was stopped with 2% sodium dodecyl sulfate at 100 "C, and samples were separated by gel electrophoresis. N protein remaining was estimated by densitometry after staining with Coo- massie Blue. The results of a single experiment were reported, but comparable results were obtained when similar incubations were carried out on two other occasions.
Addition (1 mM) Degradation %
ATP None c 5
80 ADP AMP
5-10
GTP c 5
UTP c 5
CTP 5-10 50
AMPPCP AMPPNP 50 A T P 4 5-10
5-10
phate bond is not cleaved during catalysis. The major products of N protein degradation in the presence of AMPPNP were identical to those obtained with ATP as analyzed by reverse phase chromatography (see below). Thus, binding of substrate protein, peptide bond cleavage, and release of products by Lon protease all occur in the absence of ATP hydrolysis.
Longer incubations or increased amounts of Lon protease led to degradation of all of the N protein present in solution. N protein molecules were also degraded extensively; large intermediates expected from single cleavages do not accumu- late as seen on the gel, although a lightly staining smear of protein was visible on the original gel near the dye front. In these reaction mixtures, there were 2 pg of N protein (8 p ~ ) and 0.04-0.4 pg of Lon protease (0.02-0.2 PM subunit); there- fore, even with a single cut per molecule, complete degradation of the N protein required multiple catalytic turnovers of Lon protease. As reported below, N protein is cut at several sites in each molecule, clearly indicating that Lon protease is acting catalytically to degrade N protein.
Separation of Degradation Products of N Protein by Reverse
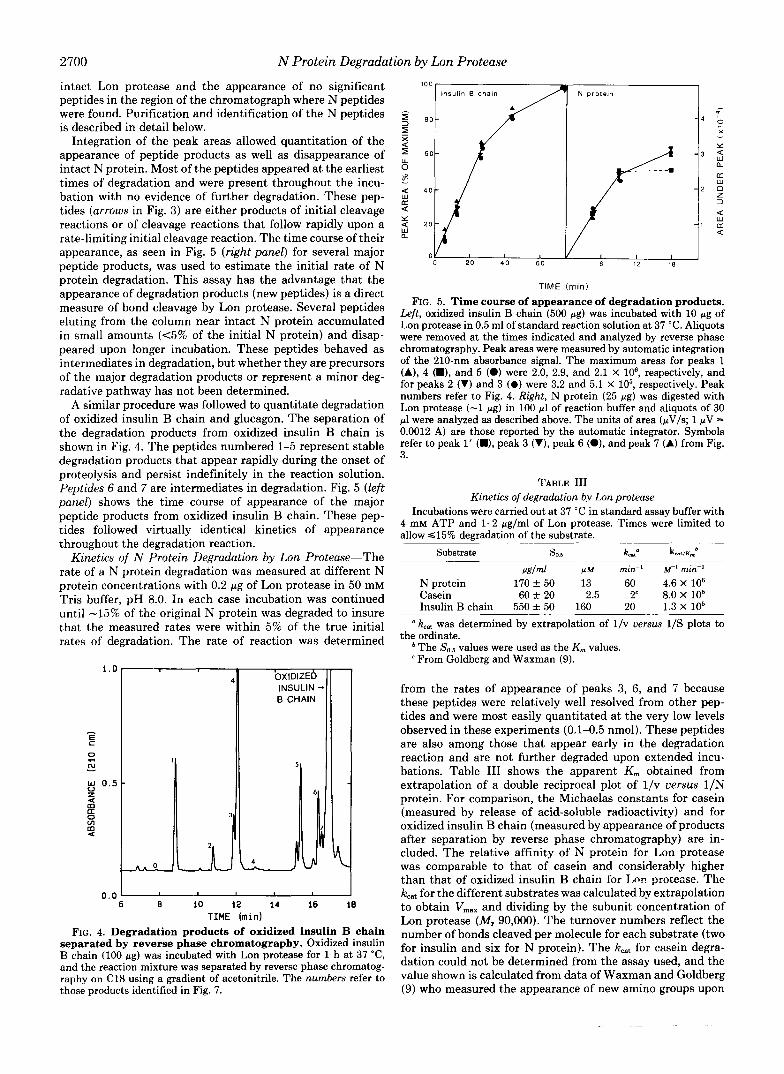
Phase Chromatography-The extensive degradation of N pro- tein was more clearly seen by separating the degradation products by reverse phase chromatography (Fig. 3). At least eight major peptide products and 15-20 minor peptide prod- ucts were detected by absorbance a t 210 nM after separation of the reaction mixtures on a 5-pM octadecyl column using an acetonitrile gradient. All of the major peptides and almost all of the minor peptides are products of N protein. Lon protease eluted at a higher acetonitrile concentration than shown in Fig. 3; incubation of Lon protease alone under the conditions used for N protein degradation resulted in very little loss of
0 min
-N
L
7 17 27 TIME (min)
FIG. 3. Separation of degradation products of N protein by reverse phase chromatography. 50 pg of N protein was incubated at 37 "C for 1 h in Tris buffer, pH 8.0, with 4 mM ATP, 25 mM MgCl,, and 1 pg of Lon protease. Reaction mixture was put on a C18 reverse phase column and eluted with a gradient of acetonitrile. The arrows indicate the major products and the numbers refer to the peptides shown in Fig. 6; D, peak associated with dithiothreitol.
2700 N Protein Degradation by Lon Protease
intact Lon protease and the appearance of no significant peptides in the region of the chromatograph where N peptides were found. Purification and identification of the N peptides is described in detail below.
Integration of the peak areas allowed quantitation of the appearance of peptide products as well as disappearance of intact N protein. Most of the peptides appeared at the earliest times of degradation and were present throughout the incu- bation with no evidence of further degradation. These pep- tides (arrows in Fig. 3) are either products of initial cleavage reactions or of cleavage reactions that follow rapidly upon a rate-limiting initial cleavage reaction. The time course of their appearance, as seen in Fig. 5 (right panel) for several major peptide products, was used to estimate the initial rate of N protein degradation. This assay has the advantage that the appearance of degradation products (new peptides) is a direct measure of bond cleavage by Lon protease. Several peptides eluting from the column near intact N protein accumulated in small amounts ( ~ 5 % of the initial N protein) and disap- peared upon longer incubation. These peptides behaved as intermediates in degradation, but whether they are precursors of the major degradation products or represent a minor deg- radative pathway has not been determined.
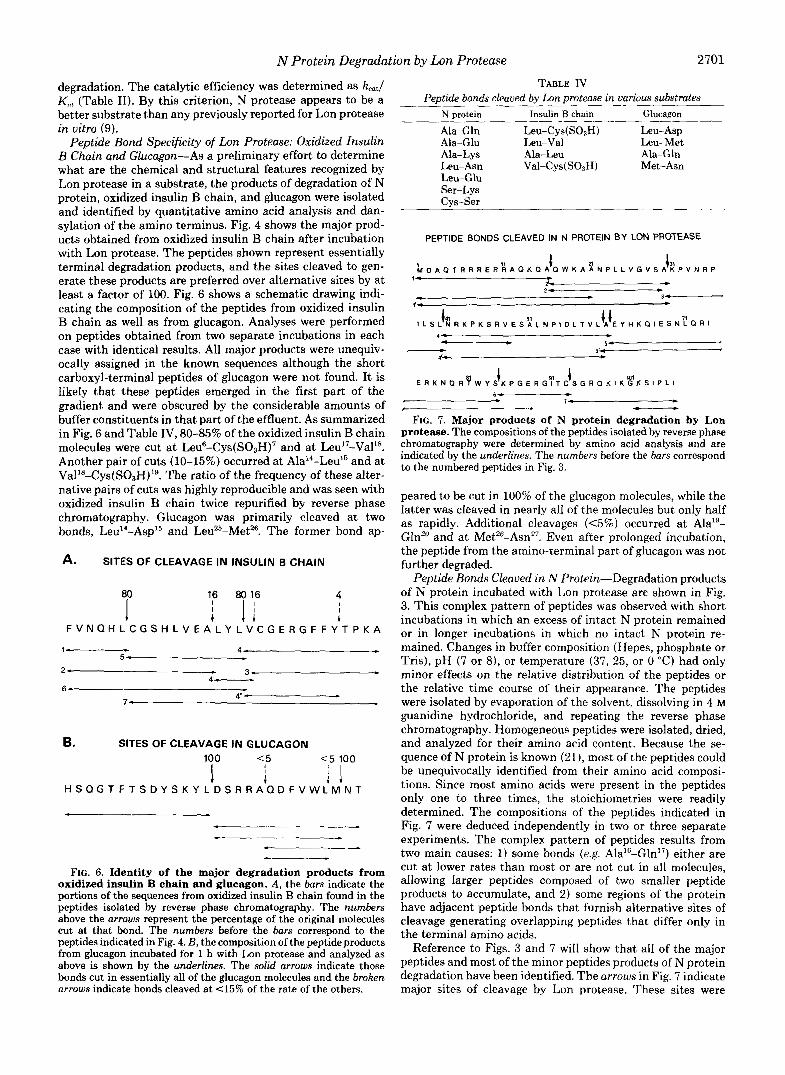
A similar procedure was followed to quantitate degradation of oxidized insulin B chain and glucagon. The separation of the degradation products from oxidized insulin B chain is shown in Fig. 4. The peptides numbered 1-5 represent stable degradation products that appear rapidly during the onset of proteolysis and persist indefinitely in the reaction solution. Peptides 6 and 7 are intermediates in degradation. Fig. 5 (left panel) shows the time course of appearance of the major peptide products from oxidized insulin B chain. These pep- tides followed virtually identical kinetics of appearance throughout the degradation reaction.
Kinetics of N Protein Degradation by Lon Protease-The rate of a N protein degradation was measured a t different N protein concentrations with 0.2 pg of Lon protease in 50 mM Tris buffer, pH 8.0. In each case incubation was continued until -15% of the original N protein was degraded to insure that the measured rates were within 5% of the true initial rates of degradation. The rate of reaction was determined
1 . 0
- E c 0
N .-I - w 0.5 V z 4
U 0 rn U
m
m
0.0 6 0 10 12 14 16 l e
TIME ( m i d FIG. 4. Degradation products of oxidized insulin B chain
separated by reverse phase chromatography. Oxidized insulin B chain (100 pg) was incubated with Lon protease for 1 h at 37 "C, and the reaction mixture was separated by reverse phase chromatog- raphy on C18 using a gradient of acetonitrile. The numbers refer to those products identified in Fig. 7.
- * 0 x - Y
w a a n W 0 z 3
a
a W L r
TIME (rnin)
FIG. 5. Time course of appearance of degradation products. Left, oxidized insulin B chain (500 pg) was incubated with 10 pg of Lon protease in 0.5 ml of standard reaction solution at 37 "C. Aliquots were removed at the times indicated and analyzed by reverse phase chromatography. Peak areas were measured by automatic integration of the 210-nm absorbance signal. The maximum areas for peaks 1 (A), 4 (W), and 5 (0) were 2.0, 2.9, and 2.1 X lo6, respectively, and for peaks 2 (V) and 3 (0) were 3.2 and 5.1 X lo5, respectively. Peak numbers refer to Fig. 4. Right, N protein (25 pg) was digested with Lon protease (-1 pg) in 100 p1 of reaction buffer and aliquots of 30 p1 were analyzed as described above. The units of area (pV/s; 1 pV = 0.0012 A) are those reported by the automatic integrator. Symbols refer to peak 1' (W), peak 3 (V), peak 6 (O), and peak 7 (A) from Fig. 3.
TABLE I11 Kinetics of degradation by Lon protease
Incubations were carried out at 37 "C in standard assay buffer with 4 mM ATP and 1-2 pg/ml of Lon protease. Times were limited to allow a15% degradation of the substrate.
I*glml P M min" M' min" N protein 170 +50 13 60 4.6 X lo6 Casein 60 + 20 2.5 2' 8.0 X lo5 Insulin B chain 550 f 50 160 20 1.3 X 10⁵
"kc., was determined by extrapolation of l /v versus 1/S plots to
* The So, values were used as the K,,, values. the ordinate.
From Goldberg and Waxman (9).
from the rates of appearance of peaks 3, 6, and 7 because these peptides were relatively well resolved from other pep- tides and were most easily quantitated at the very low levels observed in these experiments (0.1-0.5 nmol). These peptides are also among those that appear early in the degradation reaction and are not further degraded upon extended incu- bations. Table I11 shows the apparent K,,, obtained from extrapolation of a double reciprocal plot of l /v uersus 1/N protein. For comparison, the Michaelas constants for casein (measured by release of acid-soluble radioactivity) and for oxidized insulin B chain (measured by appearance of products after separation by reverse phase chromatography) are in- cluded. The relative affinity of N protein for Lon protease was comparable to that of casein and considerably higher than that of oxidized insulin B chain for T,or protease. The kcat for the different substrates was calculated by extrapolation to obtain VmaX and dividing by the subunit concentration of Lon protease (Mr 90,000). The turnover numbers reflect the number of bonds cleaved per molecule for each substrate (two for insulin and six for N protein). The kc,, for casein degra- dation could not be determined from the assay used, and the value shown is calculated from data of Waxman and Goldberg (9) who measured the appearance of new amino groups upon
N Protein Degradation by Lon Protease 2701
degradation. The catalytic efficiency was determined as kcat/ K,,, (Table 11). By this criterion, N protease appears to be a better substrate than any previously reported for Lon protease in uitro (9).
Peptide Bond Specificity of Lon Protease: Oxidized Insulin B Chain and Glucagon-As a preliminary effort to determine what are the chemical and structural features recognized by Lon protease in a substrate, the products of degradation of N protein, oxidized insulin B chain, and glucagon were isolated and identified by quantitative amino acid analysis and dan- sylation of the amino terminus. Fig. 4 shows the major prod- ucts obtained from oxidized insulin B chain after incubation with Lon protease. The peptides shown represent essentially terminal degradation products, and the sites cleaved to gen- erate these products are preferred over alternative sites by at least a factor of 100. Fig. 6 shows a schematic drawing indi- cating the composition of the peptides from oxidized insulin B chain as well as from glucagon. Analyses were performed on peptides obtained from two separate incubations in each case with identical results. All major products were unequiv- ocally assigned in the known sequences although the short carboxyl-terminal peptides of glucagon were not found. I t is likely that these peptides emerged in the first part of the gradient and were obscured by the considerable amounts of buffer constituents in that part of the effluent. As summarized in Fig. 6 and Table IV, 80-85% of the oxidized insulin B chain molecules were cut at Leus-Cys(S03H)' and at Le~'~-Val'*. Another pair of cuts (10-15%) occurred at AlaI4-Leul5 and at Val'8-Cys(S0,H)'9. The ratio of the frequency of these alter- native pairs of cuts was highly reproducible and was seen with oxidized insulin B chain twice repurified by reverse phase chromatography. Glucagon was primarily cleaved at two bonds, LeuI4-Aspl5 and LeuZ5-Metz6. The former bond ap-
A. SITES OF CLEAVAGE IN INSULIN B CHAIN
7 '! 77 4
+ I I
4 F V N Q H L C G S H L V E A L Y L V C G E R G F F Y T P K A
I- * 4 - * 5 - -
2- 31 - 4-
6 P
7- 4"-
6. SITES OF CLEAVAGE IN GLUCAGON
'7, <5 <15 100
H S Q G T F T S D Y S K Y L D S R R A ' Q D F V W L M N T
8 I I I I I
- *
FIG. 6. Identity of the major degradation products from oxidized insulin B chain and glucagon. A , the bars indicate the portions of the sequences from oxidized insulin B chain found in the peptides isolated by reverse phase chromatography. The numbers above the arrows represent the percentage of the original molecules cut at that bond. The numbers before the bars correspond to the peptides indicated in Fig. 4. B, the composition of the peptide products from glucagon incubated for 1 h with Lon protease and analyzed as above is shown by the underlines. The solid arrows indicate those bonds cut in essentially all of the glucagon molecules and the broken arrows indicate bonds cleaved at 4 5 % of the rate of the others.
TABLE IV Peptide bonds cleaved by Lon protense in various substrates
N protein Insulin B chain Glucagon
Ala-Gln Leu-Cys(S03H) Leu-Asp Ala-Glu Leu-Val Leu-Met Ala-Lys Ala-Leu Ala-Gln Leu-Asn Val-Cys(SOaH) Met-Asn Leu-Glu Ser-Lys Cys-Ser ___________-
PEPTIDE BONDS CLEAVED IN N PROTEIN BY LON PROTEASE
b O A R T R R R E R ! A O K O A R W K A ~ N P L L V G V S A K P V N R P I 131 1- "-c
D
2- * . D 3-
I L S L N R K P K S R V E S ~ L N P I D L T V L A E Y H K ~ l E ~ N ~ o ~ i I n + I 1 ' 0
1- + * * 5- __c 5 ' r
41- .D
E R K N ~ R P W Y S K P G E R G ~ T C S G R ~ K I K ~ ~ K S I P L I I 1 6- * I 1. *
FIG. 7. Major products of N protein degradation by Lon protease. The compositions of the peptides isolated by reverse phase chromatography were determined by amino acid analysis and are indicated by the underlines. The numbers before the bars correspond to the numbered peptides in Fig. 3.
peared to be cut in 100% of the glucagon molecules, while the latter was cleaved in nearly all of the molecules but only half as rapidly. Additional cleavages (<5%) occurred a t Ala"- Gln'O and at Met26-Asn'7. Even after prolonged incubation, the peptide from the amino-terminal part of glucagon was not further degraded.
Peptide Bonds Cleaved i n N Protein-Degradation products of N protein incubated with Lon protease are shown in Fig. 3. This complex pattern of peptides was observed with short incubations in which an excess of intact N protein remained or in longer incubations in which no intact N protein re- mained. Changes in buffer composition (Hepes, phosphate or Tris), pH (7 or 8), or temperature (37, 25, or 0 "C) had only minor effects on the relative distribution of the peptides or the relative time course of their appearance. The peptides were isolated by evaporation of the solvent, dissolving in 4 M guanidine hydrochloride, and repeating the reverse phase chromatography. Homogeneous peptides were isolated, dried, and analyzed for their amino acid content. Because the se- quence of N protein is known (21), most of the peptides could be unequivocally identified from their amino acid composi- tions. Since most amino acids were present in the peptides only one to three times, the stoichiometries were readily determined. The compositions of the peptides indicated in Fig. 7 were deduced independently in two or three separate experiments. The complex pattern of peptides results from two main causes: 1 ) some bonds (e.g. Ala'6-Gln'7) either are cut at lower rates than most or are not cut in all molecules, allowing larger peptides composed of two smaller peptide products to accumulate, and 2) some regions of the protein have adjacent peptide bonds that furnish alternative sites of cleavage generating overlapping peptides that differ only in the terminal amino acids.
Reference to Figs. 3 and 7 will show that all of the major peptides and most of the minor peptides products of N protein degradation have been identified. The arrows in Fig. 7 indicate major sites of cleavage by Lon protease. These sites were
-.. -

2702 N Protein Degradation by Lon Protease
considered major if peptides lying on both sides of the bond were found and if the yields of one of the peptides was >50%. Most of the cuts in N protein occurred at or near six locations: Ala16, Ala3', Leu4', Ala61, Sera, and Cysg3. Every N protein appeared to be cut between Cysg3 and Serg4 and between Leu4' and and 80% are cut at Sera-Lysss. All N protein molecules were cut either at Leu6'-Ala61 or Ala61-Glu62; like- wise, Ser2'-Ala3' and Ala3'-Lys31 were alternative sites in >90% of the molecules. At least half the molecules were cleaved a t Ala16-Gln17 but the nearby Ala2'-AlaZ1 bond could be an alternative site since the peptide produced by the cut at that bond appeared in significant amounts (-25%) in all reactions and was quite stable even after prolonged incuba- tion. Minor cuts ( 4 5 % ) were seen at Va148-Gln49 and Glyl'l- Lys"2.
DISCUSSION
Lon protease plays a major role in protein degradation in growing E. coli cells, but the nature of this role has not been clearly defined. Mutants lacking Lon protease are partially deficient (40-60%) in degradation of defective proteins and have even greater deficiencies in degradation of select native proteins such as SulA (6), RcsA ( 7 ) , and X N protein (8). That Lon protease acts directly in degrading these proteins intra- cellularly is an implication derived from extensive studies conducted by Chang and Goldberg (1) and Markovitz and co- workers (2) using purified Lon protease. Lon protease effi- ciently cleaves various denatured or modified proteins and short peptides, i n vitro (9, 11). Lon protease also displays an amidase activity with certain fluorogenic peptides. Lon pro- tease activity is dependent on or highly stimulated by (1, 2, 9-11) ATP and other phosphorylated metabolites. This latter fact coupled with the known energy- (hence possibly ATP) dependence of intracellular protein breakdown suggests that Lon is an active protease in vivo.
This study was undertaken to further establish the corre- lation between Lon protease function i n vivo and the activity of the purified protease i n vitro. Since previous studies have used heterologous substrates and mostly denatured proteins as substrates for Lon protease, it was desirable to examine a protein that appears to be a physiological substrate for Lon protease. The N protein of X was selected since it is one of only three rapidly degraded native proteins found in E. coli whose degradation is under control of lon. Most native pro- teins in E. coli are stable, and it has been proposed that the small class of very unstable native proteins consists of regu- latory proteins that are required only transiently and that may be lethal if allowed to accumulate (22). Thus, the mech- anism by which specific "timing proteins" (22) are selected for degradation and the chemical and structural differences between substrate and nonsubstrate proteins are of consid- erable importance.
The most remarkable finding in this paper is that purified Lon protease discriminates i n vitro between N protein and several other potential substrates in a way that reflects deg- radation i n vivo.
N protein is rapidly degraded by catalytic amounts of Lon protease whereas none of the other native proteins were degraded. It should be emphasized that among the proteins used, CI is degraded in vivo in a RecA protein-mediated reaction and X 0 protein is degraded very rapidly in vivo, but in neither case do mutations in Lon protease affect degrada- tion. Thus, the i n vitro results are entirely analogous to those found i n vivo. Glutamine synthetase and glutamate dehyro- genase are degraded in vivo during nitrogen starvation in lon- independent reactions and are resistant to Lon protease i n
vitro (data not shown). Drastic denaturation of some of the proteins (Cro and the mutant 0 protein) renders them more susceptible to degradation by Lon protease. No obvious mod- ification of N protein is required to render it susceptible to cleavage by Lon protease. I t seems likely that Lon protease recognizes specific structural features or sequences that are absent on the surface of most E. coli proteins. Such features may be present on specific highly unstable proteins or may be exposed by mutation, damage, or possibly by effector- induced conformational changes.
Lon protease degradation of N protein requires the presence of ATP or an analog of ATP. Thus, activation of Lon protease by phosphorylated metabolites appears to be an essential feature of Lon protease action in vivo. The concentration of ATP required for activation of N protein degradation is higher than that required for activation of casein or insulin B chain degradation. Casein or insulin B chain degradation is acti- vated at concentrations below 20 PM ATP but shows a non- hyperbolic response to changes in ATP (data not shown). At higher ATP concentrations, additional activation of casein or insulin B chain degradation is observed. One interpretation of these results is that two sites for ATP exist on Lon protease and that activation of N protein degradation and the second phase of activation of insulin B chain and casein degradation occurs when ATP binds to the weaker site. Evidence for two classes of ATP-binding sites on Lon protease and a model relating ATP binding to these sites to peptide or protein cleavage have recently been advanced by Waxman and Gold- berg (10). Why N protein degradation is not stimulated by ATP binding to the tight site is not clear, but this difference may indicate a fundamental difference between the interac- tions of N protein and nonphysiological substrates with Lon protease. Another possibility is that ATP interacts weakly with N protein and alters its susceptibility to degradation. No evidence for such an interaction has been reported, but ex- periments are in progress to determine if ATP binds to N protein. That GTP, UTP, and ADP do not stimulate N protein degradation suggests that nonspecific nucleotide in- teractions do not affect N protein stability.
Degradation of proteins by Lon protease is usually accom- panied by hydrolysis of ATP to ADP and Pi (23). Nonhydro- lyzable analogs of ATP produce variable degrees of activation of protein degradative activity, depending on the analog used and also on the protein substrate being degraded (10, 23). N protein degradation does not require ATP hydrolysis; degra- dation goes to completion, and the products produced, arising from multiple peptide bond breaks in each molecule of N protein, appear to be the same as those formed in the presence of ATP. Thus, ATP hydrolysis is not essential for any of the fundamental steps in protein degradation by Lon protease.
The virtually simultaneous appearance of the major prod- ucts of degradation of N protein and insulin B chain (Fig. 5) indicates that multiple sites are cleaved within the same molecule following a rate-limiting first peptide bond cleavage. The data do not allow us to distinguish between a processive reaction in which the substrate is cleaved at multiple sites without being released from the protease or a sequential reaction in which the initial products are released but compete effectively with the intact protein in subsequent cleavage reactions. Since some partially cleaved products accumulate in amounts greater than expected for enzyme-bound inter- mediates (e.g. p e a k 6 and 7 in Fig. 4), the mechanism cannot be strictly processive and at least some of the time interme- diates are released from the protease and subsequently re- bound and cleaved. A more thorough analysis of the kinetics of peptide bond cleavage by Lon protease is in progress.

N Protein Degradation by Lon Protease 2703
Relatively little has been reported regarding the elements involved in recognition of substrates by Lon protease. Using a series of fluorogenic peptides, Waxman and Goldberg (11) observed that Lon protease preferentially cleaved naphthy- lamide bonds of tetrapeptides in which the naphthyl group is attached to the carboxyl group of phenylalanine. They also observed that an acidic-blocking group on the amino-terminal peptide made the peptide a more favorable substrate. The results presented in this paper allow some further generali- zations to be made. The peptide bond specificity of Lon protease in the absence of extensive tertiary structure in the substrate is shown by the results with oxidized insulin B chain and glucagon. In all of the bonds cut by Lon protease in these substrates the carboxyl-donating amino acid has an aliphatic side chain, and in the majority of cases the amino acid is leucine. This result is consistent with those of Waxman and Goldberg (11) mentioned above. I t is noteworthy also that a t the major sites of cleavage, the amino side of the bond either contains an acidic amino acid or has an adjacent acidic amino acid. It is clear, however, that the presence of the aliphatic amino acid is not sufficient to provide a site of cleavage since insulin B chain contains a Leu-Val-Glu sequence that is not cut to any extent. Also glucagon contains a Val-Glu which is not cleaved, whereas the Ala-Glu bond nearby is cleaved.
Examination of the peptide bonds cut in N protein rein- forces the rule that aliphatic side chains, at the very least, allow cleavage by Lon protease. Of the nine major sites of cleavage so far identified, two have leucine and four have alanine at the carboxyl side. However, the limitations of the rule are also clearly evident. In N protein, there are 21 peptide bonds with aliphatic amino acids that are not cut a t significant rates. Pairs of amino acids a t which bond cleavage occurs (e.g. Ala-Glu, Leu-Asn, and Ser-Ala) occur in other parts of the protein where the bonds are not cleaved. At three sites, the carboxyl-amino acids have nonaliphatic side chains serine or cysteine. Interestingly, in two of these cases the penultimate amino acid is aliphatic (Val) or aromatic (Trp-Tyr). Possibly these less favorable aliphatic or bulkier aromatic groups allow binding in the active site of Lon protease but position the peptide such that cleavage occurs two positions downstream. The Ser-Lys bond (a favored site of cleavage in N protein) is found in glucagon and is not cleaved at all which again emphasizes the conclusion that the amino acids flanking a particular bond are a necessary but not sufficient determinant of cleavage by Lon protease.
The sizes of the major peptides produced by cleavage of the three polypeptides studied vary from 3 to 24 amino acids in length. Thus, Lon protease does not cleave proteins at some well-defined intervals along the polypeptide. The smallest peptide formed (two amino acids) comes from the carboxyl terminus of glucagon and is formed a t 30-50% the rate of the major cut in glucagon indicating that parts of the substrate more than three amino acids downstream of the site of cleav- age are not required in determining the site of cleavage. The shortest peptide from an amino terminus is six amino acids, so it is unlikely that features more distant than six amino acids upstream from the site of cleavage are important.
CONCLUSION
This report has documented that Lon protease selectively degrades X N protein in vitro. Since genetic and biochemical data indicate that N proteins are physiological substrates for Lon protease, the chemical and structural elements of a good substrate for Lon protease are intrinsic to a protein. N protein is cleaved in a highly specific and reproducible manner by Lon protease. The sites of cleavage in N protein are consistent with those found in nonphysiological substrates and indicate that the presence of an aliphatic side chain on the carboxyl side of the susceptible bond is a minimum requirement for Lon protease activity. Since not all bonds meeting that cri- terion are cleaved, additional features of a protein must also play important functions in determining the susceptibility to degradation by Lon protease, but those determinants await more sophisticated methods of analysis to be revealed.
Acknowledgments-I would like to thank Susan Gottesman for her support and criticism throughout the course of this research. The generous contributions of Susan Wickner (for X 0 protein and its derivative), Andrew Pakula (for X cI, Cro, and fragments of cI), and Jack Greenblatt (for the N protein used to make antibody) are gratefully acknowledged.
REFERENCES 1.
2.
3. 5.
6.
7.
8.
9.
10. 11.
12.
13. 14.
15.
16.
17.
18. 19. 20.
21. 22.
23.
Chung, C. H., and Goldberg, A. L. (1981) Proc. Natl. Acad. Sci.
Charette, M. F., Henderson, G. W., and Markovitz, A. (1981)
Gottesman, S., and Zipser, D. (1978) J. Bacteriol. 133,844-851 Maurizi, M. R., Trisler, P., and Gottesman, S. (1985) J. Bacteriol.
Mizusawa, S., and Gottesman, S. (1983) Proc. Natl. Acad. Sci. U.
Torres-Cabassa, A., and Gottesman, S. (1986) Abstract No. H-76, Annual Meeting, American Society for Microbiology, Washing- ton, D. C.
Gottesman, S., Gottesman, M., Shaw, J. E., and Pearson, M. L. (1981) Cell 24, 225-233
Goldberg, A. L., and Waxman, L. (1985) J. Biol. Chem. 260,
Waxman, L., and Goldberg, A. L. (1986) Science 232, 500-503 Waxman, L., and Goldberg, A. L. (1985) J. Biol. Chem. 260,
Rice, R. H., and Means, G. E. (1971) J. Biol. Chem. 246, 831-
Rao, R. N. (1984) Gene 3 1, 247-250 Greenblatt, J., Malnoe, P., and Li, J. (1980) J. Biol. Chem. 255,
Goda, Y., and Greenblatt, J. (1985) Nucleic Acids Res. 13, 2569-
Zehnbauer, B. A., Foley, E. C., Henderson, G. W., and Markovitz,
Weiner, A. M., Platt, T., and Weber, K. (1972) J. Biol. Chem.
Hirs, C. H. W. (1967) Methods Enzymol. 11,59-62 Laemmli, U. K. (1970) Nature 227,680-685 Roberts, J. W., and Roberts, C. W. (1975) Proc. Natl. Acad. Sci.
Franklin, N. C., and Bennett, G. N. (1979) Gene 8, 107-119 Gottesman, S. (1987) in Escherichia coli and Salmonella typhi-
murium Cellular and Molecular Biology, American Society for Microbiology, Washington, D. C.
Waxman, L., and Goldberg, A. L. (1982) Proc. Natl. Acad. Sci. U. S. A. 79,4883-4887
U. S. A. 78,4931-4935
Proc. Natl. Acad. Sci. U. S. A. 78, 4728-4732
164,1124-1135
S. A. 80,358-362
12029-12034
12022-12028
832
1465-1470
2582
A. (1981) Proc. Natl. Acad. Sci. U. S. A. 78, 2043-2047
247,3242-3251
U. S. A. 72,147-151