ii ghana...ii the ghana poverty and inequality report: using the 6th ghana living standards survey...
TRANSCRIPT


The Ghana Poverty and Inequality Report – 2016
II
The Ghana Poverty and Inequality Report:
Using the 6th Ghana Living Standards Survey
2016
By Edgar Cooke (Ashesi University College, Ghana); Sarah Hague (Chief of Policy, UNICEF Ghana); Andy McKay (Professor of Development Economics, University of Sussex, UK)

The Ghana Poverty and Inequality Report – 2016
III
Acknowledgements:
We are grateful to Ghana’s Statistical Service for having led the execution of the Ghana Living Standards Surveys upon which this analysis is based. We are very grateful for comments received on the draft from Kathleen Beegle, Vasco Molini and Pierella Paci of the World Bank as well as from Augustin Fosu, Louis Boakye-Yiadom, Fred McBagonluri, and participants at the University of Ghana and World Bank Poverty and Inequality workshop and the Ashesi Wednesday faculty seminar. The views expressed in this report do not represent the views of UNICEF, University of Sussex or Ashesi University College but those of the authors themselves. All remaining errors are those of the authors.
Cover photo: © 2015/UNICEF/UNI199048/Quarmyne
Description: Abane Afana-An, a LEAP programme beneficiary in Nyariga in Upper East Region, crafts baskets for sale.
Design: Art Excel Gh

The Ghana Poverty and Inequality Report – 2016
IV
ContentsExecutive Summary 1
1. Introduction and background 3
2. Literature review 4
3. Methodology and Data 5
3.1 Monetary poverty analysis 5
3.2 Inequality analysis 6
3.3 Measuring the growth-inequality-poverty relationship 6
3.4 Data 7
4. Results 7
4.1 Trends in Consumption Levels 7
4.2 Monetary Poverty Analysis 9
4.3 Inequality analysis 14
4.4 Measuring the growth-inequality-poverty relationship 17
5. Conclusions 24
Appendices 25
Appendix A: Methodology 25
Appendix B: National Poverty Estimates 28
Appendix C: Inequality Estimates 31
Bibliography 36
Index of Figures and Tables:
Table 1: The Effect of Changes in Economic Growth and Inequality on Poverty 5
Table 2: Median Adult Equivalent Consumption Expenditure and Growth (GHS) 7
Figure 1: Adult Equivalent Consumption by Region, 2006 and 2013 8
Figure 2: Ratio of Urban to Rural Consumption by Region, 2006 and 2013 8
Figure 3: National Poverty Rates, 1992 – 2013 (using new poverty line) 9
Figure 4: Poverty headcount by gender of household head, 1992-2006 10
Figure 5: Poverty headcount rates disaggregated by urban/rural location, 1992-2013 10
Table 3: Poverty Incidence by region, 1992-2013 11
Table 4: Regional poverty trends – Depth and Severity (2006 – 2013) 12
Table 5: Distribution of the Poor and the Population (2006 and 2013) 12
Table 6: National Poverty Estimates by Age Category 1992 – 2013 13
Figure 7: National Inequality Estimates (1992 – 2013) 14
Table 7: Inequality estimates (1992 – 2013) 15
Table 8: Ratios of Adult Equivalent Consumption, 2006 and 2013, (GHS) 17
Table 9: Growth-redistribution decomposition of changes in poverty in Ghana 17

The Ghana Poverty and Inequality Report – 2016
V
Figure 8: Growth and Inequality Decomposition of Poverty: Urban versus Rural Households (1992 – 2006) (Incidence and Depth) 19
Figure 9: Growth and Inequality Decomposition of Poverty: Urban versus Rural Households (2006 – 2013) (Incidence and Depth) 19
Figure 10: Growth Incidence Curve - 1992 – 2013 21
Figure 11: Rural and Urban Growth Incidence Curves 2006 to 2013 22
Table 10: Growth at Each Decile between 2006 and 2013 23
Table 11: Pro-poor Growth Indices 1992 – 2013 24

The Ghana Poverty and Inequality Report – 2016
1
Executive SummaryGhana has experienced steadily increasing growth of over 7% per year on average since 2005. Following the attainment of middle income country status in 2010 and discovery of offshore oil reserves, per capita growth in the country has remained relatively high. Despite the growth recorded, inequality has been increasing in the country and poverty remains prevalent in many areas.
Given the importance of inequality in attaining the goal of poverty reduction this paper sets out to comprehensively investigate the likelihood of inequality affecting the country’s poverty reduction efforts. The report specifically aims to (1) assess poverty trends in Ghana since the early 1990s, (2) estimate inequality levels and trends in Ghana over the same period, (3) determine to what extent the very poorest are benefiting from Ghana’s economic growth, and (4) assess the relationships between growth, poverty reduction and inequality.
In looking at poverty trends, the paper confirms that between 1992 and 2013 Ghana’s national level of poverty fell by more than half (from 56.5% to 24.2%), thereby achieving the MDG1 target. However, the annual rate of reduction of the poverty level slowed substantially from an average of 1.8 percentage points per year in the 1990s to 1.1 percentage point per year reduction since 2006. Conversely, the rate of reduction of extreme poverty has not slowed since the 1990s and impressive progress in cutting extreme poverty was achieved even since 2006 (cut from 16.5% to 8.4%). This means that relatively more progress has been made for the extreme poor in recent years then those living close to the poverty line.
Households in urban areas continue to have a much lower average rate of poverty than those in rural areas (10.6% versus 37.9%). However, urban poverty has dropped in recent years much faster than rural poverty and as a result the gap between urban and rural areas has doubled – rural poverty is now almost 4 times as high as urban poverty compared to twice as high in the 1990s.
At the regional level, the Northern, Upper East, and Upper West regions continue to have the highest poverty rates. However, substantial progress has been achieved since 2006 in the Upper East region as poverty has dropped from 72.9% in 2006 to 44.4% in 2013. Of great concern is the Northern region which saw its high level of poverty fall only marginally from 55.7% to 50.4%. Since the 1990s overall, the Northern region has seen the smallest progress in poverty reduction. This is a major issue for the country given that the Northern region now makes up the largest number of poor people of any of Ghana’s ten regions (1.3 million).
Regarding the depth with which people live in poverty, i.e. how far below the poverty line, the same three northern regions continue to have the highest levels of poverty depth, and Upper West and Upper East also made important progress in reducing poverty depth since 2006 although the levels remain high. For example, in Upper West, poor people still live on average a third of the way below the poverty line. Surprisingly, 4 regions (Western, Central, Volta, and Ashanti) saw their poverty depth rise since 2006, meaning that not enough efforts are being made to improve the lives of the poor in those regions.
It is also important to note that although the proportion of people living in poverty has declined by a quarter since 2006, the number of people living in poverty has only declined by 10% (from 7m to 6.4m), meaning that poverty reduction is not keeping pace with population growth.
In considering child poverty, we discovered that although important progress has been made – similar to poverty levels overall – there are still 3.5 million children living in poverty today. This accounts for 28.3% of all children. We estimate that in Ghana a child is almost 40% more likely to live in poverty than an adult. This inequity has risen substantially from the 1990s when children were only 15% more likely to be poor than adults. In addition, one child in ten lives in extreme poverty, meaning 1.2 million children live in households that are unable to provide even adequate food.
Turning now to inequality, we confirm that inequality has been on the rise in Ghana since 1992, though as measured by the Gini its rise has stalled since 2006. The Gini coefficient has risen from 37 in 1992 to 41 in 2013. However, what stands out for Ghana is that the highest levels of
The Ghana Poverty and Inequality Report – 2016
2
inequality are now registered within certain regions. The Upper West region has the highest level of inequality in the country and the largest increase in inequality since the 1990s. The lowest level of inequality is found in the Greater Accra region. This means that some Districts, communities or groups of people in certain regions, especially in the North are being left behind and are missing out on recent economic growth. Going forward, national policy will need to address this phenomenon and ensure that the poorest benefit more equitably. Inequality also increased for rural areas, and the North of the country as a whole also now has high levels of inequality.
However, looking more deeply at inequality, we assess to what extent those living in poverty have benefitted from economic growth. Looking at consumption levels, we see that the gap between the poorest 10% and the richest 10% of the population has been on the rise and has also increased since 2006. The wealthiest decile now consume 6.8 times the amount than the poorest 10%, up from 6.4 times in 2006. We also find that average consumption of this wealthiest group increased by 27% between 2006 and 2013, whereas for the poorest it only increased by 19% - meaning that growth for the richest group was over 1.4 times greater than for the poorest in this period. Equally, we find that the shares of total national consumption vary substantially between rich and poor. The wealthiest 10% consume around one third of all national consumption, whereas the poorest 10% consume just 1.72%. This means that even if the Gini has not notably increased since 2006, other evidence suggests that inequality between the poorest and wealthiest has indeed increased.
It’s important to point out that in such surveys, there are difficulties in measuring consumption at the extreme ends of the scale and that extreme poverty and extreme wealth are likely to be substantially underestimated, thereby underestimating the gap between rich and poor. However, we do also find that the poorest are starting to catch up, very slowly, with better off groups in terms of consumption levels.
To examine how much growth different groups of society have experienced, we use growth incidence curves to plot the growth rate in consumption for every percentile of the population. We find that growth rates at all percentiles are positive in all periods, meaning that everybody experienced some growth. We also note that the growth rate experienced by the poor has improved since the 1990s. However, we confirm that the poor’s growth rate has been lower overall than for wealthier groups who have benefitted more, which has added to inequality.
In the early 1990s, the growth incidence curve rose steeply, meaning that the very poorest experienced a much lower level of growth than the very wealthiest. From 1998 to 2006 the curve flattened out in the middle significantly, meaning that the majority of the population in the middle experienced a similar growth rate – however the extreme poorest population saw very low growth rates while the extreme wealthiest end saw significantly high growth rates. What is particularly notable is that, most recently, in the period 2006 to 2013, the curve flattens out even more but the tails actually invert – the extreme poorest are now experiencing higher levels of growth than average. This reflects a slowdown in the increase in inequality. Targeted programmes for the extreme poor, such as the LEAP cash transfer programme, have benefitted the poorest disproportionately in recent years and may have contributed to this effect but multiple factors related to the economy’s transformation and urbanisation will have been responsible.
We then assess the relationship between growth, poverty and inequality. We consider to what extent the increases in inequality in Ghana have dampened down poverty reduction. We find that while growth has driven impressive poverty reduction, rising inequality has indeed reduced poverty reduction. Since 2006 alone, the rise in inequality reduced poverty reduction by 1.1 percentage points, equivalent to maintaining around 289,822 people in poverty since 2006 who could have otherwise exited it. Between 1992 and 2006 this effect also reduced poverty reduction efforts by 2.5 percentage points, equivalent to 555,422 people.
Finally, we consider whether Ghana has experienced inclusive growth – i.e. growth that has benefited the poor disproportionately more than the wealthy. While it is clear the poor have seen some important benefit from growth, we determine that Ghana has not achieved inclusive growth as the wealthiest have benefited the most.

The Ghana Poverty and Inequality Report – 2016
3
1 Introduction and BackgroundGhana is known for its stability, good governance and relatively well-developed institutional capacities that support the gradual achievement of human rights. Having experienced steadily increasing economic growth of over 7% per year on average since 2005, Ghana attained lower-middle income country status in 2010. Income from offshore oil reserves discovered in 2007 began to flow in 2011, creating double-digit growth for the year. Accompanying income growth has been a rapid reduction in monetary poverty from 51.7% in 1992 to 24.2% of the population by 2013, meaning that Ghana has achieved the MDG 1 target.
However, as growth has accelerated, inequality has worsened, with the Gini coefficient rising from 37 in 1992 to 42.3 in 2013 according to GSS. In a recent IMF paper on income inequality and fiscal policy, Ghana is categorized as having one of the fastest increasing inequality levels in Africa1 although a new World Bank report clarifies that Ghana cannot yet be said to have a high level of inequality compared to other Sub-Saharan countries2. By 2006, the richest 20% of the population held almost half of Ghana’s income, whilst the poorest group saw their income share decline from 6.9% of the total in 1992 to 5.2%. Inequality between the north and the south of the country appeared to have worsened, for example the contribution of rural areas in the north of the country to national poverty levels increased from 37% to 49% between 1999 and 2006 and the depth of poverty for those in the poorest region (Upper West) increased between the 1990s and 20063. Analysis of the 2006 household living standards survey illustrated that these increases in inequality slowed down the impact of growth on poverty reduction and that rates of growth for the poor were low4.
To date, such analysis of poverty and inequality in Ghana is based almost entirely on its previous household living standards survey, the Ghana Living Standards Survey (GLSS) from 2006. Ghana’s economic performance since then has been characterised by the gradual scale-up of oil production, rapid urban development, and a series of economic crises, including the global financial crisis, food price rises, and, more recently, utility and fuel price hikes as subsidies have been removed. Speculation is rife that income inequality between rich and poor has continued to increase and that the rate of poverty reduction will have dramatically slowed in recent years. There is also concern that growing inequality has meant that large pockets of people in often rural, northern areas have seen significantly less benefit from Ghana’s development (GSS, 2008), while some other groups have benefited disproportionately more.
Recent data on non-monetary indicators also suggest that inequality is worsening in many areas. The gap between rich and poor in relation to child mortality rates, for example, has doubled between 2006 and 2011 (Multiple Indicator Cluster Survey, MICS), with children in rich groups now twice as likely to survive as poor children.
Increasing evidence suggests that increasing inequality can have a range of negative impacts on a country’s development, including upon social cohesion, political and economic stability and particularly on economic growth5. Other studies underline that tackling inequality should be done sooner rather than later, while inequality remains at lower levels. Of important relevance to this study, is the ample evidence that suggests that inequality acts as a brake on the rate of poverty reduction6.
Given this importance of inequality in the development process and its substantial lack of analysis in Ghana, as well as the increase in inequality levels seen up to 2006 and that poverty trends may have
1 Bastagli F., and Coady D. 2012. Income Inequality and Fiscal Policy. IMF2 Beegle, Kathleen, Luc Christiaensen, Andrew Dabalen, and Isis Gaddis. 2016. Poverty in a Rising Africa. Africa Poverty Report. Washington, DC: World Bank. 3 Pattern and Trends of Poverty in Ghana 1991-2006. 2007. Ghana Statistical Service4 Ibid5 Alesina & Rodrik (1994); Deininger & Squire (1998); Easterly (2007); Berg et al. (2012); Ostry et al. (2014); Dabla-Norris et al (2015).6 Lopez, 2004. Pro-poor growth: a review of what we know (and of what we don’t) and Bourguignon, F. 2004. The Poverty-Growth-Inequality Triangle. ICRIER Working Paper 125, Indian Council for Research on International Economic Relations, New Delhi.

The Ghana Poverty and Inequality Report – 2016
4 4
changed since the last GLSS, this paper aims to update these analyses using the results of the new GLSS6 (2013). Specifically the research will aim to:
• Assess poverty trends in Ghana since the early 1990s; • Estimate inequality levels and trends in Ghana since the early 1990s;
• Determine to what extent the very poorest are benefiting or otherwise from Ghana’s economic growth;
• Assess the relationships between growth, poverty reduction and inequality.
2 Literature reviewGlewwe and Twum-Baah (1991) provide a thorough analysis of the third Ghana Living Standards Survey (GLSS3). Their findings include: (1) rural residents have a higher incidence of poverty compared to urban residents; (2) residents of the rural savannah tend to be the poorest while the residents of Accra tend to have the highest welfare; (3) household heads with no education tend to be poorer whereas those with education tend to be better off; (4) the incidence of poverty varies across employment categories with agricultural workers being among the poorest; and (5) wage earners in the public and private sectors tend to be better-off.
In general, these conclusions about welfare in Ghana do not only apply to GLSS3 but to the later GLSS results as well. For instance, GSS (2007) reports a higher incidence of poverty among rural residents compared to urban residents during the 1992 to 2006 period for GLSS3 – GLSS5. This has led Adjasi and Osei (2007) to conclude that poverty in Ghana is a rural phenomenon.
A recent paper by McKay et al (2015) analyses trends in consumption and non-monetary poverty outcomes in Ghana since the early 1990s. They find an improvement in the majority of monetary and non-monetary indicators. For instance, non-monetary indicators such as infant and under-five mortality rates have declined over the period. Secondary school attendance rates and access to other services has improved. One measure that has not shown significant improvement over the period is the weight-for-height indicator for children. The issue of rising inequality is highlighted in the paper. They find an increase in spatial inequality in both monetary and non-monetary outcomes. A conclusion from the analysis is that inequality is one of the key reasons that growth occurring in the economy has not led to faster poverty reduction.
According to Kakwani (1993) poverty in a country is affected by changes in economic growth and inequality. Kakwani suggests that higher inequality can lead to less poverty reduction. It demonstrates that marginal increases in inequality will reduce the decline in poverty achieved by a given rate of economic growth.
Demery and Squire (1996) conclude from their study of six African countries (Côte d’Ivoire, Ethiopia, Ghana, Kenya, Nigeria, and Tanzania) that economic growth is associated with reducing poverty levels. In their sample, all countries with the exception of Côte d’Ivoire experienced a decline in the incidence of poverty. In table 1, Demery and Squire’s summary of the effect of changes in economic growth and inequality on poverty are shown. A key observation is that the changes in poverty caused by economic growth and inequality have opposite signs. This means that in all countries, economic growth reduced poverty, but inequality increases (as in Ethiopia, Kenya, Nigeria and Tanzania in Table 1 below) contributed to a rise in poverty.
The Ghana Poverty and Inequality Report – 2016

5
Table 1: The Effect of Changes in Economic Growth and Inequality on Poverty Across CountriesPercentage point change of the headcount index
Overall change in poverty incidence
Effect of changes in economic growth
Effect of changes in inequality
Cote d’Ivoire +15.9 +19.4 -3.5
Ethiopia -18.0 -23.5 +5.5Ghana -5.5 -4.8 -0.4Kenya -2.8 -6.2 +3.4Nigeria -8.9 -13.6 +4.7Tanzania -14.1 -33.4 +19.3Source: Demery and Squire (1996:42-43), tables 2 and 3.
The importance of growth for poverty reduction has been emphasised extensively in the poverty literature (see for example, Christiaensen, et al., 2003; Dollar and Kraay, 2002; Dollar, et al., 2013; Kanbur, 2001). However, Sachs (2005) notes that rising average incomes may not necessarily reduce extreme poverty if income inequality is high—extreme poverty will continue to persist especially in the deprived regions of a country.
When growth is inclusive it raises the consumption of the poorest individuals in society thereby enabling them to meet their basic needs (Kakwani and Pernia, 2000). One of the key issues debated in the literature is whether policy makers should focus on absolute pro-poor growth or relative pro-poor growth. Absolute pro-poor growth occurs when economic growth simply reduces absolute poverty. This then says nothing about the (re)distribution of growth. Relative pro-poor growth – also known as inclusive growth – is associated with the stronger requirement of reducing relative inequality as well as poverty (Kakwani et al, 2004), i.e. the poor benefit more than the better-off. In an increasingly unequal society like Ghana, the concept of inclusive growth, i.e. growth that benefits the poorest proportionately more, is of particular interest.
This paper does not explore what factors have caused these changes, but other recent research in Ghana has demonstrated that both poverty and inequality can be reduced by social transfer programmes, such as LEAP, the Government’s flagship social protection cash transfer programme7.
3 Methodology and Data8 3.1 Monetary poverty analysisOur monetary poverty analysis is based on consumption per adult equivalent using standard Foster, Greer and Thorbecke (FGT) poverty indices. As in many countries, Ghana uses two poverty lines; an upper one below which an individual is considered to be unable to meet all their food and non-food needs, and a lower poverty line below which an individual is considered unable to even meet their food needs. The upper poverty line is set at 1,314 GHS per adult per year for 2013, and households below it are simply referred to throughout this paper as living in poverty. The lower poverty line is set at 792 GHS per adult per year, and households below it are referred to throughout as living in extreme poverty. Our analysis is disaggregated by urban/rural, regions and the gender of the household head.
An important methodological point to note, is that there is a difficulty in directly comparing the 2013 survey with the earlier surveys9. This is because the consumption basket underlying the poverty line was updated in two main ways. First, some of the components and weights of the poverty line basket have been updated to reflect changing consumption patterns (i.e. spending on mobile phones is now much more important). Second, the Ghana Statistical Service (GSS) updated the Consumer Price
7 Cooke, E. et al. 2014. Estimating the Impact on Poverty of Ghana’s Fuel Subsidy Reform and a Mitigating Response. UNICEF and PEP.8 Further details are provided in the appendix.9 We are grateful to Anthony Krakah at the Ghana Statistical Service for a discussion of the comparability issue.
The Ghana Poverty and Inequality Report – 2016

The Ghana Poverty and Inequality Report – 2016
6
Index (CPI) used to estimate the prices of goods purchased with new price deflators. As a result, Ghana has two slightly different poverty lines over the years, one which applies to three rounds of the 1992, 1998 and 2006 GLSS, and a second which applies to the 2006 and 2013 GLSS.
To overcome this difficulty, we compare poverty for the period 1992 to 2006 using the old poverty lines used at the time. We then use the new updated poverty lines to compare changes between 2006 and 2013. In spite of these methodological differences, we can be reasonably confident that any trends we observe over the entire period are realistic.The poverty indices used primarily are the poverty headcount (prevalence) and the poverty depth index (the Foster-Greer-Thorbecke P0 and P1 indices respectively). The headcount provides an indication of the proportion of individuals living below the poverty line. The poverty depth takes account of the average shortfall of the poor’s income from the poverty line, that is, how deeply in poverty they live. Our results are representative of Ghana’s entire population.
3.2 Inequality analysisThe inequality analysis is carried out based on computing a range of different measures, including the Gini coefficients, percentile ratios and the generalised entropy (GE) indices – namely, mean log deviation (GE(0)), Theil index (GE(1)) and the half squared coefficient of variation (GE(2)). These are computed on a comparable basis over time, using consumption per adult equivalent welfare data. The GE(0) gives greater weight to the bottom end of the distribution, GE(1) provides a similar weighting across the entire distribution and GE(2) gives a greater weight to the top end of the distribution.
Deaton (1997) notes that the choice of inequality measure depends on practical convenience. Even though it is not easily decomposed, the Gini provides other advantages and is simpler to interpret compared to the other measures (Deaton, 1997). However, providing estimates for a range of measures provides a more holistic approach to analysing inequality in Ghana. The GE indices have the advantage of decomposability, where the relative shares of between and within group inequality can be identified. The changes in within - and between - group inequality will provide an indication of the determinants of the changes in income inequality, in particular an assessment of whether increasing income inequality is due to rising within-group inequality rather than between-groups. The continued role of north-south inequality can be further explored.
To give a clearer idea of the gap between rich and poor, the inequality indices are augmented with additional analysis based on growth incidence curves (showing the distributional pattern of growth) and on comparing consumption and its growth among the richest 10% of the population with the average consumption of the bottom 10% of the population. We also estimate total consumption shares for the wealthiest 10% of the population compared to the total consumption share of the poorest 10% and how these shares have changed since 2006.
3.3 Measuring the growth-inequality-poverty relationshipHaving looked at poverty trends and inequality trends over the period, the analysis then concludes with a look at the relationship between growth and inequality and poverty. We use growth incidence curves for 2006 and 2013 to assess the rate of growth that different groups of the population experienced. We assess whether growth has reduced poverty in absolute terms. However, we also consider whether the rich are benefiting from higher growth rates than the poor.
We also calculate what proportion of poverty reduction has been achieved as a result of economic growth, and what proportion is a result of changes in inequality. Identifying the role inequality and economic growth have played in poverty reduction is key to understanding the change in poverty over the period. Following the method of Datt and Ravallion (1992) we decompose changes in poverty into growth and redistribution effects. The decomposition is given as the sum of the growth, redistributive and residual effects of the change in poverty. The growth effect provides information on the contribution of economic growth in reducing poverty. While the redistribution effect shows how changes in inequality have affected poverty reduction efforts.

The Ghana Poverty and Inequality Report – 2016
7
3.4 DataThe household data used for the current analysis are obtained from the Ghana Statistical Service’s Ghana Living Standards Surveys (GLSS). The last four surveys, carried out in 1992 (GLSS3), 1999 (GLSS4), 2006 (GLSS5) and 2013 (GLSS6), are used. As discussed in the methodology section the earlier surveys are not perfectly comparable with the later surveys, however the analyses are shown alongside each other and provide a clear picture of overall trends. Further detailed information about the surveys can be found in various GSS reports (GSS, 2008, 2014).
4 ResultsThe results for all four surveys for 1992 (GLSS3), 1999 (GLSS4), 2006 (GLSS5) and 2013 (GLSS6) are presented. As discussed in the methodology, we present some results in two sets alongside each other, from 1992 to 2006 and then from 2006 to 2013. However, for the national level, we present the results across the full period from 1992 to 2013 using the new poverty lines and prices with the comparability caveat in mind. In this section, the results are summarized in the graphs presented. More detailed tables are presented in the appendix.
4.1 Trends in Consumption LevelsFor household consumption levels, table 2 provides the median (adult equivalent) consumption values for the country from 1992 to 2013, disaggregated by rural and urban areas, using the new CPI for the deflator. We can see that there has been a steady increase in expenditures of households in both rural and urban areas. Mean expenditures (not shown) are higher than the median expenditures, as they are driven by high expenditures recorded by the top few quintiles.
Between 1992 and 2013, median expenditure grew by 81.7% overall10. Over this whole period the growth in expenditures of urban areas was higher (10.2 percentage points) than rural areas. However, between 2006 and 2013 this trend reversed, as growth in consumption was higher for rural areas than urban areas. Computing annualized averages, it is important to note that the average annual increase in consumption levels has slowed down in recent years.
Table 2: Median Adult Equivalent Consumption Expenditure and Growth (GHS) Urban Rural Total
1992 1698.11 996.39 1192.39
1998 2229.20 1234.54 1464.18
2006 2730.26 1446.57 1846.16
2013 2918.12 1610.53 2166.74
Percentage Change
1992-2013 71.8 61.6 81.7
1998-2013 30.9 30.5 48.0
2006-2013 6.9 11.3 17.4Estimates are based on 2012 prices. Source: Authors’ calculation based on GLSS3 – 6
Figure 1 below presents further results comparing the average value of expenditure in 2006 and 2013 for each region. If a region is above the 45 degree line, it shows that it has witnessed an increase in mean expenditure between 2006 and 2013. Therefore, the Central and Eastern are the only two regions to have experienced a decline in expenditure over the period.
10 The higher growth in the median at the national level than either the urban or rural figure is likely due to significant rural to urban migration, as the urban population increased from 38% to 51%. There has been a more rapid increase in the median urban income coupled with a higher urban population which has translated into a higher national income.

The Ghana Poverty and Inequality Report – 2016
8
Figure 1: Adult Equivalent Consumption by Region, 2006 and 2013Figure 1: Adult Equivalent Consumption by Region, 2006 and 2013
2013
(Gha
na C
edis
)
2016 (Ghana Cedis)
• Adult Equivalent Consumption 45 degree line
Greater Accra•
••••••
•••
Ashanti
WesternCentral
EasternVolta
Brong AhafoUpper East
Upper West Northern2000
1000 2000 3000 4000 5000 6000
3000
4000
5000
6000
Figure 2 compares average urban to rural expenditure by region. Here we find that apart from the Western region (and marginally the Northern region) all remaining eight regions experience a reduction over this period in the urban to rural ratio of mean expenditure. This is consistent with the data above showing faster rural than urban consumption growth in recent years. The Upper West region stands out because there was a 66% growth in rural consumption in the region between 2006 and 2013 from 658.43 GHS to 1092.93 GHS, while a modest increase of 17.2% was recorded for urban consumption during the same period, thereby causing a considerable decline in the urban to rural consumption ratio.
Figure 2: Ratio of Urban to Rural Consumption by Region, 2006 and 2013Figure 2: Ratio of Urban to Rural Consumption by Region, 2006 and 2013
2013
(Gha
na C
edis
)
2016 (Ghana Cedis)
• Urban/Rural Adult Equivalent Consumption 45 degree line
1
1 2 3 4 5 6
23
45
Greater AccraAshantiWestern
CentralVoltaBrong Ahafo
Upper East
Upper West
Northern
•
•••••
••••Eastern

The Ghana Poverty and Inequality Report – 2016
9
4.2 Monetary Poverty AnalysisThe national poverty rates calculated using the new poverty lines and price deflators show a decline in poverty rates across the various poverty indices over the 1992 – 2013 period, as presented in Figure 3. Between 1992 and 2013 the poverty headcount fell from 56.5% to 24.2% (on the right-hand side of the figure), thereby ensuring that Ghana had achieved the first MDG target of halving poverty by 2015. However, we can also see that the annual rate of poverty reduction has slowed. In the 1990s, poverty was reduced by an average of 1.8 percentage points per year, whereas between 2006 and 2013 this had slowed to an average reduction of just 1.1 percentage point per year.
The poverty depth index also declines over the period from 20.9% in 1992 to 7.8% in 2013 meaning that poor people in Ghana are now living on average less deeply below the poverty line than they used to in the 1990s.
Consistent with the above, a similar yet more impressive pattern is observed for extreme poverty over the period. From Figure 3, the incidence of extreme poverty declines substantially from 33.2% in 1992 to 8.4% in 2013. Unlike poverty as a whole, the rate of reduction of extreme poverty has barely slowed since the 1990s. Indeed, as a proportion of total extreme poverty levels, recent progress has been impressive as Ghana has managed to halve extreme poverty in just the most recent period between 2006 and 2013.
The results thereby imply that poverty reduction has not been only focused on households near the poverty line but has made relatively more progress for households living in extreme poverty.
Figure 3: National Poverty Rates, 1992 – 2013 (using new poverty line)
When disaggregating the national poverty results by various subgroups, we restrict ourselves to analysing the two comparable sub periods separately alongside each other, 1992 to 2006 using the old poverty lines and 2006-2013 using the new poverty lines.
We first examine the decomposition of poverty by the gender of the household head. Female-headed households continue to have lower poverty rates (19.1% in 2013) than male-headed households (25.9%) (Figure 4). Extreme poverty (not shown) presents a similar pattern. The literature has attributed several possible reasons for these differences in poverty rates by gender of household head, but it depends substantially on country context and should be noted that such households are far from homogenous. For instance, in many cases, female-headed households may be less poor if the female is actually married to a migrant who sends remittances back home.

The Ghana Poverty and Inequality Report – 2016
10
Figure 4: Poverty headcount by gender of household head, 1992-2006
Note: Male household heads made up 73%, 73%, 77%, and 75% of households in 1992, 1998, 2006 and 2013 respectively. Female headed households therefore made up 27%, 27%, 23% and 25%.
Households in urban areas have on average a much lower poverty rate (10.6% in 2013) compared to households in rural areas (37.9%) (Figure 5). This is supported by our earlier results for household consumption showing that there is a widening gap over the whole period between urban and rural households. Although both rural and urban poverty rates have declined over the period, in the early 1990s rural poverty was twice as high as urban poverty. By 2012, that factor had doubled and rural poverty is now almost 4 times as high as urban poverty levels. This is due to the fact that urban poverty has dropped faster than poverty levels in rural areas.
Figure 5: Poverty headcount rates disaggregated by urban/rural location, 1992-2013
Note: rural households made up 67%, 67%, 62%, and 49.9% in 1992, 1998, 2006, and 2013. The urban population therefore made up 33%, 33%, 38% and 50.1% in the same years.

The Ghana Poverty and Inequality Report – 2016
11
In terms of poverty by region (Table 3), the highest poverty rates continue to be observed in the Northern, Upper East and Upper West regions of Ghana. There has been significant reduction in poverty in almost all regions between 1992 and 2013. Poverty was by far the highest in Upper East and Upper West regions in the 1990s and made comparatively little progress until recently. In particular, progress in reducing poverty in Upper East appears to have been dramatic since 2006, declining from 72.9% in 2006 to 44.4% in 2013. Similarly, progress in Upper West has also been most important since 2006, whereas overall progress had been almost negligible prior to 2006. An important region of concern is the Northern region which saw poverty levels decline from 55.7% in 2006 to just 50.4% in 2012. Its combination of a relatively high poverty rate and a relatively large population size means that the Northern region holds the highest number of poor people in Ghana. The Northern region experienced the smallest improvement in overall poverty levels since 1992.
Table 3: Poverty Incidence by region, 1992-2013
Old Poverty Line New Poverty Line
1992 1999 2006Change 1992-2006
2006 2013Change 2006-2013
Total Change 1992-2013
Western Region 59.6 27.3 18.6 -41.0 22.9 20.9 -2.0 -43.0
Central Region 44.3 48.4 19.9 -24.3 23.4 18.8 -4.6 -28.9
Greater Accra 25.8 5.2 11.8 -14.0 13.5 5.6 -7.9 -21.9
Volta Region 57.0 37.7 31.7 -25.3 37.3 33.8 -3.4 -28.7
Eastern Region 48.0 43.7 14.7 -33.2 17.8 21.7 3.9 -29.3
Ashanti Region 41.2 27.7 20.5 -20.7 24.0 14.8 -9.2 -30.1
Brong Ahafo 65.0 35.8 29.7 -35.3 34.0 27.9 -6.2 -41.5
Northern Region 63.4 69.2 52.2 -11.3 55.7 50.4 -5.4 -16.7
Upper East 66.9 88.2 70.5 3.6 72.9 44.4 -28.5 -27.9
Upper West 88.4 83.9 87.9 -0.5 89.1 70.7 -18.4 -18.9
Table 4 shows the depth and severity11 indices of poverty across the ten regions in Ghana for 2006 and 2013. The Northern, Upper West and Upper East regions continue to have the highest rates of poverty depth and severity. However, these three regions secured the largest reductions in poverty depth and severity since 2006. Despite such progress, the results indicate that the poor live deep in poverty in these regions and that there are a significant number of poor individuals with consumption far below the poverty line, i.e. on average people in the Upper West Region live a third below the poverty line. Table 4 also shows some increases in the poverty depth over this period in some southern regions, including Western, Central, Volta, and Eastern, meaning that on average the poor in those regions are now living deeper in poverty than in 2006.
11 The latter the Foster-Greer-Thorbecke P2 index.

The Ghana Poverty and Inequality Report – 2016
12
Table 4: Regional poverty trends – Depth and Severity (2006 – 2013)
New Poverty Line Depth Severity Difference (percentage points)
2006 2013 2006 2013 Depth SeverityWestern 5.4 5.7 1.9 2.4 0.34 0.41Central 5.6 5.6 1.8 2.5 0.05 0.65Greater Accra 3.7 1.6 1.4 0.6 -2.07 -0.76Volta 9.2 9.8 3.2 4.0 0.66 0.75Eastern 4.2 5.8 1.6 2.4 1.59 0.82Ashanti 6.4 3.5 2.4 1.3 -2.86 -1.18Brong Ahafo 9.5 7.4 3.7 2.9 -2.13 -0.86Northern 23.0 19.3 12.0 9.8 -3.71 -2.22Upper East 35.3 17.2 20.4 9.0 -18.17 -11.42Upper West 50.7 33.2 32.8 18.8 -17.54 -14.01
In considering Ghana’s population of poor people, table 5 shows us that the Northern Region (with 1.3 million poor individuals) has the largest population of the poor in the country, while Greater Accra (241,166) has the smallest. The general population has continued its shift into urban zones, with 12% moving from rural to urban areas since 2006, meaning that Ghana has now become a predominantly urban country. Regional changes in the distribution of Ghana’s poor population largely reflect general population movements but with a few exceptions. Though Greater Accra saw a 2.4% increase in its population share between 2006 and 2013, its share of the population of poor people actually declined (by 2.1%). In the Eastern region, despite only experiencing a small increase in its population share (1.2%), its share of poor people increased by much more (by 3.4%).
Table 5: Distribution of the Poor and the Population (2006 and 2013)
Distribution of thePoor
Distribution of the Poor (%)
Distribution of the Population
2006 2013 2006 2013 Change 2006 2013 Change
Urban 1,041,086 1,402,091 14.7 22 7.3 37.7 50.1 12.4
Rural 6,050,606 4,981,967 85.3 78 -7.3 62.3 49.9 -12.4
Total 7,091,692 6,384,058 100 100 0 100 100 0
REGION
Western 514,737 507,416 7.3 7.9 0.7 10.1 9.2 -0.9
Central 456,322 438,835 6.4 6.9 0.4 8.8 8.9 0.1
Greater Accra 416,827 241,166 5.9 3.8 -2.1 13.9 16.3 2.4
Volta 618,168 773,051 8.7 12.1 3.4 7.5 8.7 1.2
Eastern 530,644 592,241 7.5 9.3 1.8 13.4 10.4 -3
Ashanti 894,264 766,148 12.6 12 -0.6 16.8 19.7 2.9
Brong Ahafo 692,635 727,607 9.8 11.4 1.6 9.2 9.9 0.7
Northern 1,490,584 1,326,048 21 20.8 -0.2 12 10 -2
Upper East 771,423 474,600 10.9 7.4 -3.4 4.8 4.1 -0.7
Upper West 706,083 536,943 10 8.4 -1.5 3.6 2.9 -0.7

The Ghana Poverty and Inequality Report – 2016
13
Looking at the last row of table 5, what is particularly striking is that although the percentage of poor people has declined by a quarter since 2006, the number of people living in poverty has only declined by 10%. This means that poverty reduction is not keeping pace with population growth. Declining from 7m in 2006, Ghana still has almost 6.4m poor people.
The final table in this section provides the estimates of child poverty (table 6). Children are considered to be below 18 years, while adults are those 18 years and above. As for the national population, a trend observed is the declining incidence of child poverty since 1992. However, our results for 2013 reveal that 28.3% of children are poor. This translates into approximately 3.5 million poor children in Ghana, out of the 2013 total child population of approximately 12.3 million. About 1 in 10 children live in extreme poverty, representing about 1.2 million children.
This means that the incidence of poverty among children in the country is over 37% higher than for adults in 2013. The depth of poverty is also higher among children compared to adults. The higher incidence of poverty among children is because many poor households have a large number of children. This is confirmed by finding a higher incidence of poverty among larger households and households with several children. This disparity has more than doubled since the early 1990s when children were 15% more likely to be poor than adults.
Table 6: National Poverty Estimates by Age Category 1992 – 2013 Poverty Incidence Extreme Poverty Incidence
1992 (old poverty line)All Ghana 51.7 36.5Adults 46.3 31.9Children (below 18) 53.4 40.5
1998 (old poverty line)All Ghana 39.7 27.0Adults 35.4 24.2Children (below 18) 44.0 29.9
2006 (old poverty line)All Ghana 28.3 18.0Adults 24.6 15.5Children (below 18) 32.5 20.8
2006 (new poverty line)
All Ghana 31.7 16.4Adults 27.5 14.2Children (below 18) 36.4 18.4
2013 (new poverty line)All Ghana 24.1 8.4Adults 20.6 7.0Children (below 18) 28.3 9.9Source: Own calculation based on GLSS3 – GLSS6 datasets

The Ghana Poverty and Inequality Report – 2016
14
4.3 Inequality analysisIn this section we assess the trend in inequality in Ghana since 1992, both by looking at inequality coefficients and also the extent to which different wealth groups have seen their welfare improve over time.
Inequality measures
Figure 7 provides a summary of inequality estimates based on the Gini coefficient and Theil index. One observation is that, the trend in inequality is quite similar across the various measures12. Despite the gains made in reducing poverty, all indices show that inequality has increased between 1992 and 2013.
Within the periods, all indices show consistent increases in inequality from 1992 to 1999 and from 1999 to 2006. The pattern between 2006 and 2013 is less clear. In almost all cases the change in inequality is very small over this period; some indices record a small increase, others almost no change and the GE(2) index (which gives more weight to the wealthiest) shows a decrease. Different inequality indices measure inequality differently and so can give different measures; but the key point it that almost no index shows a statistically significant change in inequality between 2006 and 2013.
So the increase in inequality, as measured by the Gini, slowed down or even stalled according to some measures between 2006 and 2013. However, we cannot say based on this one observation if this represents a longer term trend.
Figure 7: National Inequality Estimates (1992 – 2013)
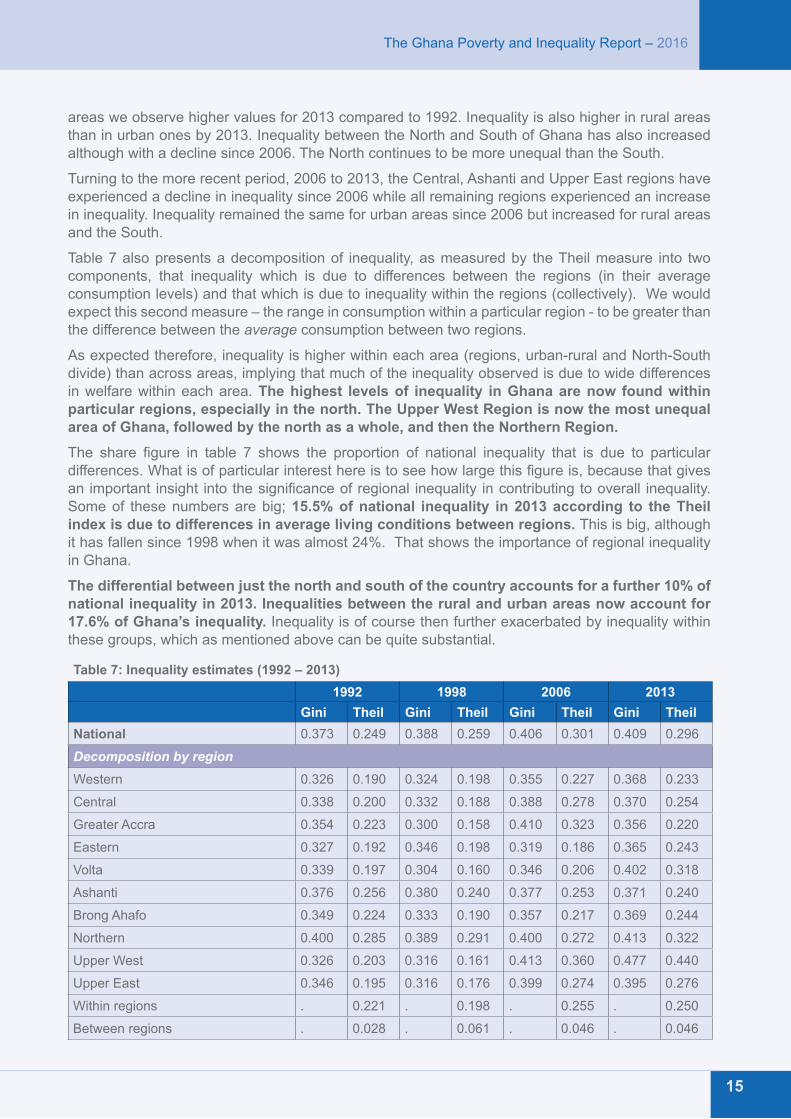
Table 7 provides a disaggregation of inequality by region, urban-rural location and north-south divide. The highest inequality recorded by the Gini coefficient is observed for Upper West in 2013. The lowest Gini coefficient in 2013 is recorded for Greater Accra. The inequality measures across the Gini, Theil index and Atkinson index provide similar rankings across our locations. The highest inequality in 1992 was recorded in the Northern Region, Urban areas and in the North of Ghana. The lowest inequality in 1992 is observed in the Western and Upper West regions of Ghana.
Over the entire time period, 1992-2013, all regions recorded increases in inequality, except the Ashanti region, which saw a small decline. Comparing the inequality estimates for urban and rural
12 There is one exception to this - the half squared coefficient of variation (GE(2))—this shows a decline in inequality between 2006 and 2013. The discrepancy is due to the greater weight the half-squared coefficient of variation places on the top percentiles of the distribution of adult equivalent consumption.
The Ghana Poverty and Inequality Report – 2016
15
areas we observe higher values for 2013 compared to 1992. Inequality is also higher in rural areas than in urban ones by 2013. Inequality between the North and South of Ghana has also increased although with a decline since 2006. The North continues to be more unequal than the South.
Turning to the more recent period, 2006 to 2013, the Central, Ashanti and Upper East regions have experienced a decline in inequality since 2006 while all remaining regions experienced an increase in inequality. Inequality remained the same for urban areas since 2006 but increased for rural areas and the South.
Table 7 also presents a decomposition of inequality, as measured by the Theil measure into two components, that inequality which is due to differences between the regions (in their average consumption levels) and that which is due to inequality within the regions (collectively). We would expect this second measure – the range in consumption within a particular region - to be greater than the difference between the average consumption between two regions.
As expected therefore, inequality is higher within each area (regions, urban-rural and North-South divide) than across areas, implying that much of the inequality observed is due to wide differences in welfare within each area. The highest levels of inequality in Ghana are now found within particular regions, especially in the north. The Upper West Region is now the most unequal area of Ghana, followed by the north as a whole, and then the Northern Region.
The share figure in table 7 shows the proportion of national inequality that is due to particular differences. What is of particular interest here is to see how large this figure is, because that gives an important insight into the significance of regional inequality in contributing to overall inequality. Some of these numbers are big; 15.5% of national inequality in 2013 according to the Theil index is due to differences in average living conditions between regions. This is big, although it has fallen since 1998 when it was almost 24%. That shows the importance of regional inequality in Ghana.
The differential between just the north and south of the country accounts for a further 10% of national inequality in 2013. Inequalities between the rural and urban areas now account for 17.6% of Ghana’s inequality. Inequality is of course then further exacerbated by inequality within these groups, which as mentioned above can be quite substantial.
Table 7: Inequality estimates (1992 – 2013) 1992 1998 2006 2013
Gini Theil Gini Theil Gini Theil Gini TheilNational 0.373 0.249 0.388 0.259 0.406 0.301 0.409 0.296
Decomposition by regionWestern 0.326 0.190 0.324 0.198 0.355 0.227 0.368 0.233
Central 0.338 0.200 0.332 0.188 0.388 0.278 0.370 0.254
Greater Accra 0.354 0.223 0.300 0.158 0.410 0.323 0.356 0.220
Eastern 0.327 0.192 0.346 0.198 0.319 0.186 0.365 0.243
Volta 0.339 0.197 0.304 0.160 0.346 0.206 0.402 0.318
Ashanti 0.376 0.256 0.380 0.240 0.377 0.253 0.371 0.240
Brong Ahafo 0.349 0.224 0.333 0.190 0.357 0.217 0.369 0.244
Northern 0.400 0.285 0.389 0.291 0.400 0.272 0.413 0.322
Upper West 0.326 0.203 0.316 0.161 0.413 0.360 0.477 0.440
Upper East 0.346 0.195 0.316 0.176 0.399 0.274 0.395 0.276
Within regions . 0.221 . 0.198 . 0.255 . 0.250
Between regions . 0.028 . 0.061 . 0.046 . 0.046

The Ghana Poverty and Inequality Report – 2016
16
Share of ‘between regions’ inequality in total inequality
0.112 0.236 0.153 0.155
Decomposition by urban/rural
Urban 0.347 0.213 0.349 0.206 0.373 0.257 0.373 0.242
Rural 0.342 0.212 0.369 0.239 0.366 0.238 0.389 0.277
Within urban/rural . 0.212 . 0.224 . 0.248 . 0.254
Between Urban and rural . 0.037 . 0.035 . 0.053 . 0.041Share of ‘between urban/rural’ inequality in total inequality
0.149 0.160 0.135 0.155 0.176 0.192 0.139 0.176
Decomposition by north/south
North 0.382 0.255 0.375 0.269 0.424 0.312 0.423 0.330
South 0.363 0.237 0.362 0.226 0.378 0.265 0.391 0.270
Within North/South . 0.240 . 0.230 . 0.270 . 0.276
Between North and South . 0.009 . 0.029 . 0.031 . 0.020Share of ‘between north/south’ inequality in total inequality
0.036 0.057 0.112 0.151 0.103 0.163 0.068 0.101
Source: Authors’ calculation based on GLSS datasets.
Inequality in consumption growth
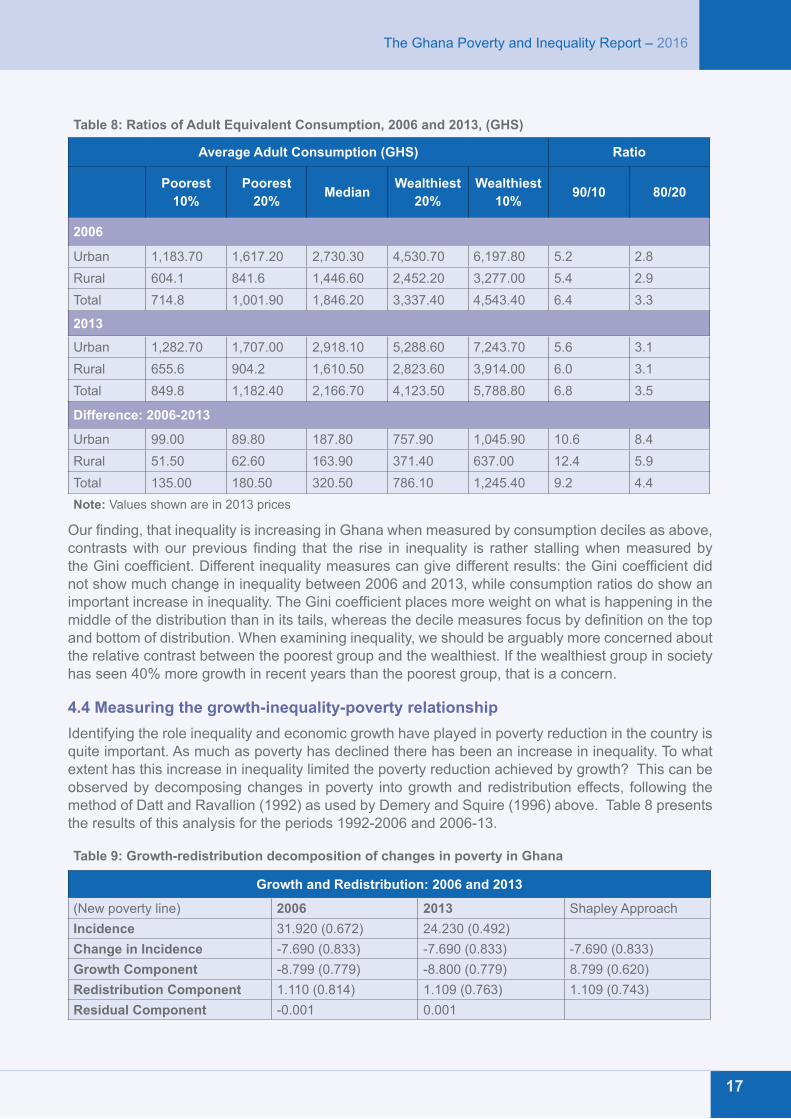
We also compare the level of consumption and its growth rate for the various population groups in an attempt to assess to what extent those living in poverty have benefited from economic growth. In table 8 below, we present the consumption levels for various groups of the population in both 2006 and 2013. For example, the poorest 10% of the population consumed on average 714.80 GHS per adult in 2006 which rose to 849.80 GHS in 2013.
In comparing the ratio of the poorest 10%’s consumption to that of the wealthiest 10% we find that the wealthiest decile had an average consumption 6.4 times that of the poorest decile in 2006. This gap then increased by 2013 to 6.8 times, so this measure suggests that inequality has risen. Most starkly, we find that the average adult consumption of the poorest 10% increased by 19% between 2006 and 2013, whereas the wealthiest 10% of the population saw their consumption increase by 27% - 1.42 times greater growth.
The consumption share of the wealthiest 10% rose slightly from 32.1% of national consumption to 32.5% between 2006 and 2013. Over the same period the bottom 10% increased their consumption share from 1.67% to 1.72%. However, these changes may be significant underestimations given difficulties of measurement at the top and bottom of the distribution.
The distribution masks some of the changes occurring within the wealthiest 10% and poorest 10%. Among the wealthiest, individuals in the very richest 99th percentile in 2006 consumed more than twice as much as those in the 90th percentile (2.41). In 2013 this marginally decreased to 2.33 (from 2.41). Among the poorest 10%, individuals at the 10th percentile consumed twice as much as those in the very poorest 1st percentile (2.60) in 2006. This marginally decreases in 2013 to 2.45.Thus, we find that among the poorest 10% and wealthiest 10% of the population, the lowest incomes within each group are catching up with the highest incomes (albeit at a slow pace). Again, one explanation could be that the survey did not successfully capture consumption by the wealthiest individuals. However, for the bottom 10%, it is an indication that current policies have had an impact on the extreme poor thereby raising the consumption of the poorest 1%. These changes occurring at the tails of the distribution are not observed with the same intensity in the middle of the distribution.
The Ghana Poverty and Inequality Report – 2016
17
Table 8: Ratios of Adult Equivalent Consumption, 2006 and 2013, (GHS)
Average Adult Consumption (GHS) Ratio
Poorest 10%
Poorest 20% Median Wealthiest
20%Wealthiest
10% 90/10 80/20
2006
Urban 1,183.70 1,617.20 2,730.30 4,530.70 6,197.80 5.2 2.8Rural 604.1 841.6 1,446.60 2,452.20 3,277.00 5.4 2.9Total 714.8 1,001.90 1,846.20 3,337.40 4,543.40 6.4 3.3
2013
Urban 1,282.70 1,707.00 2,918.10 5,288.60 7,243.70 5.6 3.1Rural 655.6 904.2 1,610.50 2,823.60 3,914.00 6.0 3.1Total 849.8 1,182.40 2,166.70 4,123.50 5,788.80 6.8 3.5
Difference: 2006-2013
Urban 99.00 89.80 187.80 757.90 1,045.90 10.6 8.4Rural 51.50 62.60 163.90 371.40 637.00 12.4 5.9Total 135.00 180.50 320.50 786.10 1,245.40 9.2 4.4Note: Values shown are in 2013 prices
Our finding, that inequality is increasing in Ghana when measured by consumption deciles as above, contrasts with our previous finding that the rise in inequality is rather stalling when measured by the Gini coefficient. Different inequality measures can give different results: the Gini coefficient did not show much change in inequality between 2006 and 2013, while consumption ratios do show an important increase in inequality. The Gini coefficient places more weight on what is happening in the middle of the distribution than in its tails, whereas the decile measures focus by definition on the top and bottom of distribution. When examining inequality, we should be arguably more concerned about the relative contrast between the poorest group and the wealthiest. If the wealthiest group in society has seen 40% more growth in recent years than the poorest group, that is a concern.
4.4 Measuring the growth-inequality-poverty relationshipIdentifying the role inequality and economic growth have played in poverty reduction in the country is quite important. As much as poverty has declined there has been an increase in inequality. To what extent has this increase in inequality limited the poverty reduction achieved by growth? This can be observed by decomposing changes in poverty into growth and redistribution effects, following the method of Datt and Ravallion (1992) as used by Demery and Squire (1996) above. Table 8 presents the results of this analysis for the periods 1992-2006 and 2006-13.
Table 9: Growth-redistribution decomposition of changes in poverty in Ghana
Growth and Redistribution: 2006 and 2013
(New poverty line) 2006 2013 Shapley ApproachIncidence 31.920 (0.672) 24.230 (0.492) Change in Incidence -7.690 (0.833) -7.690 (0.833) -7.690 (0.833)Growth Component -8.799 (0.779) -8.800 (0.779) 8.799 (0.620)Redistribution Component 1.110 (0.814) 1.109 (0.763) 1.109 (0.743)Residual Component -0.001 0.001

The Ghana Poverty and Inequality Report – 2016
18
Growth and Redistribution: 1992 and 2006(Old poverty line) 1992 2006 Shapley ApproachIncidence 51.720 (0.875) 28.548 (0.656) Change in Incidence -23.172 (1.093) -23.172 (1.093) -23.172 (1.093)Growth Component -27.146 (1.275) -24.248 (1.077) -26.697 (0.902)Redistribution Component 1.076 (0.916) 3.974 (0.994) 2.525 (0.818)Residual Component 2.898 -2.898 Note: Standard errors in brackets. Source: Authors’ calculation based on GLSS3, GLSS5 and GLSS6
What this analysis shows is that increases in inequality reduced the effect of growth on cutting poverty in both periods. Between 1992 and 2006 poverty fell by an impressive 23.2 percentage points; but if inequality had not increased the reduction would have been 2.5 percentage points higher - equivalent to maintaining around 555,422 people in poverty by 2006 who could have otherwise exited it. The increase in inequality over the period limited the impact of growth on poverty reduction. Over the shorter 2006-13 period, the same point is true: increasing inequality reduced the impact of growth over this period by 1.1 percentage points – equivalent to around 289,822 people. This is an important demonstration of the extent to which rising inequality over a period makes growth less effective in reducing poverty.
Figures 8 and 9 provide a decomposition of this effect by rural and urban households. If inequality had not increased, urban households would have seen a 2.1 percentage point bigger reduction in poverty incidence. For rural areas the redistribution effect actually reduced poverty. However, it was not precisely estimated given the large associated standard error. In addition, the residual component of the decomposition limited the decline in poverty by 2.1 percentage points. Likewise, the decline in the depth of poverty has been limited by an increase in inequality for both rural and urban households. In the absence of an increase in inequality, the depth of poverty would have declined by 2 and 1.6 percentage points more for urban and rural households respectively.
In figure 9, which considers the more recent 2006-2013 period, the increase in inequality for rural households greatly limited the amount of poverty reduction achieved. Without the increase in inequality, poverty would have declined by 2.8 percentage points more than observed. Similarly, for 2006-13, urban households would have seen a greater decline in poverty by 2.8 percentage points than occurred. Poverty depth for rural households would also have been much more reduced in the absence of inequality increases.

The Ghana Poverty and Inequality Report – 2016
19
Figure 8: Growth and Inequality Decomposition of Poverty: Urban versus Rural Households (1992 – 2006) (Incidence and Depth)
Source: Authors’ calculation based on GLSS3 and GLSS5
Figure 9: Growth and Inequality Decomposition of Poverty: Urban versus Rural Households (2006 – 2013) (Incidence and Depth)
Source: Authors’ calculation based on GLSS5 and GLSS6

The Ghana Poverty and Inequality Report – 2016
20
Growth incidence by percentileWe turn now to analyse the distributional pattern of growth in more depth by using growth incidence curves, which show the growth rate in household consumption for every percentile. The first set of graphs (Figure 10) show the growth incidence curves for Ghana (based on the old poverty lines) for the period 1992 to 2013 and figure 11 shows the growth incidence curves (based on the new poverty lines) for 2006 to 2013 for rural and urban areas.
We observe that the growth incidence curves all lie above zero, meaning that all groups, wealthy or poor, have experienced positive growth in their consumption levels throughout the entire period, although some of the most poor people experienced growth rates very close to zero. The results show that the growth experienced by the poor in Ghana has improved since the 1990s.
At the same time the growth incidence curves confirm the increasing inequality observed among households in Ghana. The growth incidence curves are generally upward sloping showing greater growth at the top of the distribution compared to the bottom. This pattern is a lot less strong over the more recent 2006-13 period, where there is actually quite fast growth at the bottom of the distribution, as well as fast growth toward the top of the distribution. This latter accounts for the increase in inequality according to some measures.

The Ghana Poverty and Inequality Report – 2016
21
Figure 10: Growth Incidence Curves, 1992 – 2013

The Ghana Poverty and Inequality Report – 2016
22
Figure 11: Rural and Urban Growth Incidence Curves 2006 to 2013
In the early 1990s (top of figure 10), the curve rose steeply, meaning that the very poorest experienced a much lower level of growth than the very wealthiest. From 1998 to 2006 the curve flattened out in the middle significantly, meaning that the majority of the population in the middle experienced a similar growth rate – however the extreme poorest population saw very low growth rates while the extreme wealthiest end saw significantly high growth rates. This led to increasing levels of inequality over this period.
What is notable is that, most recently, in the period 2006 to 2013 (figure 11), the curve flattens out even more but the tail inverts – the very extreme poorest are now experiencing higher levels of growth than average. This reflects a slowdown in the increase in inequality. A range of different factors related to the country’s economic transformation and urbanisation in particular may have created this change, although targeted programmes for the extreme poor, such as LEAP, have benefitted some of the poorest disproportionately. For the extreme 1-2% wealthiest, it could be possible that this change in the pattern of growth incidence may partly be attributed to the impact of the various economic crises that occurred around 2008.

The Ghana Poverty and Inequality Report – 2016
23
For this most recent period, 2006 to 2013, we also break down the incidence of growth across the percentiles by urban and rural areas (figure 11). Between the two areas, we see some important differences in growth occurring in rural versus urban areas. The very poorest people in urban areas experienced the highest levels of consumption growth for the country as a whole – higher than wealthier households and higher than rural households living in the same poorest percentile. This suggests a particular success of urbanisation in Ghana in recent years. What also really stands out is that, in rural areas, the wealthiest rural households have experienced much higher levels of growth than all other rural households reflecting the increased within region inequality, as noted earlier in the section.
The growth incidence curves indicate that over these periods the poorest saw their consumption levels increase. However, they show that there has not been inclusive growth, as growth in general has not benefited the poorest more than other groups and that it has not reduced inequality.
Pro-poor growth measuresWe turn finally to look at growth at decile points and to investigate some measures of pro-poor growth. In the second and third columns of table 10, we provide the mean consumption at each decile point. In column 4 we provide the percentage growth rates of mean consumption at these points. Growth has been greater at higher decile points – 2.9% for the poorest 10% but 4.1% for the wealthiest 10% - also suggesting increased inequality over this period.
Table 10: Growth at Each Decile between 2006 and 2013
Deciles Consumption - 2006 Consumption - 2013 Growth - Annual
National 2431.4 2926.9 3.1
10 714.8 849.8 2.9
20 1001.9 1182.4 2.8
30 1257.7 1480.2 2.8
40 1535.0 1808.0 2.8
50 1846.2 2166.7 2.7
60 2205.6 2618.5 2.9
70 2639.1 3175.2 3.1
80 3337.4 4123.5 3.6
90 4543.4 5788.8 4.1
Table 11 below provides the results for the various indices of pro-poor growth to provide a robust analysis of whether growth in Ghana has been inclusive. As shown in the analysis above, there is evidence of absolute pro-poor growth occurring in the country – i.e. that the poorest have seen their consumption levels rise. The Kakwani and Pernia index which is a summary index of pro-poor growth is close to one so we can conclude that growth in Ghana has been pro-poor in absolute terms. The Ravallion and Chen (2003) indices are also consistent with this, confirming that there has been absolute pro-poor growth and in all periods. The PEGR index is slightly less than the growth rate in adult equivalent consumption implying that the non-poor benefited proportionally more than the poor from economic growth. The PEGR result suggests that inequality has slowed down poverty reduction. Kakwani, et al (2004) note that a PEGR lying between zero and one as indicated above characterises a trickle-down process of economic growth – whereby, the benefits of economic growth are proportionally greater for the non-poor compared to the poor.
Whether growth has been inclusive or not is noted when we consider the relative measures of pro-poor growth. The two relative measures (of Ravallion and Chen and PEGR) are both negative indicating that the marginal increase in inequality has reduced the country’s poverty reduction efforts. This is not surprising given that inequality has been rising in Ghana. The growth in mean consumption for

The Ghana Poverty and Inequality Report – 2016
24
the poorest has not risen as fast as the richest individuals in the country. Thus, in relative terms and as already seen above, inequality plays a significant role in slowing down poverty reduction.
We can therefore conclude that all groups have seen their consumption rise. However, of significant interest is that we can say that while growth in Ghana has reduced poverty significantly, it has not been inclusive (in relative terms) as inequality has risen. So far in Ghana, the increases in inequality over recent periods have not offset the impact of growth on poverty reduction, but they have certainly moderated it. While rising inequality is a concern in its own right, for reasons of social inclusion and cohesion, the fact that Ghana’s growth is not inclusive, is slowing down poverty reduction, and could be much better shared with the poor, must be addressed. As the pace of poverty reduction slows and reaching the poorest becomes harder, it is important for government to address both poverty and inequality to achieve stronger pro-poor results in the future. Recent factors may have helped to stall the increase in inequality but they have not reversed it and it is likely that specific policy measures to support the growth of the poorest will very soon be required.
Table 11: Pro-poor Growth Indices 1992 – 2013 1992 - 1998 1992 - 2006 1998 - 2006 2006 - 2013
Growth rate in consumption % 25 58 27 20Ravallion & Chen (2003) index 0.12 0.24 0.15 0.16Ravallion & Chen (2003) relative pro-poor growth
-0.12 -0.34 -0.12 -0.05
Kakwani & Pernia (2000) index 0.90 0.85 0.93 0.87PEGR index 0.23 0.50 0.25 0.18PEGR relative pro-poor growth -0.02 -0.09 -0.02 -0.03Source: Authors’ calculation based on the GLSS datasets. The first 3 result columns are using the 2006 poverty line, the final result column uses the 2013 poverty line.
5 Conclusions The recently released Ghana Living Standards Survey (GLSS6) provided a valuable opportunity to update national poverty and inequality analysis. The paper confirms that considerable gains have been achieved in reducing poverty over the past two decades but that rising inequality increasingly threatens progress. This report traces the trends in poverty, inequality and inclusive growth over the 1992 to 2013 period for Ghana.
The remarkable results in poverty reduction have led to Ghana achieving the millennium development goal target of halving poverty overall. Furthermore, the progress in cutting extreme poverty has been far more impressive in recent years and should be further analysed. However, given the significant slowdown in the rate at which poverty has been reduced, and the fact that poverty depth has even increased in some regions, Ghana needs to redefine its fight against poverty. In particular, the major concern of the Northern region’s performance and size needs concerted focus. The large, recent improvement in poverty levels in the Upper East region needs specific analysis. In the Upper West region, its high level of poverty depth suggests that poverty programmes need to increase intensity of coverage there.
We found that children are significantly more likely to live in poverty than adults. Given the long-term and intergenerational nature of child poverty, this suggests that child poverty needs to become a specific focus of Government policy, taking an integrated approach to ensure that child wellbeing is tackled, particularly to address the 1.2 million children who are extremely poor.
The central finding of this paper is not only that inequality remains relatively high and has been rising, but that Ghana’s ‘inequality story’ is changing. The highest levels of inequality are now found within specific regions. The highest level of inequality in 2013 is found within the Upper West region, which has also seen the greatest increase in inequality since the 1990s. National policy needs to recognise

The Ghana Poverty and Inequality Report – 2016
25
this issue and address effectively why the poorest people in these regions are not experiencing as high growth as other groups.
The other major finding relates to the extent to which the poor are benefitting from economic growth. Given that poverty has been reduced, it is unsurprising that we find that all groups have benefited to some extent from growth since the 1990s. However, we do not find evidence of inclusive growth – i.e. it is the richest who have benefited the most from Ghana’s economic development. Since 2006 alone, the poorest group have seen consumption levels rise by around 40% less than the richest, on average. The wealthiest 10% of the population now consume a third of national consumption, compared to just 1.72% consumed by the poorest decile.
When considering how growth has been distributed we see clearly that wealthiest have witnessed consistently higher growth rates since the 1990s overall. However, what is highly notable is that this trend appears to have changed in recent years. Since 2006 the extreme poor – specifically those people living in the bottom 10% - have seen significantly improved growth rates, which is a complete reversal to previous decades. In particular, the poorest 1 or 2% of the population in urban areas have experienced higher growth rates than any other group in the country. If urbanisation has really benefitted the urban ultra-poor, then how? And for how long can this positive trend be sustained?
Finally, we determine that increasing inequality in Ghana is diminishing poverty reduction in Ghana, at the expense of hundreds of thousands of people who would otherwise have exited poverty. Although the rise in inequality has stalled in recent years, it has not been through concerted policy effort, and its rise will jeopardise future poverty reduction efforts for the remaining 6.7 million people who continue to be poor in the country.
AppendicesAppendix A: MethodologyPoverty indices
The FGT index is calculated as:
𝑃𝑃! = 1− 𝑦𝑦!𝑧𝑧
!!!!!
𝑁𝑁 𝐼𝐼 𝑦𝑦! ≤ 𝑧𝑧 ,𝛼𝛼 = 0,1,2
Where yi is real income, z is the poverty line, N is the number of households, and I(.) is an indicator function taking the value 1 if households are below the poverty line and zero otherwise. When α = 0 the poverty head count index is obtained, while α = 1 and α = 0 capture the poverty gap (depth) and severity of poverty respectively.
Inequality indices
The generalised entropy family of indices is given by:
𝐼𝐼! 𝑦𝑦 =1𝑛𝑛
1𝑐𝑐(𝑐𝑐 − 1)
𝑦𝑦!𝜇𝜇
!− 1 , 𝑐𝑐 ≠ 0,1
!
Where µ and n denote the mean income and population size, yi is equivalent income and c identifies the class of measure. The Theil index is given by I0 and I1 below which are the cases corresponding to c = 0 and c = 1 (Shorrocks, 1980, 1984).

The Ghana Poverty and Inequality Report – 2016
26
When c = 0, we obtain the mean log deviation (GE(0)) which is written as
𝐼𝐼! 𝑦𝑦 = 1𝑛𝑛 log
𝜇𝜇𝑦𝑦!, 𝑐𝑐 = 0,
!
We obtain the Theil index (GE(1)) when c = 1 as given in the equation below:
𝐼𝐼! 𝑦𝑦 = 1𝑛𝑛
𝑦𝑦!𝜇𝜇 log
𝜇𝜇𝑦𝑦!, 𝑐𝑐 = 1,
!
The equation for GE(2) is given below.
𝐼𝐼! 𝑦𝑦 =12
1𝑛𝑛
𝑦𝑦!𝜇𝜇
!− 1
!
, 𝑐𝑐 = 2,
The Gini is calculated as:
𝛾𝛾 =𝑁𝑁 + 1𝑁𝑁 − 1−
2𝑁𝑁(𝑁𝑁 − 1)𝜇𝜇 𝜌𝜌!𝑦𝑦!
!
!!!
Where ρi is the rank of the individual in the income distribution ranked from the highest to the lowest, N is the population, yi is equivalent income and µ is mean income.
Pro-poor growth indices
The Kakwani and Pernia (2000) index is:
𝜙𝜙 =𝛿𝛿𝜂𝜂
Where φ is the pro-poor index, δ is the sum of the changes to poverty due to changing income inequality and η is the poverty elasticity (the proportionate change in poverty due to a unit increase in income). If φ > 1, then growth has been strongly pro-poor while φ < 0 indicates that growth has increased poverty and has thus been anti-poor (Kakwani and Pernia, 2000). On the contrary, 0 < φ < 1 indicates that growth has been weakly pro-poor – poverty reduces but with higher inequality.
The Kakwani et al. (2004) index – poverty equivalent growth rate (PEGR) is:
𝛾𝛾∗ =𝛿𝛿𝜂𝜂 𝛾𝛾 = 𝜙𝜙𝜙𝜙
Where φ, η, and δ are as defined above for the Kakwani and Pernia index, γ* is the PEGR – the growth “that will result in the same level of poverty reduction as the present growth rate γ if the process had not been accompanied by any change in inequality (when everyone in the society had received the same proportional benefits of growth)” (Kakwani et al., 2004: 8). Growth is pro-poor if γ* > γ and anti-poor if γ* < γ. If 0 < γ* < γ then growth although pro-poor is associated with increasing inequality.

The Ghana Poverty and Inequality Report – 2016
27
Decomposition of poverty changes
Following Datt and Ravallion (1992) we decompose the changes in poverty into its respective growth, redistribution and residual components. The FGT poverty measures can be written as a function of the poverty line (z), mean adult equivalent consumption (µt) and the Lorenz curve (Lt):
𝑃𝑃! = 𝑃𝑃(𝑧𝑧𝜇𝜇!, 𝐿𝐿!)
Given the equation above, changes in poverty are as a result of changes in mean adult equivalent consumption relative to the poverty line and changes in the inequality.
We can therefore decompose the changes in poverty due to a change in mean consumption holding the Lorenz curve constant (that is, keeping inequality unchanged). Also, holding mean consumption constant we can show the change in poverty due to a change in inequality. The growth component is associated with changes in mean income while the redistribution component is due to changes in inequality. The residual component ensures that when the decomposition is not exact, the remainder allows all three components to sum up to the change in poverty. Datt and Ravallion (1992) note that the residual will always exist when the poverty index is not additively separable between mean consumption and inequality (the Lorenz curve). For instance, the decomposition of the changes in poverty between 2013 and 2006 is given as:
𝑃𝑃!"#$ − 𝑃𝑃!""#= 𝑃𝑃
𝑧𝑧𝜇𝜇!"#$
, 𝐿𝐿!""# − 𝑃𝑃𝑧𝑧
𝜇𝜇!""#, 𝐿𝐿!""#
growth component
+ 𝑃𝑃𝑧𝑧
𝜇𝜇!""#, 𝐿𝐿!"#$ − 𝑃𝑃
𝑧𝑧𝜇𝜇!""#
, 𝐿𝐿!""#inequality component
+ [ 𝑃𝑃𝑧𝑧
𝜇𝜇!"#$, 𝐿𝐿!""# − 𝑃𝑃
𝑧𝑧𝜇𝜇!""#
, 𝐿𝐿!""# − 𝑃𝑃𝑧𝑧
𝜇𝜇!""#, 𝐿𝐿!"#$ − 𝑃𝑃
𝑧𝑧𝜇𝜇!""#
, 𝐿𝐿!""# ]
residual component
The formulation above assumes that 2006 is the base year for computations. Base year computations can also be done with 2013. In the text we present results for both years.

The Ghana Poverty and Inequality Report – 2016
28
Appendix B: National Poverty EstimatesOur national monetary poverty results based on the old price deflator and poverty lines of 2006 are presented in figures 3 and 4. As has been widely reported, the poverty rates based on the old poverty lines show a decline from 51.7% in 1992 to 28.5% in 2006—a decline of 23.2 percentage points in the incidence of poverty over the period. Similarly, there is an 18.4 percentage point decrease in the incidence of extreme poverty. The depth and severity of poverty also show a decline over the period.
Figure 1: National Poverty 1992 – 2006 (using the old poverty lines)
Figure 2: National Extreme Poverty (using old poverty line)

The Ghana Poverty and Inequality Report – 2016
29
Appendix Table 1: Poverty estimates based on GLSS V
Poverty estimates for Ghana
Upper Poverty Line = 1,314 Lower Poverty Line = 792.05
Head Count Depth Severity Head Count Depth Severity
All Ghana 31.9 11.0 5.4 16.5 5.0 2.3
Male 34.9 12.4 6.2 18.6 5.9 2.7
Female 22.1 6.4 2.7 9.8 2.3 0.9
Western Region 22.9 5.4 1.9 6.8 1.3 0.5
Central Region 23.4 5.6 1.8 7.6 1.1 0.3
Greater Accra 13.5 3.7 1.4 5.2 1.1 0.3
Eastern Region 37.3 9.2 3.2 13.3 2.2 0.6
Volta Region 17.8 4.2 1.6 5.8 1.2 0.4
Ashanti Region 24.0 6.4 2.4 9.8 1.8 0.6
Brong Ahafo 34.0 9.5 3.7 13.7 2.9 1.1
Northern Region 55.7 23.0 12.0 36.1 12.1 5.4
Upper West 72.9 35.3 20.4 56.9 21.3 10.6
Upper East 89.1 50.7 32.8 76.0 35.4 20.1
Accra (GAMA) 12.0 3.4 1.3 4.5 1.1 0.4
Urban Coastal 6.4 1.3 0.3 1.1 0.1 0.0
Urban Forest 8.7 2.2 0.9 2.8 0.8 0.3
Urban Savannah 30.1 10.7 5.2 16.9 5.1 2.1
Rural Coastal 27.2 6.7 2.3 9.6 1.6 0.4
Rural Forest 33.1 8.4 3.1 12.6 2.1 0.6
Rural Savannah 64.2 28.0 15.6 42.9 16.0 7.9
Urban 12.4 3.7 1.6 5.1 1.4 0.5
Rural 43.7 15.4 7.6 23.4 7.2 3.3
North 65.6 30.7 17.6 48.0 18.4 9.2
South 23.3 6.0 2.2 8.5 1.6 0.5
Public 8.7 2.4 0.9 2.9 0.8 0.3
Wage Private formal 11.9 2.8 0.9 2.3 0.6 0.2
Wage Private Informal 19.8 6.3 2.8 8.4 2.4 1.0
Self Agro Export 30.2 8.1 3.2 12.6 2.6 0.8
Self Agro Crop 50.1 18.6 9.4 28.6 9.1 4.3
Self Business 19.1 5.8 2.6 8.4 2.4 1.0
Non Working 14.3 4.5 2.0 6.9 1.6 0.7

The Ghana Poverty and Inequality Report – 2016
30
Appendix Table 2: Poverty estimates based on GLSS VI
Poverty estimates for Ghana
Upper Poverty Line = 1,314 Lower Poverty Line = 792.05
Head Count Depth Severity Head Count Depth Severity
All Ghana 24.2 7.8 3.6 8.4 2.3 0.9
Male 25.9 8.4 3.9 9.2 2.5 1.0
Female 19.1 5.7 2.5 5.9 1.6 0.6
Western Region 20.9 5.7 2.3 5.5 1.3 0.5
Central Region 18.8 5.6 2.5 6.8 1.5 0.6
Greater Accra 5.6 1.6 0.6 1.5 0.3 0.1
Eastern Region 33.8 9.8 4.0 9.0 1.9 0.6
Volta Region 21.7 5.8 2.4 6.0 1.3 0.5
Ashanti Region 14.7 3.5 1.3 2.9 0.5 0.2
Brong Ahafo 27.9 7.4 2.9 6.6 1.5 0.5
Northern Region 50.4 19.3 9.8 22.8 7.2 3.2
Upper West 44.4 17.2 9.0 21.3 6.9 3.1
Upper East 70.7 33.2 18.8 45.1 15.3 7.2
Accra (GAMA) 3.5 0.9 0.3 0.5 0.1 0.0
Urban Coastal 10.1 2.3 0.9 2.0 0.4 0.2
Urban Forest 9.9 2.0 0.7 1.8 0.2 0.0
Urban Savannah 26.4 6.6 2.4 4.6 1.0 0.4
Rural Coastal 30.3 8.7 t3.6 9.4 1.8 0.6
Rural Forest 27.9 7.9 3.3 7.8 1.8 0.7
Rural Savannah 55.0 22.0 11.5 27.3 8.7 3.9
Urban 10.6 2.5 0.9 1.9 0.3 0.1
Rural 37.9 13.1 6.3 15.0 4.3 1.8
North 52.4 21.2 11.2 26.2 8.5 3.8
South 18.5 5.0 2.0 4.8 1.0 0.4

The Ghana Poverty and Inequality Report – 2016
31
Appendix C: Inequality EstimatesAppendix Table 3: Inequality estimates based on GLSS3 (2006 prices)
Gini GE(-1) GE(0) GE(1) GE(2) A(1/2) A(1) A(2)All Ghana 0.373 0.274 0.231 0.249 0.358 0.113 0.206 0.354Male 0.372 0.271 0.230 0.251 0.370 0.113 0.206 0.351Female 0.366 0.265 0.222 0.233 0.318 0.107 0.199 0.347Gender Within . 0.271 0.228 0.246 0.354 0.111 0.204 0.350Gender Between . 0.003 0.003 0.003 0.003 0.002 0.004 0.007Accra GAMA 0.364 0.240 0.215 0.234 0.326 0.106 0.193 0.324Urban Coastal 0.307 0.166 0.152 0.163 0.207 0.076 0.141 0.249Urban Forest 0.343 0.213 0.190 0.203 0.266 0.094 0.173 0.298Urban Savannah 0.359 0.307 0.229 0.228 0.305 0.107 0.205 0.381Rural Coastal 0.325 0.186 0.170 0.184 0.242 0.085 0.156 0.271Rural Forest 0.342 0.207 0.191 0.220 0.348 0.097 0.174 0.293Rural Savannah 0.333 0.222 0.186 0.192 0.250 0.090 0.170 0.307Location Within . 0.231 0.187 0.204 0.311 0.093 0.172 0.298Location Between . 0.044 0.044 0.045 0.047 0.022 0.042 0.081Western 0.326 0.186 0.172 0.190 0.261 0.086 0.158 0.271Central 0.338 0.228 0.192 0.200 0.259 0.093 0.174 0.313Greater Accra 0.354 0.233 0.205 0.223 0.312 0.101 0.186 0.318Eastern 0.327 0.189 0.174 0.192 0.268 0.087 0.160 0.275Volta 0.339 0.206 0.185 0.197 0.255 0.091 0.169 0.292Ashanti 0.376 0.268 0.233 0.256 0.376 0.115 0.208 0.349Brong Ahafo 0.349 0.215 0.198 0.224 0.322 0.100 0.180 0.301Northern 0.400 0.356 0.276 0.285 0.423 0.131 0.241 0.416Upper West 0.326 0.181 0.175 0.203 0.302 0.090 0.160 0.266Upper East 0.346 0.239 0.197 0.195 0.227 0.094 0.179 0.324Region Within . 0.246 0.203 0.221 0.329 0.101 0.184 0.316Region Between . 0.028 0.028 0.028 0.029 0.014 0.027 0.056Urban 0.347 0.233 0.199 0.213 0.289 0.098 0.181 0.318Rural 0.342 0.222 0.194 0.212 0.307 0.096 0.176 0.307Urban Within . 0.240 0.196 0.212 0.319 0.097 0.178 0.312Urban Between . 0.035 0.036 0.037 0.039 0.018 0.034 0.061North 0.382 0.296 0.243 0.255 0.365 0.117 0.216 0.372South 0.363 0.244 0.216 0.237 0.341 0.107 0.194 0.328North Within . 0.263 0.221 0.240 0.349 0.108 0.197 0.334North Between . 0.011 0.010 0.009 0.009 0.005 0.012 0.031Public 0.366 0.258 0.222 0.242 0.351 0.109 0.199 0.340Wage Private formal 0.337 0.238 0.192 0.197 0.254 0.092 0.174 0.323Wage Private Informal 0.359 0.237 0.211 0.236 0.347 0.105 0.191 0.322Self Agro Export 0.338 0.216 0.193 0.220 0.351 0.097 0.175 0.302Self Agro Crop 0.334 0.214 0.184 0.193 0.249 0.090 0.168 0.299Self Business 0.352 0.231 0.203 0.220 0.305 0.100 0.184 0.316Non Working 0.363 0.250 0.217 0.232 0.313 0.106 0.195 0.333Socio Economic Within . 0.239 0.197 0.215 0.324 0.098 0.181 0.315Socio Economic Between . 0.035 0.034 0.034 0.034 0.016 0.031 0.057

The Ghana Poverty and Inequality Report – 2016
32
Appendix Table 4: Inequality estimates based on GLSS4 (2006 prices)
Gini GE(-1) GE(0) GE(1) GE(2) A(1/2) A(1) A(2)
All Ghana 0.388 0.325 0.255 0.259 0.355 0.121 0.225 0.394Male 0.385 0.320 0.252 0.256 0.358 0.119 0.223 0.390Female 0.392 0.330 0.259 0.261 0.341 0.122 0.228 0.397Gender Within . 0.323 0.254 0.257 0.354 0.120 0.224 0.392Gender Between . 0.001 0.001 0.001 0.001 0.001 0.001 0.002Accra GAMA 0.282 0.147 0.133 0.144 0.211 0.066 0.124 0.227Urban Coastal 0.367 0.274 0.224 0.231 0.301 0.108 0.201 0.354Urban Forest 0.350 0.263 0.208 0.202 0.239 0.097 0.188 0.345Urban Savannah 0.298 0.156 0.142 0.148 0.177 0.070 0.133 0.237Rural Coastal 0.358 0.239 0.211 0.237 0.404 0.105 0.190 0.324Rural Forest 0.328 0.204 0.178 0.187 0.240 0.087 0.163 0.290Rural Savannah 0.396 0.294 0.256 0.284 0.429 0.126 0.226 0.370Location Within . 0.268 0.200 0.204 0.297 0.094 0.175 0.307Location Between . 0.057 0.055 0.055 0.058 0.029 0.061 0.125Western 0.324 0.191 0.174 0.198 0.338 0.087 0.159 0.276Central 0.332 0.196 0.177 0.188 0.240 0.087 0.162 0.281Greater Accra 0.300 0.168 0.149 0.158 0.216 0.073 0.138 0.252Eastern 0.346 0.246 0.201 0.198 0.236 0.095 0.182 0.330Volta 0.304 0.173 0.152 0.160 0.205 0.075 0.141 0.258Ashanti 0.380 0.315 0.245 0.240 0.292 0.114 0.217 0.387Brong Ahafo 0.333 0.214 0.183 0.190 0.242 0.089 0.167 0.299Northern 0.389 0.269 0.247 0.291 0.489 0.125 0.219 0.350Upper West 0.316 0.193 0.165 0.161 0.180 0.078 0.152 0.278Upper East 0.316 0.172 0.161 0.176 0.230 0.081 0.149 0.256Region Within . 0.252 0.191 0.198 0.294 0.092 0.172 0.304Region Between . 0.072 0.064 0.061 0.062 0.032 0.064 0.129Urban 0.349 0.256 0.206 0.206 0.267 0.098 0.187 0.339Rural 0.369 0.279 0.229 0.239 0.339 0.110 0.204 0.358Urban Within . 0.292 0.221 0.224 0.318 0.104 0.196 0.349Urban Between . 0.033 0.034 0.035 0.037 0.018 0.036 0.068North 0.375 0.251 0.230 0.269 0.451 0.116 0.205 0.335South 0.362 0.265 0.219 0.226 0.308 0.105 0.196 0.346North Within . 0.282 0.221 0.230 0.331 0.106 0.197 0.345North Between . 0.042 0.034 0.029 0.025 0.016 0.035 0.075Public 0.336 0.210 0.185 0.195 0.251 0.091 0.169 0.296Wage Private formal 0.316 0.192 0.166 0.168 0.203 0.080 0.153 0.278Wage Private Informal 0.371 0.263 0.233 0.288 0.622 0.119 0.208 0.344Self Agro Export 0.300 0.165 0.148 0.157 0.200 0.073 0.138 0.248Self Agro Crop 0.370 0.272 0.228 0.240 0.331 0.110 0.204 0.352Self Business 0.359 0.267 0.217 0.219 0.292 0.103 0.195 0.348Non Working 0.389 0.454 0.289 0.248 0.272 0.125 0.251 0.476Socio Economic Within . 0.280 0.212 0.217 0.313 0.101 0.189 0.335Socio Economic Between . 0.045 0.043 0.042 0.042 0.022 0.044 0.088
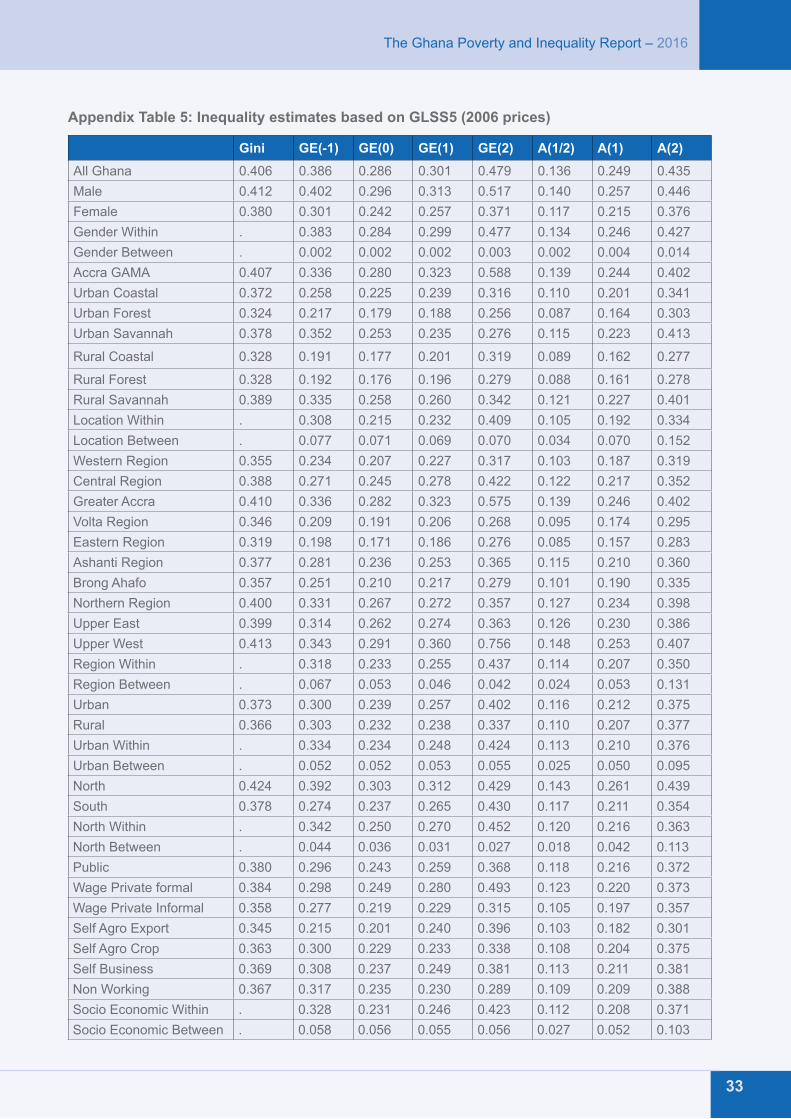
The Ghana Poverty and Inequality Report – 2016
33
Appendix Table 5: Inequality estimates based on GLSS5 (2006 prices)
Gini GE(-1) GE(0) GE(1) GE(2) A(1/2) A(1) A(2)All Ghana 0.406 0.386 0.286 0.301 0.479 0.136 0.249 0.435Male 0.412 0.402 0.296 0.313 0.517 0.140 0.257 0.446Female 0.380 0.301 0.242 0.257 0.371 0.117 0.215 0.376Gender Within . 0.383 0.284 0.299 0.477 0.134 0.246 0.427Gender Between . 0.002 0.002 0.002 0.003 0.002 0.004 0.014Accra GAMA 0.407 0.336 0.280 0.323 0.588 0.139 0.244 0.402Urban Coastal 0.372 0.258 0.225 0.239 0.316 0.110 0.201 0.341Urban Forest 0.324 0.217 0.179 0.188 0.256 0.087 0.164 0.303Urban Savannah 0.378 0.352 0.253 0.235 0.276 0.115 0.223 0.413
Rural Coastal 0.328 0.191 0.177 0.201 0.319 0.089 0.162 0.277
Rural Forest 0.328 0.192 0.176 0.196 0.279 0.088 0.161 0.278Rural Savannah 0.389 0.335 0.258 0.260 0.342 0.121 0.227 0.401Location Within . 0.308 0.215 0.232 0.409 0.105 0.192 0.334Location Between . 0.077 0.071 0.069 0.070 0.034 0.070 0.152Western Region 0.355 0.234 0.207 0.227 0.317 0.103 0.187 0.319Central Region 0.388 0.271 0.245 0.278 0.422 0.122 0.217 0.352Greater Accra 0.410 0.336 0.282 0.323 0.575 0.139 0.246 0.402Volta Region 0.346 0.209 0.191 0.206 0.268 0.095 0.174 0.295Eastern Region 0.319 0.198 0.171 0.186 0.276 0.085 0.157 0.283Ashanti Region 0.377 0.281 0.236 0.253 0.365 0.115 0.210 0.360Brong Ahafo 0.357 0.251 0.210 0.217 0.279 0.101 0.190 0.335Northern Region 0.400 0.331 0.267 0.272 0.357 0.127 0.234 0.398Upper East 0.399 0.314 0.262 0.274 0.363 0.126 0.230 0.386Upper West 0.413 0.343 0.291 0.360 0.756 0.148 0.253 0.407Region Within . 0.318 0.233 0.255 0.437 0.114 0.207 0.350Region Between . 0.067 0.053 0.046 0.042 0.024 0.053 0.131Urban 0.373 0.300 0.239 0.257 0.402 0.116 0.212 0.375Rural 0.366 0.303 0.232 0.238 0.337 0.110 0.207 0.377Urban Within . 0.334 0.234 0.248 0.424 0.113 0.210 0.376Urban Between . 0.052 0.052 0.053 0.055 0.025 0.050 0.095North 0.424 0.392 0.303 0.312 0.429 0.143 0.261 0.439South 0.378 0.274 0.237 0.265 0.430 0.117 0.211 0.354North Within . 0.342 0.250 0.270 0.452 0.120 0.216 0.363North Between . 0.044 0.036 0.031 0.027 0.018 0.042 0.113Public 0.380 0.296 0.243 0.259 0.368 0.118 0.216 0.372Wage Private formal 0.384 0.298 0.249 0.280 0.493 0.123 0.220 0.373Wage Private Informal 0.358 0.277 0.219 0.229 0.315 0.105 0.197 0.357Self Agro Export 0.345 0.215 0.201 0.240 0.396 0.103 0.182 0.301Self Agro Crop 0.363 0.300 0.229 0.233 0.338 0.108 0.204 0.375Self Business 0.369 0.308 0.237 0.249 0.381 0.113 0.211 0.381Non Working 0.367 0.317 0.235 0.230 0.289 0.109 0.209 0.388Socio Economic Within . 0.328 0.231 0.246 0.423 0.112 0.208 0.371Socio Economic Between . 0.058 0.056 0.055 0.056 0.027 0.052 0.103

The Ghana Poverty and Inequality Report – 2016
34
Appendix Table 6: Inequality estimates based on GLSS5 (2013 prices)
Gini GE(-1) GE(0) GE(1) GE(2) A-(1/2) A(1) A(2)All Ghana 0.406 0.386 0.286 0.301 0.479 0.136 0.249 0.435Male 0.412 0.402 0.296 0.313 0.517 0.140 0.257 0.446Female 0.380 0.301 0.242 0.257 0.371 0.117 0.215 0.376Gender Within . 0.383 0.284 0.299 0.477 0.134 0.246 0.427Gender Between . 0.002 0.002 0.002 0.003 0.002 0.004 0.014Accra GAMA 0.407 0.336 0.280 0.323 0.588 0.139 0.244 0.402Urban Coastal 0.372 0.258 0.225 0.239 0.316 0.110 0.201 0.341Urban Forest 0.324 0.217 0.179 0.188 0.256 0.087 0.164 0.303Urban Savannah 0.378 0.352 0.253 0.235 0.276 0.115 0.223 0.413Rural Coastal 0.328 0.191 0.177 0.201 0.319 0.089 0.162 0.277Rural Forest 0.328 0.192 0.176 0.196 0.279 0.088 0.161 0.278Rural Savannah 0.389 0.335 0.258 0.260 0.342 0.121 0.227 0.401Location Within . 0.308 0.215 0.232 0.409 0.105 0.192 0.334Location Between . 0.077 0.071 0.069 0.070 0.034 0.070 0.152Western Region 0.355 0.234 0.207 0.227 0.317 0.103 0.187 0.319Central Region 0.388 0.271 0.245 0.278 0.422 0.122 0.217 0.352Greater Accra 0.410 0.336 0.282 0.323 0.575 0.139 0.246 0.402Volta Region 0.346 0.209 0.191 0.206 0.268 0.095 0.174 0.295Eastern Region 0.319 0.198 0.171 0.186 0.276 0.085 0.157 0.283Ashanti Region 0.377 0.281 0.236 0.253 0.365 0.115 0.210 0.360Brong Ahafo 0.357 0.251 0.210 0.217 0.279 0.101 0.190 0.335Northern Region 0.400 0.331 0.267 0.272 0.357 0.127 0.234 0.398Upper East 0.399 0.314 0.262 0.274 0.363 0.126 0.230 0.386Upper West 0.413 0.343 0.291 0.360 0.756 0.148 0.253 0.407Region Within . 0.318 0.233 0.255 0.437 0.114 0.207 0.350Region Between . 0.067 0.053 0.046 0.042 0.024 0.053 0.131Urban 0.373 0.300 0.239 0.257 0.402 0.116 0.212 0.375Rural 0.366 0.303 0.232 0.238 0.337 0.110 0.207 0.377Urban Within . 0.334 0.234 0.248 0.424 0.113 0.210 0.376Urban Between . 0.052 0.052 0.053 0.055 0.025 0.050 0.095North 0.424 0.392 0.303 0.312 0.429 0.143 0.261 0.439South 0.378 0.274 0.237 0.265 0.430 0.117 0.211 0.354North Within . 0.342 0.250 0.270 0.452 0.120 0.216 0.363North Between . 0.044 0.036 0.031 0.027 0.018 0.042 0.113Public 0.380 0.296 0.243 0.259 0.368 0.118 0.216 0.372Wage Private formal 0.384 0.298 0.249 0.280 0.493 0.123 0.220 0.373Wage Private Informal 0.358 0.277 0.219 0.229 0.315 0.105 0.197 0.357Self Agro Export 0.345 0.215 0.201 0.240 0.396 0.103 0.182 0.301Self Agro Crop 0.363 0.300 0.229 0.233 0.338 0.108 0.204 0.375Self Business 0.369 0.308 0.237 0.249 0.381 0.113 0.211 0.381Non Working 0.367 0.317 0.235 0.230 0.289 0.109 0.209 0.388Socio Economic Within . 0.328 0.231 0.246 0.423 0.112 0.208 0.371Socio Economic Between . 0.058 0.056 0.055 0.056 0.027 0.052 0.103

The Ghana Poverty and Inequality Report – 2016
35
Appendix Table 7: Inequality estimates based on GLSS6 (2013 prices)
Gini GE(-1) GE(0) GE(1) GE(2) A(1/2) A(1) A(2)
All Ghana 0.409 0.387 0.288 0.296 0.430 0.136 0.251 0.436Male 0.414 0.395 0.295 0.305 0.448 0.139 0.256 0.441Female 0.392 0.352 0.264 0.268 0.379 0.124 0.232 0.413Gender Within . 0.386 0.287 0.295 0.429 0.135 0.249 0.434Gender Between . 0.001 0.001 0.001 0.001 0.001 0.002 0.004Accra GAMA 0.346 0.245 0.202 0.208 0.278 0.097 0.183 0.329Urban Coastal 0.348 0.234 0.201 0.217 0.310 0.099 0.182 0.319Urban Forest 0.360 0.248 0.213 0.226 0.308 0.104 0.192 0.332Urban Savannah 0.365 0.252 0.219 0.239 0.341 0.108 0.196 0.335Rural Coastal 0.422 0.349 0.299 0.359 0.756 0.150 0.258 0.411Rural Forest 0.350 0.245 0.205 0.218 0.312 0.100 0.185 0.329Rural Savannah 0.406 0.355 0.280 0.300 0.467 0.134 0.244 0.415Location Within . 0.321 0.226 0.234 0.366 0.107 0.196 0.342Location Between . 0.066 0.063 0.062 0.063 0.032 0.067 0.143Western Region 0.368 0.289 0.230 0.233 0.306 0.109 0.205 0.366Central Region 0.370 0.282 0.232 0.254 0.400 0.113 0.207 0.361Greater Accra 0.356 0.282 0.219 0.220 0.291 0.103 0.196 0.361Volta Region 0.402 0.313 0.270 0.318 0.635 0.135 0.237 0.385Eastern Region 0.365 0.275 0.225 0.243 0.358 0.110 0.201 0.355Ashanti Region 0.371 0.268 0.227 0.240 0.329 0.110 0.203 0.349Brong Ahafo 0.369 0.264 0.225 0.244 0.367 0.110 0.202 0.346Northern Region 0.413 0.360 0.290 0.322 0.524 0.141 0.252 0.418Upper East 0.395 0.363 0.271 0.276 0.401 0.127 0.238 0.421Upper West 0.477 0.491 0.383 0.440 0.744 0.186 0.318 0.496Region Within . 0.339 0.242 0.250 0.382 0.114 0.209 0.366Region Between . 0.048 0.046 0.046 0.047 0.025 0.052 0.111Urban 0.373 0.283 0.232 0.242 0.331 0.112 0.207 0.361Rural 0.389 0.332 0.259 0.277 0.452 0.125 0.228 0.399Urban Within . 0.342 0.246 0.254 0.389 0.116 0.215 0.375Urban Between . 0.045 0.043 0.041 0.041 0.022 0.046 0.099North 0.423 0.396 0.306 0.330 0.523 0.147 0.264 0.442South 0.391 0.321 0.257 0.270 0.391 0.123 0.227 0.391North Within . 0.360 0.266 0.276 0.412 0.126 0.231 0.396North Between . 0.027 0.023 0.020 0.017 0.011 0.026 0.067

The Ghana Poverty and Inequality Report – 2016
36
BibliographyAdams Jr., R.H., 2004. Economic Growth, Inequality and Poverty: Estimating the Growth Elasticity of Poverty. World Development 32, 1989–2014. doi:10.1016/j.worlddev.2004.08.006
Adjasi, C.K.D., Osei, K.A., 2007. Poverty profile and correlates of poverty in Ghana. International Journal of Social Economics 34, 449–471. doi:10.1108/03068290710760236
Alesina, A., Rodrik, D., 1994. Distributive Politics and Economic Growth. The Quarterly Journal of Economics 109, 465–490. doi:10.2307/2118470
Bastagli F., and Coady D. 2012. Income Inequality and Fiscal Policy. IMF Working Paper, Washington DC: IMF
Beegle, K, Christiaensen L., Dabalen A., and Gaddis I. 2016. Poverty in a Rising Africa. Africa Poverty Report. Washington, DC: World Bank.
Berg, A, Ostry, J.D., Zettelmeyer, J., 2012. What Makes Growth Sustained?, Journal of Development Economics, 98(2): 149–166.
Bibi, S., Duclos, J-Y., Verdier-Chouchane, A., 2010. Assessing Absolute and Relative Pro-Poor Growth: An Application to the MENA Region, Working Paper No. 111, Tunis: African Development Bank Group.
Christiaensen, L., Demery, L., Paternostro, S., 2003. Macro and Micro Perspectives of Growth and Poverty in Africa. World Bank Econ Rev 17, 317–347. doi:10.1093/wber/lhg025
Cooke, E.F.A., Hague, S., Tiberti, L., Cockburn, J., Lahga, A.-R.E., 2015. Estimating the impact on poverty of Ghana’s fuel subsidy reform and a mitigating response. Journal of Development Effectiveness 0, 1–24. doi:10.1080/19439342.2015.1064148
Datt, G. and Ravallion, M., 1992. Growth and redistribution components of changes in poverty measures: a decomposition with applications to Brazil and India in the 1980s. Journal of Development Economics 38, 275–295.
Deaton, A., 1997. The analysis of household surveys : a microeconometric approach to development policy (No. 17140). The World Bank.
Deininger, K., Squire, L., 1998. New ways of looking at old issues: inequality and growth. Journal of Development Economics 57, 259–287. doi:10.1016/S0304-3878(98)00099-6
Demery, L., Squire, L., 1996. Macroeconomic Adjustment and Poverty in Africa: An Emerging Picture. World Bank Res Obs 11, 39–59. doi:10.1093/wbro/11.1.39
Dollar, D. and Kraay, A. 2002. Growth is Good for the Poor, Journal of Economic Growth, 7, 195-225, Netherlands: Kluwer Academic Publishers
Dollar, D., Kleineberg, T., Kraay, A. 2013. Growth still is good for the poor (No. WPS6568). The World Bank.
Easterly, W. 2007: Inequality does cause underdevelopment: insights from a new instrument. Journal of Development Economics 84, 755- 776 (2007)
Glewwe, P., Twum-Baah, K.A., 1991. The distribution of welfare in Ghana, 1987-88 (No. LSM75). The World Bank.
Ghana Statistical Service (GSS), 2007. Pattern and Trends of Poverty in Ghana 1991-2006, Accra: Ghana Statistical Service
Ghana Statistical Service (GSS), 2008. Ghana Living Standards Survey Report of the Fifth Round (GLSS5), Accra: Ghana Statistical Service
Ghana Statistical Service (GSS), 2014. Ghana Living Standards Survey Round 6 (GLSS6): Main Report, Accra: Ghana Statistical Service
Kakwani, N., 1993. Poverty and Economic Growth with Application to Côte d’Ivoire. Review of Income and Wealth 39, 121–139. doi:10.1111/j.1475-4991.1993.tb00443.x

The Ghana Poverty and Inequality Report – 2016
37
Kakwani, N., Pernia, E.M., 2000. What is Pro-Poor Growth? Asian Development Review 18.
Kakwani, N., Khandker, S., Son, H.H., 2004. Pro-Poor Growth: Concepts and Measurement with Country Case Studies, International Poverty Centre Working Paper N0. 1, Andar, Brasilia: UNDP.
Kanbur, R., 2001. Economic Policy, Distribution anad Poverty: The Nature of Disagreements. World Development 29(6): 1083-94.
Lopez, 2004. Pro-poor growth: a review of what we know (and of what we don’t)
McKay, A., Pirttilä, J. & Tarp, F., 2015. Ghana: Poverty reduction over thirty years. UNU-WIDER Working Paper 2015(052) Helsinki: UNU-WIDER.
Ostry, J D, Berg, A., Tsangarides, C.G., 2014. Redistribution, Inequality, and Growth, IMF Staff Discussion Note 14/02.
Ravallion, M., Chen, S., 2003. Measuring pro-poor growth. Economics Letters 78, 93–99.
Sachs, J.D., 2005. Can Extreme Poverty be Eliminated?, Scientific American 56-65
Shorrocks, A.F., 1980. The Class of Additively Decomposable Inequality Measures. Econometrica 48, 613–625. doi:10.2307/1913126
Shorrocks, A.F., 1984. Inequality Decomposition by Population Subgroups. Econometrica 52, 1369–1385. doi:10.2307/1913511.
Verme, P., 2006. Pro-poor Growth during Exceptional Growth. Evidence from a Transition Economy. European Journal of Comparative Economics 3, 3–14.

The Ghana Poverty and Inequality Report – 2016
38
The Ghana Povertyand Inequality Report
2016