ii - redd+ pakistan
TRANSCRIPT


ii

iii
iv
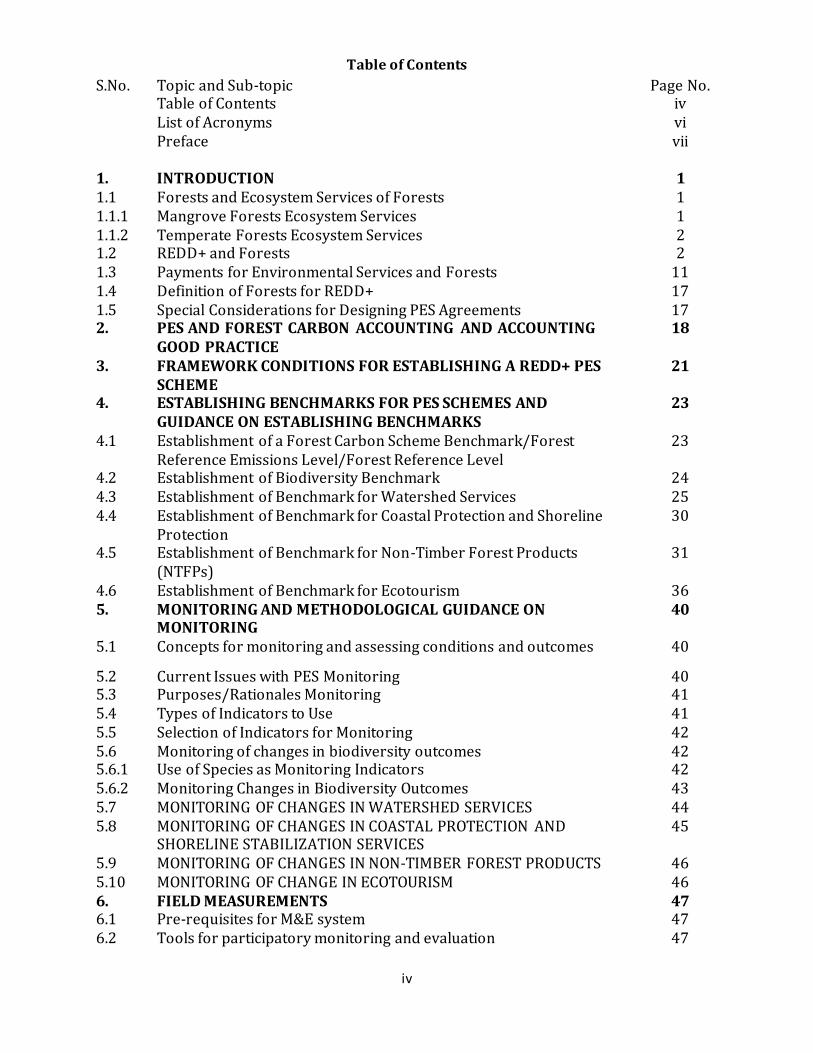
Table of Contents
S.No. Topic and Sub-topic Page No. Table of Contents iv List of Acronyms
Preface
vi vii
1. INTRODUCTION 1 1.1 Forests and Ecosystem Services of Forests 1 1.1.1 Mangrove Forests Ecosystem Services 1 1.1.2 Temperate Forests Ecosystem Services 2 1.2 REDD+ and Forests 2 1.3 Payments for Environmental Services and Forests 11 1.4 Definition of Forests for REDD+ 17 1.5 Special Considerations for Designing PES Agreements 17 2. PES AND FOREST CARBON ACCOUNTING AND ACCOUNTING
GOOD PRACTICE 18
3. FRAMEWORK CONDITIONS FOR ESTABLISHING A REDD+ PES SCHEME
21
4. ESTABLISHING BENCHMARKS FOR PES SCHEMES AND GUIDANCE ON ESTABLISHING BENCHMARKS
23
4.1 Establishment of a Forest Carbon Scheme Benchmark/Forest Reference Emissions Level/Forest Reference Level
23
4.2 Establishment of Biodiversity Benchmark 24 4.3 Establishment of Benchmark for Watershed Services 25 4.4 Establishment of Benchmark for Coastal Protection and Shoreline
Protection 30
4.5 Establishment of Benchmark for Non-Timber Forest Products (NTFPs)
31
4.6 Establishment of Benchmark for Ecotourism 36 5. MONITORING AND METHODOLOGICAL GUIDANCE ON
MONITORING 40
5.1 Concepts for monitoring and assessing conditions and outcomes 40
5.2 Current Issues with PES Monitoring 40 5.3 Purposes/Rationales Monitoring 41 5.4 Types of Indicators to Use 41 5.5 Selection of Indicators for Monitoring 42 5.6 Monitoring of changes in biodiversity outcomes 42 5.6.1 Use of Species as Monitoring Indicators 42 5.6.2 Monitoring Changes in Biodiversity Outcomes 43 5.7 MONITORING OF CHANGES IN WATERSHED SERVICES 44 5.8 MONITORING OF CHANGES IN COASTAL PROTECTION AND
SHORELINE STABILIZATION SERVICES 45
5.9 MONITORING OF CHANGES IN NON-TIMBER FOREST PRODUCTS 46 5.10 MONITORING OF CHANGE IN ECOTOURISM 46 6. FIELD MEASUREMENTS 47 6.1 Pre-requisites for M&E system 47 6.2 Tools for participatory monitoring and evaluation 47

v
7. DATA REQUIRED, ANALYSIS AND SUMMARIZATION 50 8. DATA QUALITY ASSESSMENT/ASSURANCE (DQA) 53 9. DATA REPORTING 55 10. GLOSSARY OF TERMS
REFERENCES 56
60

vi
LIST OF ACRONYMS
AD Activity Data
EF Emission Factor
ES Ecosystem Services
FCPF Forest Carbon Partnership Facility
FREL Forest Reference Emissions Level
FRL Forest Reference Level
INDC Intended Nationally Determined Contributions
NTFPs Non-Timber Forest Products
PAM Policies and Measures
PES Payments for Environmental/Ecosystem Services
REDD+ Reducing Emissions from Deforestation and Degradation of Forests, Conservation of
Forest Carbon Stocks, Sustainable Forest Management and Enhancement of Forest
Carbon Stocks
R-PP Readiness Preparation Proposal
UNCBD United Nations Convention on Biological Diversity
UNFCCC United Nations Framework Convention on Climate Change
UN-REDD+ United Nations REDD+ Program
VCM Voluntary Carbon Market
VCS Voluntary Carbon Standard
WHTF Western Himalayan Temperate Forests

vii
PREFACE
After the adoption of Cancun Agreement in 2010, the Government of Pakistan took several
measures to implement this agreement at the national, provincial and district levels. Reducing
Emissions form Deforestation and Forest Degradation (REDD+) process was initiated by Ministry of
Climate Change, Government of Pakistan in 2010 with consultative workshops and awareness
raising.
In 2013, Pakistan was selected as a REDD+ Country Participant in the Forest Carbon Partnership
Facility (FCPF) of the World Bank. The participant Committee of the FCPF through its Resolution
PC/16/2013/8 decided to allocate grant funding to Pakistan to enable it to move ahead with
preparation for readiness. Pakistan received a grant of US $ 3.8 million during June 2015 under
REDD+ Readiness Preparation Proposal (RPP). Under R-PP Pakistan is working on four main
components i.e. (i) REDD+ Policy Analysis, (ii) REDD+ Technical Preparation, (iii) Readiness
Management Arrangements and (iv) Designing and Testing REDD+ Payments for Environmental
Services.
Pakistan Forest Institute, being the prime public sector organization in forestry research and
education, was awarded a study by the National REDD+ Office, Ministry of Climate Change for
“Designing REDD+ Payment for Environmental Services” in the two selected ecosystems of the
country in 2018. One of the main components of this consultancy assignment was to prepare
awareness raising material on the following topics in English & Urdu.
What is REDD+. A Guide for Local Communities
Risks and Benefits of REDD+
Climate Change and the Role of Forests – A Community Guide
A community guide for REDD+ PES monitoring
A Manual to measure forest carbon stock.
This Community Guide has been prepared by Pakistan Forest Institute under the study “Designing
REDD+ Payment for Environmental Services”. This document is designed to educate and build the
capacity of the community members, practitioners, resource managers, researchers, students and
other stakeholders to monitor interventions of the projects on “Payment for Environmental
Services”. The document has mainly relied on the available literature from different national and
international sources as well as the information collected during the study on “Designing REDD+
Payment for Environmental Services” in Mangroves Forests of Sindh and Balochistan and Moist
Temperate Forests of Kaghan.
Syed Mahmood Nasir National Project Director (REDD+) Ministry of Climate Change Government of Pakistan, Islamabad.
1
REDD+ PES MONITORING- A COMMUNITY GUIDE
1. INTRODUCTION
1.1 Forests and Ecosystem Services of Forests
Forests are a significant portion of the Earth and climate system and are crucial for human survival
and prosperity. Although classified as a low forest cover and high deforestation rate country,
Pakistan due to its marked topographic and edaphic variability has a wide range of forest
ecosystems and biodiversity. It has one of the world's highest mountain forest ecosystems, a large
expanse of arid region mangrove forests, the so-called living fossils juniper forests, temperate
forests, sub-tropical forests and tropical thorn forests. This wide diversity of forest ecosystems is
characterized by equally varied ecosystem services that the forests of Pakistan provide. Broadly
speaking, services of forests can be categorized into provisioning services, regulating services,
supporting services and cultural services. The major ecosystem services provided by the mangrove
forests and temperate forests of Pakistan are elaborated in the following section.
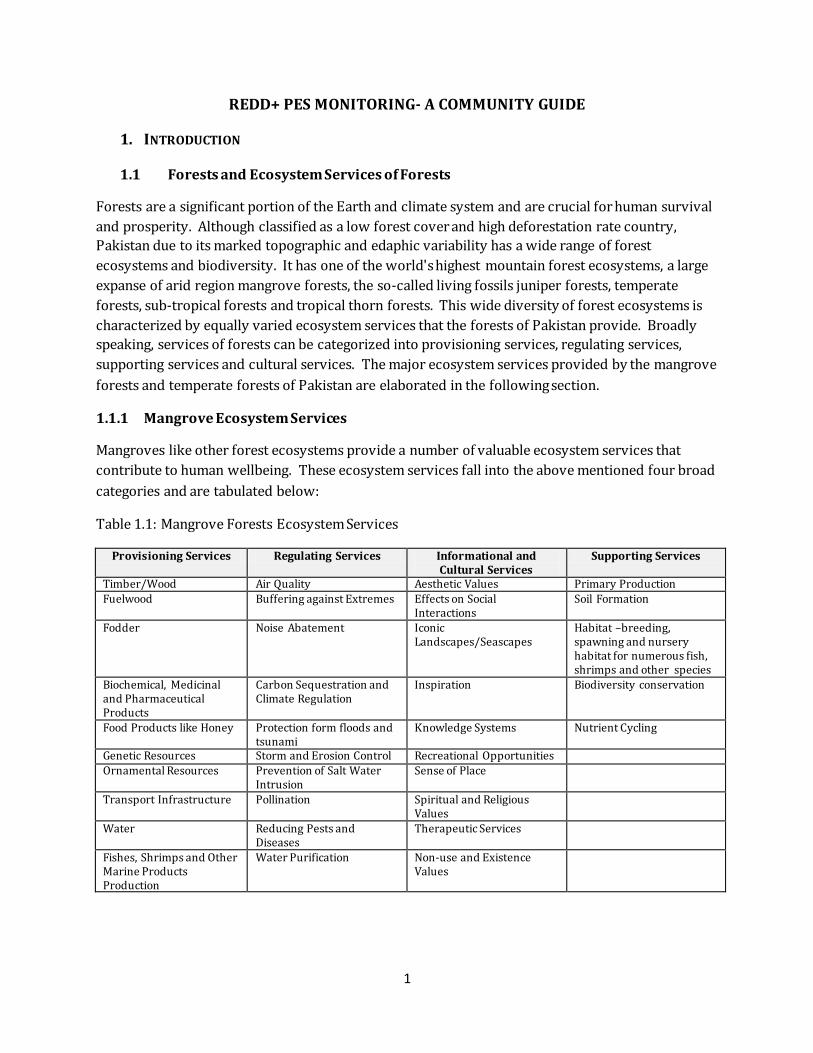
1.1.1 Mangrove Ecosystem Services
Mangroves like other forest ecosystems provide a number of valuable ecosystem services that
contribute to human wellbeing. These ecosystem services fall into the above mentioned four broad
categories and are tabulated below:
Table 1.1: Mangrove Forests Ecosystem Services
Provisioning Services Regulating Services Informational and Cultural Services
Supporting Services
Timber/Wood Air Quality Aesthetic Values Primary Production Fuelwood Buffering against Extremes Effects on Social
Interactions Soil Formation
Fodder Noise Abatement Iconic Landscapes/Seascapes
Habitat –breeding, spawning and nursery habitat for numerous fish, shrimps and other species
Biochemical, Medicinal and Pharmaceutical Products
Carbon Sequestration and Climate Regulation
Inspiration Biodiversity conservation
Food Products like Honey Protection form floods and tsunami
Knowledge Systems Nutrient Cycling
Genetic Resources Storm and Erosion Control Recreational Opportunities Ornamental Resources Prevention of Salt Water
Intrusion Sense of Place
Transport Infrastructure Pollination Spiritual and Religious Values
Water Reducing Pests and Diseases
Therapeutic Services
Fishes, Shrimps and Other Marine Products Production
Water Purification Non-use and Existence Values

2
1.1.2 Temperate Forests Ecosystem Services
Temperate forests are the water towers of Pakistan because of their location in the catchment area
of river Indus and Jhelum which provide irrigation water as well as are a source of hydropower for
the country. In the following table we list the major categories and their component ecosystem
services which contribute to human well-being. These are listed below:
Table 1.2: Ecosystem Services of Temperate Forest Ecosystem
Provisioning Services Regulating Services Informational and Cultural Services
Supporting Services
Timber/Wood Air Quality Aesthetic Values Primary Production
Fuelwood Buffering against Extremes
Effects on Social Interactions
Soil Formation
Fodder Noise Abatement Iconic Landscapes/Seascapes
Habitat –breeding, feeding and protection for numerous terrestrial species
Biochemical, Medicinal and Pharmaceutical Products
Carbon Sequestration and Climate Regulation
Inspiration Biodiversity conservation
Food Products like Honey
Protection from floods and snow avalanches
Knowledge Systems Nutrient Cycling
Genetic Resources Storm and Erosion Control
Recreational Opportunities
Ornamental Resources Prevention of Land Slides Sense of Place Transport Infrastructure
Pollination Spiritual and Religious Values
Water Reducing Pests and Diseases
Therapeutic Services
Fishes and Other Forest Products Production
Water Purification Non-use and Existence Values
The forest ecosystem services mentioned in the above categories are neither exhaustive nor
discrete as the services provided by forests in Pakistan span a wide spectrum and cover ecological,
environmental, economic, social, cultural and political considerations and processes. Because of
this multiplicity and diversity in services provision, the management of forest ecosystems is not a
simple technical or mechanical process. Instead, it incorporates a variety of competing views,
interests and considerations. This also requires that multi-stakeholder participatory planning,
implementation, monitoring and evaluation approaches need to be employed for effective
management of forests.
1.2 REDD+ and Forests
Depending on how forests are managed, forests can act as vast carbon sinks as well as a source of
carbon emissions into the atmosphere. They can also provide adaptation benefits, through their
rich biodiversity, and social benefits to those whose livelihoods are dependent on the forests.
REDD+ stands for Reducing Emissions from Deforestation and Forest Degradation, plus the role of
conservation, sustainable forest management, and enhancement of carbon stocks. REDD+ is an
3
incentive based mechanism that has been developed by the world community to reward those
developing countries which protect and conserve their existing forests as well as develop new
forests to mitigate climate change. Deforestation and forest degradation, counted together, is the
second leading cause of global warming, after energy generation. This sector is responsible for
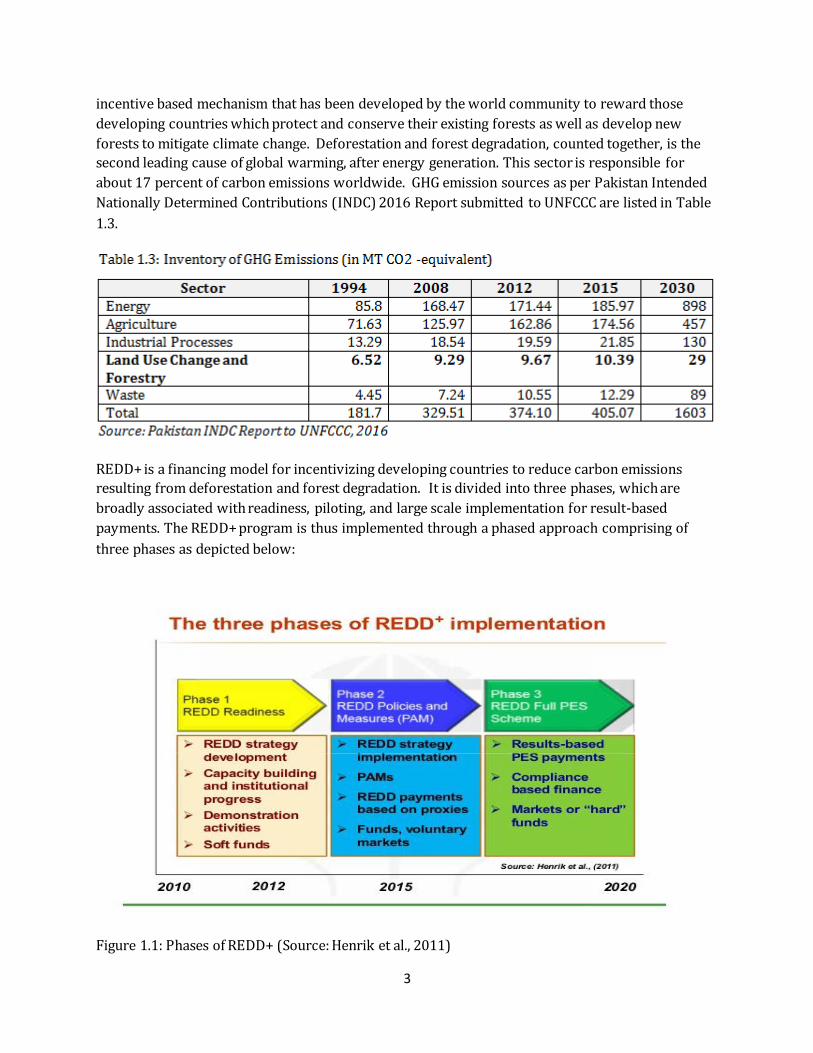
about 17 percent of carbon emissions worldwide. GHG emission sources as per Pakistan Intended
Nationally Determined Contributions (INDC) 2016 Report submitted to UNFCCC are listed in Table
1.3.
REDD+ is a financing model for incentivizing developing countries to reduce carbon emissions
resulting from deforestation and forest degradation. It is divided into three phases, which are
broadly associated with readiness, piloting, and large scale implementation for result-based
payments. The REDD+ program is thus implemented through a phased approach comprising of
three phases as depicted below:
Figure 1.1: Phases of REDD+ (Source: Henrik et al., 2011)

4
The four requirements that need to be met to pass through the Readiness Phase include:
Preparation of a REDD+ Strategy and Action Plan; Development of a National Forest Reference
Emission Level (FREL) and/or Forest Reference Level (FRL); Designing National Forest Monitoring
System and Monitoring, Reporting and Verification System; and Designing REDD+ Safeguards
Information System.
CoP 19 of UNFCCC, which took place in Warsaw, Poland from 11-22nd November 2013, adopted the
‘Warsaw Framework for REDD+’. The Warsaw REDD+ Framework makes REDD+ a reality and
enables countries to move forward with the implementation of REDD+ activities. It comprises of a
series of decisions. These decisions are referred to as the ‘REDD+ rulebook’ on how REDD+ must be
implemented. The decisions constitute the International Requirements for REDD+ implementation
and are meant to provide clarity regarding the ‘requirements’ developing country Parties must
fulfill when implementing REDD+. In addition, these also provide guidance, support, and/or
relevant institutional arrangements available to developing countries when implementing REDD+.
Following are the seven decision areas that comprise the ‘REDD+ Rulebook’ include:
1.2.1 Drivers of Deforestation and Forest Degradation in Pakistan
According to a report prepared by WWF Pakistan (2007) quoted in the draft National REDD+
Strategy of Pakistan, following are the major drivers of deforestation and forest degradation in the
country and their degree of severity.

5
Figure 1.2: Drivers of Deforestation in Pakistan (Source: WWF-Pakistan, 2007)
The following direct and indirect drivers of deforestation and forest degradation have been
identified by the draft National REDD+ Strategy and its implementation Framework for Pakistan.
Direct Drivers of Deforestation and Forest Degradation:
i. Demand and consumption of Products
a. Timber demand
b. Fuelwood demand due to local community dependence on forests
c. Fodder demand due to local community dependence on forests
d. Grazing pressure due to local community dependence on forests
e. Timber smuggling
f. Over-exploitation
ii. Land Use change
a. Mining
b. Infrastructure
c. Encroachment by locals
d. Agriculture expansion

6
iii. Natural or manmade hazards
a. Droughts
b. Floods
c. Landslides
d. Diseases
e. Forest Fire
Indirect Drivers of Deforestation and Forest Degradation:
Heavy dependence of local communities on forest resources and lack of alternatives
Population growth
Poverty
Lack of Awareness and land use planning
Shortages of Energy Sources
Political interference in forest management
Lack of financial resources
Unemployment
Weak governance and policies
Revenue based forest management
Urbanization and unwise use of timber and fuelwood
1.2.2 Controlling Drivers of Deforestation and Forest Degradation
To bring about a real impact, a thorough analysis of the agents, drivers, underlying causes of
deforestation and forest degradation in the selected ecosystems has been carried and based on this
analysis appropriate Policies and Measures (PAMs)have been proposed to tackle the drivers of
deforestation and degradation. Table 1.4 summarizes these drivers, underlying causes, driving
agents and proposed PAMs.

7
Table 1.4: Drivers of Deforestation and Degradation, Underlying Causes, Agents and PAMs Major Drivers of Deforestation and Degradation of Forests
Underlying Causes of Deforestation and Degradation of Forests
Category of Driver
Driving Agent Proposed Policies And Measures (PAMs)
Excessive cutting of Trees for Energy/Fuelwood Purposes.
Lack of Alternative Energy Sources in Rural and Forested Areas.
Direct driver of degradation
Local Community
Alternative Energy Sources and Energy Efficiency Measures
Lack of investments in forestry sector and use of forests as a source of revenue for the government.
Government Authorities and Policy Makers
Sensitize Government Authorities and Policy Makers for positive actions.
Lack of Awareness and Capacity about Environmental Services rendered by Forest Ecosystems.
Local Communities and Forestry Professionals
Develop and implement awareness creation and capacity building programs.
Excessive Population growth in Hilly Areas.
Local Community and Religious Leaders
Implement awareness creation programs.
Cumbersome Judicial Process.
Judiciary Take steps to simplify the adjudication process.
Excessive cutting of Trees for Constructional Timber and Other Domestic Use Purposes.
Lack of Wood Substitutes/Alternative Building Materials for Construction Purposes.
Direct driver of degradation
Local Community and Government Authorities.
Awareness Creation. Regulatory Changes. Provision of Alternatives.
Excessive and wasteful use of wood.
Local Community, Private Sector and Civil Society.
Awareness Creation. Regulatory Changes.

8
Excessive use of wood in different ceremonies such as marriages and funerals.
Local Community, Private Sector and Civil Society.
Awareness Creation. Regulatory Changes.
Natural Hazards like Earthquakes, and Climate Change Effects resulting in Floods, Droughts and Extreme Events causing damages to buildings.
Nature as well as Anthropogenic
Implement Disaster Risk Reduction Measures.
Illegal cutting of Trees by Timber Smugglers for Profit Making Purposes.
Greed Based Orientation of Timber Smugglers.
Direct driver of degradation.
Timber Smugglers and Conniving Forest Owners.
Incentives and PES Schemes for owners. Regulatory Measures for Smugglers.
Prolonged Ban on Commercial Harvesting of Timber.
Government Authorities.
Rationalize Forest Management.
Grazing of Livestock in Forest Areas and Using Forests as Grazing Areas.
Excessive number of Livestock which is beyond the Carrying Capacity of Grazing Lands and In-appropriate Grazing Management Practices.
Direct driver of degradation.
Livestock Owners.
Develop and introduce appropriate grazing systems.
Clearing of Forest Land for Agriculture Purposes.
Lack of Alternative Livelihood Sources in Hilly and Forested Areas.
Direct driver of deforestation
Local Community
Land Use Planning. Regulatory Measures.
Lack of Employment Opportunities in Mountainous Areas.
Indirect driver of deforestation and degradation.
Government Authorities.
Implement Area Development Projects in Mountainous Areas.
Land Tenure Problems. Indirect driver.
Government Authorities.
Tenure Improvement.
Political Influencing. Indirect driver.
Politicians. Awareness Creation.

9
Lack of Productive Agricultural Lands and low Agricultural Productivity.
Indirect driver.
Government Authorities.
Implement Agriculture Productivity Enhancement Measures.
Clearing of Forest Land for Road Construction and Other Infrastructure Purposes.
Excessive Demand for Road Construction by Local Communities and Elected Representatives.
Direct driver of deforestation.
Government Authorities.
Appropriate Land Use Planning.
Lack of Land Use Planning.
Direct driver of deforestation.
Government Authorities.
Appropriate Land Use Planning.
Lack of Awareness. Indirect driver.
Government Authorities.
Implement Awareness Creation Measures.
Excessive Population Growth.
Indirect driver.
Local Communities and Government Authorities.
Implement Awareness Creation Measures.
Clearing of Forest Land for Making of Settlements.
Non-availability of Other Land for making Settlements in Hilly Areas.
Direct driver of deforestation.
Local Community. Private Sector. Government Authorities.
Appropriate Land Use Planning.
Lack of Land Use Planning.
Government Authorities.
Appropriate Land Use Planning.
Land Tenure Problems. Government Authorities.
Streamline Tenure Issues.
Weak Law Enforcement.
Government Authorities.
Improve Law Enforcement.
Excessive Population Growth.
Local Community and Government Authority
Create Awareness.

10
Clearing of Forest Land for Mining Purposes.
Lack of Coordination between Mines and Minerals Department and Forest Department.
Direct driver of deforestation.
Government Authorities. Private Sector.
Improve coordination between Forest Department and Mining Department. Revise Laws.
Inappropriate Policies. Government Authorities.
Develop and implement better policies.
Lack of Proper Land Use Planning.
Government Authorities.
Introduce Land Use Planning.
Poor Forest Governance and Problems in Forest Laws Enforcement.
Lack of Human and Other Resources for Effective Implementation of Laws.
Indirect driver of deforestation and forest degradation.
Government Authorities.
Increase human and other resources for better forest protection.
Cumbersome Judicial Process.
Government Authorities.
Simplify forest offence cases adjudication.
Lack of investments in forestry sector and use of sector as a source of revenue for the government.
Government Authorities.
Increase forest sector allocations. Proper valuation of forest ecosystem services and educate policy makers about the values of standing trees and intact forests.
Lack of Awareness and Capacity about Environmental Services rendered by Forest Ecosystems.
Government Authorities.
Implement awareness creation and capacity building measures.

11
Forest Fires. Slash and burn type intentional fires by farmers to clear the forest area for agriculture purposes.
Direct driver. Local Communities.
Awareness creation. Regulatory measures.
Forest fires by grazing community to create openings for grass growth.
Livestock Owners.
Awareness creation. Regulatory measures.
Girdling of Trees Intentional girdling to kill a tree so that it can be cut.
Local Communities/ Forest Owners.
Awareness creation. Regulatory measures.
Diseases, insect pests and other epidemics
Climate change is exacerbating these epidemics related damages.
Nature and Anthropogenic Actors.
Awareness creation. Problem solving research measures.
Forest Degradation on account of Tourism Activities.
Lack of Coordination between Tourism Department and Forest Department.
Indirect driver.
Government Authorities.
Promote Nature based Tourism. Awareness Creation.
Inappropriate Policies. Government Authorities.
Promote Nature based Tourism. Rationalize Policies.
Lack of Proper Land Use Planning.
Government Authorities.
Promote Nature based Tourism. Rationalize Land Allocation Decisions.
General Law and Order Situation.
The insurgency wave in Pakistan created a general law and order situation in the country.
Indirect driver.
Civil Society. Government Authorities.
Awareness Creation. Improve Law Enforcement.
Source: KP Province REDD+ Strategy, 2018
Working with the key agents of deforestation and forest degradation and controlling the above
identified drivers of deforestation and forest degradation is a key element in REDD+. For this to
happen, the proposed PAMs will have to be made use.

12
In addition to controlling deforestation and forest degradation, attention has to be paid to
increasing forest sinks through natural forests rehabilitation and restoration as well as
implementing large-scale forest plantations program under a landscape approach. Budgetary
requirements for increasing forest cover from 6 percent to 10 percent are estimated to be in the
tune of US$ 3.74 billion.
1.3 Payments for Environmental Services and Forests
Having the characteristics of public goods (non-exclusion from use and non-rivalry in consumption),
most of the forest ecosystem services do not have functioning markets and suffer from “market
failure”. People, organizations and entities not paying for these ecosystem services cannot be
excluded from enjoying the service and hence there are “free rider problems”. Examples of non-
exclusion include climate change mitigation ecosystem services and habitat and watershed
protection services of forests. Similarly, the consumption of the good or service by someone does
not in any way affect the consumption of someone else such as the scenic beauty of a forest
landscape. Due to these two characteristics, it is difficult to charge price for these ecosystem
services. As a result, there is little incentive for private sector to provide these ecosystem services
and the services are under supplied by the market system. Not only that, forests are also generally
undervalued in both private and public decision because some of their key values (like watershed
protection, biodiversity conservation, climate change mitigation, aesthetic values, etc.) are ignored
ad not considered in decision making because of this lack of information and understanding. Unless
there is full information on the total economic value of forest ecosystem services that can be easily
and directly compared with the economic value of alternative public investments, the values of
forests will tend to be underestimated and hence economic decision making based on partial and
asymmetric information (Gandapur, 2018)
To circumvent the above market-failure problems, Payments for Environmental Services (PES)
schemes have been devised, which seek to support positive environmental externalities through
innovative financing mechanisms. As part of the PES scheme the beneficiaries of environmental
services pay the providers of these services under certain terms and conditions. Like any other
scheme, PES schemes too have their strengths and limitations. There are certain conditions that
need to be met for PES schemes to be successful. It is therefore important to search for, identify,
highlight and publicize PES mechanisms and experiences that could emerge as best practices.
These best practices are meant to maximize the positive impacts of PES schemes both in terms of
environmental and socioeconomic outcomes.
PES schemes are premised on the principle that resource owners and communities who provide
ecosystem services should be compensated for provision of these services by those communities
and agencies who benefit from these services. Given the wide variety of PES schemes implemented
in the world, there is no commonly agreed definition of PES schemes. A series of classifications and
typologies are being used. These are based on the type of environmental services being traded, the
geographical scope of the PES scheme, the structure of the market, or the types of payments
involved.

13
1.3.1 International Experiences and Lessons Learnt from PES schemes
Internationally, PES schemes have been implemented in different countries involving different
services, geographical scales, structuring of contracts, and performance and payments mechanisms.
A number of empirical studies have analyzed these schemes and documented initial lessons,
emerging best practices and lessons learned about those PES schemes. Based on this international
research, it can be said that a number of PES models exist, each with their own strengths and
weaknesses. So far, no single one has emerged as a standard. Further, these PES schemes are
context specific and have been developed and function under very specific conditions and involve
different ecosystem services such as water regulation, watershed protection, biodiversity
conservation, carbon sequestration, land stabilization and ecotourism. The success of PES schemes
to a great extent depends on pre-existing institutional and property rights conditions. Generally,
PES schemes work best under the following conditions:
PES services are visible and are based on clear and robust evidence linking land uses and
land management activities to the provision of environmental services or for which market
mechanism can be created;
Both PES services buyers and providers have reasonable access to resources, are well
organized and structured;
The ecosystem services being provided are significant and have high value for the
beneficiaries but the cost of provision of these services is low;
Design program activities in such a way to ensure active involvement of local communities
and other stakeholders at a minimum cost while allowing for other productive activities to
occur alongside the PES scheme;
Property rights are clear and secure and explore options for resolving tenure issues and
barriers to participation;
Strong and enforceable legal frameworks exist;
The duration of PES contract is based on the mutual agreement between buyers and sellers
and the necessity for supply of the desired ecosystem services;
Payments should be made conditional and linked with delivery of ecosystem services;
PES contracts and payments are flexible, on-going, open-ended and allow adjustments to
adapt to changing conditions
The transaction costs do not exceed the potential benefits;
PES revenues come from multiple sources that are sufficient and sustainable in time;
Incorporate and implement robust and transparent guidelines for monitoring and
verification.
Provide clear, transparent and enforceable sanctions for non-compliance,;
Assess interactions and trade-offs with other developmental policies and programs;
Explicitly consider multiple or co-benefits in evaluating outcomes;
Incorporate credible monitoring of social outcomes and impacts alongside environmental
outcomes;
Adequate investments are made in human capital, institutional building and capacity
development at both “ends” of the payment;

14
PES schemes ensure diversification of sources of revenues for communities involved in
forest conservation such as enhancement of non-timber forest products, supply of organic
food and promotion of ecotourism;
Ensuring community participation and building their capacity are the major strategies to
successfully implement PES schemes and generate benefits for marginalized communities;
and
PES schemes differ tremendously in the above mentioned characteristics. PES schemes may also
face the following limitations:
PES schemes are usually based on general conclusions and not supported by empirical data;
Sometimes PES schemes are implemented in a manner which is not cost-effective approach
to attain the established goals;
There is not proper identification of the ecosystem services, or service providers and users;
Monitoring or control mechanism are either not appropriate or adequate;
The prices are set and agreed for environmental services in an arbitrary manner and do not
correspond to and reflect ground realities and economic valuation of the resource;
Their design is not context specific and is not based on proper feasibility studies or previous
socioeconomic or biophysical studies;
They may cause un-intended negative consequences and offer perverse incentives to land
users, or may lead to displacement of environmental problems or unsustainable land uses
to surrounding areas;
They may heavily depend on unsustainable or external financial resources;
Poor communities, which are most dependent on the land for their livelihoods, are
excluded from the system;
Needed awareness raising is not done and programs and activities are poorly disseminated
amongst the concerned stakeholders and the local population.
Efforts need to be made to integrate local populations and extend the benefits of PES schemes to
them. A number of strategies can be made use of to minimize the marginalization of poor
communities and maximizing benefits to them. These inter alia include the following:
Clarification and strengthening of their rights to PES schemes related resources;
Reduction of transactions costs for them through various mechanisms including creation or
strengthening of cooperative institutions;
Agreeing on and making use of cost-effective and flexible payments mechanisms;
Providing flexibility in eligible land uses and enhancing chances for their participation;
Facilitating their networking and access to start-up financing and other resources; and
Investing in and proper capacity-building and awareness creation amongst the
communities.
1.3.2 Monetary valuation of ecosystem services
The monetary value of various forest ecosystems have been estimated by a number of studies
employing various value estimation methods and techniques. Given the fact that they are all
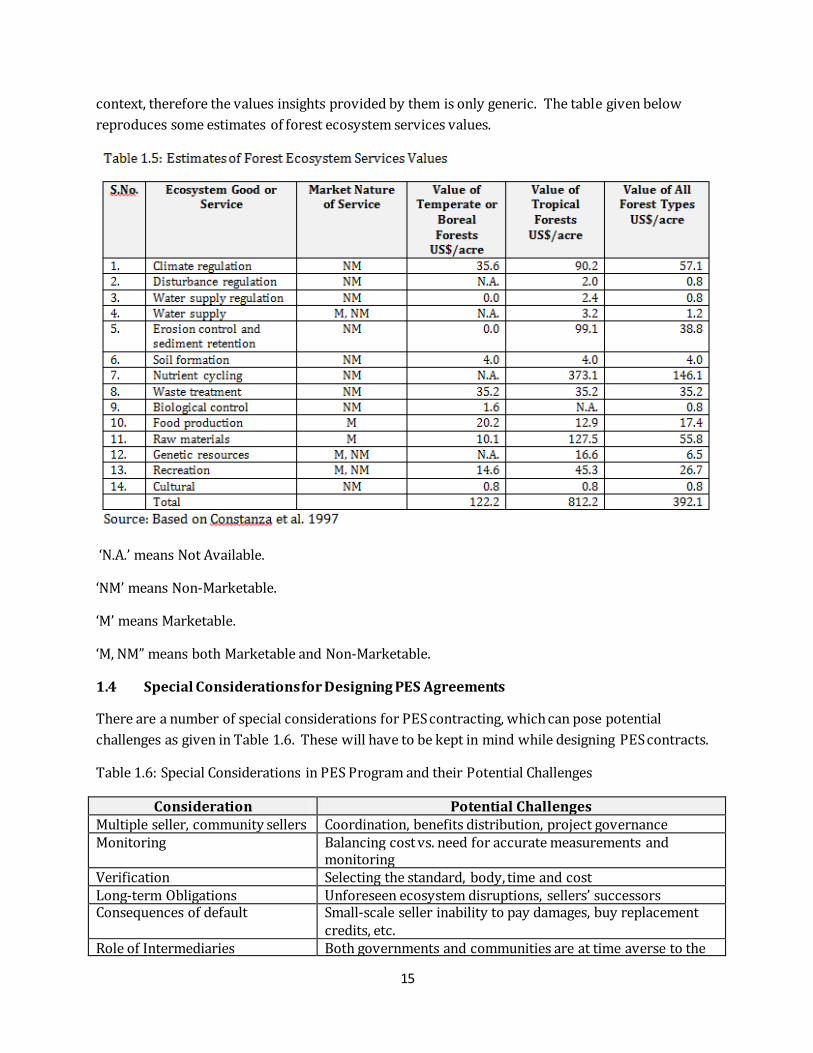
15
context, therefore the values insights provided by them is only generic. The table given below
reproduces some estimates of forest ecosystem services values.
‘N.A.’ means Not Available.
‘NM’ means Non-Marketable.
‘M’ means Marketable.
‘M, NM” means both Marketable and Non-Marketable.
1.4 Special Considerations for Designing PES Agreements
There are a number of special considerations for PES contracting, which can pose potential
challenges as given in Table 1.6. These will have to be kept in mind while designing PES contracts.
Table 1.6: Special Considerations in PES Program and their Potential Challenges
Consideration Potential Challenges Multiple seller, community sellers Coordination, benefits distribution, project governance Monitoring Balancing cost vs. need for accurate measurements and
monitoring Verification Selecting the standard, body, time and cost Long-term Obligations Unforeseen ecosystem disruptions, sellers’ successors Consequences of default Small-scale seller inability to pay damages, buy replacement
credits, etc. Role of Intermediaries Both governments and communities are at time averse to the

16
role of intermediaries which may pose problems for PES schemes development
Disputes over Tenure Disputes over tenure may arise at later stages of the agreement
Long duration of PES Agreements PES agreements, particularly those for carbon credits tend to be of longer duration
Opportunity and Other Costs Opportunity, transactions, validation, verification and implementation costs be too high and thus affect the financial viability of PES scheme
Diverse Costs and Risks Allocation
There are diverse costs and risks associated with PES agreements which need to be allocated equitably
Lack of existing Policies, Legal and Institutional Framework
Existing policies, laws and institutional frameworks lack provisions with regard to PES and ecosystem services
Lack of Awareness There is an over-all lack of awareness about ecosystem services and PES
Lack of Capacity Capacity in all parties to the PES agreement tends to be low.
2. GODD PRACTICE FOR PAYMENTS FOR ENVIRONMENTAL SERVICES (PES)
ACCOUNITNG
The following three types of forest carbon or PES accounting will be done: stock accounting, emissions accounting and project emission reductions accounting.
Stock accounting:
PES/Forest carbon stock accounting is meant to establish the stock or state of an ecosystem service of a particular territory or geographical areas at a given point in time. It is the starting point for
ecosystem service and/or project-level accounting. Stock accounting helps in prioritizing particular areas in the PES scheme.
Ecosystem Service Flow Provision or Carbon Emissions accounting:
Ecosystem Service Provision or Carbon Emissions accounting is done for assessing the level of provision of a particular ecosystem service or carbon emissions accounting from a particular forest
type. It also is necessary to assess the scale of ecosystem services from a particular forest ecosystem as well as carbon emissions from the forestry sector relative to other sectors. Besides, it
aids in realistic goal-setting for the provision of various ecosystem services including the setting of
GHG emissions targets.
PES Project Ecosystem Services Provision or Project Emission Reductions accounting:
PES Project Ecosystem Services Provision or Carbon accounting for forestry project emission
reductions is required for PES projects. In the case of REDD+ PES projects, it applies to projects undertaken under both the compliance market mechanism and the voluntary carbon markets. Both
types of carbon projects necessitate good carbon accounting to ensure that ecosystem services provision or carbon emissions reductions are real, permanent and verifiable. For projects to
generate tradable ecosystem services and carbon emission reductions, accounting methods have to follow standardized accounting approaches.

17
Accounting good practice: Accounting of ecosystem service provision or emission reductions
should be based on good practice promoted by the international community. There are several principles for carbon and non-carbon ecosystem services accounting that will have to be followed.
Adherence to good practice results in transparency, accuracy, legitimacy and trust in the PES accounting system, which are critical for both market and public acceptance of the accounting
results. These are:
Accurate and Precise: These are two statistical concepts. Ecosystem service estimates
need to be both accurate and precise. Accuracy implies how close the estimates are to the true value. Accurate estimates are free from bias and systematic error. Precise estimates on
the other hand show how the repeated measurements are close to each other. Precise estimates have lower random error. Both accuracy and precision are desirable in ecosystem
services accounting. Accuracy can be increased through removal of bias and precision through reduction in uncertainty.
Comparable: Comparable estimates implies that the data, methods and assumptions used ecosystem service accounting should be in line with those agreed internationally and which
also allow comparisons between different regions of the world.
Complete: Completeness of the estimate implies that accounting should cover all relevant categories of the ecosystem services in question. In case of carbon accounting, it must
include all sources and sinks and gases. If certain carbon pools or gases are excluded, then proper justification is needed.
Conservative: At times particular ecosystem service accounting relies on assumptions, values and procedures with high uncertainty. In such situations, the most conservative
option in the ecosystem service range should be chosen so as not to overestimate the provision of the ecosystem service. In the case of carbon accounting, conservative carbon
estimates can also be achieved through the omission of carbon pools.
Consistent: A consistent estimate means that accounting estimates for different years, different services, gases and categories reflect real differences in ecosystem service
provision rather than differences in methods. Relevance : The estimates need to be relevant for the intended use of the information.
Since, trade-offs have to be made in accounting as a result of time and resource constraints; therefore, the data, methods and assumptions used must be appropriate to the intended use
of the ecosystem service estimate. Transparent: Transparency of the ecosystem service estimate implies that the integrity of
the reported results can be easily confirmed by a third party or external actor. For this to
happen, there has to be sufficient and clear documentation of the accounting process to be available so that credibility and reliability of the ecosystem service estimates can be
assessed and reported.
Following are the International Requirements/Principles for Carbon Inventory as per Sourcebook of GOFC-GOLD Sourcebook (2010):
Relevance: The accounting system should produce estimates that are relevant for their intended use.
Comprehensiveness: The accounting system is comprehensive in that it meets international requirements and standards for the estimate in terms of inclusiveness and applicability at
various levels-national, sub-national and project level.

18
Consistency: The accounting methods are consistent with the internationally acceptable
standards like the IPCC methods and with current provisions on reporting under the UNFCCC, UNCBD or other convention relevant to the ecosystem service.
Efficiency: The accounting system allows cost-effective and timely implementation, and support early actions.
Robustness: The accounting system is robust in the sense that monitoring activities undertaken under the system provide appropriate results which are based on sound
scientific principles and international good practice. Transparency: The accounting system should be properly documented, open and readily
available for use by third party independent reviewers and the methodology should be
replicable.
3. FRAMEWORK CONDITIONS FOR ESTABLISHING A REDD+ PES SCHEME
3.1 Requirements for A REDD+ PES Project
To foster an environment in which REDD+ program can get institutionalized and REDD+
transactions can occur and to turn REDD+ into an incentive mechanism for driving investments into
forest protection, an understanding of strategic, policy, legal and institutional readiness options for
REDD+ is critical. Therefore, there is a need for developing an analytical framework for assessing
strategic, policy, legal and institutional readiness for REDD+ program implementation in the
province. In the following, we have adopted and made use of the Analytic Framework developed by
the Katoomba Group (Hawkins, 2011).
This analytical framework is divided into three levels, based on how critical the element is and the
timing and order of addressing the issues, keeping in view investors’ considerations for entering
into REDD+ agreements. These are classified into Level-1 or Threshold Conditions, Level-2 or
Essential Aspects to be developed in parallel with REDD+ , and Level-3 or Conditions for
Streamlining REDD+. These are given in table 3.1.

19
Table 3.1: Framework Conditions for PES Scheme
Given that these frame conditions for a PES project contribute to their successful implementation,
therefore a PES monitoring scheme will have to collect relevant data about these frame conditions
to ensure that a PES scheme has the necessary framework infrastructure put in place and working.
3.2 UNFCCC Cancun Safeguards and World Bank Environmental and Social
Safeguards Operational Policies
Parties to the UNFCCC agreed in Cancun, Mexico in 2010 on seven broad safeguard principles for
the implementation of REDD+ addressing transparency, participation of stakeholders, protection of
biodiversity and ecosystem services, and respect for rights of indigenous and local communities.
One year later, in Durban, the Parties to UNFCCC reached another agreement that parties
undertaking REDD+ activities should provide a summary of information on how the Cancun
safeguards are being addressed and respected.
The World Bank Forest Carbon Partnership Facility (FCPF) has also adopted Operational Policies
towards Social and Environmental Safeguards.
The Cancun Safeguards and the relevant World Bank Operational Policies are given in the following
table 3.2:

20
Table 3.2: UNFCCC REDD+ Safeguards and the World Bank Safeguard Policies

21
The UNFCCC Cancun Safeguards and World Bank Policies are binding if Pakistan is to have access to
international funding. These will, therefore, have to be properly understood; addressed in relevant
policies and laws; respected on ground; and reported on to the relevant forums through an
appropriate safeguards information system.
The consortium of Climate, Law and Policy and Hagler Baily Pakistan have done an analysis of these
safeguards and made recommendations to the Government of Pakistan regarding these safeguards.
A web link to full report is as under:
https://www.redd-pakistan.org/wp-content/uploads/2015/08/Interim-progress-report_CLP-and-
HBP.pdf
During any PES monitoring, monitoring with respect to the above safeguards will have to be done.
22
4. ESTABLISHING BENCHMARKS FOR PES SCHEMES AND GUIDANCE ON
ESTABLISHING BENCHMARKS
Benchmark or baseline is a stock-take of what is present at a point in time. Monitoring, which is
discussed in the next chapter establishes how the inventory changes with time and follows the
processes that produce that change. To be able to do both establish the benchmark and to do
continuous monitoring, an understanding of certain concepts, tools, methods, approaches,
institutional arrangements and capacities are needed. These are discussed in the following
paragraphs.
4.1 Establishment of a Forest Carbon Scheme Benchmark/Forest Reference
Emissions Level/Forest Reference Level:
4.1.1 Definition of Forests for REDD+
Government of Pakistan (2017) has adopted the following definition of forest under the REDD+
program at the national level: “A minimum area of land of 0.5 ha with tree crown cover of more
than 10% comprising trees with the potential to reach a minimum height of 2 meters.”
As per Pakistan R-PP submitted to World Bank FCPF, different provinces in the country can have
their own forest definition. Provinces are therefore considering developing their own forest
definition which suits their prevailing conditions. The province of Sindh, for example, is
considering the adoption of a separate definition for its mangrove areas along the following lines:
Given the above forest definition (Minimum Area of 0.5 hectares (ha), Minimum Crown Cover of 10
%, and Minimum Tree Height at Maturity of 2 meters.), the country will have to establish a Forest
Carbon Scheme benchmark/FREL/FRL using Activity Data and Emission Factors Data using the
above parameters of forest definition. Activity includes any operation, development, works or
conduct and in the context of carbon accounting activity. Activity data in the context of carbon
accounting means data on the magnitude of human activity (i.e., land use and land use changes
related to forests) resulting in emissions or removals of carbon during a given period of time.
Emission Factor means the amount of carbon emissions or removals associated with a landuse
activity such as deforestation or afforestation. Emission factors are derived from inventory data

23
quantifying biomass or carbon stock for a particular landuse and the change in biomass or carbon
stock resulting from a particular activity.
Using the five components of REDD+, the national FREL/FRL is to be based be on Activity Data
which includes emissions from deforestation, emissions from forest degradation, conservation and
enhancement of forest carbon stocks through sustainable forest management (i.e., growth of
existing forests) and afforestation/reforestation. The Activity Data can be collected from a variety
of sources including Remote Sensing Data as well as based on data collected from field
measurements. The best approach is to use a combination of remote sensing and field data.
4.2 Establishment of Biodiversity Benchmark
Biodiversity benchmark or baseline provides quantitative information about the state and trends of
the biodiversity indicators and different ecosystem components. Any PES monitoring scheme at the
community level will need to involve local communities, multiple government agencies (Forests,
Wildlife, Fisheries, Agriculture and Livestock) and central coordination by Forest Department.
Provincial Forest and Wildlife Departments being custodian of the forests in Pakistan have a key
role in PES monitoring and, and any biodiversity assessment framework developed is to involve
and consider agencies, communities and actors with different types of conservation roles and
responsibilities.
The primary goal of biodiversity conservation and management is to maintain ecological integrity
of the area. The ecosystem assessment should include all biotic and abiotic factors, natural
processes and a mix of long-term indigenous dominance; potential occupation by different flora and
fauna; and full environmental representation of ecosystems, which can be measured at different
scales ranging from species to populations and ecosystems.
Biodiversity monitoring frameworks should include the following nine community level
biodiversity conservation objectives. The progress towards sustainable biodiversity conservation
and management outcomes can be judged through measurement of these objectives (Gandapur,
2018).
According to Schneider (1997), biodiversity inventory and monitoring systems should be able to
meet the following rationale:

24
To provide data and information about biodiversity management and formulation of an
effective policy for biodiversity conservation;
To assess outcomes of the biodiversity conservation interventions;
To meet national and international reporting obligations; and
To obtain product compliance guarantees, such as forest certification, that confirms that
biodiversity values have not been affected.
For establishment of biodiversity benchmarks at the three levels of biodiversity (ecosystem, species and genetic) we proposed to use the following indicators: Ecosystem level diversity
Historical trends in landuse and cover Area of forest land by forest type Extent of forest land by forest type and age class or successional stage Extent of areas by forest type in protected area categories as defined by IUCN Fragmentation of forest types
Species diversity
Number of forest-dependent species Status of threatened and endangered species
Genetic diversity
Number of forest-dependent species that occupy a small portion of their former range Population trends in wildlife species.
4.3 Establishment of Benchmark for Watershed Services
4.3.1 Awareness raising about and use of Version 2 of Revised Universal Soil
Loss Equation (RUSLE-2)
Soil erosion, landslides and land degradation are extremely important issues in Pakistan and
therefore need to be factored into watershed related PES schemes and awareness created about
through various models such as the RULE-2. Version 2 of Revised Universal Soil Loss Equation
(RUSLE-2), an empirically based model, is widely used globally for erosion and landslides
prediction and control. The general Revised Universal Soil Loss Equation is as follows:
A = R x K x LS x C x P
Where:
A is average annual soil loss (tons per hectare per year;
R is the Rainfall and Runoff erosivity index (in MJ mm/ha/ hr/yr);
K is the soil Erodibility factor (in tons/MJ/mm);
25
LS is the Slope and Length of Slope Factor;
C is the Cropping Management Factor;
P is the supporting conservation practice factor.
From the above equation, it is clear that climate, soil, topography, and land use are the four major
factors which determine rates of soil erosion and landslides. In the RUSLE-2 equation, erosion and
landslides are directly related to the forces applied to the soil by erosive agents in relation to the
soil's resisting forces regardless of the land use.
RUSLE-2 model can be applied to any type of land where soil erosion is occurring and land
stabilization is important for ecosystem conservation. It can be used in the case of deforested or
degraded forest lands, range lands, croplands, wetlands, abandoned mining sites, construction sites,
reclaimed land, landfills, and any land where mineral soil is exposed to the direct forces of water
erosion and surface runoff generated by heavy intensity rainfall events.
4.3.2 Overview of Major Factors of RUSLE-2
Climate: Amongst the climate variables, rainfall erosivity is the most important variable used by
RUSLE-2. It is related to the amount of rainfall amount (how much it rains) and the intensity of
rainfall (how hard it rains). Temperature is the next important climatic variable after precipitation
as it determines the productivity and longevity of biological materials like crop residue and mulch
which are used to control erosion. Since climate varies by location; therefore choosing a location in
RUSLE-2 chooses the erosivity, precipitation, and temperature values needed to apply RUSLE-2 at a
particular site.
Soils: Different types of soil have different potentials for erodibility which can be measured
through a standard test involving a "unit plot." A unit plot is 72.6 feet (22.1 meters) long on a 9%
slope and is maintained in continuous tilled fallow (no vegetation) using periodic tillage up and
down slope to leave a "seedbed-like" soil condition. There are different soil erodibility values for
different landuses such as cropland, rangeland, forestland, etc. which are applied to RUSLE-2 model.
Topography: Slope length, steepness, and shape are the topographic characteristics that affect soil
erosion and landslides. Site-specific values are entered for these variables also in RUSLE-2 model.
Land Use: Land use is the most important factor which affects runoff and soil erosion because land
use and land cover type can be easily changed to reduce excessive erosion. RUSLE2 uses the
combination of cover-management (cultural) practices and support practices to describe land use.
Cover-management: The cover-management factor in the RUSLE2 model represents the effect of
vegetation cover on soil erosion. Soil erosion is basically a function of erosivity of the erosion
causing agents relative to the erodibility of the soil. Both of these factors are affected by the
management of soil cover. Improvement in soil cover reduces the erosivity of raindrops and
decrease surface run off.

26
Support practices: Support practices include cultural practices which affect soil erosion such as
terracing, contouring, vegetative strips and barriers, diversion channels. These practices
significantly reduce soil erosion and landsliding.
4.3.3 Data Collection and Consultations
Capacities will be built in the characterization of watershed. For this purpose questionnaires will
be developed for data collection in the field with respect to various aspects that are important from
the perspective of erosion, landslides, climatic variable, socio-economic variables, land cover and
land use variables, and those that are important form the perspective of RUSLE-2 and the
establishment of the watershed benchmark. For example, there will be field data collection on,
consultations and research for why landslides are a growing hazard, identification of hotspots of
landslides, prioritization of areas requiring land stabilization, and types of land stabilization
measures and such like topics:
Why soil erosion and landslides are a growing hazard?
Identification of hotspots of soil erosion and landslides.
Prioritization of areas requiring soil erosion control and land stabilization works.
Types of soil erosion control and landslide stabilization measures needed.
Institutional and governance arrangements for implementation arrangements of various
soil erosion control and landslide stabilization measures.
Awareness creation needs and communication strategy.
Training and capacity development needs and training and capacity development plan.
Financing arrangements.
Monitoring and Evaluation arrangements.
4.3.4 Technical Intervention Areas
Soil erosion and landslides occur on all types of lands (forest lands, range lands, crop lands, mined lands, road construction sites, etc. Different land stabilization measures are needed in these land types. Table 4.1 gives a description of the various potential soil erosion control and landslide stabilization interventions on these lands.

27
Table 4.1: Technical Intervention Areas Activity Forestry
and Range Lands
Crop Lands
Mined Lands
Road Construction Sites
Miscellaneous Measures
Preparation of Detailed Sub-watershed Level Plans and Selection of Sites for various Land Stabilization Measures
X X X X
Structural Measures Gully plugs, gabions and check dams
X
Cur-off drains and diversion channels
X
Retention ditches X Infiltration ditches X Water retaining trenches and pits
X
Check dams/Stone Check Dams X Contour Terraces X Waterways and Grassed Waterways
X
Conservation Ponds X Small dry and subsurface dams X Storage of water harvested (tanks)
X
Small rock stacked structures, waterbars, armored ditch, lead out ditches at dip key points, etc.
X
Retention Walls X Water distribution systems X X X Bio-engineering Measures Bamboo/Vegetation Fencing X Brush Layering X Brush Mattress X Fiberschine X Jute Netting X Live Crib Walls X Live Fascines X Palisades X Wattle Fence X Live Brush Sills X Bush Trenches X Brush Spurs X Land Stabilization on Agricultural or Cultivated Lands

28
Establishment of Fruit Orchards
X
Distribution of Fruit Plants for planting on agricultural lands
X
Agroforestry and Alley Cropping
X X
Bench Terraces X Broad bed and Furrow X Conservation Tillage X Hedgerows X Graded Soil Bunds X Level Soil Bunds X Grass Strips X Mulching X Trash Line X Vetiver Plantings X Farmers Training in Conservation Agriculture and Land Stabilization on Agricultural Lands
X
Land Stabilization Measures on Rangelands/Grasslands
Livestock and range management
X X
Controlled Grazing X X Area Closures X X Livestock Farmers Trainings on Land Stabilization Measures
X
Land Stabilization on Forest Lands
Controlled Grazing in Forests X Hillside Terraces X Micro-basin X Trees, Shrubs and Bushes Planting
X
Area Closures X Trenches X Water Harvesting X Live spurs X Land Stabilization on Minded Lands
Land Stabilization Works on Mined Lands
X
Land Stabilization along Road Construction Sites
Land Stabilization along Road Construction Sites
X
Transportation

29
Gravel Access Trails X X X Improved Access Trails X X X X Training and Capacity Building
Training of various stakeholders in Land Stabilization Measures on various types of lands
X X X X
Communication and Awareness Creation
Use of Radio Programs X X X X X Use of Mobile Phones and Messages
X X X X X
Use of Printed Material and Print Media
X X X X X
Use of Electronic Media X X X X X Source: Gandapur, 2017
4.4 Establishment of Benchmark for Coastal Protection and Shoreline Protection
Coastal protection and hazards management in the coastal areas of Pakistan is a serious issue of
national importance due to the high cost of developmental activities in the coastal areas and
location of high value assets in these areas. The coastal protection is also becoming a significant
issue due to increasing trend for people to live at the coast, particularly fishermen folks, tourist
infrastructure, and people working in coastal areas. Coastal areas are already facing high risks due
to increase in the frequency of sea storms and other extreme events. Sea level rise and increase in
the frequency and intensity of sea storms as a result of climate change are now adding to the
existing risks.
The main objective of coastal and shoreline protection is to decrease the physical risk from coastal
hazards. Establishment of the baseline will help identify Areas Sensitive to Coastal Hazards. For
this purpose, based on international research and experience, a set of indicators is proposed for use
that on coastal erosion risk. Three categories of indicators are proposed for establishment of
baselines of coastal protection which are described below (Dougall, 2005):
Foundation indicators
F1 – identification of coastal hazard zones on the planning maps
F2 – presence of rules to support the hazard zones and decrease physical risk of coastal hazards
F3 - policies to ensure that any building or community within the coastal hazard zones is subject to
controls to mitigate risk such as relocation and relocation plans
Baseline Indicators
B1 - Average building setback for residential dwellings in the “primary” hazard zone.

30
B2 - Number of residential dwellings in the “primary” or “secondary” hazard zones.
B3 - Number of residential lots in the “primary” or “secondary” hazard zones at a date close to the
most recent survey of coastal areas.
Trend Indicators
The third level of coastal hazard indicators focus on measuring changes in the total physical risk
based on consent approvals. These are:
T1 - Number of residential communities and populations living in the coastal hazard zones.
T2 - Number and area of residential building in coastal hazard zones
T3 - Number and area other buildings in the coastal hazard zones.
T4 - Number of population working in coastal hazard zones.
T5 - Number of existing coastal protection facilities in coastal hazard zones.
T6 –Number of new coastal protection facilities getting developed in the coastal hazard zones.
T7 – Number of existing coastal erosion monitoring facilities.
T8–Number of new coastal erosion monitoring facilities.
T-9 Number of awareness raising and capacity building sessions already held for people living in
coastal hazard zones along with the number of participants in those awareness raising and training
sessions.
T – 10- Number of new awareness raising and capacity building sessions proposed for people living
in coastal hazard zones along with the number of participants in those awareness raising and
training sessions.
4.5 Establishment of Benchmark for Non-Timber Forest Products (NTFPs)
Non-timber forest products (NTFPs) constitute an important resource source of raw material for
different pharmaceutical, herbal and culinary industries and as a source of livelihood for the local
communities. These include medicinal and aromatic plants, mushrooms, honey, wild fruits, nuts,
etc. Many rural people earn their livelihood or add to their income by collection and sale of these
NTFPs.
The diversity, quality, and availability of many species of NTFPs in Pakistan are decreasing. This
situation has serious consequences for the industries using these products, people dependent on
these for their livelihoods or livelihoods supplementation and for the biodiversity of the forest and
grassland ecosystems in the valley.
The PES project therefore proposes to take various measures so as to reverse this negative trend by
working and interacting with the collectors, producers, traders, processors, manufacturers as well

31
as with policy makers, implementers, promoters and researchers of NTFPs in the valley so as to
ensure their protection and sustainable management.
4.5.1 Indicators for NTFPs
Based on Kathryn et al. (2004), Table 4.2 gives monitoring measures (condition indicators,
pressure indicators, and human response indicators) for establishing NTFPs benchmarks.
Table 4.2: Conditions Indicators used for measurement of NTFPs
Condition Indicator Verifiers Unit of Measurement Methods Diversity of plants species
No. of young/mature plants
No. of species Field surveys, sample plots, transect walks
Density by species No. of young/mature plants
Number per ha Resource inventory
Size-class structure by species
No. of young/mature plants
Number per ha Resource inventory
Biomass of herbs by species
Utilizable biomass Kg per ha Monitoring of Sample plots
Growth and yield of selected NTFP species
Tree diameter growth
mm per year Monitoring of Sample plots
Shrub height growth
cm per year Monitoring of Sample plots
Utilizable biomass growth
Kg/ha/year Monitoring of Sample plots
Product yield Kg/ha/year Monitoring of Sample plots
NTFP Regeneration by species
Young growth 4 point ordinal scale Resource inventory
Seed production by species
Occurrence of seed
Qualitative
Focus group discussions, transect walk
Quantitative Experimental plot (mean kg/ha; % germination)
Table 4.3: Pressure Indicators Relevant for NTFPs Measurement

32
Pressure Indicator Verifiers Unit of Measurement Methods Biomass Removal Timber Volume/ha/year Continuous
Monitoring and Records
Fuelwood Volume/ha/year Continuous Monitoring and Records
Poles and Posts Volume/ha/year Continuous Monitoring and Records
NTFP Species Weight/ha/yea NTFP harvester & buyer records
Grazing Area Ha. Records Livestock Units No./ha/year Records, Transect
walks Period Months per year Focus Group
Discussions Land Conversion Forest to Crop Land Ha./year Continuous
Monitoring and Records
Forest to Settlement Ha./year Continuous Monitoring and Records
Forest to Roads Ha./year Continuous Monitoring and Records
Forest to Other Non-forest land use
Ha./year Continuous Monitoring and Records
NTFP Harvesting Practices
Season Degree of Appropriateness
Focus Group Discussions
Tools Used Degree of Appropriateness
Focus Group Discussions
Methods/Techniques Degree of Appropriateness
Focus Group Discussions
Fire Area M2/ha/year Records, Transect Walks
Frequency No./year Records, Transect Walks
Type Crown, ground, surface
Records, Transect Walks
Cause Natural, Prescribed, Incidental
Focus Group Discussions
Socio-economic Pressures
Price Rs./unit Records, Producers Surveys, Market Surveys, Focus Group Discussions

33
Unemployment Rate Economic Surveys
Out-migration No. young people continuing extractive activities
Interviews, Focus Group Discussions
Table 4.4: Human Response Indicators Relevant for NTFPs Measurement
Human Response Indicator
Verifiers Unit of Measurement Methods
Promotion of Natural Regeneration
Timber Ha/year reseeded, planted or managed for natural regeneration
Records
NTFP species Describe various techniques
Interviews, Focus groups
Conflict Stakeholders List each group Interviews Focus groups Ethnographic fieldwork
Frequency No. per year Issue Describe conflict Resolution Facilitation,
negotiation, mediation, arbitration, litigation, coercion
Perceptions Of nature Describe, categorize Ethnographic fieldwork Participant observation Interviews Focus groups
Of value of NTFPs to livelihood, quality of life Of land management Of conservation Of I & M efforts Of regulations
Resource Management Regulations
Forest Department NTFP related regulations
Describe, categorize Records Interviews or focus groups with managers and policymakers
Law Enforcement Frequency No. of Incidences/year Law enforcement records.
Types Describe Incidences Law enforcement records Interviews
4.5.2 Sampling Designs, Plot Configurations and Enumeration Methods for NTFPS

34
Beside the selection of indicators for inventory and monitoring, decisions are also needed for using
the most appropriate sampling design, frequency of inventory and plot configuration for the given
objectives and indicators. Such decisions are made based on the life-form of the NTFPs, the type of
information needed, time and financial constraints, and overall project goals and objectives. Wong
et al. (2001) provide a valuable overview of inventory approaches relevant for NTFPs. Wong (2000)
has described enumeration methods of 126 NTFPs studies. The following three tables are based on
a slightly modified form of Wong (2000). These tables illustrate the range of possibilities for NTFPs
inventory and monitoring possibilities.
Table 4.5: Sampling Designs for Monitoring of NTFPs
Sampling Design Description Examples of Previous Applications
Census 100% enumeration of small area All useful plants Simple random sampling
Selection of plots using random number tables (probability of sampling any plot equal)
Useful plants, plants in general
Systematic sampling
Location of plots on a fixed grid, normally with randomly selected origin for grid.
Trees, mushrooms
Line-plot sampling- plots located at fixed distances along a transect line
Perennial herb, saplings
Stratified sampling Area divided into strata and sampling undertaken independently in each strata
Bamboo
Multi-stage sampling Hierarchy of nested sample plots: sample of largest plots selected with further selection of smaller plots within chosen plots.
Shrubs, rattan
(Adapted from Wong, 2000)
Table 4.6: Possible Plot Configuration Methods
Plot Configuration Description Examples of Previous Applications
Measured plots with fixed dimensions
Square Insects larvae Rectangular Herbs Circular Perennial herbs 2-D plane at fixed height from ground or oriented vertically
Liana
Fixed volume Liana Plotless sampling Point-centered quarter method
Trees, palms Trees, palms
Sample fixed number of individuals Shrubs

35
closest to sample point or within sample area Individuals sampled within timed walk from house
Palms
Cluster sampling Systematic group of sub-plots in fixed pattern used at each plot location
Mangroves
Point and line transects (variable width transects)
Observations are made while standing on the point or walking along the line. Perpendicular distance from point or line to observed individuals measured.
Mammals
Line-intercept transects
Observations made of intercepts (plant clumps) with a line or plan projected above line.
Large mammal (single species)
Distance sampling Record distance from observation point to target and use of Fourier analysis to estimate target population.
Birds
Strip transects Narrow, very long transects treated as a fixed sample area.
Mammals, game animals
Torus Strip arranged around geometric shape (e.g. square) -space inside not enumerated).
Tree (single species)
(Adapted from Wong, 2000)
Table 4.7: Example Product Enumeration Methods
Method Description Examples of Previous Applications Presence/absence Record occurrence in plot (Y/N). Useful plants Tally Counts of individuals in plot. Useful plants Size measurement Measure size of all individuals in
plot (height, diameter). Herb (single species)
Cover Record percentage of plot covered by species of interest.
Herb (single species)
Subjective scores Score features of species into subjective classes
Tree bark (single species)
Weight Measure weight of all individuals in plot or harvested
Mushrooms
Volume Measure volume produced Tree syrups, Resin (Adapted from Wong, 2000)

36
4.6 Establishment of Benchmark for Ecotourism
Tourism is an untapped resource in Pakistan. Given the wide variety of touristic spots available in
the country, the potential to develop this as a source of livelihood for the local communities and
earning of foreign exchange for the country are vast. The key point, however, is to promote pro-
poor and pro-environment tourism that does not cause any cultural, social, economic or
environmental problems. Tourism Concern (1991) has listed the following principles for
responsible ecotourism:
Reducing over-consumption and waste: Tourists often over-utilize material and generate a lot of
waste from their activities which put huge pressure on the ecosystem. Decrease in the
consumption and waste will reduce the cost of environmental restoration and will enhance the
quality of tourism.
Using resources sustainably: Natural, social and cultural resources of any ecosystem are scarce
and should be used with care and caution so that the future generations are also able to benefit
from these resources.
Maintaining biodiversity: A sustainable and responsible tourism should maintain and promote
natural, social and cultural diversity of an area. This will create a resilient base for the tourism
industry.
Integrating tourism into planning: The long term sustainability of tourism could be improved
through integration of tourism development into national and local strategic planning framework
and which should also include environmental impact assessment.
Supporting local economies: Tourism that supports a wide range of local economic activities and
which has low environmental cost not only results in the socio-economic improvement of the area
but also takes care of conservation of the natural resources.
Involving local communities: The full participation of local communities in the tourism industry
will not only benefit these communities and the environment but will also improve the quality of
the ecotourism.
Consulting stakeholders and the public: Close coordination and consultation between the
tourism industry and local communities, governmental and non-organizations and institutions
working in the tourism sector is essential for ecotourism and resolution of conflicts.
Training staff: There is a need to build the capacity of people working in the tourism industry
regarding environmental issues and sustainability. They should be aware of the reduce, recycle and
reuse principles to reduce the ecological foot-print of the tourism industry.
Marketing tourism responsibly: Marketing is an important component of tourism industry.
Responsible marketing provides tourists with full and reliable information about the natural, social
and cultural environments of different destination areas and the facilities available for tourists. This
enhances customer satisfaction and results in the improvement of tourism industry.

37
Undertaking research: Modern ecotourism should be backed up by meaningful research. This
involves monitoring by the industry using effective data collection and analysis to help solve
problems and to bring benefits to destinations, the industry and consumers.
4.6.1 Proposed Ecotourist Activities and Indicators for Ecotourism in two pilot areas
Proposed eco-tourist activities in the mangrove forest areas
Campsite in the Mangroves and Creeks sites. Season: September through April
Mangroves Watch. Season: August through May
Coastal Wildlife Sighting. Season: Throughout the year
Discover Marine Life. Season: Throughout the year
Recreational Marine Fishing. Season: September through April
Sailing/Boating Trips. Season: September through April
Cultural Gatherings and Festivals. Season: Throughout the year
Proposed Ecotourism Activities in Kaghan Valley
Campsites in the valley. Season: May through October
Forests and Alpine Areas Watch. Season: May through October
Mountain Wildlife Sighting. Season: Throughout the year
Discover Naran and Mountain Life. Season: Throughout the year
Recreational Coldwater Fishing. Season: May through September
Lake Saiful Maluk Trips. Season: Throughout the year
Cultural Gatherings and Festivals. Season: Throughout the year
Proposed ecotourism related indicators for setting baseline and monitoring progress over time fall
in the following categories:
Table 4.8: Indicators for Monitoring of Ecotourism
Category of Indicator Indicator Socio-Cultural Scope Indicators Land Property No. of tourism facilities of which property is owned by and title
held by local people Access Roads No. of kilometers of paved roads Trainings No. of trainings conducted
Types of trainings conducted No. of people trained
Loss of local identity and values No. of local festivals held No. of complaints by local people about loss of local identity
and values Adhesion of the community to the tourism
No. of community people who adhere to tourism as an economic activity
Economic Scope Indicators Economic activities No. of persons or families that carry out tourism Visitation No. of visitors monthly/annually Travel agencies No. of tour operators working in the industry

38
No. of trips sold Types of activities offered
Accommodation No. and square feet of properties currently existing No. and square feet of properties being developed annually
Gastronomy No. of restaurants and kiosks opened No. of dishes including tradition food Sale levels measured in Pakistani Rupees
Household income Increased household income measured in Pakistani Rupees Percentage of household income from tourism
Basic resources No. of basic resources and facilities that are available Quality of available resources and facilities
Transportation No. of modes of transport available Quality of transport facilities Environmental Scope Indicators Solid waste generation Kilograms of garbage generated per month in peak season Energy used Megawatts of energy used in high season Water supply Liters of water used per month in high season
No. of water bodies getting contaminated Biodiversity Impacts No. of plant species getting affected
No. of animal species getting affected Sighting species with conservation problems
Landscape/Seascape Impacts No. of landscape/seascape impacts Type of landscape/seascape impacts
5 MONITORING AND METHODOLOGICAL GUIDANCE ON MONITORING

39
5.1 Current Issues with PES Monitoring
Following are some of the current issues with PES monitoring:
Inadequate or improper use of the log-frame
Inadequate, poor or missing linkages
Inadequate or non-integration of reporting system with the monitoring systems
Use of inappropriate methodologies
Insufficient or irrelevant information collection
Poor targeting of the information collected in the monitoring program
Neglect of certain key elements of monitoring such as species or ecosystems in a biodiversity monitoring program
Inadequate and only minimal quality control
Data handling and storage is inadequate and compromised
Insufficient attention paid to human and institutional development aspects of the M&E
system. 5.2 Purposes/Rationales of Monitoring
Monitoring is an important function to judge the performance of an actor, the output of an input
and to identify what action might yield the best results, and how successful past actions have been.
To develop and implement sound environmental policies, data are needed that measure the
performance of environmental systems and changes in their functioning (US National Academy of
Sciences, 2000).
Ecosystem monitoring have usually three separate monitoring purposes:
Monitoring for changes in ecological status and integrity: This type of monitoring is generally aimed
at seeking answer to the question: Are things changing and to what extent? It provides the requisite
data for reporting on the state of environment, policy development and organizational audit. The
main risks are spending too much effort in collecting data that have little intrinsic value, are not
used for policy, but look credible in reports.
Monitoring for management action. This type of monitoring provides answers to the questions such
as: When should we intervene? What actions are required when? Have our interventions been
successful? What are the alternate options? These types of questions provide basic information for
audit purposes. The main risk associated with this sort of monitoring is failing to adequately
analyze the data and report the results, and thus overlooking them in decision making.

40
Monitoring for fundamental understanding. This type of monitoring attempts to answer the
questions: Do we understand what is going on? How can we predict the future? Can we apply this
knowledge to biodiversity management? These types of questions help in achieving multiple
objectives and the collection of data for long term monitoring. Main risks associated with this type
of monitoring are sustainability and funding.
5.3 Types of Indicators to Use
International agreements such as Convention on Biodiversity (CBD. 1999) and national
requirements suggest three types of indicators to cover the range of issues:
Forest and biodiversity status: those that seek to determine biotic change of important
environmental components at scales from species to whole landscapes, in particular those with
policy relevance
Conservation effort: those that deal with the steps taken to improve biodiversity, the resources
allocated, and how efficient the measures are
Socio-economic impact: those that document impact on society and societal response.
5.4 Selection of Indicators for Monitoring
Following are some of the factors that will be considered in the selection of indicators (Bockstaller
& Girardin, 2003; Bossel, 2001; Dale & Beyeler, 2001; Jackson et al., 2000).
General importance of the indicator
Interpretability of the indicator
Policy relevance and suitability of the indicator
International compatibility of the indicator
An indicator having strong conceptual basis
An indicator having good statistical properties
An indicator that is robust and reliable
An indicator that is compatible with other elements of the M&E system
An indicator that provides the needed flexibility
An indicator that is cost effective to collect data on
An indicator that has the needed geographical or spatial variability as well as sufficient
temporal variability so that changes can be easily detected in a relatively small area and in
relatively short periods of time
An indicator that provides timely data
The indicator can be easily integrated with the rest of the system
5.5 MONITORING OF CHANGES IN BIODIVERSITY
5.5.1 Use of Species as Monitoring Indicators

41
Use of Key categories of species for biodiversity monitoring, using the terminology of Noss (1990)
and Andelman & Fagan (2000), are:
Umbrella Species: Widespread taxa that require such an area of habitat that their presence ensures
that of others.
Ecological indicators, proxies or surrogates: Taxa that reliably stand in for many others.
Biodiversity Indicators: Taxa whose presence indicates the presence of high species richness
(biodiversity indicators)
Keystone Species: Taxa ecologically essential to the functioning of an ecosystem.
Flagship or Charismatic Species: Culturally important taxa.
Vulnerable or Canary Species; Taxa sensitive to anthropogenic changes.
5.5.2 Monitoring Changes in Biodiversity Outcomes
For monitoring changes in biodiversity outcomes, we propose the following framework and nine
outcome objectives (Lee et al., 2005):
Table 5.1: Monitoring Changes in Biodiversity Outcomes
Higher Level Outcome
Targeted Level Outcomes
Outcome Objectives
Maintaining Ecological Integrity
Indigenous Dominance
1. Maintaining ecosystem processes 8. Sustainable use 2. Reducing exotic spread and
dominance 9. Community in conservation
3. Limiting environmental pollutants
Species Occupancy
4. Preventing extinctions and declines
5. Maintaining ecosystem composition
Environmental Representation
6. Ecosystem representation 7. Climate change and variability
Since sustainable use of indigenous ecosystems and species, and working with local
communities to fulfill conservation goals, are relevant to all the targeted biodiversity outcomes,
and are accordingly segregated from the others in the table above.
5.6 MONITORING OF CHANGES IN WATERSHED SERVICES
Watersheds management is a complex and involves intricate linkages and causal chains.
Therefore, monitoring of changes in watershed will be done through monitoring of variables in

42
the Drivers, Pressures, States, Impacts and Response (DPSIR) Framework. Drivers in this
framework are the root cause factors that lead to pressures or underlying causes of
deforestation and forest degradation. Deforestation and forest degradation result in a degraded
watershed state. This degraded watershed state has negative impacts on the ecosystem
services and human welfare. The resulting impacts may lead to certain policy responses. In the
context of watershed, following are the root factors and their underlying causes of deforestation
and forest degradation:
Table 5.2: Root Factors and Underlying Causes of Deforestation and Forest Degradation
S.No. Root Factor Underlying Causes of Deforestation and Forest Degradation
Resulting Watershed State
1. Economic Commodity markets prices +/- Investments +/- Urbanization + Unemployment -
2. Social Poverty - Livelihoods +/- Conflicts - Gender +/- Awareness/Education +
3. Demographic Population - Migration +/- Resettlement +
4. Political Equity +/- Resource Allocation +/-
5. Cultural Attitudes +/- Values and Beliefs +/-
6. Governance and Institutional
Policy-Forest Policy and Land Use Policy
+/-
Institutional Structure +/- Law Enforcement +/- Benefits sharing +/- Tenure and use rights +/- Corruption - Sectoral synergy + Capacity +
Source: Gandapur, 2018b
Depending on their trend, these root factors can have positive/negative impact on controlling
deforestation/forest degradation or exacerbating it. Accordingly, their impact on the
watershed will be positive if deforestation and forest degradation are controlled or negative if
they contribute to deforestation/forest degradation. These therefore act either as stressors or
enablers. Two major stressors in watershed are land use change and climate change. Therefore,
these will be closely monitored. Other stressors in the watershed include: harvesting of
biological resources and increase of invasive species. For proper monitoring of changes in

43
watershed, it is proposed that individual components of the watershed are adequately
monitored over time. These individual components, among others, include:
Forest Management Component
Soil and Land Management Component
Water Management Component
Crop Management Component
Afforestation and Reforestation Component
Pasture/Fodder Development Component
Livestock Management Component
Rural Energy Management Component
Other Farm and Non-Farm Management Component
Community Development Component
Also, skills in surveying, staking and nurseries raising need to be developed in addition to the
skills in inter-personal relations, social mobilization and management of village based
organizations.
5.7 MONITORING OF CHANGES IN COASTAL PROTECTION AND SHORELINE STABILIZATION SERVICES
Coastal protection and shoreline stabilization are the crucial ecosystem services provided by
mangroves forests. Changes in coastal areas and shoreline are brought about by the natural
processes of erosion and accretion by the ocean waves. These changes may be for short time
such as storm, regular wave action, sea tides and winds or long term events such as tectonic
activities which result in subsidence or emergence of land mass and changes in sea levels.
Cycles of erosion and accretion are common feature of the ecological character of coastal areas.
The loose sand and soils in the coastal area are often disturbed and shifted by wind, waves and
sea currents which result in rapid changes in the position of the shoreline.
Besides these natural processes, human activities are also happening along the coasts which
disturb their ecological and hydrological behavior such as land reclamation, port development,
shrimp farming, river damming and diversion in the catchment areas and dredging and sand
mining. Both these natural and anthropogenic activities often exacerbate coastal erosion in
many places and endanger prospects for coasts to fulfill their socio-economic and ecological
roles in the long term at a reasonable societal cost.
Development within coastal areas has brought the attention of policy makers and development
actors to control erosion in the coastal areas. Different measures are being applied to manage
coastal erosion and to restore the capacity of coastal systems to adapt to these changes. The
erosion problem becomes worse whenever the remedial measures applied are ineffective and
poorly designed due to lack of sufficient knowledge about the coastal processes and the nature
of coastal systems.

44
There is a need to develop and implement an operational strategy for monitoring of changes in
coastal protection and shoreline stabilization services. The key elements of this operational
strategy are shown in the following figure (Kumar et al. 2017).
Figure 5.1: Elements of operational strategy for monitoring of changes in coastal protection
Source: Kumar et al., 2017
5.8 MONITORING OF CHANGES IN NON-TIMBER FOREST PRODUCTS

45
For proper monitoring of the conservation, sustainable development and business enterprises
promotion related to NTFPs, different standards have been developed. These standards apply the
following six internationally accepted principles for sustainable collection, management and
enterprises development of MAPs (Gandapur, 2015):
Principle 1: Maintaining Wild MAP Resources
Principle 2: Preventing Negative Environmental Impacts
Principle 3: Complying with Law, Regulations and Agreements
Principle 4: Respecting Customary Rights
Principle 5: Applying Responsible Management Practices
Principle 6: Applying Responsible Business Practices
5.9 MONITORING OF CHANGE IN ECOTOURISM
There are a number of challenges to monitoring changes and measuring the impacts of tourism
(Bucley, 2008): Some of these include the following:
The difficulty of establishing a credible baseline against which change could be measured.
The difficulty of separating human-induced changes from natural processes
Spatial and temporal connections between cause and effect
The complexity of environmental interactions—primary impacts induce secondary impacts
and tertiary impacts and so on.
There are other challenges too, but those are more specific to tourism and include:
The diversity of activities performed
The diversity of environments in which tourism occurs
The mobility of tourists so that their impacts change from place to place
Cumulative impacts
There are three main methods by which impact assessments are undertaken:
After-the-fact analyses
Monitoring of change through time
Simulation
A broad perspective involving economic, environmental, and social-cultural indicators as given the
benchmark establishment section is proposed for adoption under this PES project.
6. FIELD MEASUREMENTS
6.1 Pre-requisites for M&E system

46
Field measurements are needed on the different variables identified for the various PES scheme components. For this purpose, it is recommended to develop a proper M&E system. Following are the pre-requisites for this M&E system:
Good information system Mechanisms for review & reflection Effective links between information system and decision-making system Commitment to legitimacy of making changes to what and how
In the proposed participatory M&E system under this PES scheme, M&E will be done by project communities with the help of Forest Department and other stakeholder groups. This participatory M&E intends to ensure:
Support information gathering and analysis by primary users Link this to decision making forum or opportunities Develop optimal information flows between groups of users and Decision makers at different levels The participatory monitoring and evaluation process will be carried out at all levels across
the organization and project involving all the stakeholders. Therefore, the feedback and learning flows across at different levels.
6.2 Tools for participatory monitoring and evaluation There are several set of tools used in participatory monitoring and evaluation under a PES scheme. The key however, lies in how they are applied. In conventional monitoring system an external interviews selected groups or households through interview schedules or questionnaires. Then the data is analyzed outside the project area and a report is developed. In contrast, a participatory project monitoring and evaluation process provides scope for the watershed community to understand the process and incorporate the learning on regular basis. More as mentioned above, the community empowered to reflect on its strengths and weaknesses. It provides platform for marginalized and other weaker sections to voice their opinion. Participatory learning and action methodologies are widely in use to monitor the projects. Following are the tools for participatory monitoring and evaluation.
Focus group discussion Key person interviews
Household surveys Topical meetings Informal meetings Mapping Transect walks Matrix and ranking/scoring Triangulation Case studies Secondary records

47
The information/ data collected through these tools is correlated and analyzed to derive quantifiable as well as qualitative information on project. Who can participate in participatory monitoring and evaluation? All the project stakeholders can participate in the PME process. However, watershed association, use groups, and other interest groups participate in the process. Based on the Sustainable Livelihoods Framework (DFID, 2000) as depicted in Figure 6.1 below, indicators could be developed to monitor the progress.
Figure 6.1: Sustainable Livelihoods Framework Each village institution could work out its goals and desirable objects. During the course of the PES project, these objectives / goals are monitored collectively by the project teams. It is important to note that certain interest groups involvement need to be ensured in the process, if needed with additional focus and assertion. Otherwise such groups (women, widows, landless, asset less, etc.) get neglected in the process. How to devise monitoring and evaluation indicators: This process could be carried out with project groups with the help of an outsider. Communities could come out with various indicators that reflect the project progress and impact on livelihoods. These indicators then need to be divided into qualitative and quantitative. Periodicity of monitoring and evaluation could also be derived through collective meetings. This will ensure greater involvement of project community in assessing the project and its progress. Members could be identified to maintain certain needed records. They could be trained to take up various project monitoring related activities. For example a village animator could collect the data on number of trees planted in common land, type of plants, survival rates etc. The information could be made available to the village through display at common place. Regular monitoring of such progress would ensure success of activity and desired outcome could be envisaged.

48
Steps in a multi-party Monitoring
Figure 6.2: Steps in Multi-party Monitoring (Source: www.cifor.org)
7. DATA REQUIRED, ANALYSIS AND SUMMARIZATION
Hold Multiparty Meeting-Identify common goals and monitoring concerns for the project. Construct communications framework outlining information transfer between project stakeholders.
Develop Monitoring Plan-Describe indicators to measure change built on reliable data collection methods. Specifically address, where, when and how data will be collected.
Gather Data-Collect baseline data on the status of various ecosystem services, data on project activities implementation, data on status of various ecosystem services under the project scenario and compare.
Analyze Results-Conduct simple and reliable caluclations on data from local, regional and national perspectives. Schedule multiparty team meetings to discuss and interpret results.
Share Results-Keep process transparent, adaptive and flexible. Suggest tangible prescriptions when new information becomes available. Report results illustrating both success and failure.

49
The following tables show the type of data that would be needed for mangrove forests PES scheme
in Sindh and Balochistan provinces and the WHTF PES scheme in Kaghan valley, KP province.
Table 7.1: Mangrove Forests: The identified main ecosystem services with the respective method of economic valuation.
Identified main
ecosystem services
Actual economic benefit analyzed and
valuated
Valuation technique Data required
Protection of fish and shrimp spawning sites
Fishery and fish/shrimp spawning site value
Calculation of actual fish/shrimp landing value as share of total national catches, market prices for each part of fishery sector
Recent reports, official statistics, fish and shrimp market prices and extrapolation of long-term trends
Fishery related other community wage labour
Other labour services in market prices that relate to fishing sector in nearby communities
Official labour statistics on monthly wages and community interviews
Coastal zone and habitat protection
Cleaning of waste water pollution with mangroves
Assessment of mangrove waste water cleaning potential & cost avoidance approach
Numerous Pakistani and international reports with pollution amounts, mangrove mitigation potential & official waste water treatment costs for Sindh/ Balochistan
Cyclone & tsunami mitigation with mangroves
Assessment of mangrove cyclone and tsunami damage mitigation potential & cost avoidance approach
Assessment of recent historic cyclone and tsunami events & data on previous damage costs, inflation rates, population growth, and mangrove coverage
Biodiversity conservation & promotion of ecotourism
Ecotourism Actual current numbers of eco-tourists at market price
Community survey and tour operator information from Karachi
Education and research activities in mangroves
Actual current numbers of education & research activities at market prices
Community survey and previous valuation work
Wood and Carbon Sequestration
Community wood and NTFPs
Calculation of community wood and NTFP use of mangroves at market price
Community survey/interviews
Mangrove carbon sequestration
Assessment of mangrove carbon sequestration potential and carbon market price
Measurement of mangrove growth in PES area & carbon sequestration calculations / carbon market price
Shoreline stabilization &
Land erosion prevention
Assessment of current mangrove land erosion prevention & opportunity
Recent report on subject using satellite images and GIS

50
prevention of sea intrusion
cost Land stabilization Overlapping with previous Same
Table 7.2: WHTF in Kaghan Valley: Identification of Ecosystem Services, Valuation Technique and
Data Requirements Identified main ecosystem services
Actual economic benefit analyzed and valuated
Valuation technique Data required
Watershed protection
Annual water production in Kaghan Valley
No water market price exists. Thus, the water price will be derived with replacement cost or cost avoidance methods.
Assessment of total annual run-off in Kaghan Valley & determining of a price for mountain water from reports.
Habitat conservation for future generations
Replacement cost for out planting of seedlings and spreading of herb seeds.
Planting and seeding costs per hectare of slopes from DFO Office.
Land stabilization and prevention of landslides and other erosion
Cost avoidance for reduced need of expansion of new hydropower capacity (landslides) and prevention of erosion on steep slopes by planting/seeding.
Recent hydropower reports on dam sedimentation and cost of construction of new hydropower capacity upstream. For erosion also planting & seeding cost per ha from DFO Office.
Biodiversity conservation and promotion of ecotourism
Mainstream ecotourism Travel cost method Recent statistics on annual eco-tourists numbers and tourist survey conducted by PFI
Hunting tourism Travel cost method Recent statistics on annual eco-tourists numbers and average trophy hunting prices
Provisioning Services and REDD+ related
Timber harvesting in Kaghan Valley
Log market prices per species Statistics on type of tree species and cubic meter per species & market prices
Fuelwood harvesting and collection
Fuelwood market prices per species
Statistics on type of tree species and cubic meter per species & market prices
Carbon sequestration in Kaghan Valley
Annual growth of plantations and restored forest areas & carbon sequestration
Annual growth of plantations and restored forest areas & international carbon sequestration market price
Promotion of Non-Timber Forest Products (NTFPs)
Free-grazing fodder for livestock
Replacement cost/shadow pricing using total livestock sector annual sales
Statistics of Kaghan livestock populations and various livestock product prices
Medicinal plants collection
Market price estimates at commercial sales point.
Government Records
Commercial fish production
Fish production at market price
Official statistics of the KFD
Gems and precious stones collection
Annual estimate for gems/ precious stone sales in Pakistan
Maps and reports.
8. DATA QUALITY ASSESSMENT/ASSURANCE (DQA)

51
Quality assurance (QA) and quality control (QC) are must to ensure reliability and accuracy of the measurement and monitoring of ecosystem services and to meet minimum measurement and analysis standards. The QA/QC provisions are an integral part of ecosystem services monitoring and include procedures for QA/QC related to: (1) field measurements; (2) laboratory procedures; and (3) data entry and analysis techniques.
At the end of every data collection exercise in the field, the data sheets should be checked by the team leader to identify if there is any shortcoming in the data. Once satisfied with the quality of the data, the team leader should put his signature on the sheets along with his name and date of checking. He must also record the issues that were noticed during the checking, so they can be avoided in the future. Similar checks should also be performed after data entry into computer systems and their analysis and tabulation.
If any laboratory measurement are involved, then it is advisable that the laboratory analysis process should also be checked by expert reviewer to ensure accuracy of the results.
9. DATA REPORTING

52
Data are the facts of the qualitative or quantitative variable and individual figures in the raw form.
We can only derive and generate information after we compile and analyze the data. This
information is used for reporting and decision-making. Thus every PES scheme will need data to
track progress of a plan, monitor and evaluate the effectiveness of the project, analyze the context
and reach an evidence based decision-making process. Data collected under PES scheme will pass
through different stages before reaching the senior project management via the different tiers in
the project management.
Any data is first collected at the source before being recorded, transported, processed, and
analyzed. Finally, information is derived from the data and reported to the senior management and
funding agencies. Like any other project, the data in a PES project are recorded at the field level,
then transported to the Forest Division at the district level, from where it goes to the Forest Circle
and Forest Regions levels. Finally, it reaches the Administrative Department, Planning and
Development Department levels. The responsibility of compiling, analyzing and reporting the
information to the donor agencies, lies with the Planning and Development Department. The key
point to be noted is that it is essential to maintain quality of the data throughout the entire process.
The tool that is used to examine the quality of data during the process is the Data Quality
Assessment/Assurance (DQA).
Thus, DQA is the systematic approach to assess and ensure the quality of data over all time and
levels. DQA is the scientific and statistical evaluation of PES data to determine if they meet the
planning objectives of the PES project, and thus are of the right type, quality, and quantity to
support their intended use. In other words, DQA can be termed as a data quality audit as it verifies
the data across the levels going through the details for data verification. DQA reassures that the
data fits well with six dimensions of quality as depicted below. However, the special focus is given
on accuracy, validity, precision, reliability and integrity during the assessment.
The following diagram presents the different dimensions of data quality assessment.

53
Figure 9.1: Data Quality Assessment (Source: Byrnes, 2008)
Dimensions of Data Quality
Assessment
Integrity
Accuracy
Reliability
Validity
Timeliness
Precision

54
GLOSSARY OF TERMS
Note: The explanation of terms in this glossary is aimed at facilitating understanding of climate
change mitigation and adaptation in the forestry sector of Pakistan including REDD+. Therefore,
the glossary also includes terms which have not been used in this PES Monitoring Manual but given
their importance for enhancing understanding of REDD+ at the national, provincial and local levels
have been included in this glossary. Also, an effort has been made to use agreed text to the extent
possible. However, many terms defined here may have other definitions than the ones given in this
glossary. Many definitions given in this glossary have been derived (adapted) from different
sources, including CIFOR (2009) and Green Capony Porgramme (2008).
3E+
The 3E+ criteria refer to effectiveness, efficiency, equity and co-benefits and are used in the climate
debate to assess proposed options and their expected outcomes or to evaluate actual outcomes.
Afforestation
Afforestation is the direct human-induced conversion of land that has not been forested for a period
of at least 50 years to forested land, through planting, seeding and/or the human-induced
promotion of natural seed sources.
Additionality
Additionality is the requirement that a REDD+ activity or project should generate benefits, such as
reduced emissions or increased removals that would not have happened without the activity (i.e.
the BAU scenario).
Baseline
This term is used in different ways. In REDD+, it typically represents the projected anthropogenic
changes in forest carbon stock that would occur in the absence of the proposed project activity or
policy intervention. See also BAU and reference level. In project evaluations, baseline can refer to
pre-project conditions (e.g. a baseline study involves collecting socioeconomic and ecological data
before a project starts, implicitly assuming that any change is due to the project).
Benefit sharing
The distribution of direct and indirect net gains (monetary and nonmonetary benefits) from the
implementation of REDD+.
Business as usual (BAU)
A policy neutral reference to future emissions or removals, estimated using projections of future
emission or removal levels without any REDD+ activity. The term is also used in a political economy
sense to mean the continuation of policies and practices consistent with the status quo in the pre-
REDD+ political economy of a country.

55
Carbon market
A market in which carbon emission reductions are traded, usually in the form of carbon credits
(verified or certified emission reductions). Carbon markets take the form of: (i) a voluntary market
(where emission reduction targets are not regulated), or (ii) a compliance market (where carbon
credits are traded to meet regulated emission reduction targets). The largest carbon market is the
EU’s Emissions Trading System (ETS).
Carbon offset
A reduction in emissions or an increase in removals made to compensate for an emission made
elsewhere. Carbon offsets are measured in metric tons (t) of CO2e.
Climate, Community and Biodiversity Alliance (CCBA)
Partnership of international NGOs with a mission to stimulate and promote land management
activities that mitigate global climate change, improve the well-being and reduce the poverty of
local communities, and conserve biodiversity.
Co-benefit
Benefits arising from REDD+ in addition to climate mitigation benefits, such as enhancing
biodiversity, enhancing adaptation to climate change, alleviating poverty, improving local
livelihoods, improving forest governance and protecting rights.
Compulsory/compliance/mandatory markets
Markets created and regulated by mandatory national or international climate regimes. They
allocate or auction GHG emission limits (quotas or caps) to countries, subnational units or
companies and allow them to buy carbon credits to meet their cap, or sell them if they emit less
than their cap (i.e. trade, also known as cap and trade).
Conference of Parties (COP) to the UNFCCC
The governing body of the UNFCCC. It meets once a year.
Deforestation
The permanent conversion of land from forest to non-forest. In the Marrakesh Accords,
deforestation is defined as “the direct human induced conversion of forested land to non-forested
land.” FAO defines deforestation as “the conversion of forest to another land use or the long-term
reduction of the tree canopy cover below the minimum 10% threshold.”
Degradation
Degradation refers to changes within the forest that negatively affect the structure or function of
the forest stand or site, and thereby lower its capacity to supply products and services. In the
context of REDD+, degradation can be measured in terms of reduced carbon stocks in forests that

56
remain as forests. No formal definition of degradation has yet been adopted, because many forest
carbon stocks fluctuate due to natural cyclical causes or management practices.
Forest
The Food and Agriculture Organization of the United Nations defines forest as having minimum
canopy cover of 10%, minimum tree height in situ of 5 m, minimum area of 0.5 ha, and where
agriculture is not the dominant land-use. The UNFCCC allows for a more flexible forest definition:
minimum canopy cover 10–30%, minimum tree height 2–5 m and minimum area 0.1 ha. Individual
countries have their own definitions.
Free, prior and informed consent (FPIC)
The United Nations Declaration on the Rights of Indigenous Peoples (2007) upholds the rights of
indigenous people to grant or withhold their FPIC for: activities affecting the lands they have
traditionally owned, occupied, or used; any proposed relocation and; any legal or administrative
measures affecting them. FPIC implies that consent has been obtained without coercion in advance
of project authorization and commencement, and that the affected parties fully understand the
scope, duration and potential impacts of the activities. In the context of REDD+, proponents seek
the consent of all local stakeholders, not just indigenous peoples.
Implementation costs
The costs of setting up a system and putting into place the necessary policies and actions to achieve
REDD+
Indigenous peoples
There is no universally agreed definition of indigenous people, although some international legal
instruments provide definitions. According to the United Nations, rather than define indigenous
people, the most useful approach is for them to identify themselves according to the fundamental
right to self-identification set out in declarations of human rights.
Jurisdictional REDD+
REDD+ initiative encompassing a government administrative unit at the district level or higher.
Leakage
In the context of climate change, carbon leakage happens when interventions to reduce emissions
in one area (subnational or national) lead to an increase in emissions in another area. The official
UNFCCC term is ‘displaced emissions.’
Local communities
There is no universally agreed international definition of local communities, although the term has been defined in certain international legal instruments. With respect to a particular activity commonly the term refers to communities within the activity’s area of influence.

57
Measuring, reporting and verifying (MRV)
MRV is a series of procedures associated with the communication of all mitigation actions of
developing countries. Measurement refers to the quantification of (i) anthropogenic forest-related
emissions by sources and removals by sinks; (ii) forest carbon stocks; and (iii) changes in forest
carbon stocks and forest area resulting from the implementation of REDD+ activities. Reporting
refers to communication to the international community following the Intergovernmental Panel on
Climate Change best practices guidelines. Verifying refers to checks on the accuracy of the
estimation by UNFCCC designated entities.
Mitigation
In the context of climate change, a human intervention to reduce the sources of emissions or enhance the sinks of greenhouse gases.
Net deforestation
Reduction of forest area during a specified time period.
Net REDD emissions
For REDD, a method for estimating emissions from gross deforestation that considers both the carbon stocks of the forest being cleared and the carbon stock of the replacement land use.
Opportunity cost
In the context of REDD+, this refers to forgone profits from the most profitable alternative use of
forest land.
Payment for ecosystem/environmental services (PES)
A buyer who values environmental services pays the provider or manager of the land use that
supplies those services; in return, the seller continues to deliver them. In REDD+, PES refers to a
results-based system in which payments are made for reduced emissions or increased removals
relative to an agreed reference level.
Participation
For REDD, inclusion in key processes, inter alia, decision making, implementation, benefits sharing, and evaluation.
Performance-based remuneration
An incentive system wherein the international contribution to support REDD implementation is contingent on meeting pre-agreed benchmarks.

58
Permanence
The longevity of a carbon pool and the stability of its stocks, given the management and disturbance environment in which it occurs.
Performance metric
A set of indicators and benchmarks against which REDD actions and activities are evaluated, including but not limited to emissions and removals against reference levels.
Policies and measures (PAMs)
In REDD+, PAMs are nationally enacted policies and actions that countries undertake to reduce
carbon emissions or increase removals.
Readiness
REDD+ country actions – including capacity building, policy design, consultation and consensus
building, and testing and evaluation of a REDD+ national strategy – that are taken prior to the
comprehensive implementation of REDD+.
REDD+ SES
The REDD+ Social & Environmental Standards initiative aims to build support for government-led
REDD+ programs that make a significant contribution to human rights, poverty alleviation and
biodiversity conservation.
Reducing emissions from deforestation and forest degradation (REDD) and enhancing forest
carbon stock in developing countries (REDD+)
The term ‘REDD+’ is used in many ways. A broad definition, based on the official COP13
terminology, holds that REDD+ comprises local, subnational, national and global actions whose
primary aim is to reduce emissions from deforestation and forest degradation and enhance forest
carbon stocks (increase removals) in developing countries. A narrower definition is that
REDD+ also includes results-based or conditional payments, which was a core idea when REDD+
was first launched. From another perspective, REDD+ may not only refer to actions: it may refer to
the overall idea, the objective of reduced emissions and increased removals, the set of policies or
actions necessary to achieve that objective, the outcome as measured in reduced emissions and
increased removals or the process involving all of these elements. REDD (without the plus) is used
to refer only to reduced emissions from deforestation and forest degradation, and does not include
forest carbon stock enhancement.
Reference level (REL)
Two distinct meanings and different uses may be distinguished for reference levels. First, the
reference level is used for the BAU scenario or baseline for changes in carbon stocks, which is used

59
as a benchmark for measuring the impact of REDD+ policies and actions and to define emission
reductions. In this sense, reference level can refer to gross emission levels from deforestation and
forest degradation, and to net emission levels from all emissions and removals from deforestation,
forest degradation, conservation, sustainable management of forests and enhancement of forest
carbon stocks. Second, in a result-based system, the reference level is used as a benchmark for
estimating payments to countries, subnational units or projects for emissions reductions.
Reforestation
Reforestation is the direct human-induced conversion of non-forested land to forested land,
through planting, seeding and/or the human-induced promotion of natural seed sources on land
that was forested, but that has been converted to non-forested land.
Sequestration
The process of increasing the carbon content of a carbon pool other than the atmosphere.
Shifting cultivation
An agricultural system in which plots of land are cultivated temporarily, then abandoned when the
soil loses its fertility or weeds become dominant. The plot of land is then left to be reclaimed by
natural vegetation.
Sink
A pool (reservoir) that absorbs or takes up carbon released from other components of the
carbon cycle, with more carbon being absorbed than released. Any process or mechanism which
removes a greenhouse gas, an aerosol, or a precursor of a greenhouse gas from the atmosphere. A
given pool (reservoir) can be a sink for atmospheric carbon if, during a given time interval, more
carbon is flowing into it than is flowing out.
Smallholder
A farmer of a relatively small plot of land (a smallholding), where he or she produces in relatively
small volumes, either for subsistence alone or subsistence and sale, often depending wholly or
largely on family labor. The size of smallholdings varies significantly across regions, but their
defining characteristic is that they are small relative to the land area used by commercial producers
in the same region.
Source
A pool (reservoir) that absorbs or takes up carbon released from other components of the carbon cycle, with more carbon being released than absorbed. Source is opposite of sink.
Subnational activity
60
Activities implemented at the subnational level as part of a country’s REDD strategy. Subnational activities can be implemented by governments, local authorities, NGOs, or private entities. They may be embedded in a national or international crediting mechanism.
Swidden agriculture
An agricultural practice that involves cutting and burning of forests or woodlands to create fields,
typically part of a shifting cultivation system (also referred to as slash and burn agriculture).
Tier level
Applying the IPCC Good Practice Guidance LULUCF, countries are provided with options to estimate GHG emissions. Tiers represent levels of methodological complexity where Tier 1 is the most basic estimation methodology, Tier 2 is intermediate, and Tier 3 is most demanding in terms of complexity and data requirements.
Ton (t)
One ton is equivalent to 1000 kg (also referred to as a metric ton).
Transaction costs
A cost that is incurred when making an economic exchange. It includes costs related to search and
information, enforcement and monitoring. Transaction costs sometimes refer to all costs of REDD+
except opportunity costs.
UNDRIP
UN Declaration on the Rights of Indigenous Peoples. A comprehensive statement addressing the human rights of indigenous peoples, adopted at the UN General Assembly in 2007, with 144 countries voting in support, 4 voting against, and 11 abstaining. It is a non-legally binding instrument.
UN REDD
A Collaborative Programme on Reducing Emissions from Deforestation and Forest Degradation in Developing Countries, the UN-REDD Program brings together the Food and Agriculture Organization (FAO), the United Nations Development Programme (UNDP), and the United Nations Environment Programme (UNEP) in the development of a multi-donor trust fund (established July 2008) that allows donors to pool resources and provides funding to activities of this programme.
Validation
Independent third-party assessment of a project plan or design against defined standards, e.g. to
determine eligibility for CDM or certify by VCS.

61
Verification
Independent third-party assessment of the actual emissions reductions and co-benefits of a
particular mitigation activity.
Voluntary market
Markets that function alongside compliance markets. Buyers are companies, governments, NGOs
and individuals who are voluntarily buying verified emissions reductions, e.g. to offset their own
emissions.
Verified Carbon Standard (VCS)
This is one of the world’s most widely used carbon standards for voluntary carbon offset industry.
Carbon emission reductions generated in line with VCS are called Verified Emission Reductions
(VERs).

62
REFERENCES
Andelman S.J. and Fagan W.F. 2000. Umbrellas and flagships: efficient conservation surrogates or
expensive mistakes? Proc. Natl. Acad. Sci. USA 97: 5954–5959.
Bockstaller, C., Girardin, P., 2003. How to validate environmental indicators. Agric. Syst. 76,
639–653.
Bossel, H., 2001. Assessing viability and sustainability: a systems-based approach for
deriving comprehensive indicator sets. Conserv.Ecol. 5, 12.
Bucley, R. (2008). Environmental Impacts of Ecotourism. Ecotourism series n2.International Centre for Ecotourism Research.389 pages.
Byrnes, E. 2008. Data Quality Assessment: Field Sampling Methods for Remedial Investigations, Second Edition 2nd Edition
CBD, 1999.Development of Indicators of Biological Diversity. Nairobi: Convention on
Biological Diversity, subsidiary Body on Scientific, Technical and Technological Advice.
Report No. UNEP/CBD/SBSTTA/5/12, 14 pp.
CIFOR. 2009. REDD+ on the Ground: Glossary of REDD+ Terms.
Constanza, R., Arge, R., Rudolf G., Farber, S., Gasso, M. 1997. The value of the world's
ecosystem services and natural capital. Nature volume387, pages 253–260.
Dale, V.H., Beyeler, S.C., 2001.Challenges in the development and use of ecological
indicators. Ecol. Indicators 1, 3–10.
DFID, 2000. Sustainable Livelihood Guidance Sheets.
Dougall G., 2005. Pilot Report of Proposed Coastal Hazard Indicators.
Gandapur, A. K., 2015. Non-Timber Forest Products Rules for Gilgit-Baltistan.
Gandapur, A. K., 2017. Project Document. KuramTangi Dam Watershed Management
Project-Kurram Agency, FISP-USAID.
Gandapur, A. K., 2018. Biodiversity Impact Assessment of Billion Trees Afforestation
Project. IUCN Pakistan. (Draft)
Gandapur, A. K., 2018b. Land Stabilization Project Proposal for AJK. IUCN Pakistan. (Draft)
Gandapur, A. K., 2018c. Key Environmental Information Collection under Sustainable
Forest Management Project for Kaghan and Siran Valleys of KP Province . IUCN Pakistan.
(Draft)
63
Global Canopy Programme. 2009. REDD+ Glossary of Terms.
GOFC-GOLD, 2010, A sourcebook of methods and procedures for monitoring and reporting anthropogenic greenhouse gas emissions and removals caused by deforestation, gains and losses of carbon stocks in forests remaining forests, and forestation. GOFC-GOLD Report version COP16-1, (GOFC-GOLD Project Office, Natural Resources Canada, Alberta, Canada).
Government of Khyber Pakhtunkhwa, 2018. Khyber Pakhtunkhwa’s REDD+ Strategy.
Planning and Monitoring Circle, KP Forest Department, Peshawar.
Government of Pakistan, 2014. Readiness Preparation Proposal (R-PP). Ministry of Climate Change, Islamabad, Pakistan. Available at https://www.forestcarbonpartnership.org/pakistan
Government of Pakistan, 2016. Pakistan’s Intended Nationally Determined Contribution
(PAK-INDC). Available at http://www4.unfccc.int/ndcregistry
Government of Pakistan 2017.Notification No. 1-1/2016/NRC/WG. Islamabad the 14th
September 2017.
Government of Pakistan, 2018. Draft REDD+ Strategy of Pakistan. Ministry of Climate
Change, Government of Pakistan.
Henrik, L., Aronsen, I., Bråten, K.G and Gleinsvik, A. 2011. Experiences with benefit sharing:
issues and options for REDD-plus. Management Consulting, Norway.
Jackson, L.E., Kurtz, J.C., Fisher, W.S., 2000. Evaluation Guidelines for Ecological Indicators. Environmental Protection Agency, Washington, DC. Report No. EPA/620/ R-99/005, 110 pp. Kurtz, J.C., Jackson, L.E., Fisher, W.S., 2001. Strategies for Evaluating Indicators Based on
Guidelines from the Environmental Protection Agency’s Office of Research and
Development Ecological Indicators 1, pp. 49–60.
Lee, W., McGlone, M. and Wright, E., 2005. Biodiversity Inventory and Monitoring: A review
of national and international systems and a proposed framework for future biodiversity
monitoring by the Department of Conservation. Landcare Research Contract Report:
LC0405/122, Department of Conservation, Wellington
Kathryn, L., Jones, E. T. and McLain, R. 2004. Non-timber Forest Product Inventorying and
Monitoring in the United States. Washington, D.C.: National Commission on Science for
Sustainable Forestry. Available at http://www.ifcae.org/projects/ncssf1

64
Noss, R. F., 1990. Indicators for Monitoring Biodiversity: A Hierarchical Approach. Conservation
Biology. Volume 4, Issue 4, 355-364.
Schneider, R. 1997: Ecological diversity monitoring framework. Draft for Discussion (#6).
Department of Ecology, University of Alberta, Canada.
Tourism Concern, 1991. Action and Principles for Ethical Tourism.
US National Academy of Sciences, 2000. Ecological indicators for the Nation. National
Academy Press, Washington D.C.
Wong, J. L.G., 2000. The Biometrics of Non-timber Forest Product Resource Assessment: A
Review of Current Methodology. Report commissioned under the ZF0077 pre-project of the
Forest Research Programme of the United Kingdom Department for International
Development.
Wong, J. L.G., Kirsti, T and Baker, N., 2001. Resource Assessment of Nonwood Forest
Products: Experience and Biometric Principles. Nonwood Forest Products 13. Rome: FAO.

65

66