ii sense of place and sonic topologies: towards a ... · pdf fileii sense of place and sonic...
TRANSCRIPT

II Sense of Place and Sonic Topologies: Towards aTelemimetic Sublime in the Data Landscape
Christina McPheewww.christinamcphee.net
illustrations: digital print series on fujiflex, each 19 x 66 inches, ©Christina McPhee 2003-2004
Background
slipstreamkonza.2
Global warming implicates the increasing atmospheric level of carbon as a primary agent. Nonetheless,the total worldwide carbon budget, which takes into account all known petrochemical usage on an annualbasis, shows that terrestrial systems must be absorbing more carbon than we realize. According to thecarbon budget mathematical models, carbon concentrations should be increasing faster than they actuallyare. The hypothesis is that the carbon flux patterns of selected microsystems worldwide may revealconditions under which more carbon is been absorbed than is being released. On and near Konza Prairie,since 1997, diurnal and annual data are collected as "eddy correlation" or "eddy covariant" fluxmeasurements. From two of the sites, a located on the Rannels Ranch next to the Konza field station,wireless net carries the live data online for collection and analysis. Jay Ham, PhD, agronomist andclimatologist, conducts research into carbon flux dynamics relative to models of climate change, at KansasState University. He is the scientific partner for the present project, Slipstreamkonza. Slipstreamkonzaaddresses aesthetics of digital data expression of land as a breathing ecosystem. The time based datastream of carbon flux is interpreted as rhythmic, virtual expression of sound and image in net based andspatial installation.

I net and Gaia
Imagine interpolated virtual and actual spaces thrive and decay, die and live in a riparianzone, watered by pervasive computing as a neural territory or intelligent topology, the netacts as if alive. As a place of continuous ruin and simultaneous regeneration, thenetworked space of electronic communications is re-presenting, itself. A semiotic modelmay offer us the net as a subjective topology, a synaptic process-space. This space is notsilent. Semiotically, it ‘voices’ itself. A model of the net as a live voice finds some echoin analogy to the Gaia hypothesis on the nature of the physical landscape. As life, Gaiapersistently self-represents, or emits information about herself [1]. This is an old idea innew dress. “Day by day pours forth speech,” declares the Psalmist. In semiotic terms, alandscape of voice or self-expressive phenomena, as actual, real information—is both adata landscape and sonic topology. Where and what is this place? What is the sense ofplace in the data landscape?
slippstramkonza.3
ii topology and telemimesis
You might picture the structure, or topology of data streams, whether in the electronic orin the natural ecosystem, as an invisible domain that persists over, and throughdiscontinuities. The leap across the breaks, or breakdowns, can be expressed musically bymeans of formal structures of recursion and feedback loops, as in classic cybernetictheory, but also as in Baroque fugue structures. I imagine recursion and flow, betweennatural data and human/machine, an interpolated, mutual consciousness.
A topology is a word (logos) of a place (topos). A hypothesis about what constitutes this‘word’ or voice of a place on the level of artistic process is aesthetic in nature and intent.Aesthetically, such a place may be explored as a process of telemimesis. “Telemimesis”joins tele -- vectors across distance in space, as if space is actually layered time—withmimesis, in the Platonic sense of figuration of a prescient or hidden motif.

iii sublimity + entropy
As a visual artist, one may turn a gaze to what cannot be ‘seen’. Here we move into azone of the sublime. Sublimity refers to that which is below, beyond or immanent relativeto an ontological or cognitive threshold. I assume that there is a way of expressing thisindeterminate zone, or invisible condition, in both the realms of the physical, culturallandscape and in the interior, “behind the screen” landscape of the net.
As an ecosystem, the data landscape may be described as continually subject to entropy,following the second law of thermodynamics. Life itself may be thought of arising, like aphoenix from ashes, as an articulate resistance to entropy. A continuous dialectic betweenentropy and the architectural self-structuring process of life means that homeostasis ispredicated on breakdown, or ruin. Data stream is not always continuous. Scientificinstrumentation for measurement and transmission of physical data may fail. Anomaliesof landscape data are not always explicable based on known models. Humans strugglewith the limitations of their bodies, including, fatigue, inattention, illness and mortality.A telemimetic aesthetic of the sense of place in the data landscape accommodatesbreakdown of the ‘language’ of information streams.
slipstreamkonza.4
iv synaptic recursions
Imagine recursion and flow, between natural data and human/machine, an interpolated,mutual consciousness. [2] The place of flow is sonically expressive, or so the artist hopes.A possibility is that human synaptic pathway performs as a layer of dynamic connotation.Like a trace, or vector, over and through the data landscape, the synaptic layer is human.

Maybe we primates collaborate in a system of connotation that is never fully seen, heardor actualized: existing in time, the system is grasped in spatial fragments. Or, maybe ---between ‘natural’ morphologies in the brain/mind, and the remediation of landscape as‘big data’ , is a space, or place of telemimesis. It is mimetic in that it represents itselfrelative to a precessive content (landscape data) and does so at a distance (tele) fromitself.
slipstreamkonza.5
Recursion – could it be a metaphor of breathing, in and out, between the inside of thelandscape-body and the outside? Within Gaia, imagine an emission of data, and agathering-in of data. Global climatology attempts to study climate change by collectingmillions of data samples of diurnal carbon absorption and release on the tall grass prairie,an ecologically critical environment in North America and elsewhere. The prairie isimplicated within the phenomenon global warming in ways that are not clearly seen atpresent. Slipstreamkonza is an art/science collaborative project that addresses aestheticsof digital data expression of land as a breathing ecosystem and as manifestation ofclimate change. Slipstreamkonza uses the time based data stream of carbon flux as a basisfor a sonic and telemimetic installation. Like the ancient Greek hero, Orpheus, thisproject attempts to make music from “Hades”, in other words, the invisible domain ofdata, like a voice from a hidden subject. At the sequence of delays, or layers in time, the‘sense of place’ seems to be in a feedback loop. Things move in and out of a condition ofbeing nameable, or heard.
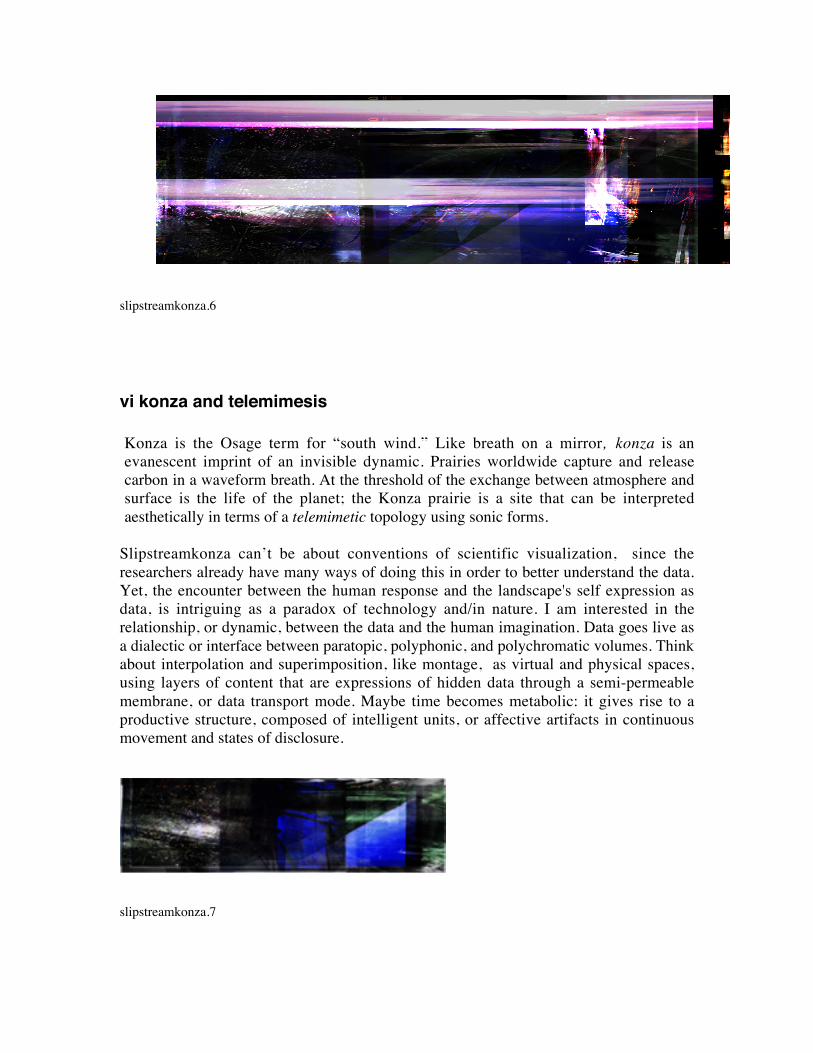
slipstreamkonza.6
vi konza and telemimesis
Konza is the Osage term for “south wind.” Like breath on a mirror, konza is anevanescent imprint of an invisible dynamic. Prairies worldwide capture and releasecarbon in a waveform breath. At the threshold of the exchange between atmosphere andsurface is the life of the planet; the Konza prairie is a site that can be interpretedaesthetically in terms of a telemimetic topology using sonic forms.
Slipstreamkonza can’t be about conventions of scientific visualization, since theresearchers already have many ways of doing this in order to better understand the data.Yet, the encounter between the human response and the landscape's self expression asdata, is intriguing as a paradox of technology and/in nature. I am interested in therelationship, or dynamic, between the data and the human imagination. Data goes live asa dialectic or interface between paratopic, polyphonic, and polychromatic volumes. Thinkabout interpolation and superimposition, like montage, as virtual and physical spaces,using layers of content that are expressions of hidden data through a semi-permeablemembrane, or data transport mode. Maybe time becomes metabolic: it gives rise to aproductive structure, composed of intelligent units, or affective artifacts in continuousmovement and states of disclosure.
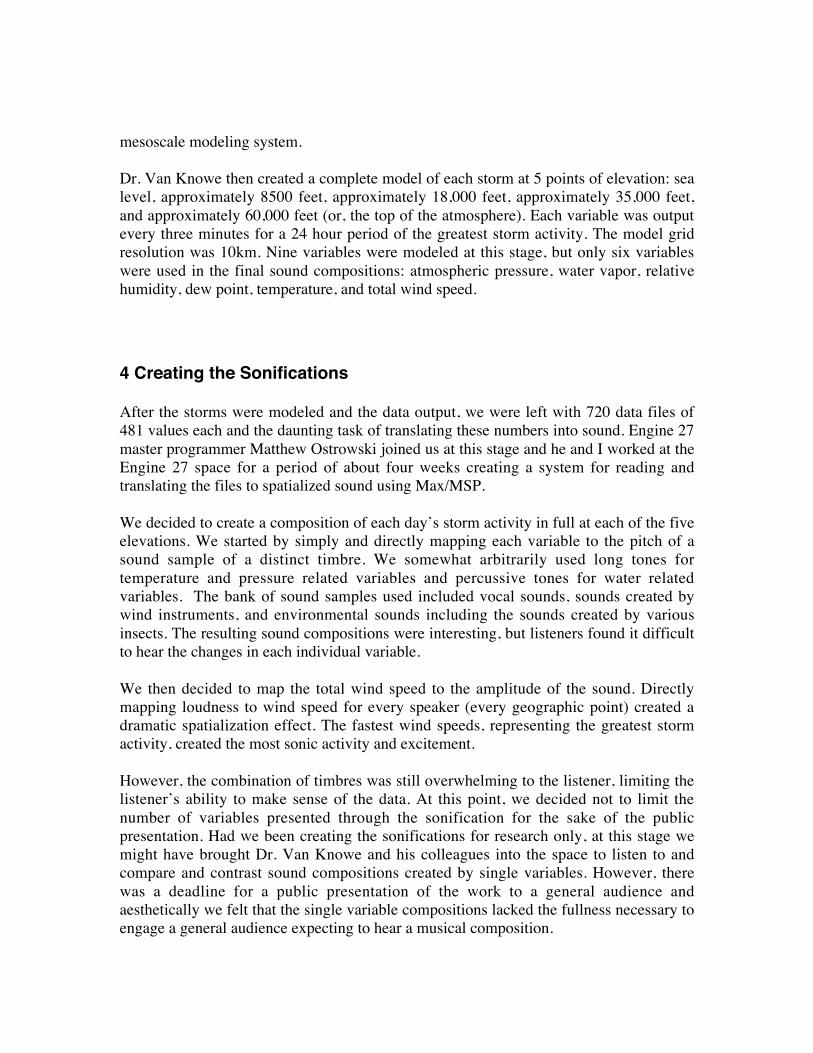
slipstreamkonza.7

vii conclusion, or another beginning
A moving sense of place gathers its momentum and definition on the fly, like acontinuous improvisation that is not entirely responsive to human use and reflection. Apoetics of that place, both virtual and physical, in the mixed volumes of fluid media,might give rise to a polyphonic design strategy, where arching shifts between recursionand sonority, darkness and density, transparency and light, processional and volume areas responsive interactive structures in multimedia installation. Like a fold or complex cutin the fabric of the data landscape, sonic topologies become a conceptual practice realmin contemporary art.
slipstreamkonza.8
Notes
[1] Geri Wittig has looked at the Gaia hypothesis relative to the discourse on landscape data, holism andscience, and includes a brief, helpful bibliography on this topic, at<http://www.c5corp.com/research/complexsystem.shtml>.
[2] Brett Stalbaum asserts that “data's role in the instantiation of the actual may be a matter of virtualinformatic interrelations (or external relations between data sets), forming their own consensual domainsthat heretofore have not yet been observed as such, but which potentially inflect the operation of actualsystems via informational transfer between neighboring systems of interrelations.”(http://www.noemalab.com/sections/ideas/ideas_articles/stalbaum_landscape_art.html)
Christina McPhee <www.christinamcphee.net>

III Atmospherics/Weather Works: Artistic Sonificationof Meteorological Data
Andrea Polliwww.andreapolli.com
PROUD music of the storm!Blast that careers so free, whistling across the prairies!Strong hum of forest tree-tops! Wind of the mountains!Personified dim shapes! you hidden orchestras!You serenades of phantoms, with instruments alert,Blending, with Nature's rhythmus, all the tongues of nations
Excerpt from Walt Whitman’s “Proud Music of the Storm” [1]
Introduction
For over ten years, I have been creating art works that translate numerical data to sound,from algorithmic compositions modeling chaos to live improvisation using video analysissystems. Areas of particular interest to my research have been modeling human methodsof improvisation in interactive computer systems and using data sonification to illustratecomplex information. Visualization is the interpretation of scientific data through thevisual image, and likewise sonfication interprets data through sound. Sonifications canhelp scientific researchers understand data in a different way.
Since 2001, I have been working on the sonification of meteorological data incollaboration with Dr. Glenn Van Knowe at MESO, Mesoscale EnvironmentalSimulations and Operations <http://www.meso.com> a leading firm in the developmentand application of atmospheric and other geophysical models for research and real-timeapplications. MESO works with the Mesoscale Atmospheric Simulation System (MASS)to create a highly detailed simulation of the weather based on terrain, initial conditions,and other factors. The atmospheric data sets produced by MESO are extremely detailed,and although they have a variety of visualization tools to interpret the data, much of thedata represented is not visual in nature (temperature and atmospheric pressure forexample). Through the project we wanted to learn what would happen if the data wasinterpreted sonically. In April 2003, we completed a series of multi-channel sonifications

of two historical storms, a tropical hurricane and a winter snowstorm at five elevations aspart of a storm sonification project called Atmospherics/Weather Works.
The Atmospherics/Weather Works project has three primary goals: the development of asoftware system for the creation of sonifications based on meteorological and other datato be used in performances and installations, live and recorded musical performances, anda web site for the presentation and distribution of the recordings and software. [2]
The first public installation of the project was in April, 2003 at Engine 27<http://www.engine27.org>, a non-profit organization devoted to the research, creationand dissemination of multi-channel sound works in New York City. A 16-channel soundinstallation spatially re-creates two historic storms that devastated the New York/LongIsland area first through data, then through sound. The resulting turbulent and evocativecompositions allowed listeners to experience geographically scaled events on a humanscale and gain a deeper understanding of some of the more unpredictable complexrhythms and melodies of nature.
Why is scientific data so often presented as visual information and much less oftenpresented as sound? One reason might have to do with time. A still visual image can bescanned over time, allowing a viewer to study various aspects of an image. A soundscapeor piece of music, although it is also temporal, cannot be examined in detail without thedestructive process of stopping, selecting, and replaying various parts. Aspects of thevisual image are also easily defined by viewers. Specific colors and shapes can bedescribed and understood more often than specific notes or musical phrases. Specificsounds also can have a level of ambiguity. Although some sounds are easily identified(like a barking dog or a cat's meow for example) the source of other sounds are not quiteas clear. If noise or an echo interacts with a sound, it is like looking at a visual imagewearing glasses that are heavily fogged, making recognition more difficult.
However, unlike a still visual image, music and soundscapes are inherently narrative. Forexample, as I listen to footsteps and voices outside my apartment door, I can determinethat two people are walking up the stairs of my apartment building. I can determineapproximately what floor they are on and even gather a little information about theirrelationship (are they a couple? a mother and child? have they been recently arguing orlaughing?) In a visual image, a photograph of a family for example, unless the emotionalstates of the subjects are highly exaggerated, an observer is likely to encounter a certainamount of ambiguity in determining the relationships between the subjects.
Can an enhanced narrative and emotional content enhance the understanding ofmeteorological data? Some meteorologists call themselves 'storm hunters'. They travel farand wide at considerable physical risk in order to experience a hurricane or tornado. Is itbecause the physical and emotional exhilaration enhances the scientist's understanding ofthe storm? The storms hunters would most certainly answer in the affirmative. Theyexperience the sound, scale, and physical properties of the storm as well as its direct

effect on the environment. A storm experienced only through visualization, whetheranimated or static, does not convey this visceral information. Scientists must use
their imagination to create a mental image of a storm's potential devastation. A sonicexperience of a storm can benefit communities beyond the meteorologist's lab. If ascientist is alerted by a visceral experience that a storm is likely to cause destruction,communities may be more quickly notified to prepare a proper response to the storm.
Our work represents a part of a growing movement in data sonification research. In 1997,The Sonification Report was prepared for the National Science Foundation by membersof the International Community for Auditory Display (ICAD).[3] This report provides anoverview of the current status of sonification research and proposes a research agenda.Most significantly to us as interdisciplinary collaborators, the report stressed the need forinterdisciplinary research and interaction. Our project is well-suited to sonificationaccording to the findings of ICAD. The data sets produced by MASS are extremely largeand complex, and although there are a variety of visualization tools in use to interpret thedata, much of the data represented is not visual in nature (temperature and atmosphericpressure for example). The data represented often portrays complex changes over time,an aspect of data particularly suited for sonification.
My personal interest in data sonification is in the artistic creation of new languages ofdata interpretation. As individuals and groups are faced with the interpretation of moreand more large data sets, a language or series of languages for communicating this massof data needs to evolve. Data interpreted as sound can communicate emotional content,and I am particularly interested in the sonification of data related to the atmosphere andthe weather because of the long history of the weather used as a metaphor for emotion inthe arts.
2 Project Planning
The project began when I met Dr. Van Knowe in the summer of 2001 at the first meetingof Bridges, an International Consortium on Collaboration in Art and Technology, a jointproject of The USC Annenberg Center for Communication & The Banff Centre for theArts New Media Institute [4]. Dr Van Knowe had joined MESO as a Senior ResearchScientist after 24 years as a meteorologist for the Air Force. He was Chief ofMeteorology at Rome Lab in New York where he directed the meteorological aspects ofall research and was chief of the modeling and simulation development branch for the AirForce's Combat Climatology Center (AFCCC) at Scott AFB, IL.
Dr. Van Knowe and I brainstormed at that meeting and then continued to communicatevia email and telephone to develop a project plan. After developing a proposal and beinginvited to participate in one of the first spatialized sound production residencies at Engine27 to create a storm sonification, we met at MESO to plan the project. We wanted tocreate a spatial sonification of one or more storms that occurred in the New York area inthe recent past in the hopes that some members of the audience would remember the

specific storms.
Dr. Van Knowe and Dr. John Zack of MESO suggested we try to create a sonification ofa major winter snowstorm that in 1979 was not foreseen by the existing meteorologicalmodels and inspired years of research and development into improving the models. The"President's Day Snowstorm" initially formed as a weak wave of surface low pressure ona front in the Gulf of Mexico on 18 February 1979. Since this storm was not predicted bythe existing meteorological models of the time, a large amount of data on this storm wasavailable.
Later, Dr Van Knowe found a strong tropical Hurricane, Hurricane Bob, that passedthough the same coastal region. We decided to attempt to sonify two storms that have avery different physical structure to see if the sonifications would yield insight into thenature of these two different types of storms.
3 Modeling the Storms for Spatialized Sound
Since the Engine 27 space has a very specific and unusual 16-channel speakerarrangement, we decided to map each speaker to a specific point in space proportional tothe area spanning from Northern Florida to Northern New York State and from theEastern tip of Massachusetts to Western New Jersey with New York City situated nearthe center. Simulated point data was to be modeled for an area of approximately 1000km.This area was mapped to the size and shape of the Engine 27 space. (see figure 1)
The kind of model output needed for sonification was very different that the outputformats already in use by MESO for visualization. Dr. Van Knowe and his colleagues usethe Mesoscale Atmospheric Simulation System (MASS) to create a highly detailedsimulation of the weather based on terrain, initial conditions, and other factors. MASStakes real data inputs from satellite or surface readings and couples the information withglobal and regional models. There are several MASS output file formats: 3D array files,2D horizontal (x-y plane) files, 2D vertical cross sections (x-z plane), 1D x,y simulatedpoint observations, and 1D vertical profile (x,z) simulated point atmospheric soundings.
Our project required files of individual variables output for each geographical point atregular temporal intervals. Dr. Van Knowe and Dr. Kenneth Waight of MESO created acustom piece of software to output the data in this format. Kenneth T. Waight joinedMESO in October 1987 after completing his Ph.D. in atmospheric science at theUniversity of Wyoming. His first three years at MESO were spent on a project funded bythe NASA Marshall Space Flight Center. Dr. Waight relocated to MESO's Troy, NewYork office in 1990 to assist in the development of MESO's real-time operational
mesoscale modeling system.
Dr. Van Knowe then created a complete model of each storm at 5 points of elevation: sealevel, approximately 8500 feet, approximately 18,000 feet, approximately 35,000 feet,and approximately 60,000 feet (or, the top of the atmosphere). Each variable was outputevery three minutes for a 24 hour period of the greatest storm activity. The model gridresolution was 10km. Nine variables were modeled at this stage, but only six variableswere used in the final sound compositions: atmospheric pressure, water vapor, relativehumidity, dew point, temperature, and total wind speed.
4 Creating the Sonifications
After the storms were modeled and the data output, we were left with 720 data files of481 values each and the daunting task of translating these numbers into sound. Engine 27master programmer Matthew Ostrowski joined us at this stage and he and I worked at theEngine 27 space for a period of about four weeks creating a system for reading andtranslating the files to spatialized sound using Max/MSP.
We decided to create a composition of each day’s storm activity in full at each of the fiveelevations. We started by simply and directly mapping each variable to the pitch of asound sample of a distinct timbre. We somewhat arbitrarily used long tones fortemperature and pressure related variables and percussive tones for water relatedvariables. The bank of sound samples used included vocal sounds, sounds created bywind instruments, and environmental sounds including the sounds created by variousinsects. The resulting sound compositions were interesting, but listeners found it difficultto hear the changes in each individual variable.
We then decided to map the total wind speed to the amplitude of the sound. Directlymapping loudness to wind speed for every speaker (every geographic point) created adramatic spatialization effect. The fastest wind speeds, representing the greatest stormactivity, created the most sonic activity and excitement.
However, the combination of timbres was still overwhelming to the listener, limiting thelistener’s ability to make sense of the data. At this point, we decided not to limit thenumber of variables presented through the sonification for the sake of the publicpresentation. Had we been creating the sonifications for research only, at this stage wemight have brought Dr. Van Knowe and his colleagues into the space to listen to andcompare and contrast sound compositions created by single variables. However, therewas a deadline for a public presentation of the work to a general audience andaesthetically we felt that the single variable compositions lacked the fullness necessary toengage a general audience expecting to hear a musical composition.

The first aesthetic choice was to translate the atmospheric pressure data to a very lowfrequency sound. In doing so, listeners lost the ability to hear a detailed melody linedescribing the pressure changes, but gained a visceral sense of the storm.
Then, we began experimenting with using some of the variables as filter variables forsound samples representing other variables. Some of the variables in the model werehighly coupled or inversely related to other variables. We created a band-pass filter thatfiltered a sound representing temperature with dew point values and filtered water vaporwith relative humidity values. We found at this point that we needed to choose soundswith a wide spectrum in order to hear the filtering most effectively. White noise has thewidest spectrum, and selecting ‘noisy’ sound samples proved the most effective incommunicating the data and also was the most effective aesthetically due to the variationin the resulting sounds.
The scaling of the data for sonification presented particular challenges. Although theoverall wind speeds varied with elevation levels, we decided to use global scaling forwind speed. This created the effect of the compositions building and receding inintensity. However, using global scaling for variables such as temperature mapped topitch or water vapor mapped to a band pass filter proved to be much less dramatic thatcreating a scaling system for each elevation level of each storm since the variablesdiffered widely between levels.
Finally, since the sonifications were to be performed in the format of a spatialized soundinstallation, we developed a daily schedule in which various compositions present thedata sets at the five elevations, moving from ground level to the top of the atmosphere. Inthe installation, each storm was performed for approximately 1/2 hour six times each day.A storm consisted of six approximately five minute compositions presenting all variablesat a single elevation and one combination of elevations based on the heights of thespeakers. These compositions were marked by a number of ringing bell sounds, markingtime and elevation like the ringing of church bells.
Conclusion
The final compositions were well received by both the general and the scientificaudiences. Visitors to the installation particularly enjoyed remembering where they wereduring Hurricane Bob and the President’s Day snowstorm while listening to thesonifications. Some audience members found a metaphorical meaning in the series ofrising elevations, finding the compositions nearer to the ground to be more visceral whilethose compositions representing activity closer to the top of the atmosphere were felt tobe more ethereal and spiritual.
Dr. Van Knowe was particularly intrigued by the spatialization of the sound, and wasinterested in how the wave patterns of the storms were moving in space. Thesonifications reinforced some known aspects of the particular storms. The winter stormwas more intense near the top of the atmosphere while the hurricane’s fastest wind speedsoccurred at lower elevations. This change in intensity was communicated very clearlythrough the varying degrees of loudness of the compositions. The patterns of movementof the tropical hurricane were known to be more chaotic than the winter storm, and theresulting compositions also reinforced this concept. Most listeners found that they couldunderstand more the more they listened to the compositions, and there was an overallconsensus that the work opens up doors for more research both in science and the arts.
Andrea Polli
References
[1] Murphy, Francis. Ed. “Proud Music of the Storm” from Walt Whitman: The Complete Poems NewYork: Viking Press; Reprint edition, 1990.[2]POLLI, Andrea, and VAN KNOWE, Glenn, Atmospherics/Weather Works: The Sonification ofMeteorological Data. 2003. /studio/atmospherics[3]KRAMER, Gregory et. al, The Sonification Report: Status of the Field and Research Agenda, 1997.Available from http://www.icad.org/websiteV2.0/references/nsf.html[4] The USC Annenberg Center for Communication & The Banff Centre for the Arts New Media Institute,Bridges: International Consortium on Collaboration in Art and Technology, 2001.

Remote control surveillanceprobe, C5, 1998
IV Software Development Platforms for Large Datasets:Artists at the API
Brett Stalbaum
C5 Corporationwww.c5corp.com
In 1998, C5 had a problem; two problems actually.
We had organized that year as a business without amodel to do a data collection and analysis project atSIGGRAPH 98, called the Remote ControlSurveillance Probe project.i The impetus for thefounding of C5 was to see what kinds of businessopportunities were available to a collaborative groupof artists and theorists already working for manyyears with information as our primary medium. Theexpertise of C5 members was brought under oneumbrella to tackle problems in domains relative toour collective experience, which includes autopoietictheory, artificial intelligence, information systemsdesign and programming, public relations, emergent behavioral systems, semiotics,literary criticism, military studies, library science, and fine art.
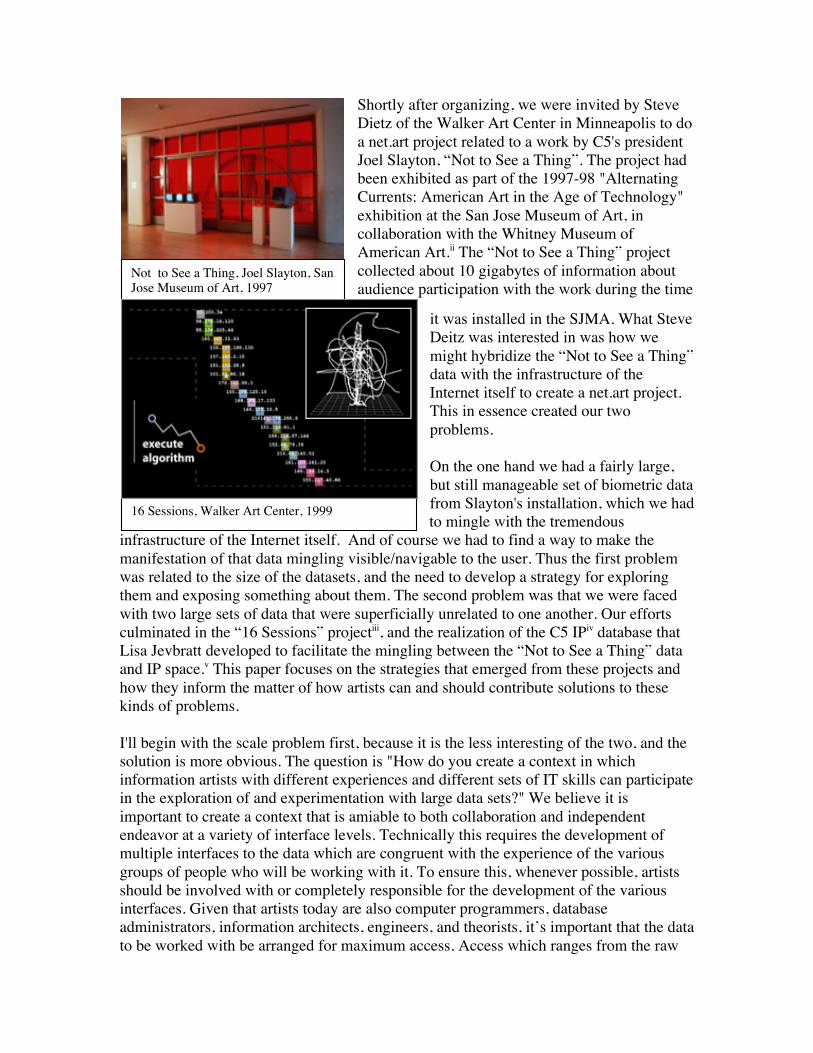
Not to See a Thing, Joel Slayton, SanJose Museum of Art, 1997
16 Sessions, Walker Art Center, 1999
Shortly after organizing, we were invited by SteveDietz of the Walker Art Center in Minneapolis to doa net.art project related to a work by C5's presidentJoel Slayton, “Not to See a Thing”. The project hadbeen exhibited as part of the 1997-98 "AlternatingCurrents: American Art in the Age of Technology"exhibition at the San Jose Museum of Art, incollaboration with the Whitney Museum ofAmerican Art.ii The “Not to See a Thing” projectcollected about 10 gigabytes of information aboutaudience participation with the work during the time
it was installed in the SJMA. What SteveDeitz was interested in was how wemight hybridize the “Not to See a Thing”data with the infrastructure of theInternet itself to create a net.art project.This in essence created our twoproblems.
On the one hand we had a fairly large,but still manageable set of biometric datafrom Slayton's installation, which we hadto mingle with the tremendous
infrastructure of the Internet itself. And of course we had to find a way to make themanifestation of that data mingling visible/navigable to the user. Thus the first problemwas related to the size of the datasets, and the need to develop a strategy for exploringthem and exposing something about them. The second problem was that we were facedwith two large sets of data that were superficially unrelated to one another. Our effortsculminated in the “16 Sessions” projectiii, and the realization of the C5 IPiv database thatLisa Jevbratt developed to facilitate the mingling between the “Not to See a Thing” dataand IP space.v This paper focuses on the strategies that emerged from these projects andhow they inform the matter of how artists can and should contribute solutions to thesekinds of problems.
I'll begin with the scale problem first, because it is the less interesting of the two, and thesolution is more obvious. The question is "How do you create a context in whichinformation artists with different experiences and different sets of IT skills can participatein the exploration of and experimentation with large data sets?" We believe it isimportant to create a context that is amiable to both collaboration and independentendeavor at a variety of interface levels. Technically this requires the development ofmultiple interfaces to the data which are congruent with the experience of the variousgroups of people who will be working with it. To ensure this, whenever possible, artistsshould be involved with or completely responsible for the development of the variousinterfaces. Given that artists today are also computer programmers, databaseadministrators, information architects, engineers, and theorists, it’s important that the datato be worked with be arranged for maximum access. Access which ranges from the raw

SoftSub, Refresh: The Art of the Screen Saver - StanfordUniverisity - Palo Alto, California, 2000
Output from the C5 Landscape database, 2002
data (files or database interface), allthe way through standard userinterfaces that highly mediateaccess to the data through endvisualizations at the presentationlayer. In between these extremes,artists should have access to the allof the API'svi and middlewarelayers, and preferably beresponsible, for the development ofthese layers. Working on “16Sessions”, and in subsequentsoftware projects such as“SoftSub”vii, C5 had in place peoplewith experience in all of these
layers of software development, and importantly experience working with each other, sothe process was relatively smooth. Of course, this is not the situation with larger sets ofinstitutionally collected data, where the standards, data formats, and API's can often bequite obtuse.viii
Different challenges exist with theemergence of large collections ofpublic data such as is available fromthe United States GeologicalSurvey, NASA, NOAA, and theHuman Genome Project. Not onlychallenges presented by thetechnical sophistication of the dataand the tremendous size of the data,but in strategizing appropriateinterfaces to the data that allowusers of very diverse backgrounds toparticipate in the process ofconsuming the data and generatingnew knowledge from the data. C5has been active in this area. Forexample, the C5 Landscape databaseis a relational database, Perl API andset of sample interfaces designedspecifically to help users in creatingtheir own programs that can easily access, analyze and display information about theshape of the earth.ix The database is designed to eliminate much of the complexity inacquisition, database interface, processing and imaging common in the manipulation ofgeo-data, so that artists have a manageable platform in which to write their own softwareand perform mapping experiments. Artists using the software can work with the databasefrom various levels of technical sophistication. These levels range from a web-based GUI

Consensual Domain "Cosmology" from acrawler by Geri Wittig for "Mapping theWeb Infome", Lisa Jevbratt, New LangtonArts 2001.
directly through SQL, Perl DBI and Java JDBC programming techniques. An API alsoprovides a variety of features and capabilities through easy to use Perl modules.
There are of course many projects that incorporate the idea of artists working with data atall levels. Notable are Lisa Jevbratt's “Mapping the Web Infome”x, and Rhizome's“alt.interface” projects.xi Rhizome's “alt.interface” project involves exposing (to artists)the database API of the Rhizome website and its large text object collection, such thatthey can create alternative interfaces. Jevbratt's web crawling project is especially notablebecause of the way that she worked with the invited artists to create both an interface forthe 'alternatively' technical artists involved, as well as working at the database and APIlevels with many of the artists to collaboratively implement features suggested by artists.It is appropriate for artists to be involved in the development of the public API's andapplication layer interfaces through which the public at large will have access to largedata, because in many cases artists working collaboratively already have experience inworking out the inherent interface issues that are involved in making data available to
'technically diverse' or even non-technical users. Artists in both new media academia andfine art practice have been involved in this kind of work for many years.
The second issue is a deeper one involvinghow artists have and can contribute to dealingwith inter-relations between very differentdatasets, as well as unexplored intra-relationswithin single large datasets of considerablecomplexity. The exploration of large datasetsis one of the most provocative and interestingissues for artists today because of theexplosion of availability of such large datasets being made available to the public.
Why? Artists as cultural workers have alwayssought to contribute to the state of ourknowledge near the edges of humanunderstanding. Among the new culturalproblems we face today are the problems ofbig data. And lest you assume that this isexclusively the domain of computer science,
the large datasets of today present new kinds of problems which computers and networksare not traditionally used to solve, and perhaps even that the traditional use of computersand networks can not solve. The familiar notion of the "information processing life cycle"is the basis of contemporary data processing. This is the very colonial idea that data is
notion holds that data must be processed into useful information, and to accomplish thisyou normally start by considering the output you want, the available input, and thendetermine the algorithm that will take your raw and untreated data and turn it into amanageable, cognizable, useful thing we call information. The entire field of DataMining and Knowledge Management as we know it today is predicated on the pre-existence of semantic models that allow data to be algorithmically mined for meaning.This is the basic philosophy and approach to data and information, and is of courseprofoundly successful, but its application reaches severe limitations in dealing withcontemporary data and the new kinds of problems it presents.
For example, traditional problem solving is not at all applicable to the situation C5 facedwith “16 Sessions”. We had two very different data sets, and although we had somepreconceptions of what they meant, we had no idea how they were related or if they wererelated, and no clear idea of what kind of question to ask. Neither set of data wascollected with a protocol that was designed to facilitate the type of endeavor that we werecharged with performing. Again, standard information processing techniques are notuseful for all problems, especially when you do not have a question, when you have apoorly formed question, or when the dataset itself is not entirely understood or containsinformation potentials that were unplanned at the time it was collected. Data may havenon-transparent semantics, or may be so complicated that you do not know where tobegin to search, or it may take on new roles as new needs emerge after the data iscollected. These issues are of course also related to the problem of what questions to ask.When you don't understand your data, you will naturally have poorly formed questionsabout it.
Why is this an important problem? The answer is that there is ever more data beingcollected in various endeavors about which we don't know what questions to ask. Forexample, the Human Genome Project has sequenced and published the entire humangenome, but that tremendous data set is largely unexplored, because in part, scientistshave not sought the answers to questions not yet raised. While this may seem quitetautologically obvious, it is simultaneously a tremendous and real problem. As put byLisa Jevbratt, the process of exploring genomic data can be "described as that of a groupof people in a dark room fumbling around not knowing what is in the room, how theroom looks or what they are looking for." Genomic data is non-unique in this respect.There are, for example, vast datasets available from the United States and othergovernments regarding all kinds of interesting things that we don't yet fully understand,or that we think we understand but which has behavior and relations that have beenoverlooked. And artists, who do not always participate in the scientific method, may wellmake discoveries or observations in their aesthetic and conceptual pursuits with such datathat lead to such questions, even if the artists are participating as blind probe heads indata space.
The exploration of such data, I argue, is the most productive and culturally usefulpositions from which to perform as an artist in the 21st century. It is hard now to make

faced with large sets of data without a map nor a clearly defined problem definition is oneof the most interesting and provocative problem types we face in an era where our abilityto collect data outpaces our ability to generate knowledge from it. Asking questions andexploring spaces in poorly defined problem domains consisting of huge datasets is thenatural, useful, and potentially highly productive cultural role in which artists should playa part.
C5's approach to these types of problems is to explore the application of autopoiesis as aconceptual framework for understanding the behavior of data and information.Autopoiesis takes place in systems that differentiate themselves from other systems on acontinual basis through operational closure, and that produce and replace their owncomponents in the process of interaction with their environment (structural coupling),that occurs via a membrane containing the organization of the unity in question, thusallowing distinction between it and its environment. A basic question for any analysis ofthe autopoietic potentials of data involve distinguishing a membrane, or the interface,where operational closure (inside) and structural coupling with an environment (outside)are expressed. It is in patterns of structural coupling that relations between complex datacan be analyzed. If you can find a membrane, you have revealed a relation between orwithin data sets. To find membranes, you need to mingle data. For example, there arecontemporary explorations within the social sciences that demonstrate that relations existcontaining information the landscape (for example drainage, land cover, or topography),can reveal insights when mingled with historical data.xii C5 views these types of dataprocessing explorations as very interesting instances of structural couplingxiii betweendata sets, even those as superficially different as geological and historical data.
Most of C5's approach to autopoietic frameworks for the understanding of large data hasbeen developed by Joel Slayton and Geri Wittig. Perhaps the key idea that emerges fromtheir work is the notion of a composibility of relationsxiv, in that composibility indicatesthe potential for autopoietic membranes existing as data relations via third orderstructural coupling in a coded environment. This allows for the analysis of data setswhere the semantic relationships are uncertain. In a sense, this idea can be described asthe search for algorithms in which superficially different data sets might be shown tocouple based on their subject-less form through inherent sans-semantic or pre-semanticmodels, and to seek these relations specifically to flag the potential for the presence ofimmanent, unplanned, or otherwise unrecognized semantics flowing from mingledrelations, thus revealing something about the ontology of the sets that produces newknowledge about them. It is unlikely that there is a universal algorithm for this, (such as auniversal visualization system for all data), but if there is, it is likely to be accidentallydiscovered by researchers searching for inter-relations between data sets. Obviously,artists should be involved in this endeavor.
This is only one approach, undertaken by a small self-funded organization that believes avery particular theoretical framework can be expressed in coded relations that delivertheir own answers. To explore this, we of course need a lot of data. It is important
that science organizations create the circumstances that will allow a diversity ofindependently theorized approaches to emerge based on public interest in and publicaccess to the data.xv It is in casting large sets of scientific data into the realm of artists,and indeed the public at large, which will allow a multitude of self-organized modes ofdiscovery to develop.
Brett Stalbaum
NOTESFirst Published as:Software Development Platforms for Large Datasets: Artists at the API,Leonardo Electronic Almanac volume 11, number 5, May 2003 ISSN #1071-4391This essay began as speaking notes for a talk of the same title delivered at a rhizome.org event sponsoredby Qbox in San Francisco CA, April 26th 2002. http://rhizome.org/events/rhizome_sf_apr.php3 i http://www.c5corp.com/projects/rcsp/index.shtml
ii http://www.c5corp.com/walker/gateway.html
iii http://www.c5corp.com/projects/16sessions/index.shtml
iv The internet protocol is the numerical addressing scheme used to identify devices on the internet.
v This later became the technical basis for 1:1, http://www.c5corp.com/projects/1to1/index.shtml
vi API is the acronym for application programming interface, which is a group of public functions that exist in a libraryof code that other programmers can make use of to implement their own code. Artists should design API's as well asuse them.
vii http://www.c5corp.com/softsub/index.shtml
viii A good example of this is the Spatial Data Transfer Standard. According to computer scientist Gregg Townsend,"The adoption of SDTS was a giant step backwards. While previous DEM files could be read by relatively simpleprograms, SDTS file are difficult to read even with the help of a large external library."http://www.cs.arizona.edu/topovista/sdts2dem/
ix http://cadre.sjsu.edu/~gis
x http://dma.sjsu.edu/jevbratt/lifelike/
xi http://rhizome.org/interface/
xii For example, see http://fisher.lib.virginia.edu/projects/salem/ The GIS of "Salem Village in 1692" is part of anelectronic Research Archive of primary source materials related to the Salem witch trials of 1692
xiii Wittig, Geri, Expansive Order Situated and Distributed Knowledge Production in Network Space,<http://www.c5corp.com/research/situated_distributed.shtml>
xiv Slayton, Joel and Wittig, Geri Ontology of Organization as System, Switch - the new media journal of the CADREdigital media laboratory, Fall 1999, Vol 5 Num 3, http://switch.sjsu.edu/web/v5n3/F-1.html
xv http://cse.ssl.berkeley.edu/nvo/nvo.htm