ii - the ethiopia embassy in china · web viewit may also be produced from fermented agar, fruit...
TRANSCRIPT
PROFILE ON THE PRODUCTION OF VINEGAR
Table of ContentsI. SUMMARY.............................................................................................................................1II. PRODUCT DESCRIPTION AND APPLICATION...............................................................3III. MARKET STUDY AND PLANT CAPACITY...................................................................3IV. MATERIALS AND INPUTS...............................................................................................7V. TECHNOLOGY AND ENGINEERING.................................................................................9VI. HUMAN RESOURCE AND TRAINING REQUIREMENT............................................15VII. FINANCIAL ANALYSIS..................................................................................................15FINANCIAL ANALYSES SUPPORTING TABLES..................................................................21
ii
I. SUMMARY
This profile envisages the establishment of a plant for the production of vinegar with a capacity
of 20,000 kg per annum. Vinegar is an important condiment and food preservative.
The country`s requirement of vinegar is met through local production and import. The present
(2012) demand for vinegar is estimated at 105,754 litters. The demand for the product is
projected to reach 105,754 litters and 105,754 litters by the years 2017 and 2022, respectively.
The principal raw materials required are fruits, yeast, sugar, colorants and chemicals such as
phosphates, ammonium and potassium salts, potassium meta- bisulphate, etc. Fruits and sugar
are available locally while the other raw materials have to be imported.
The total investment cost of the project including working capital is estimated at Birr 3.93
million. From the total investment cost the highest share (Birr 3.26 million or 82.99%) is
accounted by fixed investment cost followed by pre operation cost (Birr 564.43 thousand or
14.37%) and initial working capital (Birr 103.64 thousand or 2.64%). From the total investment
cost Birr 1.4 million or 34.30% is required in foreign currency.
The project is financially viable with an internal rate of return (IRR) of 23.86% and a net present
value (NPV) of Birr 2.59 million discounted at 10%.
The project can create employment for 13 persons. The establishment of such factory will have a
foreign exchange saving effect to the country by substituting the current imports. The project
will also create forward linkage with the food processing sub sector and backward linkage with
horticulture farming sub sector and sugar producers and also generate income for the
Government in terms of tax revenue and payroll tax.
iii
II. PRODUCT DESCRIPTION AND APPLICATION
Vinegar is an important condiment and preservative which is produced through the action of
acetic acid bacteria on dilute solutions of ethyl alcohol derived from a previous yeast
fermentation in sugar solution or fruit juice.
It may also be produced from fermented agar, fruit juices or other fermented alkali solutions
derived from barley malt, hydrolyzed cereals and starches or other carbohydrates. Vinegar
contains about 4 to 5% acetic acid, coloring matter, salts and few other fermented products
which impart characteristic flavor and aroma to it.
Vinegar is used in food industries for processing of sauce, pickle etc. Thus vinegar has its uses
both in urban households as well as industries, hotels and restaurants.
III. MARKET STUDY AND PLANT CAPACITY
A. MARKET STUDY
1. Past Supply and Present Demand
Vinegar, as an important condiment and preservative, is complementary to vegetables. The
country’s requirement for vinegar has been met through domestic production and import. Later,
IPS study estimated the average annual domestic production of the product at 50,000 liters for
the period 2001-2010. Recent data on domestic production of the product is not, however,
available, although different local brands of the product are exhibited in the shelves of retail
shops, including small merchandise shops, department stores and supermarkets. Therefore,
following the result of IPS’s study, the domestic production of vinegar is estimated at 50,000
liters for the year 2012.
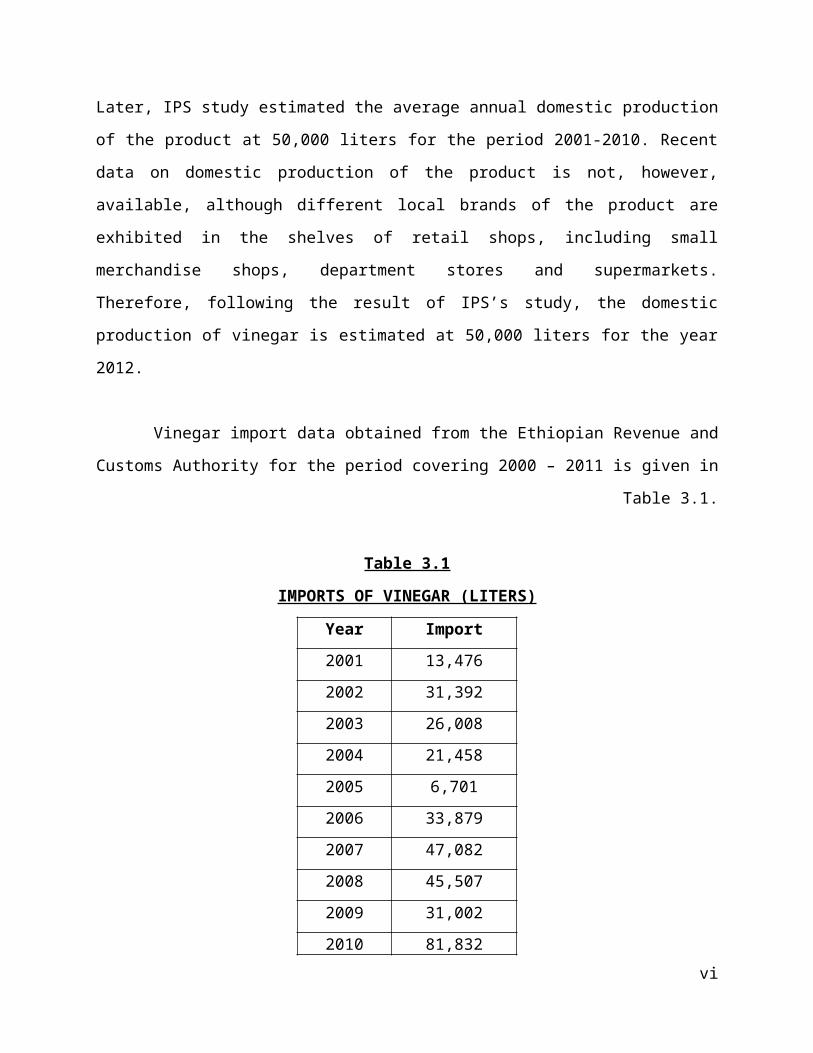
Vinegar import data obtained from the Ethiopian Revenue and Customs Authority for the period
covering 2000 – 2011 is given in Table 3.1.
iv
Table 3.1
IMPORTS OF VINEGAR (LITERS)
Year Import
2001 13,476
2002 31,392
2003 26,008
2004 21,458
2005 6,701
2006 33,879
2007 47,082
2008 45,507
2009 31,002
2010 81,832
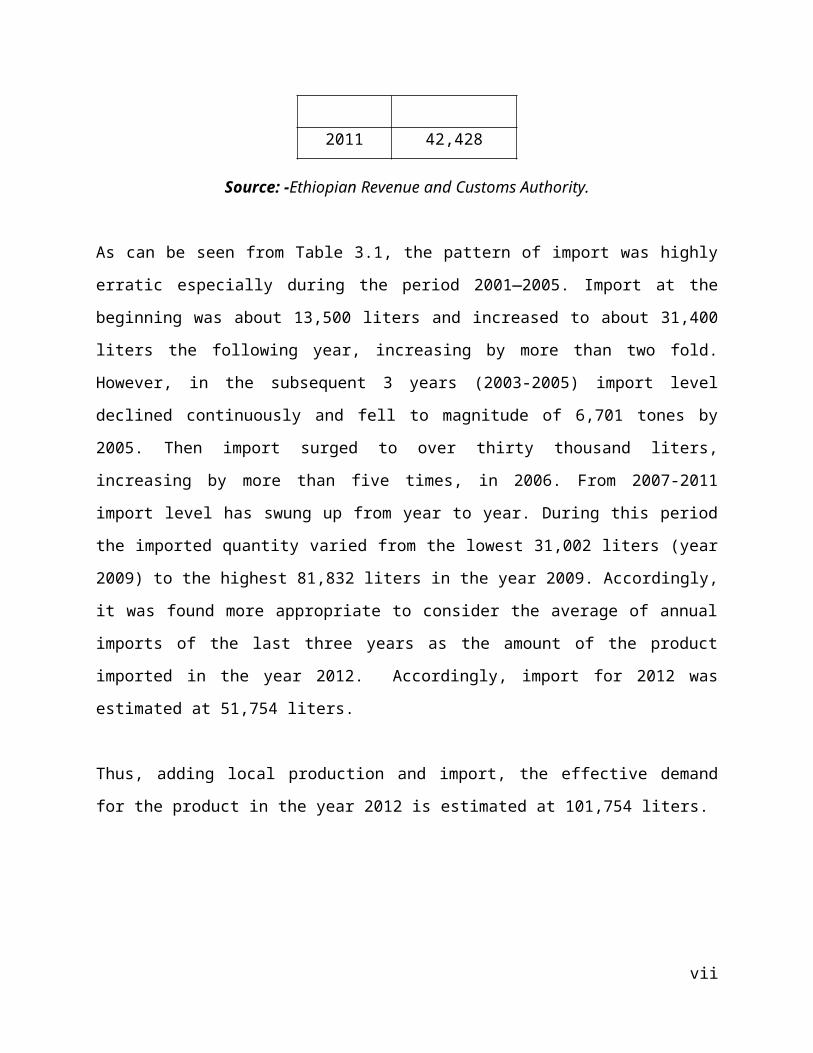
2011 42,428
Source: -Ethiopian Revenue and Customs Authority.
As can be seen from Table 3.1, the pattern of import was highly erratic especially during the
period 2001—2005. Import at the beginning was about 13,500 liters and increased to about
31,400 liters the following year, increasing by more than two fold. However, in the subsequent 3
years (2003-2005) import level declined continuously and fell to magnitude of 6,701 tones by
2005. Then import surged to over thirty thousand liters, increasing by more than five times, in
2006. From 2007-2011 import level has swung up from year to year. During this period the
imported quantity varied from the lowest 31,002 liters (year 2009) to the highest 81,832 liters in
the year 2009. Accordingly, it was found more appropriate to consider the average of annual
imports of the last three years as the amount of the product imported in the year 2012.
Accordingly, import for 2012 was estimated at 51,754 liters.
Thus, adding local production and import, the effective demand for the product in the year 2012
is estimated at 101,754 liters.
v
2. Demand Projection
Demand for vinegar is influenced mainly by urbanization and income. Addis Ababa is a
cosmopolitan city and home to majority of the county’s middle class and a considerable number
of catering establishments. This is favorable for inducing demand for vinegar via demand for
fresh fruits and vegetables. Moreover, growth of regional capitals and other towns will spur
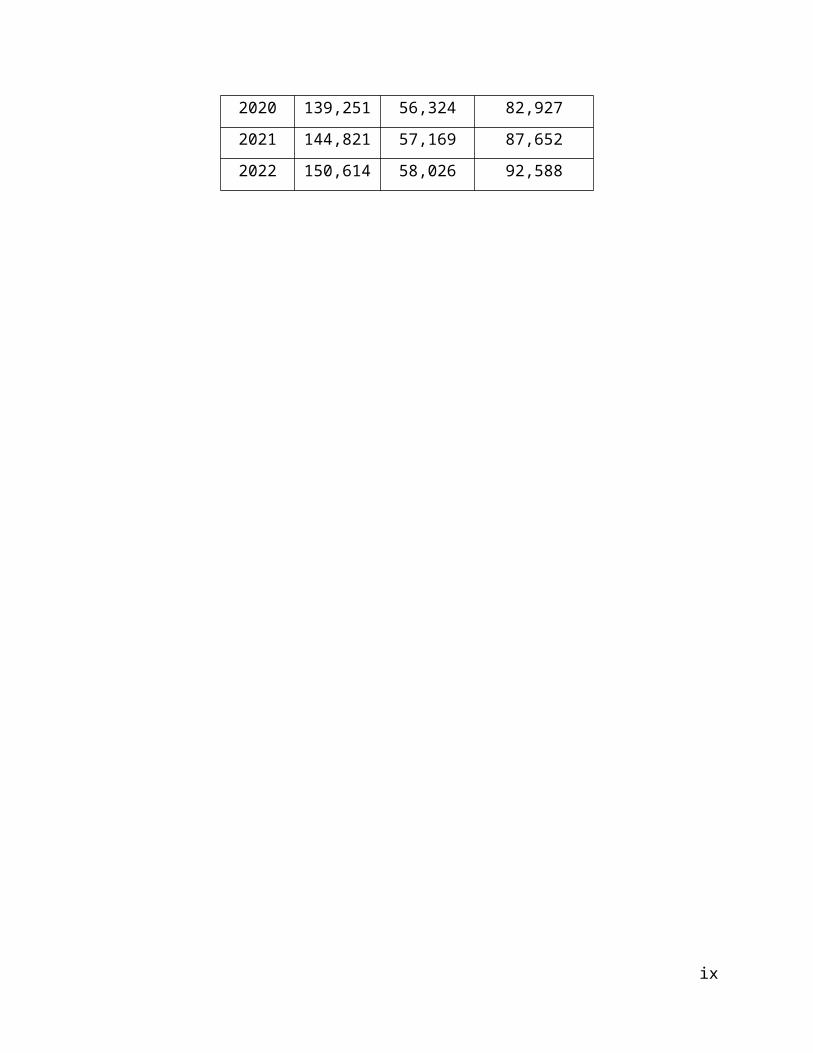
demand for vinegar. Hence, the demand for vinegar is projected making use of the 4% annual
growth rate of the urban population. Assuming the existing vinegar production in the country
will grow by 1.5%, the projected demand and supply gap (unsatisfied demand) for the product
is shown in Table 3.2.
Table 3.2
PROJECTED DEMAND FOR VINEGAR (LITERS)
Year Projected
demand
Existing
production
Unsatisfied Demand
2013 105,824 50,750 55,074
2014 110,057 51,511 58,546
2015 114,459 52,284 62,175
2016 119,037 53,068 65,969
2017 123,798 53,864 69,934
2018 128,745 54,672 74,073
2019 133,895 55,492 78,403
2020 139,251 56,324 82,927
2021 144,821 57,169 87,652
2022 150,614 58,026 92,588
vi
3. Pricing and Distribution
Currently, the average retail price of domestically produced vinegar is Birr 60 per 500 ml bottle.
Allowing margin of 25% for distributors and retailers, a factory gate price of Birr 45 is adopted
for 500 ml vinegar for the envisaged project.
The envisaged project can use the wholesale and retail network, which includes department
stores, merchandise shops and supermarkets as well as direct sales to food processing industries
to distribute its product.
B. PLANT CAPACITY AND PRODUCTION PROGRAM
1. Plant Capacity
Based on the outcome of the market study and considering the minimum economic scale of
production, the plant is proposed to have a capacity of 20,000 liters of vinegar per annum. This
capacity is proposed on the basis of single shift per day and 270 working days per annum. If
demand rises, the capacity can be increased by increasing the production shits.
2. Production Program
Taking the time required by the envisaged plant for market penetration and skill development,
the plant is planned to start operation at 70% of the installed capacity which will grow to 80% in
the second year. Full capacity production will be achieved in the third year and onwards. Details
of the annual production program are shown in Table 3.3.
vii
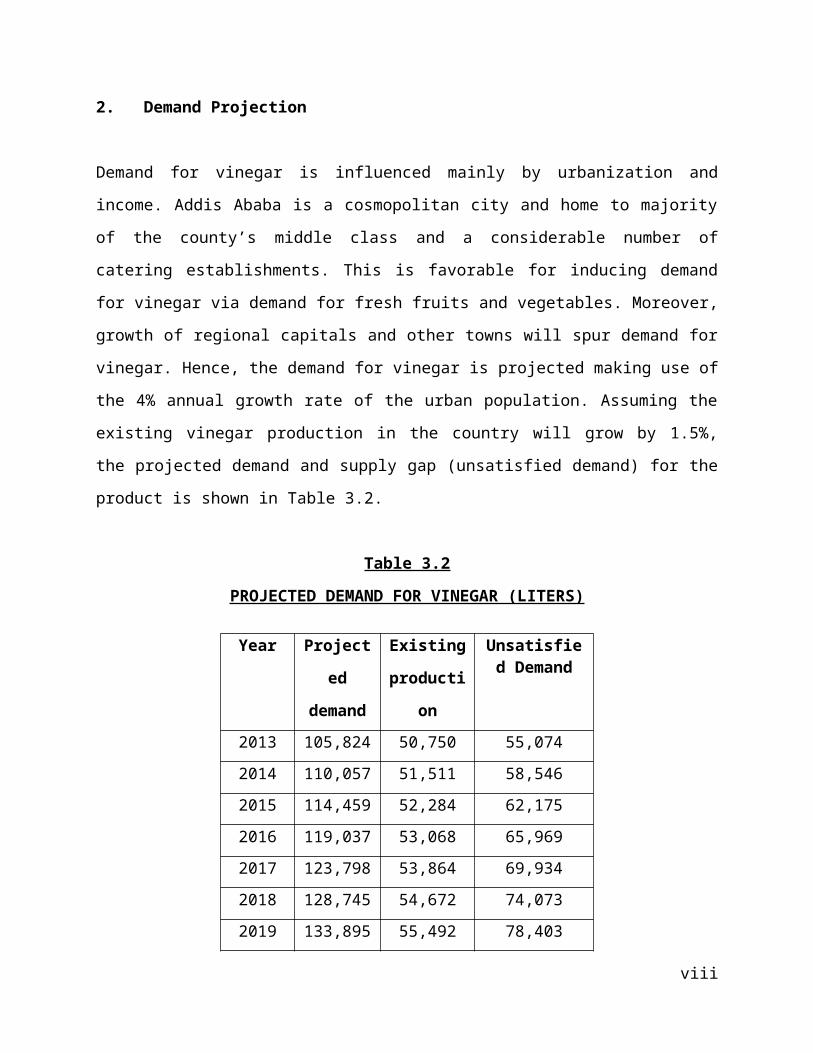
Table 3.3
ANNUAL PRODUCTION PROGRAM
Sr.No.
Description
Unit of Measur
e
Production Year1st 2nd 3rd &
Onwards1 Vinegar lt 14,00
016,00
020,000
2 Capacity utilization
rate
% 70 80 100
IV. MATERIALS AND INPUTS
A. RAW MATERIALS
The major raw materials for the production of vinegar are fruits. Yeast, sugar, colorants and
chemicals such as phosphates, ammonium and potassium salts, potassium meta- bisulphate, etc.
are the other raw materials used in small amount. Fruits and sugar are available locally while the
other raw materials have to be imported. The annual raw materials requirement and the estimated
costs at full capacity operation of the plant are depicted in Table 4.1.
Table 4.1
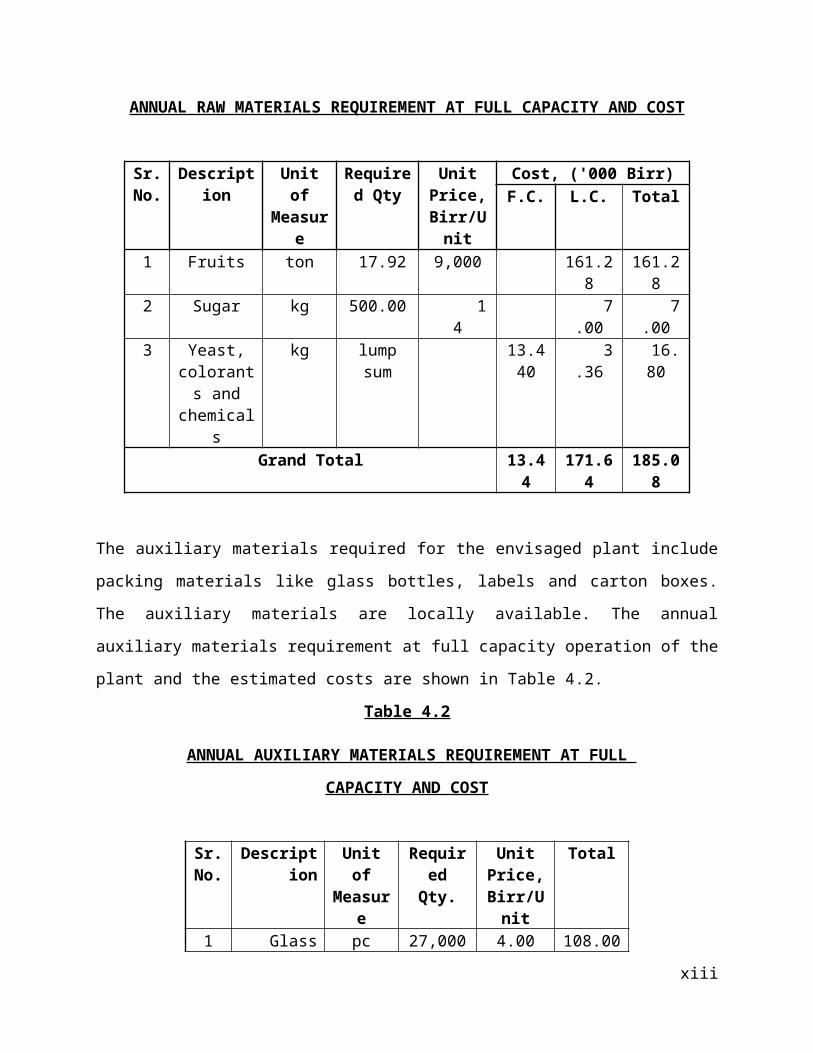
ANNUAL RAW MATERIALS REQUIREMENT AT FULL CAPACITY AND COST
Sr. No.
Description
Unit of Measur
e
Required Qty
Unit Price,
Birr/Unit
Cost, ('000 Birr)F.C. L.C. Total
1 Fruits ton 17.92 9,000 161.28 161.282 Sugar kg 500.00 14 7.00 7.003 Yeast,
colorants and
chemicals
kg lump sum 13.440 3.36 16.80
Grand Total 13.44 171.64 185.08
viii
The auxiliary materials required for the envisaged plant include packing materials like glass
bottles, labels and carton boxes. The auxiliary materials are locally available. The annual
auxiliary materials requirement at full capacity operation of the plant and the estimated costs are
shown in Table 4.2.
Table 4.2
ANNUAL AUXILIARY MATERIALS REQUIREMENT AT FULL
CAPACITY AND COST
Sr. No.
Description
Unit of Measure
Required Qty.
Unit Price,
Birr/Unit
Total
1 Glass bottle pc 27,000 4.00 108.002 Label pc 27,540 0.60 16.523 Carton box pc 1,550 6.00 9.30
Total 133.82
B. UTILITIES
Utilities required for the production of vinegar from fruit are electric power, water and fuel oil.
The annual power and utilities requirement at full capacity operation of the plant and the
estimated costs are given in Table 4.3.
Table 4.3
ANNUAL UTILITIES REQUIREMENT AT FULL CAPACITY AND COST
Sr. No.
Description Unit of Measure
Annual Requiremen
t
Unit Price,
Birr/Unit
Total
1 Electric power
kWh 22,400 0.5778 12.943
2 Water m3 1,000 10.00 10.0003 Fuel oil lt 2,000 14.84 29.680
Total 52.623
ix
V. TECHNOLOGY AND ENGINEERING
A. TECHNOLOGY
1. Production Process
Three distinct processes are involved in the production of vinegar from fruits. Each distinct process is described briefly hereunder.
a) Alcohol Fermentation
Fruit juices and sugar solutions of low concentration ferment of their own accord due to wild
yeast normally present in the fruits and in the atmosphere but this is not desirable because
different yeasts produce different kinds of decomposition products. In order to get good vinegar
it is essential to destroy all these naturally occurring yeasts and other micro organisms by
pasteurization and then to inculcate the sterilized juices thus obtained with pure yeast. Pure wine
is available in the market in a compressed form. A starter is prepared from this by adding to the
fruit and sugar solution to be fermented.
Alcoholic fermentation occurs in two stages. The first is preliminary or the vigorous
fermentation and the second is slow fermentation. During the first 3 - 6 days most of the sugar is
converted into alcohol and carbonates. The second fermentation is much slower and usually
takes 2 - 3 weeks. Under favorable conditions, the fermentation completes in a period ranging
from 72 to 96 hours, completely fermented juice usually exhibits a reading of about zero or less.
When fermentation is complete, the yeasts and the fruit pulp settle to form a compact mass at the
bottom of the cask. The fermented liquid is separated from this sedimentation by siphoning.
b) Acetic Acid Fermentation
Acetic acid fermentation is brought about by acetic acid bacteria called acetobacter. Acetic acid
fermentation should be carried in dark rooms fitted with orange and red glass pans. For acetic
x
acid fermentation, the alcohol content of the fermented liquid is adjusted to 7 - 8% alcohol
because acetic acid bacteria do not function properly at high strength.
c) Ageing
When the vinegar has reached its maximum strength, it must be aged so that it is at its best
quality for table use. The ageing is generally brought about in tanks or in barrels that are kept
full and closed so that destruction of acid by oxidation of the vinegar bacteria will not occur.
The aged vinegar should be blended as per the recipe by adding caramel, colour, etc. and is
filtered. It is then filled in glass bottles and sealed with polypropylene caps. The sealed bottles
are cooled, labeled and packed in cartons for marketing.
2. Environmental Impact
The envisaged plant does not have any pollutant emitted from the production process. Thus, the project is environment friendly.
B. ENGINEERING
1. Machinery and Equipment
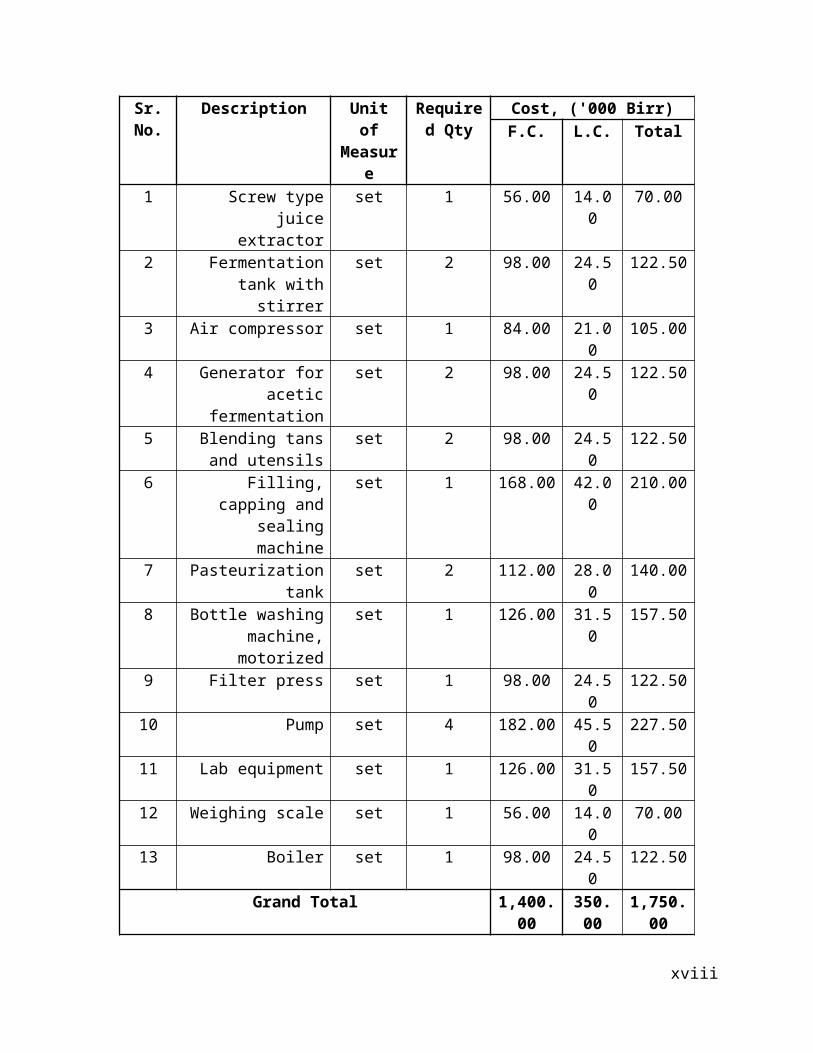
The total cost of plant machinery and equipment is estimated at Birr 1.75 million, out of which
Birr 1.4 million will be required in foreign currency. The list of plant machinery and equipment
required for the envisaged project and the estimated costs are given in Table 5.1.
xi
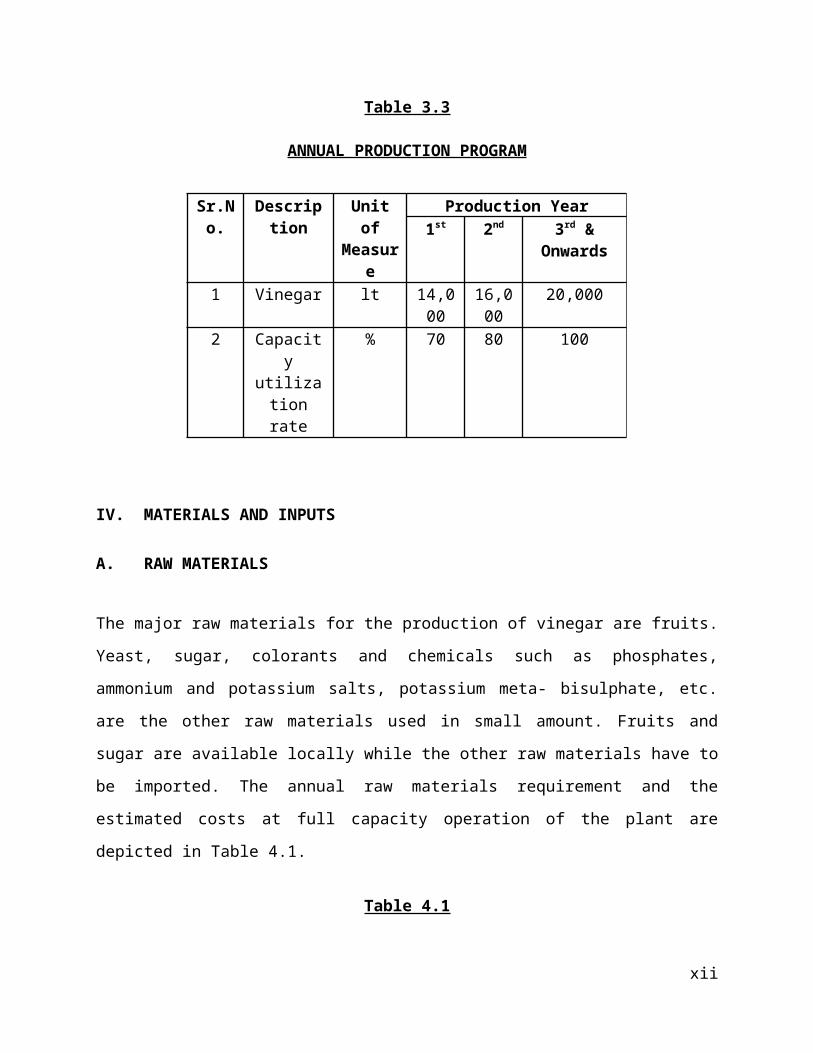
Table 5.1
LIST OF MACHINERY AND EQUIPMENT AND ESTIMATED COST
Sr. No.
Description Unit of Measure
Required Qty
Cost, ('000 Birr)F.C. L.C. Total
1 Screw type juice extractor
set 1 56.00 14.00 70.00
2 Fermentation tank with stirrer
set 2 98.00 24.50 122.50
3 Air compressor set 1 84.00 21.00 105.004 Generator for acetic
fermentationset 2 98.00 24.50 122.50
5 Blending tans and utensils
set 2 98.00 24.50 122.50
6 Filling, capping and sealing machine
set 1 168.00 42.00 210.00
7 Pasteurization tank set 2 112.00 28.00 140.008 Bottle washing
machine, motorizedset 1 126.00 31.50 157.50
9 Filter press set 1 98.00 24.50 122.5010 Pump set 4 182.00 45.50 227.5011 Lab equipment set 1 126.00 31.50 157.5012 Weighing scale set 1 56.00 14.00 70.0013 Boiler set 1 98.00 24.50 122.50
Grand Total 1,400.00 350.00 1,750.00
2. Land, Buildings and Civil Works
The overall area of land required for the envisaged project is about 350 m2, out of which 200 m2
is built - up area. The total cost of buildings and construction, at a rate of Birr 4,500 per m 2, is
estimated at Birr 900,000.
According to the Federal Legislation on the Lease Holding of Urban Land (Proclamation No
721/2004) in principle, urban land permit by lease is on auction or negotiation basis, however,
the time and condition of applying the proclamation shall be determined by the concerned
regional or city government depending on the level of development.
xii
The legislation has also set the maximum on lease period and the payment of lease prices. The
lease period ranges from 99 years for education, cultural research health, sport, NGO , religious
and residential area to 80 years for industry and 70 years for trade while the lease payment
period ranges from 10 years to 60 years based on the towns grade and type of investment.
Moreover, advance payment of lease based on the type of investment ranges from 5% to
10%.The lease price is payable after the grace period annually. For those that pay the entire
amount of the lease will receive 0.5% discount from the total lease value and those that pay in
installments will be charged interest based on the prevailing interest rate of banks. Moreover,
based on the type of investment, two to seven years grace period shall also be provided.
However, the Federal Legislation on the Lease Holding of Urban Land apart from setting the
maximum has conferred on regional and city governments the power to issue regulations on the
exact terms based on the development level of each region.
In Addis Ababa, the City’s Land Administration and Development Authority is directly
responsible in dealing with matters concerning land. However, regarding the manufacturing
sector, industrial zone preparation is one of the strategic intervention measures adopted by the
City Administration for the promotion of the sector and all manufacturing projects are assumed
to be located in the developed industrial zones.
Regarding land allocation of industrial zones if the land requirement of the project is below
5,000 m2 the land lease request is evaluated and decided upon by the Industrial Zone
Development and Coordination Committee of the City’s Investment Authority. However, if the
land request is above 5,000 m2 the request is evaluated by the City’s Investment Authority and
passed with recommendation to the Land Development and Administration Authority for
decision, while the lease price is the same for both cases.
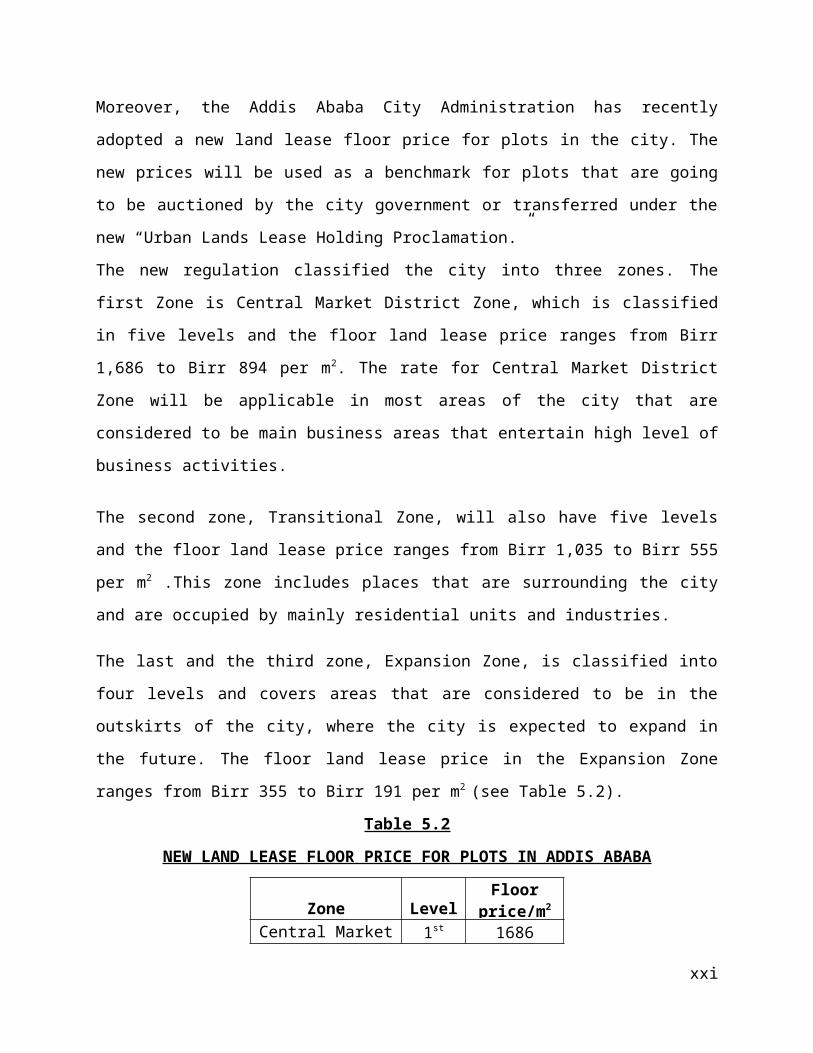
Moreover, the Addis Ababa City Administration has recently adopted a new land lease floor
price for plots in the city. The new prices will be used as a benchmark for plots that are going to
be auctioned by the city government or transferred under the new “Urban Lands Lease Holding
Proclamation.”
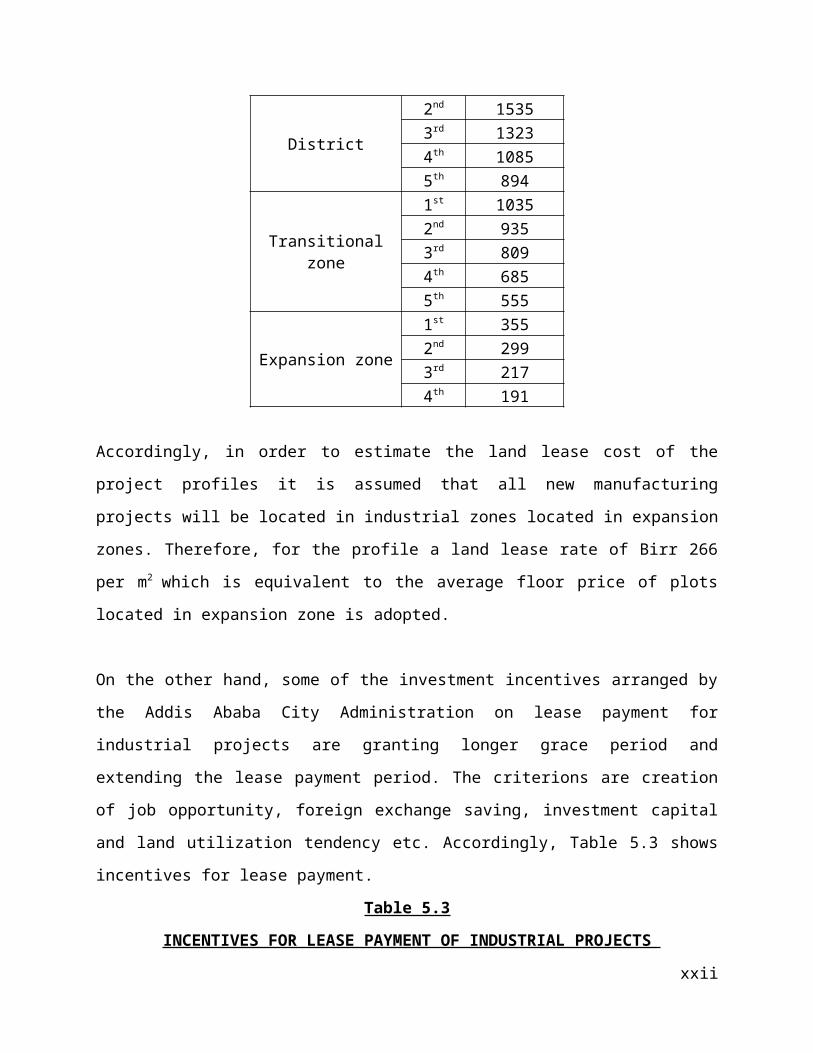
The new regulation classified the city into three zones. The first Zone is Central Market District
Zone, which is classified in five levels and the floor land lease price ranges from Birr 1,686 to
xiii

Birr 894 per m2. The rate for Central Market District Zone will be applicable in most areas of the
city that are considered to be main business areas that entertain high level of business activities.
The second zone, Transitional Zone, will also have five levels and the floor land lease price
ranges from Birr 1,035 to Birr 555 per m2 .This zone includes places that are surrounding the city
and are occupied by mainly residential units and industries.
The last and the third zone, Expansion Zone, is classified into four levels and covers areas that
are considered to be in the outskirts of the city, where the city is expected to expand in the future.
The floor land lease price in the Expansion Zone ranges from Birr 355 to Birr 191 per m2 (see
Table 5.2).
Table 5.2
NEW LAND LEASE FLOOR PRICE FOR PLOTS IN ADDIS ABABA
Zone LevelFloor
price/m2
Central Market District
1st 16862nd 15353rd 13234th 10855th 894
Transitional zone
1st 10352nd 9353rd 8094th 6855th 555
Expansion zone
1st 3552nd 2993rd 2174th 191
Accordingly, in order to estimate the land lease cost of the project profiles it is assumed that all
new manufacturing projects will be located in industrial zones located in expansion zones.
Therefore, for the profile a land lease rate of Birr 266 per m2 which is equivalent to the average
floor price of plots located in expansion zone is adopted.
xiv
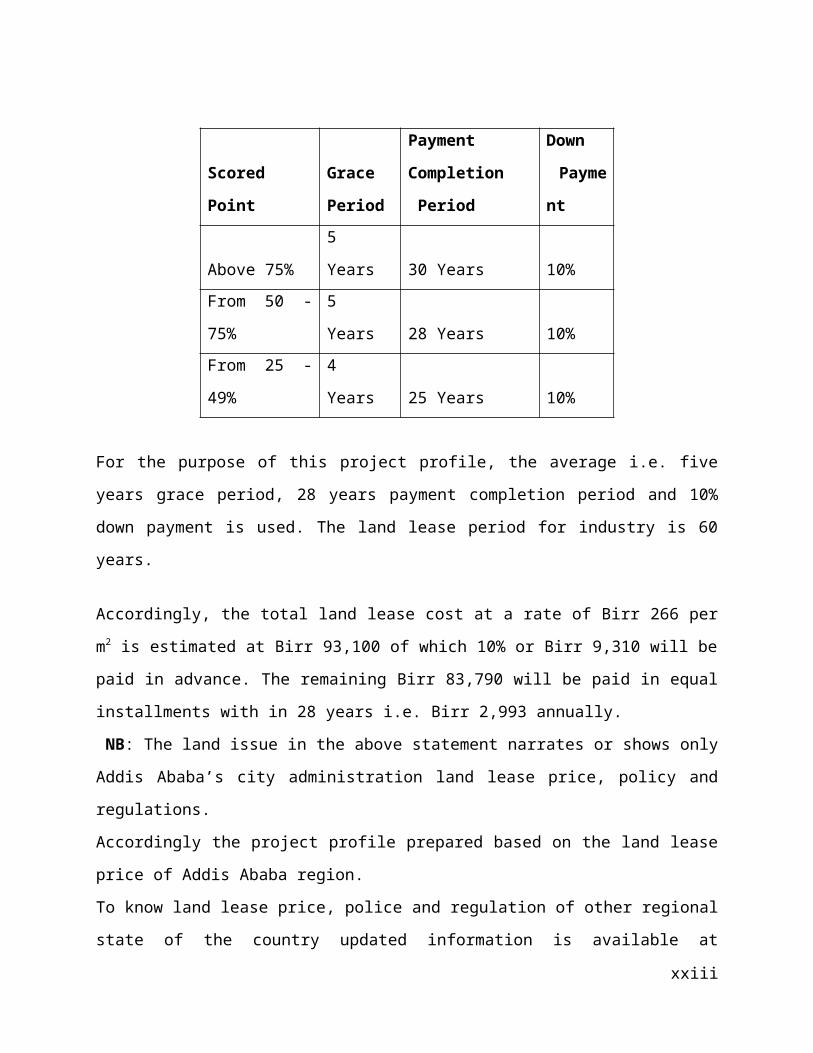
On the other hand, some of the investment incentives arranged by the Addis Ababa City
Administration on lease payment for industrial projects are granting longer grace period and
extending the lease payment period. The criterions are creation of job opportunity, foreign
exchange saving, investment capital and land utilization tendency etc. Accordingly, Table 5.3
shows incentives for lease payment.
Table 5.3
INCENTIVES FOR LEASE PAYMENT OF INDUSTRIAL PROJECTS
Scored Point
Grace
Period
Payment
Completion
Period
Down
Paymen
t
Above 75% 5 Years 30 Years 10%
From 50 - 75% 5 Years 28 Years 10%
From 25 - 49% 4 Years 25 Years 10%
For the purpose of this project profile, the average i.e. five years grace period, 28 years payment
completion period and 10% down payment is used. The land lease period for industry is 60
years.
Accordingly, the total land lease cost at a rate of Birr 266 per m2 is estimated at Birr 93,100 of
which 10% or Birr 9,310 will be paid in advance. The remaining Birr 83,790 will be paid in
equal installments with in 28 years i.e. Birr 2,993 annually.
NB: The land issue in the above statement narrates or shows only Addis Ababa’s city
administration land lease price, policy and regulations.
Accordingly the project profile prepared based on the land lease price of Addis Ababa region.
To know land lease price, police and regulation of other regional state of the country updated
information is available at Ethiopian Investment Agency’s website www.eia.gov.et on the factor
cost.
xv
VI. HUMAN RESOURCE AND TRAINING REQUIREMENT
A. HUMAN RESOURCE REQUIREMENT
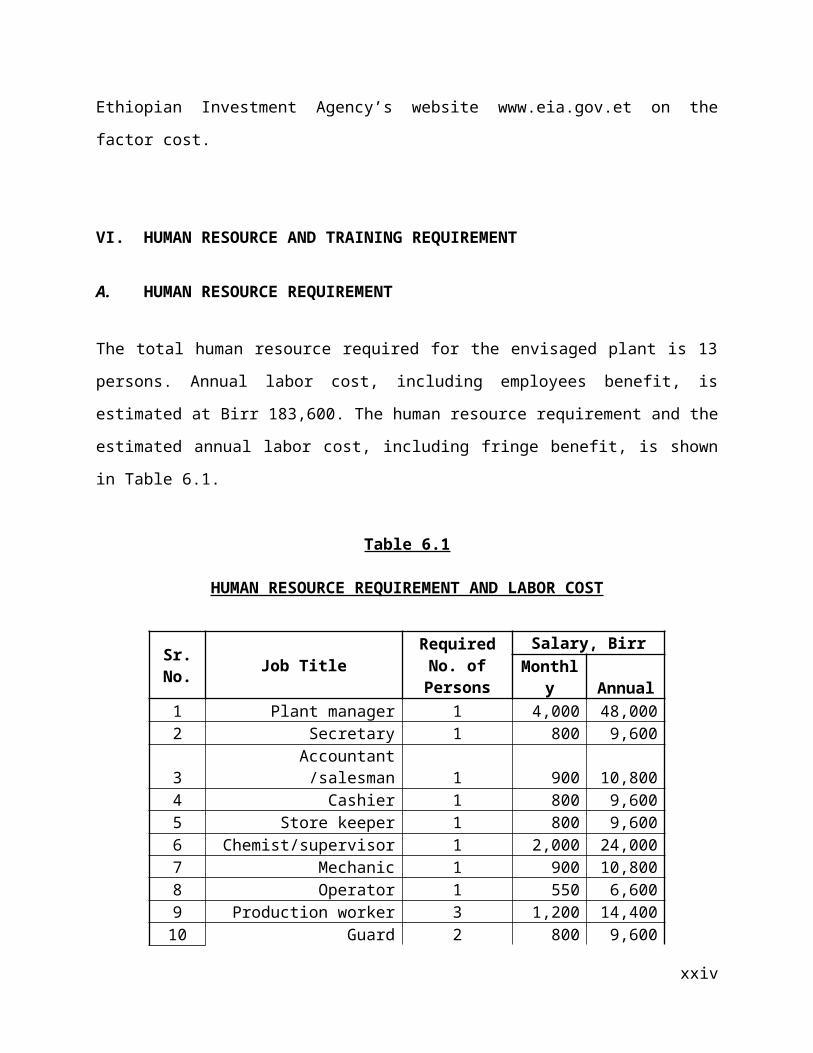
The total human resource required for the envisaged plant is 13 persons. Annual labor cost,
including employees benefit, is estimated at Birr 183,600. The human resource requirement and
the estimated annual labor cost, including fringe benefit, is shown in Table 6.1.
Table 6.1
HUMAN RESOURCE REQUIREMENT AND LABOR COST
Sr. No. Job Title Required No.
of PersonsSalary, Birr
Monthly Annual1 Plant manager 1 4,000 48,0002 Secretary 1 800 9,6003 Accountant /salesman 1 900 10,8004 Cashier 1 800 9,6005 Store keeper 1 800 9,6006 Chemist/supervisor 1 2,000 24,0007 Mechanic 1 900 10,8008 Operator 1 550 6,6009 Production worker 3 1,200 14,40010 Guard 2 800 9,600
Sub - total 13 12,750 153,000Employees benefit, 20% of basic salary 2,550 30,600
Total 15,300 183,600
B. TRAINING REQUIREMENT
One chemist, a mechanic and an operator need to be given a 3 weeks training on processing,
operation and maintenance of machinery during the erection and commissioning period by an
advanced technician of the machinery supplier. The training cost is estimated at Birr 120,000.
VII. FINANCIAL ANALYSIS
xvi
The financial analysis of the vinegar project is based on the data presented in the previous
chapters and the following assumptions:-
Construction period 1 yearSource of finance 30 % equity & 70 loanTax holidays 3 yearsBank interest 10%Discount cash flow 10%Accounts receivable 30 daysRaw material local 30 daysRaw material imported 120 daysWork in progress 1 dayFinished products 30 daysCash in hand 5 daysAccounts payable 30 daysRepair and maintenance 5% of machinery cost
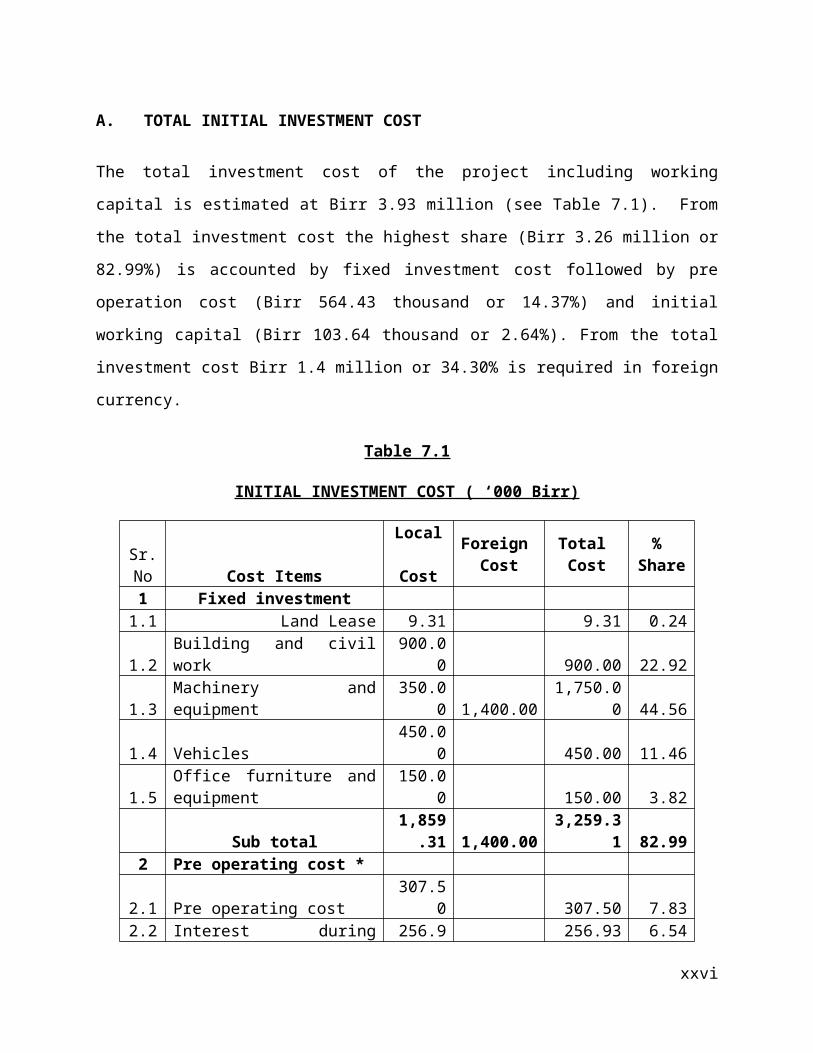
A. TOTAL INITIAL INVESTMENT COST
The total investment cost of the project including working capital is estimated at Birr 3.93
million (see Table 7.1). From the total investment cost the highest share (Birr 3.26 million or
82.99%) is accounted by fixed investment cost followed by pre operation cost (Birr 564.43
thousand or 14.37%) and initial working capital (Birr 103.64 thousand or 2.64%). From the total
investment cost Birr 1.4 million or 34.30% is required in foreign currency.
Table 7.1
INITIAL INVESTMENT COST ( ‘000 Birr)
Sr. No Cost Items
Local Cost
Foreign Cost
Total Cost
% Share
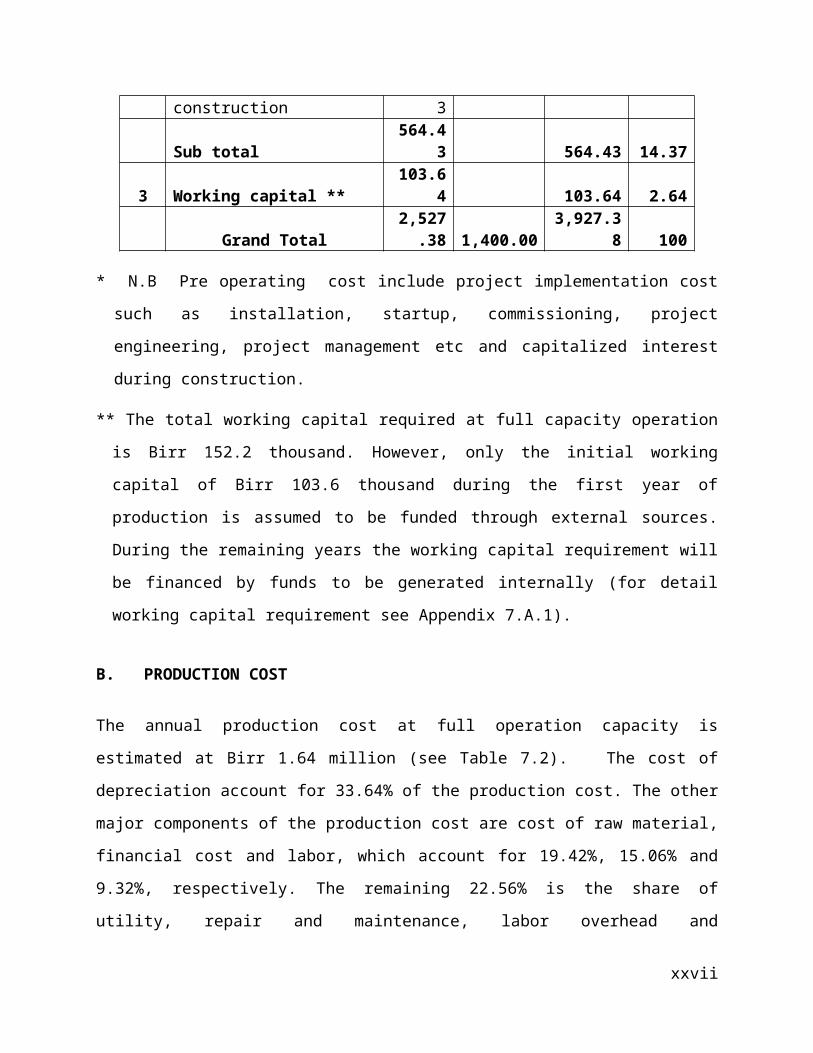
1 Fixed investment 1.1 Land Lease 9.31 9.31 0.241.2 Building and civil work 900.00 900.00 22.921.3 Machinery and equipment 350.00 1,400.00 1,750.00 44.561.4 Vehicles 450.00 450.00 11.461.5 Office furniture and equipment 150.00 150.00 3.82 Sub total 1,859.31 1,400.00 3,259.31 82.992 Pre operating cost *
2.1 Pre operating cost 307.50 307.50 7.832.2 Interest during construction 256.93 256.93 6.54
xvii
Sub total 564.43 564.43 14.373 Working capital ** 103.64 103.64 2.64 Grand Total 2,527.38 1,400.00 3,927.38 100
* N.B Pre operating cost include project implementation cost such as installation, startup,
commissioning, project engineering, project management etc and capitalized interest during
construction.
** The total working capital required at full capacity operation is Birr 152.2 thousand. However,
only the initial working capital of Birr 103.6 thousand during the first year of production is
assumed to be funded through external sources. During the remaining years the working
capital requirement will be financed by funds to be generated internally (for detail working
capital requirement see Appendix 7.A.1).
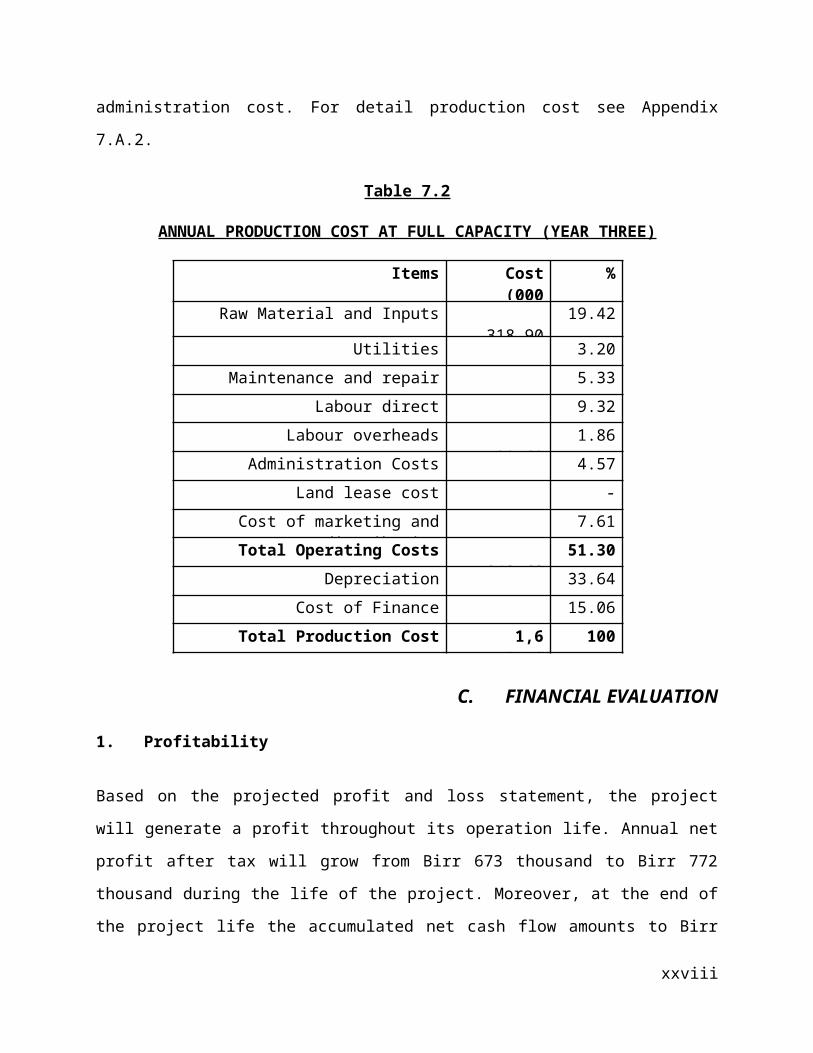
B. PRODUCTION COST
The annual production cost at full operation capacity is estimated at Birr 1.64 million (see Table
7.2). The cost of depreciation account for 33.64% of the production cost. The other major
components of the production cost are cost of raw material, financial cost and labor, which
account for 19.42%, 15.06% and 9.32%, respectively. The remaining 22.56% is the share of
utility, repair and maintenance, labor overhead and administration cost. For detail production
cost see Appendix 7.A.2.
Table 7.2
ANNUAL PRODUCTION COST AT FULL CAPACITY (YEAR THREE)
Items Cost(000 Birr)
%
Raw Material and Inputs 318.90 19.42
Utilities 52.62 3.20
Maintenance and repair 87.50 5.33
Labour direct 153.00 9.32
Labour overheads 30.60 1.86
Administration Costs 75.00 4.57
xviii
Land lease cost - -
Cost of marketing and distribution 125.00 7.61
Total Operating Costs 842.62 51.30
Depreciation 552.50 33.64
Cost of Finance 247.30 15.06
Total Production Cost 1,642.42 100
C. FINANCIAL EVALUATION
1. Profitability
Based on the projected profit and loss statement, the project will generate a profit throughout its
operation life. Annual net profit after tax will grow from Birr 673 thousand to Birr 772 thousand
during the life of the project. Moreover, at the end of the project life the accumulated net cash
flow amounts to Birr 6.31 million. For profit and loss statement and cash flow projection see
Appendix 7.A.3 and 7.A.4, respectively.
2. Ratios
In financial analysis financial ratios and efficiency ratios are used as an index or yardstick for
evaluating the financial position of a firm. It is also an indicator for the strength and weakness of
the firm or a project. Using the year-end balance sheet figures and other relevant data, the most
important ratios such as return on sales which is computed by dividing net income by revenue,
return on assets (operating income divided by assets), return on equity (net profit divided by
equity) and return on total investment (net profit plus interest divided by total investment) has
been carried out over the period of the project life and all the results are found to be satisfactory.
3. Break-even Analysis
The break-even analysis establishes a relationship between operation costs and revenues. It
indicates the level at which costs and revenue are in equilibrium. To this end, the break-even
point for capacity utilization and sales value estimated by using income statement projection are
computed as followed.
xix
Break- Even Sales Value = Fixed Cost + Financial Cost = Birr 840,000
Variable Margin ratio (%)
Break- Even Capacity utilization = Break -even Sales Value X 100 = 52.83%
Sales revenue
4. Pay-back Period
The pay- back period, also called pay – off period is defined as the period required for recovering
the original investment outlay through the accumulated net cash flows earned by the project.
Accordingly, based on the projected cash flow it is estimated that the project’s initial investment
will be fully recovered within 4 years.
5. Internal Rate of Return
The internal rate of return (IRR) is the annualized effective compounded return rate that can be
earned on the invested capital, i.e., the yield on the investment. Put another way, the internal rate
of return for an investment is the discount rate that makes the net present value of the
investment's income stream total to zero. It is an indicator of the efficiency or quality of an
investment. A project is a good investment proposition if its IRR is greater than the rate of return
that could be earned by alternate investments or putting the money in a bank account.
Accordingly, the IRR of this project is computed to be 23.86% indicating the viability of the
project.
6. Net Present Value
Net present value (NPV) is defined as the total present (discounted) value of a time series of cash
flows. NPV aggregates cash flows that occur during different periods of time during the life of a
project in to a common measuring unit i.e. present value. It is a standard method for using the
time value of money to appraise long-term projects. NPV is an indicator of how much value an
xx
investment or project adds to the capital invested. In principle, a project is accepted if the NPV is
non-negative.
Accordingly, the net present value of the project at 10% discount rate is found to be Birr 2.59
million which is acceptable. For detail discounted cash flow see Appendix 7.A.5.
D. ECONOMIC AND SOCIAL BENEFITS
The project can create employment for 13 persons. The project will generate Birr 1.55 million in
terms of tax revenue. The establishment of such factory will have a foreign exchange saving
effect to the country by substituting the current imports. The project will also create forward
linkage with the food processing sub sector and backward linkage with horticulture farming sub
sector and sugar producers. The project will also generate income for the Government in terms of
payroll tax.
xxi
Appendix 7.AFINANCIAL ANALYSES SUPPORTING TABLES
xxii
Appendix 7.A.1NET WORKING CAPITAL ( in 000 Birr)
Items Year 2 Year 3 Year 4 Year 5 Year 6 Year 7 Year 8 Year 9 Year 10 Year 11
Total inventory 59.79 67.77 79.73 79.73 79.73 79.73 79.73 79.73 79.73 79.73
Accounts receivable 55.27 61.25 70.22 70.22 70.47 70.47 70.47 70.47 70.47 70.47
Cash-in-hand 3.61 4.09 4.81 4.81 4.85 4.85 4.85 4.85 4.85 4.85
CURRENT ASSETS 118.67 133.10 154.75 154.75 155.04 155.04 155.04 155.04 155.04 155.04
Accounts payable 15.03 17.04 20.04 20.04 20.04 20.04 20.04 20.04 20.04 20.04
CURRENT LIABILITIES 15.03 17.04 20.04 20.04 20.04 20.04 20.04 20.04 20.04 20.04
TOTAL WORKING CAPITAL 103.64 116.06 134.71 134.71 135.00 135.00 135.00 135.00 135.00 135.00
22
Appendix 7.A.2PRODUCTION COST ( in 000 Birr)
Item Year 2 Year 3 Year 4 Year 5 Year 6 Year 7 Year 8 Year 9 Year 10 Year 11
Raw Material and Inputs 239 271 319 319 319 319 319 319 319 319
Utilities 39 45 53 53 53 53 53 53 53 53
Maintenance and repair 66 74 88 88 88 88 88 88 88 88
Labour direct 115 130 153 153 153 153 153 153 153 153
Labour overheads 23 26 31 31 31 31 31 31 31 31
Administration Costs 56 64 75 75 75 75 75 75 75 75
Land lease cost 0 0 0 0 3 3 3 3 3 3Cost of marketing
and distribution 125 125 125 125 125 125 125 125 125 125
Total Operating Costs 663 735 843 843 846 846 846 846 846 846
Depreciation 553 553 553 553 553 51 51 51 51 51
Cost of Finance 0 283 247 212 177 141 106 71 35 0
Total Production Cost 1,216 1,570 1,642 1,607 1,575 1,038 1,003 967 932 897
23

Appendix 7.A.3INCOME STATEMENT ( in 000 Birr)
ItemYear
2Year
3Year
4Year
5Year
6Year
7Year
8Year
9 Year 10 Year 11
Sales revenue 1,500 1,700 2,000 2,000 2,000 2,000 2,000 2,000 2,000 2,000
Less variable costs 538 610 718 718 718 718 718 718 718 718
VARIABLE MARGIN 962 1,090 1,282 1,282 1,282 1,282 1,282 1,282 1,282 1,282
in % of sales revenue 64.12 64.12 64.12 64.12 64.12 64.12 64.12 64.12 64.12 64.12
Less fixed costs 678 678 678 678 680 179 179 179 179 179
OPERATIONAL MARGIN 284 413 605 605 602 1,103 1,103 1,103 1,103 1,103
in % of sales revenue 18.95 24.27 30.24 30.24 30.09 55.17 55.17 55.17 55.17 55.17
Financial costs 283 247 212 177 141 106 71 35 0
GROSS PROFIT 284 130 358 393 425 962 997 1,033 1,068 1,103
in % of sales revenue 18.95 7.64 17.88 19.65 21.26 48.10 49.87 51.64 53.40 55.17
Income (corporate) tax 0 0 0 0 0 289 299 310 320 331
NET PROFIT 284 130 358 393 425 673 698 723 748 772
in % of sales revenue 18.95 7.64 17.88 19.65 21.26 33.67 34.91 36.15 37.38 38.62
24
Appendix 7.A.4CASH FLOW FOR FINANCIAL MANAGEMENT ( in 000 Birr)
Item Year 1 Year 2 Year 3 Year 4 Year 5 Year 6 Year 7 Year 8 Year 9 Year 10 Year 11Scra
p
TOTAL CASH INFLOW 3,567 1,876 1,702 2,003 2,000 2,000 2,000 2,000 2,000 2,000 2,000 941
Inflow funds 3,567 376 2 3 0 0 0 0 0 0 0 0
Inflow operation 0 1,500 1,700 2,000 2,000 2,000 2,000 2,000 2,000 2,000 2,000 0
Other income 0 0 0 0 0 0 0 0 0 0 0 941TOTAL CASH
OUTFLOW 3,567 1,039 1,385 1,465 1,408 1,376 1,629 1,604 1,579 1,555 1,177 0Increase in fixed assets 3,567 0 0 0 0 0 0 0 0 0 0 0
Increase in current assets 0 119 14 22 0 0 0 0 0 0 0 0
Operating costs 0 538 610 718 718 721 721 721 721 721 721 0Marketing and
Distribution cost 0 125 125 125 125 125 125 125 125 125 125 0
Income tax 0 0 0 0 0 0 289 299 310 320 331 0Financial costs 0 257 283 247 212 177 141 106 71 35 0 0
Loan repayment 0 0 353 353 353 353 353 353 353 353 0 0
SURPLUS (DEFICIT) 0 837 317 538 592 624 371 396 421 445 823 941
CUMULATIVE CASH BALANCE 0 837 1,153 1,692 2,284 2,908 3,279 3,675 4,096 4,541 5,364 6,306
25
Appendix 7.A.5DISCOUNTED CASH FLOW ( in 000 Birr)
Item Year 1Year
2 Year 3Year
4 Year 5Year
6Year
7Year
8 Year 9Year
10Year
11Scra
p
TOTAL CASH INFLOW 0 1,500 1,700 2,000 2,000 2,000 2,000 2,000 2,000 2,000 2,000 941
Inflow operation 0 1,500 1,700 2,000 2,000 2,000 2,000 2,000 2,000 2,000 2,000 0
Other income 0 0 0 0 0 0 0 0 0 0 0 941
TOTAL CASH OUTFLOW 3,670 676 754 843 843 846 1,134 1,145 1,155 1,166 1,177 0
Increase in fixed assets 3,567 0 0 0 0 0 0 0 0 0 0 0
Increase in net working capital 104 12 19 0 0 0 0 0 0 0 0 0
Operating costs 0 538 610 718 718 721 721 721 721 721 721 0
Marketing and Distribution cost 0 125 125 125 125 125 125 125 125 125 125 0
Income (corporate) tax 0 0 0 0 0 289 299 310 320 331 0
NET CASH FLOW -3,670 824 946 1,157 1,157 1,154 866 855 845 834 823 941
CUMULATIVE NET CASH FLOW -3,670 -2,846 -1,900 -742 415 1,569 2,435 3,290 4,135 4,969 5,792 6,733
Net present value -3,670 749 782 870 790 717 489 439 394 354 317 363
Cumulative net present value -3,670 -2,921 -2,139 -1,269 -479 238 726 1,165 1,559 1,913 2,230 2,593
NET PRESENT VALUE 2,593INTERNAL RATE OF RETURN 23.86%
NORMAL PAYBACK 4 years
26
27