iiarf research report contrasting grc and erm documents/contrasting grc... · iiarf research report...
TRANSCRIPT

I I A R F R e s e A R c h R e p o R t
Contrasting GRC and ERM
Perceptions and Practices Among Internal Auditors

The IIA Research Foundation 2
Copyright © 2013 by The Institute of Internal Auditors Research Foundation (IIARF). All rights reserved.
Published by The Institute of Internal Auditors Research Foundation, 247 Maitland Avenue, Altamonte Springs, Florida, 32701-4201. (www.theiia.org/research)
No part of this publication may be reproduced, stored in a retrieval system, or transmitted in any form by any means—electronic, mechanical, photocopying, recording, or otherwise—without prior written per-mission of the publisher. Requests to the publisher for permission should be sent electronically to: [email protected] with the subject line “reprint permission request.”
Limit of Liability: The IIARF publishes this document for informational and educational purposes and is not a substitute for legal or accounting advice. The IIARF does not provide such advice and makes no warranty as to any legal or accounting results through its publication of this document. When legal or accounting issues arise, professional assistance should be sought and retained.
The Institute of Internal Auditors’ (IIA’s) International Professional Practices Framework (IPPF) compris-es the full range of existing and developing practice guidance for the profession. The IPPF provides guid-ance to internal auditors globally and paves the way to world-class internal auditing.
The IIA and The IIARF work in partnership with researchers from around the globe who conduct valuable studies on critical issues affecting today’s business world. Much of the content presented in their final reports is a result of IIARF-funded research and prepared as a service to The IIARF and the internal audit profession. Expressed opinions, interpretations, or points of view represent a consensus of the researchers and do not necessarily ref lect or represent the official position or policies of The IIA or The IIARF.
eISBN-13: 978-0-89413-808-9
18 17 16 15 14 13 1 2 3 4 5 6 7 8 9

www.theiia.org/research 3
Contents
Acknowledgments 4
About the Authors 6
Executive Summary 7
Chapter 1 From Internal Controls to Risk 8
Chapter 2 A Global Survey about GRC and ERM 11
Chapter 3 The Evolution of Internal Audit Toward Governance 15
Chapter 4 The Many Definitions of GRC 18
Chapter 5 The Many Definitions of ERM 24
Chapter 6 Developing a Working Relationship Between
Governance and ERM 27
Chapter 7 Perceived Meanings of GRC and ERM 29
Chapter 8 GRC and ERM Maturity 36
Chapter 9 Value Perception of GRC and ERM 42
Chapter 10 Improving GRC and ERM 47
Chapter 11 Internal Audit Involvement in GRC and ERM 53
Chapter 12 Audit Planning 62
Chapter 13 Risk Assessments 65
Chapter 14 Frameworks and Tools 69
Chapter 15 Conclusion and Implications 74
Appendix A Survey Questions 76
Appendix B Demographics of Research Participants 103
Appendix C Execution and Oversight Responsibilities 109
Appendix D Areas Identified/Referenced in the Internal Audit Charter 111
Appendix E Extent of Your Internal Audit Function’s Involvement in GRC 113
Appendix F Extent of Your Internal Audit Function’s Involvement in ERM 115
Appendix G Frequency that Internal Audit Function Reports on
GRC to Audit Committee 117
Appendix H Frequency of Internal Audit Function Assessment of
GRC and ERM 119
Notes 121
Reference List 124
Research Sponsor Recognition 125
The IIA Research Foundation Board of Trustees 126
The IIA Research Foundation Committee of Research and Education Advisors 127

www.theiia.org/research 4
ACknowledgments
We thank the following Institute of Internal Auditors’ (IIA) chapters for their generous donations in support of this project:
Albany (Gold Partner)
Southern New England (Silver Partner)
Westchester-Fairfield (Silver Partner)
Downeast Maine (Silver Partner)
We are also thankful for the active and ongoing contributions of multiple IIA institutes who supported the research by distributing the survey within their regions, including:
Australia
Hong Kong
Netherlands
New Zealand
North America
Norway
Philippines
South Africa
Sweden
United Arab Emirates (UAE)
Zimbabwe
We would like to thank the following reviewers for their comments and suggestions for this project:
Lal Balkaran, Risk, Governance, and Internal Audit Consultant, LBA Consulting
Adil Buhariwalla, Vice President Internal Audit, Emirates Airline
Jack Gazlay, Principal, Risk Assessment Services, LLC
Bruce C. Lynn, Managing Partner, The FECG, LLC
The IIA Research Foundation 5
In addition, Urton Anderson, professor of accounting at the University of Texas and current chairman of The IIA’s Committee of Research and Education Advisors (CREA), provided significant top-down comments that were important to the overall completion of the project.
We also offer special thanks to Selma Kuurstra, Stra Global Consulting, who coordinated meetings and feedback and managed the project schedule. We also appreciate Mike Scotchie of The IIA for survey distribution, monitoring, and data collection. For editorial support, we appreciate Deborah Poulalion, IIARF project content developer, for valuable suggestions regarding organization and presentation.
Several individuals accepted our invitation to answer follow-up questions regarding the survey instrument and results, and their insights are included in this report. These respondents include:
Richard Anderson, Clinical Professor of Strategic Risk Management, DePaul University
Steven Casazza, Vice President and Controller, Nestlé Purina PetCare, Global Strategic Business Unit
Todd Freeman, Vice President, Internal Audit, CB&I (Chicago Bridge & Iron Company N.V.)
Michael Head, Vice President and Managing Director of Corporate Audit, TD Ameritrade, Inc.
Joel Kramer, Managing Director, Internal Audit Division, MIS Training Institute
Barry S. Leithhead, Risk Professional, Australia
Roger McDaniel, President, Audit Services
Betty McPhilimy, Associate Vice President, Audit and Advisory Services, Northwestern University
José Luis Rojas, Business Advisory Services Managing Partner, Grant Thornton, Mexico
Anton Van Wyk, Partner, PwC, South Africa
Joyce Vassiliou, Head of Internal Audit, Coca-Cola Hellenic Bottling Company S.A., Greece
Finally, we extend our appreciation to current and former IIA team members who helped develop and distribute the survey and our sincere thanks to the hundreds of internal audit professionals who took the time to respond.
Acknowledgments
www.theiia.org/research 6
About the Authors
Lydia M. Lafleur, CIA, is assistant director of the Center for Internal Auditing at Louisiana State University where she teaches financial accounting and internal auditing. Lydia has more than 10 years of professional experience in public accounting and the banking industry. She has co-authored several articles about internal audit topics and conducted Certified Internal Auditor (CIA) exam reviews and presentations for organizations and chapters of The Institute of Internal Auditors (IIA) throughout the United States.
Jared S. Soileau, PhD, CIA, CPA, CISA, CCSA, CRMA, is assistant professor of accounting at Louisiana State University where he teaches accounting information systems and internal auditing. Jared’s academic credentials include a bachelor of science degree in accounting with a concentration in internal auditing, a master of business administration with a concentration in internal auditing from Louisiana State University, and a doctorate in business administration with a concentration in accounting from the University of Memphis. He received The IIA’s Esther R. Sawyer Award in 2003 and the Michael J. Barrett Doctoral Dissertation Award in 2010. His research interests include internal auditing, corpo-rate governance, and enterprise risk management.
Prior to receiving his advanced degrees, Jared had an extensive career in internal auditing and infor-mation systems auditing in both public accounting and industry, working at Ernst & Young LLP, Alcatel Inc., Avery Dennison, and FedEx Services. Jared also provides CIA exam training throughout the United States. He is an active member of The IIA and currently serves on the Academic Relations Committee.
Glenn E. Sumners, DBA, CIA, CFE, CRMA, is on the faculty of Louisiana State University and serves as the director of the Louisiana State University Center for Internal Auditing (LSUCIA). Glenn was named Educator of the Year in 1987 by The IIA and received the LCPA Lifetime Achievement in Accounting Education Award in 1999. In 2006, he received The IIA’s Bradford Cadmus Memorial Award, and in 2012, he was inducted into The IIA’s American Hall of Distinguished Audit Practitioners. Glenn is a member of The IIA Society Emeritus. He is an honorary faculty member at the University of Pretoria. Five LSUCIA students have received the Esther R. Sawyer Award and 18 have won interna-tional awards for the highest score on the CIA exam. In 2012, the CIA Student Award for the top score on the exam by a student was named the Dr. Glenn E. Sumners Award.
Glenn has been actively involved with The IIA for more than 30 years and has served on numerous committees. He provides quality assurance reviews, consulting, and training to internal audit groups and audit committees internationally, and has made more than 1,300 presentations over the last 25 years.

The IIA Research Foundation 7
exeCutive summAry
Governance, risk, and control (GRC) and enterprise risk management (ERM) are two topics frequently discussed within the business community. This research study explores the perceptions
about the meanings of GRC and ERM and internal audit’s involvement. The findings provide insight into strategic steps for the internal audit profession as a whole, plus useful perspectives for practitioners.
Researchers used The IIA’s extensive network of internal audit contacts around the world to conduct a survey involving 23 countries. Many of the results were interpreted through follow-up interviews with internal audit experts in the field of GRC. Finally, the researchers conducted a review of current publica-tions about GRC and ERM to describe current thinking on the topic.
Key findings include:
While most internal auditors describe ERM as a component of GRC (60%), a significant proportion had the opposite viewpoint—that GRC was a component of ERM (24%).
Approximately four out of 10 respondents described ERM (39%) or GRC (44%) in their organizations as ad hoc or preliminary.
Significant percentages of respondents indicated that their internal audit functions did not conduct assessments of governance (25%) or ERM (34%).
Seventy-seven percent of respondents indicated that their organizations have a process for establishing risk tolerance levels, whether formal or informal.
Approximately two-thirds (63%) of respondents used a top-down, risk-based approach for internal audit planning compared to one-third (33%) who used a risk-ranked units, bottom-up approach.
For many questions in the survey, respondents gave almost identical answers for GRC and ERM, suggesting a lack of differentiation between the concepts.
In conclusion, this report provides a snapshot of internal audit’s expanding roles in risk, ERM, and governance. To meet existing and future challenges, the internal audit profession would benefit by clar-ifying the concepts and language relative to GRC and ERM.

www.theiia.org/research 8
Chapter 1
From internAl Controls to risk
“If you wish to converse with me, define your terms.”
—VoltaIre
In 1984, The IIA Research Foundation (IIARF) commissioned a study titled Internal Auditing: Directions and Opportunities. The foremost conclusion of the study was that the profession of internal
auditing was “well-established but not well-defined.” The only consistent similarity among practitioners was that internal auditors everywhere were involved in the evaluation of internal controls. 1
During the same time frame, business leaders began to look at ways to define internal controls. The Report of the National Commission on Fraudulent Financial Reporting, published in 1987, noted that management, audit committees, internal auditors, external auditors, and other groups varied greatly in their perceptions and definitions of internal control. The commissioners recommended that the Committee of Sponsoring Organizations of the Treadway Commission (COSO) establish a language of internal controls.
In 1992, COSO published Internal Control – Integrated Framework, which is now used worldwide to provide a common language about internal control for internal auditors, management, and others.2 This common language is an important tool for evaluating and facilitating communication about internal controls between different groups and individuals.
As the internal audit profession has evolved, new job enrichment responsibilities have been added, especially increased involvement in governance and risk. As a result, governance, risk, and control (GRC) and enterprise risk management (ERM) are concepts increasingly discussed and communicated in the business community. The interpretation of these terms differs across entities and geographies, creating a challenge for sharing knowledge and identifying best practices.
For example, the acronym ERM is often used interchangeably with GRC by many practitioners and software vendors. This lack of distinction decreases the transparency to external parties relative to the scope of professional services and responsibilities of internal auditors.
In the same way that COSO’s Internal Control – Integrated Framework established a language for controls, internal auditors and stakeholders need a clear and concise definition of GRC and ERM and a related language of governance.
As a result, nearly 30 years after the need to define internal control was identified, The IIARF commissioned this research study to determine whether the same definitional challenges exist with GRC and ERM. This research report is based on:
A review of current publications regarding GRC and ERM.
The IIA Research Foundation 9
A global survey of GRC and ERM with participants from 23 countries.
Interviews with leading internal audit experts to interpret survey results.
researCh QuestIons
This study was designed to answer the following questions about perceptions and practices related to GRC and ERM:
Perception from Key Sources
How has the evolution of risk and governance impacted the internal audit profession? (chapter 3)
How do key sources define GRC and ERM? (chapters 4 and 5)
How do key sources describe the relationship between GRC and ERM? (chapter 6)
Perception from Internal Auditors
How do internal auditors define GRC and ERM? (chapter 7)
How do internal auditors perceive the maturity of GRC and ERM in their organizations? (chapter 8)
How do internal auditors define the value of GRC and ERM? (chapter 9)
How do internal auditors think GRC structures and ERM processes can be improved? (chapter 10)
Practices among Internal Auditors
What is the current level of internal audit involvement in GRC and ERM? (chapter 11)
How do internal auditors incorporate ERM into their audit planning? (chapter 12)
Which risk assessment approaches do internal auditors use? (chapter 13)
What frameworks, tools, and technology do internal auditors currently use for GRC and ERM? (chapter 14)
BenefIts of the researCh for PraCtItIoners
Practitioners can use the results of this research project to:
Manage Perceptions
Learn how internal audit has evolved toward risk and governance. (chapters 3–6)
Communicate the meaning of GRC and ERM more clearly to management. (chapter 7)
From Internal Controls to Risk

www.theiia.org/research 10
Contrasting GRC and ERM
Benchmark their organization’s GRC and ERM maturity. (chapter 8)
Communicate the value of GRC and ERM to stakeholders. (chapter 9)
Learn how other internal auditors say GRC structures and ERM processes can be improved. (chapter 10)
Improve Practices
Compare the level of internal audit involvement in GRC and ERM with other respondents worldwide. (chapter 11)
Learn how other audit functions incorporate ERM into their audit plans. (chapter 12)
Learn what risk assessment approaches other audit functions use. (chapter 13)
Determine what frameworks, tools, and technologies other organizations use for GRC and ERM. (chapter 14)

The IIA Research Foundation 11
Chapter 2
A globAl survey About grC And erm
This research report was written based on the results of a global survey using The IIA’s extensive network of internal audit contacts. Researchers interpreted many of the survey results by conducting
follow-up interviews within the field of governance, risk, and control. Finally, they conducted a review of current literature on the topic to present current thinking. This chapter describes the characteristics of the global survey respondents and lists the internal audit leaders who were interviewed.
CharaCterIstICs of the GloBal surVey
The IIA Research Foundation (IIARF) administered the survey to chief audit executives (CAEs) and managers in 23 countries during the six-week period between February 7, 2012, and March 19, 2012. The survey language was English. (For the complete text of the survey, see appendix A.)
Of the 1,055 individuals who accessed the survey, 931 answered at least one question and 273 completed the survey in its entirety (see exhibit 2.1).
Exhibit 2.1. Countries Participating in the Survey
United Arab Emirates
The Netherlands
Sweden
South Africa
Philippines
Norway
New Zealand
Malaysia
Hong Kong (China)
Caribbean
Canada
Australia
Other
United States
The "Other" category includes Bermuda, Fiji, Jamaica, Mozambique, Spain, Trinidad & Tobago, Zambia, and Tanzania.
57%
7%12%
11%
1%
0%
2%
2%
1% 1%
1%0%
2%
3%

www.theiia.org/research 12
Contrasting GRC and ERM
Job TitlesIn terms of job title, 89% of respondents held positions of audit manager or higher (see exhibit 2.2).
The survey was directed toward chief audit executives (CAEs), but they also had the option to delegate it to a lower staff member for completion. The high percentage of executives among respondents is a benefit for this study because this indicates that the results ref lect a higher level of experience.
Exhibit 2.2. What is your current role in the internal audit function? (question 52)
title Percentage of respondents
Chief audit executive 55%
director of audit* 13%
Audit manager* 21%
other 11%
* Includes IT audit with respective title (for example, IT audit director or manager). Note: This question had 273 respondents.
Organization TypesCAEs of publicly traded companies comprised the greatest percentage of respondents completing
the survey (39%), while privately held organizations and public sector/government classified organiza-tions represented 21% and 22% respectively. In addition, nonprofit, service providers/consultants, and other organization types provided 11%, 4%, and 3% of the survey responses respectively, as noted in exhibit 2.3.
Exhibit 2.3. For which type of organization do you currently work? (question 48)
organization type Percentage of respondents
Publicly traded (listed) organization 39%
Public sector/government 22%
Privately held (non-listed) organization 21%
nonprofit 11%
service provider/consultant 4%
other 3%
Note: This question had 272 respondents.
Additional detailed information related to the respondents’ demographics is provided in appendix B, including:
Geographic composition
Size of organization (based on revenues)
Industry grouping

The IIA Research Foundation 13
Size of internal audit function
Limitations
A Note about Response Counts on Tables and FiguresResponse counts differ from question to question because all respondents did not answer every
question. Results provided in the main text of the paper are reported in aggregate for all responses received (not just completed surveys).
follow-uP InterVIews wIth Internal audIt exPerts
In addition to the global survey, the research team interviewed or surveyed prominent internal audit and risk management professionals during the 2012 IIA International Conference. Additional interviews were conducted remotely. These professionals represented multiple countries, including the United States, Australia, Mexico, and South Africa.
Researchers obtained feedback by presenting respondents with specific summarized results and asking for their perspective. Their insights are included throughout the study. The researchers are grateful to the following professionals for their participation:
Richard Anderson, Clinical Professor of Strategic Risk Management, DePaul University
Steven Casazza, Vice President and Controller, Nestlé Purina PetCare, Global Strategic Business Unit
Todd Freeman, Vice President, Internal Audit, CB&I (Chicago Bridge & Iron Company N.V.)
Michael Head, Vice President and Managing Director of Corporate Audit, TD Ameritrade, Inc.
Joel Kramer, Managing Director, Internal Audit Division, MIS Training Institute
Barry S. Leithhead, Risk Professional, Australia
Roger McDaniel, President, Audit Services
Betty McPhilimy, Associate Vice President, Audit and Advisory Services, Northwestern University
José Luis Rojas, Business Advisory Services Managing Partner, Grant Thornton, Mexico
Anton Van Wyk, Partner, PwC, South Africa
Joyce Vassiliou, Head of Internal Audit, Coca-Cola Hellenic Bottling Company S.A., Greece
A Global Survey about GRC and ERM

www.theiia.org/research 14
Contrasting GRC and ERM
reVIew of PuBlIshed MaterIals
Researchers reviewed internal audit history and current publications to identify and describe the most current trends related to GRC and ERM. The next section describes those trends and provides essential background information for interpreting the survey results presented later in this report.

The IIA Research Foundation 15
Chapter 3
the evolution oF internAl Audit towArd governAnCe
how has the evolution of risk and governance impacted the internal audit profession?
Governance has become increasingly important for the internal audit profession. Society recog-nizes that weak governance allows fraud, corruption, and man-made disasters to adversely impact
individuals and organizations. Accordingly, boards are looking for ways to increase their oversight of governance, and they are asking internal audit to assess and report on their organizations’ gover-nance practices.
As stated in IIA guidance:
In today’s political and business environment, there is increasing focus on governance, risk management, and control. Strong governance systems are needed to better ensure that organizations will meet their objectives and stakeholder expectations… In fulfilling its oversight responsibilities, [the board] will look to the internal audit activity to provide it with assessments on the organization’s governance practices.1
This increased need for governance oversight has provided another opportunity for internal audit to add value to an organization.
uPdates In IIa StandardS
The 2013 changes to The IIA’s International Standards for the Professional Practice of Internal Auditing (Standards) also support the observation that internal audit is evolving from controls to risk to governance.2
For example, regarding the objectives that must be established for each engagement, Standard 2210.A3 now states:
Adequate criteria are needed to evaluate governance, risk management, and controls. (Underlined words were added in 2013.)
Also, Standard 2201 now states that in planning the engagement, internal auditors must consider:

www.theiia.org/research 16
Contrasting GRC and ERM
The adequacy and effectiveness of the activity’s governance, risk management, and control processes compared to a relevant control framework or model… (Underlined and deleted words were changed in 2013.)
a Model for InCreasInG Internal audIt Value
These important changes are illustrated in exhibit 3.1, which shows that as maturity in controls, risk, and governance increases, internal audit value also increases.
Exhibit 3.1. The Evolution Toward Increasing Value for Internal Audit
Controls
GovernanceRisk
GRC
Governanceexpertise integrated
with mature riskassessment andinternal controls
Already Mature
Integration of Governance, Risk, and Controls
Incr
easi
ng V
alue
of
Inte
rnal
Aud
it
Source: Adapted from Sumners Audit Services, GRC presentation materials.
ERM
Entity
Process
Unit
ControlEnvironment
Management
Controls
Control Activities
Now Developing Future Challenge
As illustrated, the evolution of the profession is to add value by integrating risk and governance expertise with mature internal controls. Let’s look at the three elements of the graphic individually.
ControlsThe graphic shows how controls have matured as internal audit has taken the following progression:
1. Control activities
2. Management controls (plan, organize, staff, direct, and monitor)
3. The control environment (ethical tone at the top, corporate culture, integration of policy and procedures into the employee mindset)
Control maturity impacts staffing competencies, report content, and ability to add value.
The IIA Research Foundation 17
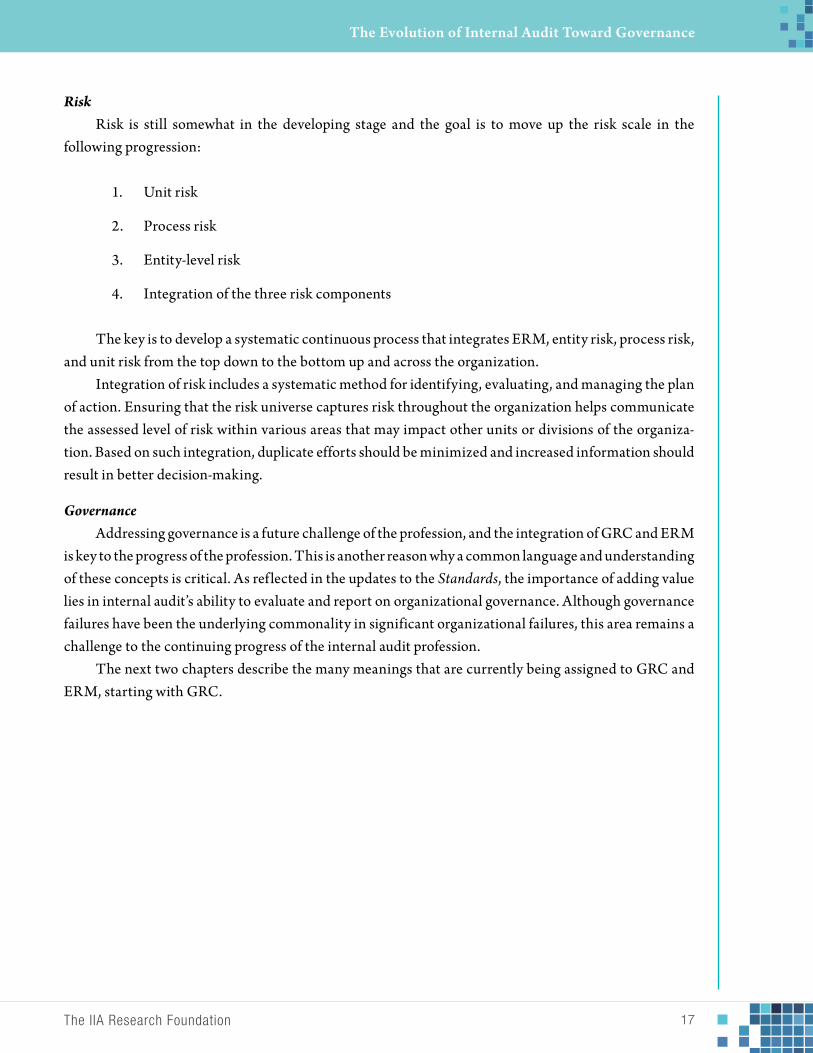
RiskRisk is still somewhat in the developing stage and the goal is to move up the risk scale in the
following progression:
1. Unit risk
2. Process risk
3. Entity-level risk
4. Integration of the three risk components
The key is to develop a systematic continuous process that integrates ERM, entity risk, process risk, and unit risk from the top down to the bottom up and across the organization.
Integration of risk includes a systematic method for identifying, evaluating, and managing the plan of action. Ensuring that the risk universe captures risk throughout the organization helps communicate the assessed level of risk within various areas that may impact other units or divisions of the organiza-tion. Based on such integration, duplicate efforts should be minimized and increased information should result in better decision-making.
GovernanceAddressing governance is a future challenge of the profession, and the integration of GRC and ERM
is key to the progress of the profession. This is another reason why a common language and understanding of these concepts is critical. As ref lected in the updates to the Standards, the importance of adding value lies in internal audit’s ability to evaluate and report on organizational governance. Although governance failures have been the underlying commonality in significant organizational failures, this area remains a challenge to the continuing progress of the internal audit profession.
The next two chapters describe the many meanings that are currently being assigned to GRC and ERM, starting with GRC.
The Evolution of Internal Audit Toward Governance

www.theiia.org/research 18
Contrasting GRC and ERM
Chapter 4
the mAny deFinitions oF grC
how do key sources define GrC?
Imagine that you just met four internal audit practitioners who graduated in the last 10 years, and you have asked them to describe their education and careers. Here is what you might find:
Two have accounting degrees, one has a finance degree, and the fourth has a computer science degree.
One went to work for a Big 4 firm, two started in industry, and one went to work in government.
Two became Certified Internal Auditors (CIAs), one achieved the Certified Public Accountant (CPA) and Certified Information Systems Auditor (CISA) designations, and one is a Certified Government Auditing Professional (CGAP).
One primarily conducts Sarbanes-Oxley work, one performs external attest assignments, one performs operational audits, and one audits regulatory compliance.
Two belong to The IIA, one joined ISACA, and one joined the Association of Government Accountants (AGA).
Only two of the four are IIA members and attend IIA meetings and training.
One has changed jobs three times.
This example, in a simplistic way, ref lects the diversity and vitality of the internal audit profession across many facets. However, the challenge with this scenario is that diverse experiences typically do not lead to a common viewpoint. This would be especially true for complex risk and governance challenges. In fact, perspectives on these topics in professional literature vary widely.
This chapter discusses the primary viewpoints regarding the meaning of GRC.Key points include:
How governance is defined
How risk is defined
The IIA Research Foundation 19
Whether the “C” in GRC stands for controls or compliance
A succinct definition for GRC
Let’s start by looking at how professional organizations define governance.
workInG defInItIons of GoVernanCe
The meaning of governance lies at the heart of understanding GRC. The IIA’s definition:
Governance—The combination of processes and structures implemented by the board to inform, direct, manage, and monitor the activities of the organization toward the achievement of its objectives.
—From the Standards1
Another recent publication from The IIA, Advancing Organizational Governance by Dean Bahrman, provides a good summary of other important definitions of governance from around the world:2
Governance is the culture, values, mission, structure, and layers of policies, processes, and measures by which organizations are directed and controlled. Governance, in this context, includes but is not limited to the activities of the Board…
—From the Open Compliance and Ethics Group (OCEG)3
Corporate governance is the system by which companies are directed and controlled. Boards of directors are responsible for the governance of their companies… The responsibilities of the board include setting the company’s strategic aims, providing the leadership to put them into effect, supervising the management of the business, and reporting to shareholders on their stewardship…
—Cadbury Committee (1992)4
[Governance involves] a set of relationships between a company’s management, its board, its shareholders, and other stakeholders. Corporate governance also provides the structure through which the objectives of the company are set, and the means of attaining those objectives and monitoring performance are determined. Good corporate governance should provide proper incentives for the board and management to pursue objectives that are in the interests of the company and its shareholders and should facil-itate effective monitoring.
—The Organisation for Economic Co-Operation and Development (OECD)5
The Many Definitions of GRC
www.theiia.org/research 20
Contrasting GRC and ERM
Corporate governance is “the framework of rules, relationships, systems, and processes within and by which authority is exercised and controlled in corporations.” It encom-passes the mechanisms by which companies, and those in control, are held to account.6 Corporate governance inf luences how the objectives of the company are set and achieved, how risk is monitored and assessed, and how performance is optimized.”7
—Australian Securities Exchange8
It is interesting to note the variations in the definitions. While these definitions are based on several sources, they can be summarized effectively in this way:
Governance is the manner in which a board of directors (trustees) ensures an organiza-tion has structural integration to meet its objectives.
workInG defInItIons of rIsk
The next component of GRC is risk. To recognize the meaning of risk, it will suffice to review The IIA definitions from the Standards glossary:
Risk—The possibility of an event occurring that will have an impact on the achievement of objec-tives. Risk is measured in terms of impact and likelihood.
Risk Management—A process to identify, assess, manage, and control potential events or situa-tions to provide reasonable assurance regarding the achievement of the organization’s objectives.9
does the “C” stand for Controls or CoMPlIanCe?
The final component of GRC is the “C,” the meaning of which is a source of some debate. Some say it refers to controls, while others prefer compliance. A helpful comment on the relationship between controls and compliance in GRC was provided by Anton van Wyk, PwC advisory services leader in South Africa. He stated:
A properly integrated GRC (compliance) enhances the overall control environment allowing management to demonstrate to the board that the business is in control. So a strong interrelationship does exist between GRC and control.
In essence, van Wyk said that compliance “enhances” control, therefore implying that compliance is a subset of control. If that is the case, then the “C” in GRC would refer to control (with compliance as a subset of control).
A careful reading of the definitions of control and compliance in The IIA’s Standards is consistent with this perspective.
Control—Any action taken by management, the board, and other parties to manage risk and increase the likelihood that established objectives and goals will be achieved.

The IIA Research Foundation 21
Management plans, organizes, and directs the performance of sufficient actions to provide reasonable assurance that objectives and goals will be achieved.
Compliance—Adherence to policies, plans, procedures, laws, regulations, contracts, or other requirements.
Note that controls are defined broadly as actions to mitigate risk, while compliance indicates a specific type of action—adherence to criteria. Therefore, compliance represents a subset of controls.
In addition, the 2013 revisions to the Standards use the phrase “governance, risk management, and control processes” in multiple places.10
Enterprise Risk Management by Paul Sobel and Kurt Reding offers a helpful diagram that shows internal control as a subset of ERM and governance.11
Exhibit 4.1. Governance, ERM, and Internal Control
Governance
ERM
InternalControl
Source: Paul Sobel and Kurt Reding, Enterprise Risk Management (The Institute of Internal Auditors Research Foundation, 2012), 20.
The Many Definitions of GRC

www.theiia.org/research 22
Contrasting GRC and ERM
The following exhibit provides a visual model of the integration of ERM within the GRC structure.
Exhibit 4.2. GRC — ERM Integration Overview
Governance
Risk
ERM
ComplianceControls
Residual Risk
Source: Louisiana State University, Center for Internal Auditing, GRC course materials.
The Control EnvironmentThere is one other term related to control that is often not understood—the control environment.
It is important to recognize the difference between hard controls (such as regulations) and soft controls (such as the control environment). Following is The IIA’s definition of control environment:
Control Environment—The attitude and actions of the board and management regarding the importance of control within the organization. The control environment provides the discipline and structure for the achievement of the primary objectives of the system of internal control. The control environment includes the following elements:
Integrity and ethical values
Management’s philosophy and operating style
Organizational structure
Assignment of authority and responsibility
Human resource policies and practices
Competence of personnel
The quality of governance, risk, and control is dependent upon the control environment.

The IIA Research Foundation 23
a suCCInCt defInItIon of GrC
Based on the discussion above, GRC could be succinctly defined as follows:
GRC is the manner in which a board of directors (trustees) ensures an organization attempts to meet its objectives by identifying and managing risks and obtaining assur-ance that controls (including compliance) are in place and efficiently and effectively mitigating risk.
As noted within our previous definition, risk management is a component of GRC. With perhaps an acceptable definition of GRC in place, the next chapter addresses the chal-lenge of defining ERM and discusses the debate about whether ERM fits under the broad governance umbrella of GRC.
The Many Definitions of GRC

www.theiia.org/research 24
Chapter 5
the mAny deFinitions oF erm
how do key sources define erM?
The definitions of ERM are more challenging to identify than the definitions of governance. In 2006, the authors of The Essentials of Risk Management stated:
For all the hype, however, ERM continues to be an elusive concept that varies widely in definition and implementation…1
In 2010, the authors of Enterprise Risk Management: An Introduction and Overview concluded that:
Our final observation is that the ERM concept is still a new concept and is likely to take a while to get the emerging country firms to reach the desirable level of risk management practices for sound business reasons rather than as a new responsibility that needs to be practiced because of law.2
how do ProfessIonal orGanIzatIons defIne erM?
Following are the most visible definitions of ERM available today. The Risk Management Society (RIMS) defines ERM as:
Enterprise Risk Management (“ERM”) is a strategic business discipline that supports the achievement of an organization’s objectives by addressing the full spectrum of its risks and managing the combined impact of those risks as an interrelated risk portfolio.
ERM represents a significant evolution beyond previous approaches to risk management in that it:
1. Encompasses all areas of organizational exposure to risk (financial, operational, reporting, compliance, governance, strategic, reputational, etc.);
2. Prioritizes and manages those exposures as an interrelated risk portfolio rather than as individual “silos”;
3. Evaluates the risk portfolio in the context of all significant internal and external environments, systems, circumstances, and stakeholders;

The IIA Research Foundation 25
4. Recognizes that individual risks across the organization are interrelated and can create a combined exposure that differs from the sum of the individual risks;
5. Provides a structured process for the management of all risks, whether those risks are primarily quantitative or qualitative in nature;
6. Views the effective management of risk as a competitive advantage; and
7. Seeks to embed risk management as a component in all critical decisions throughout the organization.3
Other definitions of ERM from around the world include:
[Risk management is] an integral part of all organizational processes. [It] is not a stand-alone activity that is separate from the main activities and processes of the organization. Risk management is part of the responsibilities of management and an integral part of all organizational processes, including strategic planning and all project and change management processes.
—The Council of Standards Australia (November 2009) and the Council of Standards New Zealand (October 2009)4
[ERM is] a structured, consistent and continuous process across the whole organization for identifying, assessing, deciding on responses to and reporting on opportunities and threats that affect the achievement of its objectives.
—The IIA–UK and Ireland5
Enterprise risk management is a process, effected by an entity’s board of directors, management and other personnel, applied in strategy setting and across the enterprise, designed to identify potential events that may affect the entity, and manage risk to be within its risk appetite, to provide reasonable assurance regarding the achievement of entity objectives.
—COSO’s Enterprise Risk Management – Integrated Framework, 20046
a suCCInCt defInItIon of erM
Based on the current literature, following is a succinct definition for ERM:
ERM is an integrated systematic process of identifying major risk to achieving the specific goals and objectives of the organization. These risks should be analyzed by like-lihood and impact and mitigated to an acceptable level of residual risk.
The Many Definitions of ERM

www.theiia.org/research 26
Contrasting GRC and ERM
ConClusIon
Though there may be a lack of consensus on the meaning of GRC and ERM, these terms are being used extensively, and the relationship between these concepts is also being developed. The next chapter suggests a future working relationship for these two concepts.

The IIA Research Foundation 27
Chapter 6
develoPing A working relAtionshiP between governAnCe And erm
how do key sources describe the relationship between GrC and erM?
Because the definitions of GRC and ERM are so varied, the understanding of the relationship between the two concepts is extremely varied as well. Some practitioners propose that when ERM is fully
implemented, it would include GRC. Others feel strongly that the “R” (Risk) in GRC includes ERM.A diplomatic observation about the relationship between ERM and GRC is provided in The IIA’s
classic reference book, Sawyer’s Guide for Internal Auditors:
It is not appropriate to think that one is superior to the other or that either ERM or GRC is right or wrong from a professional perspective. GRC is not complete without abun-dant, reliable information about risk, nor is ERM relevant or useful unless it is rooted in governance, compliance, and business performance.1
Sawyer’s guide also indicates that ERM comes under the umbrella of GRC, stating, “Internal audi-tors should recognize the value of ERM and how it can be integrated with GRC.”
Paul Sobel, vice president/chief audit executive at Georgia-Pacific LLC and a known leader in ERM research, firmly states that ERM is a component of governance:
ERM is an important component of governance [just as] internal control is an important component of ERM.2
If ERM is a component of governance, then ERM would also be a component of GRC. Michael Rasmussen, vice president of enterprise risk and compliance for Forrester Research,
summarized the roles of GRC and ERM as follows:
GRC is really a philosophy, and a framework for communicating around governance and compliance issues; ERM, on the other hand, is the measurement and qualification of risk, and the establishment of individual risk ownership. In effect, GRC encompasses ERM.3
Stated another way, ERM varies based on the quality of governance; however, the quality of gover-nance is not based on the quality of ERM. The quality of the ERM process is more dependent on the quality of governance than governance is dependent on ERM.
www.theiia.org/research 28
Contrasting GRC and ERM
Risk management expert Douglas Hubbard noted that governance has control over ERM because governance determines “where risk management sits in the organization.”4
GoVernanCe as a struCture and erM as a ProCess
Another way to understand the relationship between governance and risk is to look carefully at The IIA’s definitions (note italicized words).
Governance—The combination of processes and structures implemented by the board to inform, direct, manage, and monitor the activities of the organization toward the achievement of its objectives (italics added).
Risk Management—A process to identify, assess, manage, and control potential events or situations to provide reasonable assurance regarding the achievement of the organiza-tion’s objectives (italics added).5
Note that governance is defined as “a combination of processes and structures.” On the other hand, risk management is described only as a “process.”
One can therefore infer that the process of risk management is managed through the structure of governance. In other words, governance provides the cultural infrastructure for the process of ERM. As the results of the survey will demonstrate, this perspective on the relationship between GRC and ERM is not universal, creating confusion for stakeholders and internal auditors.

The IIA Research Foundation 29
Chapter 7
PerCeived meAnings oF grC And erm
how do internal auditors define GrC and erM?
One of the impetuses of this study was the frequent and interchangeable use of the acronyms GRC and ERM. As a result, attempting to capture the current understanding of these terms within the
profession provides a starting point to fulfill the research objectives.
Is erM a CoMPonent of GrC or VICe Versa?
As mentioned earlier, it is possible to make a strong case for ERM being a component of GRC. However, this point of view is not necessarily a consensus among practitioners. Although 60% of survey respondents indicated ERM is a component of GRC, approximately 25% indicated the opposite—that GRC is a component of ERM; 14% chose “neither,” which indicates that they may not have established a defined relationship between GRC and ERM (see exhibit 7.1).
Exhibit 7.1: In your opinion, is ERM a component of GRC, or GRC a component of ERM? (question 28)
Other, please specify:
Neither
ERM is a component of GRC
GRC is a component of ERM
60%
14% 24%
2%
www.theiia.org/research 30
Contrasting GRC and ERM
Several respondents chose the “other” option and provided comments, including:
They are equal.
They should be combined in one process.
[I] would probably not label the approaches as discrete.
Todd Freeman, vice president of internal audit at CB&I (Chicago Bridge & Iron Company N.V.), offered the following statement as a potential explanation for the significant number of respondents indi-cating GRC as a component of ERM:
Whether a person is in internal audit or not, ERM is the phrase used by many to discuss initiatives by many organizations. For those not familiar with GRC, it may be a natural inclination to believe GRC and its risk component is a subset of an ERM initiative. Those more familiar with these terms may surmise that risk identification, assessment, and mitigation are a component of governance, risk, and control.
CoMMonalItIes and dIfferenCes Between GrC and erM
The survey obtained more insight into respondents’ viewpoints by asking them to subjectively identify commonalities and differences between GRC and ERM.
Commonalities between GRC and ERMQuestion 29 of the survey asked participants to “identify five commonalities of GRC and ERM.”
Respondents overwhelmingly indicated the commonalities were:
Risk
Risk identification
Risk assessment
The risk management process
The emphasis on risk was expected because both acronyms include the letter “R” for the word Risk. Other commonalities listed by respondents included:
Specific types of compliance
External audit
Internal audit
Code of ethics

The IIA Research Foundation 31
Several respondents said that there is no difference between GRC and ERM, one specifi-cally responding:
The distinction is entirely brought about as a consequence of consultants or experts wishing to sell a product…
One respondent summarized by stating:
Both concepts have generated a lot of frustration and confusion.
Differences between GRC and ERMRespondents were also asked to “Identify five differences between GRC and ERM” (survey ques-
tion 30). Since the respondents could not depend on the commonality of the word risk for their responses, their answers varied significantly. Here is a sample of the comments received:
GRC is tactical or operational (lower level); whereas ERM is strategic (higher level).
GRC also promotes positives such as ethical behavior as opposed to only managing risk.
[The difference is the] parties responsible for execution and oversight.
GRC is more encompassing as it includes governance and compliance.
GRC is corporate; ERM can be applied at a lower level.
ERM is periodic; GRC is continuous.
GRC is primarily a software vendor driven invention that has had little practical success or value. ERM, if done right, can be a major source of success for any organization.
GRC creates the control environment and its activities, while ERM complements GRC with respect to best performance.
ERM is detailed; GRC is overarching and less detailed. GRC can happen unintentionally while ERM is deliberate.
You can cover ERM through a fully functional GRC, but you couldn’t cover GRC with a fully functional ERM.
The lack of consensus on the differences provides additional evidence as to the lack of a common understanding for these two concepts.
Perceived Meanings of GRC and ERM

www.theiia.org/research 32
Contrasting GRC and ERM
To summarize, respondents appear to consider GRC to be associated with:
Ethical behavior
Evolving infrastructure
The control environment
Overarching scope
In contrast, respondents appeared to view ERM as:
Periodic rather than a continuous process
Applied at lower levels
Not including governance and compliance
These responses also indicate that some respondents align GRC with COSO’s Internal Control – Integrated Framework, and ERM with COSO’s ERM framework. While there are alternatives to the COSO models, the high response rate from the United States and Canada and the association of COSO with U.S.-based organizations may contribute to this observation. The lack of commonalities in the iden-tified differences again illustrates the lack of consensus regarding integration between ERM and GRC.
aCtIVItIes ClassIfIed as GrC, erM, or Both
Another way to determine how respondents defined GRC and ERM was to ask them to decide whether certain activities were part of GRC, ERM, or both.
As noted in exhibit 7.2, in general, most of the activities were classified as a component of both GRC and ERM. Several of the items indicated as both GRC and ERM were expected to only be identified as either GRC or ERM. Specifically, “independent internal audit function” was not expected to be asso-ciated with ERM. However, 66% of respondents indicated that an independent internal audit function was either ERM (9%) or Both (57%). Several other activities that were unexpectedly classified as both include “external audit process,” “establishment of code of conduct/ethics/corporate policy,” and “moni-toring of fraud hotline.”
Even general topics such as governance, risk, compliance, and internal controls were most frequently categorized as both GRC and ERM. While risk should clearly fall within both GRC and ERM, one would expect that governance, compliance, and internal controls should be more aligned with GRC.

The IIA Research Foundation 33
Exhibit 7.2. Indicate whether the following is a component of GRC, ERM, or both [and identify the person or group with execution and oversight responsibilities for each of the following]: (question 5)
activity GrC erM Both
Alignment of company actions with shareholder value 28% 15% 56%
Compliance 36% 9% 55%
ensuring ethical business transactions 42% 8% 50%
establishment of code of conduct/ethics/corporate policy 47% 7% 46%
external audit process 47% 8% 45%
evaluation of controls to ensure proper risk management 21% 24% 55%
governance 45% 7% 48%
independent internal audit function 34% 9% 57%
internal controls 26% 10% 64%
management of environmental, health, and safety concerns 26% 23% 51%
management of regulatory compliance 36% 10% 54%
management of risk within established tolerance levels 13% 33% 54%
monitoring of effective fraud hotline process 47% 13% 40%
risk 8% 27% 65%
setting and monitoring of organizational risk tolerance level 13% 36% 51%
organizationwide assurance 30% 11% 59%
Quality control process 32% 14% 53%
Note: Percentage totals may not equal 100% due to rounding. Between 432 and 517 responses were received for each activity.
Perceived Meanings of GRC and ERM
www.theiia.org/research 34
Contrasting GRC and ERM
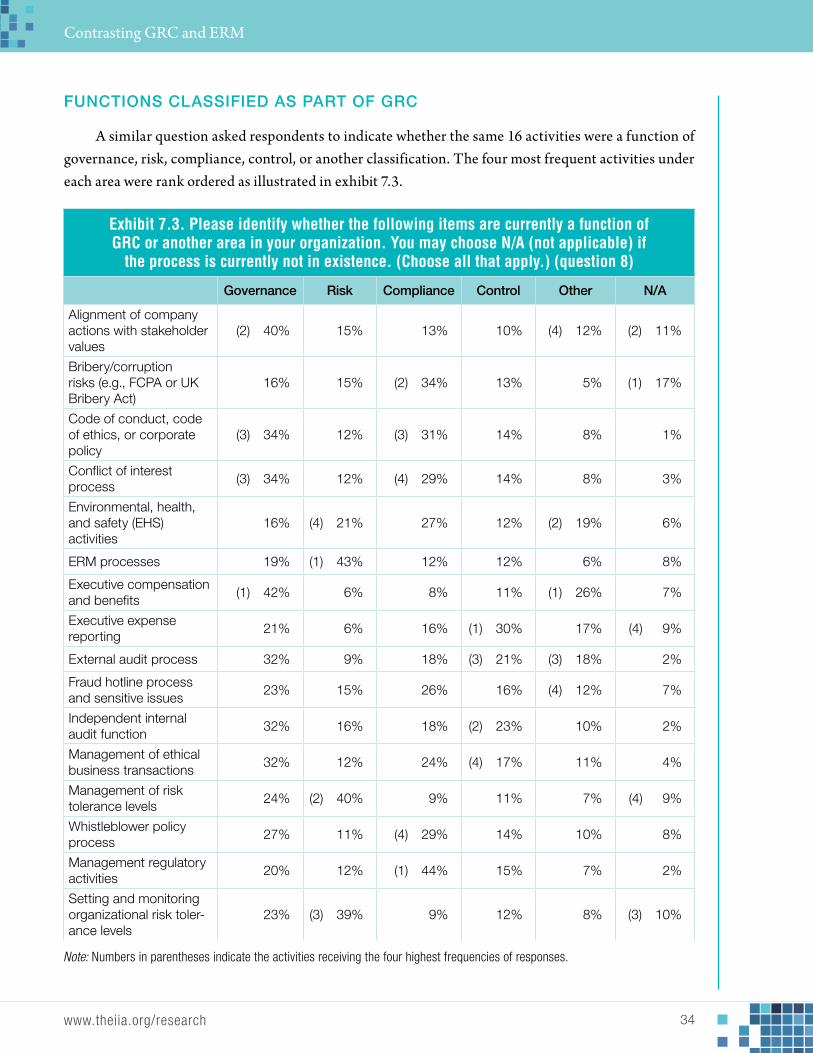
funCtIons ClassIfIed as Part of GrC
A similar question asked respondents to indicate whether the same 16 activities were a function of governance, risk, compliance, control, or another classification. The four most frequent activities under each area were rank ordered as illustrated in exhibit 7.3.
Exhibit 7.3. Please identify whether the following items are currently a function of GRC or another area in your organization. You may choose N/A (not applicable) if
the process is currently not in existence. (Choose all that apply.) (question 8)
Governance risk Compliance Control other n/a
Alignment of company actions with stakeholder values
(2) 40% 15% 13% 10% (4) 12% (2) 11%
bribery/corruption risks (e.g., FCPA or uk bribery Act)
16% 15% (2) 34% 13% 5% (1) 17%
Code of conduct, code of ethics, or corporate policy
(3) 34% 12% (3) 31% 14% 8% 1%
Conflict of interest process
(3) 34% 12% (4) 29% 14% 8% 3%
environmental, health, and safety (ehs) activities
16% (4) 21% 27% 12% (2) 19% 6%
erm processes 19% (1) 43% 12% 12% 6% 8%
executive compensation and benefits
(1) 42% 6% 8% 11% (1) 26% 7%
executive expense reporting
21% 6% 16% (1) 30% 17% (4) 9%
external audit process 32% 9% 18% (3) 21% (3) 18% 2%
Fraud hotline process and sensitive issues
23% 15% 26% 16% (4) 12% 7%
independent internal audit function
32% 16% 18% (2) 23% 10% 2%
management of ethical business transactions
32% 12% 24% (4) 17% 11% 4%
management of risk tolerance levels
24% (2) 40% 9% 11% 7% (4) 9%
whistleblower policy process
27% 11% (4) 29% 14% 10% 8%
management regulatory activities
20% 12% (1) 44% 15% 7% 2%
setting and monitoring organizational risk toler-ance levels
23% (3) 39% 9% 12% 8% (3) 10%
Note: Numbers in parentheses indicate the activities receiving the four highest frequencies of responses.

The IIA Research Foundation 35
Following are some of the notable observations regarding the responses:
“Management of regulatory activities” was most frequently classified as compliance (by 44% of respondents). Respondents probably reasoned that while this activity could be viewed as a risk, management’s need to comply with a regulation should most likely be classified as a compliance (with regulation) activity.
The “alignment of company actions with stakeholder values” is, to a large extent, the definition of governance; therefore, it would be expected that respondents would be much less likely to give a response other than governance. However, only 40% of the respondents selected governance.
“Executive compensation and benefits” was considered a governance activity by 42% of respondents, while “executive expense reporting” was viewed as a control activity by 30%.
Although the “independent internal audit function” and “external audit process” were each classified as governance activities by 32% of respondents, each was also frequently classified as control activities (23% and 21% respectively). Including internal audit under controls would be consistent with COSO’s internal control model, which includes internal audit as a component of the control environment.
Though the activities are worded in a way that provides room for respondent interpretation, the responses raise additional questions related to how members of the profession consider various activities that are a part of GRC and ERM.
For example, analysis of the rankings as well as percentages indicates that respondents identify two activities (“code of conduct, code of ethics, or corporate policy,” and “conf lict of interest process”) highly within both Governance and Compliance classifications in their organizations. It would have been expected that respondents would have chosen one or the other but not both. This provides addi-tional evidence of an absence of consistency in classification within components of the GRC structure.
ConclusionAlthough the majority of respondents (60%) indicated that ERM is a component of GRC, a
significant percentage (40%) of respondents had an alternative view. Additional questions about the components of GRC and ERM revealed further differences in perspective.
With consideration of the differences in respondent perceptions, in the next chapter we discuss the respondents’ perception of their organizations’ maturity related to GRC and ERM.
Perceived Meanings of GRC and ERM
www.theiia.org/research 36
Chapter 8
grC And erm mAturity
how do internal auditors perceive the maturity of GrC and erM in their organizations?
This section provides a summary of questions related to the maturity of organizational GRC activities and ERM processes. The responses show that:
Approximately four out of 10 respondents described ERM (39%) or GRC (44%) in their organizations as ad hoc or preliminary.
Respondents gave almost identical maturity ratings for GRC and ERM, which suggests a lack of differentiation between the two concepts.
Respondents indicated that more of their internal audit charters included governance (73%) than ERM (43%).
Respondents also indicated that more of their audit committee charters included governance (77%) than ERM (62%).
ERM was included in 19% more audit committee charters than internal audit charters.
Following is a detailed description of the results for questions on this topic.
MaturIty leVels of GrC and erM ProCesses
Respondents were asked to rate the maturity of their organization’s current GRC structure and ERM processes using the following scale.
Ad hoc—Undocumented; state of dynamic change; individual experiences.
Preliminary—Risk defined in different ways, in silos.
Defined—Common risk framework. Organizationwide view of risk. Action plans imple-mented in response to high priority risks.
Integrated—ERM activities coordinated. Common tools and processes, with enter-prisewide risk monitoring, measurement, and reporting. Scenario planning and process metrics in place.

The IIA Research Foundation 37
Optimized—Risk discussion embedded in strategic planning, capital allocation, and permeates into daily decision-making. Early warning system to notify board and management to risks above established thresholds.
Respondents consistently rated GRC and ERM at approximately the same maturity level (see exhibit 8.1).
Exhibit 8.1. Based on the [following] five maturity model classifications, rate your organization’s maturity of current ERM and GRC processes. (question 4)
ERM Maturity
GRC Maturity
13%16%
0%
5%
10%
15%
20%
25%
30%
35%
40%
45%
26%28%
39%
36%
19%
17%
4% 4%
Ad hoc DefinedPreliminary Integrated Optimized
N = 850 respondents for ERM maturity and 895 responses for GRC maturity
Note: As a result of rounding, totals may exceed 100%.
Given that GRC and ERM are different, although related, the expectation would be that maturity levels would be independent of each other; however, they were highly correlated.1 It is unlikely that GRC and ERM are at the same level of maturity for so many respondents. One possible explanation is that respondents did not differentiate between the two concepts. In other words, respondents considered GRC and ERM to be the same or similar.
Additional analysis showed that the maturity levels of both GRC and ERM were positively correlated with the size of the internal audit function. This was especially true at the optimized level. Notably, the correlation was stronger for the size of the internal audit function than for revenue. This suggests the possibility that larger internal audit staff size has a positive impact on the maturity of GRC and ERM.
GRC and ERM Maturity

www.theiia.org/research 38
Contrasting GRC and ERM
Perspective from Active Internal Audit LeadersLet’s consider possible reasons why many respondents indicated that GRC or ERM maturity in
their organizations was ad hoc or preliminary. Regarding low GRC maturity, José Luis Rojas, partner at Grant Thornton (Mexico), suggested that
many respondents have not yet recognized that strong GRC adds value to the business:
There has been a great push driven by regulators, bankers and shareholders toward adopting better governance structures that integrate risk management and compliance, but companies still have to realize that it is not a cost but a business driver and that trans-parency and good governance add value to their investments.
Regarding low ERM maturity, Rojas commented that, similar to GRC perceptions, many organiza-tions do not recognize that strong ERM adds value beyond regulatory compliance:
Most organizations still have an internal control process based on models such as COSO and CoCo [criteria of control] and are more concerned with complying with regula-tions rather than adopting best practices because they do not see the value added from a comprehensive ERM approach. It is important for governing institutions and collegiate bodies to spread such culture.
Similarly, Barry Leithhead, a consultant for governance, risk management, and internal auditing in Australia, stated that organizations are not embracing ERM because “they haven’t realized that it’s a profit-maker, not an overhead cost.”
Regarding the relatively low percentage of respondents who indicated maturity levels as integrated or optimized for GRC (21%) or ERM (23%), Steven Casazza, vice president and controller of Nestlé PetCare, confirmed:
[I have] not really seen any organization that has a highly integrated GRC model. [When] networking at conferences, I have yet to find anyone who has embedded GRC into the core DNA of the organization.
Internal audIt Charters
Another way to assess the maturity of GRC or ERM in an organization is to see whether these concepts are referenced in the internal audit charter and/or the audit committee charter. First, we’ll look at what respondents said about internal audit charters.
Internal audit responsibilities, as defined within their charter or the audit committee charter, generally focus more on controls and risk than on governance. This was consistent with the results about the internal audit charter (see exhibit 8.2).

The IIA Research Foundation 39
Exhibit 8.2. Are the following areas identified or referenced in your internal audit charter? (question 34)
yes no
governance 73% 27%
Control environment 88% 12%
risk 88% 12%
erm 43% 57%
specific internal controls 57% 43%
Compliance 87% 13%
Assurance services 61% 39%
extent of advisory services 56% 44%
mandatory audits 36% 64%
N = 266 respondents
Note: See appendix D for more detailed analysis by demographic groupings.
The elements that were most frequently included in the internal audit charter were:
Risk (88%)
Control environment (88%)
Compliance (87%)
Approximately seven out of 10 internal audit charters also included governance, but ERM was included in less than half:
Governance (73%)
ERM (43%)
Note that there was a gap of 30% between internal audit charters that included governance (73%) and internal audit charters that included ERM (43%). The lower percentage for ERM is probably due to organizations in the study that did not have an ERM process. The responses for the audit committee charters had a similar gap but not as extensive (see comments regarding exhibit 8.3).
audIt CoMMIttee Charters
Now that we’ve seen responses regarding the internal audit charter, let’s look at the audit committee charter. Historically, audit committees have been relied upon to provide oversight of the financial reporting process and results. This oversight responsibility for publicly traded companies creates a significant relationship between audit committees and external auditors. At the same time, the audit
GRC and ERM Maturity

www.theiia.org/research 40
Contrasting GRC and ERM
committee maintains oversight of the internal audit function—in many cases through a direct reporting relationship. As a result of these roles and the increased need for oversight of risk management, ERM processes also have frequently fallen under the purview of the audit committee.
Please see exhibit 8.3 for an overview of the governance and risk elements that respondents said were included in their organizations’ audit committee charters.
Exhibit 8.3. Are the following roles identified in your audit committee charter? (question 2)
roles formal Informal no unknown
governance 57% 20% 15% 9%
Control environment 59% 22% 11% 9%
risk 63% 19% 10% 8%
erm 36% 26% 28% 10%
Controls 70% 16% 7% 8%
Compliance 63% 19% 10% 8%
Assurance oversight 69% 13% 9% 9%
N = 914 respondents Note: As a result of rounding, totals may exceed 100%.
As indicated in exhibit 8.3, the elements that were most frequently included in the audit committee charter (formally and informally) were:
Controls (86%)
Risk, compliance, assurance oversight (82% for each)
Control environment (81%)
Governance (77%)
ERM (62%)
Note that there was a gap of 15% between inclusion of governance (77%) and inclusion of ERM (62%) in the audit committee charter. Possible reasons are that governance has been in place much longer than ERM. Also, governance is a more general term and therefore is more likely to be included to some extent in charters, whereas ERM, especially in the COSO context, is much more specific. Additionally, many organizations have not implemented ERM, and the ones that have may have assigned oversight to the entire board or a board committee other than the audit committee (for example, a risk committee).
Additional analysis showed that organizations with higher revenue and/or larger internal audit staff size were more likely to have governance and ERM roles identified within the audit committee charter.

The IIA Research Foundation 41
Comparing Internal Audit Charters and Audit Committee ChartersThere were some similarities and differences between the internal audit charters and the audit
committee charters worth noting:
Governance was included in audit committee charters (77%) and internal audit charters (73%) at about the same rate.
Audit committee charters are more likely to include ERM (62%) than internal audit charters (43%).
These differences exist even though the perceived maturity levels for GRC and ERM were almost identical (see exhibit 8.1).
Best practices charters are a factor as a criteria in a quality assessment review. The charter should ref lect the activities and role of the internal audit function. It is critical to reference governance, risk (ERM), and control in the audit committee and internal audit charters.
GRC and ERM Maturity

www.theiia.org/research 42
Chapter 9
vAlue PerCePtion oF grC And erm
how do internal auditors define the value of GrC and erM?
Value perception is an important component of the relationship between internal audit, management and the audit committee. The survey included several questions about value and areas of effective-
ness for GRC and ERM from internal audit’s perspective. Key findings include:
Internal auditors say that internal stakeholders’ top expectations for GRC and ERM are to reduce operational risk, organizational risk, financial reporting risk, and strategic risk, while enhancing the organization’s reputation.
Internal auditors perceive ERM as most effective at addressing financial risk and least effective at addressing governance risk.
In reference to the components in the definition of internal auditing, internal auditors rated their effectiveness at adding value in the following order (from highest to lowest): 1) controls, 2) compliance, 3) risk, 4) governance.
Internal stakeholder exPeCtatIons of BenefIts froM GrC and erM aCtIVItIes
The nature of a GRC or ERM program in an organization will be shaped by the expectations of internal stakeholders. Survey respondents were asked to indicate their stakeholders’ expectations regarding the benefits they expected from GRC or ERM activities. Exhibit 9.1 lists the benefits that were presented in the question, plus the responses for both GRC and ERM.

The IIA Research Foundation 43
Exhibit 9.1. Indicate your level of agreement. Internal stakeholders expect the following benefits associated with GRC activities (question 9)/ERM activities (question 16).
Benefits expectedGrC erM
sd* d* n* a* sa* sd* d* n* a* sa*
enhanced business strategy
3% 5% 29% 49% 14% 2% 6% 25% 54% 11%
enhanced reputation* 2% 3% 14% 50% 30% 1% 2% 20% 56% 20%
improved benchmarking 3% 8% 40% 38% 10% 2% 9% 44% 40% 6%
improved financial performance
4% 11% 29% 45% 13% 2% 11% 29% 47% 10%
improved market performance
3% 15% 46% 28% 7% 3% 13% 48% 29% 7%
lower financial reporting risk*
2% 3% 18% 53% 24% 2% 5% 21% 57% 15%
lower financial volatility 3% 10% 33% 44% 10% 2% 10% 34% 45% 8%
lower market volatility 5% 18% 47% 25% 4% 3% 15% 51% 27% 4%
lower operational risk* 2% 2% 12% 59% 25% 1% 2% 6% 62% 29%
lower organizational risk* 1% 1% 14% 59% 24% 1% 2% 10% 61% 26%
lower strategic risk* 2% 4% 21% 52% 22% 1% 1% 15% 60% 23%
reduced cost of capital 3% 15% 40% 34% 8% 2% 13% 44% 33% 8%
other 2% 2% 73% 14% 10% 5% 2% 60% 23% 10%
*SD = Strongly Disagree, D = Disagree, N = Neutral, A = Agree, SA = Strongly Agree
The respondents had few differences in their responses between GRC and ERM, even though the questions regarding GRC benefits and ERM benefits were separated by several questions within the survey (questions 9 and 16). While this may indicate a lack of differentiation between GRC and ERM, it also shows that internal auditors have a strong sense of what is most valuable to their stakeholders. See exhibit 9.2 for a summary of the top benefits internal stakeholders expect from GRC and ERM.
Exhibit 9.2. Internal Stakeholders’ Top Expectations for GRC and ERM (question 16 summary)
Benefits expected GrC erM
lower operational risk 84% 91%
lower organizational risk 83% 87%
enhanced reputation 80% 83%
lower financial reporting risk 77% 76%
lower strategic risk 74% 72%
Note: This table shows the percentage of internal auditors who agreed or strongly agreed that internal stakeholders expected the benefits. These are the top five percentages for GRC and ERM.
Value Perception of GRC and ERM

www.theiia.org/research 44
Contrasting GRC and ERM
effeCtIVeness of erM at addressInG dIfferent tyPes of rIsk
Because ERM is emerging as a new component in many organizations, it is interesting to see how the internal audit respondents assessed the effectiveness of ERM for addressing various risks. Respondents were asked to evaluate the effectiveness of their organization’s ERM process to identify, assess, and manage 18 types of risk. Their responses indicate that financial risk is considered a top area of effectiveness, while governance was considered one of the lowest areas of effectiveness. See exhibits 9.3 and 9.4 for details.
Risks That Are Most Effectively Addressed Through ERMThe four risk types that respondents ranked as most effectively addressed within their ERM
processes were financial, regulatory, compliance, and operating. These rankings were fairly consistent across identification, assessment, and management (see exhibit 9.3).
Exhibit 9.3. Risks That Internal Auditors Perceive to Be Most Effectively Identified, Assessed, and Managed Through ERM (question 26)
Identified assessed Managed
Financial risk Financial risk Financial risk
regulatory risk regulatory risk regulatory risk
Compliance risk operating risk operating risk
operating risk Compliance risk Compliance risk
economic risk Credit risk reputational risk
it risk it risk Credit risk
legal risk reputational risk legal risk
Note: This table is based on question 26: How effective do you believe your current ERM process is at adequately identifying, assessing, and managing the following types of risk? The survey question asked respondents to rate effectiveness on a scale of low (1), medium (2), high (3). A weighted score was calculated based on the number of responses within each category times the rating. The risks with the highest weighted scores are included in this table.
Risks That Are Least Effectively Addressed Through ERMExhibit 9.2 shows the risks respondents ranked as least effectively addressed within their ERM
processes. Respondents consistently gave lower ratings for governance, cultural, vendor, human capital, and environmental risks.

The IIA Research Foundation 45
Exhibit 9.4. Risks That Internal Auditors Perceive to Be Least Effectively Identified, Assessed, and Managed Through ERM (question 26)
Identified assessed Managed
governance risk governance risk external risk
environmental risk vendor risk environmental risk
human capital risk environmental risk human capital risk
vendor risk human capital risk vendor risk
Cultural risk Cultural risk Cultural risk
Note: This table is based on question 26: How effective do you believe your current ERM process is at adequately identifying, assessing, and managing the following types of risk? The survey question asked respondents to rate effectiveness on a scale of low (1), medium (2), high (3). A weighted score was calculated based on the number of responses within each category times the rating. The risks with the lowest weighted scores are included in this table.
how well does Internal audIt add Value, alIGnInG wIth the defInItIon of Internal audItInG
The IIA’s definition of internal auditing states that internal audit will add value through the assess-ment of four key areas: governance, risk, controls, and compliance. Respondents were asked to identify how strongly they agree that the internal audit activity in their organization is bringing value in these four areas (see exhibit 9.5).
Exhibit 9.5. To what extent do you agree that internal audit activities within your organization are aligned with The IIA’s Definition of Internal
Auditing to add value through the assessment of: (question 35)
assessment of:strongly disagree
disagree neutral agreestrongly
agree
governance 4% 5% 15% 44% 32%
risk 3% 4% 11% 44% 38%
Controls 3% 1% 4% 41% 51%
Compliance 4% 4% 6% 49% 37%
N = 268 respondents
Value Perception of GRC and ERM

www.theiia.org/research 46
Contrasting GRC and ERM
The responses in exhibit 9.5 are remarkably parallel with the evolution of internal auditing described in chapter 3 (see exhibit 3.1). Historically, internal audit has progressed from assessing controls to risk to governance. Ref lecting that pattern, respondents scored themselves highest in controls and lowest in governance (see exhibit 9.6)
Exhibit 9.6. The Effectiveness of Internal Audit at Adding Value (question 36 - summary results)
assessment of:Percentage of respondents who agreed
or strongly agreed that internal audit adds value through the assessment of:
Controls 92%
Compliance 86%
risk 82%
governance 76%
Note: This table is based on responses to question 35: To what extent do you agree that internal audit activities within your orga-nization are aligned with The IIA’s Definition of Internal Auditing to add value through the assessment of:
Exhibit 9.6 indicates an opportunity to enhance the value-added proposition of internal audit by increasing the emphasis on governance.
Richard Anderson, Clinical Professor of Strategic Risk Management at DePaul University, commented that for internal audit to add more value in assessing governance, its role should be clearer:
There is a lack of clarity on exactly what governance encompasses on the part of both internal auditors and their organizations. As a result, it is not clear to stakeholders or audi-tors which governance processes and risks should be part of the scope of internal auditing.
Adding value to the organization will always be an area where internal audit will work to improve and expand. The next chapter highlights the survey respondents’ suggestions for improving GRC and ERM in an organization.

The IIA Research Foundation 47
Chapter 10
imProving grC And erm
how do internal auditors think GrC structures and erM processes can be improved?
This chapter reports the survey responses related to improving GRC and ERM in an organization. Key themes include:
Respondents were most positive regarding the impact of auditing ERM but most negative regarding the impact of leading the ERM process (see exhibit 10.1).
Based on survey responses, the researchers identify seven ideas for improving GRC and 15 ideas for improving ERM.
Based on their experience, the researchers suggest audit strategies for governance (especially related to the control environment).
faCtors that Could PosItIVely or neGatIVely IMPaCt erM at an orGanIzatIon
Internal auditors were asked to project whether certain conditions would have a positive or negative impact on an organization’s ERM process (see exhibit 10.1).
Exhibit 10.1. What impact would the following have on an organization’s ERM processes? (question 25)
extremely Positive
Positive neutral negativeextremely negative
weighted score*
internal audit of erm process 59 172 46 4 0 286
oversight by independent board risk committee
63 145 57 8 3 257
independent chief risk officer (Cro) reporting to the board
81 94 78 17 2 235
Ceo oversight of erm processes 47 148 51 26 8 200
Cro reporting to the Ceo 48 127 64 29 4 186
oversight by non-independent board risk committee
10 77 101 71 17 -8
internal audit function leads erm process
18 68 94 72 26 -20
*Weighted score computed based on point system in which Extremely Positive = 2; Positive = 1; Neutral = 0; Negative = -1; and Extremely Negative = -2.
www.theiia.org/research 48
Contrasting GRC and ERM
Note that while most respondents were most positive about the impact of auditing the ERM process, they were the most negative about leading it.
This position is consistent with IIA guidance, particularly IIA Position Paper, Role of Internal Auditing in Enterprise Risk Management, which states that internal audit should not take accountability for risk management.1
In addition, chapter 11 of this report indicates that, in practice, internal auditors also do not take the lead in ERM. Exhibit 11.4 shows that while 68% of respondents indicated that they support ERM processes on an annual or more frequent basis, only 31% indicate that they lead ERM processes on an annual or more frequent basis.
surVey resPondents’ Ideas for IMProVInG GrC and erM
Survey participants were asked to provide subjective responses for improving GRC and ERM. After reviewing the comments, the researchers identified the following key themes for GRC:
1. Develop a consistent language related to governance within the organization.
2. Educate management on the benefits of effective governance practices.
3. Ensure that management effectively communicates the need for all stakeholders to contribute to the overall governance process.
4. Develop measurable key performance indicators (KPIs) that can be used to evaluate the governance, risk, and controls processes.
5. Monitor and audit against KPIs and communicate results periodically to the board (committees) and other stakeholders via an effective medium and content for each.
6. Integration of risk management processes as opposed to silo-based approach.
7. Effective ethical tone at the top.
The researchers also identified the respondents’ key themes for improving ERM processes. Their suggestions especially emphasized board responsibility for oversight or, alternatively, delegation of over-sight to the audit committee or risk committee. Also, appropriate organization infrastructure and having a chief risk officer (CRO) with responsibility and accountability for ERM execution were considered critical. Additional detailed comments related to improving ERM follow:
1. Objectives must exist before management can identify potential events affecting their achievement.
2. Align the organization’s risk appetite to strategy objectives.

The IIA Research Foundation 49
3. Appropriate emphasis of the impact of culture on the risk process.
4. Embed a risk culture throughout the organization.
5. Conduct internal audits of ERM processes with comprehensive reporting to the audit or risk committee of the board.
6. Appointment of a dedicated resource, chief risk officer (CRO), with an independent functional reporting relationship to the board audit or risk committee.
7. Delineation of responsibility and accountability for ERM process by the CEO and senior management.
8. Senior management needs to buy in and communicate the values and benefits related to the ERM processes.
9. Identification of a risk universe with a continuous dynamic risk assessment approach that considers traditional existing and emerging risks.
10. Incorporation of opportunities (upside risk) in addition to threats (downside risk).
11. Utilization of a top-down and bottom-up approach to result in a more comprehensive risk assessment process with increased employee buy-in.
12. Integration of ERM with business processes.
13. Use of a balanced set of quantitative and qualitative measures in the risk assessment process.
14. Continuous improvement and gap assessment between existing and effective processes.
15. Communication and education to improve understanding of ERM.
suGGested audIts for GoVernanCe (related to the Control enVIronMent)
This section contains recommendations from the research team for auditing governance, partic-ularly the control environment. Historically, internal audit has allocated a significant amount of time to auditing control activities but perhaps too little attention to the control environment. This is partly due to the objective nature of control activities and the subjective nature of the control environment, and partly due to the perceived role of internal audit in the past. Because the control environment is the foundation for organizational governance, audits of the control environment provide a significant opportunity for internal audit to add value and contribute to GRC.
Improving GRC and ERM

www.theiia.org/research 50
Contrasting GRC and ERM
The following explains the components of the control environment and the potential audits that may be conducted to provide value to the organization.
Components of a Control EnvironmentThe first step in preparing for a governance audit is to understand the difference between a unit
audit, a process audit (ERM), and a governance audit (which would include the control environment). Unit-level audits typically address the control activities while entity-level audits help evaluate the control environment (governance).
Governance audits focus on the components of the control environment, which include:
Integrity and ethical values
• Corporate culture
Tone at the top—management philosophy and operating style
• Control conscience
• Employee morale
Organizational structure
• Competence of personnel
• Adequacy of staffing
• Assignment of authority and responsibility
Human resources—policies and practices
• Accountability and recognition for actions
Suggested Control Environment (Governance) AuditsWhen making plans to audit governance, it is best to consult the Standards for guidance. Standard
2110: Governance states:
The internal audit activity must assess and make appropriate recommendations for improving the governance process in its accomplishment of the following objectives:
Promoting appropriate ethics and values within the organization;
Ensuring effective organizational performance management and accountability;
Communicating risk and control information to appropriate areas of the organization; and
Coordinating the activities of and communicating information among the board, external and internal auditors, and management.

The IIA Research Foundation 51
Consistent with the requirement of Standard 2110, following are several examples of entity-level audits that CAEs should consider for their control environment audit plans. These audits are related to governance and ref lect the difference between a governance audit and an ERM audit.
Conflict-of-Interest Statement (Ethics and Values)The audit of the conf lict-of-interest statement is important because conf licts of interest correlate with fraud cases. The audit should identify who manages the process and who they report to. Who manages the process and their organization status is the most critical element of the audit. The audit also should include the design, all-inclusiveness, dissemination, collection, and disposition aspects.
Communication ProcessOne element of the communication process is the complaint hotline. The quality of this process can be an indirect evaluation of one component of the control envi-ronment and governance. Critical to this audit is the appropriate selection of the process owner and their reporting relationships. The audit should include the design, compliance, disposition, and reporting. If outsourced, multiple reporting would be needed with one copy going directly to the CAE. It cannot be overemphasized that this process will not function unless employees perceive that management sincerely wants their comments and feedback. Often, management tends to favor good news.
Executive Expense ReportsThe executive expense reports are a litmus test of the integrity of senior management. These reports directly or indirectly address the integrity and ethical value compo-nent in the control environment. The internal audit charter should list the executive expense reports as a mandatory annual audit. The charter of the audit committee should delineate the committee’s responsibility to review the annual audit report of executive expenses. Involvement of the audit committee in this process is critical. The audit committee charter and the internal audit charter should articulate and be consistent relative to executive expenses. The audit of the expense reports should include a process audit as well as a transac-tion approach. The process includes the design, authorization, approval, budget, and oversight. The transaction aspect includes a review of each report for compliance with established policies and procedures.
Best Practices for the Audit CommitteeThe internal audit function can add value by ensuring that the audit committee operates using best practices. This would not necessarily be classified as an audit but as a best practice review that provides a gap analysis, including improvements for consideration. The review objectives would include determining that the audit committee charter is all-inclusive relative to the committee’s expected responsibili-ties and includes best practices. The audit should determine that the audit committee
Improving GRC and ERM

www.theiia.org/research 52
Contrasting GRC and ERM
performs gap analysis, implements needed adjustments, and documents fulfillment of its responsibilities.
Other areas of the control environment (governance) that can be audited include:
• ERM (auditing ERM could be considered a subset of auditing governance)
• The strategic planning process
• Executive compensation and benefits
• Corporate policy
• The annual employee survey
Keeping the practical suggestions from this chapter in mind, the next group of chapters captures responses related to the current state of GRC and ERM activities at respondent organizations.

The IIA Research Foundation 53
Chapter 11
internAl Audit involvement in grC And erm
what is the current level of internal audit involvement in GrC and erM?
This chapter presents various activities that internal audit provides related to GRC activities and ERM processes. Readers can use the information presented to gain perspective on their own organizations. Key findings include:
Approximately six out of 10 respondents reported that internal audit was moderately or extensively involved in GRC and ERM in their organizations (see exhibit 11.1).
Approximately eight out of 10 survey respondents said their organizations had implemented an ERM program (see exhibit 11.2).
Significant percentages of respondents indicated that their internal audit functions did not conduct assessments of governance (25%) or ERM (34%) in their organizations (see exhibit 11.3).
Approximately one in four respondents indicated that their internal audit functions never audit the code of ethics/conduct process (25%) or the conf lict of interest process (23%) (see exhibit 11.4).
Almost half of respondents indicated their internal audit functions never audit executive compensation and benefits (45%), and one in four indicated they never audit executive expense reporting (25%) (see exhibit 11.4).
Respondents indicated that they more frequently provided reports on controls, compliance, the control environment, and risk to their stakeholders than reports on ERM and governance.
Generally speaking, approximately 20% to 30% of internal audit respondents said that they provided ERM or governance training for the audit committee, executive management, or management. Notably, almost 50% of respondents indicated that they provided training for management on controls.
Internal audIt InVolVeMent wIth GrC and erM
The majority of internal audit functions in the survey were moderately or extensively involved in GRC (68%) and ERM (66%) at their organizations (see exhibit 11.1).

www.theiia.org/research 54
Contrasting GRC and ERM
Although the percentages of involvement for GRC and ERM were nearly identical, the Pearson correlation between GRC and ERM ratings was 0.41, indicating that the responses for GRC and ERM were positively correlated, but still had a level of independence.
Exhibit 11.1. What is the extent of your internal audit function’s involvement in: (question 33)
response extensive Moderate limited none
grC 33% 35% 23% 9%
erm 32% 34% 24% 10%
N = 272 respondentsNote: See appendices E and F for more detailed analysis by demographic groupings.
Important information about the different levels of involvement according to demographic char-acteristics is included in appendix E (for GRC) and appendix F (for ERM). Following is a sample of the key findings:
One might expect that larger internal audit functions and larger organizations would have more internal audit involvement in GRC and ERM. This appears to be true for ERM (see appendix F) but not for GRC (see appendix E).
Internal audit functions’ involvement in GRC activities is more extensive for publicly traded organizations than for nonprofit, privately held, and governmental agencies.
Internal audit functions in the manufacturing industry have slightly more extensive involvement in GRC than the other industries identified.
IMPleMentatIon of an erM ProGraM
Approximately eight out of 10 survey respondents said their organizations had implemented an ERM program, either formal or informal (see exhibit 11.2).

The IIA Research Foundation 55
Exhibit 11.2. Has your organization implemented a formal ERM program? (question 13)
Yes, informal
Yes, formal (i.e., explicitlystated and documented)
No
52%
29%
19%
N = 334 respondents
Internal audIt assessMent of erM and GrC CoMPonents
Survey respondents indicated high levels of involvement in assessing risk, controls, compliance, and the control environment, but approximately 20% lower involvement for assessing governance and ERM (see exhibit 11.3).
Exhibit 11.3. How frequently does your internal audit function assess: (question 40)
area assessedContinual
assessmentannual
assessmentnot assessed
governance 37% 39% 25%
Control environment 43% 51% 5%
risk 52% 40% 8%
erm 26% 40% 34%
Controls 69% 30% 1%
Compliance 59% 37% 4%
N = 269 respondentsNote: See appendix H for more detailed analysis by demographic groupings.
Internal Audit Involvement in GRC and ERM

www.theiia.org/research 56
Contrasting GRC and ERM
Exhibit 11.3 shows that at least 90% of internal audit functions in the survey assessed the following areas:
Controls (99%)
Compliance (96%)
Control environment (95%)
Risk (92%)
However, assessment involvement for governance and ERM was much lower:
ERM (66%)
Governance (75%)
The low percentage of involvement in ERM is partly due to ERM not being implemented in 19% of the responding organizations. However, all organizations have governance, so internal audit could be involved in assessing governance in any organization.
Also, regarding governance, it is interesting to note that while 95% of respondents said they assessed the control environment, only 75% said they assessed governance. Because governance is the basis of the control environment, one might expect that the percentages for governance and the control environment to be more similar. The difference may indicate that respondents do not identify the control environ-ment as being a part of governance, or they may have been uncertain as to what processes would be included in the term governance.
Insight into the Survey ResultsInterviews with experienced internal auditors provided insight into the various reasons behind
lower percentages for governance and ERM assessments. Joel Kramer, managing director for the internal audit division of MIS Training Institute, offers the
following explanation of why audit efforts often focus on the control activity much more than on the control environment:
In my opinion, [it’s] because education and entry-level audit training are geared to the basic control activities rather than how control activities are a key component of gover-nance to mitigate a material risk.
The researchers suggest that one reason training may be geared toward controls rather than gover-nance is that the COSO model emphasizes audit efforts related to the control activities but pays relatively little attention to the control environment.
Roger McDaniel of Audit Services stated that among the many internal audit functions he has reviewed, “very seldom do I find governance given due consideration in the audit plan.”

The IIA Research Foundation 57
Joyce Vassiliou, director of internal audit at Coca-Cola Hellenic Bottling Company, commented:
I believe many internal audit functions are reluctant to assess ERM and governance, as many internal audit shops have limited or no experience in auditing these processes. Furthermore, under the current economic situation, audit budgets are strained and companies are focusing their internal audit resources on operations, maintaining SOX [Sarbanes-Oxley], and anti-fraud programs.
Demographic DifferencesFor complete details about the demographic differences in assessing GRC and ERM based on orga-
nization size, region, and industry, see appendix H. Notable observations include:
Internal audit functions of organizations with revenues of $10 million to $50 million were least likely to assess ERM (55%) and governance (40%).
Internal audit functions of not-for-profit organizations were least likely to assess ERM (60%) and governance (40%).
Internal audit functions in the transportation and healthcare industries were least likely to assess ERM (50% and 47% respectively) or governance (38% and 35% respectively).
Internal audit functions of organizations located in the United States and Canada and Western Europe were least likely to assess ERM (41% and 31% respectively), while organizations based in Latin America were least likely to assess governance (40%).
Possibly as a result of resource constraints, smaller internal audit functions (fewer than 10 full-time equivalents) are least likely to assess ERM and governance (see exhibit H.3 for detailed percentages).
freQuenCy of InVolVeMent In sPeCIfIC GrC and erM ProCesses
Internal audit involvement in GRC and ERM can occur in a wide range of frequency, from twice a year to once every five years. See exhibit 11.4 for a perspective on the amount of time internal audit functions are spending on their GRC and ERM activities. Also note the percentages who say that their functions do not perform the activities at all.
Internal Audit Involvement in GRC and ERM

www.theiia.org/research 58
Contrasting GRC and ERM
Exhibit 11.4. How frequently does the internal audit function perform the following in your organization? (question 41)
twice or More Per
yearannually
Periodically (at least every 3 years)
rarely (e.g., every
5 years)
not Performed
Audits bribery/corruption risks (e.g., FCPA, uk bribery Act)
7% 19% 16% 14% 43%
Audits the code of ethics/conduct process
5% 32% 23% 17% 25%
Audits the conflict of interest process
5% 28% 24% 20% 23%
Audits erm processes 8% 23% 14% 10% 45%
Audits executive compensa-tion and benefits
3% 24% 15% 14% 45%
Audits executive expense reporting
7% 33% 25% 10% 24%
Audits the whistleblower policy/process
6% 24% 19% 13% 38%
leads the erm processes 14% 17% 5% 3% 62%
supports the erm processes 32% 33% 8% 6% 22%
reports on the erm process to the audit committee
19% 31% 10% 3% 36%
reports on grC to the audit committee
25% 26% 7% 3% 39%
N = 268 respondentsNote: See appendix G for more detailed analysis by demographic groupings.
In reference to the control environment, note the following key observations:
Approximately one in four respondents indicated that their internal audit functions never audit the code of ethics/conduct process (25%) or the conf lict of interest process (23%).
Almost half of respondents indicated their internal audit functions never audit executive compensation and benefits (45%), and one in four indicated they never audit executive expense reporting (25%).
Further Analysis of “Reports on GRC to the Audit Committee”One specific area of exhibit 11.4 that merited additional analysis is the percentage of respondents
who “report on GRC to the audit committee” (see appendix G). Responses were analyzed by organi-zation size, type, industry, and location. Demographic groups that had the highest percentages for not reporting GRC to the audit committee were:
Organizations with revenues of $100M to $500M (54%)

The IIA Research Foundation 59
Nonprofit (48%) and privately held (52%) organizations
Organizations in the transportation, manufacturing, utilities, and government industry
United States and Canadian (46%) and Latin American (40%) organizations
Internal audit functions with one full-time equivalent staff (46%) as well as 11 to 20 full-time equivalent staff (49%)
rePortInG lInes for GrC and erM
Survey respondents were asked to consider various reporting lines and indicate whether they provided reports to them regarding GRC and ERM components (see results in exhibit 11.5).
Exhibit 11.5: Please indicate if your internal audit function reports on the following items and, if so, who receives the report. (question 42)
recipient
Items reported
GovernanceControl
environmentrisk erM Controls Compliance
board 21% 25% 27% 21% 25% 24%
Audit committee 60% 77% 75% 54% 86% 80%
risk committee 11% 11% 21% 19% 14% 13%
Ceo 47% 59% 58% 44% 64% 61%
CFo 36% 53% 50% 37% 63% 50%
Cro 12% 13% 21% 18% 16% 17%
legal counsel 18% 24% 26% 18% 27% 35%
other 10% 21% 19% 11% 27% 21%
not reported 32% 11% 14% 37% 2% 10%
N = 269 respondentsNote: Percentages per column can exceed 100% as each type of reporting may be provided to multiple stakeholders.
Taken as a whole, the data indicates that the audit committee, CEO, and CFO are most likely to receive reports related to controls, compliance, the control environment, and risk. They are less likely to receive reports related to ERM and governance. Also, consistent with The IIA’s International Professional Practices Framework (IPPF), the primary reporting line was to the audit committee with a notable percentage of reports also being provided to the CEO and CFO of the organization.
Internal Audit Involvement in GRC and ERM

www.theiia.org/research 60
Contrasting GRC and ERM
traInInG ProVIded to orGanIzatIonal stakeholders By Internal audIt
Internal audit functions often provide training to various organizational stakeholders on compli-ance, controls, ERM, governance, and risk. Exhibit 11.6 summarizes the topics and stakeholders to whom training is provided.
Exhibit 11.6. Does your internal audit function provide any educational training to the board of directors, audit committee, executive management,
management, or staff levels related to: (question 46)
Group Compliance Controls erM Governance risk
board of directors 11% 8% 8% 9% 8%
Audit committee 29% 31% 24% 23% 31%
executive management 27% 29% 27% 20% 30%
management 36% 48% 28% 24% 38%
Audit staff 51% 56% 37% 38% 48%
none 34% 25% 41% 40% 31%
Note: Percentages in the rows and columns can exceed 100% because respondents were able to select more than one topic and group for which they provided training. The percentages were calculated based on the number of respondents who completed any part of the question, which was 264.
The responses in this table can best be understood by looking at the differences between groups and then looking at the differences between training topics.
Differences between GroupsThe left column shows groups that receive training from internal audit. They can be organized
as follows:
Board of directors
Audit committee, executive management, management
Audit staff
Respondents provided the least amount of training to boards of directors (approximately 10%). Training levels for audit committee, executive management, and management were much higher (with the percentage who offered training ranging from 23% to 48%, depending on group and topic).
Interestingly, a recent McKinsey study indicates that less than 25% of board members surveyed indicated that they had a “complete understanding” of the current strategy of the organizations on whose board they serve. Perhaps there is an opportunity for training in this area as well.1 As a result of complexity within industries, there are many opportunities for industry-specific training relative to governance, risks, and controls (i.e., financial services debacles).

The IIA Research Foundation 61
Differences Between Training TopicsGenerally speaking, approximately 20% to 30% of internal audit respondents said that they provided
ERM or governance training for the audit committee, executive management, or management.It is worth noting that almost 50% of respondents indicated that they provided training for
management on controls, which was a significantly higher percentage than any of the other topics for management, executive management, or the audit committee.
In summary, this chapter presented the findings regarding internal audit involvement in GRC and ERM. Responses consistently showed the current involvement is not yet at the same level as involvement in control, compliance, and risk. The next chapter looks specifically at ways that internal audit functions include ERM in their audit planning.
Internal Audit Involvement in GRC and ERM

The IIA Research Foundation 62
Chapter 12
Audit PlAnning
how do internal auditors incorporate risk and erM into their audit planning?
Risk is a key factor in audit planning for a majority of organizations in the survey. But there is a differ-ence between using a risk-based approach and having a connection with ERM. This chapter looks
at how much connection respondents had with ERM in their organizations. Key findings include:
Almost all internal audit functions in the survey used a risk-based approach for their audit and engagement planning.
A high percentage of respondents said that their internal audit functions connected with ERM for annual audit planning (84%) and engagement planning (76%).
A total of 77% of respondents indicated that their organizations have a process for establishing risk tolerance levels, whether formal or informal (exhibit 12.3).
Approximately six out of 10 respondents indicated that their organizations had a chief risk officer (CRO), either formally or informally.
rIsk-Based audIt PlannInG
Risk-based audit planning was the norm among survey respondents (see exhibit 12.1).
Exhibit 12.1. Does your internal audit function use a risk-based approach for: (question 43)
response yes Partially no
internal audit annual planning (i.e., resource allocation, macro planning) 86% 12% 2%
engagement planning (micro planning) 77% 20% 4%
N = 261 respondents
Note that the engagement planning was more likely to be partially connected with ERM than the annual audit planning. Now let’s look at the connection to ERM.
ConneCtIons Between erM and audIt PlannInG
The ERM process should be an input factor in developing both the risk-driven audit plan and the risk-driven engagement plan. Each audit should provide feedback to the ERM process relative to any

The IIA Research Foundation 63
risks not previously identified or miscalculated. Survey participants indicated that some level of commu-nication exists between the ERM processes and the internal audit annual planning (84%) or engagement planning (76%) process (see exhibit 12.2). As might be expected, there is less connection between the ERM and engagement planning than the connection to resource allocation. This suggests that there is an opportunity for more of the results of the audit engagements to provide feedback to the ERM process.
Exhibit 12.2. Classify the type of connections that exist between ERM and your macro- and micro-level internal audit risk assessment/plan. (question 44)
No connection
Informal connection orcommunication
Formal connection orcommunication
11844%
4216%
10840%
ERM and the internal audit risk assessment (internal audit annual planning or resource
allocation) (question 44, part a)ERM and internal engagement planning
(question 44, part b)
8231%
6424%
12045%
N = 268 for question 44, part a, and 266 for question 44, part b
estaBlIshInG rIsk toleranCes
A total of 77% of respondents indicated they have a process for establishing risk tolerance levels, whether formal or informal (see exhibit 12.3). As of March 2010, the U.S. Securities and Exchange Commission (SEC) began requiring proxy statements to include a disclosure of the board’s oversight practices related to the risk management process. Therefore, it is expected that the percentage using a formal process will increase.
Audit Planning

www.theiia.org/research 64
Contrasting GRC and ERM
Exhibit 12.3: How would you classify your organization’s process for establishing risk tolerance levels? (question 19)
No process
No process, (planning stage)
Informal process
Formal process
31%
10%
13%
46%
N = 231 respondentsNote: Responses were filtered to only include respondents who indicated they had an ERM program (formal or informal).
ChIef rIsk offICer InVolVeMent
Approximately 62% of respondents indicated that their organization had a CRO, either formally or informally (see exhibit 12.4). This compares to 77% of respondents indicating that their organization has an ERM program.
Exhibit 12.4. Does your organization have a chief risk officer? (question 15)
response %
no 38%
yes, but with another title 13%
yes, informal 20%
yes, formal 29%
With the role of risk firmly established in the internal audit function, let’s look at the different risk assessment approaches internal auditors use.

The IIA Research Foundation 65
Chapter 13
risk Assessments
what risk assessment approaches do internal auditors use?
The understanding and perception of risk is impacted by the methodology used to drive the risk-driven audit plan and risk-driven engagement plan. The perception and understanding of risks is
also impacted by whether an organization uses a risk-based approach or a unit-based approach. Key findings include:
Three out of four respondents used a combination of qualitative and quantitative methods to assess risk (see exhibit 13.1).
Respondents whose organizations had a formal or informal ERM process were more likely to use a qualitative-only approach to risk assessment (35% and 38% respectively) than were respondents in general (15%). (Compare exhibits 13.1 and 13.2.)
Approximately two-thirds (63%) of respondents used a top-down, risk-based approach for internal audit planning compared to one-third (33%) who used a risk-ranked units, bottom-up approach (see exhibit 13.3).
Fifty-six percent of respondents with a formal or informal ERM process use a centralized, corporatewide approach (see exhibit 13.4).
rIsk assessMent—QualItatIVe or QuantItatIVe?
Exhibit 13.1 shows that a relatively low percentage of respondents assessed risk using either quali-tative (15%) or quantitative methods (6%). The combination approach was the most widely used (77%).

www.theiia.org/research 66
Contrasting GRC and ERM
Exhibit 13.1. How does your internal audit function assess risk? (question 39)
Do not assess risk
Combined (quantitativeand qualitative)
Quantitatively
Qualitatively6%
2%
15%
77%
N = 271 responses
rIsk assessMent—dIfferenCes for orGanIzatIons wIth an erM ProCess
Respondents whose organizations had a formal or informal ERM process were more likely to use a qualitative-only approach to risk assessment (35% and 38%) than respondents in general (15%). (Compare exhibits 13.1 and 13.2.)
While quantification enhances the risk analysis process, many risks (for example, reputational) do not facilitate a quantified approach. It is expected that the combination approach (with qualitative and quantita-tive measures) will remain relevant as experience with risk assessment matures.. Along these lines, note that organizations with formal ERM processes were slightly more likely to use a combination approach for risk assessment than organizations with an informal ERM process (64% and 57% respectively). See exhibit 13.2.
Exhibit 13.2. Is the approach of the risk assessment process: (classified based on formal or informal ERM process) (question 24)
formal erM
ProcessInformal erM Process
response % %
Qualitative (categorical, e.g., high/medium/low) 35% 38%
Quantitative (a mathematical calculation) 1% 4%
Combination (both categorical and mathematical) 64% 57%
other, please specify: 0% 1%
total responses 150 81
Note: Results were filtered to include only respondents who said they had a formal ERM process or an informal ERM process.

The IIA Research Foundation 67
MaCro-leVel rIsk assessMent—unIt aPProaCh or rIsk aPProaCh?
For planning use of resources at a macro-level, twice as many respondents used the risk approach (identifying and ranking the top risks) over the risk-ranked units approach (identifying the units and ranking the top units by risks). See exhibit 13.3.
Exhibit 13.3: In conducting the macro-level risk assessment (internal audit planning of resource allocation), does internal audit use
a risk approach or risk-ranked units? (question 38)
Do not use risk-basedapproach
RIsk-ranked units (identifythe units and rank the topunits by risks)
Risk approach (identify andrank the top risks
4%
33%
63%
N = 268 respondents
rIsk assessMent—dePartMental, CentralIzed, or a CoMBInatIon
As the experience with risk matures, it is expected that organizations will move from a silo approach to a centralized risk approach. A total of 56% of respondents with formal or informal ERM processes use a centralized, corporatewide approach (see exhibit 13.4). The Pearson correlation between respondents’ ranking of their organizations’ ERM maturity and the use of a centralized risk approach was positive (0.28 correlation; significant at <.01).
Risk Assessments
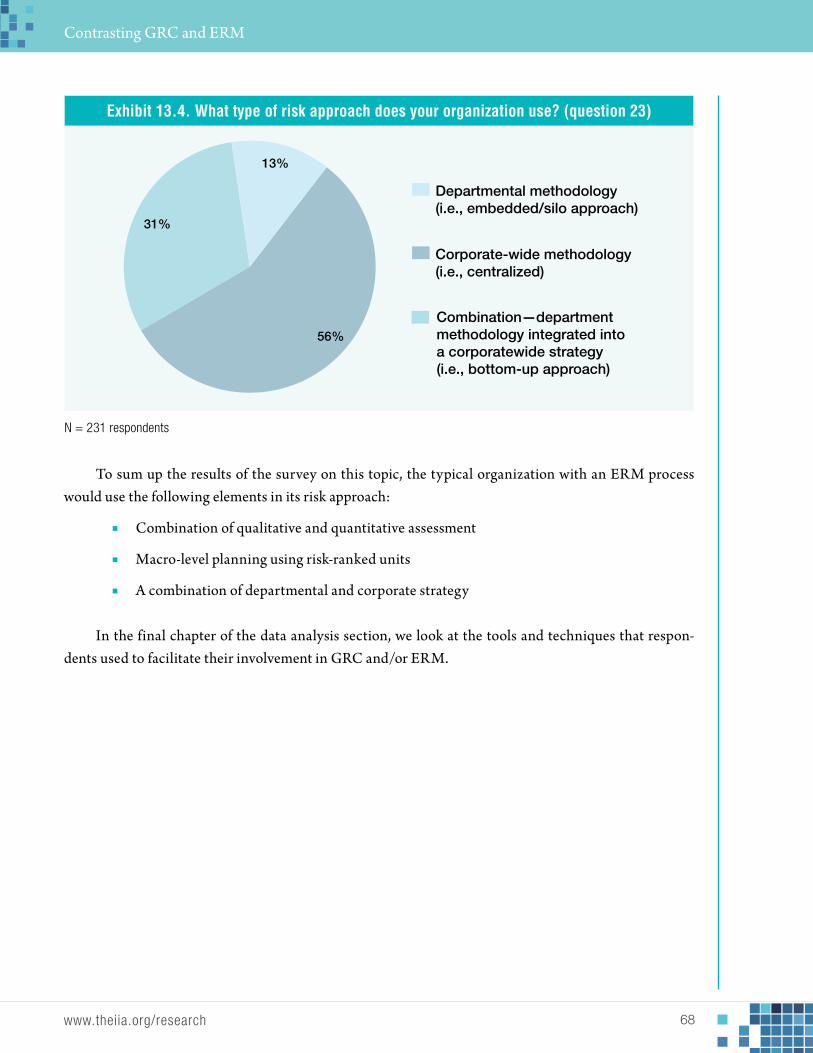
www.theiia.org/research 68
Contrasting GRC and ERM
Exhibit 13.4. What type of risk approach does your organization use? (question 23)
Combination—department methodology integrated intoa corporatewide strategy(i.e., bottom-up approach)
Corporate-wide methodology(i.e., centralized)
Departmental methodology(i.e., embedded/silo approach)
13%
31%
56%
N = 231 respondents
To sum up the results of the survey on this topic, the typical organization with an ERM process would use the following elements in its risk approach:
Combination of qualitative and quantitative assessment
Macro-level planning using risk-ranked units
A combination of departmental and corporate strategy
In the final chapter of the data analysis section, we look at the tools and techniques that respon-dents used to facilitate their involvement in GRC and/or ERM.

The IIA Research Foundation 69
Chapter 14
FrAmeworks And tools
what frameworks and tools do internal auditors currently use related to GrC and erM?
Internal audit functions use various frameworks and tools to manage the additional responsibilities that come from their involvement in GRC and ERM. This includes finding ways to benchmark their prac-
tices and finding software tools to offer support. This chapter gives key findings about practices among respondents, such as:
Approximately one out of three respondents indicated that they had moderate to extensive use of continuous auditing (31%), continuous monitoring (32%), or control self-assessment (CSA) (37%).
A total of 24% of organizations with a formal or informal ERM process do not use a formal framework.
Few respondents performed extensive benchmarking related to GRC (5%) or ERM (6%), and 23% reported a moderate level of benchmarking for both GRC and ERM.
Respondents reported greater use of vendor-developed software related to GRC activities (25%) than ERM processes (19%).
tools and fraMeworks used By Internal audIt In General
First, let’s look at what tools and frameworks the survey respondents said that they use for overall internal audit activity at their organizations (see exhibit 14.1).

www.theiia.org/research 70
Contrasting GRC and ERM
Exhibit 14.1. Does your internal audit function use the following tools or frameworks? (question 45)
extensive
useModerate
useMinimal
useno
not applicable
Continuous auditing 9% 22% 28% 40% 1%
Continuous monitoring 10% 22% 30% 36% 1%
Control self-assessment (CsA) 13% 24% 22% 40% 2%
Coso–erm 19% 28% 17% 35% 1%
Coso – internal Control 43% 33% 7% 16% 1%
Control of criteria (CoCo) 5% 10% 9% 65% 10%
iso 31000 9% 11% 11% 60% 10%
N = 269 respondents
Approximately one out of three respondents indicated that they had moderate to extensive use of continuous auditing (31%), continuous monitoring (32%), or control self-assessment (CSA) (37%).
The different levels of usage for COSO, CoCo, and ISO31000 can be attributed to the global scope of the survey respondents. Because the majority of respondents were from the United States, the COSO usage was high (76% for COSO’s Internal Control and 47% for COSO’s ERM).
fraMeworks used By Internal audIt for erM
Exhibit 14.2. Which ERM framework, if any, does your organization follow? (question 22)
52%
21%
9%
3%1%
24%
0%
10%
20%
30%
40%
50%
60%
COSO ERM
ISO 31000
AS/NZ 4360
King III
Turnbull
No formal framework used
N = 231 respondents

The IIA Research Foundation 71
A total of 24% of responding organizations with a formal or informal ERM process do not use a formal framework. The primary frameworks that respondents used for ERM were COSO’s ERM (52%) and ISO 31000 (21%). With the relatively recent publication of ISO 31000, the number of organizations using this model might be expected to increase. As organizations increase their adoption of ERM and move from an informal to a formal approach, it is expected that either COSO’s ERM or ISO 31000 may be the framework of choice.
GrC and erM BenChMarkInG
Respondents were asked to indicate their organizations’ level of benchmarking relative to GRC and ERM. As evidenced in exhibit 14.3, there were no significant differences in the benchmarking responses between GRC and ERM. Because ERM is a repeatable process, it appears that it would be easier and a more likely candidate for benchmarking.
Exhibit 14.3. To what extent does your organization perform benchmarking related to GRC/ERM? (question 6)
Extensive
Moderate
Limited
None
5%
33%
39%
23%23%
6%
29%
41%
GRC Benchmarking ERM Benchmarking
N = 507 respondents for GRC and 512 respondents for ERM
Very few of the responding organizations perform extensive benchmarking. Only 5% conduct extensive benchmarking for GRC and 6% for ERM.
In addition to resource and time constraints that would prevent benchmarking, Michael Head, chief audit executive of TD Ameritrade, noted:
Unlike internal auditing, there is not a recognized governing body (such as COSO, The IIA, or another organization) to look to for guidance and overall coordination, promoting GRC and ERM. As a result, there is no credible source of best practices to benchmark against.
Frameworks and Tools
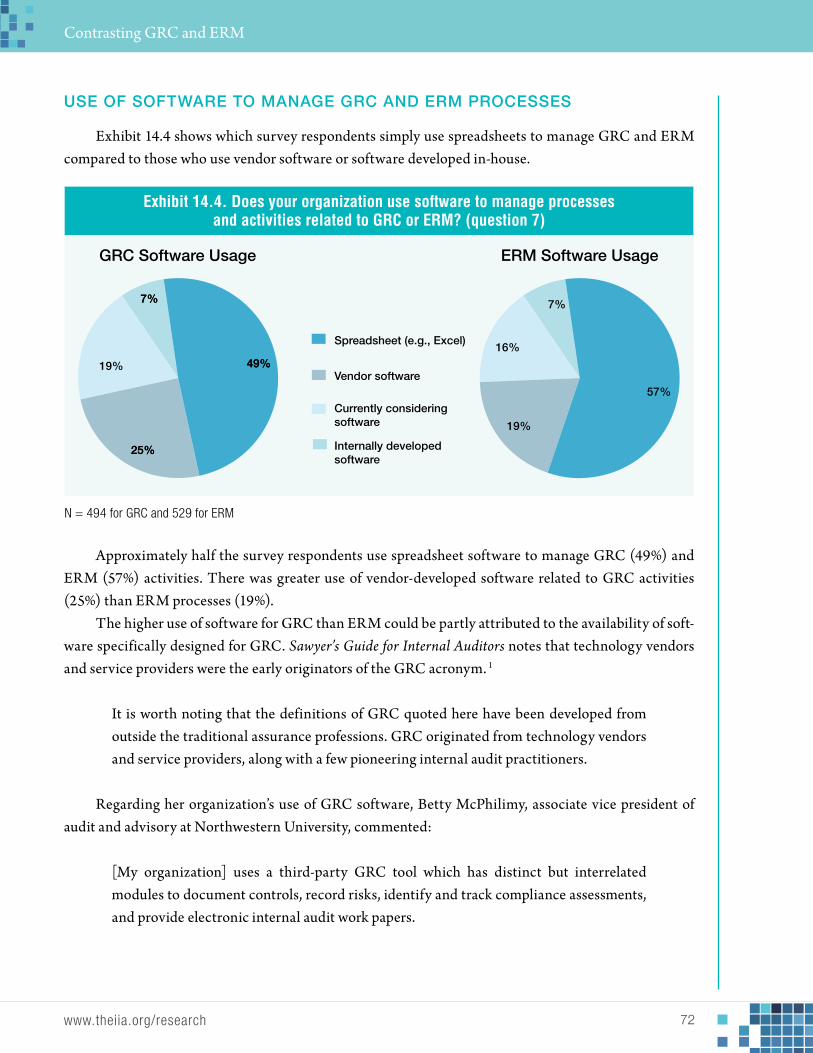
www.theiia.org/research 72
Contrasting GRC and ERM
use of software to ManaGe GrC and erM ProCesses
Exhibit 14.4 shows which survey respondents simply use spreadsheets to manage GRC and ERM compared to those who use vendor software or software developed in-house.
Exhibit 14.4. Does your organization use software to manage processes and activities related to GRC or ERM? (question 7)
Internally developedsoftware
Currently consideringsoftware
Vendor software
Spreadsheet (e.g., Excel)
7%
49%
25%
7%
49%
25%
19%
16%
7%
57%
19%
GRC Software Usage ERM Software Usage
N = 494 for GRC and 529 for ERM
Approximately half the survey respondents use spreadsheet software to manage GRC (49%) and ERM (57%) activities. There was greater use of vendor-developed software related to GRC activities (25%) than ERM processes (19%).
The higher use of software for GRC than ERM could be partly attributed to the availability of soft-ware specifically designed for GRC. Sawyer’s Guide for Internal Auditors notes that technology vendors and service providers were the early originators of the GRC acronym. 1
It is worth noting that the definitions of GRC quoted here have been developed from outside the traditional assurance professions. GRC originated from technology vendors and service providers, along with a few pioneering internal audit practitioners.
Regarding her organization’s use of GRC software, Betty McPhilimy, associate vice president of audit and advisory at Northwestern University, commented:
[My organization] uses a third-party GRC tool which has distinct but interrelated modules to document controls, record risks, identify and track compliance assessments, and provide electronic internal audit work papers.

The IIA Research Foundation 73
As McPhilimy noted, the technology solutions that support GRC are focused on risk and controls, which in turn support governance oversight (see exhibit 14.5).
Exhibit 14.5. Use of Technology for GRC
TechnologySolutions
Governance
Risks (ERM)
Controls
This discussion of frameworks and tools concludes the data analysis section of this research report. The next chapter summarizes the key findings and their implications.
Frameworks and Tools
www.theiia.org/research 74
Chapter 15
ConClusion And imPliCAtions
Based on results from the global survey, interviews with experts, and a literature review, this research report suggests the following overall conclusions:
Usage of terminology related to GRC and ERM is inconsistent, and there is a need for the profession to agree on consistent definitions of GRC and ERM and their relationship.
A high percentage of internal audit functions are involved in GRC and ERM, but internal audit practices in these areas are still maturing.
need for Consensus In GrC and erM terMInoloGy
The global survey conducted for this report clearly points to a lack of consensus regarding the defi-nitions of GRC and ERM. For example, while most internal auditors describe ERM as a component of GRC (60%), a significant proportion had the opposite viewpoint—that GRC was a component of ERM (24%). In addition, for many questions in the survey, respondents gave almost identical answers for GRC and ERM, suggesting a lack of differentiation between the concepts.
As indicated by the research results, the development of a consistent language regarding GRC and ERM is a significant need for the internal audit profession. In the same way that COSO developed the Internal Control–Integrated Framework to establish a language of controls, it would be ideal for the profes-sion to embrace a visual framework that clearly illustrates the interaction between a GRC structure and ERM processes, and provides clear definitions of GRC and ERM.
PICture of GrC and erM PraCtICes worldwIde
In addition to highlighting the need for consensus regarding the definitions of GRC and ERM, this research report also provided a picture of current internal audit practices in these two areas. Overall, a high percentage of respondents from around the world reported some level of involvement in GRC (91%) and ERM (90%) (see exhibit 11.1). At the same time, a lower percentage of respondents gave high ratings to their organizations’ maturity in these areas.
Also, it is worth noting that respondents indicated more activity in their organization around GRC than ERM. Specifically, more respondents conducted assessments over governance than ERM. Furthermore GRC was included more frequently than ERM within respondents internal auditor char-ters or audit committee charters. The detailed statistics follow:

The IIA Research Foundation 75
GRC Summary
68% of respondents indicated extensive or moderate involvement in GRC (see exhibit 11.1).
75% reported that they assessed governance either continually or annually (see exhibit 11.3).
This is consistent with findings that governance was included in 73% of internal audit charters and 77% of audit committee charters (see exhibits 8.2 and 8.3).
57% of respondents rated their organizations GRC maturity as defined, integrated, or optimized (see exhibit 8.1).
ERM Summary
66% of respondents indicated extensive or moderate involvement in ERM (see exhibit 11.1).
66% reported they assess ERM continually or annually (which is 9% lower than for GRC, see exhibit 11.3).
Compared to GRC, a lower percentage of respondents included ERM in their charter documents. ERM was included in 43% of internal audit charters and 62% of audit committee charters (see exhibits 8.2 and 8.3).
However, 62% of respondents rated their ERM maturity as defined, integrated, or optimized (which is a 5% higher maturity rating than for GRC) (see exhibit 8.1).
IMPlICatIons
The internal audit profession has been gravitating from a primary focus on controls to also evaluate risk. At the same time, internal audit is paying more attention to assurance and consulting for gover-nance. The attention to both risk and governance is critical considering the frequent failures by boards of directors and audit committees to monitor executive management closely enough to prevent financial statement fraud and significant business failures. Even if an organization has a mature ERM process, an effective governance process is needed to support and enforce ERM findings.
This research report provides evidence that GRC and ERM practices are imbedded in internal audit functions around the world. At the same time, survey results indicate that internal audit has not yet reached maturity with relation to GRC structure and ERM processes. The rate at which this maturity occurs will partly depend on how soon leading business organizations take on the challenge of defining GRC and ERM and their relationship to each other.
Conclusion and Implications

www.theiia.org/research 76
appendix a
survey Questions
The following is the survey instrument in its entirety used to capture the information presented in this document. Tables and graphics within the document provide reference to the following ques-
tions, although summaries of question responses are not provided. Additional stratified summaries are provided in appendix D for select questions.
GoVernanCe, rIsk, and Controls/CoMPlIanCe and enterPrIse rIsk ManaGeMent surVey
Welcome!Thank you for participating in The IIA Research Foundation’s survey on Governance, Risk, and
Controls/Compliance (GRC) and Enterprise Risk Management (ERM). The survey consists of four parts to capture specific information about the following within your organization:
1. GRC activities
2. ERM processes
3. Internal audit function
4. Company and demographic information
This survey will take approximately 20 minutes to complete and closes on Friday, Mar. 16. (Note: If you are unable to finish the survey in one sitting, you can save your progress and return to
the survey at a later time. Be sure to follow the instructions for saving your unique URL that you will find on the screen when you click the Save button.)

The IIA Research Foundation 77
Section 1: GRC Activities1. To what extent do audit committee members in your organization use insight obtained from
other organizations’ audit committees when providing input for:
none limited Moderate extensive unknown
grC activities
erm processes
2. Are the following roles identified in your audit committee’s charter?
no yes, informalyes, formal (i.e., explicitly stated
and documented)unknown
Control environment
governance
risk
erm
Compliance
Controls
oversight of assurance functions
3. Does your organization have the following?
no yes, informal yes, formal
mission statement
Code of ethics
Code of conduct
Fraud policy
risk tolerance statement
whistleblower policies or guidelines
Survey Questions

www.theiia.org/research 78
Contrasting GRC and ERM
4. Based on the following five maturity model classifications, rate your organization’s maturity of current ERM and GRC processes:
Ad hoc: Undocumented; state of dynamic change; individual experiences.
Preliminary: Risk is defined in different ways, such as in silos.
Defined: Common risk framework; organizationwide view of risk; action plans imple-mented in response to high-priority risks.
Integrated: ERM activities are coordinated; common tools and processes, with enter-prisewide risk monitoring, measurement, and reporting; scenario planning and process metrics are in place.
Optimized: Risk discussion embedded in strategic planning, capital allocation, and in daily decision-making; early warning system to notify board and management to risks above established thresholds.
ad hoc Preliminary defined Integrated optimized
erm
grC

The IIA Research Foundation 79
5. Indicate whether the following is a component of GRC, ERM, or both, and identify the person or group with execution and oversight responsibilities for each of the following:
Component of: execution oversight
GrC erM Both responsibility: responsibility:
Alignment of company actions with shareholder values (drop down list)
board AuditCommitteegovernanceCommittee
risk CommitteeCeoCFoCro
Chief legal CounselCAe
other exec mgmtAll mgmt
All employeesother
(drop down list)board AuditCommitteegovernanceCommittee
risk CommitteeCeoCFoCro
Chief legal CounselCAe
other exec mgmtAll mgmt
All employeesother
Compliance
ensuring ethical business transactions
establishment of code of conduct, code of ethics, or corporate policy
external audit process
evaluation of controls to ensure proper risk management
governance
independent internal audit function
internal controls
management of environmental, health, and safety concerns
management of regulatory compliance
management of risks within estab-lished tolerance levels
monitoring of effective fraud hotline process
risk
setting and monitoring organiza-tional risk tolerance levels
organizationwide assurance activities
Quality control processes
6. To what extent does your organization perform benchmarking related to:
none limited Moderate extensive
grC
erm
Survey Questions

www.theiia.org/research 80
Contrasting GRC and ERM
7. Does your organization use software to manage processes and activities related to: (Choose all that apply)
Currently considering
software
spreadsheet (e.g., excel)
Vendor
software
Internally developed software
grC activities
erm processes
7a. Please list the software that you use, other than Excel or an internally developed application. Note: the names of vendors and their software will not be included in any written report or document.
_
8. Please identify whether the following items are currently a function of GRC or another area in your organization. You may choose “Not applicable” if the process is currently not in existence. (Choose all that apply)
Governance risk Compliance Control othernot
applicable
Alignment of company actions with stakeholder values
bribery/corruption risks (e.g., Foreign Corrupt Practices Act or the uk bribery Act)
Code of conduct, code of ethics, or corporate policy
Conflict of interest process
environmental, health, and safety activities
erm process
executive compensation and benefits
executive expense reporting
external audit process
Fraud hotline process and sensitive issues

The IIA Research Foundation 81
independent internal audit function
management of ethical business transactions
management of risk tolerance levels
whistleblower policy process
management of regula-tory activities
setting and monitoring organizational risk toler-ance levels
other
8a. Please list other significant functions and the category(ies) they fall under:
9. Indicate your level of agreement.
Internal stakeholders expect the following benefits associated with GRC activities:
strongly disagree
disagree neutral agreestrongly
agree
improved financial performance
lower financial volatility
lower financial reporting risk
improved market performance
lower market volatility
enhanced reputation
reduced cost of capital
lower organizational risk
lower operational risk
lower strategic risk
improved benchmarking
enhanced business strategy
other
Survey Questions

www.theiia.org/research 82
Contrasting GRC and ERM
9a. Please list other stakeholder expectations: _
10. Rank the four most important expected benefits of GRC activities from the perspective of internal stakeholders.
Most important2nd most important
3rd most important
4th most important
improved financial performance
lower financial volatility
lower financial reporting risk
improved market performance
lower market volatility
enhanced reputation
reduced cost of capital
lower organizational risk
lower operational risk
lower strategic risk
improved benchmarking
enhanced business strategy
other
10a. Please list and rank other expected benefits you feel would be among the most important to internal stakeholders:

The IIA Research Foundation 83
11. What benefits do the identified stakeholders expect from GRC activities? (Choose all that apply)
executive management
Board of directors
Internal audit
legal counsel
Institutional investors
Creditors others
enhanced business strategy
enhanced reputation
improved benchmarking
improved financial performance
improved market performance
lower financial volatility
lower financial reporting risk
lower market volatility
lower opera-tional risk
lower organi-zational risk
lower strate-gic risk
reduced cost of capital
other
11a. If applicable, please list other stakeholders not listed above, and identify the benefit(s) they expect:
Survey Questions

www.theiia.org/research 84
Contrasting GRC and ERM
12. What impact, if any, would the following have on the quality of an organization’s GRC processes?
extremely negative
negative none Positiveextremely positive
disaster recovery expert on the board
Financial expert on the audit committee
increase in board size
increase in internal audit staff size
increase in the percentage of independent board members
increase in the percentage of independent compensation committee members
increase in percentage of independent nominating committee members
risk expert on the audit committee
same individual serving as Ceo and chairman of the board of directors
separate the roles of Ceo and chairman of the board
technology expert on the board

The IIA Research Foundation 85
Section 2: ERM Processes
13. Has your organization implemented a formal ERM program?
No
Yes, informal
Yes, formal (i.e., explicitly stated and documented)
14. Does your organization’s ERM program include:
no yes, informal yes, formal
risk universe
risk likelihood rating
risk impact rating
risk tolerance (residual) levels
risk profile for the organization
15. Does your organization have a chief risk officer?
No
Yes, informal
Yes, formal
Yes, but with another title; please specify:
15a. Is your organization’s chief audit executive (or equivalent) also the chief risk officer?
Yes
No
Survey Questions

www.theiia.org/research 86
Contrasting GRC and ERM
16. Indicate your level of agreement with the statement below:
Internal stakeholders expect the following benefits associated with ERM activities:
strongly disagree
disagree neutral agreestrongly
agree
improved financial performance
lower financial volatility
lower financial reporting risk
improved market performance
lower market volatility
enhanced reputation
reduced cost of capital
lower organizational risk
lower operational risk
lower strategic risk
improved benchmarking
enhanced business strategy
other
16a. What other benefits, if any, do internal stakeholders expect?

The IIA Research Foundation 87
17. What benefits do each of the stakeholders below expect from your organization’s ERM processes? (Choose all that apply)
executive manage-
ment
Board of directors
Internal audit
legal counsel
Institutional investors
Creditors others
improved financial performance
lower financial volatility
lower financial reporting risk
improved market performance
lower market volatility
enhanced reputation
reduced cost of capital
lower organizational risk
lower operational risk
lower strategic risk
improved benchmarking
enhanced business strategy
other
17a. If applicable, please list other stakeholders not listed above, and identify the benefit(s) they expect:
Survey Questions

www.theiia.org/research 88
Contrasting GRC and ERM
18. Indicate your level of agreement with each statement as it relates to ERM:
your organizationModel organization
(Best practice)
is lead by executive management (Click here to choose) (Click here to choose)
oversight is provided by the entire board (Click here to choose) (Click here to choose)
oversight is provided by the audit committee
(Click here to choose) (Click here to choose)
oversight is provided by the risk/erm committee
(Click here to choose) (Click here to choose)
is a component of grC (Click here to choose) (Click here to choose)
Considers reputational risks (Click here to choose) (Click here to choose)
Considers strategic risks (Click here to choose) (Click here to choose)
Considers operational risks (Click here to choose) (Click here to choose)
Considers financial risks (Click here to choose) (Click here to choose)
Considers governance risks (Click here to choose) (Click here to choose)
Considers compliance risks (Click here to choose) (Click here to choose)
Considers environmental risks (Click here to choose) (Click here to choose)
Considers it risks (Click here to choose) (Click here to choose)
Considers legal risks (Click here to choose) (Click here to choose)
Considers human capital risks (Click here to choose) (Click here to choose)
Considers market risks (Click here to choose) (Click here to choose)
Considers regulatory risks (Click here to choose) (Click here to choose)
Considers credit risks (Click here to choose) (Click here to choose)
Considers vendor risks (Click here to choose) (Click here to choose)
Considers fraud risks (Click here to choose) (Click here to choose)

The IIA Research Foundation 89
your organizationModel organization
(Best practice)
Considers cultural risk (Click here to choose) (Click here to choose)
Considers economic risks (Click here to choose) (Click here to choose)
is analyzed by likelihood (Click here to choose) (Click here to choose)
is analyzed by impact (Click here to choose) (Click here to choose)
specifies risk tolerance levels (Click here to choose) (Click here to choose)
19. How would you classify your organization’s process for establishing risk tolerance levels?
No process
No process, but one is in the planning stage
Informal process
Formal process
20. To what extent are the following individuals or groups responsible for setting your organization’s risk tolerance levels?
accountable Contributes input not involved
Audit committee
board chairman
risk committee
Ceo
Chief financial officer
Chief operating officer
Chief risk officer
Compliance
entire board
internal audit function
other
Survey Questions

www.theiia.org/research 90
Contrasting GRC and ERM
20a. Please specify additional individuals or functions involved in setting your organization’s risk tolerance levels:
21. Who is responsible for monitoring whether a risk is within your organization’s acceptable risk tolerance levels?
accountable Contributes input not involved
board audit committee
board chairman
board risk committee
Ceo
Chief financial officer
Chief operating officer
Chief risk officer
Compliance
entire board
internal audit
other
21a. Please specify additional individuals or functions responsible for monitoring whether risks are within the organization’s acceptable risk tolerance levels:
22. Which ERM framework, if any, does your organization follow?
No formal framework used
COSO ERM
AS/NZ 4360
ISO 31000

The IIA Research Foundation 91
Turnbull
King III
Other, please specify: ___________________________________
23. What type of risk approach does your organization use?
Corporatewide methodology (i.e., centralized)
Combination — department methodology integrated into a corporatewide strategy (i.e., bottom-up approach)
Departmental methodology (i.e., embedded/silo approach)
24. Is the approach of the risk assessment process:
Qualitative (categorical, e.g., high/medium/low)
Quantitative (a mathematical calculation)
Combination (both categorical and mathematical)
Other, please specify:
25. What impact would the following have on an organization’s ERM process?
extremely negative
negative neutral Positiveextremely positive
Ceo oversight of erm processes
Chief risk officer (Cro) reporting to the Ceo
independent Cro reporting to the board
internal audit of erm process
internal audit function leads erm process
oversight by nonindependent board risk committee
oversight by independent board risk committee
Survey Questions

www.theiia.org/research 92
Contrasting GRC and ERM
26. How effective do you believe your current ERM process is at adequately identifying, assessing, and managing the following types of risk:
Identifying risk assessing risk Managing risk
low Medium high low Medium high low Medium high
Compliance risk
Credit risk
Cultural risk
economic risk
environmental risk
external risk
Financial risk
Fraud risk
governance risk
human capital risk
it risk
legal risk
market risk
operating risk
regulatory risk
reputational risk
strategic risk
vendor risk
other
26a. Please describe if there is another significant area that your ERM process identifies, assesses, and manages, as well as its effectiveness level:

The IIA Research Foundation 93
27. Does your organization have a defined risk universe?
No
Yes, informal
Yes, formal (i.e., written or documented)
28. In your opinion, is ERM a component of GRC or GRC a component of ERM?
ERM is a component of GRC
GRC is a component of ERM
Neither
Other, please specify:
29. Please identify one to five commonalities of GRC and ERM.
30. Please identify one to five differences between GRC and ERM.
31. Please identify up to five practices or suggestions to improve the development or effectiveness of GRC activities.
32. Please identify up to five practices or suggestions to improve the development or effectiveness of ERM processes.
Survey Questions

www.theiia.org/research 94
Contrasting GRC and ERM
Section 3: Internal Audit Function
33. What is the extent of your internal audit function’s involvement in:
none limited Moderate extensive
grC activities
erm processes
34. Are the following areas identified or referenced within your internal audit charter?
yes no
Compliance
Control environment
specific internal controls
erm
governance
risk
Any mandatory audits
extent of assurance services provided
extent of advisory services provided
35. To what extent do you agree that internal audit activities within your organization are aligned with The IIA’s Definition of Internal Auditing to add value through the assessment of:
strongly disagree disagree neutral agree strongly agree
Compliance
Controls
governance
risk
36. Indicate your level of agreement with the statement below:
The IIA’s Definition of Internal Auditing permeates throughout all functions and activities of internal audit in your organization.
Strongly disagree

The IIA Research Foundation 95
Disagree
Neutral
Agree
Strongly agree
37. Is your audit risk universe analyzed by both likelihood and impact?
Yes
No
38. In conducting the macro-level risk assessment (internal audit planning of resource allocation), does internal audit use a risk approach or risk ranked units?
Risk approach (identify and rank the top risks)
Risk ranked units (identify the units and rank the top units by risks)
Do not use risk-based approach
39. How does your internal audit function assess risk?
Quantitatively
Qualitatively
Combined (quantitative and qualitative)
Do not assess risk
40. How frequently does your internal audit function assess:
Continual assessment annual assessment not assessed
Compliance
Control environment (entity level)
Controls
erm
governance
risk
Survey Questions

www.theiia.org/research 96
Contrasting GRC and ERM
41. How frequently does the internal audit function perform the following in your organization?
not performed
rarely (e.g., every
5 years)
Periodically (at least
every 3 years)annually
twice or more per year
Audits bribery/corruption risks (e.g., FCPA, uk bribery Act)
Audits the code of ethics/conduct process
Audits the conflict of interest process
Audits erm processes
Audits executive compensa-tion and benefits
Audits executive expense reporting
Audits the whistleblower policy/process
leads the erm processes
supports the erm processes
reports on the erm process to the audit committee
reports on grC to the audit committee

The IIA Research Foundation 97
42. Please indicate if your internal audit function reports on the following items and, if so, who receives the report: (Choose all that apply)
not reported
Boardaudit
committeerisk
committeeCeo Cfo Cro
legal Counsel
other
Compliance
Control environment (entity level)
Controls
erm
governance
risk
43. Does your internal audit function use a risk-based approach for:
no Partially yesnot
applicable
internal audit annual planning (i.e., resource alloca-tion, macro planning)
engagement planning (micro planning)
44. Classify the type of connections that exist between ERM and your macro-level internal audit risk assessment/plan:
no connection
Informal connection or communication
formal connection or communication
erm and the internal audit risk assessment (internal audit annual planning or resource allocation)
erm and internal audit engagement planning
44a. To what extent are audit results used to provide input into the ERM assessment process?
Not at all
Minimally
Moderately
Extensively
Survey Questions

www.theiia.org/research 98
Contrasting GRC and ERM
45. Does your internal audit function use the following tools or frameworks?
noMinimal
useModerate
useextensive
usenot
applicable
Continuous auditing
Continuous monitoring
Control self-assessment (CsA)
Coso–erm
Coso–internal Control
Criteria of Control (CoCo)
iso 31000
45a. If applicable, please specify other tools or frameworks and the level of use by your internal audit function:
46. Does your internal audit function provide any educational training to the board of directors, audit committee, executive management, management, or staff levels related to: (Choose all that apply)
Board of directors
audit committee
executive management
Management audit staff none
Compliance
Controls
erm
governance
risk

The IIA Research Foundation 99
Organizational InformationThank you for participating in this survey. The following questions are optional for the study.
However they will be useful in the ability to gain a better understanding related to differences that exist related to GRC and ERM based upon organization size, industry, geographical location, and board characteristics.
47. Select the annual revenue range that best fits your organization:
Less than USD 10 million
USD 10 million to less than USD 50 million
USD 50 million to less than USD 100 million
USD 100 million to less than USD 500 million
USD 500 million to less than USD 1 billion
USD 1 billion to less than USD 10 billion
USD 10 billion or more
48. For which type of organization do you currently work?
Service Provider/Consultant
Publicly Traded (Listed) Organization
Privately Held (Nonlisted) Organization
Public Sector/Government
Nonprofit
Other
49. What best describes your organization’s primary industry?
Aerospace and defense
Agriculture/forestry/fisheries
Communication/telecommunication services
Construction/engineering/architecture
Consulting services
Distribution
Survey Questions

www.theiia.org/research 100
Contrasting GRC and ERM
Educational services
Energy/oil and gas
Financial services/banking/real estate
Gaming/lotteries
Government–local
Government–state/provincial
Government–national/federal
Health services
Hospitality/entertainment/restaurant
Insurance carriers/agents
Manufacturing
Mining
Nonprofit sector
Pharmaceuticals
Public accounting/accounting services
Technology
Transportation
Utilities
Wholesale/retail
Other
50. Please provide your organization name and ticker symbol (if applicable):
Organization name:
Ticker or Trading Symbol (if applicable):
51. In which country do you reside?
Australia

The IIA Research Foundation 101
Canada
Caribbean
Hong Kong (China)
Malaysia
New Zealand
Norway
The Netherlands
Philippines
Sweden
South Africa
United Arab Emirates
United States
Other, please specify:
52. What is your current role in the internal audit function?
Chief audit executive (I am the most senior auditing officer for the organization with ultimate responsibility for the entire internal auditing function.)
Director of audit (I am the chief auditor authorized to direct a broad, comprehensive program of internal auditing within my organization.)
Audit manager (I administer the internal auditing activity of an assigned location within the general guidelines provided by the director of auditing.)
Audit staff (I conduct, or assist in conducting, reviews of assigned organizational and functional activities.)
IT audit director (I am head of the IT auditing activity within my organization.)
IT audit manager (I administer the IT auditing activity of an assigned location within the general guidelines provided by the director of IT auditing.)
IT audit staff (I conduct, or assist in conducting, reviews of assigned organizational and functional activities related to IT auditing.)
Other, please specify:
Survey Questions

www.theiia.org/research 102
Contrasting GRC and ERM
53. What is the size of your internal audit function (in full-time equivalents)?
N/A
1
2–5
6–10
11–20
21–50
51–100
More than 100
We thank you for your participation!
54. Please provide the following information if you would like to receive a copy of the research report by email. This information will be used only for the purpose of emailing the report:
Name:
Email address:
The IIA Research Foundation 103
appendix B
demogrAPhiCs oF reseArCh PArtiCiPAnts
The following exhibits provide additional information about the demographic composition of the participants who completed the survey. (Additional information may be found in the methodology
chapter.) This appendix shows data regarding:
Country
Organization size
Organization type
Industry group
Internal audit function size
Country
Respondents represent 22 different countries, with the United States (58%), Australia (12%), and Canada (11%) representing nearly 80% of the total respondents. For the purpose of more detailed anal-ysis, countries are grouped into regions to allow analysis of results based on geographical area. Exhibit B.1 summarizes the survey respondents by country and region.
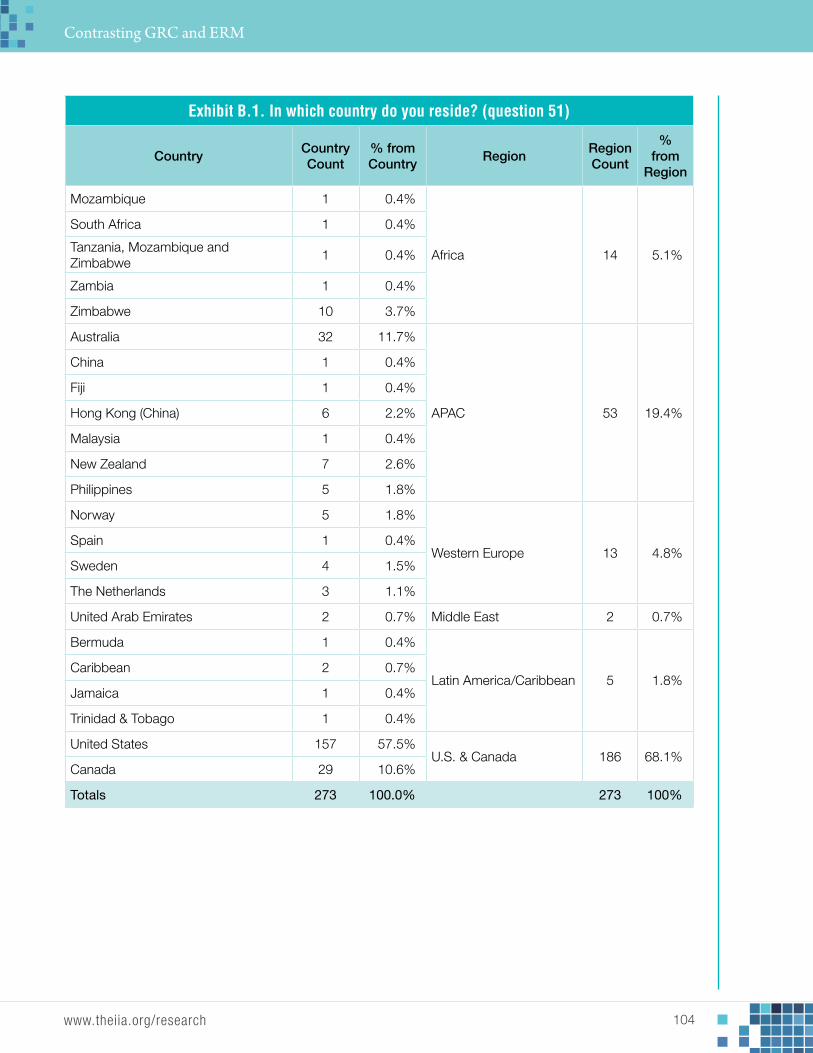
www.theiia.org/research 104
Contrasting GRC and ERM
Exhibit B.1. In which country do you reside? (question 51)
CountryCountry Count
% from Country
regionregion Count
% from
region
mozambique 1 0.4%
Africa 14 5.1%
south Africa 1 0.4%
tanzania, mozambique and Zimbabwe
1 0.4%
Zambia 1 0.4%
Zimbabwe 10 3.7%
Australia 32 11.7%
APAC 53 19.4%
China 1 0.4%
Fiji 1 0.4%
hong kong (China) 6 2.2%
malaysia 1 0.4%
new Zealand 7 2.6%
Philippines 5 1.8%
norway 5 1.8%
western europe 13 4.8%spain 1 0.4%
sweden 4 1.5%
the netherlands 3 1.1%
united Arab emirates 2 0.7% middle east 2 0.7%
bermuda 1 0.4%
latin America/Caribbean 5 1.8%Caribbean 2 0.7%
Jamaica 1 0.4%
trinidad & tobago 1 0.4%
united states 157 57.5%u.s. & Canada 186 68.1%
Canada 29 10.6%
Totals 273 100.0% 273 100%

The IIA Research Foundation 105
orGanIzatIon sIze
As shown in exhibit B.2, the largest percentage (35%) of respondents based on revenue is organiza-tions with revenues between $1 billion and $10 billion. While 46% of respondents reported revenues above $1 billion, smaller organizations are also well represented, comprising of 54% of the surveys completed.
Exhibit B.2. Select the annual revenue range that best fits your organization:(question 47)
size Category % of respondents
less than 10m usd 5%
10m - 50m usd 8%
50m -100m usd 6%
100m - 500m usd 19%
500m - 1b usd 17%
1b - 10b usd 35%
greater than 10b usd 11%
264 Respondents
Industry GrouPInG
As shown in exhibit B.3, the financial services, banking, and real estate industry is the most repre-sented industry in the survey, generating 22% of the responses. The only other industry comprising more than 10% of the responses is insurance carriers/agents at 12%. This classification is part of the more general finance and insurance classification, which represents 33 percent of the respondents. Although the general/other classification represents 29% of the respondents, no individual industry within the classification represents more than 7% of the respondents industry.
Demographics of Research Participants

www.theiia.org/research 106
Contrasting GRC and ERM
Exhibit B.3. What best describes your organization’s primary industry? (question 49)
Industry Count % Industry ClassificationClass Count
% Class
Financial services/banking/real estate 59 21.6%
Finance & insurance 91 33%insurance carriers/agents 32 11.7%
government–local 5 1.8%
government 28 10%government–national/federal 12 4.4%
government–state/provincial 11 4.0%
health services 17 6.2% health 17 6%
manufacturing 27 9.9% manufacturing 27 10%
distribution 2 0.7%transportation 16 6%
transportation 14 5.1%
utilities 16 5.9% utilities 16 6%
Aerospace and defense 3 1.1%
other 78 29%
Agriculture/forestry/fisheries 3 1.1%
Communication/telecommunication services
1 0.4%
Construction/engineering/architecture 3 1.1%
Consulting services 6 2.2%
educational services 8 2.9%
energy/oil and gas 4 1.5%
gaming/lotteries 3 1.1%
hospitality/entertainment/restaurant 4 1.5%
mining 1 0.4%
nonprofit sector 8 2.9%
Pharmaceuticals 3 1.1%
Public accounting/accounting services 1 0.4%
technology 7 2.6%
wholesale/retail 6 2.2%
other 17 6.2%
Total 273 100.0% 273 100%

The IIA Research Foundation 107
Internal audIt funCtIon sIze
Survey respondents were also categorized by the internal audit function staff size as represented in exhibit B.4. The largest portion of internal audit functions responding to the survey (56%) had between two and 10 full-time equivalents (FTEs) in the internal audit department. This further illustrates the diversity in the organizational size of survey respondents.
Exhibit B.4. What is the size of your internal audit function (in full-time equivalents)? (question 53)
Iaf-ftes % respondents
1 10%
2–5 33%
6–10 23%
11–20 16%
21–50 12%
51–100 4%
>100 2%
270 Respondents
lIMItatIons
As with all survey information, the results are only as reliable as the perception and responses provided by respondents. As such, there may have been personal (time constraints or topic interest) or organizational factors (information propriety) that may have caused respondents to self-select into or out of the survey. This could introduce some non-response bias into the results, as it could for any voluntary survey. Where practical, responses were stratified based on organizational size, industry, organization type, geography, and internal audit function size. Detailed tables related to the stratified information are provided in appendixes D through H.
This survey also had the possibility of a dropout bias, but response analysis suggests that the dropout rate did not significantly affect the results. Specifically, the first question received 931 responses, but respondents dropped out throughout the survey. The most significant dropout point was question 5, which was a complex question in which 414 of the initial respondents did not answer or opted to drop out of the survey. To check for dropout bias, the responses to questions were compared for all respondents, respondents who completed the survey, and survey participants who dropped out before completion. There was no significant variation between the three groups. Therefore, there did not appear to be a dropout bias.
Response counts differ for each question because all respondents did not answer every ques-tion. Results provided in the main text of the report are reported for all responses received (not just completed surveys). As a result, the number of responses varies from question to question, depending
Demographics of Research Participants
www.theiia.org/research 108
Contrasting GRC and ERM
on whether the question was near the beginning or the end of the survey. Variables used to stratify survey results were presented at the end of the survey. Therefore, stratified results are only available for completed surveys.

The IIA Research Foundation 109
appendix C
exeCution And oversight resPonsibilities
Exhi
bit C
.1 Q
uest
ion
5 –
Iden
tify
the
pers
on o
r gro
up w
ith e
xecu
tion
resp
onsi
bilit
ies
for e
ach
of th
e fo
llow
ing:
Boar
d (e
ntire
)Au
dit
Com
mitt
eeGo
vern
ance
Co
mm
ittee
Ri
sk
Com
mitt
eeCE
OCF
OCR
OCh
ief
Com
plia
nce
Offic
er
Chie
f Leg
al
Coun
sel
CAE
Othe
r Exe
c. M
anag
emen
tAl
l M
anag
emen
tAl
l Em
poye
esOt
her
Alig
ning
act
ions
with
sh
areh
olde
r val
ue16
% 3
% 3
% 2
%40
% 3
% 4
% 1
% 1
% 1
% 4
%16
% 5
% 2
%
Com
plia
nce
3%
5%
1%
1%
7%
5%
2%
26%
7%
5%
4%
18%
16%
1%
ensu
ring
ethi
cal b
usi-
ness
tran
sact
ions
4%
2%
2%
1%
15%
6%
2%
6%
8%
1%
4%
24%
24%
1%
Cod
e of
con
duct
8%
2%
3%
1%
25%
1%
1%
10%
16%
3%
13%
7%
5%
4%
ext
erna
l aud
it 3
%14
% 1
% 0
% 3
%48
%12
% 0
% 0
% 9
% 4
% 1
% 1
% 4
%
eval
uatio
n of
con
trols
to
ens
ure
prop
er ri
sk
man
agem
ent
1%
7%
0%
3%
6%
9%
5%
2%
0%
42%
4%
15%
2%
3%
gov
erna
nce
12%
4%
10%
1%
28%
2%
2%
4%
7%
3%
8%
15%
2%
1%
inde
pend
ent i
nter
nal
audi
t 2
%16
% 0
% 0
% 5
% 5
% 4
% 2
% 0
%62
% 1
% 0
% 1
% 2
%
inte
rnal
con
trols
1%
4%
1%
1%
8%
8%
5%
1%
0%
12%
3%
40%
17%
1%
envi
ronm
enta
l, he
alth
, an
d sa
fety
1%
0%
1%
2%
9%
1%
4%
6%
4%
0%
25%
27%
10%
7%
man
agem
ent o
f reg
u-la
tory
com
plia
nce
1%
1%
0%
1%
6%
4%
17%
24%
13%
1%
5%
19%
6%
2%
man
agem
ent o
f ris
k w
ithin
tole
ranc
e le
vels
3%
3%
1%
4%
16%
5%
7%
1%
1%
4%
9%
39%
6%
1%
Frau
d ho
tline
1%
3%
0%
1%
2%
2%
23%
12%
14%
21%
9%
5%
1%
7%
ris
k 2
% 2
% 1
% 6
%10
% 5
%23
% 1
% 2
% 4
% 6
%25
%12
% 2
%
set
and
mon
itor r
isk
tole
ranc
e le
vels
10%
3%
1%
12%
23%
7%
7%
1%
1%
2%
12%
18%
1%
4%
org
aniz
atio
nwid
e as
sura
nce
2%
7%
1%
2%
8%
8%
5%
2%
1%
36%
5%
16%
3%
4%
Qua
lity
cont
rol
proc
ess
1%
3%
1%
1%
10%
3%
0%
3%
1%
5%
18%
38%
11%
5%

www.theiia.org/research 110
Contrasting GRC and ERM
Exhi
bit C
.2 Q
uest
ion
5 –
Iden
tify
the
pers
on o
r gro
up w
ith o
vers
ight
resp
onsi
bilit
ies
for e
ach
of th
e fo
llow
ing:
Boar
d (e
ntire
)Au
dit
Com
mitt
eeGo
vern
ance
Co
mm
ittee
Ri
sk
Com
mitt
eeCE
OCF
OCR
OCh
ief
Com
plia
nce
Offic
er
Chie
f Leg
al
Coun
sel
CAE
Othe
r Exe
c. .M
anag
emen
tAl
l M
anag
emen
tAl
l Em
poye
esOt
her
Alig
ning
act
ions
with
sh
areh
olde
r va
lue
63%
12%
3%
1%
9%
1%
1%
1%
0%
0%
2%
3%
1%
2%
Com
plia
nce
17%
37%
6%
4%
8%
1%
3%
7%
4%
5%
3%
6%
0%
1%
ens
urin
g et
hica
l bus
i-ne
ss tr
ansa
ctio
ns27
%21
% 6
% 2
%13
% 2
% 0
% 4
% 4
% 3
% 4
%12
% 1
% 0
%
Cod
e of
con
duct
34%
22%
9%
2%
11%
1%
1%
4%
4%
2%
4%
4%
1%
1%
ext
erna
l aud
it13
%69
% 0
% 0
% 3
% 7
% 1
% 1
% 0
% 4
% 2
% 0
% 0
% 1
%
eval
uatio
n of
con
trol
s to
ens
ure
prop
er r
isk
man
agem
ent
11%
53%
1%
8%
5%
3%
3%
1%
0%
8%
3%
3%
0%
1%
gov
erna
nce
52%
14%
14%
1%
8%
1%
0%
2%
1%
2%
2%
2%
1%
1%
inde
pend
ent i
nter
nal
audi
t12
%75
% 0
% 0
% 3
% 2
% 1
% 1
% 0
% 4
% 1
% 0
% 0
% 1
%
inte
rnal
con
trol
s 9
%43
% 1
% 2
% 7
% 5
% 2
% 1
% 0
%14
% 3
% 9
% 1
% 0
%
env
ironm
enta
l, he
alth
, an
d sa
fety
24%
7%
4%
9%
21%
2%
4%
1%
3%
1%
14%
5%
1%
3%
man
agem
ent o
f reg
ula-
tory
com
plia
nce
19%
25%
7%
5%
12%
3%
2%
6%
7%
3%
5%
4%
1%
2%
man
agem
ent o
f ris
k w
ithin
tole
ranc
e le
vels
27%
18%
4%
18%
11%
2%
5%
0%
0%
3%
5%
5%
1%
0%
Frau
d ho
tline
9%
49%
5%
6%
8%
1%
2%
3%
5%
5%
3%
1%
0%
4%
ris
k26
%20
% 4
%20
%10
% 2
% 5
% 0
% 0
% 4
% 4
% 4
% 1
% 1
%
set
and
mon
itor
risk
tole
ranc
e le
vels
39%
15%
3%
17%
11%
2%
3%
0%
0%
3%
3%
2%
0%
2%
org
aniz
atio
nwid
e as
sura
nce
16%
52%
3%
3%
9%
3%
1%
1%
1%
4%
4%
3%
0%
1%
Qua
lity
cont
rol p
roce
ss19
%14
% 5
% 3
%22
% 3
% 2
% 0
% 0
% 4
%15
%10
% 1
% 2
%

www.theiia.org/research 111
appendix d
AreAs identiFied/reFerenCed in the internAl Audit ChArter
Stratification Tables for Revenue, Organization Type, Industry Classification, Region, and Full-time Equivalents for Question 34
Question 34: Are the following areas identified or referenced in your internal audit charter?
Exhibit D.1. Areas Identified/Referenced in Internal Audit Charter—By Revenue
Response LT<$10M$10M- $50M
$50M- $100M
$100M- $500M
$500M- $1B
$1B- $10B
GT>$10B Totals
governance 100% 79% 64% 63% 82% 72% 61% 72%
risk 100% 79% 73% 81% 93% 89% 100% 88%
erm 60% 42% 36% 33% 47% 41% 54% 43%
Exhibit D.2. Areas Identified/Referenced in Internal Audit Charter—By Organization Type
Response Nonprofit
Privately Held
(Non listed) Organization
Public Sector/
Government
Publicly Traded (Listed)
Organization
Service Provider/
ConsultantOther Totals
governance 69% 74% 79% 69% 75% 71% 73%
risk 76% 87% 88% 92% 88% 89% 88%
erm 25% 43% 47% 45% 50% 57% 43%
Exhibit D.3. Areas Identified/Referenced in Internal Audit Charter—By Industry Classification
ResponseFinancial Services
GovernmentHealthcare/ Insurance
Manufacturing Transportation Utilities Other Totals
governance 73% 78% 81% 60% 87% 60% 74% 73%
risk 92% 96% 75% 92% 93% 80% 82% 88%
erm 49% 50% 31% 46% 33% 40% 39% 44%

www.theiia.org/research 112
Contrasting GRC and ERM
Question 34: Are the following areas identified or referenced in your internal audit charter? (continued)
Exhibit D.4. Areas Identified/Referenced in Internal Audit Charter—By Region
Response Africa Asia PacificLatin
America/ Caribbean
Middle EastU.S. &
CanadaWestern Europe
Totals
governance 86% 77% 80% 100% 71% 75% 73%
risk 100% 94% 80% 100% 85% 100% 88%
erm 71% 67% 40% 100% 35% 42% 44%
Exhibit D.5. Areas Identified/Referenced in Internal Audit Charter - Internal Audit—Full-time Equivalents
Response 1 2–5 6–10 11–20 21–50 50+ totals
governance 64% 74% 70% 76% 75% 81% 73%
risk 72% 86% 92% 90% 94% 94% 88%
erm 24% 40% 39% 55% 59% 50% 43%

The IIA Research Foundation 113
appendix e
extent oF your internAl Audit FunCtion’s involvement in grC
Stratification Tables for Revenue, Organization Type, Industry Classification, Region, and Full-time Equivalents (question 33)
extent of your Internal audit function’s Involvement in GrC—By revenue
Response LT<$10M$10M- $50M
$50M- $100M
$100M- $500M
$500M- $1B
$1B- $10B
GT>$10B Totals
extensive 30% 30% 33% 28% 37% 35% 29% 33%
moderate 50% 50% 20% 34% 33% 29% 43% 34%
limited 20% 20% 40% 21% 20% 26% 25% 24%
none 0% 0% 7% 17% 11% 10% 4% 9%
totals 100% 100% 100% 100% 100% 100% 100% 100%
extent of your Internal audit function’s Involvement in GrC—By organization type
Response Nonprofit
Privately Held (Non
listed) Organization
Public Sector/
Government
Publicly Traded (Listed)
Organization
Service Provider/
ConsultantOther Totals
extensive 21% 27% 24% 43% 50% 33% 33%
moderate 34% 39% 34% 35% 25% 22% 35%
limited 34% 23% 29% 17% 13% 44% 23%
none 10% 11% 14% 6% 13% 0% 9%
totals 100% 100% 100% 100% 100% 100% 100%
extent of your Internal audit function’s Involvement in GrC—By Industry Classification
ResponseFinancial Services
GovernmentHealthcare/ Insurance
Manufacturing Transportation Utilities Other Totals
extensive 27% 26% 29% 31% 31% 38% 43% 33%
moderate 40% 22% 41% 46% 38% 31% 28% 35%
limited 23% 26% 18% 19% 31% 19% 25% 23%
none 10% 26% 12% 4% 0% 13% 4% 9%
totals 100% 100% 100% 100% 100% 100% 100% 100%

www.theiia.org/research 114
Contrasting GRC and ERM
Stratification Tables for Revenue, Organization Type, Industry Classification, Region, and Full-time Equivalents (question 33) continued
extent of your Internal audit function’s Involvement in GrC—By region
Response Africa Asia PacificLatin
America/ Caribbean
Middle EastU.S. &
CanadaWestern Europe
Totals
extensive 43% 37% 20% 100% 31% 17% 33%
moderate 50% 35% 60% 0% 33% 50% 35%
limited 7% 20% 20% 0% 25% 25% 23%
none 0% 8% 0% 0% 10% 8% 9%
totals 100% 100% 100% 100% 100% 100% 100%
extent of your Internal audit function’s Involvement in GrC—Internal audit—full-time equivalents
Response 1 2–5 6–10 11–20 21–50 50+ Totals
extensive 26% 39% 23% 41% 32% 31% 33%
moderate 30% 35% 38% 27% 42% 38% 35%
limited 37% 19% 22% 22% 23% 25% 23%
none 7% 7% 17% 10% 3% 6% 9%
totals 100% 100% 100% 100% 100% 100% 100%

The IIA Research Foundation 115
appendix f
extent oF your internAl Audit FunCtion’s involvement in erm
Stratification Tables for Revenue, Organization Type, Industry Classification, Region, and Full-time Equivalents (question 33)
extent of your Internal audit function’s Involvement in erM - By revenue
Response LT<$10M$10M- $50M
$50M- $100M
$100M- $500M
$500M- $1B
$1B- $10B
GT >$10B
Totals
extensive 50% 25% 27% 21% 35% 37% 32% 32%
moderate 40% 15% 20% 34% 41% 35% 29% 33%
limited 10% 50% 40% 32% 15% 17% 32% 25%
none 0% 10% 13% 13% 9% 11% 7% 10%
totals 1 1 1 1 1 1 1 7
extent of your Internal audit function’s Involvement in erM - By organization type
Response Nonprofit
Privately Held (Non
listed) Organization
Public Sector/
Government
Publicly Traded (Listed)
Organization
Service Provider/
ConsultantOther Totals
extensive 28% 29% 20% 42% 50% 11% 32%
moderate 28% 46% 32% 30% 13% 67% 34%
limited 38% 14% 32% 22% 38% 0% 24%
none 7% 11% 15% 7% 0% 22% 10%
totals 100% 100% 100% 100% 100% 100% 100%
extent of your Internal audit function’s Involvement in erM - By Industry Classification
ResponseFinancial Services
GovernmentHealthcare/ Insurance
Manufacturing Transportation Utilities Other Totals
extensive 32% 19% 29% 48% 6% 25% 39% 32%
moderate 39% 19% 41% 30% 50% 44% 28% 34%
limited 20% 41% 24% 15% 25% 31% 24% 24%
none 9% 22% 6% 7% 19% 0% 8% 10%
totals 100% 100% 100% 100% 100% 100% 100% 100%

www.theiia.org/research 116
Contrasting GRC and ERM
Stratification Tables for Revenue, Organization Type, Industry Classification, Region, and Full-time Equivalents (question 33) continued
extent of your Internal audit function’s Involvement in erM - By region
Response Africa Asia PacificLatin
America/ Caribbean
Middle EastU.S. &
CanadaWestern Europe
Totals
extensive 36% 23% 20% 50% 37% 8% 32%
moderate 50% 46% 40% 50% 27% 62% 34%
limited 14% 27% 40% 0% 24% 23% 24%
none 0% 4% 0% 0% 12% 8% 9%
totals 100% 100% 100% 100% 100% 100% 100%
extent of your Internal audit function’s Involvement in erM - Internal audit – full-time equivalents
Response 1 2–5 6–10 11–20 21–50 50+ Totals
extensive 33% 27% 40% 36% 34% 19% 32%
moderate 22% 30% 33% 48% 31% 50% 34%
limited 41% 28% 12% 14% 31% 25% 24%
none 4% 15% 15% 2% 3% 6% 10%
totals 100% 100% 100% 100% 100% 100% 100%

The IIA Research Foundation 117
appendix G
FreQuenCy thAt internAl Audit FunCtion rePorts on grC to Audit Committee
Stratification Tables for Revenue, Organization Type, Industry Classification, Region, and Full-time Equivalents (question 40)
reports on GrC to the audit Committee: - By revenue
Response LT<$10M$10M- $50M
$50M- $100M
$100M- $500M
$500M- $1B
$1B- $10B
GT>$10B Totals
twice or more per year
40% 30% 27% 22% 24% 28% 15% 25%
Annually 60% 25% 33% 17% 24% 24% 30% 26%
Periodically (at least every 3 years)
0% 5% 0% 7% 9% 6% 11% 6%
rarely (e.g., every 5 years)
0% 5% 0% 0% 7% 3% 4% 3%
not performed
0% 35% 40% 54% 36% 39% 41% 40%
total 100% 100% 100% 100% 100% 100% 100% 100%
reports on GrC to the audit Committee: - By organization type
Response Nonprofit
Privately Held
(Nonlisted) Organization
Public Sector/
Government
Publicly Traded (Listed)
Organization
Service Provider/
ConsultantOther Totals
twice or more per year
34% 19% 18% 31% 13% 38% 26%
Annually 7% 20% 32% 26% 63% 38% 25%
Periodically (at least every 3 years)
7% 7% 11% 6% 0% 0% 7%
rarely (e.g., every 5 years)
3% 2% 5% 3% 0% 0% 3%
not performed
48% 52% 35% 34% 25% 25% 39%
total 100% 100% 100% 100% 100% 100% 100%

www.theiia.org/research 118
Contrasting GRC and ERM
Stratification Tables for Revenue, Organization Type, Industry Classification, Region, and Full-time Equivalents (question 40) continued
reports on GrC to the audit Committee: - By Industry Classification
ResponseFinancial Services
GovernmentHealthcare/ Insurance
Manufacturing Transportation Utilities Other Totals
twice or more per year
23% 19% 29% 30% 20% 13% 32% 26%
Annually 26% 23% 24% 22% 7% 27% 31% 26%
Periodically (at least every 3 years)
10% 8% 12% 0% 0% 7% 5% 7%
rarely (e.g., every 5 years)
1% 4% 0% 0% 20% 7% 3% 3%
not performed 39% 46% 35% 48% 53% 47% 28% 39%
total 100% 100% 100% 100% 100% 100% 100% 100%
reports on GrC to the audit Committee: - By region
Response Africa APACLatin
America/
CaribbeanMiddle East
U.S. & Canada
Western Europe
Totals
twice or more per year
36% 26% 40% 50% 25% 17% 26%
Annually 36% 34% 0% 50% 20% 58% 25%
Periodically (at least every 3 years)
0% 11% 20% 0% 6% 8% 7%
rarely (e.g., every 5 years)
14% 2% 0% 0% 3% 0% 3%
not performed 14% 28% 40% 0% 46% 17% 39%
total 100% 100% 100% 100% 100% 100% 100%
reports on GrC to the audit Committee: - Internal audit – full-time equivalents
Response 1 2–5 6–10 11–20 21–50 50+ Totals
twice or more per year
19% 30% 26% 27% 16% 25% 26%
Annually 27% 22% 28% 22% 35% 19% 25%
Periodically (at least every 3 years)
8% 9% 2% 2% 10% 19% 7%
rarely (e.g., every 5 years)
0% 2% 5% 0% 6% 6% 3%
not performed 46% 37% 39% 49% 32% 31% 39%
total 100% 100% 100% 100% 100% 100% 100%

The IIA Research Foundation 119
appendix h
FreQuenCy oF internAl Audit FunCtion Assessment oF grC And erm
Stratification Tables for Revenue, Organization Type, Industry Classification, Region, Full-time Equivalents
frequency of Internal audit function assessment: - By organization type
Response NonprofitPrivately Held
(Nonlisted) Organization
Public Sector/
Government
Publicly Traded (Listed)
Organization
Service Provider/
ConsultantOther Totals
erm-Continuous 20% 25% 25% 29% 25% 22% 26%
erm-Annual 20% 45% 39% 44% 50% 33% 40%
erm-none 60% 29% 36% 28% 25% 44% 34%
governance-Continuous
27% 33% 34% 42% 25% 44% 36%
governance-Annual
33% 46% 40% 38% 50% 11% 39%
governance -none 40% 20% 26% 20% 25% 44% 25%
frequency of Internal audit function assessment: - By revenue
Response LT<$10M$10M- $50M
$50M- $100M
$100M- $500M
$500M- $1B
$1B- $10B
GT>$10B Totals
erm-Continuous 40% 20% 53% 23% 25% 25% 19% 26%
erm-Annual 40% 25% 13% 42% 34% 43% 59% 40%
erm-none 20% 55% 33% 35% 41% 32% 22% 35%
governance-Continuous
50% 45% 27% 35% 31% 34% 44% 36%
governance-Annual 50% 15% 53% 40% 44% 38% 37% 39%
governance-none 0% 40% 20% 25% 24% 27% 19% 25%

www.theiia.org/research 120
Contrasting GRC and ERM
Stratification Tables for Revenue, Organization Type, Industry Classification, Region, Full-time Equivalents (continued)
frequency of Internal audit function assessment: - By Industry Classification
ResponseFinancial Services
GovernmentHealthcare/ Insurance
Manufacturing Transportation Utilities Other Totals
erm-Continuous 27% 25% 24% 19% 25% 20% 31% 26%
erm-Annual 44% 33% 29% 48% 25% 47% 39% 40%
erm-none 29% 42% 47% 33% 50% 33% 30% 33%
governance-Continuous
35% 42% 24% 33% 44% 40% 39% 37%
governance-Annual
43% 38% 41% 37% 19% 53% 36% 39%
governance-none 22% 19% 35% 30% 38% 7% 24% 24%
frequency of Internal audit function assessment: - By region
Response Africa Asia PacificLatin
America/ Caribbean
Middle EastU.S. &
CanadaWestern Europe
Totals
erm-Continuous 57% 31% 0% 50% 24% 15% 27%
erm-Annual 21% 56% 80% 50% 35% 54% 40%
erm-none 21% 13% 20% 0% 41% 31% 33%
governance-Continuous
64% 37% 40% 100% 34% 46% 38%
governance -Annual
36% 45% 20% 0% 37% 38% 38%
governance -none 0% 18% 40% 0% 29% 15% 25%
frequency of Internal audit function assessment: - Internal audit – full-time equivalents
Response 1 2–5 6–10 11–20 21–50 50+ Totals
erm-Continuous 15% 26% 22% 44% 22% 25% 26%
erm-Annual 42% 35% 40% 37% 47% 63% 40%
erm-none 42% 39% 38% 20% 31% 13% 33%
governance-Continuous
26% 39% 31% 54% 32% 38% 37%
governance-Annual 33% 36% 39% 34% 42% 63% 39%
governance-none 41% 25% 30% 12% 26% 0% 24%

The IIA Research Foundation 121
notes
ChaPter 1
froM Internal Controls to rIsk
1. R. K. Mautz, Peter Tiessen, and Robert H. Colson, Internal Auditing: Directions and Opportunities (Altamonte Springs, FL: The Institute of Internal Auditors Research Foundation, 1984), 11–14.
2. Internal Control: Integrated Framework (Committee of Sponsoring Organizations of the Treadway Commission, 1992).
ChaPter 3
the eVolutIon of Internal audIt toward GoVernanCe
1. Practice Guide, Assessing Organizational Governance in the Private Sector (Altamonte Springs, FL: The Institute of Internal Auditors, July 2012), 1.
2. International Professional Practices Framework (Altamonte Springs, FL: The Institute of Internal Auditors, 2013).
ChaPter 4
the Many defInItIons of GrC
1. International Professional Practices Framework (Altamonte Springs, FL: The Institute of Internal Auditors, 2013), from the glossary.
2. Dean Bahrman, Advancing Organizational Governance: Internal Audit’s Role (Altamonte Springs, FL: The Institute of Internal Auditors Research Foundation, 2011), 5–6.
3. GRC Capability Model “Red Book 2.0” (Open Compliance and Ethics Group, 2009), 9.
4. The Committee on the Financial Aspects of Corporate Governance, and Gee and Co., Ltd., The Financial Aspects of Corporate Governance (London, England: Professional Publishing Ltd., December 1, 1992), paragraph 2.5.
5. Organisation for Economic Co-operation and Development, OECD Principles of Corporate Governance (Paris, France: OECD Publication Services, 2004), 11.
6. Justice Owen in the HIH Royal commission, The Failure of HIH Insurance Volume 1: A Corporate Collapse and Its Lessons, Commonwealth of Australia, April 2003 at page xxxiii and Justice Owen, Corporate Governance – Level upon Layer, speech to the 13th Commonwealth Law Conference 2003, Melbourne 13–17 April 2003 at page 2, as quoted in ASX Corporate Governance Council, Revised Corporate Principles and Recommendation with 2010 Amendments, 2nd edition (Australia: ASX Corporate Governance Council, 2007), 3.

www.theiia.org/research 122
Contrasting GRC and ERM
7. ASX Corporate Governance Council, Revised Corporate Principles and Recommendation with 2010 Amendments, 2nd edition (Australia: ASX Corporate Governance Council, 2007), 3.
8. The Failure of HIH Insurance Volume 1: A Corporate Collapse and Its Lessons.
9. International Professional Practices Framework, glossary.
10. Ibid. See the term Overall Opinion in the glossary, and Standards 2201 and 2210.
11. Paul J. Sobel and Kurt F. Reding, Enterprise Risk Management: Achieving and Sustaining Success (Altamonte Springs, FL: The Institute of Internal Auditors Research Foundation, 2012). Taken as a whole, Sobel and Reding’s discussion of “the relationship between governance, ERM, and internal control” supports the view that the “C” in GRC represents control (19–21). However, there are instances in the book that use the word compliance as well: “An emerging practice is to establish a position responsible for governance, risk, and compliance (GRC) activities” (44).
ChaPter 5
the Many defInItIons of erM
1. Michel Crouhy, Dan Galai, and Robert Mark, The Essentials of Risk Management (New York: McGraw-Hill, 2006), 16.
2. John Fraser and Betty Simkins, Enterprise Risk Management: An Introduction and Overview (New York: John Wiley & Sons, Inc., 2010), 525.
3. The RIMS website, “What Is ERM?” http://www.rims.org/erm/pages/WhatisERM.aspx (accessed March 15, 2013).
4. http://www.cmswire.com/cms/information-management/enabling-risk-management-across-the -organization-011432.php (accessed June 5, 2013).
5. Position Paper, The Role of Internal Auditing in Enterprise-wide Risk Management, published by The IIA-U.K. and Ireland, 2009, 2.
6. Enterprise Risk Management – Integrated Framework, Executive Summary Framework (Committee of Sponsoring Organizations of the Treadway Commission, 2004), 16.000
ChaPter 6
deVeloPInG a workInG relatIonshIP Between GoVernanCe and erM
1. Sawyer’s Guide for Internal Auditors, Vol. 3, Governance, Risk Management, and Compliance Essentials (Altamonte Springs, FL: The Institute of Internal Auditors, 2012), 16.
2. Paul J. Sobel and Kurt F. Reding, Enterprise Risk Management: Achieving and Sustaining Success (Altamonte Springs, FL: The Institute of Internal Auditors Research Foundation, 2012), 20.
3. Michael Rasmussen, quoted from “Is ERM GRG? Or Vice Versa?” Treasury & Risk, 2007.

The IIA Research Foundation 123
4. Douglas W. Hubbard, The Failure of Risk Management: Why It’s Broken and How to Fix It (Hoboken, NJ: John Wiley & Sons, 2009).
5. International Professional Practices Framework (Altamonte Springs, FL: The Institute of Internal Auditors, 2013), from the glossary.
ChaPter 8
GrC and erM MaturIty
1. Not only were the summary percentages similar, but a review of the stratified responses reflected similar percentages.
ChaPter 10
IMProVInG GrC and erM
1. Position Paper, Role of Internal Auditing in Enterprise Risk Management (Altamonte Springs, FL: The Institute of Internal Auditors, January 2009), 4.
ChaPter 11
Internal audIt InVolVeMent In GrC and erM
1. 2011 McKinsey Quarterly - Strategic Practice, Governance since the economic crisis: McKinsey Global Survey results. https://www.mckinseyquarterly.com/Governance_since_the_economic _crisis_McKinsey_Global_Survey_results_2814
ChaPter 14
fraMeworks and tools
1. Sawyer’s Guide for Internal Auditors, Vol. 3, Governance, Risk Management and Compliance Essentials (Altamonte Springs, FL: The Institute of Internal Auditors, 2012), 10.
Notes

The IIA Research Foundation 124
reFerenCe list
Australian Securities Exchange. Corporate Governance Principles and Recommendations with 2010 Amendments. http://w w w.asxgroup.com.au/media/PDFs/cg _ principles_recommendations_w ith_2010_amendments.pdf
Bahrman, P. Dean. Advancing Organizational Governance: Internal Audit ’s Role. Altamonte Springs: Institute of Internal Auditors Research Foundation, 2011. Print.
Banham, Russ. “Is ERM GRC? Or Vice Versa?” Treasury & Risk June (2007): 48-50. Cadbury, Adrian. Report of the Committee on the Financial Aspects of Corporate Governance.
London: Gee, 1992. Print.Crouhy, Michel, Dan Galai, and Robert Mark. The Essentials of Risk Management. New York:
McGraw-Hill, 2006. Print.Fraser, John, and Betty J. Simkins. Enterprise Risk Management. Hoboken, NJ: Wiley, 2010. Print.Hubbard, Douglas W. The Failure of Risk Management: Why It ’s Broken and How to Fix It.
Hoboken, NJ: Wiley, 2009. Print.Institute of Internal Auditors. International Professional Practices Framework (IPPF) – Practice
Guide – Assessing Organizational Governance in the Private Sector.Internal Control – Integrated Framework. New York, NY: Committee of Sponsoring Organizations
of the Treadway Commission, 1992. Print. King Report on Governance for South Africa 2009. Sandton, Republic of South Africa: Institute
of Directors of Southern Africa, 2009. Print.Mautz, R. K., Peter Tiessen, and Robert H. Colson. Internal Auditing: Directions and Opportunities.
Altamonte Springs, FL: The Institute of Internal Auditors Research Foundation, 1984. Print.New York Stock Exchange Unveils Governance Principles, CNBC 9/23/2010.
http://w w w.smartbrief.com/ser vlet/A rchiveSer vlet?issueid=CDA08614 -257D-4BBD-B652 -6643B621466A&lmid=archives
Organization for Economic Co-Operation and Development (OECD). OECD Principles of Corporate Governance (2004). http://www.oecd.org/daf/corporateaffairs/corporategovernanceprinciples/31557724 .pdf
Report of the National Commission on Fraudulent Financial Reporting. Washington, D.C.: Commission, 1987. Print.
Sawyer, Lawrence B. Sawyer’s Guide for Internal Auditors: A Comprehensive Research Manual. Altamonte Springs, FL: The Institute of Internal Auditors Research Foundation, 2012. Print.
Sobel, Paul J., and Kurt F. Reding. Enterprise Risk Management: Achieving and Sustaining Success. Altamonte Springs: The Institute of Internal Auditors Research Foundation, 2012. Print.
Taleb, Nassim. The Black Swan: The Impact of the Highly Improbable. New York: Random House, 2010. Print.
The Open Compliance and Ethics Group (OCEG) GRC Capability Model (Red Book) 2.0. http://thegrcbluebook.com/wp-content/uploads/2011/12/uploads_OCEG.RedBook2-BASIC.pdf
Tricker, R. Ian. Corporate Governance: Principles, Policies, and Practices. Oxford: Oxford UP, 2009. Print.
The IIA Research Foundation 125
the mission oF the iiA reseArCh FoundAtion
The Institute of Internal Auditors Research Foundation’s (IIARF’s) mission is to shape, advance, and expand knowledge of internal auditing by providing relevant research and educational prod-
ucts to the profession globally. As a separate, tax-exempt organization, The Foundation does not receive funding from IIA membership dues but depends on contributions from individuals and organizations—and from IIA chapters and institutes—to move our programs forward. We also would not be able to function without our valuable volunteers. To that end, we thank the following that have contributed in the past 12 months:
reseArCh sPonsor reCognition
strateGIC Partner
ACL Services, Ltd.
PrInCIPal Partners
CaseWare IDEA Inc. Crowe Horwath LLP Ernst & Young LLP PricewaterhouseCoopers LLP
dIaMond Partners
IIA–Chicago Chapter IIA–Dallas Chapter IIA–Philadelphia Chapter
Gold Partners
Anonymous Stephen D. Goepfert, CIA, CRMA Chevron Services, Inc. IIA–Detroit Chapter Exxon Mobil Corporation IIA–Houston Chapter Lockheed Martin Corporation IIA–Milwaukee Chapter IIA–Pittsburgh Chapter Southern California Edison Company

www.theiia.org/research 126
the iiA reseArCh FoundAtion boArd oF trustees
President: Sharon T. Grant, CIA, CRMA, United Airlines
Vice President–Strategy: Richard J. Anderson, CFSA
Vice President-Research and Education: Urton L. Anderson, PhD, CIA, CCSA, CFSA, CGAP, University of Texas at Austin
Vice President–Development: Wayne G. Moore, CIA, Wayne Moore Consulting
Treasurer: Mark J. Pearson, CIA, Boise, Inc.
Secretary: Michael F. Pryal, CIA, Federal Signal Corporation
Staff Liaison: Margie P. Bastolla, CIA, CRMA, The Institute of Internal Auditors Research Foundation
MeMBers
Neil D. Aaron, News Corporation Audley L. Bell, CIA, World Vision International
Sten Bjelke, CIA, IIA Sweden Peter H.G. Cheng, CIA, CRMA, National Health Research Institutes
Jean Coroller, IIA–France Scott J. Feltner, CIA, Kohler Company
Philip E. Flora, CIA, CCSA, FloBiz & Associates, LLC
Jacques R. Lapointe, CIA, CGAP, Province of Nova Scotia
James A. LaTorre, PricewaterhouseCoopers LLP USA Kasurthrie Justine Mazzocco, IIA–South Africa
Betty L. McPhilimy, CIA, CRMA, Northwestern University Frank M. O’Brien, CIA, Olin Corporation
John R. Peirson, Deloitte & Touche LLP (US) Jeffrey Perkins, CIA, CRMA, TransUnion
Edward C. Pitts, Avago Technologies Larry E. Rittenberg, PhD, CIA, University of Wisconsin
Mark L. Salamasick, CIA, CRMA, University of Texas at Dallas Susan D. Ulrey, CIA, CliftonLarsonAllen LLP
Jacqueline K. Wagner, CIA, Ernst & Young LLP

The IIA Research Foundation 127
the iiA reseArCh FoundAtion Committee oF reseArCh And eduCAtion Advisors
ChaIrManUrton L. Anderson, PhD, CIA, CCSA, CFSA, CGAP, University of Texas at Austin
VICe-ChaIrManFrank M. O’Brien, CIA, Olin Corporation
staff lIaIsonLillian McAnally, The Institute of Internal Auditors Research Foundation
MeMBersBarry B. Ackers, CIA, University of South Africa
James A. Alexander, CIA, Unitus Community Credit UnionSebastien Allaire, CIA, Deloitte Paris
John Beeler, SalesForce.com Inc.Joseph P. Bell, CIA, CGAP, Ohio Office of Internal Audit
Sharon Bell, CIA, The Boeing CompanyToby Bishop, Deloitte & Touche LLP (US)
Sezer Bozkus, CIA, CFSA, CRMA, Grant Thornton TurkeyJohn K. Brackett, CFSA, McGladrey & Pullen, LLP
Adil S. Buhariwalla, CIA, CRMA, IIA–United Arab EmiratesRichard R. Clune, Jr., CIA, Kennesaw State University
Donald A. Espersen, CIA, CRMA, despersen & associatesPeter Funck, IIA–Sweden
Stephen G. Goodson, CIA, CCSA, CGAP, CRMA, Texas Department of Public SafetyUlrich Hahn, PhD, CIA, CCSA, CGAP
John C. Harris, CIA, Gallagher Bassett Services, Inc.Sabrina B. Hearn, CIA, University of Alabama System
Karin L. Hill, CIA, CGAP, CRMA, Texas Department of Assistive and Rehabilitative ServicesWarren Kenneth Jenkins, Jr., CIA, Lowe’s Companies, Inc.
Jie Ju, Nanjing Audit UniversityDavid Muchoki Kanja, CIA, United Nations
Brian Daniel Lay, CRMA, Ernst & Young LLP David J. MacCabe, CIA, CGAP, CRMA
Steve Mar, CFSA, NordstromJozua Francois Martins, CIA, CRMA, Citizens Property Insurance Corporation
John D. McLaughlin, BDODeborah L. Munoz, CIA, CalPortland Cement Company
Jason Philibert, CIA, CRMA, TriNetMichael L. Piazza, Professional Development Associates
Sandra W. Shelton, PhD, DePaul UniversityRui Bezerra Silva, Libra Terminal Rio SA Tania Stegemann, CIA, CCSA, Rio Tinto
Warren W. Stippich, Jr., CIA, CRMA, Grant Thornton ChicagoDeanna F. Sullivan, CIA, SullivanSolutions
Stig J. Sunde, CIA, CGAP, IIA–United Arab EmiratesDawn M. Vogel, CIA, CRMA, Great Lakes Higher Education Corporation
David Williams, Dallas County Community CollegeValerie Wolbrueck, CIA, CRMA, Lennox International, Inc.
Linda Yanta, CIA, Eskom Holdings SOC LimitedDouglas E. Ziegenfuss, PhD, CIA, CCSA, CRMA, Old Dominion University

www.theiia.org/research