iie working paper 05-15 outsourcing and skill imports: foreign
TRANSCRIPT

Working Paper S e r i e s
W P 0 5 - 1 5 D E C E M b E r 2 0 0 5
1 7 5 0 M a s s a c h u s e t t s a v e n u e , n W | W a s h i n g t o n , D c 2 0 0 3 6 - 1 9 0 3
t e l : ( 2 0 2 ) 3 2 8 - 9 0 0 0 | F a x : ( 2 0 2 ) 6 5 9 - 3 2 2 5 | W W W . i i e . c o M
Outsourcing and Skill Imports: Foreign High-Skilled Workers on H-1B and L-1 Visas in the United States
Jacob Funk Kirkegaard
Jacob Funk Kirkegaard is a research associate at the Institute for International Economics. His current research focuses on European economies and reforms, pension reforms, offshoring, and the impact of information technologies. Before joining the Institute, he worked with the Danish Ministry of Defense and the United Nations in Iraq. In 1996, he graduated from the Danish Army’s Special School of Intelligence and Linguistics with the rank of first lieutenant.
AbstractThis working paper looks in detail at the H-1B and L-1 visa programs for temporary employment in the United States. Based on official data from the US Citizenship and Immigration Services and the US Department of State, H-1B and L-1 visa issuance rapidly increased in the late 1990s, followed by a marked slowdown after 2001. This points to the highly cycli-cal nature of both visa programs. Indian nationals and immigrants working in computer-related occupations dominate the H1-B and L-1 population in the United States, but these two groups are also found to be the most cyclical segment, with very large declines in inflows after 2001. The total population of H-1B visaholders in 2003 is estimated to range between 387,000 and 746,000, of which 160,000 to 306,000 were Indian nationals. As all data on H-1B/L-1 visaholders are gross numbers and gross jobs data for comparable categories are absent, the extent of the impact of these visa programs on the US labor market cannot be gauged precisely. A broad range of US industries and educational institutions are found to be employing H-1B recipients, with the IT industry being the dominant sector. Evidence of aggressive wage-cost cutting, in-cluding paying H-1B recipients only the legally mandated 95 percent of the prevailing US wage, is found among some H-1B employers, although no systematic abuse of the system is present.
Note: This working paper is based on work carried out at the Institute for International Economics in relation to its project on “Accelerating the Globalization of America: Information Technology” (2006, forthcoming). The author would like to thank Catherine Mann for her continued support and inspiration, and Elizabeth M. Grieco from the US Citizenship and Immigration Services and especially Julie Furuta-Toy from the US Department of State for invaluable aid in supplying detailed data and navigating them correctly. The author is currently residing in the United States on an H-1B visa sponsored by the Institute for International Economics and is solely responsible for any errors.
JEL categories: F22, F23, J44, J61, K31, L86 Keywords: Outsourcing, offshoring, high-skilled labor, immigration, H-1B/L-1 visas
Copyright © 2005 by the Institute for International Economics. All rights reserved. No part of this working paper may be reproduced or utilized in any form or by any means, electronic or mechanical, including photocopying,
recording, or by information storage or retrieval system, without permission from the Institute.

1
“I’d certainly get rid of the H-1B visa cap. That’s one of the easiest decisions.”1
Bill Gates, Microsoft Chairman
“Are employers taking advantage of [H-1B] immigrants to saturate the labor market and drive down wages for employees?”2
Marcus Courtney, WashTech President
Just as the ongoing offshore outsourcing of US jobs to low-wage countries has recently attracted the
attention of politicians and business leaders, so has its mirror image—the import of foreign high-
skilled labor for work in the United States. This working paper takes an in-depth look at available US
official statistical data on this important phenomenon and gauges its true extent with particular
emphasis on the US information technology (IT) services sector.
Section I briefly describes available data. Section II shows how the aggregate use of foreign
imported labor on L-1 and H-1B visas in the United States has been highly cyclical, with a large
increase up to 2001 followed by a significant decrease in subsequent years and a rebound in 2004.
The section looks in detail at the sectoral and national characteristics of H-1B visa recipients and
gauges the size of the entire H-1B population inside the United States. Section III focuses on the US
IT services industry’s use of imported labor, the sector’s major employers, as well as the wage levels
of H-1B visa recipients. Concluding remarks round off the paper.
I. WHERE DO US L-1 AND H-1B VISA DATA COME FROM?
Foreign high-skilled workers enter the US labor market temporarily,3 predominantly as either
“intracompany transferees” (L-1 visaholders4) or “foreign specialist workers” (H-1B visaholders5). As
1 Comments at the Library of Congress, April 27, 2005. Reported in CNET News at http://news.com.com/Gates+wants+to+scrap+H-1B+visa+restrictions/2100-1022_3-5687039.html (accessed on August 3, 2005). 2 Comments on January 27, 2005, reported in CNET News at www.zdnet.com.au/jobs/news_trends/0,2000056653,39178682,00.htm (accessed on August 3, 2005). 3 This working paper does not deal with permanent immigrants in the United States, many of whom are also highly skilled. 4 L-1 visas are for individuals being transferred to work for a US-located employer. To be eligible for an L-1 visa, one should have worked abroad for one continuous year within the last three years in a related business entity in a managerial/executive position or in a so-called specialized knowledge staff capacity. For those in the former category of experience, the initial duration of an L-1 visa is three years, extendable up to seven years, while for the latter category, initial duration is also three years but with a possible two-year extension. In June 2005, the US Citizen and Immigration Services (USCIS) implemented the L-1 Visa Reform Act of 2004, which contained a number of amendments to limit the use of imported foreign high-skilled workers on L-1 visas. As such, L-1 visa recipients can no longer work (primarily) at a work site other than that of their petitioning employer if either: (a) the work is controlled and supervised by a different employer or (b) the offsite arrangement is essentially one to provide a nonpetitioning party with local labor for hire, rather than a service related to the specialized knowledge of the petitioning employer. See “USCIS Implements L-1 Visa Reform Act of 2004,” USCIS press release, June 23, 2005.

2
the H-1B visa program is the larger of the two programs in question, and the category for which
most detail is available, its discussion will make up the majority of the content of this working paper.
In all cases, official data are collected by fiscal years (from October to September) rather than
calendar years. The main data sources are the US Department of Homeland Security’s Citizen and
Immigration Services (USCIS)6 Yearbooks of Immigration Statistics,7 the US State Department’s annual
reports of the visa office of the Bureau of Consular Affairs,8 the annual reports to Congress on the
characteristics of H-1B visa recipients9 as well as the US Department of Labor’s Foreign Labor
Certification (FLC) online database for labor condition applications (LCAs).10
In order to relate the different data sources to each other, it is useful to first describe the
process of obtaining an H-1B11 and L-1 visa. An H-1B visa is sought by a US employer wishing to
hire a foreign high-skilled worker. The process has two distinct parts: First an LCA is filed with the
Department of Labor’s Employment and Training Administration (DOLETA). In this filing, a US
employer (or a legal representative—i.e., an immigration lawyer) demonstrates interest in hiring a
foreign worker and provides DOLETA with the necessary information to establish that the foreign
worker will be employed in the United States in accordance with US law (see below)—otherwise the
application will be rejected. For data purposes, this means that a great deal of information about
employers and wage levels is available from DOLETA’s online database. However, it is important to
emphasize that filing an LCA merely indicates a US employer’s interest in hiring a foreign worker. It
has no direct relation to whether an H-1B visa is issued and holds no valid information about the
number of H-1B employees a particular US employer hires.
Once the LCA is approved, the US employer (or legal representative) files a petition for an
H-1B visa with the USCIS in order for an H-1B visa to be issued to the individual foreign worker
whom the US employer wishes to hire. For data purposes, this means that a substantial amount of
data on the number and aggregate characteristics of approved H-1B petitions are available from the
USCIS, and this is the source for the actual number of approved H-1B visa petitions.
However, it is important to understand that a US visa is an “entry document”—i.e., a
document that aliens show at the US border to be allowed to enter the United States. But in many
cases, recipients of H-1B visas are already inside the United States when the USCIS approves their
H-1B petitions. These recipients receive H-1B approval notices from the USCIS and are issued H-IB
visas only when they travel outside the United States for the first time while in H-1B status in order
to be allowed back into the United States. As this working paper is about the importing (i.e.,
5 H-1B visaholders must hold a minimum of the equivalent of a US baccalaureate degree to be eligible for this visa, as well as adhere to a list of other requirements. See http://uscis.gov/graphics/services/tempbenefits/TempWorker.htm for further information. 6 The USCIS was formerly the Immigration and Naturalization Service (INS). 7 Available at http://uscis.gov/graphics/shared/statistics/yearbook/index.htm. 8 Available at http://travel.state.gov/visa/about/report/report_1476.html. 9 Available at http://uscis.gov/graphics/shared/services/employerinfo/H-1B.htm. 10 Available at www.flcdatacenter.com/. 11 See http://workforcesecurity.doleta.gov/foreign/h-1b.asp for additional information.

3
involving the crossing of international borders) of foreign high-skilled workers into the US
workforce, the fact that many H-1B recipients are already inside the United States further
complicates the choice of data. Hence, to get a better idea about the number of high-skilled workers
entering the US workforce from abroad, the US Department of State’s data on H-1B visas actually
issued at overseas US consular offices are a better source, as they track the actual number of new
high-skilled aliens entering the United States as H-1B workers.
On the other hand, much less data are available for L-1 visas. The application process is
somewhat less complicated, although many of the issues from H-1B visas resurface here as well.
Again, the US employer files for the L-1 visa with the USCIS on behalf of the alien worker,12 who
then, if outside the United States, uses this application to obtain an L-1 visa at a US consular office
abroad. If the alien is inside the United States at the time, a change of visa status is sought at the
USCIS. An important distinction from the H-1B visa is that no labor certification—i.e., statement
that the alien is being employed on the same terms as US workers—is required for the L-1 visa.
Unfortunately, no data are available from the USCIS on the total number of L-1 petitions approved,
and to get an idea of the number, one has to look at the actual number of L-1 visas issued by
overseas US consular offices.
In a different function, the USCIS also collects data on persons in both H-1B and L-1 status
when they enter the United States at the border. The category “person in visa status” includes people
who have changed their nonimmigrant status while inside the United States to either H-1B or L-1
status and obtained the visa from a US consular office abroad, Canadians in this status exempt from
the visa requirement, and people outside the United States who have obtained their H-1B and L-1
visas from US consular offices abroad. It is evident that the number of H-1B and L-1 entries into the
United States will have very little direct relation to the actual number of H-1B visaholders inside the
United States at any given time or the number of H-1B or L-1 visas issued in a given period. Both H-
1B and L-1 visas are multiyear visas, and individuals in H-1B or L-1 visa status obviously may enter
and exit the United States numerous times in a given period for the duration of their visa status,
inflating the number of entries relative to the actual number of persons in a particular visa status.13
Thus, the number of entries by persons in visa status in a particular visa category in a given period
will be significantly higher than the number of visas issued in that period.
12 This is done through filing an I-129 petition. For an in-depth description of the L-1 filing procedure, see Wasem (2004). 13 The opposite could also be the case, where a person in H-1B or L-1 visa status do not exit and reenter the United States at all for the duration of their multiyear visa, in which case the relative number of entries would be deflated. This, however, in the aggregate seems to be rare.

4
II. DATA RESULTS, LEVELS, AND DEVELOPMENTS
Figure 1 presents USCIS data on the number of entries by individuals in H-1B and L-1 visa status
into the United States.14 A very clear rising time trend is seen from the mid-1990s to 2001, after
which it declines before rebounding in 2004. Admission of high-skilled workers into the United
States thus mirrors the broader economic trends in the US economy and labor market, which saw
rapid job growth in the latter part of the 1990s, a recession in 2001, and subdued job growth in
2002–03, before a rebound in 2004. Data on entries of high-skilled individuals thus point to the fact
that in the aggregate, utilization of the H-1B and L-1 visa programs is quite responsive to cyclical
changes in the US economy.
The data in figure 1 are interesting mainly to discern this time trend and not for the absolute
levels, as multiple entries significantly inflate the latter. And even so, such a time trend may be caused
by external factors rather than any changes in the actual number of persons in visa status. For
instance, a decline in real airfare prices since the early 1990s makes it more likely that individuals in
H-1B or L-1 visa status will travel abroad (and hence exit and enter the United States) more today
than they would have in 1990, resulting in a rising time trend even if the actual number of visaholders
were constant. Similarly, the rapid increase of US foreign direct investment abroad and foreign
investment in the United States—i.e., the rise of multinational companies—since 1990 will likely
increase the number of entries and exits by individuals in the relevant visa status and hence push up
the time trend. This point is particularly important in the case of India, which started its economic
liberalization only in 1991.
L-1 Data in Detail
The distinction between data on visaholder entry and those on actual visa issuance becomes clear
when data from figure 1 is compared with actual visa issuance data for 1990 to 2004 from the US
State Department. The comparable data for total annual issuance of L-1 visas at US consular offices
abroad is shown in table 1.
Actual L-1 visa issuance peaked in 2001, with 59,384 visas issued, and subsequently declined
slightly in 2002 and 2003, before setting a new record in 2004 (as initial data indicate). As such L-1
visa issuance in general fluctuates with the same cyclicality as seen in the admission of individuals in
L-1 visa status. The fact that actual visa issuance as a share of admissions declined from 23 percent in
the early 1990s to around 20 percent in recent years is testament to the fact that in the aggregate,
14 See Wasem (2004) and Lowell (2000) for longer time series on visa issuance for larger L and H-1 visa categories.

5
individuals in L-1 status travel more today than before. Further, the point of visas as “entry
documents” resurfaces here, as the three-year L-1 visa is renewable either twice for two additional
years at a time for a total of seven years (managers/executives) or once for two additional years for a
total of five years (specialized knowledge staff). If the visa recipient is already inside the United States
when the USCIS approves the L-1 visa petition and never leaves the United States during his or her
spell of employment, no visa will need to be issued, and the actual number of visas issued may
underestimate the actual number of L-1 recipients in the US labor force at any given time. All the
above-listed issues illustrate the difficulties in estimating the precise number of L-1 visaholders within
US borders based on entry and actual issuance data.
Digging a little deeper into the additional available data by nationality on entries into the
United States by individuals in L-1 visa status and actual issuance of L-1 visas at US consular offices,
one sees in table 2 that rich countries such as Britain, Japan, and Germany, with which the United
States shares very close economic relations in terms of direct investment and cross-ownership of
companies, consistently top the list of countries whose citizens are admitted in L-1 status. Britain
consistently accounts for the highest share of the L-1 visa population, which is in accordance with its
status as the top foreign investor in the United States (and vice versa). Sharing the same language and
Anglo-Saxon business culture facilitates intracompany employee transfers.
While rich countries dominated in terms of the number of individuals admitted on L-1 visa
during 1996–2003, in terms of actual L-1 visa issuance they were overtaken by India after 2000.
Actual L-1 visa issuance to Indian nationals rose by more than thirteen-fold, from 1,350 in 1996 to
more than 18,000 by 2003. This increase occurred at the same time as the number of L-1 visas issued
to Chinese citizens declined by almost 75 percent, from 4,256 in 1996 to just 1,098 in 2003, clearly
indicating that just because a developing country is growing rapidly and economically integrating with
the world does not mean that its nationals will be issued L-1 visas more intensively. In other words,
the rapid increase in Indian nationals’ use of L-1 visas does not seem to be just a story of rapid
Indian economic growth and embrace of globalization, as this has also occurred in China—
something else seems to have happened.15
It is clear from table 2 that in terms of how frequently a country’s citizens in L-1 status travel
in and out of the United States, India stands out with a much lower average rate of entry (and exit)
than other similar countries. The fact that Pakistanis in L-1 status, who in terms of family traditions
and geography are “closely related to Indians,” seem not to be significantly more likely to travel in
(and out) of the United States than other nationalities makes India a particular outlier. Indeed, the
actual number of L-1 visas issued to Indian nationals is almost the same as the number of Indian
nationals in L-1 status entering the United States, possibly indicating that the work of Indians in L-1
15 While more geopolitical tension existed between the United States and China during the period in question than between the United States and India, in neither case has this tension reached a level where it can reasonably be said to have influenced the increasing economic cooperation between the two countries and the United States.

6
visa status is much more fixed inside the United States than is the case for other nationals. This
interpretation would be consistent with the use of L-1 visas to import Indian workers to the US labor
market.
On the other hand, when looking at detailed entry data for Indian nationals for fiscal 2003,
one sees in table 1 that 21,748 Indians in L-1 visa status entered the United States. During that same
period, 10,664 Indians in L-2 visa status—either the spouse or children of an individual in L-1
status—entered the United States16—i.e., roughly the same 2:1 ratio between L-1 visaholders and
their spouses and children as that found among other countries and in the aggregate data. This large
relative number of Indian family members to Indians in L-1 visa status in the United States seems
somewhat at odds with notions that the L-1 visa program is dominated by young, single, male Indian
IT workers being imported temporarily into the United States to work in the IT sector.
In summary, the use of the L-1 visa program has increased rapidly in recent years, and Indian
nationals now account for a larger share of the total L-1 population. The rising trend in L-1 visa
usage indicates increased import of foreign labor (especially Indians) to the US labor market via this
program. However, one cannot discern from available data whether this increase in the number of
Indians in L-1 visa status is in any specific industry or occupation, particularly IT.
H-1B Data in Detail
Much more official data exist on H-1B than on L-1 visas, which significantly aids the analysis. The
American Competitiveness and Workforce Improvement Act of 199817 requires US immigration
authorities to annually collect and present to the US Congress information on the countries of origin,
occupations, educational attainment, and compensation paid to aliens whose employers successfully
petition for their H-1B status. However, more data also mean that they could be misinterpreted.
Therefore, it is important to distinguish between the four data sources for H-1B information: 1)
LCAs; 2) entry data; 3) successful H-1B visa petitions; and 4) actual H-1B visas issued. A numerical
comparison of the latest available data illustrates the following:18
1) LCAs: No data on the total number of LCAs filed in 2003 exist at the time of writing, as
multiple processes for filing were available at the time.19 But as mentioned above, this
number is essentially meaningless as it has little or no relation to the actual number of
H-1B visa petitions approved and visas actually issued.
16 Data are from the USCIS Yearbook of Immigration Statistics 2004, table 23, 93. 17 See Public Law 105-777, Division C, American Competitiveness and Workforce Improvement Law, Section 416(c)(2). 18 See also Assem (2004) for an in-depth description of the different types of H-1B visa data. 19 In 2002, employers filed applications online (H-1B E-File) or faxed them (H-1B fax data). Only the E-File data are available. See DOLETA’s datacenter at www.flcdatacenter.com/CaseH-1B.aspx.

7
2) Entry data: In 2003, 360,498 individuals in H-1B visa status entered the United States
(figure 1).
3) Successful H-1B visa petitions: In 2003, 217,340 H-1B visa petitions were granted by the
USCIS, which is only 60 percent of the number of times an individual in H-1B visa
status entered the United States in 2003.
4) H-1B visas issued: The US State Department issued a total of 107,196 visas in 2003, or
only 30 percent of the number of times an individual in H-1B visa status entered the
United States in 2003 and only 49 percent of the number of visa H-1B petitions
approved by the USCIS.
The reasons that the number of entries to the United States by H-1B visaholders is
significantly above both approved H-1B visa petitions and actual H-1B visas issued are similar to
those of L-1 visas, as the H-1B visa is also a multiyear visa. However, it is more surprising that there
is an almost 50 percent difference between the number of approved H-1B petitions and actual H-1B
visas issued. This difference has four main reasons: First, it is of course always possible that an alien
for whom an employer has petitioned for an H-1B never “shows up” and hence does not need a visa.
The extent of such “absenteeism” among foreign H-1B beneficiaries cannot be gauged but should be
expected to be limited, especially in the IT sector, where large differences in wages exist between
countries (for instance, between India and the United States). Second, “multiple employers”
(frequently at different levels within the same organization) often petition for the same foreign
worker, who subsequently may be granted multiple petitions. Third, employers may apply for
multiple H-1B visas in their individual petitions to the USCIS, and as the “immediate use” of
approved petitions is not a requirement, US employers may “hoard” such successful petitions, thus
inflating the number compared with actual H-1B visas issued in a given period. Fourth, as with L-1
visas, H-1B visas are “entry documents,” so if an alien is already inside the United States at the time
his or her petition is approved and never leaves the United States during his or her time in
employment, no actual H-1B visa needs to issued.20
Table 3 brings together statistics from USCIS annual reports to the US Congress on the
country of origin, occupation, industry sector, and average wage levels of recipients of successful H-
1B petitions. It is separated into two panels: Panel A shows data on H-1B petitions granted for initial
employment—i.e., to new aliens entering the US labor market (columns 1 to 5). Panel B shows data
on H-1B petitions granted for continuing employment—i.e., to aliens already in US employment at
the time of issuance (columns 6 to 10). As the trends in the data in the two panels are roughly similar,
20 Depending on the visa reciprocity with the alien’s country of origin, his or her H-1B visa may be limited to a shorter period of validity than the initial three-year duration of the H-1B work permit, and/or fewer entries. If this is the case, an individual may need to have more than one H-1B visa issued during the three-year duration of the H-1B work petition. This, however, is not relevant for any of the individual countries discussed in this paper.

8
this discussion will focus predominantly on H-1B visas granted for initial employment in the United
States.
Row 2 in panel A shows the number of H-1B visa petitions as a share of the total number of
individuals in H-1B visa status entering the United States. This number varies quite a bit between a
high of 86 percent in 2001, the year when the number of new H-1B visa petitions granted peaked at
331,206, to a low of 53 and 60 percent in 2002 and 2003, respectively. 21 Similarly, row 3 in panel A
shows that the share of H-1B visa petitions granted for initial employment also peaked in 2001 to
201,787 or 61 percent of the total,22 before dropping to only 103,584 in 2002 and 105,314 in 2003—
indicating that the number of H-1B petitions approved for initial employment was cut in half after
2001. This drastic decline is quite remarkable considering that all the years in question (2001, 2002,
and 2003) had the same 195,000 congressional cap (box 1) in place and hence did not occur due a
regulatory change in US visa laws. Instead, it is evident that the granting of H-1B visa petitions for
initial employment is even more cyclical than the entry of individuals in visa status in figure 1.
An alien for whom an employer initially applies for an H-1B visa may be either outside the
United States or already in the United States at the time of the application. If the alien is outside the
United States, a successful petition (and subsequent visa issuance at a US consular office and entry
into the United States) will result in an addition to the US labor force. If the alien is inside the United
States, a successful petition need not necessarily result in an addition to the US labor force, as the
alien may be transferring from another US visa category and may already be in the US labor force.
For example, an alien could transfer from an academic F-1 visa, which gives the visaholder an option
to work for one year (called optional practical training, or OPT) within the United States after
graduation from an accredited US educational institution with a baccalaureate or higher academic
degree. So if this student were granted an H-1B visa while working in the United States on OPT, it
would not result in an addition to the US labor force. With respect to aliens in this “educational
pipeline,” the US Immigration and Naturalization Service (now the USCIS) provides statistical detail
on the previous visa status of beneficiaries of H-1B visa petitions in 1999 who were present in the
United States at the time their H-1B visa petitions were approved (numbering 53,300). Of these, 60
percent (30,800) were students. Hence in 1999, about a quarter of the total number of H-1B visa
petitions granted for initial employment (134,400) went to aliens who had studied in the United
States and then upon graduation or finishing a year of OPT entered the US labor force. Given that it
is relatively administratively simple (and cheap) for an F-1 student graduating from a US university to
21 This is further supported by data from a GAO report (GAO 2000), which shows that from 1992 to 1998, the number of “new H-1B nonimmigrants approved” was between 50,000 and the annual cap of 65,000. This is substantially lower than the roughly 100,000 entries by individuals in H-1B visa status seen in figure 1. However, data from the GAO publication refer only to those approved H-1B visas that count toward the annual congressional cap. 22 The fact that this number for H-1B petitions for initial employment exceeds the 195,000 congressional cap is testament to why one should not take the cap as an indicator of the number of H-1B visas available annually.

g
m
f
a
t
2
o
w
Box 1 The congressional cap on H-1B visas Possibly the most discussed single number with respect to H-1B visaholders and their economic impact on the US economy is the congressional cap on annual H-1B petitions. This is somewhat unfortunate, as this particular number is almost entirely meaningless when analyzing the actual number of H-1B visaholders in or entering the US labor market. From fiscal 1992 to 1998, the annual cap was 65,000 before being temporarily raised to 115,000 in 1999 and 2000 and to 195,000 from 2001 to 2003. In 2004, it dropped back to 65,000, before being raised through the H-1B visa Reform Act of 2004 by 20,000 for fiscal 2005 and subsequent years. However, the additional 20,000 H-1B visas made available for fiscal 2005 and subsequent years are earmarked only for aliens who have earned a master’s or higher degree from a US institution of higher learning (USCIS 2005).
However, the following H-1B applicant categories are exempt from the annual congressional cap: * J-1 visa holders in medical education and training, who have been granted a waiver of the posteducation
two-year home residency requirement; * beneficiaries employed at an institution of higher education or related affiliated nonprofit entity; * beneficiaries employed at a nonprofit or governmental research organization; and * beneficiaries who are renewing their H-1B visa status after the expiry of the initial three-year period.
The second and the fourth categories are substantial categories of exemption, as will be illustrated below (see shaded area in table 3). Indeed, exempt categories made up the majority of all successful H-1B petitions approved by the USCIS in 2002 and 2003, which evidently makes the annual congressional cap a very poor indicator of the actual number of new H-1B visas available in a given year.
The two recent US free trade agreements (FTAs) with Chile and Singapore have also had direct implications on the congressional cap such that the agreements earmarked 1,400 and 5,400 H-1B visas per fiscal year to Chilean and Singaporean nationals, respectively. In other words, this in effect cut the number of H-1B visas available to all other aliens from fiscal 2004 onward to just 58,200, or by just over 10 percent.
The inclusion of such visa rules in US FTAs caused some initial political tension in the US Congress. But the actual effect of FTAs on US visa issuance so far has been very modest, since less than 100 H-1B slots were used by Chileans and Singaporeans during the first year of the two FTAs in fiscal 2004.The remaining more than 6,700 unused H-1B slots were returned to the total pool of 65,000.
The introduction of the “E-3” visa in the US-Australia FTA in May 2005, which is essentially an H-1B visa only for 10,500 Australians a year, is another novelty that invariably will make the annual congressional H-1B cap less reliable as a measure of foreign high-skilled labor inflows into the United States.1 The E-3 further indicates that at least for “allied developed countries,” high-skilled visas are increasingly becoming a bargaining chip in FTA negotiations. This does not, however, so far seem to be the case in US FTA negotiations with developing countries.2
However, as technical capabilities for disaggregation of the value chain of service providers and the supply of high-skilled workers in developing countries both continue to increase, this topic is certain to remain on trade policymakers’ agendas. Already several developing countries—most notably India—have submitted demands for the inclusion of visa regulation and the movement of natural persons (GATS mode 4) in the ongoing Doha service-sector negotiations (Government of India 2002).
1 For details on the new visa, see the Australian government’s Web site at www.dfat.gov.au/geo/us/e3_visa.html. 2 See comments on the issue by Congressman James Sensenbrenner at the Australian Parliament, May 31, 2005, at http://canberra.usembassy.gov/sensenbrenner%20Q&A.htm.
et his or her one-year OPT, compared with getting an H-1B immediately, it is likely that the
ajority of F-1 visaholders transfer into H-1B visa status only after the OPT period expires. This is
urther made likely by the fact that aliens on OPT are exempt from US social security taxes, which
liens in H-1B visa status are not.
It becomes clear from rows 4 and 5 of panel A that 80 percent of the drastic decline in the
otal number of successful H-1B visa petitions approved for initial employment between 2001 and
002 (79,000 out of a decline of 100,000) occurred in the number of petitions approved for aliens
utside the United States at the time of the petition. In other words, importing of foreign high-skilled
orkers from outside the United States into the US labor force was the most cyclical of all relevant 9

10
aggregate H-1B categories and saw by far the biggest numerical decline following the end of the long
US economic boom in 2001.
In contrast, the number of H-1B petitions for initial employment approved for aliens who
were inside the United States at the time of the petition (row 5) has been relatively stable since 2000,
at approximately 65,000 a year, albeit rising slightly to 85,000 in 2001. Recalling that most in this
group were on academic F-1 visas, the relative stability over the entire period further indicates that
any fallout from reduced applications to US universities has yet to reflect in the number of foreign
graduates entering the US labor market. As such, while US companies have reduced their import of
foreign high-skilled workers, they have continued to hire approximately the same number of foreign
graduates from US universities as they did in 2000.23
Here it should be emphasized that the regulations concerning H-1B (as well as L-1) visas,
unlike those for other US temporary visas, allow a visaholder “dual intent.” This means that aliens
may temporarily enter the United States for work purposes and simultaneously lawfully pursue
permanent residency (for both themselves and their immediate family) while in the United States
without affecting their H-1B visa status. The lack of a requirement for foreign residence while
applying for a “green card,” as well as the opportunity to travel in and out of the United States during
such an application process, make the H-1B visa a desirable way to obtain US permanent residency.
The stability in the number of foreign students hired indicates that the utilization of this channel by
this group has not been affected by either the recent tighter US labor market or the post–9/11
security fallout. Hence, in the last couple of years, the H-1B program has continued to be a part of
the path of “first a US degree, then a US job, then US permanent residency” for many high-skilled
immigrants to the United States. (However, this path has ever more obstacles; see box 2.)
Digging deeper into the data on country of origin (rows 6 to 8 in panel A), one sees that
Indian citizens account for by far the largest share of H-1B petitions, about half of all petitions
granted in 1999–2001, followed at a distance by China, Canada, and Britain. The data in rows 9 to 11,
which show that “computer-related occupations” are by far the biggest occupational category for
successful H-1B petitions, and in rows 12 and 13, which show that in 2001 about half of all recipients
of successful H-1B petitions were employed in the US IT services and hardware industry indicate
that in these particular sectors, the use of imported high-skilled Indian labor was widespread during
the boom years.24
23 The 2004 H-1B Visa Reform Act, which adds an additional 20,000 H-1B visas exclusively for foreign nationals who have obtained a master’s degree or higher from a US institution of higher education, is a direct attempt at facilitating the continued employment inside the United States of foreign graduates of US educational institutions. However, the fact that only 9,358 (of the 20,000) have been applied for (as of July 28, two months before the end of fiscal 2005) indicates a possible slowdown in the employment by US businesses of foreign high-skilled graduates from US universities. See USCIS public notice, May 24, 2005, at http://uscis.gov/graphics/services/tempbenefits/cap.htm. 24 The rapid rise in employment of “imported high-skilled IT workers” by US-located firms during the 1990s is further illustrated by the fact that in 1992, only about 6,000 H-1B visas (out of an approximately 50,000 granted that year) were issued to IT-related occupations. Fiscal 1992 was the first year when the H-1B visa

o
o
p
ctw
Box 2 From high-skilled import to permanent US resident “Dual intent” provisions, which allow both L-1 and H-1B visaholders to apply for permanent US residence (a green card) while working in the United States, directly link the entry regulation of temporary high-skilled workers and permanent additions to the US workforce through immigration. However, a number of particular rules concerning the granting of “green cards” make pursuing “dual intent” far more difficult for some nationals—particularly Indians—than others.
The Immigration and Nationality Act (INA, section 201)1 stipulates that an annual maximum of 366,000 immigrants may be granted permanent residence in the United States under family and employment-based preferences, the latter of which is of relevance to L-1 and H-1B workers. The INA (section 202) further prescribes that the per-country limit for such preference immigrants is 7 percent of the total (i.e., 25,620 of the current 366,000 maximum).
Three types of employment preferences are relevant here: 1) priority workers—multinational company managers, executives, persons with extraordinary ability, outstanding researchers, and academics; 2) holders of advanced degrees (PhDs) and/or possessing exceptional abilities; and 3) skilled workers, professionals, and other workers (the majority of H-1B/L-1 visaholders fall in this category).
All applications for employment-based preferences are processed chronologically from the date of application. This, combined with the 7 percent per-country limit for green card applications and the lop-sided national distribution of dual-intent H-1B and L-1 visas, with Indian nationals making up by far the largest share of visa recipients, has created severe delays for some nationals in acquiring a green card. The Department of State therefore has created “cut-off dates,” which essentially is the earliest date by which those from “over-subscribed nationalities” must apply for permanent residence in order for their applications to realistically be processed in a given fiscal year.
The October 2005 Department of State Visa Bulletin (at http://travel.state.gov/visa/frvi/bulletin/bulletin_2631.html#) indicates that in fiscal 2005, nationals from China (mainland-born), India, Mexico, and the Philippines are expected to face numerical restrictions and delays. As such, under the third preference (skilled worker, professionals and other workers), only those Indians who filed for permanent residence in January 1, 1998, can expect to have their applications processed in 2005—in other words, most Indian H-1B and L-1 visaholders face a more than seven-year delay in acquiring an employment preference–based permanent US residence. The similar cut-off date for Chinese nationals is May 2000, indicating an approximately five-year delay.
As the maximum duration for H-1B visas is six years, these delays will frequently force Chinese or Indian H-1B (or L-1) visaholders to leave the United States before they will be eligible for permanent residency. Obviously, this in effect undermines the “dual-intent” provision for such H-1B (and L-1) visaholders of Chinese and Indian nationalities.
The very long delays facing Indian nationals therefore make it highly unlikely that many—if not most—of the H-1B/L-1 visa recipients from India, who arrived in the United States during and immediately after the information technology boom, will be able to acquire permanent US residency without first having to leave the United States for a prolonged period.
While the likely inability of many recently imported Indian IT specialists to acquire permanent US residence will be applauded by some, its longer-term effects are difficult to immediately gauge. It could be viewed as an expedient way to rid the US labor force of some workers who may no longer be needed as much as they were in 1999–2000, thus plausibly providing better employment opportunities to American workers. However, such a viewpoint is mitigated by the adverse impact of reverse brain drain. These are highly skilled people, whose skills the US economy would benefit from in general. Furthermore, such workers might take up employment and utilize the skills acquired while in the United States in foreign-located direct competitors of US-located companies, which may prove a longer-term competitive threat to these US-located companies.
1 Available at http://uscis.gov/lpBin/lpext.dll/inserts/slb/slb-1/slb-22/slb-1150?f=templates&fn=document-frame.htm (accessed on September 17, 2005).
On the other hand, Indians account for about 70 percent of the total decline in the number
f H-1B petitions approved for initial employment from 2001 to 2002 (70,000 out of a total decline
f 100,000). This decline of about 70,000 corresponds very closely to the decline in the number of
etitions approved for aliens in computer-related occupations and for aliens employed in the US IT
11
ould be granted to aliens under the Immigration Act of 1990, and hence most granted visas that year counted oward the 65,000 annual cap, especially since no extensions could logically be granted. Earlier, H-1B visas ere referred to as “specialty occupation visas” and had no upper limit (GAO 2000:8)

12
services and hardware sectors.25 Because individual petitions cannot be “cross-tabbed,” it cannot be
discerned with absolute certainty whether the same petitions account for the similar level of decline
in all three categories. Nevertheless, it strongly indicates that the number of H-1B visas granted for
initial employment to Indians in computer-related occupations, employed in the US IT services and
hardware sectors, drastically declined from 2001 to 2002 and that the level in all three categories
remained low in 2003.26
The data in the addendum to table 3 (rows 14 to 17 in panel A) on actual H-1B visa issuance
abroad to Indians corroborate this interpretation. The number of actual H-1B visas issued to Indians
declined by roughly 40 percent (or about 30,000) from 74,000 in 2001 to only 44,000 in 2002 and
further to 42,000 in 2003. As such, Indians also make up 70 percent of the 43,000 decline in actual
H-1B visa issuance from 161,000 in 2001 to 118,000 in 2002. Also, Indians’ share of total H-1B
issuance declined from 46 percent in 2001 to 37 percent in 2002, rising slightly to 39 percent in 2003.
Size and Impact of the H-1B Population in the United States
Estimating the actual number of H-1B visaholders in the US labor market at any given time is
particularly challenging, given the data limitations illustrated earlier. However, the data in table 3 give
an idea of the range of the number of H-1B beneficiaries in the US economy in recent years. Keeping
in mind that an H-1B visa is valid for a maximum of three years, and assuming that all the aliens
whose H-1B petition were approved from 2000 to 2003 were inside the United States for the entire
duration of their visas, one can obtain from row 2 in panel A the absolute maximum potential H-1B
population in the United States of 786,000 and 746,000 in 2002 and 2003, respectively.27
However, as seen earlier, the actual number of H-1B visas issued by the State Department is
much lower than the number of H-1B petitions approved by the USCIS. Data in row 14 yield a total
H-1B population in the United States of 411,000, 413,000, and 387,000 in 2001, 2002, and 2003,
respectively—again assuming that all recipients remained in the United States for the entire three-
year period of their visa but more important, assuming that no alien received a “change of visa status
to H-1B” while already inside the United States and that the only H-1B recipients inside the United
States came directly from abroad. As such, the data in row 14 surely underestimate the actual
25 A similar trend is visible for recipients of extensions of H-1B visas (panel B, columns 8 and 9), where the number of Indian recipients and recipients in computer-related occupations and IT services and hardware sectors all declined by about 30,000 from 2001 to 2002. 26 These data are in part corroborated by other sources. For instance, NASSCOM, the Indian IT industry association, estimates that the number of Indian IT professionals traveling to the United States on H-1B visas dropped from 77,000 in 2001 to 33,000 in 2002 and 30,000 in 2003 (as of March 2003). The source for these data is Wipro Ltd.’s 2004 20-F filing with the SEC. 27 2002 and 2003 are the only two years for which enough data are available to make three-year aggregate summations.

13
population. Therefore the actual H-1B population ought to be within the approximate range of
400,000 and 750,000.28
Similar simple three-year summations of data in table 3, again assuming all aliens with a
successful H-1B petition (both for initial and continuing employment, i.e., panels A and B) were
present for the entire three-year period, yield a maximum estimated Indian H-1B population of
351,000 in 2002 and 306,000 in 2003, with a minimum (from table 3, panel A, row 15) of 191,000 in
2001, 180,000 in 2002, and 160,000 in 2003. Meanwhile, a maximum of 415,000 and 350,000
foreigners may have worked in computer-related occupations in 2002 and 2003, respectively.
The population of high-skilled foreigners on H-1B visas in the United States is thus
substantial, regardless of the estimation technique. But when estimating the impact of this population
on the US economy, especially on US workers, data must be used with care. The total population of
H-1B recipients is of direct relevance only if one assumes that a 1:1 (or closer) relationship constantly
exists between the number of aliens in employment in the United States and the number of
unemployed US citizens and permanent residents—i.e., all foreigners on H-1B visas are continuously
replacing “a US worker.”
If instead one wishes to gauge the impact of H-1B recipients on the hiring of US workers at
a point in time, it would be more appropriate to use data for H-1B petitions approved for initial
employment, as only these aliens will be competing with out-of-job Americans for new jobs. H-1B
recipients with successful H-1B petitions for continued employment—i.e., aliens already in
employment in the United States—do not directly compete in the “new hiring” market. This is
particularly so as the opportunities for “job switching” by employed H-1B recipients are limited (see
below). As such, the relevant numbers of successful H-1B petitions for initial employment are found
in row 3 of panel A in table 3. It should be emphasized that these are the maximum possible
numbers of relevant H-1B petitions.
Further, the data in table 3 are all gross numbers—i.e., they indicate only those aliens with
successful H-1B petitions. As such, each alien with a successful petition may be viewed as one “filling
a vacancy inside the United States.” These numbers, however, do not include any information about
H-1B visaholders who lose their jobs and then leave the United States. Therefore, these data are not
“net H-1B employment data.” This is an extremely important distinction to make when considering
what to compare table 3 data with.
Most dynamic US labor-market analysis is carried out using changes in net employment as
measured in the Bureau of Labor Statistics (BLS) Current Employment Statistics (CES) and Current
Population Survey (CPS) programs.29 However, comparing changes in “net employment” with the
28 More sophisticated estimates can be made, adjusting these population numbers for deaths, emigration from the United States, and transfers to permanent US residence, among others. See, for instance, Lowell (2000). However, introducing such additional assumptions in the estimations is both beyond the scope of this working paper and unlikely to materially alter the results. 29 See www.bls.gov/ces/home.htm and www.bls.gov/cps/home.htm for more information on these programs.

14
gross number for successful H-1B petitions for initial employment (i.e., a proxy for vacancies filled
by foreigners) is erroneous.30 Instead, the number of successful H-1B petitions for initial
employment ought to be compared with the gross job gains (i.e., total vacancies filled) in the relevant
period and category.
Such comparisons, however, face terminal data problems, as data on US gross job gains are
extremely limited. The BLS Business Employment Dynamics program31 currently collects data on
gross job gains and losses on a quarterly basis for the entire US private nonfarm economy and a
limited number of large economic sectors.32 BLS staff Pinkston and Spletzer (2004) have made
limited calculations of the number of annual gross job gains and losses.33
But to make valid “apples-to-apples” comparisons between data on successful H-1B
petitions and gross job gains, detailed gross job gain data for only high-skilled jobs are required, as H-
1B visas by definition are given only to applicants with a bachelor’s or higher degree.34 For instance,
if one were to take the ratio of the number of all successful H-1B petitions for initial employment
and the total number of gross job gains in the US economy, the result would be vastly understated
and invariably show a very limited share of new jobs snapped up by H-1B recipients. This would be
because the very large number of gross new low-skilled jobs created in the US economy would very
substantially “inflate the ratio denominator”—i.e., the total number of gross job openings.
Currently, data on gross job gains for only high-skilled jobs (or high-skilled by occupation)
do not exist in the United States. Therefore, such attempts to accurately gauge the direct impact of
H-1B recipients on hiring of US workers are not possible.
In the presence of such severe data limitations, it is nonetheless pertinent to point to the
best approximation of the number of “imported high-skilled foreigners” in the US labor market. This
number is found in panel A, row 4 of table 3, which shows the number of successful H-1B visa
petitions approved to foreigners for initial employment who were outside the United States at the
30 See, for instance, Department of Commerce, Digital Economy (2000), p. 51, for such an incorrect comparison of gross data with net changes in employment. Comparing the number of approved H-1B visa petitions in IT occupations in 1999 with the change in net high-skilled employment yields the grossly inflated result that H-1B recipients took up 28 percent of all new IT occupation jobs. The fact that this comparison is based on all H-1B petitions, rather than just the petitions approved for initial employment, further inflates this result. 31 See www.bls.gov/bdm/home.htm for additional information. 32 These sectors are “Total Private Sector,” “Goods Producing,” “Natural Resource and Mining,” “Construction,” “Manufacturing,” “Service Providing,” “Whole Sale Trade,” “Retail Trade,” “Transportation and Warehousing,” “Utilities,” “Information,” “Financial Activities,” “Professional and Business Services,” “Education and Health Services,” “Leisure and Hospitality Services,” and “Other Services.” 33 It is important to realize that, unlike with net employment growth data, one cannot simply annualize quarterly gross flow data to get annual data by summation. Gross annual data look at the gross number of jobs gained over the year, while quarterly data examine gross jobs gained during the year. See Pinkston and Spletzer (2004). 34 Long work experience may also qualify applicants without a bachelor’s degree or higher. As such, in 2003, 1.6 percent of all approved petitions were from applicants with less than a bachelor’s degree (USCIS 2004, table 7).
15
time of the petition. These data intuitively correspond to the concept of “imported skills” as “the
bringing into the United States of an alien to fill a new position.”35
It is clear that the extent of such importing of skills during the boom years from 1999 to
2001 was not negligible. During the last three years of the economic boom, US-located companies
brought in about 270,000 highly skilled workers from abroad to fill newly created US jobs. However,
as the job prospects in the US labor market deteriorated dramatically after 2001, the number of
imported aliens declined considerably, reflecting the cyclicality described above.
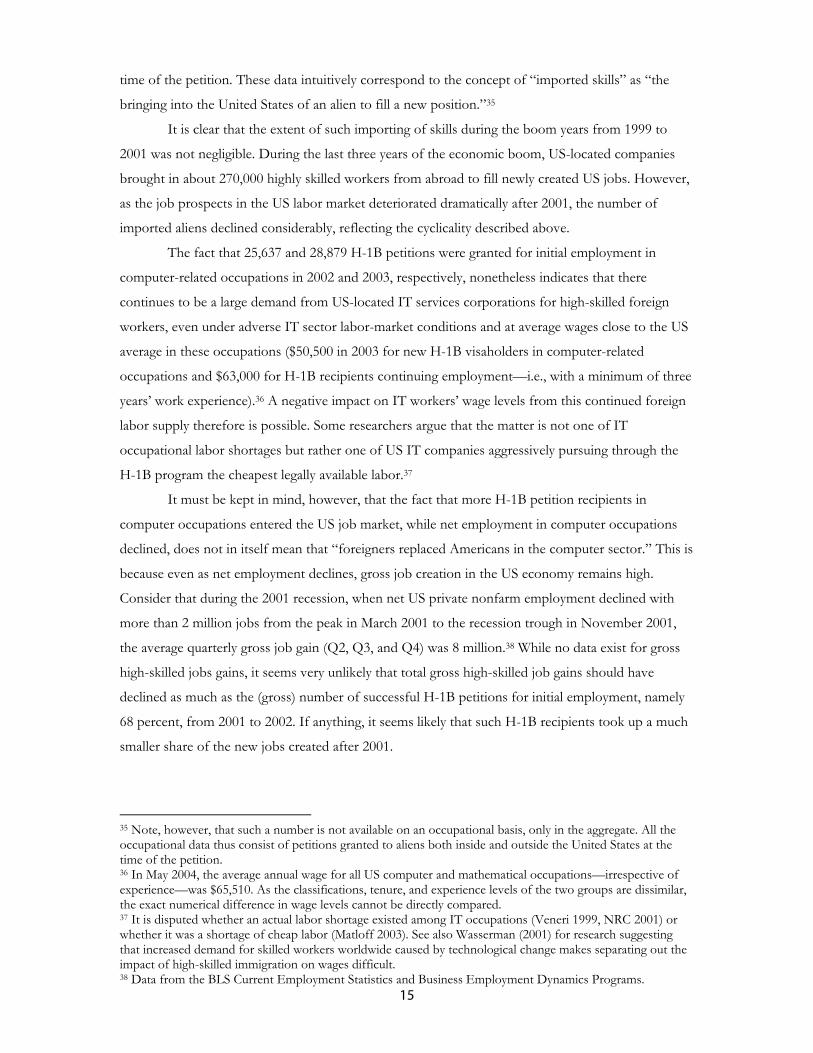
The fact that 25,637 and 28,879 H-1B petitions were granted for initial employment in
computer-related occupations in 2002 and 2003, respectively, nonetheless indicates that there
continues to be a large demand from US-located IT services corporations for high-skilled foreign
workers, even under adverse IT sector labor-market conditions and at average wages close to the US
average in these occupations ($50,500 in 2003 for new H-1B visaholders in computer-related
occupations and $63,000 for H-1B recipients continuing employment—i.e., with a minimum of three
years’ work experience).36 A negative impact on IT workers’ wage levels from this continued foreign
labor supply therefore is possible. Some researchers argue that the matter is not one of IT
occupational labor shortages but rather one of US IT companies aggressively pursuing through the
H-1B program the cheapest legally available labor.37
It must be kept in mind, however, that the fact that more H-1B petition recipients in
computer occupations entered the US job market, while net employment in computer occupations
declined, does not in itself mean that “foreigners replaced Americans in the computer sector.” This is
because even as net employment declines, gross job creation in the US economy remains high.
Consider that during the 2001 recession, when net US private nonfarm employment declined with
more than 2 million jobs from the peak in March 2001 to the recession trough in November 2001,
the average quarterly gross job gain (Q2, Q3, and Q4) was 8 million.38 While no data exist for gross
high-skilled jobs gains, it seems very unlikely that total gross high-skilled job gains should have
declined as much as the (gross) number of successful H-1B petitions for initial employment, namely
68 percent, from 2001 to 2002. If anything, it seems likely that such H-1B recipients took up a much
smaller share of the new jobs created after 2001.
35 Note, however, that such a number is not available on an occupational basis, only in the aggregate. All the occupational data thus consist of petitions granted to aliens both inside and outside the United States at the time of the petition. 36 In May 2004, the average annual wage for all US computer and mathematical occupations—irrespective of experience—was $65,510. As the classifications, tenure, and experience levels of the two groups are dissimilar, the exact numerical difference in wage levels cannot be directly compared. 37 It is disputed whether an actual labor shortage existed among IT occupations (Veneri 1999, NRC 2001) or whether it was a shortage of cheap labor (Matloff 2003). See also Wasserman (2001) for research suggesting that increased demand for skilled workers worldwide caused by technological change makes separating out the impact of high-skilled immigration on wages difficult. 38 Data from the BLS Current Employment Statistics and Business Employment Dynamics Programs.

16
All told, the visa data clearly indicate that “skills import” by US-located IT services and
hardware companies of foreign—largely Indian—computer-related H-1B visaholders was substantial
in the years of rapid economic growth in the sector and hence underpinned sectoral nonwage
inflationary growth. The data show a very large decline after 2001 in the number of new visa
petitions approved (and visas issued) for aliens seeking initial employment, particularly from India, in
the IT services sector. As such, the data point toward a much diminished aggregate impact on the US
labor market of H-1B visas after 2001. This strongly cyclical nature of import of IT workers to the
United States is also found in other developed economies, such as Canada and France, where data
are available.39
III. WHO HIRES H-1B VISAHOLDERS AND AT WHAT WAGES?
It is obvious that due to the vast differences in the average wage levels between the United States and
countries such as India, many highly skilled Indian IT workers would be willing to work in the
United States at wages less than the prevailing US wage, as even a fraction of the prevailing US wage
would allow them to well support a family in India. It is equally obvious that IT companies located in
the United States would have a direct interest in hiring such highly skilled workers at such lower
wages.
In order to avoid such downward wage pressure from H-1B visaholders, US law contains a
number of specific rules about what H-1B visaholders must be paid: H-1B recipients must be paid
either 1) the actual wage—i.e., the wage rate paid by the employer to all other individuals with similar
experience, qualifications, education, job responsibilities and function, specialized knowledge, and
other legitimate business factors for the specific employment in question, or 2) in the absence of
similar US workers at the workplace of the H-1B recipient, the prevailing wage for the occupational
classification in the area of intended employment.40
Several sources may be consulted to find the correct prevailing wage for a given H-1B visa
petition. A request for a prevailing wage determination may be filed with the local State Employment
Security Agency (SESA) or the Bureau of Labor Statistics Occupational Employment Statistics;41 the
federal government online wage determination42 may be consulted, as may other independent
authoritative sources, such as private compensation surveys from companies like Watson Wyatt,43 the
Economic Research Institute,44 and the American Society of Employers.45
39 See OECD Information Technology Outlook 2004, 242–44. 40 See http://workforcesecurity.doleta.gov/foreign/wages.asp for additional information. 41 See www.bls.gov/oes/home.htm. 42 See www.wdol.gov/sca.aspx#0. 43 See www.watsonwyatt.com/. 44 See www.erieri.com/. 45 See www.aseonline.org/Home.HTML.

17
The employer is responsible for the truthfulness of the information provided in the H-1B
petition. That the employer has several sources to choose the prevailing wage from raises the issue of
whether employers choose the one that provides the lowest estimate. Therefore, it is incumbent
upon the Department of Labor to determine whether a given source is acceptable and to deny the
foreign labor certification if the provided prevailing wage information is deemed nonauthoritative.
Third parties may launch a complaint with the Department of Labor alleging inaccuracy of the
provided prevailing wage information in individual petitions.
A SESA prevailing wage determination cannot be challenged, nor does it seem probable that
a prevailing wage that is in accordance with wage sources provided by the Department of Labor itself
can be so successfully challenged. The majority of H-1B petitions use official prevailing wage data
from these sources (figures 2 to 21), so it seems unlikely that employers are systematically depressing
wages by providing inaccurate data on prevailing wages.
On the other hand, federal law CFR 665.731 (d) (4)46 explicitly states that “[N]o prevailing
wage violation will be found if the employer paid a wage that is equal to, or more than 95 percent of,
the prevailing wage….” Therefore, it is essentially legal for US employers to pay H-1B recipients 5
percent less than the prevailing wage, which, not surprisingly, is the lower range for wages offered to
H-1B recipients. If US employers are found by the Department of Labor to pay their H-1B
workforce less than 95 percent of the prevailing wage, they will be required to pay them the full 100
percent. In other words, companies face no real financial penalty for paying their foreign high-skilled
workers up to 5 percent less than the prevailing wage.
Furthermore, it is the employer that applies for the H-1B on behalf of a foreign worker.
Therefore, the opportunities for “job-hopping” in search of better wages elsewhere in the United
States are limited for the alien, as he or she has to find another employer to file the H-1B petition.47
This might give employers some scope for further downward wage pressure, despite what their LCA
filing may state. The fact that an H-1B petition costs an employer a minimum of $1,435 likely adds to
the sway that employers have over H-1B recipients.48 Therefore, the official filing data from the FLC
database should not be viewed as definitive data, rather as the best aggregate data available.49
An interesting question is, who are the US companies that hire aliens on H-1B visas? Two
detailed data sources reveal the US-located companies that apply for permits to employ H-1B
46 Available at www.dol.gov/dol/allcfr/ETA/Title_20/Part_655/20CFR655.731.htm. 47 If the H-1B visaholder loses his or her job in the United States, he or she has only a very limited period in which to find a new sponsor. The exact period varies (generally measured in weeks) depending on the country of citizenship of the H-1B visaholder. 48 The fee depends on the size of the company. For example, for a company with more than 26 employees, the fee is $2,085. On the other hand, employers may on each petition file for multiple employees, which will reduce the average costs per individual H-1B recipient substantially. See “USCIS Announces New H-1B Procedures for FY 2005 and FY 2006,” USCIS press release, May 4, 2005. 49 This is particularly so, as the GAO (2000, 2003) found statistically significant lower wages among H-1B recipients than similar US citizens doing the same jobs. The GAO also found that the Department of Labor’s investigative authority is in reality limited by resources and the requirement for a third party to launch a complaint, which may prevent comprehensive checks from being carried out.

18
visaholders. In 2000, the then INS published a list of the leading US employers of H-1B visaholders
between October 1999 and February 2000 (INS 2000b). And secondly the Department of Labor
maintains an online database of all the US companies that file LCAs petitions for employing foreign
workers on H-1B visas.50 At the time of writing, this database held information on H-1B LCA
petitions filed (both approved and rejected applications) in fiscal years 2002, 2003, 2004, and early
2005.
However, it is crucial to realize that an LCA filing by an employer does not mean that an H-
1B petition will automatically be approved by the USCIS. The FLC department explicitly states that a
one-to-one relationship does not exist between the number of approved LCA filings and the number
of H-1B petitions ultimately approved. The number of LCAs the Department of Labor typically
certifies is more than three times the number of H-1B visa petitions the USCIS approves.51 Because
of such large discrepancies at the aggregate level, one cannot relate the number of certified LCAs a
company has (from the FLC database) with the number of H-1B visaholders it actually employs.
Table 4 uses the special data on H-1B visas actually issued directly from INS (2000b) and
not data for LCAs from the FLC database.
The vast majority of big employers of H-1B in late 1999 and early 2000 were household US
corporate names in the IT industry, such as Motorola, Oracle, Cisco, Intel, and Microsoft. The US
financial industry and major educational institutions were also well represented. Only seven of the
top 100 (not all 100 are shown in table 4) US-located employers were Indian IT services companies.
Several companies, both Indian and US, as stated in their filings with the Securities and
Exchange Commission (SEC), rely very heavily on foreign H-1B (and L-1) visaholders in their US
work force in 2003.52 This could be an indication that some companies’ primary model for US-
located business is bringing in foreign (probably mostly Indian) IT workers to carry out the tasks.
50 This Department of Labor database is available at http://archive.flcdatacenter.com/casesearch.asp. Currently, only data on H-1B E-Filings—i.e., applications filed by the employer at the Department of Labor’s FLC online filing site at www.lca.doleta.gov—are available for fiscal years 2002, 2003, and 2004. Employers may also choose to file through the H-1B-fax filing system, for which data only for 2004 are available. According to the Department of Labor, in fiscal 2004, approximately 90 percent of employers filed using the H-1B-E-File system. 51 See www.flcdatacenter.com/CaseData.aspx. 52 The fact that no data are available for most of the companies in table 4 does in no way mean that the average for those companies for which data are available is the average for all companies. The companies for which data are available generally provide these data in the SEC filings, as part of their general description of their business model and risks associated with it. This probably means that companies provide information about the number of H-1B/L-1 visaholders in their US workforce only if the number is so big that it is important to their business model. In other words, the fact that no data are available for most companies—for instance, #1 ranked Motorola—likely means that for these companies, the share of H-1B/L-1 visaholders is very low. This, however, does not apply to those Indian companies for which no data are available. In their case, the lack of data is because they are privately held companies that do not submit filings to the SEC or similar entities. As these companies directly compete with public Indian companies, the average number of H-1B/L-1 visaholders in these companies is likely to be similar to that in Indian companies for which data are available.

19
US immigration legislation regulating the H-1B visa program has already attempted to address the
issue of using an “exclusively H-1B visa recipient workforce.” Legislation covering H-1B visas (CFR
655.736) defines “H-1B-dependent employers” and “willful violators.”53
An “H-1B-dependent employer” is defined as one that either
1. had fewer than 25 full-time equivalent employees54 employed in the United States and
employed more than seven H-1B nonimmigrants;
2. had at least 26, but not more than 50, full-time equivalent employees in the United States
and employed more than 12 H-1B nonimmigrants; or
3. had at least 51 full-time equivalent employees employed in the United States and employed
H-1B nonimmigrants in a number that was equal to at least 15 percent of the number of
such full-time equivalent employees.
A “willful violator” is defined as an employer that either
1. violated Department of Labor proceedings under section 212(n)(2) of the Act (8 U.S.C.
1182(n)(2)(C) or Department of Justice proceedings under section 212(n)(5) of the Act (8
U.S.C. 1182(n)(5) or
2. committed either a willful failure or a misrepresentation of a material fact during the five-
year period preceding the LCA and this has been made public on or after October 21, 1998.
US-located employers that are “H-1B-dependent employers” or “willful violators” are
subject to two additional attestation obligations that other US employers seeking to employ H-1B
visa recipients are not. First, they are prohibited from hiring any H-1B recipients (see below for
description of an exempt group) if it leads to the displacement55 of any US worker(s), either directly
(i.e., in its own workforce) or indirectly (at a worksite of a second employer).56 Second, such
employers are required to take good faith steps to recruit US workers in the United States for the US
jobs for which H-1B visas are being sought. Such measures must entail procedures that meet
53 Available at www.dol.gov/dol/allcfr/ETA/Title_20/Part_655/20CFR655.736.htm 54 Excluding bona fide consultants or independent contractors but including all persons who are consistently treated as “employees” by the employer for all purposes including FICA, FLSA, etc. 55 Displacement has two components: One, it entails a US worker being “laid off,” i.e., a US worker loses his or her job for reasons other than discharge due to inadequate performance, violation of workforce rules, or other causes related to the worker’s performance or behavior at the job. Two, it entails that the H-1B worker takes over an “essentially equivalent job” previously held by a US worker, as determined by job responsibilities, qualifications, and experience of the workers and area of employment. 56 See CFR 655.738 at www.dol.gov/dol/allcfr/ETA/Title_20/Part_655/20CFR655.738.htm for further details.

20
industrywide standards and offer the prevailing compensation—at least as much as the compensation
to be paid to the H-1B recipient.57
In other words, the several Indian (and similar US) companies that, according to their SEC
filings, employed a large number of H-1B recipients, thus yielding workplace ratios far in excess of
the thresholds listed above (15 percent of the total workforce, given the size of the operations of
these Indian and US companies), will qualify as “H-1B dependent employers” and subsequently be
unable to hire H-1B recipients who directly replace US workers.
On the face of it, therefore, the frequently mentioned stories of US workers in IT companies
being “forced to train their replacements (frequently Indian) and thereafter fired”58 would be against
US legislation, and such companies could be pursued legally. Therefore, prevention of such
“instances of abuse” is entirely a matter of enforcing existing US legislation, rather than a broader
issue for the H-1B visa program.
However, certain H-1B visa recipients are exempt from these regulations, and their hiring
even by “H-1B dependent employers” and “willful violators” does not require that these US-located
companies adhere to the additional attestation obligations laid out above. This group of H-1B
recipients consists of those who either;59
1. are receiving a wage at an annual rate of $60,000, including cash bonuses and similar
compensation but excluding benefits such as health insurance, life insurance, and pension
plans60 or
2. have attained a master’s degree or higher (or its equivalent) in a specialty related to the
intended employment.61
This means that it is indeed possible to start a business in the United States and staff it entirely
with H-1B visa recipients or replace entirely an existing company’s US workforce with H-1B visa
recipients, provided that these workers are paid more than $60,000 per annum or all have relevant
master’s or higher degrees. As such, the only particular constraints facing such a business model,
57 See CFR 655.739 at www.dol.gov/dol/allcfr/ETA/Title_20/Part_655/20CFR655.739.htm for further details. 58 One of the best places to find such press anecdotes is the news section of the Washington Alliance of Technology Workers (Washtech) at www.washtech.org/news/. 59 See CFR 665.737 at www.dol.gov/dol/allcfr/ETA/Title_20/Part_655/20CFR655.737.htm for further details. 60 The H-1B recipient is required to receive at least $60,000 per annum, and the required salary cannot be decreased or prorated if the H-1B recipient has a part-time schedule. 61 The master’s or higher degree must be from an institution that is accredited or recognized under the law of the country where the degree was obtained and equivalent to a master’s or higher degree issued by a US academic institution. An academic degree cannot be substituted with experience or demonstration of expertise in the academic specialty (i.e., no “time equivalency” or “performance equivalency” will be recognized as substituting for a degree issued by an academic institution). Relevant US authorities—the USCIS and the Department of Labor—are solely responsible for consulting appropriate sources of expertise in determining the equivalency between a foreign and a US academic degree.

21
which seems to be present in the US IT services sector (table 4), in terms of acquiring H-1B visas are
the salary floor of $60,000 per annum, where none exist for other employers of H-1B visa recipients,
and the requirement for a master’s degree or higher, where a bachelor’s degree will suffice for all
other H-1B visa recipients.62
Figures 2 to 21 plot by company the wage offered (on the y-axis) to each individual H-1B
visa recipient, as well as the prevailing wage (on the x-axis) for the occupation in question. The
figures also note the share of applications with prevailing wage from a US government source. The
source of these data is the US Department of Labor’s FLC database, which contains information on
all LCA applications sent in by individual companies or other entities. The dots in the figures
correspond to individual LCA filings and not to approved H-1B petitions and have no direct relation
to the number of H-1B visaholders each company in reality hires.
Figures 2 to 7 list LCA filings for fiscal 2004 for six of the most well-known Indian IT
services companies in the United States (also found in table 4); figures 8 to 14 list the same for those
US IT companies that were included in the BusinessWeek 2004 Info Tech 100, with revenues above
$20 billion; and figures 15 to 21 list fiscal 2004 LCA filings for a select number of other US
businesses and organizations. All figures are constructed such that, if a dot is above the diagonal line,
it indicates that the H-1B visa recipient is offered a wage above the prevailing wage; if it is below the
diagonal, the wage offered is below the prevailing wage. Only data for fiscal 2004 are presented, as
this is the only period for which data for all—i.e., both online and fax-based—LCA filings are
available. All wages are expressed in annual terms.
Figures 2 to 7, which show individual LCA filings of six of the biggest Indian IT services
companies with operations in the United States—Tata, Infosys, Wipro, Satyam, Birla, and Ramsoft—
clearly reveal several characteristics. First, all these companies are palpable “H-1B dependent
employers” but have a substantial range in the wages they offer their prospective H-1B recipients.
With many prospective employees offered wages below $60,000 a year, it can be concluded that in
order to legally be in the United States, all workers in this group must possess a master’s degree or
higher in a specialty related to the occupation in question. In other words, this is genuinely a group of
companies that seeks to hire very highly skilled foreign workers to work in the United States. It
cannot be discerned with certainty whether these H-1B recipients are inside or outside the United
States when the company applies for the H1-B visa, but it seems likely that the vast majority of these
workers are hired directly in India—i.e., “imported to work in the companies’ US operations.”
Second, many of these H-1B visa recipients are paid very close to 95 percent of the
prevailing wage. While in full accordance with US labor-market regulation, these wages strictly
speaking, undercut those of similar US workers by the legal 5 percent. Hence, it seems readily
justified when this group of companies is accused of suppressing the wages of US high-skilled IT
62 See http://uscis.gov/graphics/services/tempbenefits/ecrd.htm#anchorH-1B for the general documentation requirements for H-1B visa recipients.

22
workers, in addition to the downward pressure on wages applied by the additional relevant labor
supply. But since this group of Indian companies (and their direct US competitors—see, for instance,
Cognizant Technology Solutions in figure 20) are operating in accordance with all US labor-market
laws, it is not justified to accuse them of systematic “abuse” of the H-1B program. Third, it should be
noted that many of the H-1B visa recipients hired by this group are indeed offered wages
significantly above relevant US prevailing wages, indicating that these workers possess additional
relevant skills that companies must (and are willing to) compensate them for.
A similar temporary visa program in Germany, where up to 20,000 “IT green cards” were
available to IT specialists from August 2000 to August 2004, was a failure, as it could not attract
20,000 applicants.63 This indicates the strong cyclical downturn in the German economy but also that
the US labor market continues to be a huge draw, relative to other developed economies, for high-
skilled IT labor.
It is clear from figures 8 to 14, which show LCA filings for the leading US IT companies,
that the practice of offering many H-1B visa recipients only 95 percent of the US prevailing wage in
fiscal 2004 is not just among Indian (or similar US) IT services companies but also among such US
IT industry household names as IBM, HP, Intel, Motorola, Microsoft, Dell, and Cisco. That such
legal wage-cost cutting is also occurring among US IT industry leaders should probably not be
surprising, given the intense competitive pressures in this industry. However, it is also clear that
relative to the Indian IT services companies, many more H-1B recipients to be possibly employed at
major US IT companies are offered wages significantly above the US prevailing wage. This is likely
an indication both of the more diverse operations of the bigger US companies and of the H-1B
system continuing to be an oft-used way for these companies to access highly skilled and experienced
alien workers more broadly.
Assuming that what was found above—i.e., that a very large group of these workers are
indeed of Indian origin and brought to the US from here and hence, at the US prevailing wage, can
be expected to earn significantly above what would be possible in India—concerns the entire cohort,
several issues must be addressed.
Considering that it is illegal for H-1B visa recipients to obtain employment at any other US
employer other than the sponsoring one, the fact that so many of them are offered wages
significantly above the legal minimum of 95 percent of the prevailing wage, indicates that for this
group of US and Indian IT services companies, “worker turnover” may nonetheless be an important
issue. Why else would wages significantly above the legally mandated 95 percent of the US prevailing
wages be offered to people who cannot look for work elsewhere in the United States?
63 Only 17,177 “IT green cards” were issued by the German authorities during the four-year period, and of these, only 12,406 had very long-term work and residency permits of three months or more. About a quarter of the visa recipients were Indian, with between 500 to 900 each from Romania, Russia, Poland, and China. See “Information Und Kommunikation In Aktuellen Zahlen,” Statistische Bundesamt, October 5, at www.destatis.de/presse/deutsch/pm2004/p4220024.htm (accessed May 16, 2005).

23
The answer probably has two aspects: First, it is possible that competing US IT services
companies can poach individual H-1B visa recipients from one another, only that each time they
have to go through the rather cumbersome and costly H-1B application process.64 Hence, in a
competitive industry, the very best H-1B visa recipients possessing the most genuinely sought after
skills can negotiate a wage premium by requiring different US IT services firms to “outbid” each
other. Second, with employment opportunities in countries like India expanding, the very best Indian
IT workers will demand substantially above US prevailing wages to be lured to work in the United
States, even though US prevailing wages in IT are substantially more than wages at home. Hence, this
wage premium offered to many H-1B visa recipients in the IT services sector might be an early
indication that a truly global market for the very best IT talent has already emerged.
Figures 15 to 21 underline the broader importance of the H-1B visa program. They show
how some of the leading US financial and industrial companies (GE and Goldman Sachs),
universities (Harvard, MIT, and Los Alamos National Laboratory), and healthcare providers (Kaiser
Foundation Hospitals) are also frequent users. In these non-IT industries, the wage offered to H-1B
recipients generally is likely to be far more in excess of the US prevailing wage than seems prevalent
in the IT industry. This, in extension of the paragraph above, indicates that many H-1B visa
recipients hired by these organizations possess valuable skills in excess of those required to be eligible
for an H-1B visa. As such, it seems that these organizations are already engaged in the broader global
hunt for the very best employees, which is also evident in the IT services industry.
Finally, as the vast majority of the LCA filings by the companies/institutions in figures 2 to
21 provide prevailing wages from official US sources, there does not seem to be any problem with
US employers speculating in using the “lowest prevailing wage source.”
In summary, it is clear that in the IT sector Indian and similar US “outsourcing-type IT
services providers” are utilizing US labor-market legislation to the limit to push for competitive labor
cost advantages, frequently resulting in a 5 percent legal undercutting of US prevailing wages by H-
1B visa recipients. Thus, there seems to be reason to believe that limited downward wage pressure
exists from the H-1B program in particular IT services, in addition to the wage-moderating effects of
the additional foreign supply of such high-skilled workers. On the other hand, many H-1B recipients,
employed both in the IT services sector and other economic sectors, receive wages substantially
above the prevailing US wage. This premium indicates that this group is indeed bringing highly
sought after skills and experience into the US labor market, well above what is required for visa
eligibility.
64 This “visa portability” for H-1B visaholders—the ability to change employers during their stay once the new employer files successfully for a new H-1B petition on their behalf—was instituted by Congress only in 2001. See GAO (2003, 9).

24
IV. CONCLUDING REMARKS
This working paper presents as detailed a picture as possible of the extent of imports of high-skilled
foreign labor on H-1B and L-1 visas to the United States. The number of such foreign workers in
both categories substantially increased until 2001 but declined sharply in subsequent years. The two
visa programs have been found to be very responsive to cyclical developments in the US economy,
particularly with respect to new visa petitions for initial employment in computer-related occupations
and for Indian nationals, where large declines have occurred.
Due to scarce data, one can estimate only a wide range for the total H-1B population—
roughly between 400,000 and 750,000 in 2002 and 2003. Due to the gross, not net, nature of data on
H-1B petitions and visas, and the dearth of similar aggregate gross job gains data for high-skilled
workers, currently available data do not allow for systematic investigation of the impact of foreign
workers on the hiring prospects of US workers. However, it is possible that the substantial H-1B
population in the United States may adversely affect US wages in some, particularly computer-
related, occupations.
H-1B visaholders are a very important source of labor for several Indian and US IT services
companies. No evidence of systematic abuse of the H-1B visa programs by these companies exists in
the official data examined, although such “offshoring/outsourcing type IT services providers”
aggressively pursue all legally available paths to cut labor costs, including paying foreign workers only
the legally mandated 95 percent of the prevailing wage.
Large US IT, financial, and manufacturing-sector companies, as well as leading educational
institutions, continuously demand H-1B visaholders. These institutions frequently offer their foreign
H-1B recipients wages substantially above the prevailing US wage, indicating that such workers
continue to bring to the US economy highly sought-after skills that command a substantial wage
premium in the labor market.
The highly cyclical character of both the H-1B and L-1 visa programs, which led to
significant imports of foreign high-skilled labor during the economic boom but much less
subsequently, combined with continued heavy use of the programs by leading companies in the
United States, leads to the aggregate conclusion that the programs do exactly what they were meant
to do in the 1998 American Competitiveness and Workforce Improvement Act, namely improve the
US workforce and US competitiveness. Reductions in the programs could therefore lead to an
unnecessary decline in the competitiveness of US companies and the US economy as a whole.
If global US companies face more legislative obstacles to employing highly skilled and
competitively priced taxpaying people in the United States at US wage levels, they will continue to get
better opportunities to send the work overseas, thanks to declining trade barriers, technology, and
improving skill levels across the world. Therefore, instead of attempting to “close the US borders” to
foreign high-skilled workers, policymakers should focus on domestic initiatives to improve education

25
and skills of adversely affected US workers and on enforcement of existing labor regulations.
Improving domestic institutions remains critical to alleviating the negative effects of globalization on
the US economy.
REFERENCES Assil, Reem. 2004. The US H-1B Visa Program, North American Alliance for Fair Employment (November). Available at www.fairjobs.org (accessed on August 6, 2005). GAO (General Accounting Office). 1998. Information Technology: Assessment of the Department of Commerce’s Report on Workforce Demand and Supply. GAO/HEHS-98-106R. Washington. GAO (General Accounting Office). 2000. H-1B Foreign Workers: Better Controls Needed to Help Employers and Protect Workers. GAO/HEHS-00-157. Washington. GAO (General Accounting Office). 2003. H-1B Foreign Workers: Better Tracking Needed to Help Determine H-1B Program’s Effects on US Workforce. GAO-03-883. Washington. Government of India. 2002. Proposed Liberalization of Movement of Professionals Under General Agreement of Trade in Services (GATS). Available at the World Trade Organization’s Web site at www.wto.org/english/tratop_e/serv_e/s_propnewnegs_e.htm#movement (accessed on August 3, 2005). Lowell, Lindsay B. 2000. H-1B Temporary Workers: Estimating the Population. Washington: Institute for the Study of International Migration, Georgetown University. Lowell, Lindsay B., and Bryan Christian. 2000. Employers of Foreign Temporary (H-1Bs) in Information Technology. Washington: Institute for the Study of International Migration, Georgetown University. Mann, Catherine, assisted by Jacob F. Kirkegaard. 2006 (forthcoming). Accelerating the Globalization of America: Information Technology. Washington: Institute for International Economics. Matloff, Norman. 2003. On the Need For Reform of the H-1B Non-Immigrant Work Visa in Computer-Related Occupations. University of Michigan Journal of Law Reform 36, no. 4 (summer): 1–99. National Research Council. 2001. Building a Workforce for the Information Economy. Washington: National Academies Press. OECD (Organization for Economic Cooperation and Development). 2004. Trends in International Migration 2004. Paris. Pinkston, Joshua P., and James R. Spletzer. 2004. Annual Measures of Gross Job Gains and Gross Job Losses. Monthly Labor Review (November): 3–13. Washington: Department of Labor. Statistische Bundesamt. 2004. Information Und Kommunikation In Aktuellen Zahlen. www.destatis.de/presse/deutsch/pm2004/p4220024.htm (accessed on May 16, 2005). Department of Commerce, Economics and Statistics Administration. 2000. Digital Economy 2000. Washington. INS (US Immigration and Naturalization Service). 2000a., Characteristics of Specialty Occupation Workers (H-1B): May 1998 to July 1999. Washington.

26
INS (US Immigration and Naturalization Service). 2000b. Leading Employers of Specialty Occupation Workers (H-1B): October 1999 to February 2000. Washington. INS (US Immigration and Naturalization Service). 2002a. Characteristics of Specialty Occupation Workers (H-1B): Fiscal Year 2000. Washington. INS (US Immigration and Naturalization Service). 2002b. Characteristics of Specialty Occupation Workers (H-1B): Fiscal Year 2001. Washington. USCIS (US Citizen and Immigration Services). 2003. Characteristics of Specialty Occupation Workers (H-1B): Fiscal Year 2002. Washington: Department of Homeland Security. USCIS (US Citizen and Immigration Services). 2004. Characteristics of Specialty Occupation Workers (H-1B): Fiscal Year 2003. Washington: Department of Homeland Security. USCIS (US Citizen and Immigration Services). 2005. Allocation of Additional H-1B Visas Created by the H-1B Reform Act of 2004. Federal Register 20, no. 86 (May 5). Washington: Department of Homeland Security. Department of Labor, Office of Inspector General Office of Audit. 1996. The Department of Labor's Foreign Labor Certification Programs: The System Is Broken and Needs To Be Fixed. Washington. Department of State. 2002. Report of the Visa Office 2000. Washington. Department of State. 2003. Report of the Visa Office 2001. Washington. Department of State. 2004. Report of the Visa Office 2002. Washington. Veneri, Carolyn M. 1999. Can Occupational Labor Shortages be Identified Using Available Data? Monthly Labor Review (March): 15–21. Washington: Department of Labor. Wasem, Ruth Ellen. 2004. Immigration Policy for Intercompany Transfers (L Visa): Issues and Legislation. Washington: Congressional Research Service. Wasserman, Miriam. 2001. EllisIsland.com? Federal Reserve Bank of Boston Regional Review (Quarter 1). Boston. Wipro Ltd. 2004. 20-F Filing with the US Securities and Exchange Commission. Available at the SEC Web site at www.sec.gov/edgar/searchedgar/companysearch.html (accessed on August 3, 2005).

Table 1 L-1 visa issuance and admittance, 1990–2004
Year Number of individuals in L-1 status admitted
Number of L-1 visas issued
Issuance as a share of admittances
1990 63,180 14,342 23% 1991 70,505 16,109 23% 1992 75,315 17,345 23% 1993 82,606 20,369 25% 1994 98,189 22,666 23% 1995 112,124 29,088 26% 1996 140,457 32,098 23% 1997 n.a. 36,589 n.a. 1998 203,255 38,307 19% 1999 234,443 41,739 18% 2000 294,658 54,963 19% 2001 328,480 59,384 18% 2002 313,699 57,721 18% 2003 298,054 57,245 19% 2004 314,484 62,700(p) 20%(p)
n.a. = not available (p) = provisional Source: USCIS and US State Department. L-1 visa issuance data provided by Julie Furuta-Toy, director of the Office of Public and Diplomatic Liaison, Visa Services. On file with author.
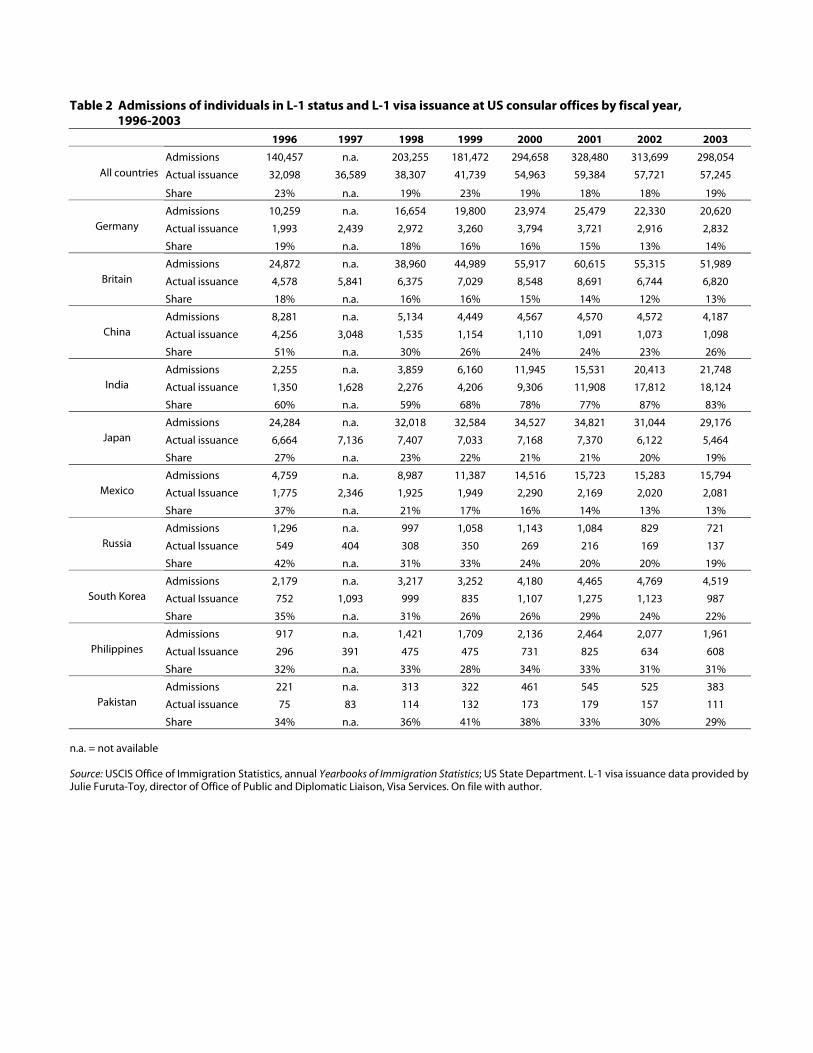
Table 2 Admissions of individuals in L-1 status and L-1 visa issuance at US consular offices by fiscal year,
1996-2003 1996 1997 1998 1999 2000 2001 2002 2003
Admissions 140,457 n.a. 203,255 181,472 294,658 328,480 313,699 298,054
Actual issuance 32,098 36,589 38,307 41,739 54,963 59,384 57,721 57,245 All countries
Share 23% n.a. 19% 23% 19% 18% 18% 19%
Admissions 10,259 n.a. 16,654 19,800 23,974 25,479 22,330 20,620
Actual issuance 1,993 2,439 2,972 3,260 3,794 3,721 2,916 2,832 Germany
Share 19% n.a. 18% 16% 16% 15% 13% 14%
Admissions 24,872 n.a. 38,960 44,989 55,917 60,615 55,315 51,989
Actual issuance 4,578 5,841 6,375 7,029 8,548 8,691 6,744 6,820 Britain
Share 18% n.a. 16% 16% 15% 14% 12% 13%
Admissions 8,281 n.a. 5,134 4,449 4,567 4,570 4,572 4,187
Actual issuance 4,256 3,048 1,535 1,154 1,110 1,091 1,073 1,098 China
Share 51% n.a. 30% 26% 24% 24% 23% 26%
Admissions 2,255 n.a. 3,859 6,160 11,945 15,531 20,413 21,748
Actual issuance 1,350 1,628 2,276 4,206 9,306 11,908 17,812 18,124 India
Share 60% n.a. 59% 68% 78% 77% 87% 83%
Admissions 24,284 n.a. 32,018 32,584 34,527 34,821 31,044 29,176
Actual issuance 6,664 7,136 7,407 7,033 7,168 7,370 6,122 5,464 Japan
Share 27% n.a. 23% 22% 21% 21% 20% 19%
Admissions 4,759 n.a. 8,987 11,387 14,516 15,723 15,283 15,794
Actual Issuance 1,775 2,346 1,925 1,949 2,290 2,169 2,020 2,081 Mexico
Share 37% n.a. 21% 17% 16% 14% 13% 13%
Admissions 1,296 n.a. 997 1,058 1,143 1,084 829 721
Actual Issuance 549 404 308 350 269 216 169 137 Russia
Share 42% n.a. 31% 33% 24% 20% 20% 19%
Admissions 2,179 n.a. 3,217 3,252 4,180 4,465 4,769 4,519
Actual Issuance 752 1,093 999 835 1,107 1,275 1,123 987 South Korea
Share 35% n.a. 31% 26% 26% 29% 24% 22%
Admissions 917 n.a. 1,421 1,709 2,136 2,464 2,077 1,961
Actual Issuance 296 391 475 475 731 825 634 608 Philippines
Share 32% n.a. 33% 28% 34% 33% 31% 31%
Admissions 221 n.a. 313 322 461 545 525 383
Actual issuance 75 83 114 132 173 179 157 111 Pakistan
Share 34% n.a. 36% 41% 38% 33% 30% 29% n.a. = not available Source: USCIS Office of Immigration Statistics, annual Yearbooks of Immigration Statistics; US State Department. L-1 visa issuance data provided by Julie Furuta-Toy, director of Office of Public and Diplomatic Liaison, Visa Services. On file with author.

Table 3 USCIS standards on successful H-1B petitions, fiscal years 1999–2003 1999 (1) 2000 2001 2002 2003 1 2 3 4 5
a. Petitions for initial employment
1 Number of times an H-1B visa holder was admitted into the US 302,326 355,605 384,191 370,490 360,498
2 Total number of H-1B petitions granted ( percent of admittances) n.a. 257,640 (72%) 331,206 (86%) 197,537 (53%) 217,340 (60%)3 Of which: Number of H-1B petitions granted for initial employment (% of total petitions granted) 134,400 (n.a.) 136,787 (53%) 201,787 (61%) 103,584 (52%) 105,314 (48%)
4
Of which: Alien was outside the US at the time of employer petition (% of total initial employment petitions granted) 81,100 (60%) 75,785 (55%)) 115,759 (57%) 36,494 (35%) 41,895 (40%)
5
Of which: Alien was inside the US at the time of employer petition (% of total initial employment petitions granted) 53,300 (40%) 61,002 (45%) 85,320 (43%) 67,090 (65%) 63,419 (60%)
6 Of which: #1 country of origin (% of total) India India India India India
63,900 (48%) 60,757 (44%) 90,668 (45%) 21,066 (20%) 29,269 (29%)
7 Of which: #2 country of origin (% of total) China China China China China
12,400 (9%) 12,333 (9%) 16,847 (8%) 11,832 (11%) 11,144 (11%)
8 Of which: #3 country of origin (% of total) UK Canada Canada Canada Canada
4,400 (3%) 5,465 (4%) 9,184 (5%) 7,893 (8%) 6,201 (6%)
9 Of which: #1 occupational group (% of total) and median earnings
n.a.
Computer-related occupations Computer-related occupations
Computer-related occupations
Computer-related occupations
74,551 (55%) 110,713 (55%) 25,637 (25%) 28,879 (27%)
$50,000 $51,600 $55,000 S$50,500
10 Of which: #2 occupational group (% of total) and median earnings
Occupations in architecture,
engineering, and surveying
Occupations in architecture,
engineering, and surveying
Occupations in architecture,
engineering, and surveying
Occupations in education
17,086 (12%) 25,365 (13%) 14,467 (14%) 15,008 (14%)
$51,480 $56,485 $52,000 $36,000
11 Of which: #3 occupational group (% of total) and median earnings
Occupations in administrative specializations
Occupations in administrative specializations
Occupations in education
Occupations in administrative specializations
11,468 (8%) 15,573 (8%) 13,996 (14%) 13,892 (13%)
$38,000 $40,000 $35,000 $38,90012 Of which: Number employed in IT services industry (% of total) (2) n.a. n.a. 88,613 (44%) 17,803 (17%) 19,347 (19%)13 Of which: Number employed in IT hardware industry (% of total) (3) n.a. n.a. 4,824 (2%) 2,210 (2%) 1,554 (1%)
14Addendum: Number of H-1B visas issued by the US State Department (% of total H-1B petitions granted) (4)
116,513 (n.a.) 133,290 (52%) 161,643 (49%) 118,352 (60%) 107,196 (49%)
15Addendum: Number of H-1B visas issued by the US State Department to Indian nationals (% of total H-1B petitions granted to Indians)
55,062 (n.a.) 61,530 (49%) 74,078 (46%) 44,012 (68%) 42,245 (53%)
16Addendum: Number of H-1B visas issued by the US State Department to Chinese nationals (% of total H-1B petitions granted to Chinese)
5,775 (n.a.) 7,489 (33%) 9,076 (33%) 7,576 (40%) 5,608 (28%)17 Addendum: Number of H-1B visas issued by the US State Department to British nationals 6,664 7,304 8,462 6,842 6,095

Table 3 (continued)
1999 (1) 2000 2001 2002 2003
6 7 8 9 10b.
Petitions for continuing employment1
Number of times an H-1B visa holder was admitted into the US 302,326 355,605 384,191 370,490 360,4982
Total number of H-1B petitions granted n.a. 257,640 331,206 197,537 217,3403
Of which: Number of H-1B petitions granted for continuing employment (% of total) n.a. 120,853 (47%) 130,127 (39%) 93,953 (48%) 112,026 (52%)
6
Of which: #1 country of origin (% of total) n.a. India India India India
63,940 (53%) 70,893 (54%) 43,914 (47%) 49,897 (45%)7
Of which: #2 country of origin (% of total) n.a. China China China China
10,237 (8%) 10,483 (8%) 7,009 (7%) 8,919 (8%)8
Of which: #3 country of origin (% of total) n.a. Canada Canada Canada Canada
2,900 (2%) 3,542 (3%) 3,867 (4%) 4,959 (4%)9
Of which: #1 occupational group (% of total) and median earnings
n.a.
Computer-related occupations
Computer-related cccupations
Computer-related occupations
Computer-related occupations
73,875 (61%) 80,684 (62%) 49,477 (53%) 54,235 (48%)
$ 65,000 $69,000 $64,739 $63,000 10
Of which: #2 Occupational group (% of total) and median earnings
Occupations in architecture, engineering, and
surveying
Occupations in architecture,
engineering, and surveying
Occupations in architecture, engineering,
and surveying
Occupations in architecture,
engineering, and surveying
14,298 (12%) 15,023 (12%) 10,730 (11%)14,292 (13%)
$ 65,000 $68,000 $ 63,600 $64,756 11
Of which: #3 occupational group (% of total) and median earnings
Occupations in administrative specializations
Occupations in administrative specializations
Occupations in educationOccupations in administrative specializations
6,951 (6%) 8,221 (6%) 7,250 (8%) 9,180 (8%)
$50,000 $54,429 $39,000 $50,000 12
Of which: Number employed in IT services industry (% of total)n.a. n.a. 60,071 (46%) 35,814 (38%) 39,323 (35%)
13 Of which: Number employed in IT hardware industry (% of total)
n.a. n.a. 4,347 (3%) 2,293 (2%) 3,774 (3%) n.a. = not available
1. Period from May 1998 to July 1999.
2. Defined as NAICS categories (3341) Computer and Peripheral Equipment and NAICS (3344) Semiconductor and Other Electronic Component Manufacturing.
3. Defined as NAICS categories (5415) Computer Systems Design and Related Services, (5141) Information Services, (5142) Data Processing Services, and (5112) Software Publishers. Not data for all categories each year.
4. Actual issuance by the US State Department of H-1B visas is 1996, 1997, and 1998 amounted to 58,327, 80,547, and 91,360, respectively. India, China, and Britain ranked one, two, and three respectively in terms of visa issuance for 2000–03, followed by Japan, Philippines, and Germany. Individual country data provided by Julie Furuta-Toy, director of Office of Public and Diplomatic Liaison, Visa Services. On file with author.
Sources: INS (2000, 2002a, 2002b); USCIS (2003, 2004); US Department of State Annual Report of the Visa Office (2000a, 2001, and 2002); OECD (2004). It must be emphasized that the USCIS qualifies its annual reports to Congress on H-1B visas by stating that “very little editing has been done to the data”, and there may subsequently be some errors in the data. Whether these are systematic cannot be discerned. Shaded areas denote H-1B petitions that are exempt from the congressional cap on H-1B visas.

Table 4 Leading US employers of H-1B visaholders, October 1999–February 2000
Rank Company Number of H-1B approved Country of origin Share of US workforce on H-1B
or L-1 visas, 2003/2004
1 Motorola Inc. 618 United States n.a.
2 Oracle Corporation 455 United States n.a.
3 Cisco Systems 398 United States n.a. 4 Mastech (iGate) 389 United States 13 (H-1B only)
5 Intel Corporation 367 United States n.a. 6 Microsoft Corporation 362 United States n.a.
7 Rapidigm 357 United States n.a. 8 Syntel Inc. 337 United States 59 (486 H-1B, 268 L-1)
9 Wipro Ltd. 327 India >50 (1,130 H-1B, 1,491 L-1) 10 Tata Consulting Services 320 India n.a.
11 PWC LLP 272 United States n.a. 12 PeopleCom Consultancies 261 Unknown n.a.
13 Lucent Technologies 255 United States n.a. 14 Infosys Technologies Ltd. 239 India >50 (3,200 H-1B, 700 L-1)
15 Nortel Networks, Inc. 234 Canada n.a. 16 Tekedge Corporation 219 United States n.a.
17 Data Conversion 195 United States n.a. 18 Tata Infotech. 185 India n.a.
19 Cotilligent USA, Inc. 183 United States n.a. 20 Sun Microsystems, Inc. 182 United States n.a.
26 Hewlett-Packard Co. 149 United States n.a. 33 Birlasoft 128 India n.a.
35 IBM 124 United States n.a. 39 Satyam Computer Services 123 India close to 100 (687 H-1B, 635 L-1, March 2002)
42 University of Washington 113 United States n.a. 52 University of Pennsylvania 97 United States n.a.
58 Merrill Lynch 87 United States n.a. 65 General Electric 80 United States n.a.
71 Goldman Sachs 75 United States n.a. 75 Stanford University 73 United States n.a.
79 Morgan Stanley 71 United States n.a. 82 Harvard University 70 United States n.a.
94 Ramco Systems 63 India n.a. 99 Yale University 61 United States n.a.
n.a. = not available Sources: INS (2000b); company 10-K or 20 filings with the SEC; company web sites.

Figure 1 H-1B and L-1 admissions by fiscal year
100,446114,467 110,223
240,947
302,326
355,605
75,31598,189
112,124
140,457
203,255
234,443
294,658
144,458
117,574105,899
92,795
386,821
360,498370,490
384,191
82,60670,50563,180
314,484298,054
328,480313,699
0
50000
100000
150000
200000
250000
300000
350000
400000
450000
1990 1991 1992 1993 1994 1995 1996 1998 1999 2000 2001 2002 2003 2004
H-1B Status Admissions L-1 Status Admissions
Source: USCIS 2003Yearbook of Immigration Statistics , Temporary Admissions of Nonimmigrants to the US in 2004. No data available for 1997.
Figure 2 Tata (Tata Consulting Systems and Tata Infotech) LCAs, fiscal 2004
$-
$20,000
$40,000
$60,000
$80,000
$100,000
$120,000
$- $20,000 $40,000 $60,000 $80,000 $100,000 $120,000
prevailing wage
offe
red
wag
e
Share of LCAs with prevailing wage from an official US source: 85 percent
LCA = labor condition application Source: FLC Datacenter , www.flcdatacenter.com.

Figure 3 Wipro LCAs, fiscal 2004
$-
$10,000
$20,000
$30,000
$40,000
$50,000
$60,000
$70,000
$80,000
$- $10,000 $20,000 $30,000 $40,000 $50,000 $60,000 $70,000 $80,000
prevailing wage
offe
red
wag
e
Share of LCAs with prevailing wage from an official US source: 80 percent
Source: FLC Datacenter, www.flcdatacenter.com.
Figure 4 Infosys LCAs, fiscal 2004
$-
$10,000
$20,000
$30,000
$40,000
$50,000
$60,000
$70,000
$80,000
$- $10,000 $20,000 $30,000 $40,000 $50,000 $60,000 $70,000 $80,000
prevailing wage
offe
red
wag
e
Share of LCAs with prevailing wafe from an official US source: 62 percent
Source: FLC Datacenter, www.flcdatacenter.com.

Figure 5 Satyam LCAs, fiscal 2004
$-
$20,000
$40,000
$60,000
$80,000
$100,000
$120,000
$- $20,000 $40,000 $60,000 $80,000 $100,000 $120,000
prevailing wage
offe
red
wag
e
Share of LCAs with prevailing wage from an official US source: 91 percent
Source : FLC Datacenter , www.flcdatacenter.com.
Figure 6 Birlasoft LCAs, fiscal 2004
$-
$10,000
$20,000
$30,000
$40,000
$50,000
$60,000
$70,000
$80,000
$- $10,000 $20,000 $30,000 $40,000 $50,000 $60,000 $70,000 $80,000
prevailing wage
offe
red
wag
e
Share of LCAs with prevailing wage from an official US source: 100 percent
Source: FLC Datacenter, www.flcdatacenter.com.

Figure 7 Ramsoft LCAs, fiscal 2004
$-
$10,000
$20,000
$30,000
$40,000
$50,000
$60,000
$- $10,000 $20,000 $30,000 $40,000 $50,000 $60,000
prevailing wage
wag
e of
fere
d
Share of LCAs with prevailing wage from an official US source: 100 percent
Source: FLC Datacenter, www.flcdatacenter.com.
Figure 8 IBM LCAs, fiscal 2004
$-
$50,000
$100,000
$150,000
$200,000
$250,000
$- $50,000 $100,000 $150,000 $200,000 $250,000
prevailing wage
offe
red
wag
e
Share of LCAs with prevailing wage from an official US source: 94 percent
Source: FLC Datacenter, www.flcdatacenter.com.

Figure 9 Hewlett Packard LCAs, fiscal 2004
$-
$20,000
$40,000
$60,000
$80,000
$100,000
$120,000
$140,000
$160,000
$- $20,000 $40,000 $60,000 $80,000 $100,000 $120,000 $140,000 $160,000
prevailing wage
wag
e of
fere
d
Source: FLC Datacenter, www.flcdatacenter.com.
Share of LCAs with prevailing wage from an official US source: 96 percent
Figure 10 Dell LCAs, fiscal 2004
$-
$20,000
$40,000
$60,000
$80,000
$100,000
$120,000
$140,000
$160,000
$- $20,000 $40,000 $60,000 $80,000 $100,000 $120,000 $140,000 $160,000
prevailing wage
wag
e of
fere
d
Source: FLC Datacenter, www.flcdatacenter.com.
Share of LCAs with prevailing wage from an official US source: 99 percent

Figure 11 Microsoft LCAs, fiscal 2004
$-
$50,000
$100,000
$150,000
$200,000
$250,000
$300,000
$- $50,000 $100,000 $150,000 $200,000 $250,000 $300,000
prevailing wage
offe
red
wag
e
Share of LCAs with prevailing wage from an official US source: 6 percent (94% from Radford Surveys at www.radford.com)
Source: FLC Datacenter, www.flcdatacenter.com
Figure 12 Intel LCAs, fiscal 2004
$-
$20,000
$40,000
$60,000
$80,000
$100,000
$120,000
$140,000
$- $20,000 $40,000 $60,000 $80,000 $100,000 $120,000 $140,000
prevailing wage
offe
red
wag
e
Source: FLC Datacenter, www.flcdatacenter.com
Share of LCAs with prevailing wage from an official US source: 76 percent

Figure 13 Motorola LCAs, fiscal 2004
$-
$50,000
$100,000
$150,000
$200,000
$250,000
$- $50,000 $100,000 $150,000 $200,000 $250,000
prevailing wage
wag
e of
fere
d
Source: FLC Datacenter, www.flcdatacenter.com.
Share of LCAs with prevailing wage from an official US source: 9 percent (85% from Dietrich Surveys at www.dsurveys.com)
Figure 14 Cisco LCAs, fiscal 2004
$-
$50,000
$100,000
$150,000
$200,000
$250,000
$- $50,000 $100,000 $150,000 $200,000 $250,000prevailing wage
wag
e of
fere
d
Share of LCAs with prevailing wage from an official US source: 18 percent (79 percent from Radford Surveys at www.radford.com)
Source: FLC Datacenter at www.flcdatacenter.com.

Figure 15 General Electric LCAs, fiscal 2004
$-
$20,000
$40,000
$60,000
$80,000
$100,000
$120,000
$140,000
$160,000
$180,000
$200,000
$- $20,000 $40,000 $60,000 $80,000 $100,000 $120,000 $140,000 $160,000 $180,000 $200,000
prevailing wage
wag
e of
fere
d
Share of LCAs with prevailing wage from an official US source: 78 percent
Source: FLC Datacenter, www.flcdatacenter.com.
Figure 16 Goldman Sachs LCAs, fiscal 2004
$-
$50,000
$100,000
$150,000
$200,000
$250,000
$300,000
$- $50,000 $100,000 $150,000 $200,000 $250,000 $300,000
prevailing wage
wag
e of
fere
d
Share of LCAs with prevailing wage from an official US source: 11 percent (89% from Watson Wyatt World wide at www.watsonwyatt.com)
Source: FLC Datacenter, www.flcdatacenter.com.

Figure 17 Harvard University LCAs, fiscal 2004
$-
$20,000
$40,000
$60,000
$80,000
$100,000
$120,000
$140,000
$160,000
$180,000
$200,000
$- $20,000 $40,000 $60,000 $80,000 $100,000 $120,000 $140,000 $160,000 $180,000 $200,000
prevailing wage
offe
red
wag
e
Share of LCAs with prevailing wage from an official US source: 100 percent
Source: FLC Datacenter, www.flcdatacenter.com.
Figure 18 Massachusetts Institute of Technology LCAs, fiscal 2004
$-
$20,000
$40,000
$60,000
$80,000
$100,000
$120,000
$140,000
$160,000
$- $20,000 $40,000 $60,000 $80,000 $100,000 $120,000 $140,000 $160,000
prevailing wage
offe
red
wag
e
Source: FLC Datacenter, www.flcdatacenter.com.
Share of LCAs with prevailing wage from an official US source: 100 percent

Figure 19 Los Alamos National Laboratory LCAs, fiscal 2004
$-
$20,000
$40,000
$60,000
$80,000
$100,000
$120,000
$140,000
$- $20,000 $40,000 $60,000 $80,000 $100,000 $120,000 $140,000
prevailing wage
offe
red
wag
e
Share of LCAs with prevailing wage from an official US source: 100 percent
Source: FLC Datacenter, www.flcdatacenter.com.
Figure 20 Cognizant Technology Solutions LCAs, fiscal 2004
$-
$20,000
$40,000
$60,000
$80,000
$100,000
$120,000
$- $20,000 $40,000 $60,000 $80,000 $100,000 $120,000
prevailing wage
offe
red
wag
e
Source: LC Datacenter, www.flcdatacenter.com.
Share of LCAs with prevailing wage from an official US source: 13 percent (87% from Watson Wyatt Worldwide at www.watsonwyatt.com).

Figure 21 Kaiser Foundation Hospitals LCAs, fiscal 2004
$-
$20,000
$40,000
$60,000
$80,000
$100,000
$120,000
$140,000
$160,000
$- $20,000 $40,000 $60,000 $80,000 $100,000 $120,000 $140,000 $160,000
prevailing wage
offe
red
wag
e
Source: FLC Datacenter, www.flcdatacenter.com.
Share of LCAs with prevailing wage from an official US source: 11 percent (89 percent from Radford Surveys at www.radford.com and Watson Wyatt Worldwide at www.watsonwyatt.com)