studentsrepo.um.edu.mystudentsrepo.um.edu.my/6797/1/lailatun.pdf · iii abstract this research is...
TRANSCRIPT
STRUCTURAL, MAGNETIC, THERMAL, MESOMORPHIC AND DENSITY FUNCTIONAL THEORETICAL STUDIES OF
COMPLEXES OF COPPER(II) AND IRON(II) WITH CARBOXYLATE IONS AND 2,2’-BIPYRIDINE LIGANDS
LAILATUN NAZIRAH OZAIR
FACULTY OF SCIENCE
UNIVERSITY OF MALAYA
KUALA LUMPUR
2016 Univ
ersity
of M
alaya

UNIVERSITI MALAYA
ORIGINAL LITERARY WORK DECLARATION
Name of Candidate: LAILATUN NAZIRAH OZAIR
Registration/Matric No: SHC120096
Name of Degree: DOCTOR OF PHILOSOPHY
Title of Project Paper/Research Report/Dissertation/Thesis (“this Work”):
STRUCTURAL, MAGNETIC, THERMAL, MESOMORPHIC AND DENSITY FUNCTIONAL THEORETICAL STUDIES OF COMPLEXES OF COPPER(II) AND IRON(II) WITH CARBOXYLATE IONS AND 2,2’-BIPYRIDINE LIGANDS
Field of Study: Material Chemistry
I do solemnly and sincerely declare that:
(1) I am the sole author/writer of this Work; (2) This Work is original; (3) Any use of any work in which copyright exists was done by way of fair dealing and for
permitted purposes and any excerpt or extract from, or reference to or reproduction of any copyright work has been disclosed expressly and sufficiently and the title of the Work and its authorship have been acknowledged in this Work;
(4) I do not have any actual knowledge nor do I ought reasonably to know that the making of this work constitutes an infringement of any copyright work;
(5) I hereby assign all and every rights in the copyright to this Work to the University of Malaya (“UM”), who henceforth shall be owner of the copyright in this Work and that any reproduction or use in any form or by any means whatsoever is prohibited without the written consent of UM having been first had and obtained;
(6) I am fully aware that if in the course of making this Work I have infringed any copyright whether intentionally or otherwise, I may be subject to legal action or any other action as may be determined by UM.
Candidate’s Signature Date: 08 September 2016
Subscribed and solemnly declared before,
Witness’s Signature Date: 08 September 2016
Name: ASSOC. PROF. DR. NORBANI ABDULLAH
Designation:
Univers
ity of
Mala
ya

iii
ABSTRACT
This research is focused on the syntheses and characterization of magnetic, thermally
stable and mesomorphic complexes of copper(II) and iron(II) of general formula
[Cu2(RCOO)4(bpy)2] and [Fe(RCOO)2(bpy)] (R = CH3(CH2)6-14, p-CH3(CH2)9-15C6H4;
bpy = 2,2’-bipyridine), respectively, and study their magnetic properties (for the
copper(II) complexes) and structures (for the iron(II) complexes) by density functional
theories (DFT). The structures of ligands and complexes were deduced by CHN
elemental analyses, 1H-NMR spectroscopy (for ligands), FTIR spectroscopy, UV-vis
spectroscopy, and X-ray crystallography (for single crystals). The magnetic
susceptibilities of complexes were determined at room temperature by the Gouy
method, their thermal stabilities by thermogravimetry (TG), and their mesomorphic
properties by differential scanning calorimetry (DSC) and polarizing optical microscopy
(POM). The geometry optimization and frequencies calculations were done using
Gaussian09W package with DFT B3LYP method and 6-31G basis set. A total of nine
copper(II) complexes and eight iron(II) complexes were successfully synthesised and
characterised. All copper(II) complexes have square pyramidal Cu(II) centres with
monodentate and syn-anti bridging carboxylato ligands, were magnetic, thermally stable
(Tdec ranged from 173 oC to 272 oC), and mesomorphic. All iron(II) complexes were
octahedral with a mixture of high spin (HS) and low spin (LS) iron(II) atoms at room
temperature, and thermally stable (Tdec ranged from 152 oC to 160 oC). The
alkylcarboxylate complexes, except for [Fe2(CH3(CH2)10COO)4(bpy)], were not
mesomorphic,. The arylcarboxylate complexes were mesomorphic. The molecular
modelling for copper(II) complex (1) and iron(II) complexes (6 and 16) showed good
agreement between the experimental and theoretical data.
Univers
ity of
Mala
ya
iv
ABSTRAK
Penyelidikan ini berfokuskan sintesis dan pencirian kompleks magnetik, stabil terma
dan mesomorfik kuprum(II) dan ferum(II), masing-masing dengan formula umum
[Cu2(RCOO)4(bpy)2] dan [Fe(RCOO)2(bpy)] (R = CH3(CH2)6-14, p-CH3(CH2)9-15C6H4;
bpy = 2,2’-bipyridine), dan mengkaji sifat magnet (bagi kompleks kuprum(II)) dan
struktur (bagi kompleks ferum(II)) melalui teori ketumpatan fungsian (DFT). Struktur
ligan dan kompleks dideduksikan secara analisis unsur CHN, spektroskopi 1H-NMR
(untuk ligan), spektroskopi FTIR, spektroskopi UV-nampak, dan kristolagrafi sinar X
(untuk hablur tunggal). Kerentanan magnet kompleks ditentukan pada suhu bilik
melalui kaedah Gouy, kestabilan terma melalui termogravimetri (TG), dan sifat
mesomorfik melalui kalorimetri imbasan perbezaan (DSC) dan mikroskopi pengutuban
optik (POM). Pengoptimum geometri dan pengiraan frekuensi dilakukan dengan
menggunakan pakej Gaussian09W dengan kaedah DFT B3LYP dan set asas 6-31G.
Sejumlah sembilan kompleks kuprum(II) dan lapan kompleks ferum(II) berjaya
disintesis dan dicirikan. Semua kompleks kuprum(II) mempunyai pusat Cu(II) piramid
sisi empat sama dengan ligan karboksilat monodentat dan titian syn-anti, magnetik,
stabil terma (Turai dalam julat 173 oC hingga 272 oC), dan mesomorfik. Semua kompleks
ferum(II) adalah oktahedral dengan campuran atom ferum(II) spin tinggi (HS) dan spin
rendah (LS) pada suhu bilik, dan stabil terma (Turai dalam julat 152 oC hingga 160 oC).
Kompleks alkilkarboksilat, kecuali [Fe2(CH3(CH2)10COO)4(bpy)], adalah tidak
mesomorfik. Kompleks arilkarboksilat adalah mesomorfik. Pemodelan molekul bagi
kompleks kuprum(II) (1) dan kompleks ferum(II) (6 dan 16) menunjukkan persamaan
yang baik antara data eksperimen dengan data teori.
Univers
ity of
Mala
ya
v
ACKNOWLEDGEMENTS
The process of earning a doctorate and writing a dissertation would not possible without
the help and support of kind people around me. Above all, thanks to ALLAH for
bestowing his great mercy to me.
I would like to express my deepest appreciation to my supervisor, Assoc. Prof.
Dr. Norbani Abdullah, who was helpful and offered such invaluable assistance, support
and guidance. Without her guidance and persistent help, this research would not have
been possible.
Particularly, I would like to thank my husband, Mohd Firdaus Mohd Iskandar,
for his consistent love, support and sacrifices through this journey.
I owe my deepest gratitude to my beloved daughter, Adeleia Sophia for her
understanding and endless love, and my parents Ozair Saidin and Dr. Zamrudah
Zainuddin, for their support in every aspect of this research.
I am indebted to my colleagues from the inorganic chemistry research
laboratory, my friends and all staff in the Chemistry Department, University of Malaya,
for the invaluable assistance.
Last but not least, I would like to acknowledge the scholarship from Ministry of
Higher Education Malaysia (MyPhD) and the following grants for this research:
Fundamental Sciences of Self Assembly High Impact Research Grant
(UM.C/625/1/HIR/MOHE/05) and University of Malaya Postgraduate Research Grant
(PG023-2013A).
Univers
ity of
Mala
ya
vii
TABLE OF CONTENTS
ABSTRACT iii
ABSTRAK iv
ACKNOWLEDGEMENT v
TABLE OF CONTENTS vii
LIST OF FIGURES xii
LIST OF TABLES xxiv
LIST OF SCHEMES xxvi
CHAPTER 1 INTRODUCTION 1
CHAPTER 2 THEORY AND LITERATURE REVIEW 5
2.1 Introduction 5
2.2 Copper(II) carboxylate 5
2.2.1 Syntheses and structures 5
2.2.2 Thermal and mesomorphic properties 15
2.2.3 Complexes of copper(II) carboxylates with N-donor ligands 21
2.3 Iron(II) carboxylates 28
2.3.1 Syntheses and structures 28
2.3.2 Magnetic properties 28
2.3.3 Complexes of iron(II) carboxylates with N-donor ligands 29
2.4 Theoretical studies 34
CHAPTER 3 EXPERIMENTAL 37
3.1 Materials 37
3.2 Syntheses 38
3.2.1 [Cu2(RCOO)4(bpy)2(H2O)2] 38
(a) [Cu2(CH3(CH2)6COO)4(bpy)2(H2O)2] 38
Univers
ity of
Mala
ya

viii
(b) [Cu2(CH3(CH2)8COO)4(bpy)2] 39
(c) [Cu2(CH3(CH2)10COO)4(bpy)2] 39
(d) [Cu2(CH3(CH2)12COO)4(bpy)2] 40
(e) [Cu2(CH3(CH2)14COO)4(bpy)2] 40
3.2.2 [Fe2(RCOO)4(bpy)2] 41
(a) [Fe2(CH3(CH2)8COO)4(bpy)(H2O)2] 41
(b) [Fe2(CH3(CH2)10COO)4(bpy)(H2O)2] 41
(c) [Fe2(CH3(CH2)12COO)4(bpy)(H2O)2] 41
(d) [Fe2(CH3(CH2)14COO)4(bpy)(H2O)2] 42
3.2.3 [Cu2(p-ROC6H4COO)4(bpy)2] 42
(a) [Cu2(p-CH3(CH2)9OC6H4COO)4(bpy)2] 42
(b) [Cu2(p-CH3(CH2)11OC6H4COO)4(bpy)2] 43
(c) [Cu2(p-CH3(CH2)13OC6H4COO)4(bpy)2] 43
(d) [Cu2(p-CH3(CH2)15OC6H4COO)4(bpy)2] 44
3.2.4 [Fe2(μ-RCOO)2(RCOO)2(bpy)] 44
(a) [Fe2(μ-RCOO)2(RCOO)2(bpy)] (R = p-CH3(CH2)9OC6H4) 44
(b) [Fe2(μ-RCOO)2(RCOO)2(bpy)] (R = p-CH3(CH2)11OC6H4) 45
(c) [Fe(RCOO)2(bpy)](R = p-CH3(CH2)13OC6H4) 45
(d) [Fe(RCOO)2(bpy)] (R = p-CH3(CH2)15OC6H4) 45
3.3 Instrumental Analyses 46
3.3.1 Single crystal X-ray crystallography 46
3.3.2 Elemental analyses 46
3.3.3 Fourier transform infra-red spectroscopy 46
3.3.4 Ultraviolet-visible spectroscopy 47
3.3.5 1H-NMR spectroscopy 47
3.3.6 Room-temperature magnetic susceptibility 47
Univers
ity of
Mala
ya

ix
3.3.7 Thermogravimetric analysis 47
3.3.8 Polarizing optical microscope 48
3.3.9 Differential scanning calorimetry 48
3.3.10 Molecular modeling 48
CHAPTER 4 RESULTS AND DISCUSSION 49
4.1 [Cu2(RCOO)4(bpy)2] 49
4.1.1 [Cu2(CH3(CH2)6COO)4(bpy)2] (1) 49
(a) Synthesis and structural elucidation 49
(b) Thermal and mesomorphic studies 58
4.1.2 [Cu2(CH3(CH2)8COO)4(bpy)2] (2) 61
(a) Synthesis and structural elucidation 61
(b) Thermal and mesomorphic studies 67
4.1.3 [Cu2(CH3(CH2)10COO)4(bpy)2] (3) 70
(a) Synthesis and structural elucidation 70
(b) Thermal and mesomorphic studies 75
4.1.4 [Cu2(CH3(CH2)12COO)4(bpy)2] (4) 78
(a) Synthesis and structural elucidation 78
(b) Thermal and mesomorphic studies 82
4.1.5 [Cu2(CH3(CH2)14COO)4(bpy)2] (5) 85
(a) Synthesis and structural elucidation 85
(b) Thermal and mesomorphic studies 91
4.1.6 Summary 94
4.2 [Fe2(RCOO)4(bpy)] 99
4.2.1 [Fe2(CH3(CH2)8COO)4(bpy)(H2O)2] (6) 99
(a) Synthesis and structural elucidation 99
(b) Thermal and mesomorphic studies 104
Univers
ity of
Mala
ya
x
4.2.2 [Fe2(CH3(CH2)10COO)4(bpy)(H2O)2] (7) 107
(a) Synthesis and structural elucidation 107
(b) Thermal and mesomorphic studies 110
4.2.3 [Fe2(CH3(CH2)12COO)4(bpy)(H2O)2] (8) 112
(a) Synthesis and structural elucidation 112
(b) Thermal and mesomorphic studies 116
4.2.4 [Fe2(CH3(CH2)14COO)4(bpy)(H2O)2] (9) 118
(a) Synthesis and structural elucidation 118
(b) Thermal and mesomorphic studies 121
4.2.5 Summary 124
4.3 [Cu2(p-ROC6H4COO)4(bpy)2] 125
4.3.1 [Cu2(p-CH3(CH2)9OC6H4COO)4(bpy)2] (10) 125
(a) Synthesis and structural elucidation 125
(b) Thermal and mesomorphic studies 133
4.3.2 [Cu2(p-CH3(CH2)11OC6H4COO)4(bpy)2] (11) 136
(a) Synthesis and structural elucidation 136
(b) Thermal and mesomorphic studies 145
4.3.3 [Cu2(p-CH3(CH2)13OC6H4COO)4(bpy)2] (12) 148
(a) Synthesis and structural elucidation 148
(b) Thermal and mesomorphic studies 153
4.3.4 [Cu2(p-CH3(CH2)15OC6H4COO)4(bpy)2] (13) 156
(a) Synthesis and structural elucidation 156
(b) Thermal and mesomorphic studies 161
4.3.5 Summary 164
4.4 Reactions of [Fe2(μ-H2O)(μ-RCOO)2(RCOO)2(H2O)2] with bpy 165
4.4.1 [Fe2(μ-RCOO)2(RCOO)2(bpy)] (R = p-CH3(CH2)9OC6H4) (14) 165
Univers
ity of
Mala
ya

xi
(a) Synthesis and structural elucidation 165
(b) Thermal and mesomorphic studies 171
4.4.2 [Fe2(μ-RCOO)2(RCOO)2(bpy)] (R = p-CH3(CH2)11OC6H4) (15) 174
(a) Synthesis and structural elucidation 174
(b) Thermal and mesomorphic studies 178
4.4.3 [Fe(p-CH3(CH2)13OC6H4COO)2(bpy)] (16) 181
(a) Synthesis and structural elucidation 181
(b) Thermal and mesomorphic studies 184
4.4.4 [Fe(p-CH3(CH2)15OC6H4COO)2(bpy)] (17) 186
(a) Synthesis and structural elucidation 186
(b) Thermal and mesomorphic studies 190
4.4.5 Summary 192
4.5 Molecular modeling 193
4.5.1 Magneto-structural correlation and computational results for
copper(II) complexes 194
4.5.2 Computational results and FTIR comparison for iron(II) complexes 197
CHAPTER 5 CONCLUSIONS AND SUGGESTION
FOR FUTURE WORKS 201
5.1 Conclusions 201
5.2 Suggestion for future works 203
References 204
Appendix
Univers
ity of
Mala
ya

xii
LIST OF FIGURES
Figure 2.1 : Paddle-wheel structure of (a) [Cu2(RCOO)4];
(b) [Cu2(RCOO)4(L)2] and (c) polymeric [Cu2(RCOO)4]
6
Figure 2.2 : Bridging coordination modes of RCOO- ligand 7
Figure 2.3 : The energy of the d-orbitals in an (a) octahedral,
(b) square pyramidal, and (c) square planar geometry
9
Figure 2.4 : Electron spin alignment (a) antiferromagnetism;
(b) ferromagnetism; (c) ferrimagnetism
11
Figure 2.5 : ORTEP view of the molecular structure of
[Cu2(OOCC6H5)4(CH3CH2OH)2] displaying the thermal
ellipsoids at 30% probability. H atoms are omitted for
clarity [4]
13
Figure 2.6 : Crystal structure of [Cu2(CH3(CH2)5COO)4] [30] 14
Figure 2.7 : Crystal structure of [Cu6(O2CC6H2(OCH2CH3)3)12] [31] 14
Figure 2.8 : Molecular arrangement in a solid, a liquid crystal and a
liquid
15
Figure 2.9 : An example of a molecular structure for calamitic LC 16
Figure 2.10 : Examples of calamitic LC textures (a) nematic;
(b) smectic A; and (c) smectic C
17
Figure 2.11 : An example of molecular structure for discotic LC
(R = p-CnH2nC6H4CO-)
17
Figure 2.12 : An example of Colh mesophase 18
Figure 2.13 : An example of a DSC scan 19
Figure 2.14 : Discotic mesophase exhibited by copper(II)
alkylcarboxylates [39]
19
Univers
ity of
Mala
ya

xiii
Figure 2.15 : Molecular structure of
tetrakis(μ-o-decanoato)dicopper(II), showing two
paddle-wheel units linked through Cu-O(axial) bonds
[40]
20
Figure 2.16 : Hexagonal columnar discotic phase [40] 21
Figure 2.17 : Molecular structure of [Cu2(L)4(py)4].2CH2Cl2 [43] 22
Figure 2.18 : Crystal structure of
[Cu2(CH3(CH2)14COO)4(2,2’-bipyridine)2].2CH3OH [44]
23
Figure 2.19 : Crystal structure of [Cu(oda)(phen)]2.6H2O [45] 24
Figure 2.20 : Crystal structures of
[Cu2(3-HOC6H4COO)4(4-acetylpyridine)2].6H2O [25]
25
Figure 2.21 : Molecular structure of
[Cu(pyrazine-2,3-dicarboxylate)(H2O)2].H2O [48]
25
Figure 2.22 : (a) Molecular structure of [Cu(R)2(bpy)2].RH; (b) optical
textures of [Cu(R)2(bpy)2].RH at 71.9 oC on cooling from
81.0 oC [49]
26
Figure 2.23 : Proposed structure of [Cu2(R)4(bpy)]n [49] 27
Figure 2.24 : Photomicrographs of [Cu2(R)4(bpy)]n at: (a) 180.6 oC on
cooling from 185 oC, (b) 133 oC on cooling from 185 oC,
and (c) 160 oC on cooling from 190 oC [49]
28
Figure 2.25 : Electronic arrangements in (a) HS, and (b) LS iron(II)
octahedral complexes
29
Figure 2.26 : Molecular structure of
[Fe2(μ-H2O)(μ-OAc)2(OAc)3(py)2]- [56]
30
Figure 2.27 : Molecular structure of
[Fe2(BEAN)(μ-O2CPhCy)3](OTf) [58]
30
Univers
ity of
Mala
ya

xiv
Figure 2.28 : Molecular structure of
Fe2(μ-H2O)(μ-O2CCF3)2(μ-XDK)(TMEN)2] [59]
31
Figure 2.29 : Proposed structure of
[Fe2(CH3COO)4(L)2] (R = CH3(CH2)13) [60]
31
Figure 2.30 : Photomicrograph of on heating at (a) 70 oC and (b) 78 oC
[60]
33
Figure 2.31 : Perspective view along b-axis of the syn-anti μ-
carboxylate bridged iron(II) chain [63]
34
Figure 2.32 : Figure 2.32. Molecular structure of [Cu2(FBF)4] [65] 35
Figure 2.33 : The experimental and simulated FTIR spectra of
[Fe2(CH3COO)4(L)2] (R = CH3(CH2)13) [60]
36
Figure 4.1 : FTIR spectrum of CH3(CH2)6COONa.½H2O 50
Figure 4.2 : FTIR spectrum of
[Cu6Cl10(CH3(CH2)6COO)2].3H2O.2CH3CH2OH
52
Figure 4.3 : UV-vis spectrum of
[Cu6Cl10(CH3(CH2)6COO)2].3H2O.2CH3CH2OH
52
Figure 4.4 : (a) Molecular structure, and (b) the packing diagram of 1
viewed along crystallographic b-axis
54
Figure 4.5 : (a) Molecular structure, and (b) the packing diagram of 1a
viewed along crystallographic b-axis
55
Figure 4.6 : FTIR spectrum of 1 57
Figure 4.7 : UV-vis spectrum of 1 in DMSO-C2H5OH 58
Figure 4.8 : TGA trace of 1 59
Figure 4.9 : Photomicrographs of: (a) 1 on cooling at 138 oC;
(b) [Cu2(CH3(CH2)6COO)4] on cooling at 150 oC
60
Figure 4.10 : DSC scans of 1 61
Univers
ity of
Mala
ya

xv
Figure 4.11 : FTIR spectrum of CH3(CH2)8COONa.2H2O 62
Figure 4.12 : FTIR spectrum of [Cu2(CH3(CH2)8COO)4(H2O)2] 63
Figure 4.13 : UV-vis spectrum of [Cu2(CH3(CH2)8COO)4(H2O)2] in
DMSO-C2H5OH
64
Figure 4.14 : (a) Molecular structure, and (b) packing diagram 2
viewed along crystallographic b-axis
65
Figure 4.15 : FTIR spectrum of 2 66
Figure 4.16 : UV-vis spectrum of 2 in DMSO-C2H5OH 67
Figure 4.17 : TGA trace of 2 68
Figure 4.18 : Photomicrograph of 2 at 36 oC on cooling 69
Figure 4.19 : DSC scans of 2 69
Figure 4.20 : FTIR spectrum of CH3(CH2)10COONa.½H2O 70
Figure 4.21 : FTIR spectrum of [Cu2(CH3(CH2)10COO)4(H2O)2].2H2O 71
Figure 4.22 : UV-vis spectrum of
[Cu2(CH3(CH2)10COO)4(H2O)2].2H2O in DMSO-
C2H5OH
72
Figure 4.23 : (a) Molecular structure, and (b) packing diagram 3
viewed along crystallographic b-axis
73
Figure 4.24 : FTIR spectrum of 3 74
Figure 4.25 : UV-vis spectrum of 3 75
Figure 4.26 : TGA trace of 3 76
Figure 4.27 : Pictomicrographs of: (a) 3 on heating at 103 oC; (b) 3 on
cooling at 76 oC
77
Figure 4.28 : DSC scans of 3 77
Figure 4.29 : FTIR spectrum of CH3(CH2)12COONa 78
Figure 4.30 : FTIR spectrum of [Cu2(CH3(CH2)12COO)4(H2O)2].4H2O 79
Univers
ity of
Mala
ya

xvi
Figure 4.31 : UV-vis spectrum of
[Cu2(CH3(CH2)12COO)4(H2O)2].4H2O in DMSO-
C2H5OH
80
Figure 4.32 : FTIR spectrum of 4 81
Figure 4.33 : UV-vis spectrum of 4 82
Figure 4.34 : TGA trace of 4 83
Figure 4.35 : Photomicrographs of: (a) 4 on cooling at 152 oC;
(b) [Cu2(CH3(CH2)12COO)4(H2O)2].4H2O on cooling at
97 oC
84
Figure 4.36 : DSC scans of 4 85
Figure 4.37 : FTIR spectrum of CH3(CH2)14COONa 86
Figure 4.38 : FTIR spectrum of [Cu2(CH3(CH2)14COO)4(H2O)2] 87
Figure 4.39 : UV-vis spectrum of [Cu2(CH3(CH2)14COO)4(H2O)2].H2O
in DMSO-C2H5OH
87
Figure 4.40 : (a) Molecular structure, and (b) packing diagram 5
viewed along crystallographic b-axis.
89
Figure 4.41 : FTIR spectrum of 5 90
Figure 4.42 : UV-vis spectrum of 5 91
Figure 4.43 : TGA trace of 5 92
Figure 4.44 : Photomicrographs of: (a) 5 on cooling at 140 oC;
(b) [Cu2(CH3(CH2)14COO)4(H2O)2].H2O on cooling at 85
oC
93
Figure 4.45 : DSC scans of 5 94
Figure 4.46 : Proposed structural formula for
[Fe2(μ-H2O)2(CH3(CH2)8COO)4].H2O
(lattice H2O is not shown)
99
Univers
ity of
Mala
ya

xvii
Figure 4.47 : FTIR spectrum of [Fe2(μ-H2O)2(CH3(CH2)8COO)4].H2O 100
Figure 4.48 : UV-vis spectrum of
[Fe2(μ-H2O)2(CH3(CH2)8COO)4].H2O in CHCl3
101
Figure 4.49 : FTIR spectrum of 6 102
Figure 4.50 : UV-vis spectrum of 6 in chloroform 103
Figure 4.51 : Proposed structure of 6
([Fe2(CH3(CH2)8COO)4(bpy)(H2O)2])
104
Figure 4.52 : TGA trace of 6 105
Figure 4.53 : Photomicrographs of 6 on heating at: (a) 28 oC; and (b)
49 oC
105
Figure 4.54 : DSC scans of 6 106
Figure 4.55 : FTIR spectrum of
[Fe2(μ-H2O)2(CH3(CH2)10COO)4].2H2O
107
Figure 4.56 : UV-vis spectrum of
[Fe2(μ-H2O)2(CH3(CH2)10COO)4].2H2O in chloroform
108
Figure 4.57 : FTIR spectrum of 7 109
Figure 4.58 : UV-vis spectrum of 7 in chloroform 110
Figure 4.59 : TGA traces of 7 111
Figure 4.60 : Photomicrographs of 7 on heating at: (a) 40 oC; and on
cooling at (b) 39 oC
111
Figure 4.61 : DSC scans of 7 112
Figure 4.62 : FTIR spectrum of
[Fe2(μ-H2O)2(CH3(CH2)12COO)4].2H2O
113
Figure 4.63 : UV-vis spectrum of
[Fe2(μ-H2O)2(CH3(CH2)12COO)4].2H2O in chloroform
114
Figure 4.64 : FTIR spectrum of 8 115
Univers
ity of
Mala
ya
xviii
Figure 4.65 : UV-vis spectrum of 8 in CHCl3 115
Figure 4.66 : TGA trace of 8 116
Figure 4.67 : Photomicrographs of 8 on heating at: (a) 50 oC; (b) 56 oC;
and (c) 72 oC
117
Figure 4.68 : DSC scans of 8 118
Figure 4.69 : FTIR spectrum of [Fe2(μ-H2O)2(CH3(CH2)14COO)4] 119
Figure 4.70 : UV-vis spectrum of [Fe2(μ-H2O)2(CH3(CH2)14COO)4] in
CHCl3
119
Figure 4.71 : FTIR spectrum of 9 120
Figure 4.72 : UV-vis spectrum of 9 121
Figure 4.73 : TGA trace of 9 122
Figure 4.74 : Photomicrographs of 9 on heating at: (a) 45 oC; and (b)
60 oC
123
Figure 4.75 : DSC scans of 9 123
Figure 4.76 : 1H-NMR spectrum of p-CH3(CH2)9OC6H4COOCH3 126
Figure 4.77 : FTIR spectrum of p-CH3(CH2)9OC6H4COOCH3 127
Figure 4.78 : FTIR spectrum of p-CH3(CH2)9OC6H4COOK 129
Figure 4.79 : FTIR spectrum of
[Cu2(p-CH3(CH2)9OC6H4COO)4(H2O)2]
130
Figure 4.80 : UV-vis spectrum of
[Cu2(p-CH3(CH2)9OC6H4COO)4(H2O)2]
131
Figure 4.81 : FTIR spectrum of 10 132
Figure 4.82 : UV-vis spectrum of 10 133
Figure 4.83 : TGA trace of 10 134
Figure 4.84 : Photomicrographs of: (a) 10 on cooling at 121 oC; and
(b) [Cu2(p-CH3(CH2)9OC6H4COO)4(H2O)2] on cooling
135
Univers
ity of
Mala
ya
xix
at 142 oC
Figure 4.85 : DSC scans of 10 135
Figure 4.86 : 1H-NMR spectrum of p-CH3(CH2)11OC6H4COOCH2CH3 136
Figure 4.87 : (a) Molecular structure, and (b) packing diagram for
p-CH3(CH2)11OC6H4COOCH2CH3 viewed along
crystallographic c-axis.
139
Figure 4.88 : FTIR spectrum of p-CH3(CH2)11OC6H4COOCH2CH3 140
Figure 4.89 : FTIR spectrum of p-CH3(CH2)11OC6H4COOK 141
Figure 4.90 : FTIR spectrum of
[Cu2(p-CH3(CH2)11OC6H4COO)4(H2O)2].2H2O
142
Figure 4.91 : UV-vis spectrum of
[Cu2(p-CH3(CH2)11OC6H4COO)4(H2O)2].2H2O
143
Figure 4.92 : FTIR spectrum of 11 144
Figure 4.93 : UV-vis spectrum of 11 145
Figure 4.94 : TGA trace of 11 146
Figure 4.95 : Photomicrographs of: (a) 11 on cooling at 145 oC; and
(b) [Cu2(p-CH3(CH2)11OC6H4COO)4(H2O)2].2H2O on
cooling at 89 oC
147
Figure 4.96 : DSC scans of 11 147
Figure 4.97 : Proposed chemical structure of
p-CH3(CH2)13OC6H4COOCH3
148
Figure 4.98 : FTIR spectrum of p-CH3(CH2)13OC6H4COOCH2CH3 149
Figure 4.99 : FTIR spectrum of CH3(CH2)13OC6H4COOK 150
Figure 4.100 : FTIR spectrum of
[Cu2(p-CH3(CH2)13OC6H4COO)4(H2O)2].2H2O
151
Figure 4.101 : UV-vis spectrum of 151
Univers
ity of
Mala
ya

xx
[Cu2(p-CH3(CH2)13OC6H4COO)4(H2O)2].2H2O
Figure 4.102 : FTIR spectrum of 12 152
Figure 4.103 : UV-vis spectrum of 12 153
Figure 4.104 : TGA trace of 12 154
Figure 4.105 : Photomicrographs of
[Cu2(p-CH3(CH2)13OC6H4COO)4(H2O)2].2H2O on
cooling at 65 oC
155
Figure 4.106 : DSC scans of 12 155
Figure 4.107 : H-NMR spectrum p-CH3(CH2)15OC6H4COOCH3 156
Figure 4.108 : FTIR spectrum of p-CH3(CH2)15OC6H4COOCH3 157
Figure 4.109 : FTIR spectrum of p-CH3(CH2)15OC6H4COOK 158
Figure 4.110 : FTIR spectrum of
[Cu2(p-CH3(CH2)15OC6H4COO)4(H2O)2]
159
Figure 4.111 : UV-vis spectrum of
[Cu2(p-CH3(CH2)15OC6H4COO)4(H2O)2]
159
Figure 4.112 : FTIR spectrum of 13 160
Figure 4.113 : UV-vis spectrum of 13 161
Figure 4.114 : TGA trace of 13 162
Figure 4.115 : Photomicrograph of
[Cu2(CH3(CH2)15OC6H4COO)4(H2O)2] on cooling at 56
oC
162
Figure 4.116 : DSC scans of 13 163
Figure 4.117 : Proposed structural formula for
[Fe2(μ-H2O)(μ-RCOO)2(RCOO)2(H2O)2]
(R = p-CH3(CH2)9OC6H4)
166
Figure 4.118 : FTIR spectrum of 167
Univers
ity of
Mala
ya
xxi
[Fe2(μ-H2O)(μ-RCOO)2(RCOO)2(H2O)2]
(R = p-CH3(CH2)9OC6H4)
Figure 4.119 : UV-vis spectrum of
[Fe2(μ-H2O)(μ-RCOO)2(RCOO)2(H2O)2]
(R = p-CH3(CH2)9OC6H4)
168
Figure 4.120 : FTIR spectrum of 14 169
Figure 4.121 : UV-vis spectrum of 14 170
Figure 4.122 : Structure of [Fe2(μ-OOCR)2(RCOO)2(bpy)]
(R = p-CH3(CH2)9OC6H4)
171
Figure 4.123 : TGA trace of 14 172
Figure 4.124 : Photomicrographs of: (a) 14 on cooling at 101 oC; (b)
14 on cooling at 92 oC; (c) 14 on cooling at 89 oC;
and
(d) [Fe2(μ-H2O)(μ-RCOO)2(RCOO)2(H2O)2]
(R = p-CH3(CH2)9OC6H4) on cooling at 127 oC
173
Figure 4.125 : DSC scans of 14 174
Figure 4.126 : FTIR spectrum of
[Fe2(μ-H2O)(μ-RCOO)2(RCOO)2(H2O)2].H2O
(R = p-CH3(CH2)11OC6H4)
175
Figure 4.127 : UV-vis spectrum of
[Fe2(μ-H2O)(μ-RCOO)2(RCOO)2(H2O)2].H2O
(R = p-CH3(CH2)11OC6H4)
176
Figure 4.128 : FTIR spectrum of 15 177
Figure 4.129 : UV-vis spectrum of 15 178
Figure 4.130 : TGA trace of 15 179
Figure 4.131 : Photomicrographs of: (a) 15 on cooling at 92 oC; (b) 15 180
Univers
ity of
Mala
ya
xxii
on cooling at 85 oC; and
(c) [Fe2(μ-H2O)(μ-RCOO)2(RCOO)2(H2O)2].H2O
(R = p-CH3(CH2)11OC6H4) on cooling at 100 oC
Figure 4.132 : DSC scans of 15 180
Figure 4.133 : FTIR spectrum of
[Fe2(μ-H2O)(μ-RCOO)2(RCOO)2(H2O)2]
(R = p-CH3(CH2)13OC6H4COO)
181
Figure 4.134 : UV-vis spectrum of
[Fe2(μ-H2O)(μ-RCOO)2(RCOO)2(H2O)2]
(R = p-CH3(CH2)13OC6H4COO)
182
Figure 4.135 : FTIR spectrum of 16 183
Figure 4.136 : UV-vis spectrum of 16 183
Figure 4.137 : TGA trace of 16 184
Figure 4.138 : Photomicrographs of: (a) 16 on cooling at 100 oC; (b) 16
on cooling at 92 oC; and
(c) [Fe2(μ-H2O)(μ-RCOO)2(RCOO)2(H2O)2]
(R = p-CH3(CH2)13OC6H4COO) on cooling at 90 oC
185
Figure 4.139 : DSC scans of 16 186
Figure 4.140 : FTIR spectrum of
[Fe2(μ-H2O)(μ-RCOO)2(RCOO)2(H2O)2]
(R = p-CH3(CH2)15OC6H4)
187
Figure 4.141 : UV-vis spectrum of
[Fe2(μ-H2O)(μ-RCOO)2(RCOO)2(H2O)2]
(R = p-CH3(CH2)15OC6H4)
188
Figure 4.142 : FTIR spectrum of 17 189
Figure 4.143 : UV-vis spectrum of 17 189
Univers
ity of
Mala
ya

xxiii
Figure 4.144 : TGA trace of 17 190
Figure 4.145 : Photomicrographs of: (a) 17 on cooling at 92 oC; and
(b) [Fe2(μ-H2O)(μ-RCOO)2(RCOO)2(H2O)2]
(R = p-CH3(CH2)15OC6H4) on cooling at 107 oC
191
Figure 4.146 : DSC scans of 17 191
Figure 4.147 : Cu-O-Cu angles for (a) 1; (b) 2; (c) 3; and (d) 5 195
Figure 4.148 : Optimised structure of 1 196
Figure 4.149 : Optimized structure of; (a) 6 and (b) 16 198
Figure 4.150 : FTIR intensities for; (a) 6 and (b) 16 199
Univers
ity of
Mala
ya

xxiv
LIST OF TABLES
Table 3.1 : List of main chemicals used in this research 37
Table 4.1 : FTIR data (in cm-1) and assignments 51
Table 4.2 : Crystallographic and structure refinement details of 1, 1a, 2, 3
and 5
96
Table 4.3 : Selected bond lengths (Å) and angles (o) for 1, 1a, 2, 3 and 5 98
Table 4.4 : Precursor complexes of complexes 1 to 5 94
Table 4.5 : Complexes 1 – 5 95
Table 4.6 : FTIR data in (cm-1) and assignments 100
Table 4.7 : Precursor complexes of complexes 6 – 9 124
Table 4.8 : Complexes 6 – 9 124
Table 4.9 : 1H-NMR spectral data for p-CH3(CH2)9OC6H4COOCH3 126
Table 4.10 : FTIR data in (cm-1) and assignments
(R = p-CH3(CH2)nOC6H4)
128
Table 4.11 : 1H-NMR spectral data for
p-CH3(CH2)11OC6H4COOCH2CH3
137
Table 4.12 : Crystallographic data nd refinement details for
p-CH3(CH2)11OC6H4COOCH2CH3
138
Table 4.13 : Selected bond lengths (Å) and angles (o) for
p-CH3(CH2)11OC6H4COOCH2CH3
138
Table 4.14 : 1H-NMR data for p-CH3(CH2)13OC6H4COOCH2CH3 148
Table 4.15 : 1H-NMR data for p-CH3(CH2)15OC6H4COOCH3 156
Table 4.16 : Precursor complexes of complexes 10 - 13 164
Table 4.17 : Complexes 10 – 13 164
Table 4.18 : FTIR data in (cm-1) and assignments 167
Univers
ity of
Mala
ya
xxv
(R = p-CH3(CH2)nOC6H4)
Table 4.19 : Precursor complexes of complexes 14 – 17 192
Table 4.20 : Complexes 14 – 17 193
Table 4.21 : Magneto-structural correlation data for 1, 2, 3 and 5 based on
crystal data
195
Table 4.22 : Comparison of bond lengths (Å) and angles (o) for 1 197
Table 4.23 : Comparison of experimental and calculated data for FTIR
peaks of 6 and 16
200
Table 5.1 : Structural formulae of copper(II) and iron(II)
alkylcarboxylates with bpy as ligand
201
Table 5.2 : Structural formulae of copper(II) and iron(II)
p-alkyloxybenzoates with bpy as ligand
201
Univers
ity of
Mala
ya

xxvi
LIST OF SCHEMES
Scheme 1.1 : Synthetic steps for; (a) Complexes 1-9. R1 =
CH3(CH2)6COO; R2 = CH3(CH2)8COO, R3 =
CH3(CH2)10COO, R4 = CH3(CH2)12COO and R5 =
CH3(CH2)14COO; (b) Complexes 10-18, R1 =
p-CH3(CH2)9OC6H4COO,
R2 = p-CH3(CH2)11OC6H4COO,
R3 = p-CH3(CH2)13OC6H4COO and R4 =
p-CH3(CH2)15OC6H4COO
2
Scheme 2.1 : Reaction equations for the formation of [Cu2(RCOO)4] 5
Scheme 2.2 : Binding modes of carboxylate ions 7
Scheme 2.3 : Classification of liquid crystals 16
Scheme 4.1 : Synthetic steps for [Cu2(RCOO)4(bpy)2], where
R = CH3(CH2)n
49
Scheme 4.2 : Synthetic steps for [Fe(RCOO)2(bpy)], where
R = CH3(CH2)8-14
99
Scheme 4.3 : Effect of heat on the structure and spin state of 6
(R = CH3(CH2)8COO)
107
Scheme 4.4 : Synthetic steps for [Cu2(p-ROC6H4COO)4(bpy)2], where
R = CH3(CH2)n
125
Scheme 4.5 : The change in the structure for 14 on heating 172
Univers
ity of
Mala
ya
1
CHAPTER 1: INTRODUCTION
Metallomesogen is a metal-containing liquid crystal. The main interest in this research
area is to study the possibility of combining the properties of liquid crystals, such as
fluidity, ordered molecular arrangement in one or two dimension and self-healing, with
the properties associated with metal(II) ions, especially those of the transition metals
(colour, magnetism, high electron density, redox ability).
Combining the characteristics between metallomesogen and magnetism showed
a few interesting properties such as paramagnetic liquid crystal and the molecular
orientation in the magnetic field can be controlled [1,2].
The main objectives of this research were to (a) synthesize and characterize
thermally stable, magnetic and mesomorphic complexes of general formulae
[Cu2(RCOO)4(bpy)2] and [Fe2(RCOO)4(bpy)], where R = CH3(CH2)6-14 and
CH3(CH2)9-15C6H4, and bpy = 2,2’-bipyridine (Scheme 1.1), (b) study the
magneto-structural correlation for selected copper(II) complexes and structural
confirmation for selected iron(II) complexes by comparing the theoretical and
experimental FTIR data using density functional theories (DFT), and (c) ascertain if
magnetism and mesomorphism may be tuned by changing the chain length of the
alkylcarboxylate and as well as the effect of inserting an aromatic ring in the
carboxylate ligands. Univers
ity of
Mala
ya

2
(a)
(b)
Scheme 1.1 Synthetic steps for; (a) Complexes 1-9. R1 = CH3(CH2)6COO;
R2 = CH3(CH2)8COO, R3 = CH3(CH2)10COO, R4 = CH3(CH2)12COO and
R5 = CH3(CH2)14COO; (b) Complexes 10-18, R1 = p-CH3(CH2)9OC6H4COO,
R2 = p-CH3(CH2)11OC6H4COO, R3 = p-CH3(CH2)13OC6H4COO and
R4 = p-CH3(CH2)15OC6H4COO
A total of 17 complexes were obtained with four of them single crystals. The
structures of the crystals were determined by X-ray crystallography, while the structures
for non-crystalline complexes were deduced by combining the data from elemental
analyses and spectroscopies (1H-nuclear magnetic resonance for organic ligands, FTIR
and UV-vis). The magnetic susceptibility of the complexes was studied using the Gouy
Univers
ity of
Mala
ya

3
method. The thermal properties were studied using the thermogravimetry (TG), and
mesomorphic properties by differential scanning calorimetry (DSC) and polarizing
optical microscopy (POM).
The findings from this research were published in two ISI journals, and
presented at three conferences, as listed below and shown in Appendix 1.
1. Abdullah, N.; Sharmin, N.; Ozair, L.N.; Nordin, A. R.; Mohd. Nasir, W. S. N.;
Mohamadin, M. I., Structures and mesomorphism of complexes of
tetrakis(4-chlorobenzoate-μ-O, O’)bis(ethanol)dicopper(II) with different N-donor
ligands. Journal of Coordination Chemistry, 2015, 68(8), 1347-1360.
2. Abdullah, N.; Hashim, R.; Ozair, L. N.; Al-Hakeem, Y.; Samsudin, H.; Anita
Marlina, Salim, M.; Mohd. Said, S.; Subramanian, B.; Nordin, A. R., Structural,
mesomorphic, photoluminescence and thermoelectric studies of mononuclear and
polymeric complexes of copper(II) with 2-hexyldecanoato and 4,4’-bipyridine
ligands. Journal of Material Chemistry C, 2015, 3, 11036-11045.
3. Lailatun Nazirah Ozair, Naima Sharmin, Nur Syamimi Ahmad Tajidi, Norbani
Abdullah, Zainudin Arifin, Structural and mesogenic properties of copper(II)
carboxylates with different N-donor ligands, Joint Malaysia-UK Symposium on
Inorganic Chemistry, 5 December, 2013, Deparment of Chemistry, Faculty of
Science, University of Malaya (Poster).
4. Lailatun Nazirah Ozair, Norbani Abdullah, Synthesis, thermal studies and optical
textures of [Cu2(CnH2n+1COO)4(2,2’-bipyridine)2(H2O)2], The International
Conference on Ionic Liquid, 11-13 December, 2013, Langkawi Island, Kedah,
Malaysia (Oral).
5. Lailatun Nazirah Ozair, Norbani Abdullah, Synthesis, structural, optical properties
and magnetism of [Cu2(CnH2n+1COO)4(2,2’-bipyridine)2] and
[Cu2(CnH2n+1OC6H4COO)4(2,2’-bipyridine)2], 2015 International Conference on
Univers
ity of
Mala
ya
4
Engineering, Technology and Applied Science – Fall Session, 10-12 November,
2015, Nagoya, Japan (Oral).
This thesis is divided into five chapters. Chapter 1 briefly introduces the
objectives of the research and list the papers published and presented at conferences.
Chapter 2 covers the theory and literature reviews on copper(II) and iron(II)
carboxylates, focussomg on the structural elucidation followed by magnetic, thermal
and mesomorphic properties. Relevant theoretical concepts are also presented in this
chapter. Chapter 3 presents the experimental part of the research, covering the
materials used in the research, the syntheses of the ligands and complexes, and
instrumental techniques for their characterization. Chapter 4 contains the results and
discussion, and finally Chapter 5 presents the conclusions and suggestions for future
works. A list of references and appendixes are included at the end the thesis.
Univers
ity of
Mala
ya

5
CHAPTER 2: THEORY AND LITERATURE RIVIEW
2.1 Introduction
This chapter covers the chemistry of copper(II) carboxylates and iron(II) carboxylates,
and their complexes with N-donor ligands. It includes the basic concepts used for the
elucidation of their structures, namely single crystal X-ray crystallography, elemental
analyses, FTIR spectroscopy, UV-vis spectroscopy, 1H-NMR spectroscopy, and
magnetism. These are followed by studies on their thermal stability by
thermogravimetry (TG), mesomorphisms by polarizable optical microscopy (POM) and
differential scanning calorimetry (DSC), and finally, the correlation between structure
and the concept of molecular modeling.
2.2 Copper(II) carboxylates
2.2.1 Syntheses and structures
Copper(II) carboxylates are usually dimeric complexes with the general formula,
[Cu2(RCOO)4]. They are easily prepared from cheap non-poisonous starting materials,
usually by reacting a copper(II) salt with a carboxylate ion [3] or from the reaction of
the corresponding carboxylic acids with copper(II) carbonate or copper(II) acetate [4-6]
(Scheme 2.1).
Cu2+ + 2 RCOO- [Cu(RCOO)2]
CuCO3(OH)2 + 2RCOOH [Cu(RCOO)2] + 2H2O + CO2
Cu(CH3COO)2 + 2RCOOH [Cu(RCOO)2] + 2CH3COOH
Scheme 2.1 Reaction equations for the formation of [Cu2(RCOO)4]
Most copper(II) carboxylates were reported to adopt the paddle-wheel structure
[7,8]. In this structure, four bidentate carboxylates ligands were bridged to each
copper(II) and forming a basal plane (Figure 2.1(a)). The free axial position of the
Univers
ity of
Mala
ya

6
copper(II) may be occupied with an oxygen or a nitrogen donor atom from the solvent
molecules such as methanol [4], acetonitrile [9], pyridine [10] (Figure 2.1(b)) or by an
oxygen atom of another dimer forming an oligomeric chain [11] (Figure 2.1(c)).
(a) (b) (c)
Figure 2.1 Paddle-wheel structure of: (a) [Cu2(RCOO)4]; (b) [Cu2(RCOO)4(L)2] and
(c) polymeric [Cu2(RCOO)4]
Carboxylate ions (RCOO-) have varieties of binding modes (Scheme 2.2).
However, the ions mostly show three main bridging coordination modes in copper(II)
complexes, such as syn-syn, syn-anti and anti-anti (Figure 2.2).
Univers
ity of
Mala
ya

7
Scheme 2.2 Binding modes of carboxylate ions
Figure 2.2 Bridging coordination modes of RCOO- ligand
FTIR spectroscopy may be used to deduce the binding mode of RCOO- ion to
the metal centre, based on the difference (Δ) between the values for υasymCOO and
υsymCOO. The value of υasymCOO is normally found in the range of 1678-1541 cm-1, while
that for the υsymCOO is normally found in the range of 1417-1202 cm-1 [12]. The Δ value
of less than 120 cm-1 usually indicates chelating carboxylate group, while value in the
Binding mode
Ionic
Monodentate
Chelating Bridging
Bidentate
Covalent
syn-syn anti-anti syn-anti
Univers
ity of
Mala
ya

8
range of 130-180 cm-1 indicates bridging coordination mode. A complex with a
monodentate carboxylate group has a larger ΔCOO value (>200 cm-1). The general trend
is shown below:
Δ(chelating) < Δ(ionic) < Δ(bridging) < Δ(monodentate)
FTIR spectrum also shows the presence of other functional groups. As
examples, the aliphatic groups (CH2 asymmetric and symmetric) peaks are found in the
range of 2960-2850 cm-1, C=C aromatic peak is found in the range of 1600-1500 cm-1,
and a peak for the C-N bond stretch is found in the range of 1300-1100 cm-1 [13-16].
The geometry of both copper(II) atoms in copper(II) carboxylates with the
paddle-wheel structure is square pyramidal. However, copper(II) is geometrically
plastic, and may show other geometries, such as octahedral (distorted due to Jahn-Teller
effect), square planar and tetrahedral. These geometries may be inferred from the
wavelength of its d-d band in the UV-vis spectrum [17,18].
UV-visible spectroscopy (UV-vis) covers the electromagnetic region from
ultraviolet to near infrared regions (200-1000 nm). An important equation from UV-vis
is known as Beer-Lambert’s law: A = εcl, where A is the absorbance (no unit), ε is the
molar absorptivity (dm3 mol-1 cm-1), c is the molarity of the solution (mol dm-3) and l is
the path length of the light (dimension of a cell or cuvette in cm). The molar
absorptivity is to measure of how strongly a chemical species absorbs light at a given
wavelength.
The d-d transitions refer in the visible region (lower energy) and the intensity is
much lower than the charge transfer (CT) bands. From the crystal-field theory, the five
degenerate d orbitals from the metal ion split in the presence of ligands. The splitting
depends on the metal ion, ligands and geometry of the complex (Figure 2.3).
Univers
ity of
Mala
ya

9
(a)
(b)
(c)
Figure 2.3 The energy of the d-orbitals in an (a) octahedral, (b) square pyramidal,
and (c) square planar geometry
In an octahedral complex, 3d orbitals split into three lower energy t2g orbitals
(xy, xz, yz) and two higher energy eg orbitals (z2, x2-y2). In a square pyramidal complex,
the 3d orbitals split into two lower energy (xz, yx) followed by xy and z2. The highest
energy level was x2-y2, while in a square planar complex, z2 orbital is lower than xy
orbital.
According to the Laporte rule, the d-d transition is forbidden but multiplicity
allowed for the octahedral and square planar complexes (complexes with centre of
eg
t2g
Δo
Univers
ity of
Mala
ya

10
inversion). Thus, these complexes usually show a weak band (ε ~ 1-10 dm3 mol-1 cm-1)
with pale colour. On the other hand, complexes with no centre of inversion such as
tetrahedral and square pyramidal, are not governed by this rule. Therefore they have
stronger band(s) (ε ~ 100 dm3 mol-1 cm-1) and are more intense in colour.
For first-row transition metal complexes, the electronic transitions are d-d and
charge transfer (CT), which may either be ligand-to-metal charge transfer (LMCT) or
metal-to-ligand charge transfer (MLCT). LMCT refers to an electronic excitation from
the ligand orbital (“oxidation”) to the metal orbital (“reduction”), and opposite applies
to the MLCT. The CT bands reside in the high energy region and were highly intense
(ε > 103 dm3 mol-1 cm-1).
For copper(II) carboxylates, the favourable coordination environment at the
metal(II) centre is square pyramidal and the d-d band is expected at about 700 nm [19].
The band for a tetrahedral complex is normally at about 800 nm, and a square planar
complex at about 600 nm [20]. Another characteristic for dinuclear copper(II)
carboxylates is a shoulder band at about 300 nm [21].
Copper(II) ion has one unpaired electron as its valence electronic configuration
is 3d9. Hence, it forms paramagnetic complexes. A paramagnetic material has one or
more unpaired electrons (the overall spin quantum number is be greater than zero).
Magnetic properties of a material can be deduced from the value of its effective
magnetic moment (μeff). This can be calculated from the following equations:
χM = χg x Mr
χMcorr = χM – χD
μeff = 2.828(χmcorr T)½
where χM is molar magnetic susceptibility, χg is gram magnetic susceptibility (reading
from the instrument), Mr is the molar mass, χD is the magnetic susceptibility corrected
Univers
ity of
Mala
ya
11
from half value of Mr x 10-6 [22], χMcorr is the corrected molar magnetic susceptibility,
and T is the absolute temperature.
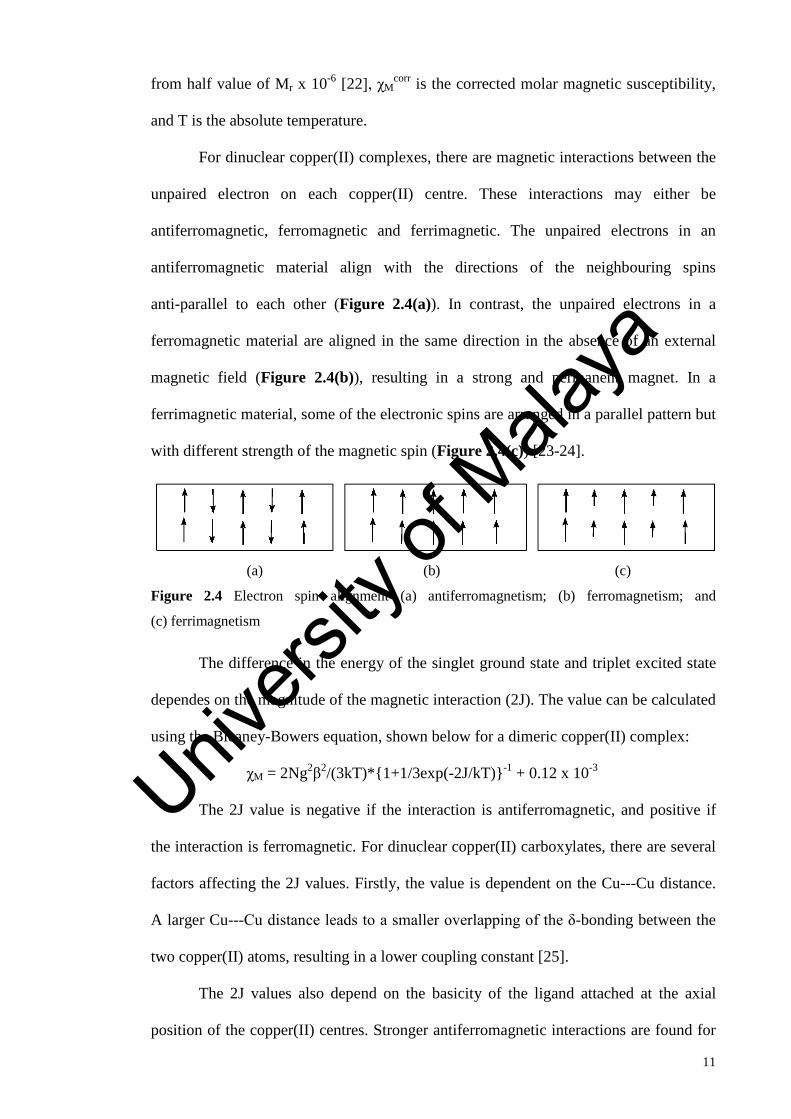
For dinuclear copper(II) complexes, there are magnetic interactions between the
unpaired electron on each copper(II) centre. These interactions may either be
antiferromagnetic, ferromagnetic and ferrimagnetic. The unpaired electrons in an
antiferromagnetic material align with the directions of the neighbouring spins
anti-parallel to each other (Figure 2.4(a)). In contrast, the unpaired electrons in a
ferromagnetic material are aligned in the same direction in the absence of an external
magnetic field (Figure 2.4(b)), resulting in a strong and permanent magnet. In a
ferrimagnetic material, some of the electronic spins are arranged in a parallel pattern but
with different strength of the magnetic spin (Figure 2.4(c)) [23-24].
(a) (b) (c)
Figure 2.4 Electron spin alignment (a) antiferromagnetism; (b) ferromagnetism; and
(c) ferrimagnetism
The difference in the energy of the singlet ground state and triplet excited state
dependes on the magnitude of the magnetic interaction (2J). The value can be calculated
using the Bleaney-Bowers equation, shown below for a dimeric copper(II) complex:
χM = 2Ng2β2/(3kT)*{1+1/3exp(-2J/kT)}-1 + 0.12 x 10⁻³
The 2J value is negative if the interaction is antiferromagnetic, and positive if
the interaction is ferromagnetic. For dinuclear copper(II) carboxylates, there are several
factors affecting the 2J values. Firstly, the value is dependent on the Cu---Cu distance.
A larger Cu---Cu distance leads to a smaller overlapping of the δ-bonding between the
two copper(II) atoms, resulting in a lower coupling constant [25].
The 2J values also depend on the basicity of the ligand attached at the axial
position of the copper(II) centres. Stronger antiferromagnetic interactions are found for
Univers
ity of
Mala
ya
12
complexes with weaker axial ligands (weaker σ donation) [26]. For example, the 2J
value for [Cu2(O2CCH3)4(H2O)2] with H2O ligands coordinated at both axial positions,
was -299 cm-1, but the value was lower (2J = -284 cm-1) when H2O was replaced with
NH3, indicating weaker antiferromagnetic interaction [27].
The 2J values also depend on the substituents at the aromatic ring of
arylcarboxylato ligands. For example, Rodríguez-Fortea et al., showed that
electron-withdrawing groups reduced the strength of the exchange coupling [27].
Another factor affecting the 2J values is the Cu-O bridging bonds. Basically, the
super-exchange pathway mechanism was through the Cu-O-C(R)-O-Cu bridges [28]. A
strongly bonded R to COO results in a stronger Cu-O bond in the CuO4 basal plane.
Thus, when the Cu-O bond decreased, the coupling constant value increased. An
antiferromagnetic interaction is found in a complex with Cu-O-Cu angle (θ),
95.34o < θ < 101.9o, and ferromagnetic interaction when the angle is larger than 101.9o
[29].
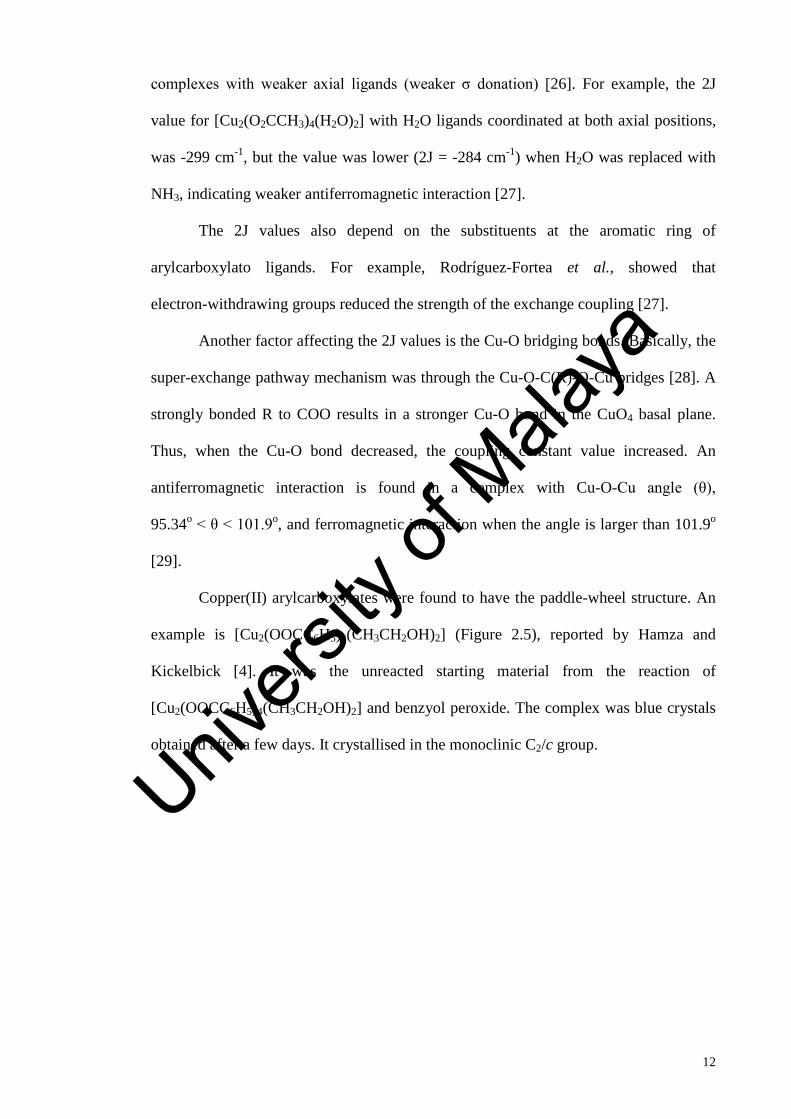
Copper(II) arylcarboxylates were found to have the paddle-wheel structure. An
example is [Cu2(OOCC6H5)4(CH3CH2OH)2] (Figure 2.5), reported by Hamza and
Kickelbick [4]. It was the unreacted starting material from the reaction of
[Cu2(OOCC6H5)4(CH3CH2OH)2] and benzyol peroxide. The complex was blue crystals
obtained after a few days. It crystallised in the monoclinic C2/c group.
Univers
ity of
Mala
ya
13
Figure 2.5 ORTEP view of the molecular structure of
[Cu2(OOCC6H5)4(CH3CH2OH)2] displaying the thermal ellipsoids at 30%
probability. H atoms are omitted for clarity [4]
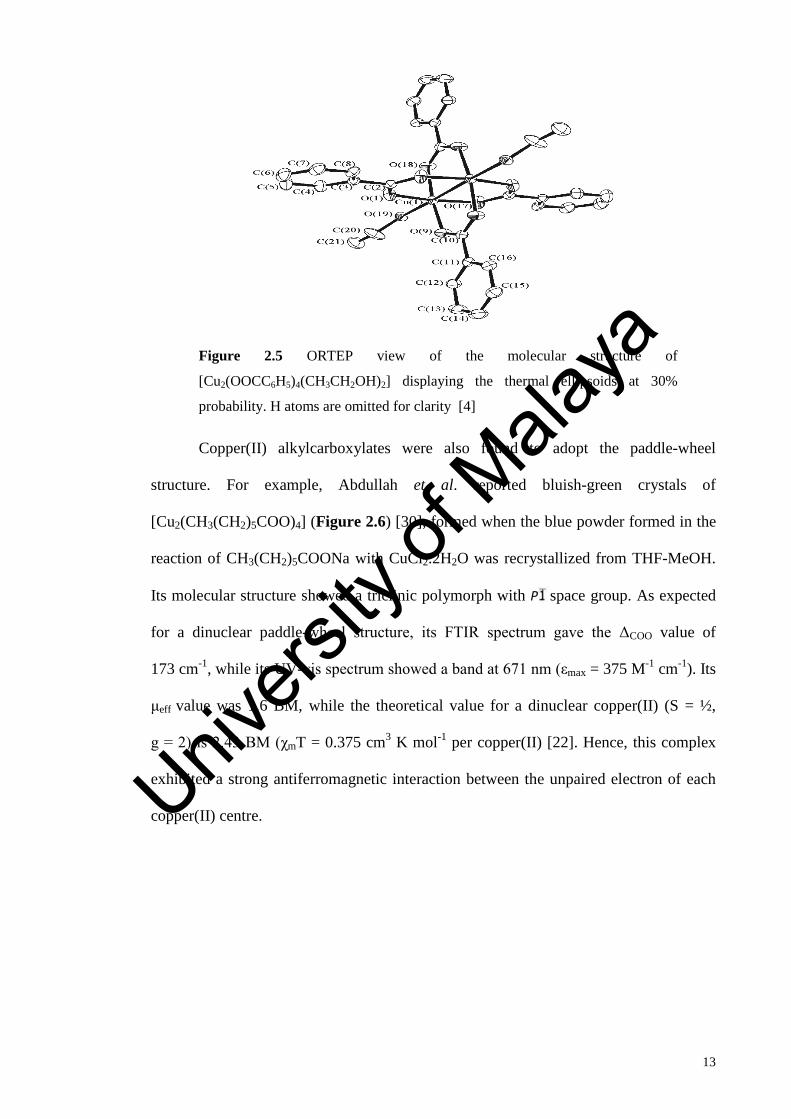
Copper(II) alkylcarboxylates were also found to adopt the paddle-wheel
structure. For example, Abdullah et al. reported bluish-green crystals of
[Cu2(CH3(CH2)5COO)4] (Figure 2.6) [30], formed when the blue powder formed in the
reaction of CH3(CH2)5COONa with CuCl2.2H2O was recrystallized from THF-MeOH.
Its molecular structure showed a triclinic polymorph with P space group. As expected
for a dinuclear paddle-wheel structure, its FTIR spectrum gave the ΔCOO value of
173 cm-1, while its UV-vis spectrum showed a band at 671 nm (εmax = 375 M-1 cm-1). Its
μeff value was 1.6 BM, while the theoretical value for a dinuclear copper(II) (S = ½,
g = 2) is 2.43 BM (χmT = 0.375 cm3 K mol-1 per copper(II) [22]. Hence, this complex
exhibited a strong antiferromagnetic interaction between the unpaired electron of each
copper(II) centre. Univers
ity of
Mala
ya
14
Figure 2.6 Crystal structure of [Cu2(CH3(CH2)5COO)4] [30]
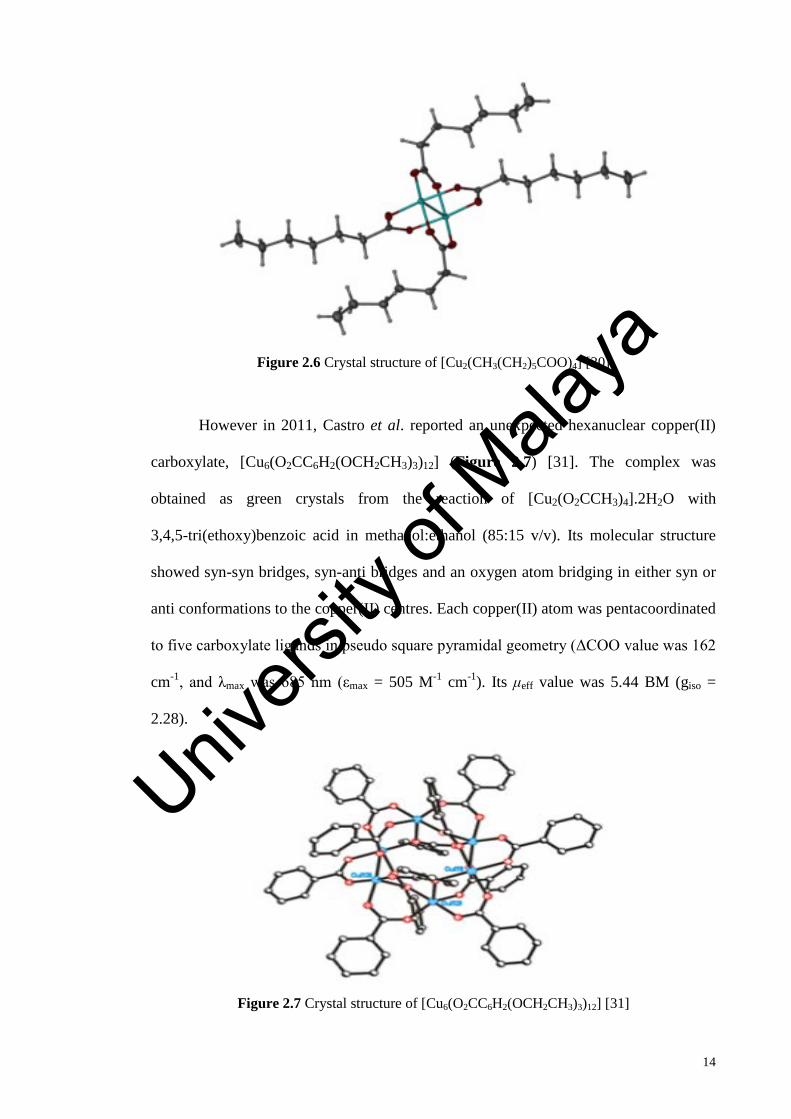
However in 2011, Castro et al. reported an unexpected hexanuclear copper(II)
carboxylate, [Cu6(O2CC6H2(OCH2CH3)3)12] (Figure 2.7) [31]. The complex was
obtained as green crystals from the reaction of [Cu2(O2CCH3)4].2H2O with
3,4,5-tri(ethoxy)benzoic acid in methanol:ethanol (85:15 v/v). Its molecular structure
showed syn-syn bridges, syn-anti bridges and an oxygen atom bridging in either syn or
anti conformations to the copper(II) centres. Each copper(II) atom was pentacoordinated
to five carboxylate ligands in pseudo square pyramidal geometry (ΔCOO value was 162
cm-1, and λmax was 685 nm (εmax = 505 M-1 cm-1). Its μeff value was 5.44 BM (giso =
2.28).
Figure 2.7 Crystal structure of [Cu6(O2CC6H2(OCH2CH3)3)12] [31]
Univers
ity of
Mala
ya

15
2.2.2 Thermal and mesomorphic properties
Copper(II) carboxylates were reported to be thermally stable, and when the ligands are
alkylcarboxylate ions or have alkyl(oxy) chains, to exhibit liquid crystal properties. The
thermal stability of a complex may be determined by thermogravimetry (TG). In this
technique, the percentage weight loss of a sample is measured as it is heated (usually up
to 1000 oC) in a controlled N2 atmosphere. Most copper(II) carboxylates decomposed at
about 200 oC due to the decarboxylation of the ligand and loss of CO2 [32]. For
example, [Cu2(CH3(CH2)5COO)4] was stable up to 280 oC [30].
Liquid crystal (LC) is a state of matter between the solid and liquid states.
Hence, LC materials are fluidic but their molecules arranged in an orderly manner as in
solids (Figure 2.8).
Solid Liquid crystal Liquid
Figure 2.8 Molecular arrangement in a solid, a liquid crystal and a liquid
Friedrich Reinitzer discovered LC in 1888 when he claimed that cholesteryl
benzoate has two distinct melting points. During his experiment he observed that the
compound did not melt directly on heating, but instead changed into a hazy liquid
(mesophase), and only became a clear transparent liquid (isotropic) on further heating.
This behavior is characteristic of a LC. The temperature at which a material changes to
a mesophase (M) is known as its melting temperature, and the temperature when a
mesophase changes to an isotropic liquid (I) is known as its clearing temperature.
There are two general types of liquid crystals: lyotropic LC and thermotropic,
LC (Scheme 2.3). For lyotropic LC, the mesomorphic properties were observed in
solutions and controlled by concentrations, while for thermotropic LC, the
Univers
ity of
Mala
ya

16
mesomorphic properties were induced by heat. Thermotropic LC can be further divided
into several types, depending on the shapes of the molecules, specifically rod-like for
calamitic LC and disc-like for discotic LC.
Scheme 2.3 Classification of liquid crystals
In designing liquid crystals, the mesogens require long alkyl(oxy) chain
(CnH2n+1(O); n > 8). Calamitic LC are compounds with rod-like structures, and
exhibited nematic and smectic mesophases (Figure 2.9). The nematic mesophase (N) is
the least ordered and very fluid, and usually displayed a schlieren texture when viewed
under a polarizing optical microscope (Figure 2.10(a)) [33]. On the other hand, the
smectic mesophase is more positionally oriented and ordered. Two most commonly
found smectic mesophases are smectic A (SmA) (Figure 2.10(b)) and smectic C (SmC)
(Figure 2.10(c)).
Figure 2.9 An example of a molecular structure for calamitic LC
Liquid Crystal
Lyotropic
LC-polymer Discotic Calamitic
Thermotropic
• Smectic
• Nematic
Chl t i
• Nematic
• Discotic
Univers
ity of
Mala
ya

17
(a)
(b)
(c)
Figure 2.10 Examples of calamitic LC textures (a) nematic; (b) smectic A; and (c) smectic C
Discotic mesogens have disc-like structures, and exhibited discotic nematic (ND)
and columnar (Col) mesophases (Figure 2.11).
Figure 2.11 An example of molecular structure for discotic LC (R = p-CnH2nC6H4CO-)
Univers
ity of
Mala
ya

18
In the ND mesophase, which is not commonly observed, the molecules were
aligned in a parallel direction and can rotate around the molecular long axis (hence,
there is orientational but with no positional order). In the columnar mesophase, the
molecules stack in a column and give rise to different arrangements, such as hexagonal
columnar (Colh), rectangular columnar (Colr) and tetragonal columnar (Coltet). The
columns formed are parallel to one another and periodic in two-dimensional array
(Figure 2.12) [34].
Figure 2.12 An example of Colh mesophase
The mesogenic properties of a material are normally studied by differential
scanning calorimetry (DSC) and polarizing optical microscopy (POM).
DSC is used to study the thermal transition, and give informations such as glass
transition temperature, melting temperature and clearing temperature [35]. A DSC scan
provides an accurate method of measuring the heat capacities and enthalpy changes
(ΔH). The enthalpy of transition (area under a curve) can be expressed using the
formula below:
An endothermic process (absorption of the heat) may be due to melting,
clearing, and chemical reaction, while an exothermic process may be due to
crystallization and bond formation [36-38] (Figure 2.13).
Univers
ity of
Mala
ya
19
Figure 2.13 An example of a DSC scan
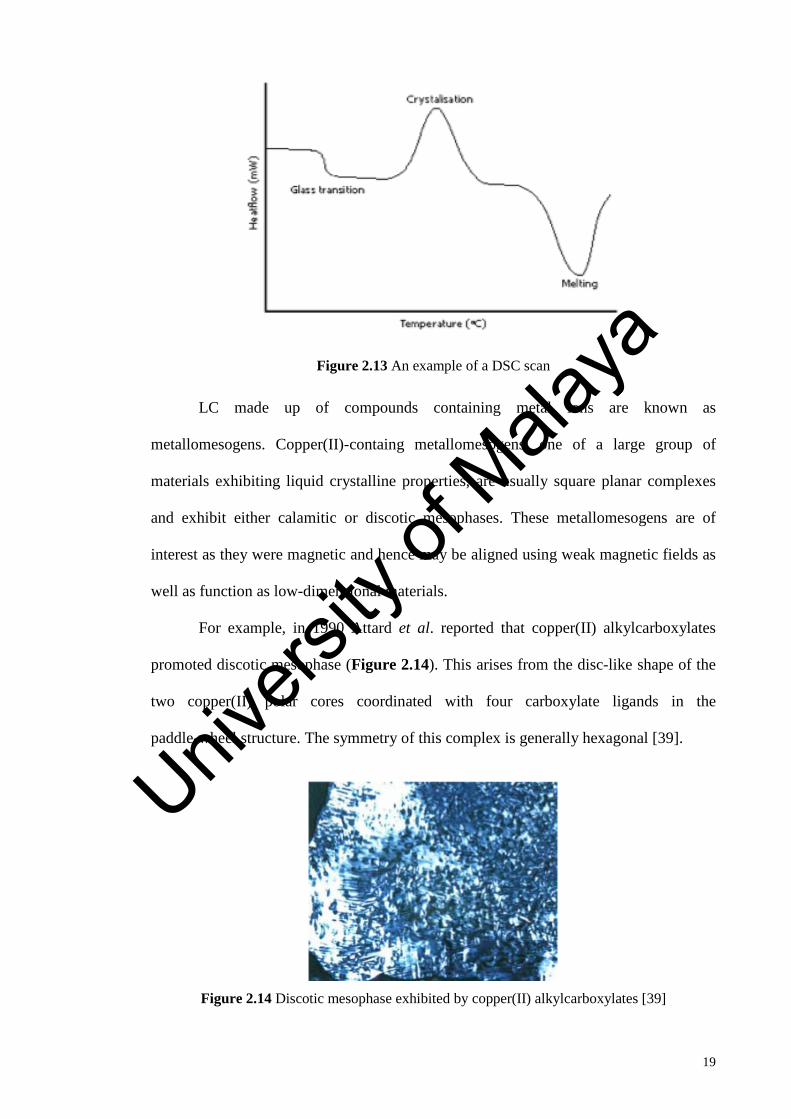
LC made up of compounds containing metal ions are known as
metallomesogens. Copper(II)-containg metallomesogens, one of a large group of
materials exhibiting liquid crystalline properties, are usually square planar complexes
and exhibit either calamitic or discotic mesophases. These metallomesogens are of
interest as they were magnetic and hence may be aligned using weak magnetic fields as
well as function as low-dimensional materials.
For example, in 1990 Attard et al. reported that copper(II) alkylcarboxylates
promoted discotic mesophase (Figure 2.14). This arises from the disc-like shape of the
two copper(II) polar cores coordinated with four carboxylate ligands in the
paddle-wheel structure. The symmetry of this complex is generally hexagonal [39].
Figure 2.14 Discotic mesophase exhibited by copper(II) alkylcarboxylates [39]
Univers
ity of
Mala
ya

20
Ramos et al. reported green-blue crystals of
tetrakis(μ-o-CH3(CH2)8COO)4dicopper(II) (Figure 2.15), prepared from the reaction of
decanoic acid with copper(II) carbonate [40]. The complex crystallised in the triclinic
P space group. Its structure was paddle wheel (CuO4O chromophore) [41]. The dimers
were linked into an oligomeric chain by Cu-O bonds (axial ligation). The ΔCOO value
from its FTIR spectrum was 173 cm-1, in agreement with the bridging bidentate
carboxylato ligand as revealed by its crystal structure. The complex melted at room
temperature and decomposed at 260 oC (below its clearing temperature). The DSC
showed an exotherms at 80 oC with ΔH value of 27.4 kJ mol-1 Hence, POM observation
failed to capture any liquid crystal images. However by adopting the technique by
Demus et al. [42], which is evaporating solvent at the liquid crystal phase temperature, a
visual observation of mesophase was carried out with the microscope. This method
showed a birefringent fluid phase without any texture as a proof of crystal phase. A
typical hexagonal columnar discotic liquid crystal was observed (Figure 2.16).
Figure 2.15 Molecular structure of tetrakis(μ-o-decanoato)dicopper(II), showing
two paddle-wheel units linked through Cu-O(axial) bonds [40]
Univers
ity of
Mala
ya
21
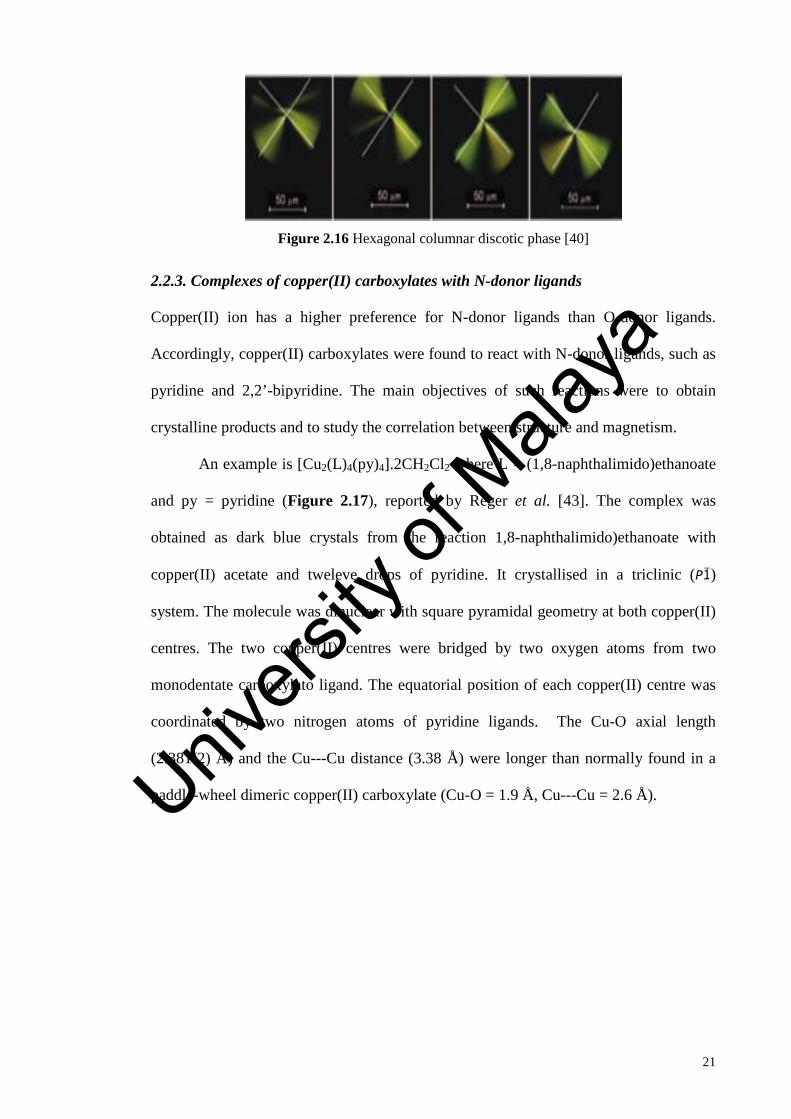
Figure 2.16 Hexagonal columnar discotic phase [40]
2.2.3. Complexes of copper(II) carboxylates with N-donor ligands
Copper(II) ion has a higher preference for N-donor ligands than O-donor ligands.
Accordingly, copper(II) carboxylates were found to react with N-donor ligands, such as
pyridine and 2,2’-bipyridine. The main objectives of such reactions were to obtain
crystalline products and to study the correlation between structure and magnetism.
An example is [Cu2(L)4(py)4].2CH2Cl2 where L = (1,8-naphthalimido)ethanoate
and py = pyridine (Figure 2.17), reported by Reger et al. [43]. The complex was
obtained as dark blue crystals from the reaction 1,8-naphthalimido)ethanoate with
copper(II) acetate and tweleve drops of pyridine. It crystallised in a triclinic (P )
system. The molecule was dinuclear with square pyramidal geometry at both copper(II)
centres. The two copper(II) centres were bridged by two oxygen atoms from two
monodentate carboxylato ligand. The equatorial position of each copper(II) centre was
coordinated by two nitrogen atoms of pyridine ligands. The Cu-O axial length
(2.381(2) Å) and the Cu---Cu distance (3.38 Å) were longer than normally found in a
paddle-wheel dimeric copper(II) carboxylate (Cu-O = 1.9 Å, Cu---Cu = 2.6 Å). Univers
ity of
Mala
ya

22
Figure 2.17 Molecular structure of [Cu2(L)4(py)4].2CH2Cl2 [43]
The binding mode of the carboxylato ligand in [Cu2(L)4(py)4].2CH2Cl2 was
syn-anti. Its magnetic data suggested a weak antiferromagnetic interaction
(J = -1.7 cm-1). Its TGA data showed that it was thermally stable up to 120 oC with a
total weight loss of 84.5% due to loss of two pyridine molecules and four carboxylato
ligands (calcd: 84.1%). The final residual weight of CuO at temperatures above 551 oC
was 10.0% (calcd: 10.2%).
Another example is [Cu2(CH3(CH2)14COO)4(2,2’-bipyridine)2].2CH3OH
(Figure 2.18), reported by Nazeer et al. [44]. It was obtained as dark blue crystals from
the reaction of [Cu2(p-H2NC6H4COO)2(CH3(CH2)14COO)2] with 2,2’-bipyridine. Its
molecules crystallised in a triclinic P crystal system, and showed syn-anti coordination
mode of the carboxylato ligand. Univers
ity of
Mala
ya
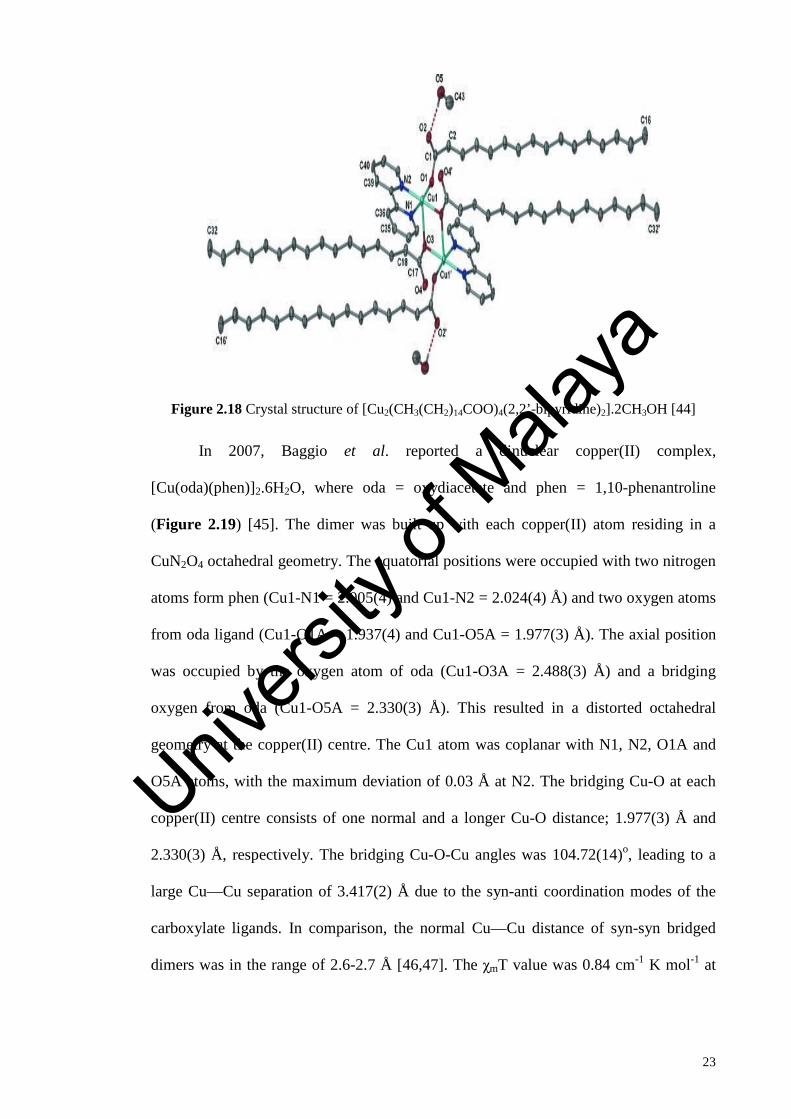
23
Figure 2.18 Crystal structure of [Cu2(CH3(CH2)14COO)4(2,2’-bipyridine)2].2CH3OH [44]
In 2007, Baggio et al. reported a dinuclear copper(II) complex,
[Cu(oda)(phen)]2.6H2O, where oda = oxydiacetate and phen = 1,10-phenantroline
(Figure 2.19) [45]. The dimer was built up with each copper(II) atom residing in a
CuN2O4 octahedral geometry. The equatorial positions were occupied with two nitrogen
atoms form phen (Cu1-N1 = 2.005(4) and Cu1-N2 = 2.024(4) Å) and two oxygen atoms
from oda ligand (Cu1-O1A = 1.937(4) and Cu1-O5A = 1.977(3) Å). The axial position
was occupied by the oxygen atom of oda (Cu1-O3A = 2.488(3) Å) and a bridging
oxygen from oda (Cu1-O5A = 2.330(3) Å). This resulted in a distorted octahedral
geometry at the copper(II) centre. The Cu1 atom was coplanar with N1, N2, O1A and
O5A atoms, with the maximum deviation of 0.03 Å at N2. The bridging Cu-O at each
copper(II) centre consists of one normal and a longer Cu-O distance; 1.977(3) Å and
2.330(3) Å, respectively. The bridging Cu-O-Cu angles was 104.72(14)o, leading to a
large Cu—Cu separation of 3.417(2) Å due to the syn-anti coordination modes of the
carboxylate ligands. In comparison, the normal Cu—Cu distance of syn-syn bridged
dimers was in the range of 2.6-2.7 Å [46,47]. The χmT value was 0.84 cm-1 K mol-1 at
Univers
ity of
Mala
ya

24
50K (μeff = 2.6 BM). This indicates a ferromagnetic coupling between two copper(II)
centres.
Figure 2.19 Crystal structure of [Cu(oda)(phen)]2.6H2O [45]
Another crystal was [Cu2(3-HOC6H4COO)4(4-acetylpyridine)2].6H2O (Figure
2.20), reported by Youngme et al. [25]. In this complex, both copper(II) atoms were
linked by four carboxylato ligands in the syn-syn configuration (ΔCOO = 173 cm-1). The
pyridyl nitrogen atom was axially coordinated completing the square pyramidal
coordination geometry (λmax = 743 nm). The important bond distances were
Cu–O = 1.958 to 1.970 Å, Cu–N = 2.181(2) Å, and Cu...Cu = 2.654(1) Å. These were in
the ranges for typical dinuclear paddle-wheel units in Cu(II) carboxylates. At 350 K, the
χmT value was 0.575 cm3 K mol-1, which was lower than the spin-only value for two
non-interacting Cu(II) ion (0.75 cm3 K mol-1). The χmT value decreased to 0.014
cm3 K mol-1 at 50 K, and the J value was -278.5 cm-1, indicating a strong
antiferromagnetic interaction.
Univers
ity of
Mala
ya
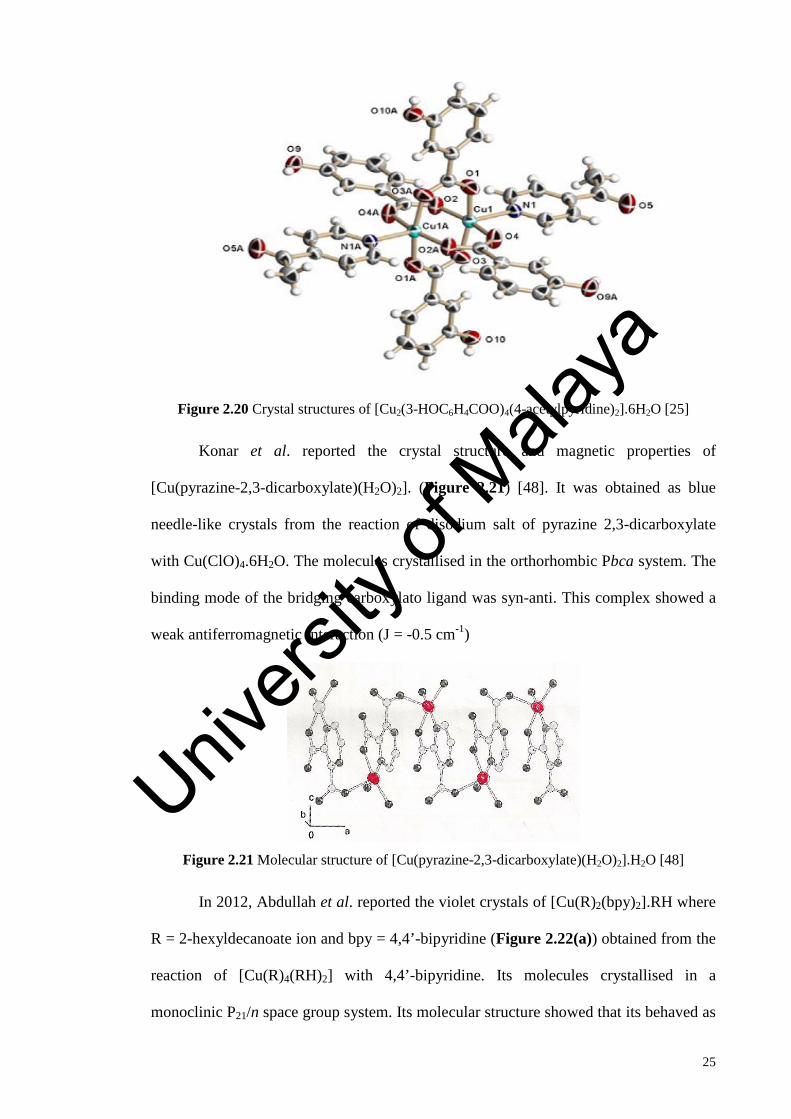
25
Figure 2.20 Crystal structures of [Cu2(3-HOC6H4COO)4(4-acetylpyridine)2].6H2O [25]
Konar et al. reported the crystal structure and magnetic properties of
[Cu(pyrazine-2,3-dicarboxylate)(H2O)2]. (Figure 2.21) [48]. It was obtained as blue
needle-like crystals from the reaction of disodium salt of pyrazine 2,3-dicarboxylate
with Cu(ClO)4.6H2O. The molecules crystallised in the orthorhombic Pbca system. The
binding mode of the bridging carboxylato ligand was syn-anti. This complex showed a
weak antiferromagnetic interaction (J = -0.5 cm-1)
Figure 2.21 Molecular structure of [Cu(pyrazine-2,3-dicarboxylate)(H2O)2].H2O [48]
In 2012, Abdullah et al. reported the violet crystals of [Cu(R)2(bpy)2].RH where
R = 2-hexyldecanoate ion and bpy = 4,4’-bipyridine (Figure 2.22(a)) obtained from the
reaction of [Cu(R)4(RH)2] with 4,4’-bipyridine. Its molecules crystallised in a
monoclinic P21/n space group system. Its molecular structure showed that its behaved as
Univers
ity of
Mala
ya
26
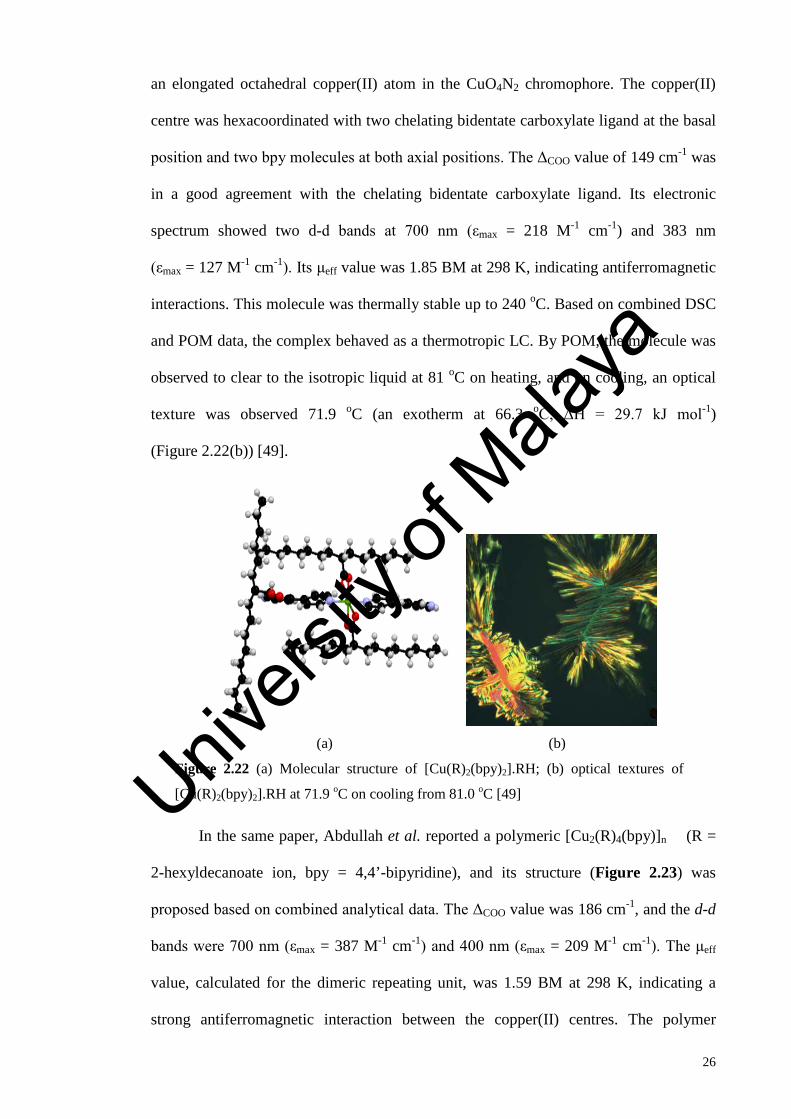
an elongated octahedral copper(II) atom in the CuO4N2 chromophore. The copper(II)
centre was hexacoordinated with two chelating bidentate carboxylate ligand at the basal
position and two bpy molecules at both axial positions. The ΔCOO value of 149 cm-1 was
in a good agreement with the chelating bidentate carboxylate ligand. Its electronic
spectrum showed two d-d bands at 700 nm (εmax = 218 M-1 cm-1) and 383 nm
(εmax = 127 M-1 cm-1). Its μeff value was 1.85 BM at 298 K, indicating antiferromagnetic
interactions. This molecule was thermally stable up to 240 oC. Based on combined DSC
and POM data, the complex behaved as a thermotropic LC. By POM, the molecule was
observed to clear to the isotropic liquid at 81 oC on heating, and on cooling, an optical
texture was observed 71.9 oC (an exotherm at 66.3 oC, ΔH = 29.7 kJ mol-1)
(Figure 2.22(b)) [49].
(a) (b)
Figure 2.22 (a) Molecular structure of [Cu(R)2(bpy)2].RH; (b) optical textures of
[Cu(R)2(bpy)2].RH at 71.9 oC on cooling from 81.0 oC [49]
In the same paper, Abdullah et al. reported a polymeric [Cu2(R)4(bpy)]n (R =
2-hexyldecanoate ion, bpy = 4,4’-bipyridine), and its structure (Figure 2.23) was
proposed based on combined analytical data. The ΔCOO value was 186 cm-1, and the d-d
bands were 700 nm (εmax = 387 M-1 cm-1) and 400 nm (εmax = 209 M-1 cm-1). The μeff
value, calculated for the dimeric repeating unit, was 1.59 BM at 298 K, indicating a
strong antiferromagnetic interaction between the copper(II) centres. The polymer
Univers
ity of
Mala
ya

27
suffered a major weight loss of 90.7% at 220 oC indicating the decomposition of all
carboxylate and bpy ligands (calcd; 90.3%). Its DSC showed a strong endothermic peak
at 48.3 oC (ΔH = 35.7 kJ mol-1) and two weak exothermic peaks at 131.7 oC and
151.7 oC on heating, and three corresponding exothermic peaks with similar enthalpies
on cooling. Its POM photomicrographs showed that the molecule started to clear to an
isotropic liquid at 184 oC, and dendritic optical textures of ColH mesophase was
observed on cooling at 180.6 oC (Figure 2.24(a)). This mesophase then coalesced to a
mosaic texture with homeotropic region on cooling at 133 oC (Figure 2.24(b)).
However when a new sample was heated to 190 oC (above its isotropization
temperature), dendritic textures reappeared at almost the same temperature as before on
cooling, followed by nematic globules (ColN) at 160 oC (Figure 2.24(c)).
Figure 2.23 Proposed structure of [Cu2(R)4(bpy)]n [49]
Univers
ity of
Mala
ya
28
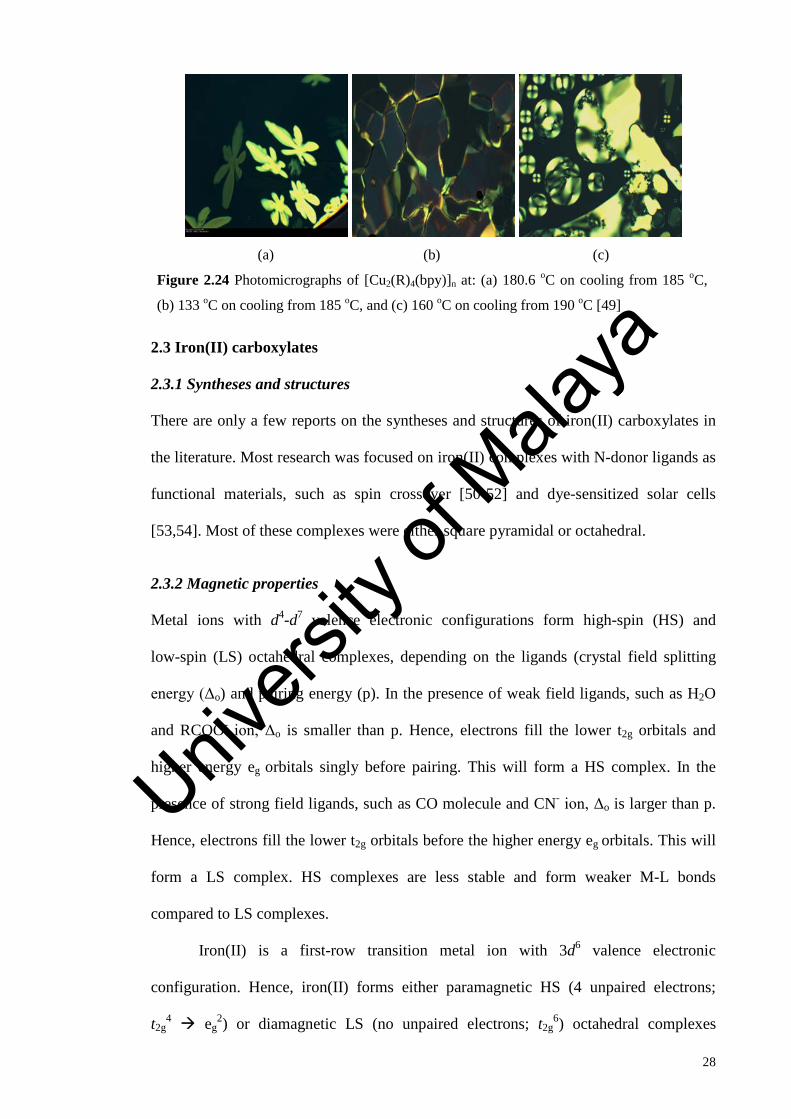
(a) (b) (c)
Figure 2.24 Photomicrographs of [Cu2(R)4(bpy)]n at: (a) 180.6 oC on cooling from 185 oC,
(b) 133 oC on cooling from 185 oC, and (c) 160 oC on cooling from 190 oC [49]
2.3 Iron(II) carboxylates
2.3.1 Syntheses and structures
There are only a few reports on the syntheses and structures of iron(II) carboxylates in
the literature. Most research was focused on iron(II) complexes with N-donor ligands as
functional materials, such as spin crossover [50-52] and dye-sensitized solar cells
[53,54]. Most of these complexes were either square pyramidal or octahedral.
2.3.2 Magnetic properties
Metal ions with d4-d7 valence electronic configurations form high-spin (HS) and
low-spin (LS) octahedral complexes, depending on the ligands (crystal field splitting
energy (Δo) and pairing energy (p). In the presence of weak field ligands, such as H2O
and RCOO- ion, Δo is smaller than p. Hence, electrons fill the lower t2g orbitals and
higher energy eg orbitals singly before pairing. This will form a HS complex. In the
presence of strong field ligands, such as CO molecule and CN- ion, Δo is larger than p.
Hence, electrons fill the lower t2g orbitals before the higher energy eg orbitals. This will
form a LS complex. HS complexes are less stable and form weaker M-L bonds
compared to LS complexes.
Iron(II) is a first-row transition metal ion with 3d6 valence electronic
configuration. Hence, iron(II) forms either paramagnetic HS (4 unpaired electrons;
t2g4 eg
2) or diamagnetic LS (no unpaired electrons; t2g6) octahedral complexes
Univers
ity of
Mala
ya
29
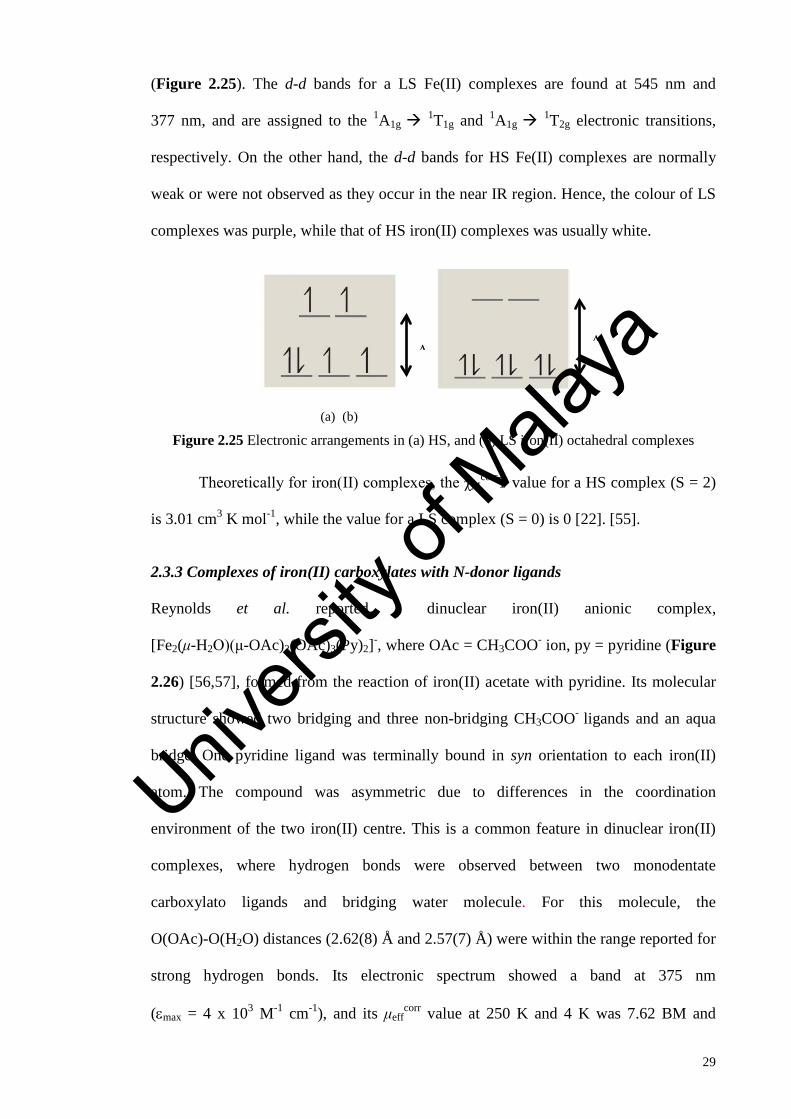
(Figure 2.25). The d-d bands for a LS Fe(II) complexes are found at 545 nm and
377 nm, and are assigned to the 1A1g 1T1g and 1A1g 1T2g electronic transitions,
respectively. On the other hand, the d-d bands for HS Fe(II) complexes are normally
weak or were not observed as they occur in the near IR region. Hence, the colour of LS
complexes was purple, while that of HS iron(II) complexes was usually white.
(a) (b)
Figure 2.25 Electronic arrangements in (a) HS, and (b) LS iron(II) octahedral complexes
Theoretically for iron(II) complexes, the χMcorrT value for a HS complex (S = 2)
is 3.01 cm3 K mol-1, while the value for a LS complex (S = 0) is 0 [22]. [55].
2.3.3 Complexes of iron(II) carboxylates with N-donor ligands
Reynolds et al. reported a dinuclear iron(II) anionic complex,
[Fe2(μ-H2O)(μ-OAc)2(OAc)3(Py)2]-, where OAc = CH3COO- ion, py = pyridine (Figure
2.26) [56,57], formed from the reaction of iron(II) acetate with pyridine. Its molecular
structure showed two bridging and three non-bridging CH3COO- ligands and an aqua
bridge. One pyridine ligand was terminally bound in syn orientation to each iron(II)
atom. The compound was asymmetric due to differences in the coordination
environment of the two iron(II) centre. This is a common feature in dinuclear iron(II)
complexes, where hydrogen bonds were observed between two monodentate
carboxylato ligands and bridging water molecule. For this molecule, the
O(OAc)-O(H2O) distances (2.62(8) Å and 2.57(7) Å) were within the range reported for
strong hydrogen bonds. Its electronic spectrum showed a band at 375 nm
(εmax = 4 x 10³ M-1 cm-1), and its μeffcorr value at 250 K and 4 K was 7.62 BM and
Δ
Δ
Univers
ity of
Mala
ya
30
4.37 BM, respectively. The g value in the dimer was 2.2, which is close to the expected
values for 2.8. The very weak anti-ferromagnetic coupling in this complex was as
expected for an aqua-bridged dinuclear complex.
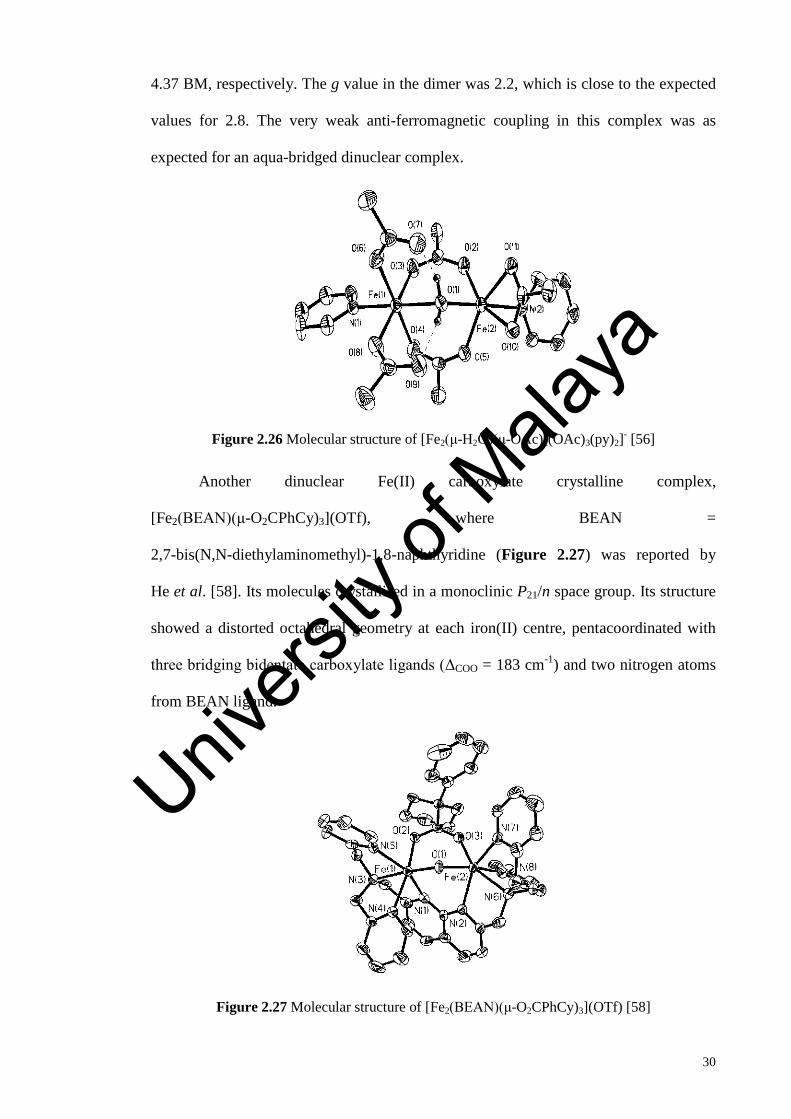
Figure 2.26 Molecular structure of [Fe2(μ-H2O)(μ-OAc)2(OAc)3(py)2]- [56]
Another dinuclear Fe(II) carboxylate crystalline complex,
[Fe2(BEAN)(μ-O2CPhCy)3](OTf), where BEAN =
2,7-bis(N,N-diethylaminomethyl)-1,8-naphthyridine (Figure 2.27) was reported by
He et al. [58]. Its molecules crystallised in a monoclinic P21/n space group. Its structure
showed a distorted octahedral geometry at each iron(II) centre, pentacoordinated with
three bridging bidentate carboxylate ligands (ΔCOO = 183 cm-1) and two nitrogen atoms
from BEAN ligand.
Figure 2.27 Molecular structure of [Fe2(BEAN)(μ-O2CPhCy)3](OTf) [58]
Univers
ity of
Mala
ya

31
Another dinuclear iron(II) complex,
[Fe2(μ-H2O)(μ-O2CCF3)2(μ-XDK)(TMEN)2], where XDK = m-xylenediamine
Bis(Kemp’s triacid imide), and TMEN = N,N,N',N'-tetramethyl-1-diaminoethane, was
reported by Edit et al. [59]. In this complex, the iron(II) centres have an octahedral
coordination (Figure 2.28), and were hexacoordinated with two bridging carboxylates
ligands, a bridging water molecule, two nitrogen atoms from the TMEN ligand, and the
XDK was monodentically bonded to the iron(II) centre.
Figure 2.28 Molecular structure of Fe2(μ-H2O)(μ-O2CCF3)2(μ-XDK)(TMEN)2] [59]
In 2014, Abdullah et al., reported a dinuclear iron(II) complex,
[Fe2(CH3COO)4(L)2], where L = (4,4’-bis[3,4-bis(tetradecyloxy)stryl-2,2’-bipyridine),
formed as dark purple powder from the reaction of [Fe(CH3COO)2] with ascorbic acid
and L [60]. Its proposed structure (Figure 2.29) was based on combined analytical data.
NN
OR
OR
ROOR
NN
ORRO
OROR
OO
Fe Fe
O
O
O
O
OO
Figure 2.29 Proposed structure of [Fe2(CH3COO)4(L)2] (R = CH3(CH2)13) [60]
Univers
ity of
Mala
ya

32
The results of the CHN elemental analyses for the above complex, C, 74.96%;
H, 11.25%; N, 1.84% were in good agreement with the calculated values C, 74.29%;
H, 10.48%; N, 2.01%. The ΔCOO values from its FTIR spectrum were 130 cm-1 and
206 cm-1, suggesting bidentate chelating and monodentate bridging CH3COO- ligands,
respectively. Its electronic absorption spectrum showed MLCT peak at 544 nm
(εmax = 2194 M-1 Cm-1), assigned to LS iron(II) (electronic transition, t2g π*) [61],
and two d-d peaks at 1412 nm (εmax = 25.6 M-1 cm-1) and 1755 (25.6 M-1 cm-1) assigned
to HS iron(II) (electronic transition, 5T2g 5Eg). Weaker Fe-N and Fe-O bonds in the
distorted octahedral N2O4 coordination to iron(II) centres contributed to the splitting of
the d-d peaks for HS iron(II). A d-d peak for LS iron(II) was found as a shoulder on the
strong MLCT peak was assigning for 1A1g 1T1g. The spectral data suggested the
presence of HS and LS iron(II) atoms in the complex.
The χMT values for the above dimeric complex decreased from 3.35 cm3 K mol-1
at 294 K to 1.12 cm3 K mol-1 and 0.66 cm3 K mol-1 at 8.1 K and 2 K, respectively. From
the data, it was inferred that the complex was made up of 56.8 % HS and 43.2% LS
iron(II) atoms at 294 K (the theoretical χMT value for a dinuclear octahedral HS iron(II)
at 294 K was 6.0 cm3 K mol-1). Its g value was 1.9, which was lower than the theoretical
value (2.0), suggesting an axially distorted octahedral geometry. The J value was
-81.2 cm-1, indicating an antiferromagnetic interaction between two iron(II) centres,
postulated to occur through the carboxylate bridges [60]
The thermal properties of the above complex was later reported by the same
authors in 2015 [62]. Its TG trace showed a major weight loss of 97.5% (calcd; 95.6%)
from 199 oC to 612 oC. its DSC scans was done in two cycles (heat-cool-heat-cool)
showed two overlapping endotherms at Trange = 57.2 – 74.2 oC (ΔHcombined = +127.6
kJ mol-1) and a broad exotherm at 48.8 oC (ΔH = -189.9 kJ mol-1. These peaks were
similar on the second heating indicating reversibility of phase transition. Under the
Univers
ity of
Mala
ya
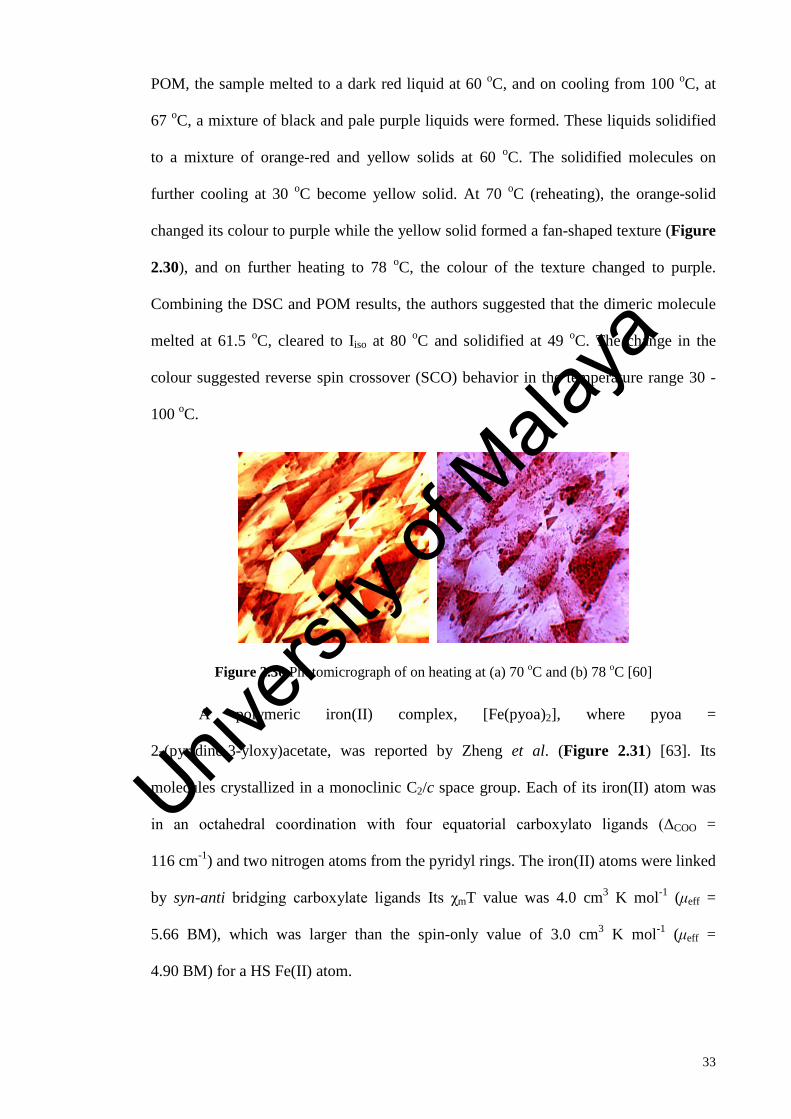
33
POM, the sample melted to a dark red liquid at 60 oC, and on cooling from 100 oC, at
67 oC, a mixture of black and pale purple liquids were formed. These liquids solidified
to a mixture of orange-red and yellow solids at 60 oC. The solidified molecules on
further cooling at 30 oC become yellow solid. At 70 oC (reheating), the orange-solid
changed its colour to purple while the yellow solid formed a fan-shaped texture (Figure
2.30), and on further heating to 78 oC, the colour of the texture changed to purple.
Combining the DSC and POM results, the authors suggested that the dimeric molecule
melted at 61.5 oC, cleared to Iiso at 80 oC and solidified at 49 oC. The change in the
colour suggested reverse spin crossover (SCO) behavior in the temperature range 30 -
100 oC.
Figure 2.30 Photomicrograph of on heating at (a) 70 oC and (b) 78 oC [60]
A polymeric iron(II) complex, [Fe(pyoa)2], where pyoa =
2-(pyridine-3-yloxy)acetate, was reported by Zheng et al. (Figure 2.31) [63]. Its
molecules crystallized in a monoclinic C2/c space group. Each of its iron(II) atom was
in an octahedral coordination with four equatorial carboxylato ligands (ΔCOO =
116 cm-1) and two nitrogen atoms from the pyridyl rings. The iron(II) atoms were linked
by syn-anti bridging carboxylate ligands Its χmT value was 4.0 cm3 K mol-1 (μeff =
5.66 BM), which was larger than the spin-only value of 3.0 cm3 K mol-1 (μeff =
4.90 BM) for a HS Fe(II) atom.
Univers
ity of
Mala
ya

34
Figure 2.31 Perspective view along b-axis of the syn-anti μ-carboxylate
bridged iron(II) chain [63]
2.4 Theoretical studies
The goal of the theoretical studies is to predict and understand the initial quantitative
description of molecules and their reactions. The knowledge of the exact structural
molecule and their bonding as well as the detailed insight into the state-to-state
dynamics are required in order to determine the outcome of the reaction. These are
essential in order to understand the results from a sophisticated experiment.
Comparison between experimental data with the theoretical allows us to
understand more about the structures, bonding and reactions. The theoretical methods
are now developed with sufficient accuracy to estimate reliable predictions for
molecules and reaction that have not been made or measured in the laboratory.
Vibrational spectroscopy is widely used in structural studies of organic
molecules. Quantum-chemical computational may predict the harmonies frequency and
spectral intensities essential for the interpretation of experimental spectra. The accuracy
of the computational IR intensities is difficult as they are dependent on the dipole
moment and polarizability. Hence, this will require the use of large, diffuse basis sets
such as aug-cc-pVTZ [64].
For example, in 2009 Sagdinc et al. reported the structural and theoretical
properties of [Cu2(FBF)4], where FBF = (R,S)-[2-(2-fluoro-4-biphenyl)]propanoate ion
Univers
ity of
Mala
ya

35
(Figure 2.32) using DFT calculations, followed by the vibrational properties using
Raman and infrared spectroscopy with B3LYP method and 6-31G(d.p) basis set. The
investigation was done to better understand the structural and bonding characteristic of
the complex. The major characteristic from the FTIR spectrum of this molecule is the
frequency of the asymmetric and symmetric COO-, which were found at 1589 cm-1 and
1408 cm-1, respectively. Thus, the ΔCOO value was 181 cm-1, consistent with the
bridging bidentate of the molecule [65].
Figure 2.32 Molecular structure of [Cu2(FBF)4] [65]
As another example, Abdullah et al [60] showed a good match between the
experimental FTIR spectrum of a dinuclear iron(II) complex, [Fe2(CH3COO)4(L)2],
where L = (4,4’-bis[3,4-bis(tetradecyloxy)stryl-2,2’-bipyridine), with the simulated
spectrum regenerated using the DFT calculation (Figure 2.33). Univers
ity of
Mala
ya
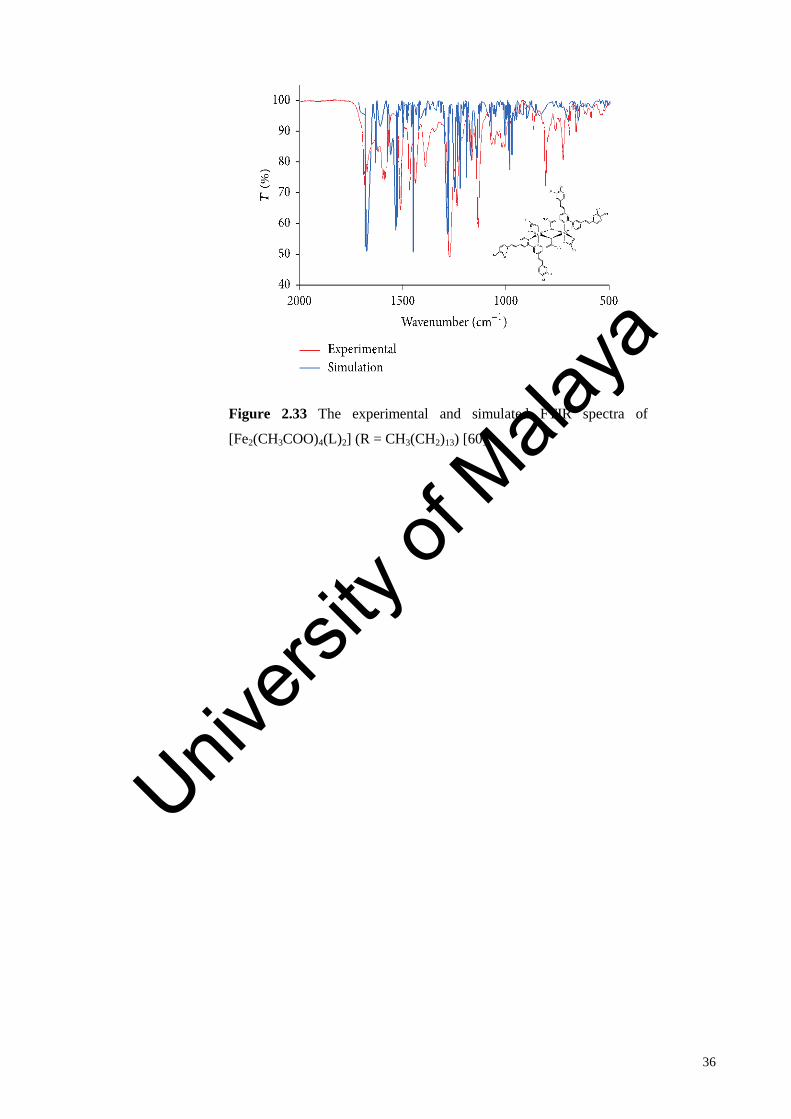
36
Figure 2.33 The experimental and simulated FTIR spectra of
[Fe2(CH3COO)4(L)2] (R = CH3(CH2)13) [60]
Univers
ity of
Mala
ya
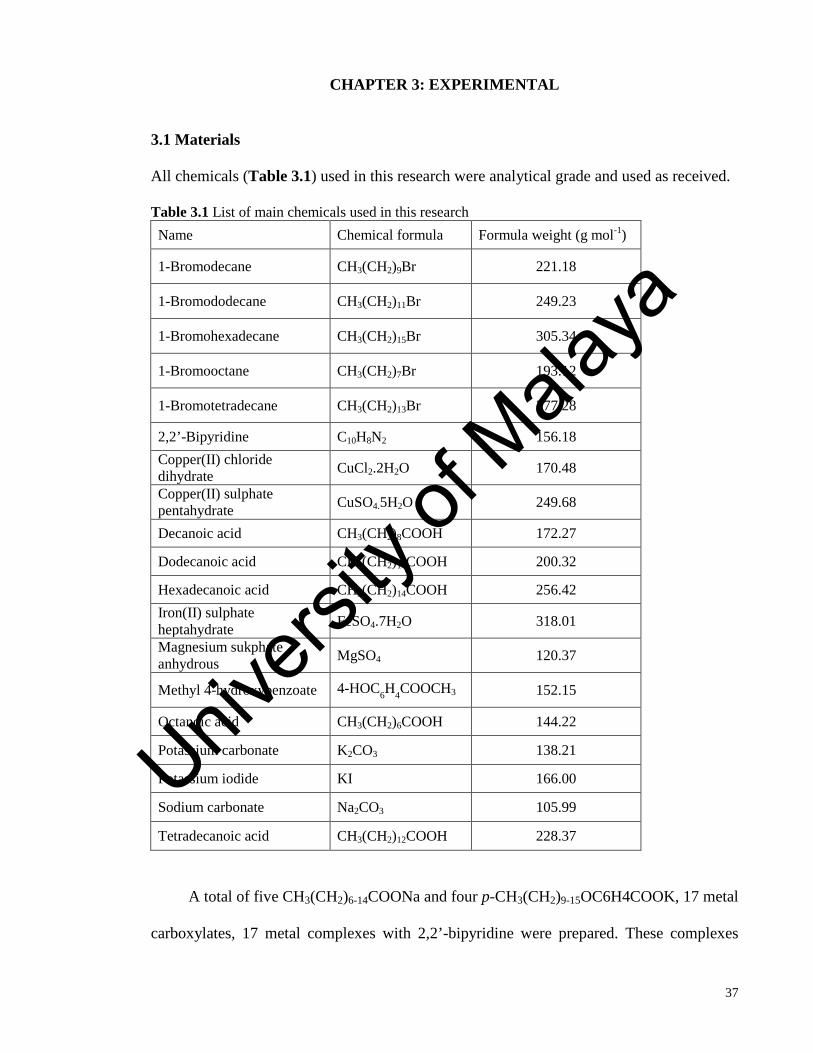
37
CHAPTER 3: EXPERIMENTAL
3.1 Materials
All chemicals (Table 3.1) used in this research were analytical grade and used as received.
Table 3.1 List of main chemicals used in this research Name Chemical formula Formula weight (g mol-1)
1-Bromodecane CH3(CH2)9Br 221.18
1-Bromododecane CH3(CH2)11Br 249.23
1-Bromohexadecane CH3(CH2)15Br 305.34
1-Bromooctane CH3(CH2)7Br 193.12
1-Bromotetradecane CH3(CH2)13Br 277.28
2,2’-Bipyridine C10H8N2 156.18 Copper(II) chloride dihydrate CuCl2.2H2O 170.48
Copper(II) sulphate pentahydrate CuSO4.5H2O 249.68
Decanoic acid CH3(CH2)8COOH 172.27
Dodecanoic acid CH3(CH2)10COOH 200.32
Hexadecanoic acid CH3(CH2)14COOH 256.42 Iron(II) sulphate heptahydrate FeSO4.7H2O 318.01
Magnesium sukphate anhydrous MgSO4 120.37
Methyl 4-hydroxybenzoate 4-HOC6H4COOCH3 152.15
Octanoic acid CH3(CH2)6COOH 144.22
Potassium carbonate K2CO3 138.21
Potassium iodide KI 166.00
Sodium carbonate Na2CO3 105.99
Tetradecanoic acid CH3(CH2)12COOH 228.37
A total of five CH3(CH2)6-14COONa and four p-CH3(CH2)9-15OC6H4COOK, 17 metal
carboxylates, 17 metal complexes with 2,2’-bipyridine were prepared. These complexes
Univers
ity of
Mala
ya

38
were analysed by CHN elemental analyses, FTIR spectroscopy, UV-vis spectroscopy,
1H-nuclear magnetic resonance spectroscopy, thermogravimetric analysis (TGA),
differential scanning calorimetry (DSC), polarizing optical microscopy (POM) and
room-temperature magnetic susceptibility. Crystalline complexes were analysed by
single-crystal X-ray crystallography.
All geometry optimization and frequencies calculations were done using
Gaussian09W package with DFT B3LYP method with 6-31G basis set. In the calculation,
ultrafine integral was used. The frequency calculation calculated from the resultant of the
above calculation was done to obtain its IR intensities. The predicted IR intensities from the
calculation were compared to the experimental IR. The frequencies were scaled by 0.98
because the overestimates calculation by B3LYP method [66].
3.2 Syntheses
3.2.1 [Cu2(RCOO)4(bpy)2(H2O)2]
a) [Cu2(CH3(CH2)6COO)4(bpy)2(H2O)2]
A solution of CH3(CH2)6COOH (14.47 g; 100.3 mmol) in ethanol (100 ml) was added
portionwise to a solution of Na2CO3 (5.30 g; 50.0 mmol) in water (100 ml). The mixture
was magnetically stirred and heated for 30 minutes. The white solid
(CH3(CH2)6COONa.1/2H2O) obtained was filtered and washed with water before dried
overnight. The yield was 14.23 g (85.6%).
A solution of CuCl2.2H2O (1.72 g; 10.1 mmol) in distilled water (20 ml) was added to
a solution of CH3(CH2)6COONa.1/2H2O (3.34 g; 20.1 mmol) in aqueous ethanol
(100 ml). The mixture was magnetically stirred and heated for 30 minutes. The reaction
mixture was left to cool to room temperature, washed with water, and filtered. The product
Univers
ity of
Mala
ya

39
was a green powder ([Cu6Cl10(CH3(CH2)6COO)2].3H2O.2CH3CH2OH), and its yield was
1.21 g (61.6%).
2,2’-Bipyridine (0.24 g; 1.5 mmol) was added to a hot solution of
[Cu6Cl10(CH3(CH2)6COO)2].3H2O.2CH3CH2OH (0.53 g; 0.5 mmol) in methanol-ethanol
(1:2 ratio; 100 ml). The reaction mixture was stirred for about 30 minutes, allowed to cool
to room temperature, and filtered. The product was a blue powder, and its yield was 0.06 g
(11.9%). On recrystalisation from ethanol, two types of blue crystals were obtained.
b) [Cu2(CH3(CH2)8COO)4(bpy)2]
The method was the same as for [Cu2(CH3(CH2)6COO)4(bpy)2] (Section 3.2.1 (a)), using
Na2CO3 (5.34 g; 50.3 mmol), CH3(CH2)8COOH (17.76 g; 103.1 mmol),
CH3(CH2)8COONa.2H2O (3.30 g; 18.0 mmol), CuCl2.2H2O (1.56 g; 9.0 mmol),
[Cu2(CH3(CH2)8COO)4(H2O)2] (1.15 g; 1.4 mmol), and 2,2’-bipyridine (0.44 g; 2.8 mmol).
The yields of CH3(CH2)8COONa.2H2O was 14.80 g (74.0%),
[Cu2(CH3(CH2)8COO)4(H2O)2] was 2.99 g (39.2%), and [Cu2(CH3(CH2)8COO)4(bpy)2]
(blue semisolid) was 1.54 g (97.9%). On recrystalisation from chloroform-ethanol
(1:1 v/v), blue crystals were obtained.
c) [Cu2(CH3(CH2)10COO)4(bpy)2]
The method was the same as for [Cu2(CH3(CH2)6COO)4(bpy)2] (Section 3.2.1 (a)), using
Na2CO3 (5.23 g; 49.3 mmol), CH3(CH2)10COOH (20.04 g; 100.0 mmol),
CH3(CH2)10COONa.1/2H2O (4.49 g; 20.2 mmol), CuCl2.2H2O (1.75 g; 10.3 mmol),
[Cu2(CH3(CH2)10COO)4(H2O)2].2H2O (0.17 g; 0.2 mmol), and 2,2’-bipyridine (0.68 g;
0.4 mmol).
The yields of CH3(CH2)10COONa.1/2H2O was 15.79 g (69.2%),
[Cu2(CH3(CH2)10COO)4(H2O)2].2H2O was 1.01 g (10.2%), and
Univers
ity of
Mala
ya

40
[Cu2(CH3(CH2)10COO)4(bpy)2] (blue solid) was 0.22 g (95.2%). On recrystalisation from
ethanol, blue crystals were obtained.
d) [Cu2(CH3(CH2)12COO)4(bpy)2]
The method was the same as for [Cu2(CH3(CH2)6COO)4(bpy)2] (Section 3.2.1 (a)), using
Na2CO3 (5.31 g; 50.1 mmol), CH3(CH2)12COOH (22.86 g; 100.1 mmol),
CH3(CH2)12COONa; 5.01 g; 20.0 mmol), CuCl2.2H2O (1.71 g; 10.1 mmol),
[Cu2(CH3(CH2)12COO)4(H2O)2].4H2O (0.74 g; 0.70 mmol), and 2,2’-bipyridine (0.24 g;
1.5 mmol).
The yields of CH3(CH2)12COONa was 20.73 g (82.8%),
[Cu2(CH3(CH2)12COO)4(H2O)2].4H2O was 2.97 g (23.1%), and
[Cu2(CH3(CH2)12COO)4(bpy)2] (blue solid) was 0.38 g (43.7%).
e) [Cu2(CH3(CH2)14COO)4(bpy)2]
The method was the same as for [Cu2(CH3(CH2)6COO)4(bpy)2] (Section 3.2.1 (a)), using
Na2CO3 (5.30 g; 50.0 mmol), CH3(CH2)14COOH (25.68 g; 100.1 mmol),
CH3(CH2)14COONa (5.55 g; 0.02 mol), CuCl2.2H2O (1.82 g; 0.01 mol),
[Cu2(CH3(CH2)14COO)4(H2O)2] (2.67 g; 2.3 mmol), and 2,2’-bipyridine (0.80 g;
5.1 mmol).
The yields of CH3(CH2)14COONa was 24.24 g (87.1%),
[Cu2(CH3(CH2)14COO)4(H2O)2] was 4.76 g (37.6%), and [Cu2(CH3(CH2)14COO)4(bpy)2]
(blue crystals) was 2.67 g (81.1%).
Univers
ity of
Mala
ya
41
3.2.2 [Fe2(RCOO)4(bpy)(H2O)2]
a) [Fe2(CH3(CH2)8COO)4(bpy)(H2O)2]
The method was the same as for [Cu2(CH3(CH2)6COO)4(bpy)2] (Section 3.2.1 (a)), using
CH3(CH2)8COONa.2H2O; 4.48 g; 19.5 mmol), FeSO4.7H2O (3.58 g; 12.9 mmol),
[Fe2(μ-H2O)2(CH3(CH2)8COO)4].H2O (1.29 g; 1.5 mmol), 2,2’-bipyridine (0.50 g;
3.2 mmol).
The yields of [Fe2(μ-H2O)2(CH3(CH2)8COO)4].H2O was 5.98 g (36.1%), and
[Fe2(CH3(CH2)8COO)4(bpy)(H2O)2] was 0.77 g (49.7%).
b) [Fe2(CH3(CH2)10COO)4(bpy)(H2O)2]
The method was the same as for [Cu2(CH3(CH2)6COO)4(bpy)2] (Section 3.2.1 (a)), using
CH3(CH2)10COONa (2.60 g; 11.2 mmol), FeSO4.7H2O (2.13 g; 5.6 mmol),
[Fe2(μ-H2O)2(CH3(CH2)10COO)4].2H2O (1.05 g; 1.1 mmol), 2,2’-bipyridine (0.34 g;
2.2 mmol).
The yield of [Fe2(μ-H2O)2(CH3(CH2)10COO)4].2H2O was 1.84 g (33.3%), and
[Fe2(CH3(CH2)10COO)4(bpy)2(H2O)2].2H2O was 0.85 g (67.9%).
c) [Fe2(CH3(CH2)12COO)4(bpy)(H2O)2]
The method was the same as for [Cu2(CH3(CH2)6COO)4(bpy)2] (Section 3.2.1 (a)), using
CH3(CH2)12COONa; 5.71 g; 22.8 mmol), FeSO4.7H2O (4.39 g; 11.6 mmol),
[Fe2(μ-H2O)2(CH3(CH2)12COO)4].2H2O (0.84 g; 0.8 mmol), 2,2’-bipyridine (0.24 g;
1.5 mmol).
The yield of [Fe2(μ-H2O)2(CH3(CH2)12COO)4].2H2O was 1.72 g (13.8%), and
[Fe2(CH3(CH2)12COO)4(bpy)(H2O)2] was 0.86 g (90.9%).
Univers
ity of
Mala
ya
42
d) [Fe2(CH3(CH2)14COO)4(bpy)(H2O)2]
The method was the same as for [Cu2(CH3(CH2)6COO)4(bpy)2] (Section 3.2.1 (a)), using
CH3(CH2)14COONa; 3.83 g; 13.7 mmol), FeSO4.7H2O (2.62 g; 6.9 mmol),
[Fe2(μ-H2O)2(CH3(CH2)14COO)4] (1.23 g; 1.1 mmol), 2,2’-bipyridine (0.34 g; 2.2 mmol).
The yield of [Fe2(μ-H2O)2(CH3(CH2)14COO)4] was 3.78 g (47.2%), and
[Fe2(CH3(CH2)14COO)4(bpy)(H2O)2] was 0.74 g (50.8%).
3.2.3 [Cu2(p-ROC6H4COO)4(bpy)2]
a) [Cu2(p-CH3(CH2)9OC6H4COO)4(bpy)2]
p-HOC6H4COOCH3 (4.57 g; 30.0 mmol), K2CO3 (4.98 g; 36.0 mmol) and KI (0.22 g;
1.3 mmol) were added in 200 ml DMF. The mixture was stirred and heated at 50oC until
dissolved. BrCH2(CH2)8CH3 (6.61 g; 29.9 mmol) was added dropwise to the hot solution.
The reaction was refluxed for 24 hours. The cool white powder was washed with water
(3x100 ml) and ethanol (2x100 ml) until the washing is colourless. The white powder was
dissolved in CHCl3 (100 ml) and MgSO4 anhydrous was added to the solution. The MgSO4
anhydrous was filtered. The CHCl3 was evaporated at room temperature and filtered. The
product (p-CH3(CH2)9OC6H4COOCH3) was white solids and its yield was 63.4% (5.54 g).
p-CH3(CH2)9OC6H4COOCH3 (3.87 g; 13.2 mmol) was dissolved in 100 ml of hot
EtOH. KOH (0.74 g; 13.2 mmol) in 10 ml EtOH was added dropwise to the hot solution.
The reaction was reflux for 4 hours. The reaction was cool to room temperature and the
white solid (1.46 g) was filtered and its yield was 35.0%.
p-CH3(CH2)9OC6H4COOK (0.99 g; 3.1 mmol) was dissolved in ethanol:water
(100 ml; 1:1 v/v). The reaction was heated to 50 oC. CuSO4.5H2O (0.40 g; 1.6 mmol) was
dissolved in 20 ml water and was added dropwise to the hot solution. The reaction was
heated for 30 minutes and blue powder was filtered hot (0.87 g) with 44.2% yield.
Univers
ity of
Mala
ya

43
[Cu2(p-CH3(CH2)9OC6H4COO)4(H2O)2] (0.26 g; 0.2 mmol) was immersed in
100 ml ethanol. 2,2’-bipyridine (0.07 g; 0.4 mmol) was dissolved in 10 ml of ethanol was
added dropwise to the hot solution above. The reaction was magnetically stirred and heated
(50 oC) for an hour. The clear solution was left to cool to room temperature overnight. The
blue solid, [Cu2(p-CH3(CH2)9OC6H4COO)4(bpy)2].2H2O was filtered (0.21 g) with 65.4%
yield.
b) [Cu2(p-CH3(CH2)11OC6H4COO)4(bpy)2]
The method was the same as for [Cu2(p-CH3(CH2)9OC6H4COO)4(bpy)2] (Section 3.2.3
(a)), using p-HO-C6H4COOCH2CH3 (5.01 g; 30.1 mmol), K2CO3 (4.9922 g; 36.1 mmol),
KI (0.21 g; 1.2 mmol), CH3(CH2)11Br (7.47 g; 29.9 mmol),
p-CH3(CH2)11OC6H4COOCH2CH3 (2.53 g; 7.1 mmol), KOH (0.55 g; 9.7 mmol),
p-CH3(CH2)11OC6H4COOK (1.02 g; 2.9 mmol), CuSO4.5H2O (1.49 g; 6.0 mmol),
[Cu2(p-CH3(CH2)11OC6H4COO)4(H2O)2].2H2O (0.32 g; 0.2 mmol), and 2,2’-bipyridine
(0.06 g; 0.4 mmol).
The yields of p-CH3(CH2)11OC6H4COOCH2CH3 was 5.55 g (52.1%),
p-CH3(CH2)11OC6H4COOK was 1.20 g (49.1%),
[Cu2(p-CH3(CH2)11OC6H4COO)4(H2O)2].2H2O was 1.03 g (25.1%) and
[Cu2(p-CH3(CH2)11OC6H4COO)4(bpy)2] (blue solids) was 0.27 g (80.3%).
c) [Cu2(p-CH3(CH2)13OC6H4COO)4(bpy)2]
The method was the same as for [Cu2(p-CH3(CH2)9OC6H4COO)4(bpy)2] (Section 3.2.3
(a)), using p-HOC6H4COOCH2CH3 (5.01 g; 30.2 mmol), K2CO3 (5.03 g; 36.4 mmol), KI
(0.21 g; 1.3 mmol), CH3(CH2)13Br (7.61 g; 27.4 mmol), p-CH3(CH2)13OC6H4COOCH2CH3
(2.79 g; 7.7 mmol), KOH (0.54 g; 9.6 mmol), p-CH3(CH2)13OC6H4COOK
(0.89 g; 2.4 mmol), CuSO4.5H2O (0.31 g; 1.2 mmol),
Univers
ity of
Mala
ya
44
[Cu2(p-CH3(CH2)13OC6H4COO)4(H2O)2].2H2O (0.24 g; 0.2 mmol), and 2,2’-bipyridine
(0.04 g; 0.3 mmol).
The yields of p-CH3(CH2)13OC6H4COOCH2CH3 was 8.02 g (80.6%),
p-CH3(CH2)13OC6H4COOK was 1.49 g (51.8%),
[Cu2(p-CH3(CH2)13OC6H4COO)4(H2O)2].2H2O was 0.76 g (39.9%) and
[Cu2(p-CH3(CH2)13OC6H4COO)4(bpy)2] (blue solids) was 0.04 g (13.4%).
d) [Cu2(p-CH3(CH2)15OC6H4COO)4(bpy)2]
The method was the same as for [Cu2(p-CH3(CH2)9OC6H4COO)4(bpy)2]
(Section 3.2.3 (a)), using p-HOC6H4COOCH3 (5.51 g; 36.2 mmol), K2CO3 (7.07 g;
51.1 mmol), KI (0.21 g; 1.3 mmol), CH3(CH2)15Br (10.99 g; 36.0 mmol),
p-CH3(CH2)15OC6H4COOCH3 (10.57 g; 28.1 mmol), KOH (1.58 g; 28.1 mmol),
p-CH3(CH2)15OC6H4COOK.2H2O (3.93 g; 9.0 mmol), CuCl2.2H2O (0.84 g; 4.9 mmol),
[Cu2(p-CH3(CH2)13OC6H4COO)4(H2O)2] (0.47 g; 0.3 mmol), and 2,2’-bipyridine (0.03 g;
0.2 mmol).
The yields of p-CH3(CH2)15OC6H4COOCH3 was 11.91 g (87.8%),
p-CH3(CH2)15OC6H4COOK.2H2O was 10.5 g (85.4%),
[Cu2(p-CH3(CH2)15OC6H4COO)4(H2O)2] was 3.95 g (54.6%) and
[Cu2(p-CH3(CH2)15OC6H4COO)4(bpy)2] (blue solids) was 0.28 g (82.7%).
3.2.4 [Fe2(μ-RCOO)2(RCOO)2(bpy)]
a) [Fe2(μ-RCOO)2(RCOO)2(bpy)] (R = p-CH3(CH2)9OC6H4)
A solution of FeSO4.7H2O (0.44 g; 1.2 mmol) in distilled water (10 ml) was added
portionwise to a solution of p-CH3(CH2)9OC6H4COOK, (Section 3.2.3 (a)) (0.73 g; 2.3
mmol) in ethanol:water (100 ml; 1:1 v/v). The reaction mixture was magnetically stirred
Univers
ity of
Mala
ya
45
and heated for 30 minutes. The brown powder [Fe2(μ-H2O)(μ-RCOO)2(RCOO)2(H2O)2]
formed was filtered hot. The yield was 0.72 g (47.1%).
2,2’-Bipyridine (0.09 g; 0.6 mmol) was added to a hot solution of
[Fe2(μ-H2O)(μ-RCOO)2(RCOO)2(H2O)2] (0.36 g; 0.3 mmol) in chloroform (100 ml). The
reaction mixture was stirred for about 30 minutes, allowed to cool to room temperature, and
filtered. The yield of [Fe2(μ-RCOO)2(RCOO)2(bpy)] was 0.29 g (76.6%).
b) [Fe2(μ-RCOO)2(RCOO)2(bpy)] (R = p-CH3(CH2)11OC6H4)
The method was the same as for [Fe2(μ-RCOO)2(RCOO)2(bpy)] (Section 3.2.4 (a)) using
p-CH3(CH2)11OC6H4COOK; 2.00 g; 5.8 mmol, FeSO4.7H2O (1.10 g; 2.9 mmol),
[Fe2(μ-H2O)(μ-RCOO)2(RCOO)2(H2O)2].H2O (0.89 g; 0.6 mmol), 2,2’-bipyridine (0.20 g;
1.3 mmol).
The yield of [Fe2(μ-H2O)(μ-RCOO)2(RCOO)2(H2O)2].H2O was 1.99 g (48.9%) and
[Fe2(μ-RCOO)2(RCOO)2(bpy)] was 0.65 g (73.3%).
c) [Fe(RCOO)2(bpy)](R = p-CH3(CH2)13OC6H4)
The method was the same as for [Fe2(μ-RCOO)2(RCOO)2(bpy)] (Section 3.2.4 (a)) using
CH3(CH2)13OC6H4COOK; 2.17 g; 5.8 mmol, FeSO4.7H2O (1.1037 g; 2.9 mmol),
[Fe2(μ-H2O)(μ-RCOO)2(RCOO)2(H2O)2] (0.78 g; 0.5 mmol), 2,2’-bipyridine (0.16 g;
1.0 mmol).
The yield of [Fe2(μ-H2O)(μ-RCOO)2(RCOO)2(H2O)2] was 2.40 g (55.2%) and
[Fe(RCOO)2(bpy)] was 0.42 g (97.4%).
d) [Fe(RCOO)2(bpy)] (R = p-CH3(CH2)15OC6H4)
The method was the same as for [Fe2(μ-RCOO)2(RCOO)2(bpy)] (Section 3.2.4 (a)) using
CH3(CH2)15OC6H4COOK; 1.68 g; 3.9 mmol), FeSO4.7H2O (0.81 g; 2.1 mmol),
Univers
ity of
Mala
ya
46
[Fe2(μ-H2O)(μ-RCOO)2(RCOO)2(H2O)2] (0.66 g; 0.4 mmol), 2,2’-bipyridine (0.13 g;
0.8 mmol).
The yield of [Fe2(μ-H2O)(μ-RCOO)2(RCOO)2(H2O)2] was 1.32 g (41.9%) and
[Fe(RCOO)2(bpy)] was 0.47 g (79.7%).
3.3 Instrumental Analyses
3.3.1 Single crystal X-ray crystallography
Single crystal X-ray diffraction was performed on a Bruker SMART APEX diffractometer
operating with graphite-monochromator Mo Kα radiation (λ = 0.71073Å) at 100 K. The
intensities were collected using the ω -2θ scan mode, in the range 2.0o < θ <27.5o. The data
sets were corrected for absorption based on multiple scans [67] and reduced using standard
methods [68]. All structures were solved by direct method using SHELXS-97 [69], and
refined by full matrix least-square methods on F2 with the use of the SHELXL-97 program
package [6]. The crystals molecular structures were drawn with 50% displacement
ellipsoids using Mercury [70].
3.3.2 Elemental analyses
The elemental analyses were recorded on a Perkin Elmer CHNS/O analyser 2400 Series II.
The sample was accurately weighed (1 – 2 mg) in a tin capsule (5 x 8 mm). The capsule
containing the sample was folded into a tiny piece and placed inside the analyzer to be
heated to a maximum temperature of 1000 oC.
3.3.3 Fourier transform infrared spectroscopy
The Fourier Transform Infrared spectra (FTIR) were recorded from 4000 – 450 cm-1 on a
Perkin Elmer 400 FT-IR/FT-FIR spectrometer with attenuated total reflection (ATR)
technique.
Univers
ity of
Mala
ya
47
3.3.4 Ultraviolet-visible spectroscopy
The ultraviolet-visible spectra (UV-vis), for both solid and solution samples, were recorded
from 1000 – 300 nm on a SHIMADZU UV-vis-NIR 3600 spectrophotometer. An exactly
known mass of the solid was dissolved in a suitable solvent in a 10-mL volumetric flask.
The solution was introduced into a 1-cm quartz cuvette. Then the cuvette was inserted into
the sample holder. The spectrum obtained was recorded against the solvent as the
background.
3.3.5 1H-NMR spectroscopy
The proton NMR was recorded on JEOL FT-NMR Lambda 400 MHz spectrometer. The
samples were dissolved in CDCl3. The chemical shifts were reported in ppm using the
residual protonated solvent as reference.
3.3.6 Room-temperature magnetic susceptibility
Room-temperature magnetic susceptibility was recorded on a Sherwood Auto Magnetic
Susceptibility Balance. An empty tube was tared on the analytical balance and then placed
in the instrument. The exponent of the reading was changed to 10-5 and tared. The finely
ground sample was packed into the tube to the calibrated mark (length 5 cm) and the mass
was recorded. The tube containing the sample was then placed in the instrument and the χg
was recorded.
3.3.7 Thermogravimetric analysis
The thermogravimetric analysis (TGA) was recorded from 50–900 oC on a Pyris Diamond
TG/DTA Perkin Elmer instrument with the scan rate of 20 oC min-1. The sample was
analysed under nitrogen at a flow rate of 10 cm3 min-1. An empty alumina pan was placed
Univers
ity of
Mala
ya

48
in the holder and tared. Then the sample (4 - 5 mg) was loaded onto the pan and the weight
recorded.
3.3.8 Polarizing optical microscope
The mesophases pictomicrographs were captured using Nikon-H600L Eclipse Miscroscope
equipped with Metler Toledo FP90 central processor and Linkam THMS 600 hot stage.
The magnification was 50x.
3.3.9 Differential scanning calorimetry
Differential scanning calorimetry (DSC) was recorded from 35–300 oC on a Perkin Elmer
DSC 6 calorimeter. The weight of the sample (3 – 4 mg) was initially recorded on a
microbalance. The sample was transferred into an aluminium crucible and placed inside the
instrument. The analysis was performed under nitrogen gas at a flow rate of 10 cm3 min-1
and scan rate of 10 oC min-1.
3.3.10 Molecular modelling
Computational calculation analysis was conducted using density functional theory (DFT),
B3LYP method. The calculation was performed on Gaussian 09 program package. In
preliminary calculation to determine the lowest energy conformers, the geometry
optimization was done using 6-31G basis sets on all atoms. The lowest energy conformers
were then individually recalculated their moieties using 6-311G basis sets. The frequency
calculation calculated from the resultant of the above calculation was done to obtain its IR
intensities. The predicted IR intensities from the calculation were compared to the
experimental IR. The frequencies were scaled by 0.98 because the overestimates
calculation by B3LYP method [66].
Univers
ity of
Mala
ya
49
CHAPTER 4: RESULTS AND DISCUSSION
4.1 [Cu2(RCOO)4(bpy)2]
The general steps for the syntheses of [Cu2(CH3(CH2)nCOO)4(bpy)2], where n = 6 (1),
8 (2), 10 (3), 12 (4) and 14 (5), are shown in Scheme 4.1.
RCOOHNa2CO3
RCOONaCuCl2.2H2O
[Cu2(RCOO)4] bpy [Cu2(RCOO)4(bpy)2]
Scheme 4.1 Synthetic steps for [Cu2(RCOO)4(bpy)2], where R = CH3(CH2)n
4.1.1 [Cu2(CH3(CH2)6COO)4(bpy)2] (1)
(a) Synthesis and structural elucidation
The first step in the synthesis [Cu2(CH3(CH2)6COO)4(bpy)2] (1) (Scheme 4.1) involved
the reaction of CH3(CH2)6COOH with Na2CO3 to form CH3(CH2)6COONa.½H2O. It
was obtained as a white powder in good yield (86 %). Its elemental analysis results (C,
54.8%; H, 9.2%) were in good agreement with the calculated values, (C, 55.3%; H,
9.7%; FW 175.198 g mol-1). Its FTIR spectrum shown in Figure 4.1, and the peak
assignments are given in Table 4.1 (which also include the data for later discussion). It
shows two strong peaks at 2924 cm-1 and 2858 cm-1 for CH2 asymmetric and symmetric
stretching for the alkyl chain, respectively, and two strong peaks at 1559 cm-1 and
1418 cm-1 for νasymCOO and νsymCOO, respectively. Hence, the Δνcoo value (Δνcoo =
νasymCOO - νsymCOO) for CH3(CH2)6COO- ion was 141 cm-1. Univers
ity of
Mala
ya
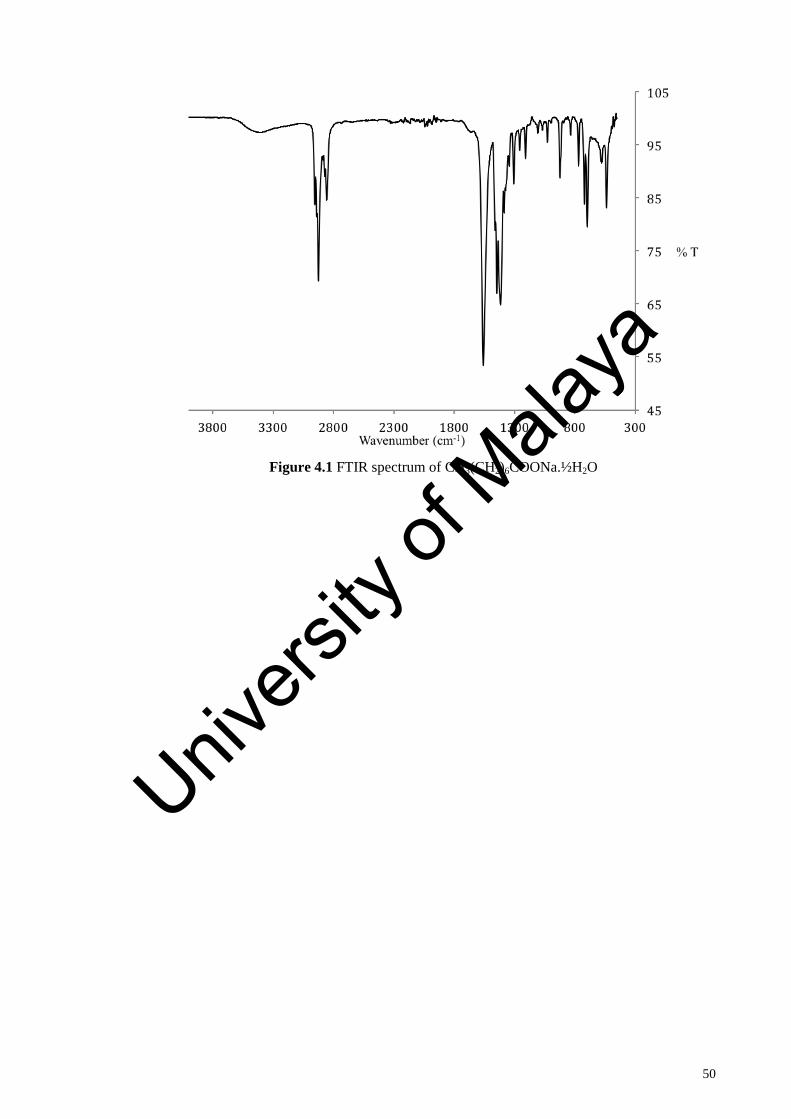
50
Figure 4.1 FTIR spectrum of CH3(CH2)6COONa.½H2O
Univers
ity of
Mala
ya

51
Table 4.1 FTIR data (in cm-1) and assignments
Compound CH2 (asym)
CH2 (sym)
COO (asym)
COO (sym)
C=C (aromatic) C-N
CH3(CH2)6COONa.½H2O 2924 2858 1559 1418 - -
CH3(CH2)8COONa.2H2O 2922 2853 1558 1425 - -
CH3(CH2)10COONa.1/2H2O 2922 2850 1559 1423 - -
CH3(CH2)12COONa 2922 2849 1559 1423 - -
CH3(CH2)14COONa 2917 2850 1557 1420 - -
[Cu6Cl10(CH3(CH2)6COO)2]. 3H2O.2CH3CH2OH 2918 2851 1630/1
602 1445/ 1390 - -
[Cu2(CH3(CH2)8COO)4(H2O)2] 2920 2850 1628 1436 - -
[Cu2(CH3(CH2)10COO)4(H2O)2] 2920 2850 1627 1450 - -
[Cu2(CH3(CH2)12COO)4(H2O)2]. 4H2O 2916 2851 1585 1445 - -
[Cu2(CH3(CH2)14COO)4(H2O)2]. H2O 2915 2850 1584 1444 - -
[Cu2(CH3(CH2)6COO)4(bpy)2]; (1) 2921 2854 1620 1434/
1411 1586 1317
[Cu2(CH3(CH2)8COO)4(bpy)2]; (2) 2918 2851 1629 1447/
1382 1600 1301
[Cu2(CH3(CH2)10COO)4(bpy)2]; (3) 2920 2850 1627 1449/
1379 1617 1303
[Cu2(CH3(CH2)12COO)4(bpy)2]; (4) 2918 2851 1602 1444/
1382 1630 1302
[Cu2(CH3(CH2)14COO)4(bpy)2]; (5) 2918 2849 1625 1467/
1366 1623 1309
The second step involved reacting CH3(CH2)6COONa.½H2O with CuCl2.2H2O to
form the precursor complex, [Cu2(CH3(CH2)6COO)4]. However based on the following
data, the product formed was [Cu6Cl10(CH3(CH2)6COO)2].3H2O.2CH3CH2OH (green
powder; yield = 62%) instead of the expected [Cu2(CH3(CH2)6COO)4]. The elemental
analysis results (C, 19.4%; H, 3.2%) were in good agreement with the calculated values
(C, 20.6%; H, 4.1%; FW 1168.414 g mol-1). Its FTIR data (Table 4.1; Figure 4.2)
shows the presence of the expected functional groups. The Δνcoo values were 157 cm-1
and 240 cm-1. These show that the binding modes of CH3(CH2)6COO- in the complex
were bidentate bridging and monodentate, respectively [21, 71].
Univers
ity of
Mala
ya

52
Figure 4.2 FTIR spectrum of [Cu6Cl10(CH3(CH2)6COO)2].3H2O.2CH3CH2OH
Its UV-vis spectrum (Figure 4.3) in C2H5OH shows a broad d-d band at 693 nm
(εmax = 104 M-1 cm-1). The data suggest a square pyramidal geometry at the Cu(II)
centres [72,73].
Figure 4.3 UV-vis spectrum of [Cu6Cl10(CH3(CH2)6COO)2].3H2O.2CH3CH2OH
Univers
ity of
Mala
ya

53
However, its μeff value could not be determined due to insufficient amount of
sample.
[Cu6Cl10(CH3(CH2)6COO)2].3H2O.2CH3CH2OH reacted with bpy to form a blue
powder, which on recrystallisation from ethanol, formed two different blue crystals.
Single crystal X-ray crystallographic data and structure refinement for both crystals
are shown in Table 4.2, selected bond lengths and angles are shown in Table 4.3, and
their molecular structure and packing are shown in Figure 4.4 and Figure 4.5. Hence,
the structural formulas for these crystals were [Cu2(CH3(CH2)6COO)4(bpy)2] (yield =
12%) (1) and [Cu2Cl2(H2O)4(bpy)2] (1a). These results further support the presence of
Cl in the starting complex.
Univers
ity of
Mala
ya

54
(a)
(b)
Figure 4.4 (a) Molecular structure, and (b) the packing diagram of 1 viewed along
crystallographic b-axis
Univers
ity of
Mala
ya

55
(a)
(b)
Figure 4.5 (a) Molecular structure, and (b) the packing diagram of 1a viewed along
crystallographic b-axis
Univers
ity of
Mala
ya
56
From the study of the crystal structure of 1, the compound was crystallised in
the triclinic system with P space group, a = 9.50(11) Å, b = 9.71(11) Å,
c = 15.37(2) Å, α = 76.89(3)o, β = 81.96(2)o, γ = 84.33(3)o, Z = 2, V = 1364(3) Å3
(Figure 4.4). Each of its copper(II) centre was penta-coordinated with two N atoms
from chelating bpy [Cu-N1 = 2.006 (5) Å and Cu-N2 = 2.048 (5) Å], two O atoms from
bridging CH3(CH2)6COO- ligands (Cu-O1 = 1.968 (5) Å and Cu-O2 = 2.381 (5) Å), and
an O atom from monodentate CH3(CH2)6COO- ligands (Cu-O3 = 1.930 (5) Å), residing
in a square pyramidal geometry environment. The Cu-N bond lengths [74-76] and the
two equatorial Cu-O bonds lengths were in the expected range [74-76], while the
Cu1-O2 bond length at the apical site of copper(II) has a longer length than expected.
This is in agreement of the syn-anti binding mode of the carboxylato ligand [76],
resulting in significantly long Cu-Cu distance (3.374 Å) (the normal Cu-Cu length for
copper(II) complexes with the paddle-wheel structure is about 2.6 Å [74,75]. The Cu(II)
atom was coplanar with the equatorial donor atoms of O(1)/O(1a) and bpy ring with
max deviation of 0.007(5) at N(2) atom from the least square plane.
In contrast, 1a was a dinuclear copper(I) complex which crystallised in the
triclinic P space group (Figure 4.5). The two copper(I) centres have distorted
tetrahedral geometry and different environments, namely CuN2O2 and CuN2OCl. The
coordination at the first Cu(I) centre involved two N atoms from chelating bpy and two
O from bridging aqua ligand, while the second Cu(I) involved two N atoms from
chelating bpy, an O from bridging aqua ligand, and a Cl atom at the axial position.
The formation of complexes 1 and 1a suggested that Cu(II) in
[Cu6Cl10(CH3(CH2)6COO)2].3H2O.2CH3CH2OH was partially reduced to Cu(I) when it
reacted with bpy. Similar suggestion was offered by Chisholm et al. for
[Mo(OPri)2(bpy)2] [77].
Univers
ity of
Mala
ya

57
Its FTIR data (Table 4.1; Figure 4.6) shows the presence of the expected
functional groups. Hence, the Δνcoo values were 209 and 186 cm-1, in agreement with
monodentate nonbridging and syn-anti monodentate bridging CH3(CH2)6COO ligands
as revealed from its crystal structure, respectively.
Figure 4.6 FTIR spectrum of 1
Its UV-vis spectrum (Figure 4.7) in DMSO-C2H5OH shows a broad d-d band at
699 nm (εmax = 104 M-1 cm-1) and a shoulder on a strong charge transfer band at 370 nm
(εmax = 115 M-1 cm-1). The data suggest a dinuclear complex with square pyramidal
geometry at Cu(II) centres [72, 73]. Hence, the geometry of 1 in the crystals remained
intact in these solvents. Univers
ity of
Mala
ya
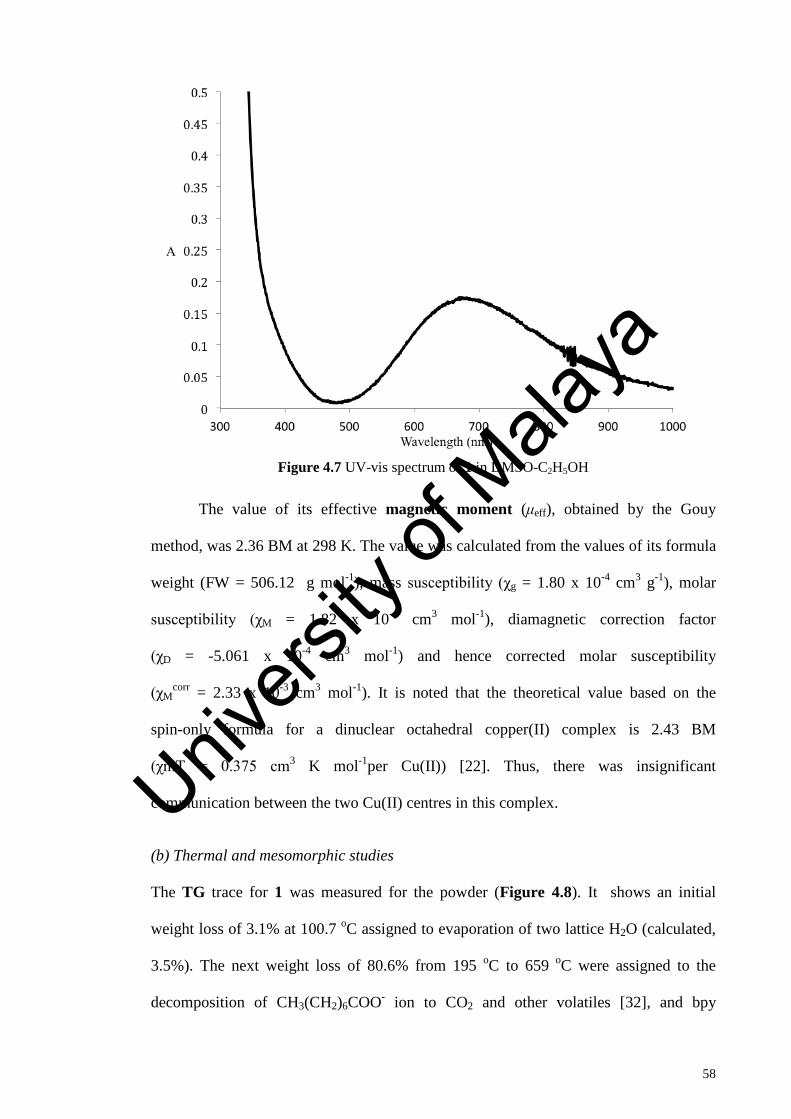
58
Figure 4.7 UV-vis spectrum of 1 in DMSO-C2H5OH
The value of its effective magnetic moment (μeff), obtained by the Gouy
method, was 2.36 BM at 298 K. The value was calculated from the values of its formula
weight (FW = 506.12 g mol-1), mass susceptibility (χg = 1.80 x 10⁻⁴ cm3 g-1), molar
susceptibility (χM = 1.82 x 10⁻⁴ cm3 mol-1), diamagnetic correction factor
(χD = -5.061 x 10⁻⁴ cm3 mol-1) and hence corrected molar susceptibility
(χMcorr = 2.33 x 10⁻³ cm3 mol-1). It is noted that the theoretical value based on the
spin-only formula for a dinuclear octahedral copper(II) complex is 2.43 BM
(χmT = 0.375 cm3 K mol-1per Cu(II)) [22]. Thus, there was insignificant
communication between the two Cu(II) centres in this complex.
(b) Thermal and mesomorphic studies
The TG trace for 1 was measured for the powder (Figure 4.8). It shows an initial
weight loss of 3.1% at 100.7 oC assigned to evaporation of two lattice H2O (calculated,
3.5%). The next weight loss of 80.6% from 195 oC to 659 oC were assigned to the
decomposition of CH3(CH2)6COO- ion to CO2 and other volatiles [32], and bpy
Univers
ity of
Mala
ya
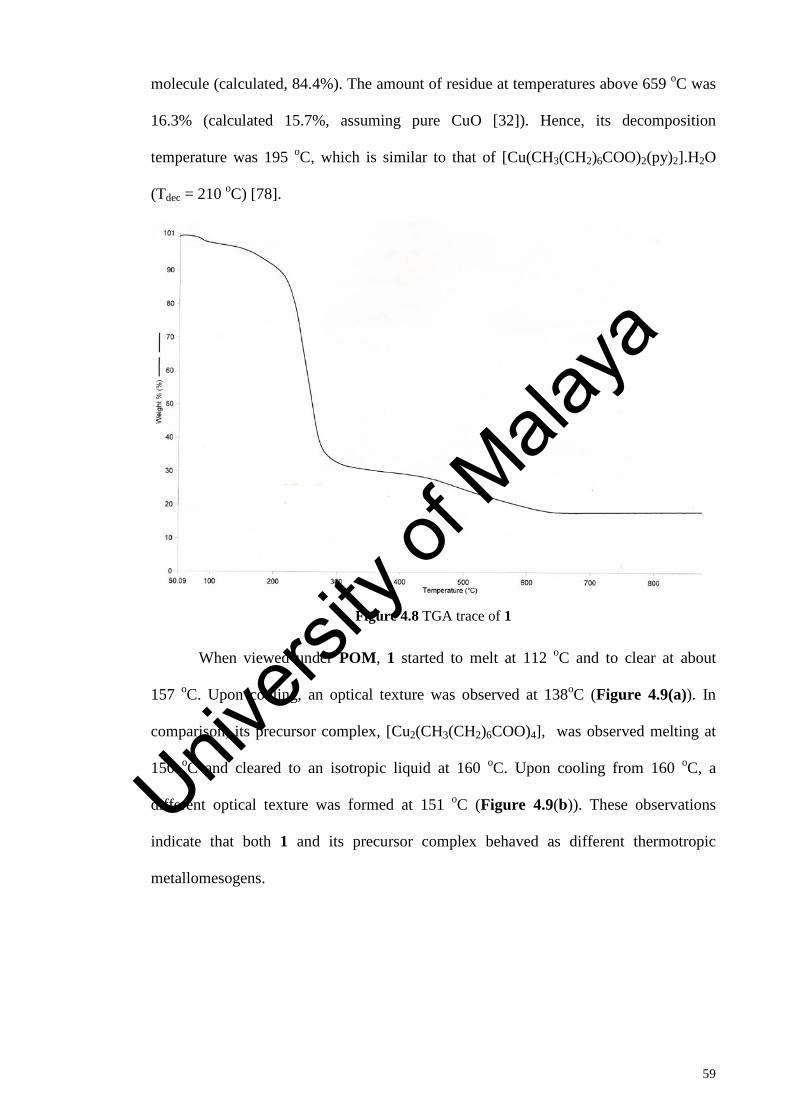
59
molecule (calculated, 84.4%). The amount of residue at temperatures above 659 oC was
16.3% (calculated 15.7%, assuming pure CuO [32]). Hence, its decomposition
temperature was 195 oC, which is similar to that of [Cu(CH3(CH2)6COO)2(py)2].H2O
(Tdec = 210 oC) [78].
Figure 4.8 TGA trace of 1
When viewed under POM, 1 started to melt at 112 oC and to clear at about
157 oC. Upon cooling, an optical texture was observed at 138oC (Figure 4.9(a)). In
comparison, its precursor complex, [Cu2(CH3(CH2)6COO)4], was observed melting at
150 oC and cleared to an isotropic liquid at 160 oC. Upon cooling from 160 oC, a
different optical texture was formed at 151 oC (Figure 4.9(b)). These observations
indicate that both 1 and its precursor complex behaved as different thermotropic
metallomesogens.
Univers
ity of
Mala
ya

60
(a) (b)
Figure 4.9 Photomicrographs of: (a) 1 on cooling at 138 oC; (b) [Cu2(CH3(CH2)6COO)4] on
cooling at 150 oC
Its DSC traces (Figure 4.10) shows two overlapping endothermic peaks on
heating at 93 oC (∆Hcombined = +63 kJ mol-1) assigned to the breaking of the axial Cu-O
bonds of the dimeric structure to form two monomers and melting of the monomers,
and a broad endothermic peak at 157 oC (∆H = +42 kJ mol-1) assigned to its clearing
temperature to isotropic liquid (I). On cooling, there were two exothermic peaks at
136 oC (∆H = -36 kJ mol-1) and 35 oC (∆H = -22 kJ mol-1) assigned to the formation of a
mesophase (I-M transition) and mesophase-to-crystal transition (M-Cr), respectively.
Univers
ity of
Mala
ya
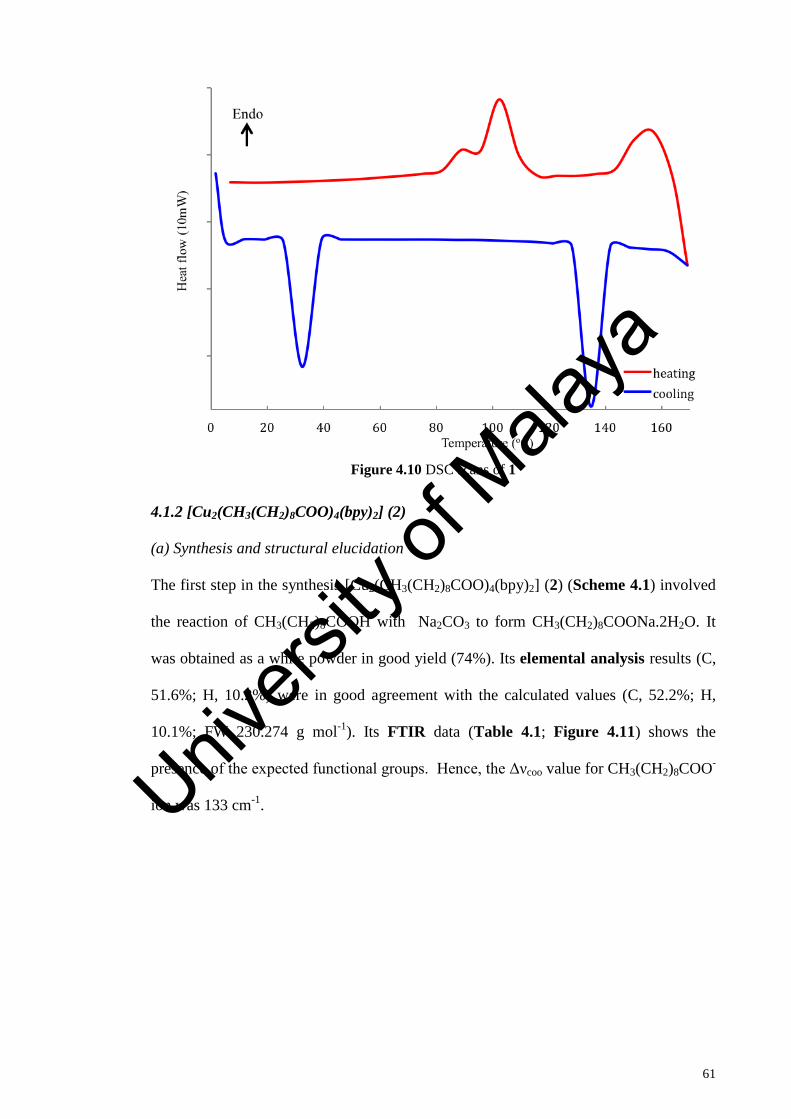
61
Figure 4.10 DSC scans of 1
4.1.2 [Cu2(CH3(CH2)8COO)4(bpy)2] (2)
(a) Synthesis and structural elucidation
The first step in the synthesis [Cu2(CH3(CH2)8COO)4(bpy)2] (2) (Scheme 4.1) involved
the reaction of CH3(CH2)8COOH with Na2CO3 to form CH3(CH2)8COONa.2H2O. It
was obtained as a white powder in good yield (74%). Its elemental analysis results (C,
51.6%; H, 10.2%) were in good agreement with the calculated values (C, 52.2%; H,
10.1%; FW 230.274 g mol-1). Its FTIR data (Table 4.1; Figure 4.11) shows the
presence of the expected functional groups. Hence, the Δνcoo value for CH3(CH2)8COO-
ion was 133 cm-1. Univers
ity of
Mala
ya

62
Figure 4.11 FTIR spectrum of CH3(CH2)8COONa.2H2O
The second step involved reacting CH3(CH2)8COONa.2H2O with CuCl2.2H2O to
form the precursor complex, [Cu2(CH3(CH2)8COO)4(H2O)2] (green powder; yield =
39%). Its elemental analysis results (C, 57.0%; H, 9.0%) were in good agreement with
the calculated values (C, 56.6%; H, 9.5%; FW 848.14 g mol-1). Its FTIR data (Table
4.1; Figure 4.12) shows the presence of the expected functional groups. The Δνcoo value
was 192 cm-1, indicating that CH3(CH2)8COO- was coordinated at a bridging ligand in
the complex.
Univers
ity of
Mala
ya

63
Figure 4.12 FTIR spectrum of [Cu2(CH3(CH2)8COO)4(H2O)2]
Its UV-vis spectrum (Figure 4.13) in C2H5OH shows a broad d-d band at
699 nm (εmax = 386 M-1 cm-1) and a shoulder to a strong charge transfer band at 366 nm
(εmax = 325 M-1 cm-1). The data suggest a square pyramidal geometry for both Cu(II) in
the dinuclear complex.
Univers
ity of
Mala
ya
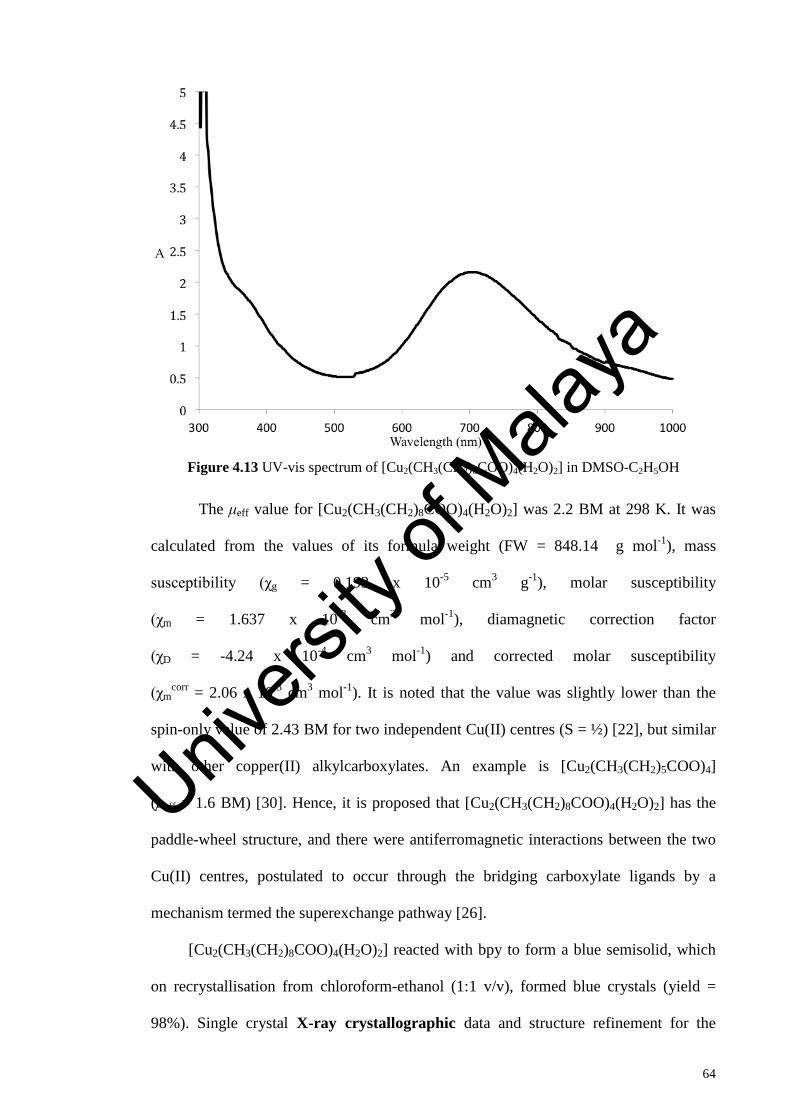
64
Figure 4.13 UV-vis spectrum of [Cu2(CH3(CH2)8COO)4(H2O)2] in DMSO-C2H5OH
The μeff value for [Cu2(CH3(CH2)8COO)4(H2O)2] was 2.2 BM at 298 K. It was
calculated from the values of its formula weight (FW = 848.14 g mol-1), mass
susceptibility (χg = 0.193 x 10⁻⁵ cm3 g-1), molar susceptibility
(χm = 1.637 x 10⁻³ cm3 mol-1), diamagnetic correction factor
(χD = -4.24 x 10⁻⁴ cm3 mol-1) and corrected molar susceptibility
(χmcorr = 2.06 x 10⁻³ cm3 mol-1). It is noted that the value was slightly lower than the
spin-only value of 2.43 BM for two independent Cu(II) centres (S = ½) [22], but similar
with other copper(II) alkylcarboxylates. An example is [Cu2(CH3(CH2)5COO)4]
(μeff = 1.6 BM) [30]. Hence, it is proposed that [Cu2(CH3(CH2)8COO)4(H2O)2] has the
paddle-wheel structure, and there were antiferromagnetic interactions between the two
Cu(II) centres, postulated to occur through the bridging carboxylate ligands by a
mechanism termed the superexchange pathway [26].
[Cu2(CH3(CH2)8COO)4(H2O)2] reacted with bpy to form a blue semisolid, which
on recrystallisation from chloroform-ethanol (1:1 v/v), formed blue crystals (yield =
98%). Single crystal X-ray crystallographic data and structure refinement for the
Univers
ity of
Mala
ya

65
crystal is shown in Table 4.2, selected bond lengths and angles are shown in Table 4.3,
and ORTEP presentations and packing patterns are shown in Figure 4.14. Hence, the
structural formula for the crystal was [Cu2(CH3(CH2)8COO)4(bpy)2] (2).
(a)
(b)
Figure 4.14 (a) Molecular structure, and (b) packing diagram 2 viewed along crystallographic
b-axis
The X-ray data shows that 2 has similar structure as 1. Its crystallised in the
triclinic system with P1 space group, a = 9.39(6) Å, b = 9.59(6) Å, c = 17.59(2) Å,
α = 83.34(5)o, β = 79.60(4)o, γ = 82.51(5)o, Z = 1, V = 1536(18) Å3. Each of its
copper(II) centre was penta-coordinated with two N atoms from chelating bpy
[Cu-N1 = 2.005 (16) Å and Cu-N2 = 2.059 (19) Å], two O atoms from bridging
CH3(CH2)8COO- ligands (Cu-O1 = 1.919 (19) Å and Cu-O2 = 2.390 (16) Å), and an O
Univers
ity of
Mala
ya

66
atom from monodentate CH3(CH2)8COO- ligands (Cu-O3 = 1.901 (15) Å). The Cu(II)
atom was coplanar with the equatorial donor atoms of O(1)/O(3) and bpy ring with max
deviation of 0.016(5) at N(3) atom from the least square plane.
Its FTIR data (Table 4.1; Figure 4.15) shows the presence of the expected
functional groups. Hence, the Δνcoo values were 247 and 182 cm-1 in agreement with
monodentate nonbridging and syn-anti monodentate bridging CH3(CH2)8COO- ligands,
respectively, as observed in its single crystal structure.
Figure 4.15 FTIR spectrum of 2
Its UV-vis spectrum (Figure 4.16) in DMSO-C2H5OH shows a broad d-d band at
683 nm (εmax = 117 M-1 cm-1) and a shoulder to a strong charge transfer band at 388 nm
(εmax = 167 M-1 cm-1). These data were similar to 1 and may be similarly explained. Univ
ersity
of M
alaya
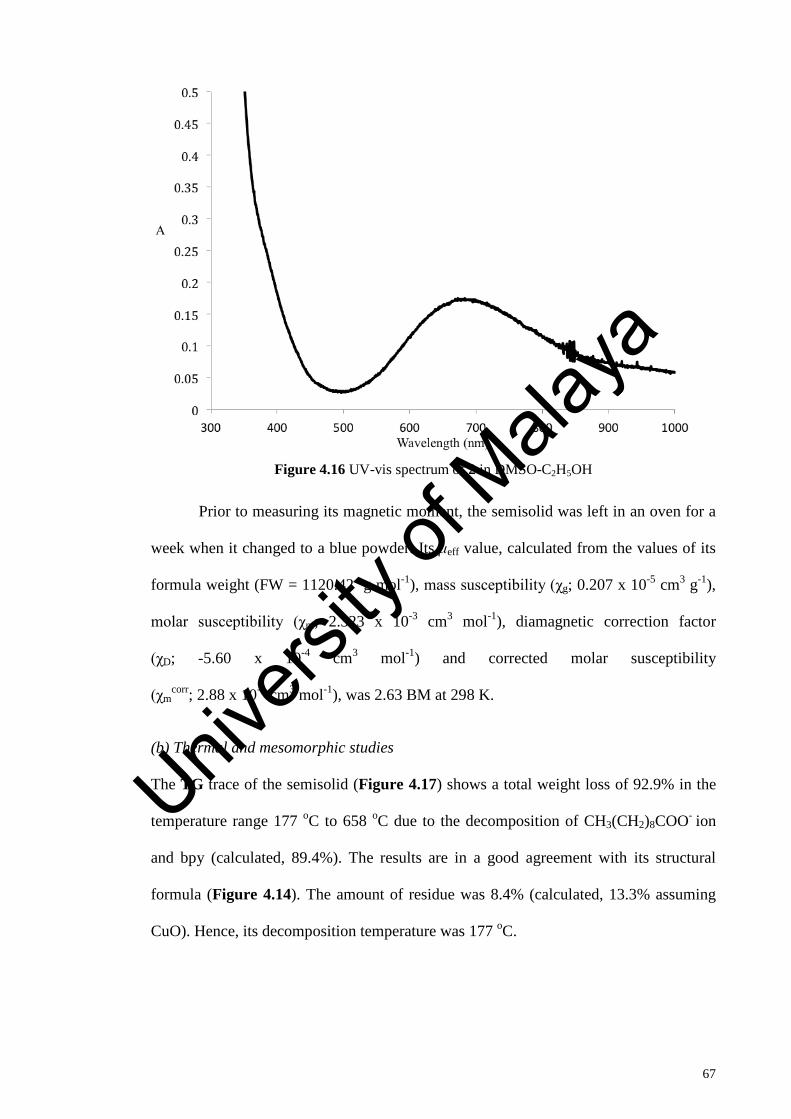
67
Figure 4.16 UV-vis spectrum of 2 in DMSO-C2H5OH
Prior to measuring its magnetic moment, the semisolid was left in an oven for a
week when it changed to a blue powder. Its μeff value, calculated from the values of its
formula weight (FW = 1120.42 g mol-1), mass susceptibility (χg; 0.207 x 10⁻⁵ cm3 g-1),
molar susceptibility (χm; 2.323 x 10⁻³ cm3 mol-1), diamagnetic correction factor
(χD; -5.60 x 10⁻⁴ cm3 mol-1) and corrected molar susceptibility
(χmcorr; 2.88 x 10⁻³ cm3 mol-1), was 2.63 BM at 298 K.
(b) Thermal and mesomorphic studies
The TG trace of the semisolid (Figure 4.17) shows a total weight loss of 92.9% in the
temperature range 177 oC to 658 oC due to the decomposition of CH3(CH2)8COO- ion
and bpy (calculated, 89.4%). The results are in a good agreement with its structural
formula (Figure 4.14). The amount of residue was 8.4% (calculated, 13.3% assuming
CuO). Hence, its decomposition temperature was 177 oC.
Univers
ity of
Mala
ya

68
Figure 4.17 TGA trace of 2
When viewed under POM, the semisolid was fluidic at 29.6 oC and then cleared
at about 100 oC. Upon cooling from I, bâtonnet textures were observed at
36 oC (Figure 4.18), indicating the formation of smectic A phase (SmA). In contrast, its
precursor complex, [Cu2(CH3(CH2)8COO)4(H2O)2], did not show any optical structures.
Similar observation was reported for crystals of [Cu2(CH3(CH2)8COO)4] by Ramos et
al., [40]. From these result, it is proposed that the structure of 2 changed to rod-like
when the syn-anti monodentate bridging CH3(CH2)8COO- ligand dissociated on heating.
Similar thermal effect on the binding modes of carboxylate ligands was suggested for
[Cu2(CH3(CH2)nCOO)4] (n = 4-8, 10, 12, 14, 16) by Moita et al. based on variable-
temperature FTIR spectroscopy [79] and by Abdullah et al. for
[Cu(R)2(4,4’-bpy)2].2RH (R = 2-hexydecanoate ion, 4,4’-bpy = 4,4’-bipyridine) [49].
Hence, 2 behaved as a thermotropic metallomesogen (smectogenic).
Univers
ity of
Mala
ya

69
Figure 4.18 Photomicrograph of 2 at 36 oC on cooling
The DSC traces for the semisolid (Figure 4.19) shows a broad endothermic
peak on heating at 33 oC (∆H = +35 kJ mol-1) assigned to breaking of the syn-anti
bridging bonds of the complex, and a broad peak endothermic peak at 118 oC
(∆H = +27 x 103 kJ mol-1) assigned to I. On cooling, there was an exothermic peak at
32oC (∆H = -36 kJ mol-1) assigned to I-M transition.
Figure 4.19 DSC scans of 2
Univers
ity of
Mala
ya
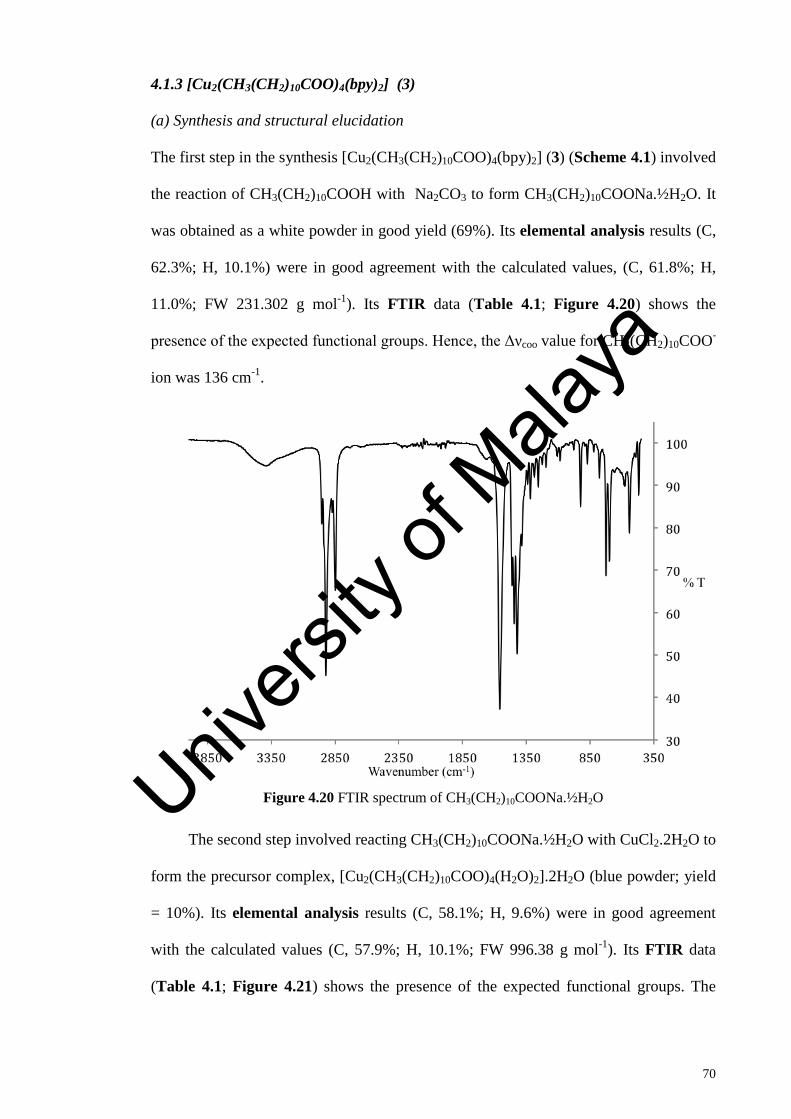
70
4.1.3 [Cu2(CH3(CH2)10COO)4(bpy)2] (3)
(a) Synthesis and structural elucidation
The first step in the synthesis [Cu2(CH3(CH2)10COO)4(bpy)2] (3) (Scheme 4.1) involved
the reaction of CH3(CH2)10COOH with Na2CO3 to form CH3(CH2)10COONa.½H2O. It
was obtained as a white powder in good yield (69%). Its elemental analysis results (C,
62.3%; H, 10.1%) were in good agreement with the calculated values, (C, 61.8%; H,
11.0%; FW 231.302 g mol-1). Its FTIR data (Table 4.1; Figure 4.20) shows the
presence of the expected functional groups. Hence, the Δνcoo value for CH3(CH2)10COO-
ion was 136 cm-1.
Figure 4.20 FTIR spectrum of CH3(CH2)10COONa.½H2O
The second step involved reacting CH3(CH2)10COONa.½H2O with CuCl2.2H2O to
form the precursor complex, [Cu2(CH3(CH2)10COO)4(H2O)2].2H2O (blue powder; yield
= 10%). Its elemental analysis results (C, 58.1%; H, 9.6%) were in good agreement
with the calculated values (C, 57.9%; H, 10.1%; FW 996.38 g mol-1). Its FTIR data
(Table 4.1; Figure 4.21) shows the presence of the expected functional groups. The
Univers
ity of
Mala
ya

71
Δνcoo value was 177 cm-1, indicating that CH3(CH2)10COO- was coordinated at a
bridging ligand in the complex.
Figure 4.21 FTIR spectrum of [Cu2(CH3(CH2)10COO)4(H2O)2].2H2O
Its UV-vis spectrum (Figure 4.22) in DMSO-C2H5OH shows a broad d-d band
at 693 nm (εmax = 467 M-1 cm-1). The data are similar to previously discussed
complexes, and may be similarly explained.
Univers
ity of
Mala
ya

72
Figure 4.22 UV-vis spectrum of [Cu2(CH3(CH2)10COO)4(H2O)2].2H2O in DMSO-C2H5OH
The μeff value for [Cu2(CH3(CH2)10COO)4(H2O)2].2H2O could not determined
due to insufficient sample.
[Cu2(CH3(CH2)10COO)4(H2O)2].2H2O reacted with bpy to form a blue powder
(yield = 95%), which on recrystallisation from ethanol, formed blue crystals. Single
crystal X-ray crystallographic data and structure refinement for the crystal is shown in
Table 4.2, selected bond lengths and angles are shown in Table 4.3, and ORTEP
presentations and packing patterns are shown in Figure 4.23. Hence, the structural
formula for the crystal was [Cu2(CH3(CH2)10COO)4(bpy)2] (3) which was similar to 1
and 2.
Univ
ersity
of M
alaya

73
(a)
(b)
Figure 4.23 (a) Molecular structure, and (b) packing diagram 3 viewed along crystallographic
b-axis
The X-ray data shows that 3 has similar structure as 1 and 2. It crystallised in the
triclinic system with P-1 space group, a = 9.35(7) Å, b = 9.61(6) Å, c = 19.88(13) Å,
α = 86.80(5)o, β = 77.04(4)o, γ = 81.22(5)o, Z = 1, V = 1720(19) Å3. Each of its
copper(II) centre was penta-coordinated with two N atoms from chelating bpy
[Cu-N1 = 2.016 (2) Å and Cu-N2 = 2.022 (3) Å], two O atoms from bridging
CH3(CH2)10COO- ligands (Cu-O1 = 1.952 (2) Å and Cu-O2 = 2.393 (2) Å), and an O
atom from monodentate CH3(CH2)10COO- ligands (Cu-O3 = 1.939 (2) Å). The Cu(II)
atom was coplanar with the equatorial donor atoms of O(17)/O(17a) and bpy ring with
max deviation of 0.007(3) at N(5) atom from the least square plane.
Univers
ity of
Mala
ya
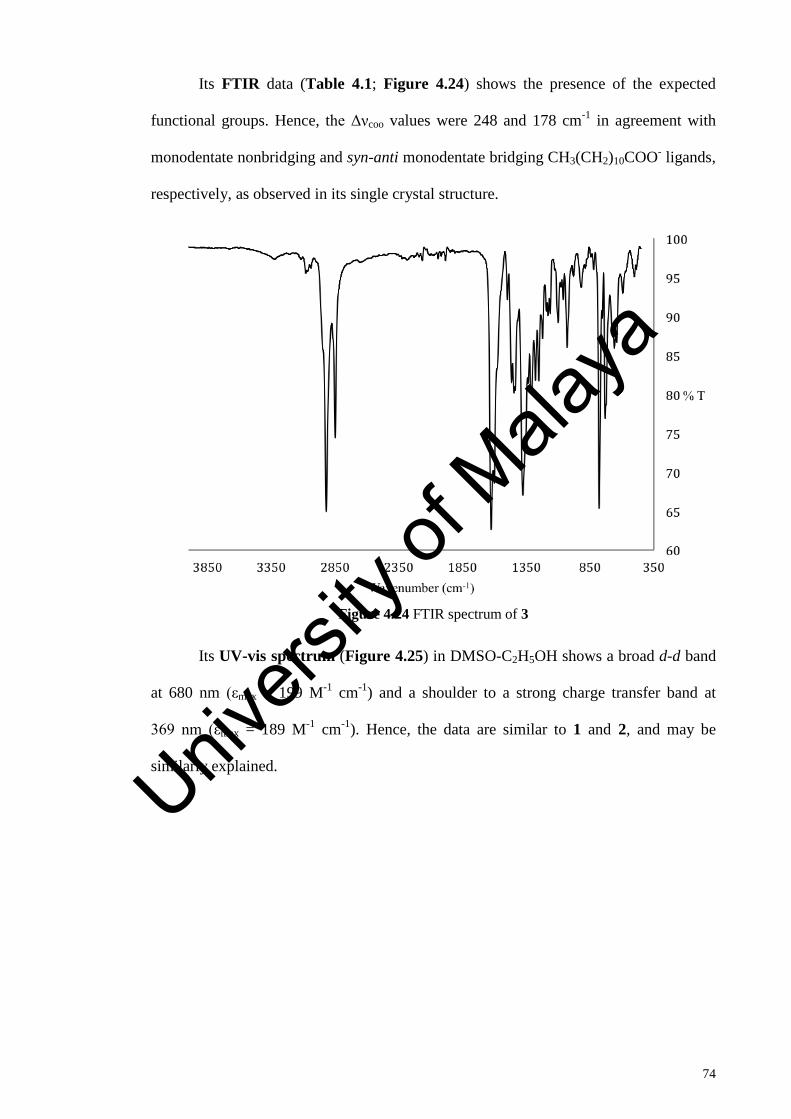
74
Its FTIR data (Table 4.1; Figure 4.24) shows the presence of the expected
functional groups. Hence, the Δνcoo values were 248 and 178 cm-1 in agreement with
monodentate nonbridging and syn-anti monodentate bridging CH3(CH2)10COO- ligands,
respectively, as observed in its single crystal structure.
Figure 4.24 FTIR spectrum of 3
Its UV-vis spectrum (Figure 4.25) in DMSO-C2H5OH shows a broad d-d band
at 680 nm (εmax = 199 M-1 cm-1) and a shoulder to a strong charge transfer band at
369 nm (εmax = 189 M-1 cm-1). Hence, the data are similar to 1 and 2, and may be
similarly explained.
Univers
ity of
Mala
ya
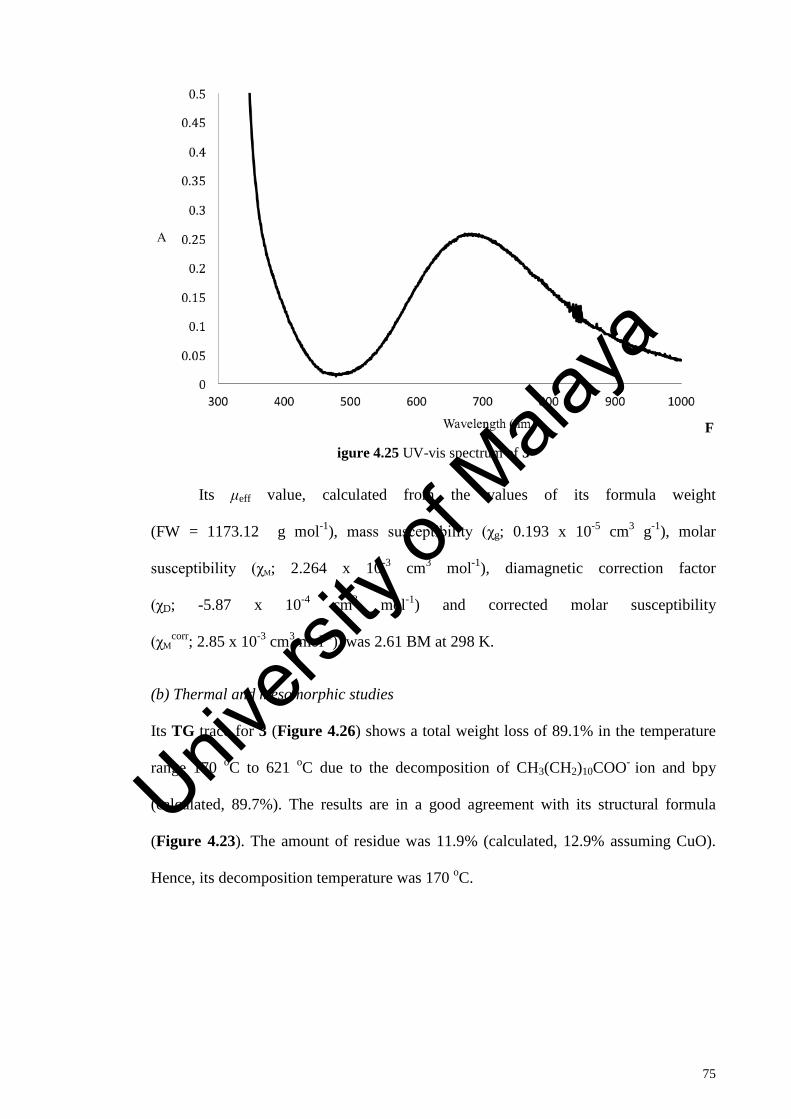
75
F
igure 4.25 UV-vis spectrum of 3
Its μeff value, calculated from the values of its formula weight
(FW = 1173.12 g mol-1), mass susceptibility (χg; 0.193 x 10⁻⁵ cm3 g-1), molar
susceptibility (χM; 2.264 x 10⁻³ cm3 mol-1), diamagnetic correction factor
(χD; -5.87 x 10⁻⁴ cm3 mol-1) and corrected molar susceptibility
(χMcorr; 2.85 x 10⁻³ cm3 mol-1), was 2.61 BM at 298 K.
(b) Thermal and mesomorphic studies
Its TG trace for 3 (Figure 4.26) shows a total weight loss of 89.1% in the temperature
range 170 oC to 621 oC due to the decomposition of CH3(CH2)10COO- ion and bpy
(calculated, 89.7%). The results are in a good agreement with its structural formula
(Figure 4.23). The amount of residue was 11.9% (calculated, 12.9% assuming CuO).
Hence, its decomposition temperature was 170 oC.
Univers
ity of
Mala
ya
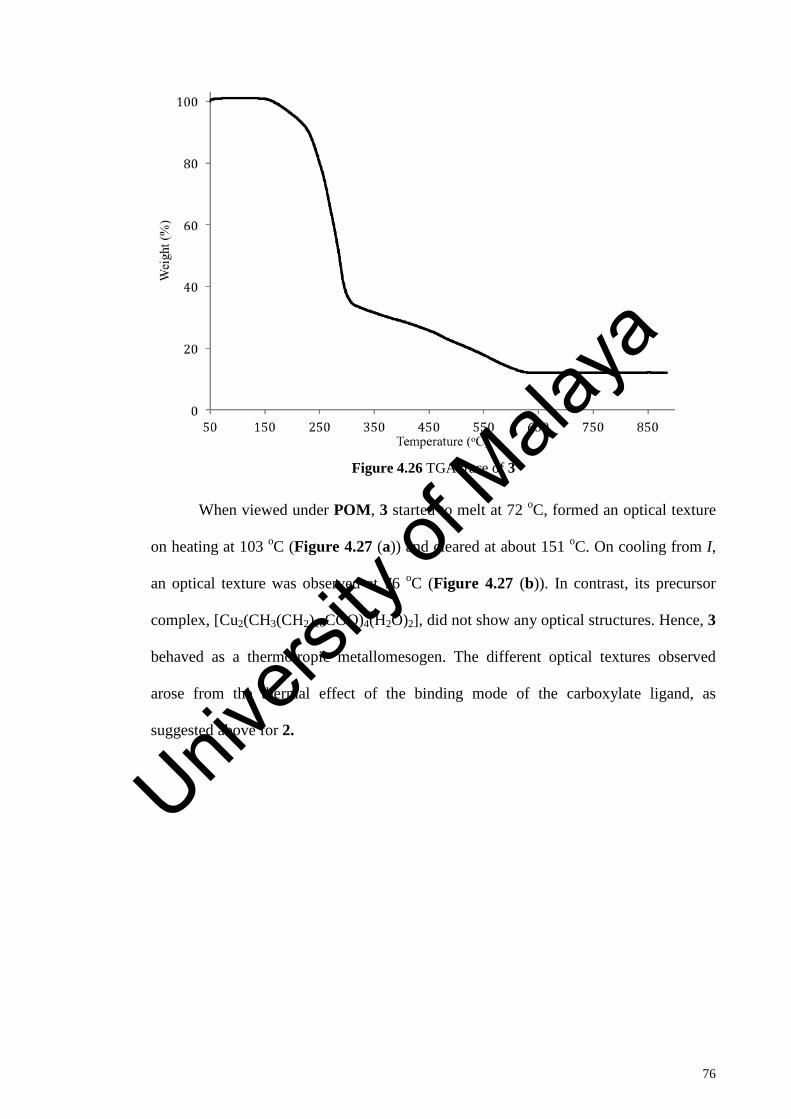
76
Figure 4.26 TGA trace of 3
When viewed under POM, 3 started to melt at 72 oC, formed an optical texture
on heating at 103 oC (Figure 4.27 (a)) and cleared at about 151 oC. On cooling from I,
an optical texture was observed at 76 oC (Figure 4.27 (b)). In contrast, its precursor
complex, [Cu2(CH3(CH2)10COO)4(H2O)2], did not show any optical structures. Hence, 3
behaved as a thermotropic metallomesogen. The different optical textures observed
arose from the thermal effect of the binding mode of the carboxylate ligand, as
suggested above for 2.
Univers
ity of
Mala
ya

77
(a) (b)
Figure 4.27 Pictomicrographs of: (a) 3 on heating at 103 oC; (b) 3 on cooling at 76 oC
Its DSC traces (Figure 4.28) shows overlapping endothermic peaks at 62 oC
(∆Hcombined = +87 kJ mol-1) assigned to Cr1-Cr2 and Cr2-M transitions, and a broad
endothermic peak at 129 oC (∆H = +4 kJ mol-1) assigned to M-I transition. On cooling,
there were two exothermic peaks at 102 oC (∆H = -10 kJ mol-1) and 67 oC
(∆H = -1 kJ mol-1) assigned to I-M transition and M-Cr2 transitions, respectively.
Figure 4.28 DSC scans of 3
Univers
ity of
Mala
ya

78
4.1.4 [Cu2(CH3(CH2)12COO)4(bpy)2] (4)
(a) Synthesis and structural elucidation
The first step in the synthesis [Cu2(CH3(CH2)12COO)4(bpy)2] (4) (Scheme 4.1) involved
the reaction of CH3(CH2)12COOH with Na2CO3 to form CH3(CH2)12COONa. It was
obtained as a white powder in good yield (83%). The results of its elemental analyses
(C, 66.1%; H, 11.9%) were in good agreement with the calculated values (C, 67.2%; H,
10.9%; FW 250.346 g mol-1). Its FTIR data (Table 4.1; Figure 4.29) shows the
presence of the expected functional groups. Hence, the Δνcoo value for CH3(CH2)12COO-
ion was 136 cm-1.
Figure 4.29 FTIR spectrum of CH3(CH2)12COONa
The second step involved reacting CH3(CH2)12COONa with CuCl2.2H2O to form
the precursor complex, [Cu2(CH3(CH2)12COO)4(H2O)2].4H2O (blue powder; yield =
23%). The results of its elemental analyses (C, 57.3%; H, 10.0%) were in good
agreement with the calculated values (C, 58.8%; H, 10.5%); FW 1144.62 g mol-1). Its
FTIR data (Table 4.1; Figure 4.30) shows the presence of the expected functional
groups. The Δνcoo value was 140 cm-1, indicating that CH3(CH2)12COO- ion was
Univers
ity of
Mala
ya

79
coordinated as a bridging ligand in the complex as the value was higher than
CH3(CH2)12COO- ion (136 cm-1).
Figure 4.30 FTIR spectrum of [Cu2(CH3(CH2)12COO)4(H2O)2].4H2O
Its UV-vis spectrum (Figure 4.31) in DMSO-C2H5OH shows a broad d-d band
at 700 nm (εmax = 156 M-1 cm-1) and a shoulder to a strong charge transfer band at
357 nm (εmax = 161 M-1 cm-1). The results were similar to previously discussed
precursors, and may be similarly explained.
Univers
ity of
Mala
ya
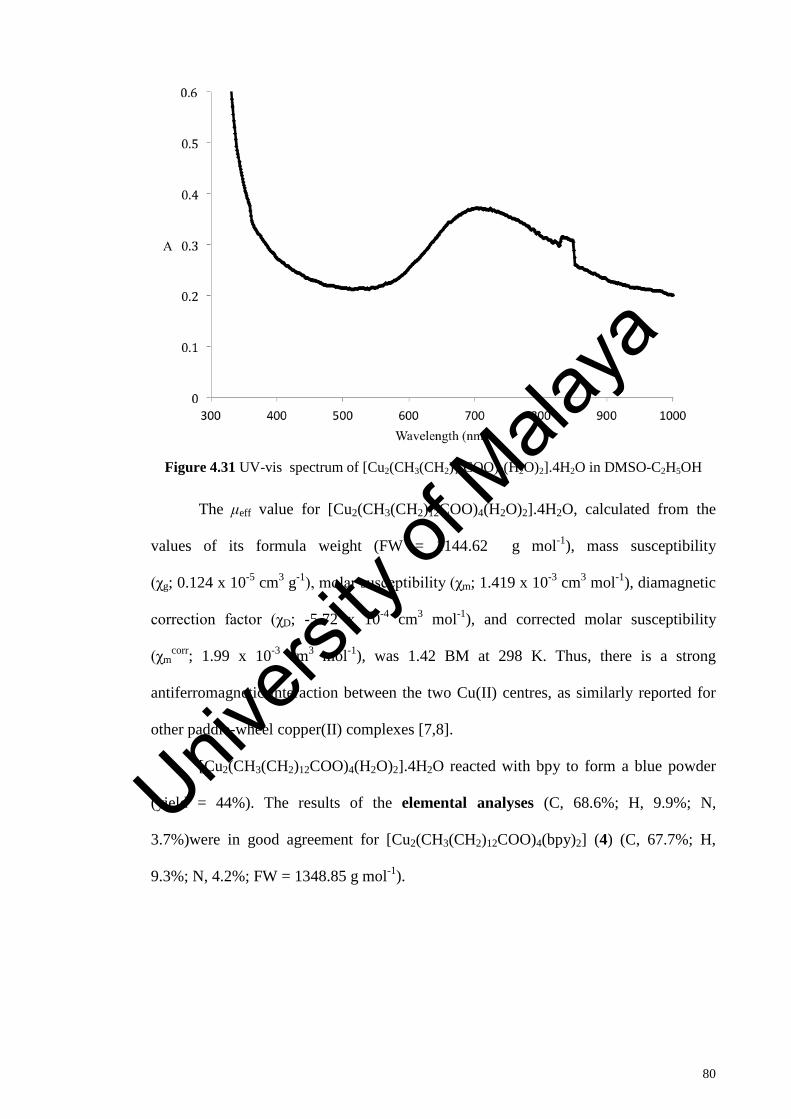
80
Figure 4.31 UV-vis spectrum of [Cu2(CH3(CH2)12COO)4(H2O)2].4H2O in DMSO-C2H5OH
The μeff value for [Cu2(CH3(CH2)12COO)4(H2O)2].4H2O, calculated from the
values of its formula weight (FW = 1144.62 g mol-1), mass susceptibility
(χg; 0.124 x 10⁻⁵ cm3 g-1), molar susceptibility (χm; 1.419 x 10⁻³ cm3 mol-1), diamagnetic
correction factor (χD; -5.72 x 10⁻⁴ cm3 mol-1), and corrected molar susceptibility
(χmcorr; 1.99 x 10⁻³ cm3 mol-1), was 1.42 BM at 298 K. Thus, there is a strong
antiferromagnetic interaction between the two Cu(II) centres, as similarly reported for
other paddle-wheel copper(II) complexes [7,8].
[Cu2(CH3(CH2)12COO)4(H2O)2].4H2O reacted with bpy to form a blue powder
(yield = 44%). The results of the elemental analyses (C, 68.6%; H, 9.9%; N,
3.7%)were in good agreement for [Cu2(CH3(CH2)12COO)4(bpy)2] (4) (C, 67.7%; H,
9.3%; N, 4.2%; FW = 1348.85 g mol-1).
Univers
ity of
Mala
ya

81
Its FTIR data (Table 4.1; Figure 4.32) shows the presence of the expected
functional groups. Hence, the Δνcoo values were 220 and 158 cm-1 in agreement with
monodentate nonbridging and syn-anti monodentate bridging CH3(CH2)12COO- ligands,
respectively.
Figure 4.32 FTIR spectrum of 4
Its UV-vis spectrum (Figure 4.33) in DMSO-C2H5OH shows a broad d-d band
at 678 nm (εmax = 171 M-1 cm-1) and a shoulder to a strong charge transfer band at 367
nm (εmax = 148 M-1 cm-1). The data were similar and may be similarly explained.
Univers
ity of
Mala
ya

82
Figure 4.33 UV-vis spectrum of 4
Combining the above data, it is proposed that 4 has similar structure as 1 - 3.
Its μeff value, calculated from the values of its formula weight
(FW = 1348.85 g mol-1), mass susceptibility (χg; 1.98 x 10⁻⁶ cm3 g-1), molar
susceptibility (χm; 2.671 x 10⁻³ cm3 mol-1), diamagnetic correction factor
(χD; -6.74 x 10⁻⁴ cm3 mol-1) and corrected molar susceptibility
(χmcorr; 3.35 x 10⁻³ cm3 mol-1), was 2.83 BM at 298 K.
(b) Thermal and mesomorphic studies
The TG trace of 4 (Figure 4.34) shows a total weight loss of 89.8% in the temperature
range 163 oC to 621 oC due to the decomposition of CH3(CH2)12COO- ion and bpy
(calculated, 90.6%). The results are in a good agreement with its structural formula. The
amount of residue was 10.2% (calculated, 9.4% assuming CuO). Hence, its
decomposition temperature was 163 oC.
Univers
ity of
Mala
ya
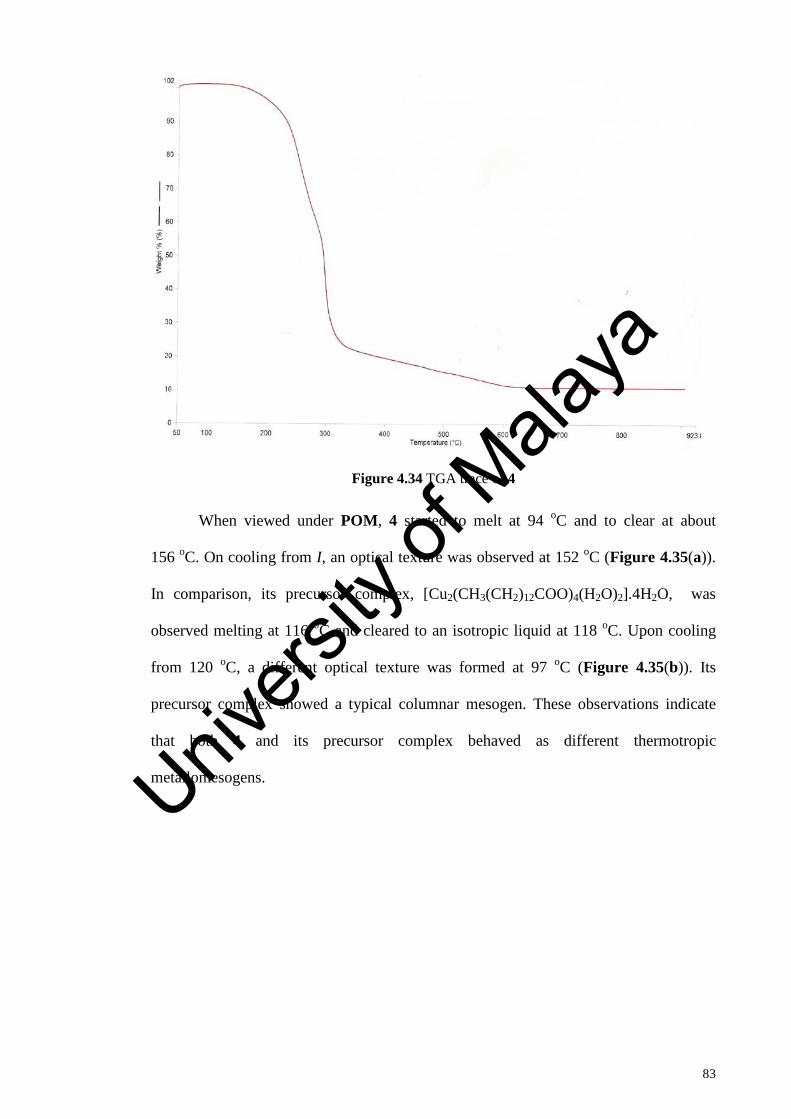
83
Figure 4.34 TGA trace of 4
When viewed under POM, 4 started to melt at 94 oC and to clear at about
156 oC. On cooling from I, an optical texture was observed at 152 oC (Figure 4.35(a)).
In comparison, its precursor complex, [Cu2(CH3(CH2)12COO)4(H2O)2].4H2O, was
observed melting at 116 oC and cleared to an isotropic liquid at 118 oC. Upon cooling
from 120 oC, a different optical texture was formed at 97 oC (Figure 4.35(b)). Its
precursor complex showed a typical columnar mesogen. These observations indicate
that both 4 and its precursor complex behaved as different thermotropic
metallomesogens.
Univers
ity of
Mala
ya
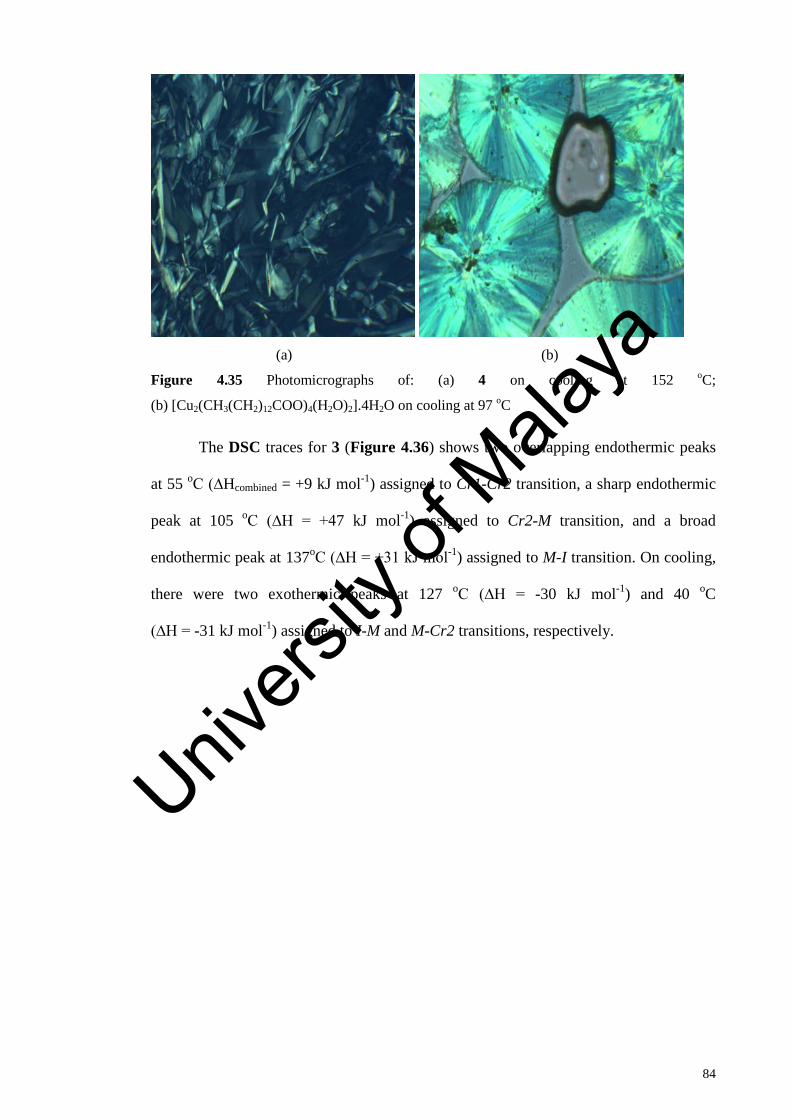
84
(a) (b)
Figure 4.35 Photomicrographs of: (a) 4 on cooling at 152 oC;
(b) [Cu2(CH3(CH2)12COO)4(H2O)2].4H2O on cooling at 97 oC
The DSC traces for 3 (Figure 4.36) shows two overlapping endothermic peaks
at 55 oC (∆Hcombined = +9 kJ mol-1) assigned to Cr1-Cr2 transition, a sharp endothermic
peak at 105 oC (∆H = +47 kJ mol-1) assigned to Cr2-M transition, and a broad
endothermic peak at 137oC (∆H = +31 kJ mol-1) assigned to M-I transition. On cooling,
there were two exothermic peaks at 127 oC (∆H = -30 kJ mol-1) and 40 oC
(∆H = -31 kJ mol-1) assigned to I-M and M-Cr2 transitions, respectively.
Univers
ity of
Mala
ya
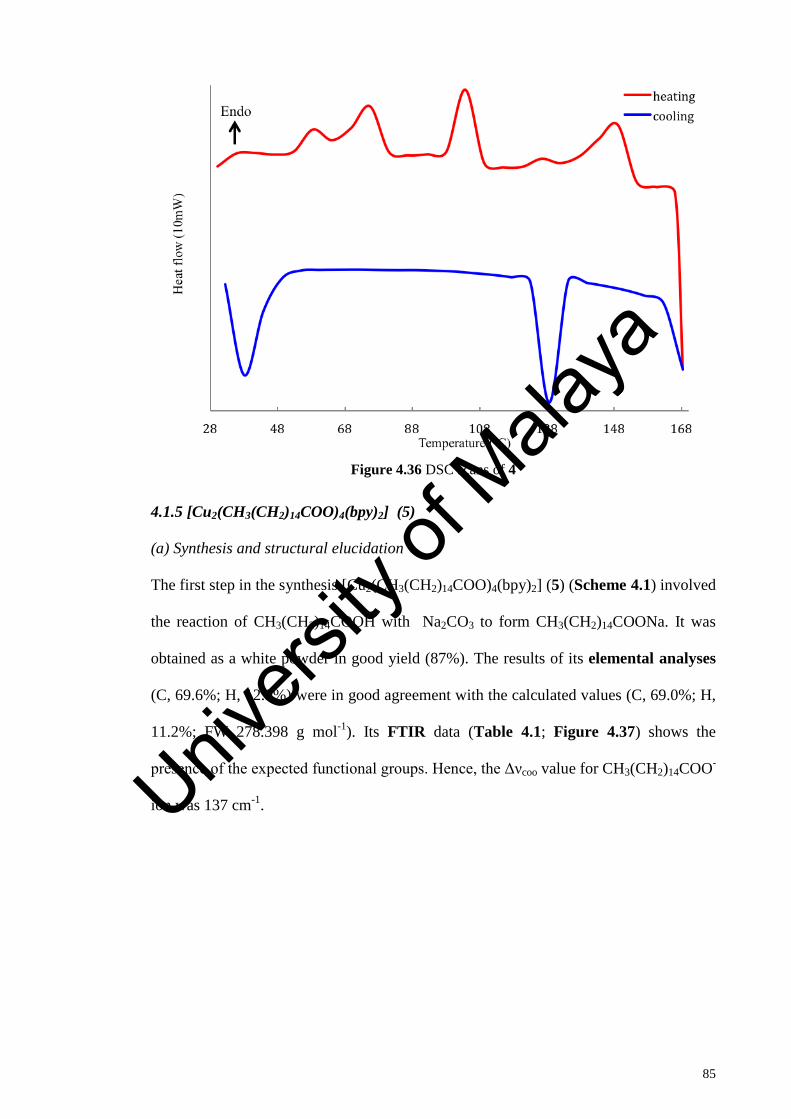
85
Figure 4.36 DSC scans of 4
4.1.5 [Cu2(CH3(CH2)14COO)4(bpy)2] (5)
(a) Synthesis and structural elucidation
The first step in the synthesis [Cu2(CH3(CH2)14COO)4(bpy)2] (5) (Scheme 4.1) involved
the reaction of CH3(CH2)14COOH with Na2CO3 to form CH3(CH2)14COONa. It was
obtained as a white powder in good yield (87%). The results of its elemental analyses
(C, 69.6%; H, 12.9%) were in good agreement with the calculated values (C, 69.0%; H,
11.2%; FW 278.398 g mol-1). Its FTIR data (Table 4.1; Figure 4.37) shows the
presence of the expected functional groups. Hence, the Δνcoo value for CH3(CH2)14COO-
ion was 137 cm-1. Univers
ity of
Mala
ya

86
Figure 4.37 FTIR spectrum of CH3(CH2)14COONa
The second step involved reacting CH3(CH2)14COONa with CuCl2.2H2O to form
the precursor complex, [Cu2(CH3(CH2)14COO)4(H2O)2] (blue powder; yield = 38%).
The results of its elemental analyses (C, 64.4%; H, 11.3%) were in good agreement
with the calculated values (C, 64.9%; H, 10.9%; FW 1184.76 g mol-1). Its FTIR data
(Table 4.1; Figure 4.38) shows the presence of the expected functional groups. The
Δνcoo value was 140 cm-1, indicating that CH3(CH2)14COO- was coordinated at a
bridging ligand in the complex as the value is higher than the CH3(CH2)14COO- ion
(137 cm-1).
Univers
ity of
Mala
ya
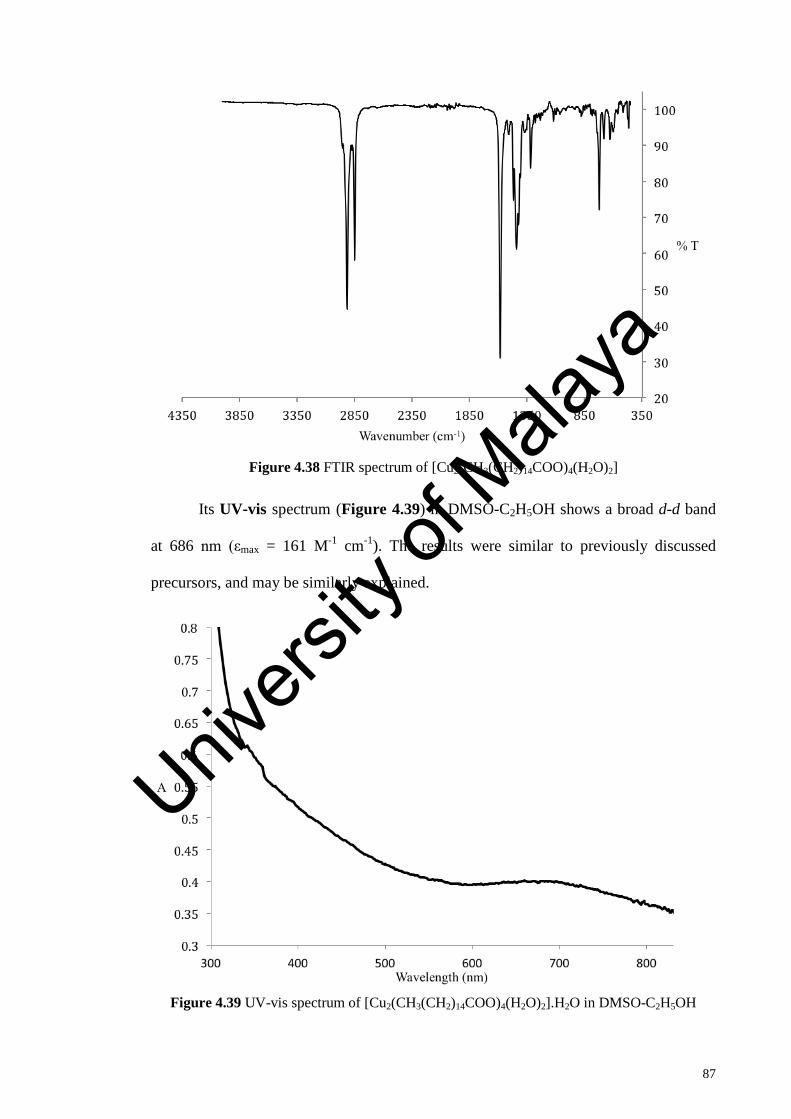
87
Figure 4.38 FTIR spectrum of [Cu2(CH3(CH2)14COO)4(H2O)2]
Its UV-vis spectrum (Figure 4.39) in DMSO-C2H5OH shows a broad d-d band
at 686 nm (εmax = 161 M-1 cm-1). The results were similar to previously discussed
precursors, and may be similarly explained.
Figure 4.39 UV-vis spectrum of [Cu2(CH3(CH2)14COO)4(H2O)2].H2O in DMSO-C2H5OH
Univers
ity of
Mala
ya
88
The μeff value for [Cu2(CH3(CH2)14COO)4(H2O)2], calculated from the values of
its formula weight (FW = 1184.76 g mol-1), mass susceptibility (χg; 8.30 x 10⁻⁷ cm3 g-1),
molar susceptibility (χm; 9.84 x 10⁻⁴ cm3 mol-1), diamagnetic correction factor
(χD; -5.92 x 10⁻⁴ cm3 mol-1) and corrected molar susceptibility
(χmcorr; 1.58 x 10⁻³ cm3 mol-1), was 1.94 BM at 298 K. Thus, it may be said that there is
an antiferromagnetic interaction between the two Cu(II) centres. Hence, the structure of
[Cu2(CH3(CH2)14COO)4(H2O)2].H2O was proposed to have a paddle-wheel structures as
similar values were reported.
[Cu2(CH3(CH2)14COO)4(H2O)2] reacted with bpy to form a blue powder, which
on recrystallisation from ethanol, formed blue crystals (yield = 81%). Single crystal
X-ray crystallographic data and structure refinement for the crystal is shown in
Table 4.2, selected bond lengths and angles are shown in Table 4.3, and ORTEP
presentations and packing patterns are shown in Figure 4.40. Hence, the structural
formula for the crystal was [Cu2(CH3(CH2)14COO)4(bpy)2] (5), which was similar to
1 – 3.
Univers
ity of
Mala
ya

89
(a)
(b)
Figure 4.40 (a) Molecular structure, and (b) packing diagram 5 viewed along crystallographic
b-axis.
The X-ray data shows that 5 has similar structure as 1 to 3. It crystallised in the
triclinic system with P-1 space group, a = 9.00(2) Å, b = 9.88(2) Å, c = 23.28(5) Å,
α = 92.73(4)o, β = 98.76(5)o, γ = 101.51(4)o, Z = 1, V = 1998.7(7) Å3. Each of its
copper(II) centre was penta-coordinated with two N atoms from chelating bpy
[Cu-N1 = 2.011 (16) Å and Cu-N2 = 2.018 (16) Å], two O atoms from bridging
CH3(CH2)14COO- ligands (Cu-O1 = 1.964 (13) Å and Cu-O2 = 2.331 (13) Å), and an O
atom from monodentate CH3(CH2)14COO- ligands (Cu-O3 = 1.938 (14) Å).
Its FTIR data (Table 4.1; Figure 4.41) shows the presence of the expected
functional groups. Hence, the Δνcoo values were 259 and 158 cm-1 in agreement with
Univers
ity of
Mala
ya

90
monodentate nonbridging and syn-anti monodentate bridging CH3(CH2)14COO- ligands,
respectively, as observed in its single crystal structure.
Figure 4.41 FTIR spectrum of 5
Its UV-vis spectrum (Figure 4.42) in DMSO-C2H5OH shows a broad d-d band
at 673 nm (εmax = 122 M-1 cm-1). The results were similar to previously discussed
precursors, and may be similarly explained.
Univers
ity of
Mala
ya

91
Figure 4.42 UV-vis spectrum of 5
Its μeff value, calculated from the values of its formula weight
(FW = 1461.14 g mol-1), mass susceptibility (χg; 1.38 x 10⁻⁶ cm3 g-1), molar
susceptibility (χm; 2.01 x 10⁻³ cm3 mol-1), diamagnetic correction factor
(χD; -7.31 x 10⁻⁴ cm3 mol-1) and corrected molar susceptibility
(χmcorr; 2.75 x 10⁻³ cm3 mol-1), was 2.56 BM at 298 K.
(b) Thermal and mesomorphic studies
The TG trace of 5 (Figure 4.43) shows a total weight loss of 89.3% in the temperature
range 161 oC to 596 oC due to the decomposition of CH3(CH2)14COO- ion and bpy
(calculated, 91.3%). The results are in a good agreement with its structural formula
(Figure 4.40). The amount of residue was 11.4% (calculated, 10.9% assuming CuO).
Hence, its decomposition temperature was 161 oC.
Univers
ity of
Mala
ya

92
Figure 4.43 TGA trace of 5
When viewed under POM, 5 started to melt at 118 oC and to clear at about
151 oC. Upon cooling from I, an optical texture was observed at 140 oC (Figure
4.44(a)). In comparison, its precursor complex, [Cu2(CH3(CH2)14COO)4(H2O)2].H2O,
was observed melting at 117 oC and cleared to an isotropic liquid at 130 oC. Upon
cooling from 130 oC, a different optical texture was formed at 85 oC (Figure 4.44(b)).
These observations indicate that both 5 and its precursor complex behaved as different
thermotropic metallomesogens.
Univers
ity of
Mala
ya

93
(a) (b)
Figure 4.44 Photomicrographs of: (a) 5 on cooling at 140 oC; (b)
[Cu2(CH3(CH2)14COO)4(H2O)2].H2O on cooling at 85 oC
The DSC traces for 5 (Figure 4.45) shows endothermic peaks at 90 oC
(∆H = +50 kJ mol-1) assigned to Cr1-Cr2 transition, 112 oC (∆H = +88 kJ mol-1)
assigned to Cr2-M transition, and 153 oC (∆H = +53 kJ mol-1) assigned to M-I
transition. On cooling, there were two exothermic peaks at 131 oC (∆H = -41 kJ mol-1)
and 64 oC (∆H = -62 kJ mol-1), assigned to I-M and M-Cr2 transitions, respectively.
Univers
ity of
Mala
ya

94
Figure 4.45 DSC scans of 5
4.1.6 Summary
To summarize, the analytical data for the precursor complexes, [Cu2(R)4] (R =
CH3(CH2)6-14COO) and complexes formed from their reactions with bpy (1-5) are
shown in Table 4.4 and Table 4.5, respectively.
Table 4.4 Precursor complexes of complexes 1 - 5
Proposed chemical formula Δνcoo (cm-1)
λmax, nm (εmax M-1 cm-1)
μeff (BM) M*
[Cu6Cl10(CH3(CH2)6COO)2].3H2O.2EtOH 157, 240 693 (104 ) - Yes
[Cu2(CH3(CH2)8COO)4(H2O)2] 192 699 (386) 2.2 No
[Cu2(CH3(CH2)10COO)4(H2O)2].2H2O 177 693 (467) - Yes
[Cu2(CH3(CH2)12COO)4(H2O)2].4H2O 140 700 (156) 1.42 Yes
[Cu2(CH3(CH2)14COO)4(H2O)2] 140 686 (161) 1.94 Yes
*M = mesomorphism
[Cu6Cl10(CH3(CH2)6COO)2].3H2O.2EtOH was a hexamer with bidentate
bridging and monodentate carboxylates ligand, while the other precursor complexes
Univers
ity of
Mala
ya
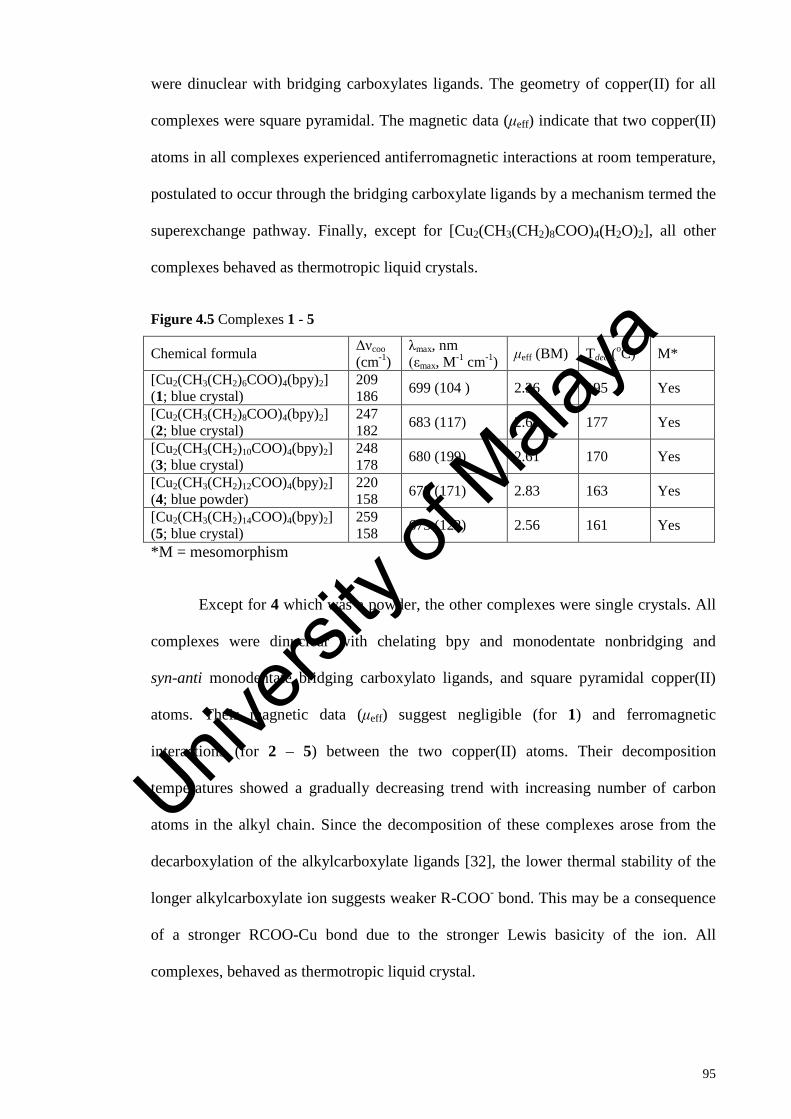
95
were dinuclear with bridging carboxylates ligands. The geometry of copper(II) for all
complexes were square pyramidal. The magnetic data (μeff) indicate that two copper(II)
atoms in all complexes experienced antiferromagnetic interactions at room temperature,
postulated to occur through the bridging carboxylate ligands by a mechanism termed the
superexchange pathway. Finally, except for [Cu2(CH3(CH2)8COO)4(H2O)2], all other
complexes behaved as thermotropic liquid crystals.
Figure 4.5 Complexes 1 - 5
Chemical formula Δνcoo (cm-1)
λmax, nm (εmax, M-1 cm-1) μeff (BM) Tdec (oC) M*
[Cu2(CH3(CH2)6COO)4(bpy)2] (1; blue crystal)
209 186 699 (104 ) 2.36 195 Yes
[Cu2(CH3(CH2)8COO)4(bpy)2] (2; blue crystal)
247 182 683 (117) 2.63 177 Yes
[Cu2(CH3(CH2)10COO)4(bpy)2] (3; blue crystal)
248 178 680 (199) 2.61 170 Yes
[Cu2(CH3(CH2)12COO)4(bpy)2] (4; blue powder)
220 158 678 (171) 2.83 163 Yes
[Cu2(CH3(CH2)14COO)4(bpy)2] (5; blue crystal)
259 158 673 (122) 2.56 161 Yes
*M = mesomorphism
Except for 4 which was a powder, the other complexes were single crystals. All
complexes were dinuclear with chelating bpy and monodentate nonbridging and
syn-anti monodentate bridging carboxylato ligands, and square pyramidal copper(II)
atoms. Their magnetic data (μeff) suggest negligible (for 1) and ferromagnetic
interactions (for 2 – 5) between the two copper(II) atoms. Their decomposition
temperatures showed a gradually decreasing trend with increasing number of carbon
atoms in the alkyl chain. Since the decomposition of these complexes arose from the
decarboxylation of the alkylcarboxylate ligands [32], the lower thermal stability of the
longer alkylcarboxylate ion suggests weaker R-COO- bond. This may be a consequence
of a stronger RCOO-Cu bond due to the stronger Lewis basicity of the ion. All
complexes, behaved as thermotropic liquid crystal.
Univers
ity of
Mala
ya
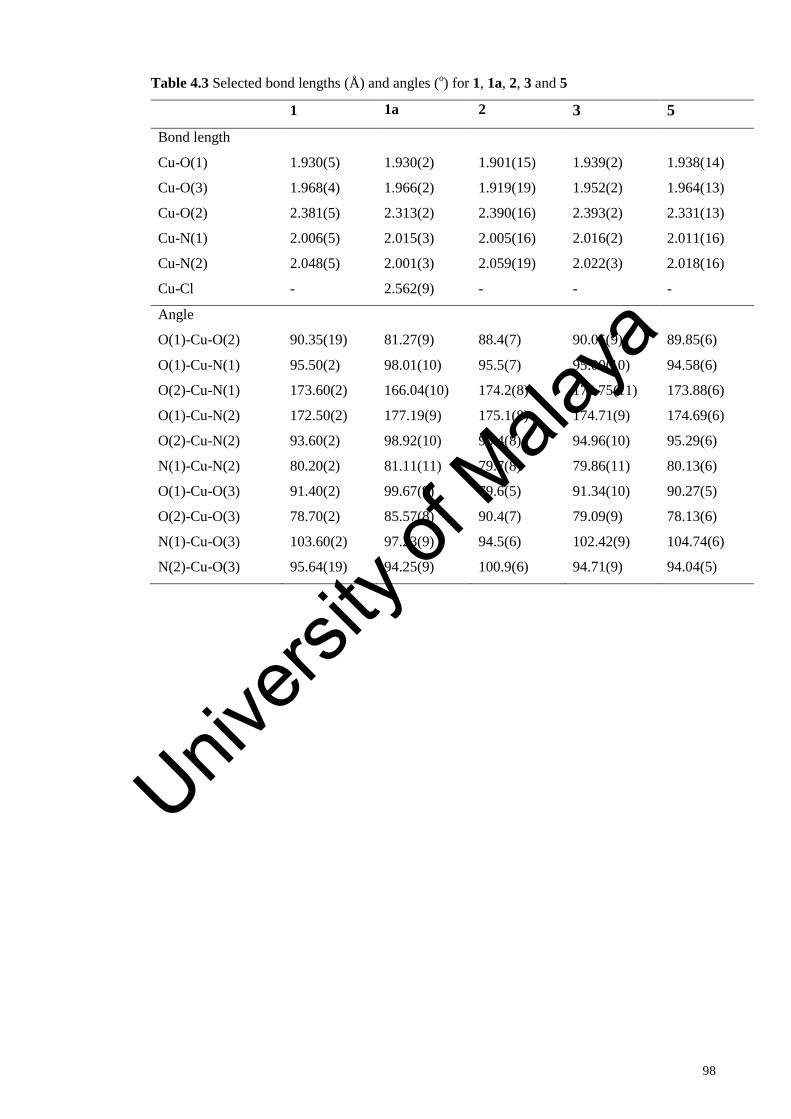
98
Table 4.3 Selected bond lengths (Å) and angles (o) for 1, 1a, 2, 3 and 5
1 1a 2 3 5
Bond length
Cu-O(1) 1.930(5) 1.930(2) 1.901(15) 1.939(2) 1.938(14)
Cu-O(3) 1.968(4) 1.966(2) 1.919(19) 1.952(2) 1.964(13)
Cu-O(2) 2.381(5) 2.313(2) 2.390(16) 2.393(2) 2.331(13)
Cu-N(1) 2.006(5) 2.015(3) 2.005(16) 2.016(2) 2.011(16)
Cu-N(2) 2.048(5) 2.001(3) 2.059(19) 2.022(3) 2.018(16)
Cu-Cl - 2.562(9) - - -
Angle
O(1)-Cu-O(2) 90.35(19) 81.27(9) 88.4(7) 90.05(9) 89.85(6)
O(1)-Cu-N(1) 95.50(2) 98.01(10) 95.5(7) 95.00(10) 94.58(6)
O(2)-Cu-N(1) 173.60(2) 166.04(10) 174.2(8) 172.75(11) 173.88(6)
O(1)-Cu-N(2) 172.50(2) 177.19(9) 175.1(8) 174.71(9) 174.69(6)
O(2)-Cu-N(2) 93.60(2) 98.92(10) 96.4(8) 94.96(10) 95.29(6)
N(1)-Cu-N(2) 80.20(2) 81.11(11) 79.7(8) 79.86(11) 80.13(6)
O(1)-Cu-O(3) 91.40(2) 99.67(9) 79.6(5) 91.34(10) 90.27(5)
O(2)-Cu-O(3) 78.70(2) 85.57(8) 90.4(7) 79.09(9) 78.13(6)
N(1)-Cu-O(3) 103.60(2) 97.23(9) 94.5(6) 102.42(9) 104.74(6)
N(2)-Cu-O(3) 95.64(19) 94.25(9) 100.9(6) 94.71(9) 94.04(5)
Univers
ity of
Mala
ya
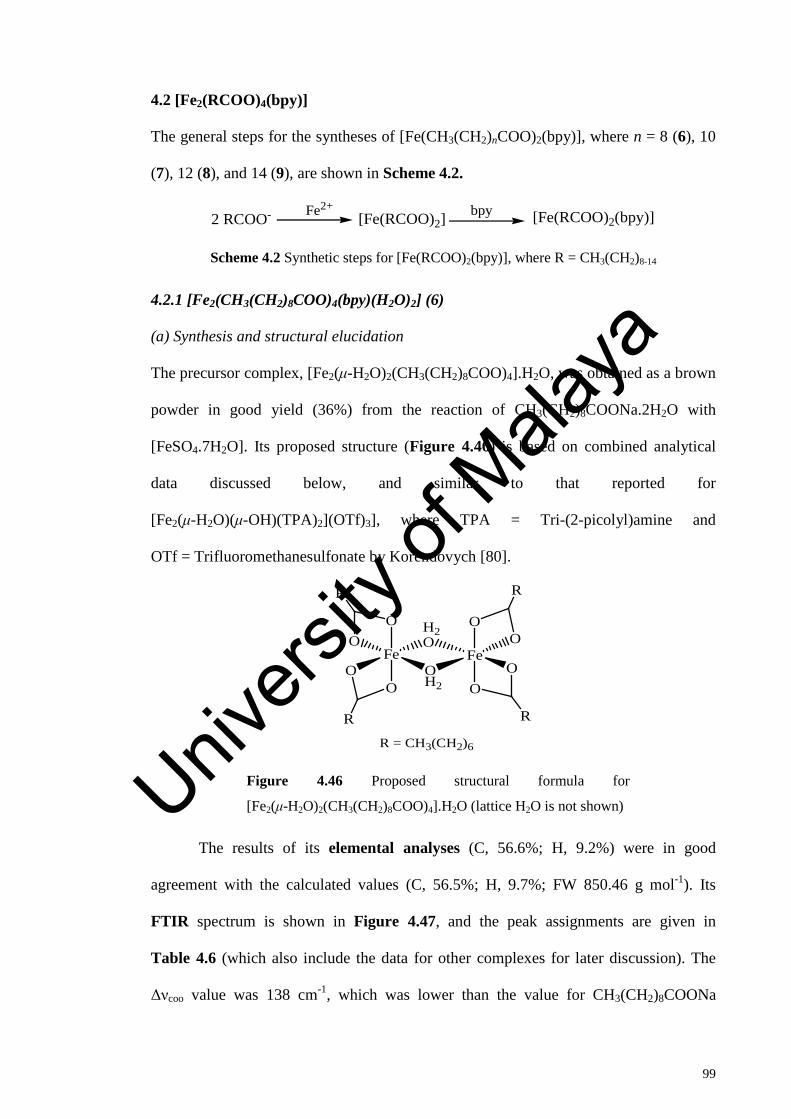
99
4.2 [Fe2(RCOO)4(bpy)]
The general steps for the syntheses of [Fe(CH3(CH2)nCOO)2(bpy)], where n = 8 (6), 10
(7), 12 (8), and 14 (9), are shown in Scheme 4.2.
2 RCOO- Fe2+[Fe(RCOO)2] bpy [Fe(RCOO)2(bpy)]
Scheme 4.2 Synthetic steps for [Fe(RCOO)2(bpy)], where R = CH3(CH2)8-14
4.2.1 [Fe2(CH3(CH2)8COO)4(bpy)(H2O)2] (6)
(a) Synthesis and structural elucidation
The precursor complex, [Fe2(μ-H2O)2(CH3(CH2)8COO)4].H2O, was obtained as a brown
powder in good yield (36%) from the reaction of CH3(CH2)8COONa.2H2O with
[FeSO4.7H2O]. Its proposed structure (Figure 4.46) is based on combined analytical
data discussed below, and similar to that reported for
[Fe2(μ-H2O)(μ-OH)(TPA)2](OTf)3], where TPA = Tri-(2-picolyl)amine and
OTf = Trifluoromethanesulfonate by Korendovych [80].
FeO
OH2O
OH2
O
O
R
R
FeO
OO
O
R
R
R = CH3(CH2)6
Figure 4.46 Proposed structural formula for
[Fe2(μ-H2O)2(CH3(CH2)8COO)4].H2O (lattice H2O is not shown)
The results of its elemental analyses (C, 56.6%; H, 9.2%) were in good
agreement with the calculated values (C, 56.5%; H, 9.7%; FW 850.46 g mol-1). Its
FTIR spectrum is shown in Figure 4.47, and the peak assignments are given in
Table 4.6 (which also include the data for other complexes for later discussion). The
Δνcoo value was 138 cm-1, which was lower than the value for CH3(CH2)8COONa
Univers
ity of
Mala
ya

100
(133 cm-1), indicating that CH3(CH2)8COO- ions were coordinated to both Fe(II) centres
as chelating ligands [81].
Figure 4.47 FTIR spectrum of [Fe2(μ-H2O)2(CH3(CH2)8COO)4].H2O
Table 4.6 FTIR data in (cm-1) and assignments
Compound CH2 (asym)
CH2 (sym)
COO (asym)
COO (sym)
C=C (aro) C-N
[Fe2(μ-H2O)2(CH3(CH2)8COO)4].H2O 2924 2854 1584 1446 - -
[Fe2(μ-H2O)2(CH3(CH2)10COO)4].2H2O 2927 2857 1577 1449 - -
[Fe2(μ-H2O)2(CH3(CH2)12COO)4].2H2O 2918 2851 1582/ 1533
1448 1423 - -
[Fe2(μ-H2O)2(CH3(CH2)14COO)4] 2919 2851 1573 1449 - -
[Fe2(CH3(CH2)8COO)4(bpy)(H2O)2]; (6) 2923 2854 1549 1442
1411 1580 1318
[Fe2(CH3(CH2)10COO)4(bpy)(H2O)2].2H2O; (7) 2917 2850 1605 1472
1433 1605 1304
[Fe2(CH3(CH2)12COO)4(bpy)(H2O)2]; (8) 2918 2851 1575 1431
1437 1583 1318
[Fe2(CH3(CH2)14COO)4(bpy)(H2O)2]; (9) 2918 2851 1573 1438
1433 1580 1321
Its UV-vis spectrum (Figure 4.48) in CHCl3 shows a d-d band appearing as a
shoulder on the strong CT band at 464 nm (ε = 377 M-1 cm-1), assigned to the
Univers
ity of
Mala
ya
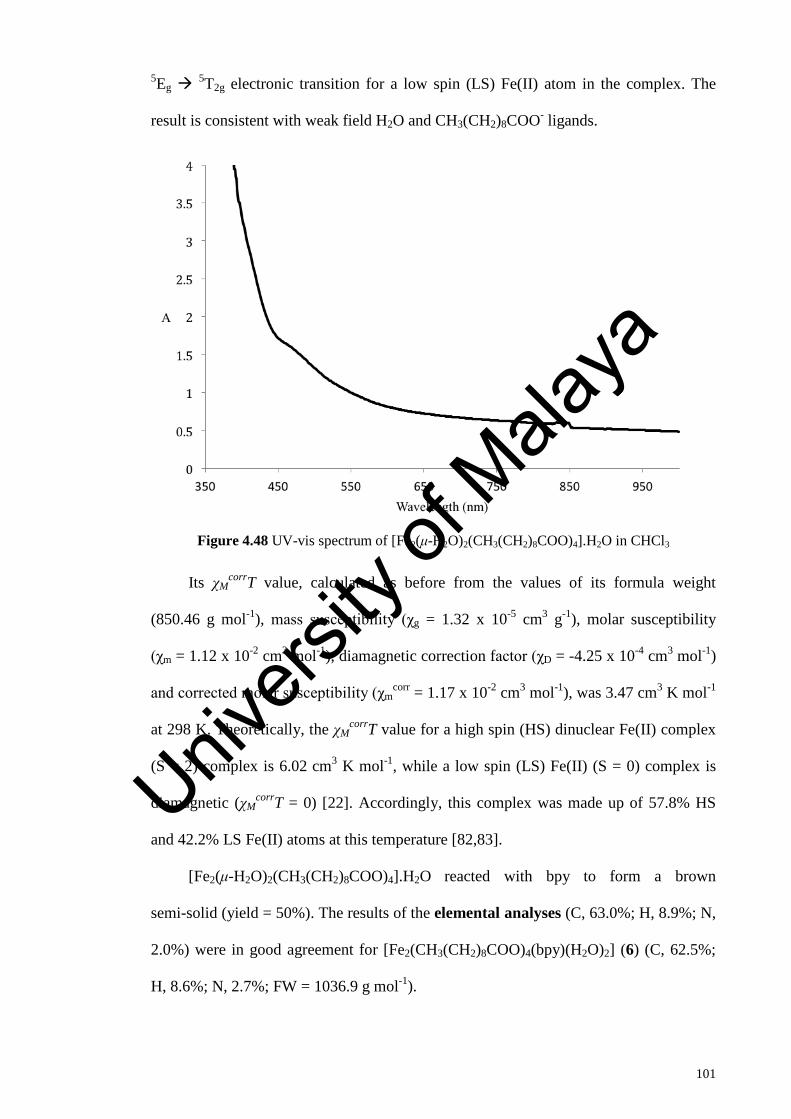
101
5Eg 5T2g electronic transition for a low spin (LS) Fe(II) atom in the complex. The
result is consistent with weak field H2O and CH3(CH2)8COO- ligands.
Figure 4.48 UV-vis spectrum of [Fe2(μ-H2O)2(CH3(CH2)8COO)4].H2O in CHCl3
Its χMcorrT value, calculated as before from the values of its formula weight
(850.46 g mol-1), mass susceptibility (χg = 1.32 x 10⁻⁵ cm3 g-1), molar susceptibility
(χm = 1.12 x 10⁻² cm3 mol-1), diamagnetic correction factor (χD = -4.25 x 10⁻⁴ cm3 mol-1)
and corrected molar susceptibility (χmcorr = 1.17 x 10⁻² cm3 mol-1), was 3.47 cm3 K mol-1
at 298 K. Theoretically, the χMcorrT value for a high spin (HS) dinuclear Fe(II) complex
(S = 2) complex is 6.02 cm3 K mol-1, while a low spin (LS) Fe(II) (S = 0) complex is
diamagnetic (χMcorrT = 0) [22]. Accordingly, this complex was made up of 57.8% HS
and 42.2% LS Fe(II) atoms at this temperature [82,83].
[Fe2(μ-H2O)2(CH3(CH2)8COO)4].H2O reacted with bpy to form a brown
semi-solid (yield = 50%). The results of the elemental analyses (C, 63.0%; H, 8.9%; N,
2.0%) were in good agreement for [Fe2(CH3(CH2)8COO)4(bpy)(H2O)2] (6) (C, 62.5%;
H, 8.6%; N, 2.7%; FW = 1036.9 g mol-1).
Univers
ity of
Mala
ya

102
Its FTIR data (Table 4.6; Figure 4.49) show the presence of the expected
functional groups. Hence, the Δνcoo values were 107 cm-1 and 138 cm-1, indicating two
different chelating CH3(CH2)8COO- ligands.
Figure 4.49 FTIR spectrum of 6
Its UV-vis spectrum (Figure 4.50) in chloroform shows a d-d band appearing as a
shoulder at 585 nm (ε = 146 M-1 cm-1) and a charge transfer band at 465 nm
(ε = 640 M-1 cm-1). The d-d peak was assigned to the electronic transition for a LS
Fe(II) atom, as similarly done for its precursor complex,
[Fe2(μ-H2O)2(CH3(CH2)8COO)4].H2O. Univers
ity of
Mala
ya
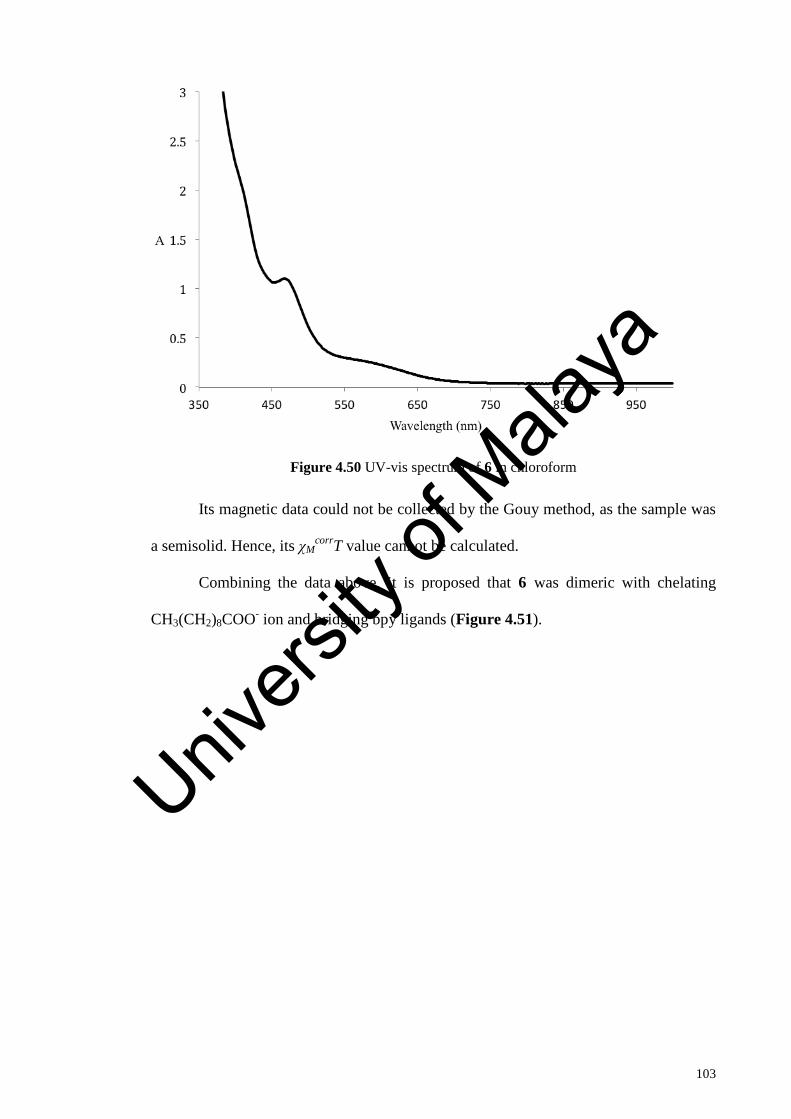
103
Figure 4.50 UV-vis spectrum of 6 in chloroform
Its magnetic data could not be collected by the Gouy method, as the sample was
a semisolid. Hence, its χMcorrT value cannot be calculated.
Combining the data above, it is proposed that 6 was dimeric with chelating
CH3(CH2)8COO- ion and bridging bpy ligands (Figure 4.51).
Univers
ity of
Mala
ya
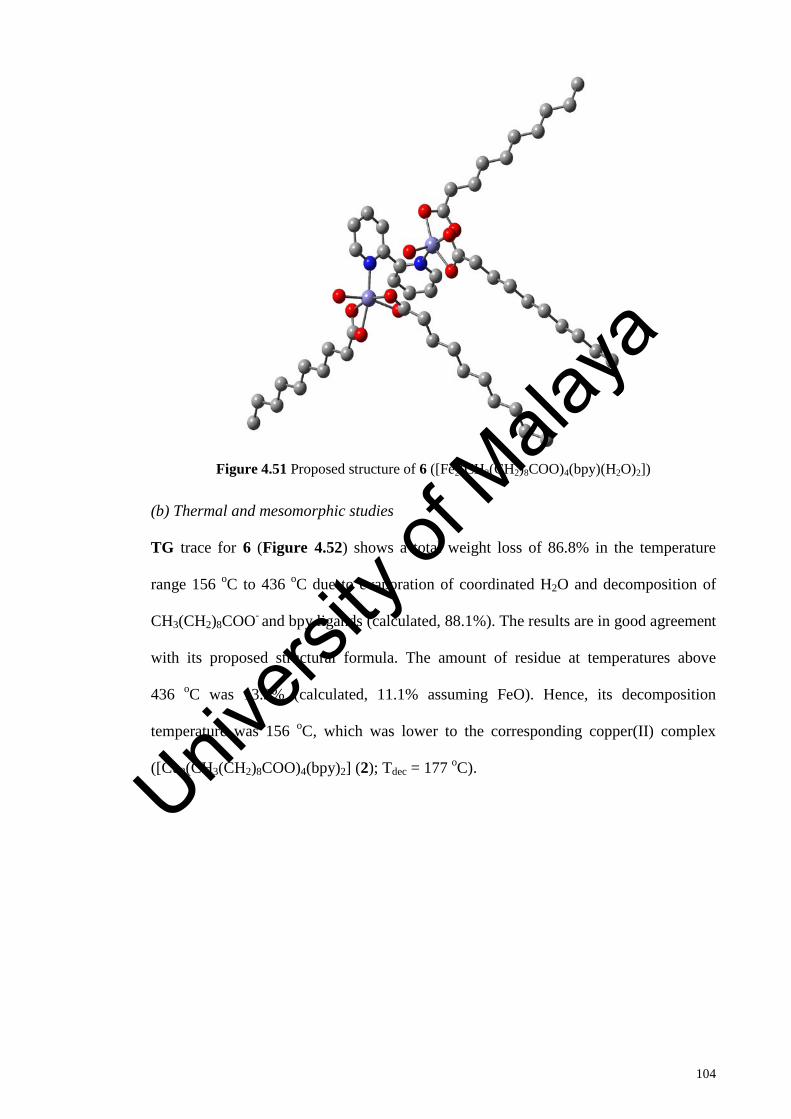
104
Figure 4.51 Proposed structure of 6 ([Fe2(CH3(CH2)8COO)4(bpy)(H2O)2])
(b) Thermal and mesomorphic studies
TG trace for 6 (Figure 4.52) shows a total weight loss of 86.8% in the temperature
range 156 oC to 436 oC due to evaporation of coordinated H2O and decomposition of
CH3(CH2)8COO- and bpy ligands (calculated, 88.1%). The results are in good agreement
with its proposed structural formula. The amount of residue at temperatures above
436 oC was 13.2% (calculated, 11.1% assuming FeO). Hence, its decomposition
temperature was 156 oC, which was lower to the corresponding copper(II) complex
([Cu2(CH3(CH2)8COO)4(bpy)2] (2); Tdec = 177 oC). Univers
ity of
Mala
ya

105
Figure 4.52 TGA trace of 6
When viewed under POM, the semisolid was fluidic and the colour was red at
28 oC (Figure 4.53(a)). On further heating, it cleared to a paler red liquid at about 49 oC
(Figure 4.53(b)), indicating a lower proportion of LS Fe(II) in the complex. However
upon cooling from the liquid phase, there was no optical texture observed. Hence, 6 did
not behave as a thermotropic metallomesogen.
(a) (b)
Figure 4.53 Photomicrographs of 6 on heating at: (a) 28 oC; and (b) 49 oC
Univers
ity of
Mala
ya

106
Its DSC traces (Figure 4.54) shows overlapping endothermic peaks in the
temperature range of 35.6 oC to 56.4 oC (∆Hcombined = +7.0 kJ mol-1) assigned to its
melting temperature and LS-HS SCO transition (discussed below). These were followed
by several weak overlapping endothermic peaks in the temperature range of 56.5 oC to
88.6 oC due to breaking of weak intermolecular forces. However, on cooling from this
temperature, there were no peaks observed, in agreement with the results from POM.
Figure 4.54 DSC scans of 6
The entropy change for spin crossover (SCO; ∆Sspin) for spin-labile materials
may be theoretically calculated using the formula: ∆Sspin = Rln[(2S+1)HS/(2S+1)LS],
where R = 8.314 J K-1 mol-1 [84]. The ∆Sspin value may then be compared with the
experimental value obtained from the DSC, calculated using the formula: ∆Sspin = ∆H/T.
The theoretical ∆Sspin value for Fe(II) complexes is 13.38 J K-1 mol-1 since S = 2 for HS
Fe(II) atom (electronic configuration = t2g4eg
2; number of unpaired electrons = 4), while
S = 0 for LS Fe(II) (electronic configuration = t2g6; number of unpaired electrons = 0).
For 6, ∆Sspin value was 23.5 J K-1 mol-1 at 46.1 oC. Hence, it is inferred that the complex
showed a LS-HS SCO transition at this temperature.
Univers
ity of
Mala
ya

107
Combining both POM and DSC data, the effect of heat on the structure and spin
state of the complex is shown in Scheme 4.3.
[Fe2(R)4(bpy)(H2O)2]∆
[Fe(R)2(bpy)] + [Fe(R)2(H2O)2]49 oC
LS HS
Scheme 4.3 Effect of heat on the structure and spin state of 6 (R = CH3(CH2)8COO)
4.2.2 [Fe2(CH3(CH2)10COO)4(bpy)(H2O)2] (7)
(a) Synthesis and structural elucidation
The precursor complex, [Fe2(μ-H2O)2(CH3(CH2)10COO)4].2H2O was obtained as a
brown powder, with 33% yield from the reaction of CH3(CH2)10COONa.½H2O with
[FeSO4.7H2O]. The results of its elemental analyses (C, 58.6%; H, 9.2%) were in good
agreement with the calculated values (C, 58.7%; H, 10.3%; FW 980.9 g mol-1). Its
FTIR data (Table 4.6; Figure 4.55) show the presence of the expected functional
groups. Hence, the Δνcoo value was 128 cm-1, which was lower than the value for
CH3(CH2)10COONa (136 cm-1), indicating that CH3(CH2)10COO- ion was coordinated
as a chelating ligand.
Figure 4.55 FTIR spectrum of [Fe2(μ-H2O)2(CH3(CH2)10COO)4].2H2O
Univers
ity of
Mala
ya
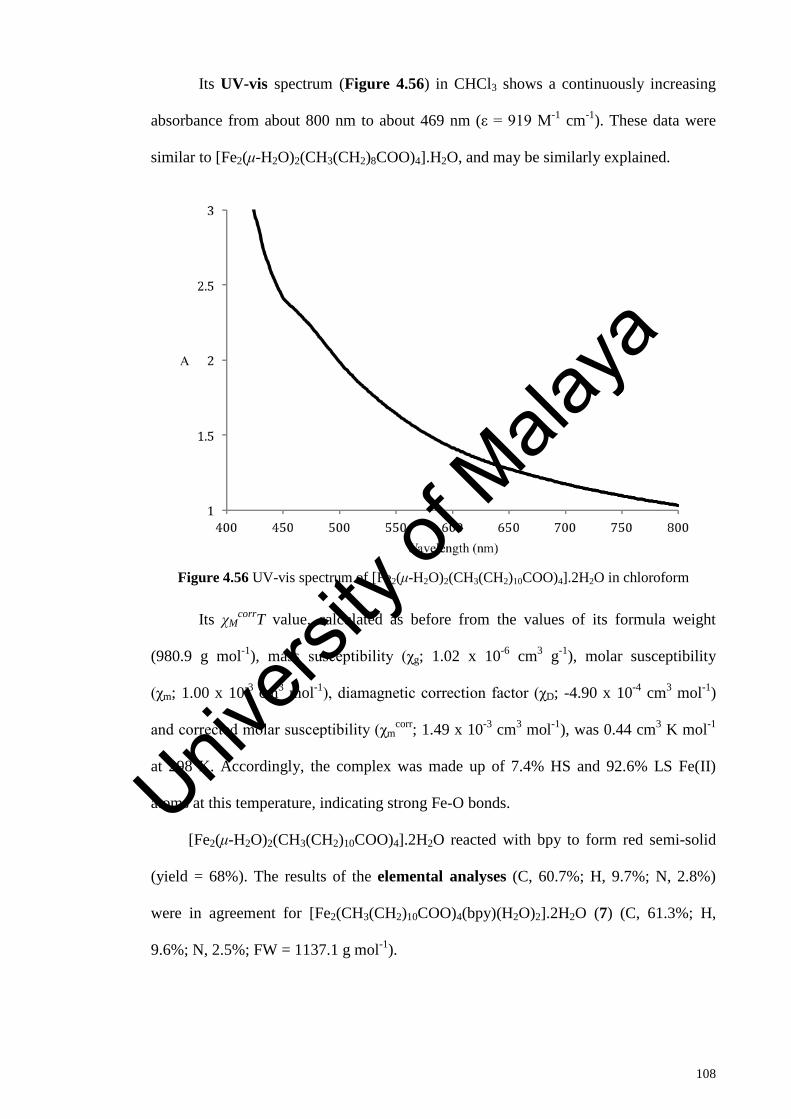
108
Its UV-vis spectrum (Figure 4.56) in CHCl3 shows a continuously increasing
absorbance from about 800 nm to about 469 nm (ε = 919 M-1 cm-1). These data were
similar to [Fe2(μ-H2O)2(CH3(CH2)8COO)4].H2O, and may be similarly explained.
Figure 4.56 UV-vis spectrum of [Fe2(μ-H2O)2(CH3(CH2)10COO)4].2H2O in chloroform
Its χMcorrT value, calculated as before from the values of its formula weight
(980.9 g mol-1), mass susceptibility (χg; 1.02 x 10⁻⁶ cm3 g-1), molar susceptibility
(χm; 1.00 x 10⁻³ cm3 mol-1), diamagnetic correction factor (χD; -4.90 x 10⁻⁴ cm3 mol-1)
and corrected molar susceptibility (χmcorr; 1.49 x 10⁻³ cm3 mol-1), was 0.44 cm3 K mol-1
at 298 K. Accordingly, the complex was made up of 7.4% HS and 92.6% LS Fe(II)
atoms at this temperature, indicating strong Fe-O bonds.
[Fe2(μ-H2O)2(CH3(CH2)10COO)4].2H2O reacted with bpy to form red semi-solid
(yield = 68%). The results of the elemental analyses (C, 60.7%; H, 9.7%; N, 2.8%)
were in agreement for [Fe2(CH3(CH2)10COO)4(bpy)(H2O)2].2H2O (7) (C, 61.3%; H,
9.6%; N, 2.5%; FW = 1137.1 g mol-1).
Univers
ity of
Mala
ya

109
Its FTIR data (Table 4.6; Figure 4.57) show the presence of the expected
functional groups. Hence, the Δνcoo values were 133 cm-1 and 172 cm-1, indicating two
chelating CH3(CH2)10COO- ligands.
Figure 4.57 FTIR spectrum of 7
Its UV-vis spectrum (Figure 4.58) in chloroform shows a d-d band appearing as a
shoulder at 358 nm (ε = 99 M-1 cm-1). The d-d peak was assigned to the electronic
transition for a LS Fe(II) atom, as explained above.
Univers
ity of
Mala
ya

110
Figure 4.58 UV-vis spectrum of 7 in chloroform
Similar to 6, its magnetic data could not be collected by the Gouy method as the
sample was a semisolid. Hence, its χMcorrT value cannot be calculated.
(b) Thermal and mesomorphic studies
TG trace for 7 (Figure 4.59) shows a total weight loss of 93.3% in the temperature
range 129 oC to 346 oC due to evaporation of coordinated and lattice H2O and
decomposition of CH3(CH2)10COO- ion and bpy ligands (calculated, 90.2%). The results
were in good agreement with its proposed structural formula. The amount of residue at
temperatures above 346 oC was 6.7% (calculated, 9.8% assuming pure Fe). Hence, its
decomposition temperature was 129 oC. Univers
ity of
Mala
ya

111
Figure 4.59 TGA traces of 7
When viewed under POM, its colour was red on heating at 40 oC
(Figure 4.60(a)), and on cooling from the isotropic liquid, optical textures were
observed at 39 oC (Figure 4.60(b)). Hence, 7 behave as a thermotropic
metallomesogen.
(a) (b)
Figure 4.60 Photomicrographs of 7 on heating at: (a) 40 oC; and on cooling at (b) 39 oC
Its DSC traces (Figure 4.61) shows overlapping endothermic peaks in the
temperature range of 32.1 oC to 45.9 oC (∆Hcombined = +83.9 kJ mol-1) assigned to
Univers
ity of
Mala
ya
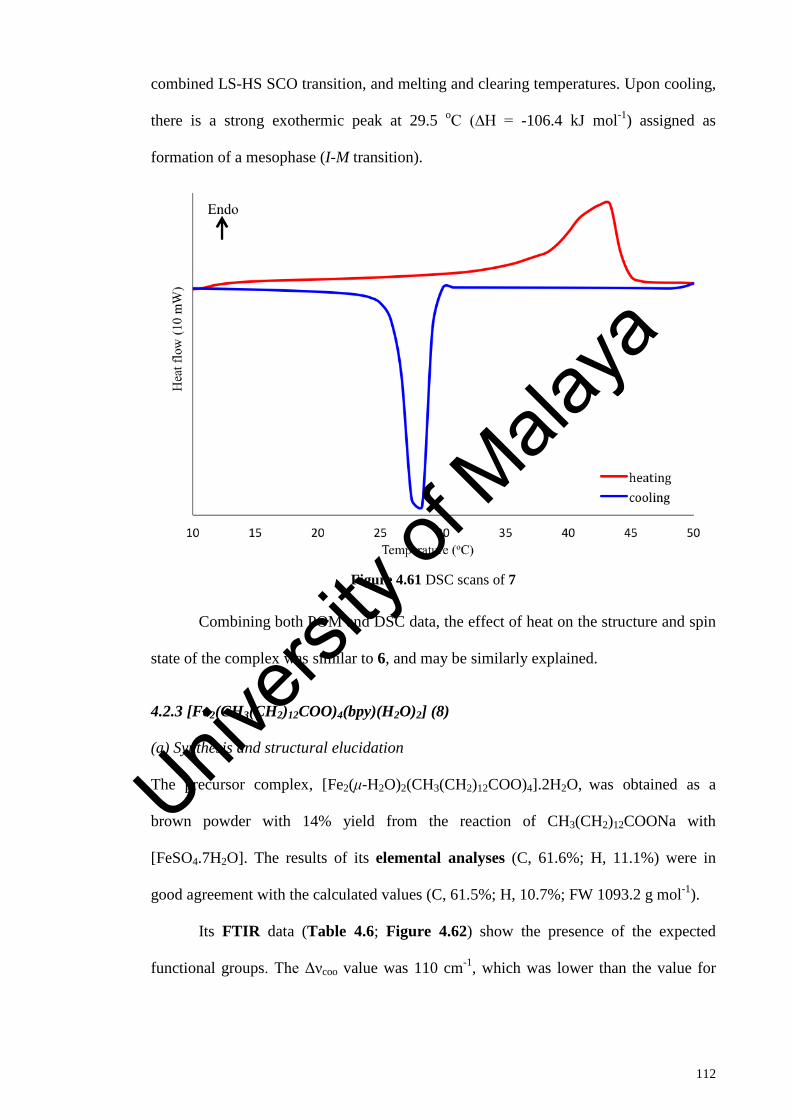
112
combined LS-HS SCO transition, and melting and clearing temperatures. Upon cooling,
there is a strong exothermic peak at 29.5 oC (∆H = -106.4 kJ mol-1) assigned as
formation of a mesophase (I-M transition).
Figure 4.61 DSC scans of 7
Combining both POM and DSC data, the effect of heat on the structure and spin
state of the complex was similar to 6, and may be similarly explained.
4.2.3 [Fe2(CH3(CH2)12COO)4(bpy)(H2O)2] (8)
(a) Synthesis and structural elucidation
The precursor complex, [Fe2(μ-H2O)2(CH3(CH2)12COO)4].2H2O, was obtained as a
brown powder with 14% yield from the reaction of CH3(CH2)12COONa with
[FeSO4.7H2O]. The results of its elemental analyses (C, 61.6%; H, 11.1%) were in
good agreement with the calculated values (C, 61.5%; H, 10.7%; FW 1093.2 g mol-1).
Its FTIR data (Table 4.6; Figure 4.62) show the presence of the expected
functional groups. The Δνcoo value was 110 cm-1, which was lower than the value for
Univers
ity of
Mala
ya

113
CH3(CH2)12COONa (136 cm-1), indicating that CH3(CH2)12COO- ion was coordinated
as a chelating ligand.
Figure 4.62 FTIR spectrum of [Fe2(μ-H2O)2(CH3(CH2)12COO)4].2H2O
Its UV-vis spectrum (Figure 4.63) in CHCl3 shows a continuously increasing
absorbance from about 1000 nm to a shoulder at 591 nm (ε = 774 M-1 cm-1). The
spectrum was similar to [Fe2(μ-H2O)2(CH3(CH2)8COO)4].H2O, and may be similarly
explained.
Univers
ity of
Mala
ya
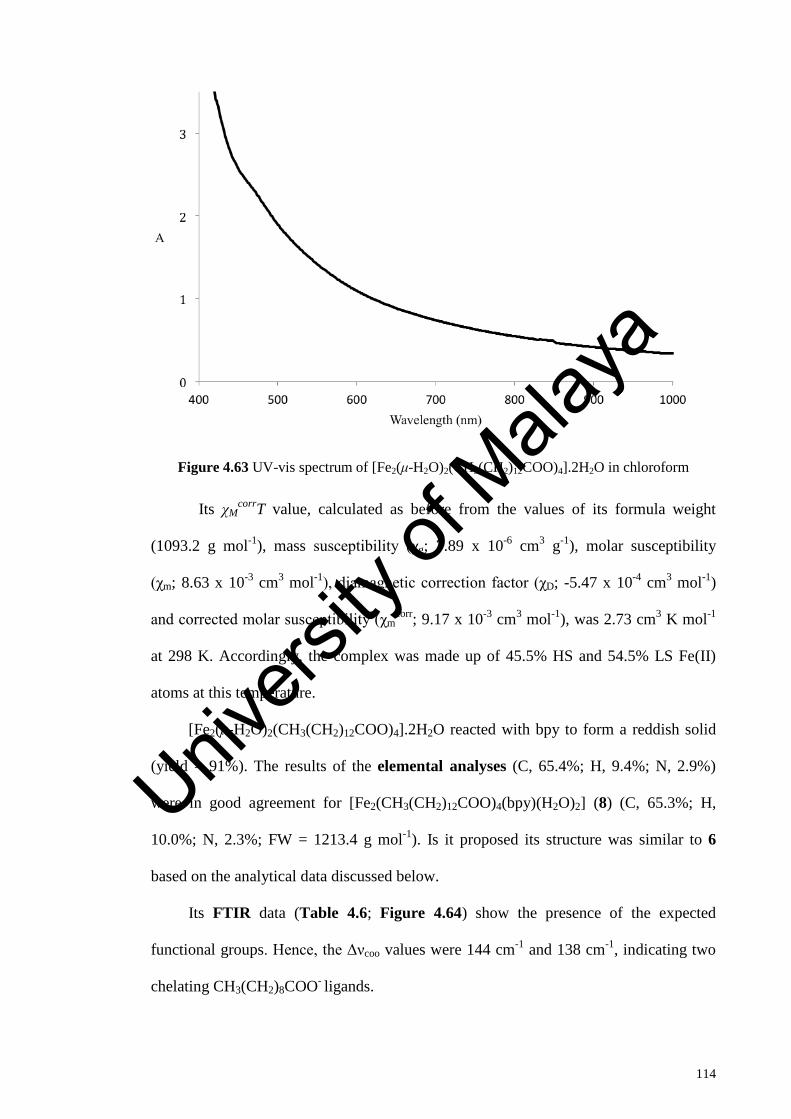
114
Figure 4.63 UV-vis spectrum of [Fe2(μ-H2O)2(CH3(CH2)12COO)4].2H2O in chloroform
Its χMcorrT value, calculated as before from the values of its formula weight
(1093.2 g mol-1), mass susceptibility (χg; 7.89 x 10⁻⁶ cm3 g-1), molar susceptibility
(χm; 8.63 x 10⁻³ cm3 mol-1), diamagnetic correction factor (χD; -5.47 x 10⁻⁴ cm3 mol-1)
and corrected molar susceptibility (χmcorr; 9.17 x 10⁻³ cm3 mol-1), was 2.73 cm3 K mol-1
at 298 K. Accordingly, the complex was made up of 45.5% HS and 54.5% LS Fe(II)
atoms at this temperature.
[Fe2(μ-H2O)2(CH3(CH2)12COO)4].2H2O reacted with bpy to form a reddish solid
(yield = 91%). The results of the elemental analyses (C, 65.4%; H, 9.4%; N, 2.9%)
were in good agreement for [Fe2(CH3(CH2)12COO)4(bpy)(H2O)2] (8) (C, 65.3%; H,
10.0%; N, 2.3%; FW = 1213.4 g mol-1). Is it proposed its structure was similar to 6
based on the analytical data discussed below.
Its FTIR data (Table 4.6; Figure 4.64) show the presence of the expected
functional groups. Hence, the Δνcoo values were 144 cm-1 and 138 cm-1, indicating two
chelating CH3(CH2)8COO- ligands.
Univers
ity of
Mala
ya
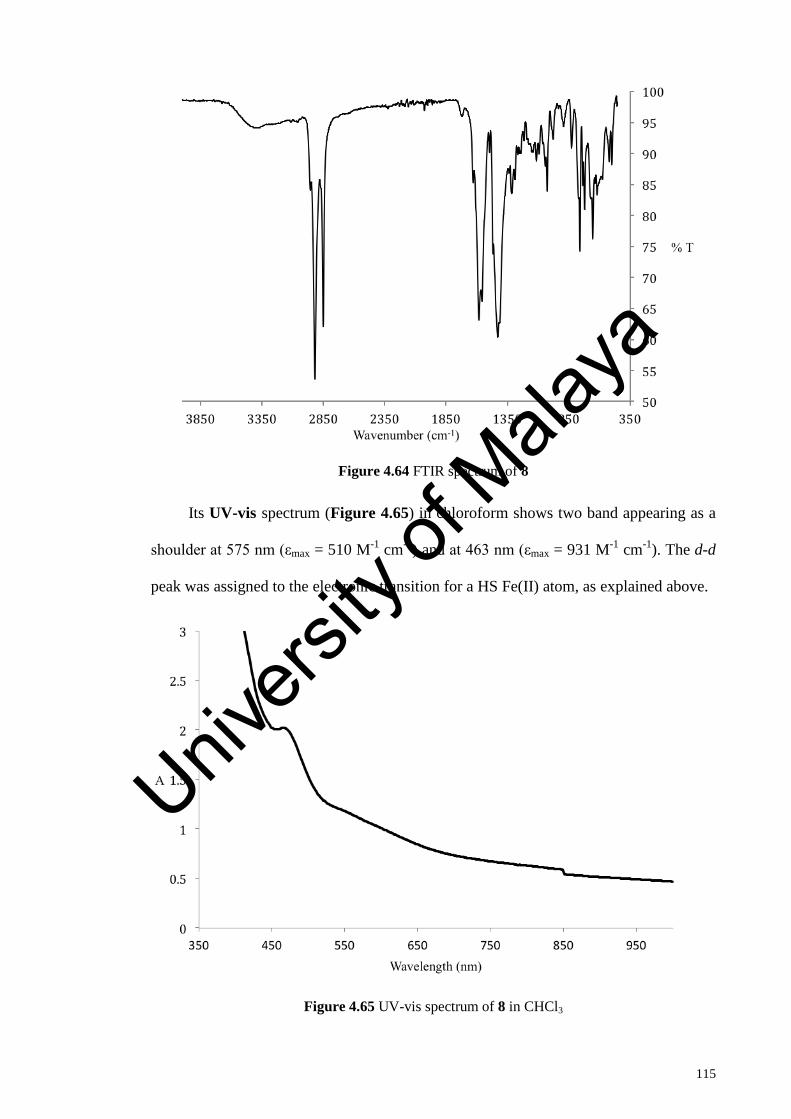
115
Figure 4.64 FTIR spectrum of 8
Its UV-vis spectrum (Figure 4.65) in chloroform shows two band appearing as a
shoulder at 575 nm (εmax = 510 M-1 cm-1) and at 463 nm (εmax = 931 M-1 cm-1). The d-d
peak was assigned to the electronic transition for a HS Fe(II) atom, as explained above.
Figure 4.65 UV-vis spectrum of 8 in CHCl3
Univers
ity of
Mala
ya
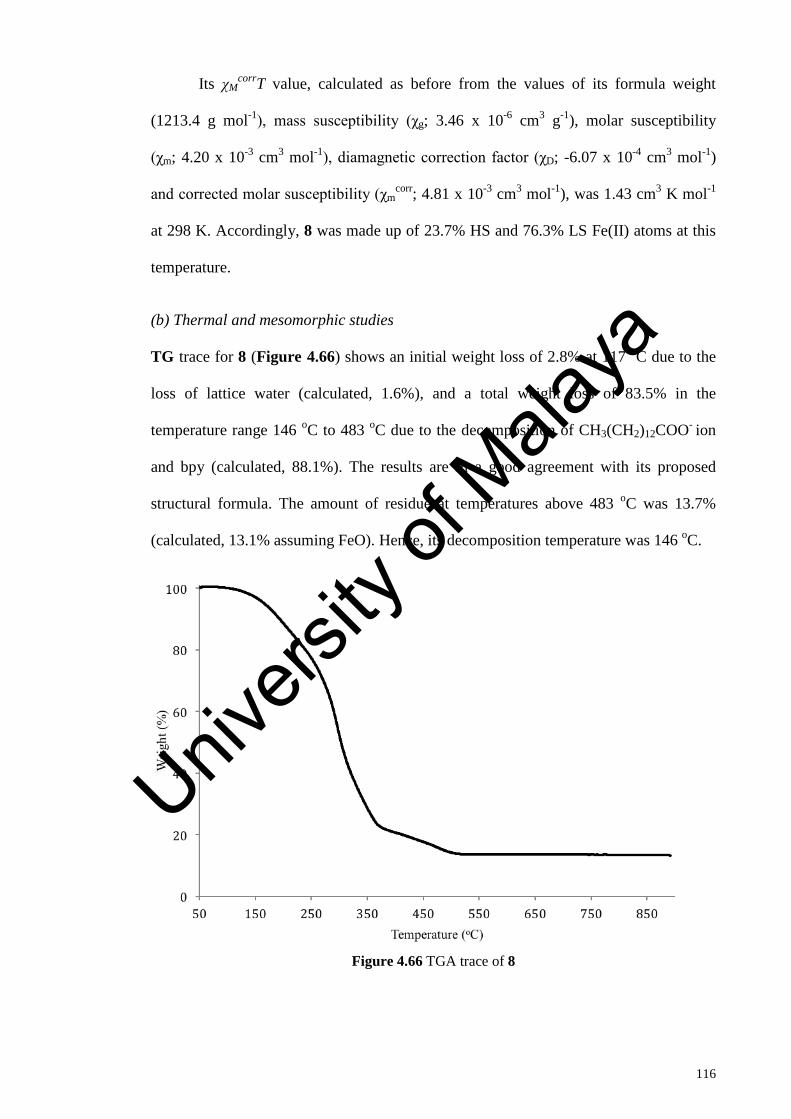
116
Its χMcorrT value, calculated as before from the values of its formula weight
(1213.4 g mol-1), mass susceptibility (χg; 3.46 x 10⁻⁶ cm3 g-1), molar susceptibility
(χm; 4.20 x 10⁻³ cm3 mol-1), diamagnetic correction factor (χD; -6.07 x 10⁻⁴ cm3 mol-1)
and corrected molar susceptibility (χmcorr; 4.81 x 10⁻³ cm3 mol-1), was 1.43 cm3 K mol-1
at 298 K. Accordingly, 8 was made up of 23.7% HS and 76.3% LS Fe(II) atoms at this
temperature.
(b) Thermal and mesomorphic studies
TG trace for 8 (Figure 4.66) shows an initial weight loss of 2.8% at 117 oC due to the
loss of lattice water (calculated, 1.6%), and a total weight loss of 83.5% in the
temperature range 146 oC to 483 oC due to the decomposition of CH3(CH2)12COO- ion
and bpy (calculated, 88.1%). The results are in a good agreement with its proposed
structural formula. The amount of residue at temperatures above 483 oC was 13.7%
(calculated, 13.1% assuming FeO). Hence, its decomposition temperature was 146 oC.
Figure 4.66 TGA trace of 8
Univers
ity of
Mala
ya
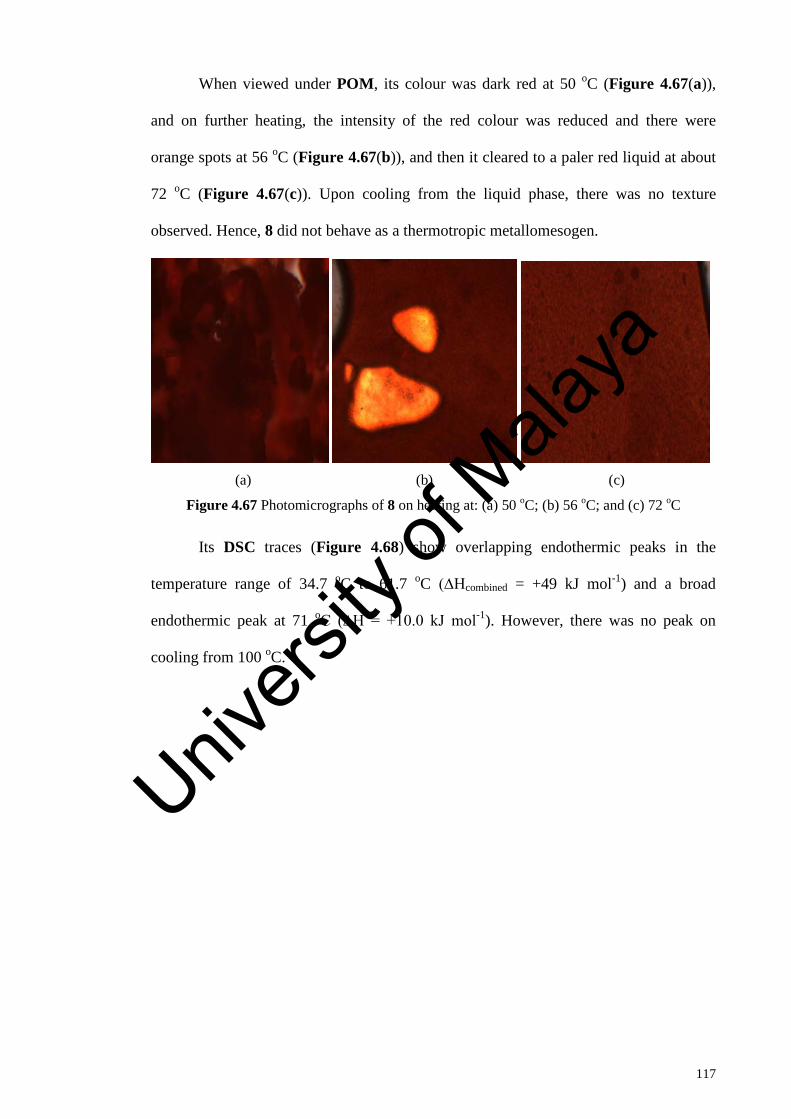
117
When viewed under POM, its colour was dark red at 50 oC (Figure 4.67(a)),
and on further heating, the intensity of the red colour was reduced and there were
orange spots at 56 oC (Figure 4.67(b)), and then it cleared to a paler red liquid at about
72 oC (Figure 4.67(c)). Upon cooling from the liquid phase, there was no texture
observed. Hence, 8 did not behave as a thermotropic metallomesogen.
(a) (b) (c)
Figure 4.67 Photomicrographs of 8 on heating at: (a) 50 oC; (b) 56 oC; and (c) 72 oC
Its DSC traces (Figure 4.68) show overlapping endothermic peaks in the
temperature range of 34.7 oC to 61.7 oC (∆Hcombined = +49 kJ mol-1) and a broad
endothermic peak at 71 oC (∆H = +10.0 kJ mol-1). However, there was no peak on
cooling from 100 oC.
Univers
ity of
Mala
ya
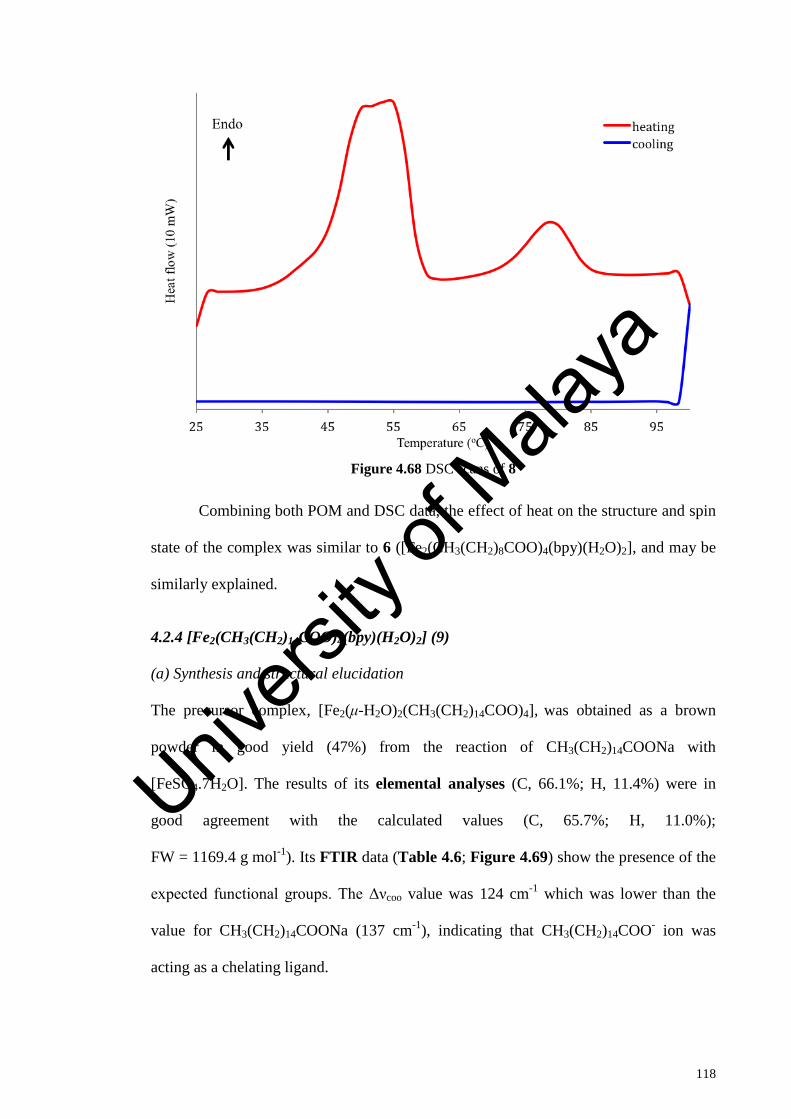
118
Figure 4.68 DSC scans of 8
Combining both POM and DSC data, the effect of heat on the structure and spin
state of the complex was similar to 6 ([Fe2(CH3(CH2)8COO)4(bpy)(H2O)2], and may be
similarly explained.
4.2.4 [Fe2(CH3(CH2)14COO)4(bpy)(H2O)2] (9)
(a) Synthesis and structural elucidation
The precursor complex, [Fe2(μ-H2O)2(CH3(CH2)14COO)4], was obtained as a brown
powder in good yield (47%) from the reaction of CH3(CH2)14COONa with
[FeSO4.7H2O]. The results of its elemental analyses (C, 66.1%; H, 11.4%) were in
good agreement with the calculated values (C, 65.7%; H, 11.0%);
FW = 1169.4 g mol-1). Its FTIR data (Table 4.6; Figure 4.69) show the presence of the
expected functional groups. The Δνcoo value was 124 cm-1 which was lower than the
value for CH3(CH2)14COONa (137 cm-1), indicating that CH3(CH2)14COO- ion was
acting as a chelating ligand.
Univers
ity of
Mala
ya
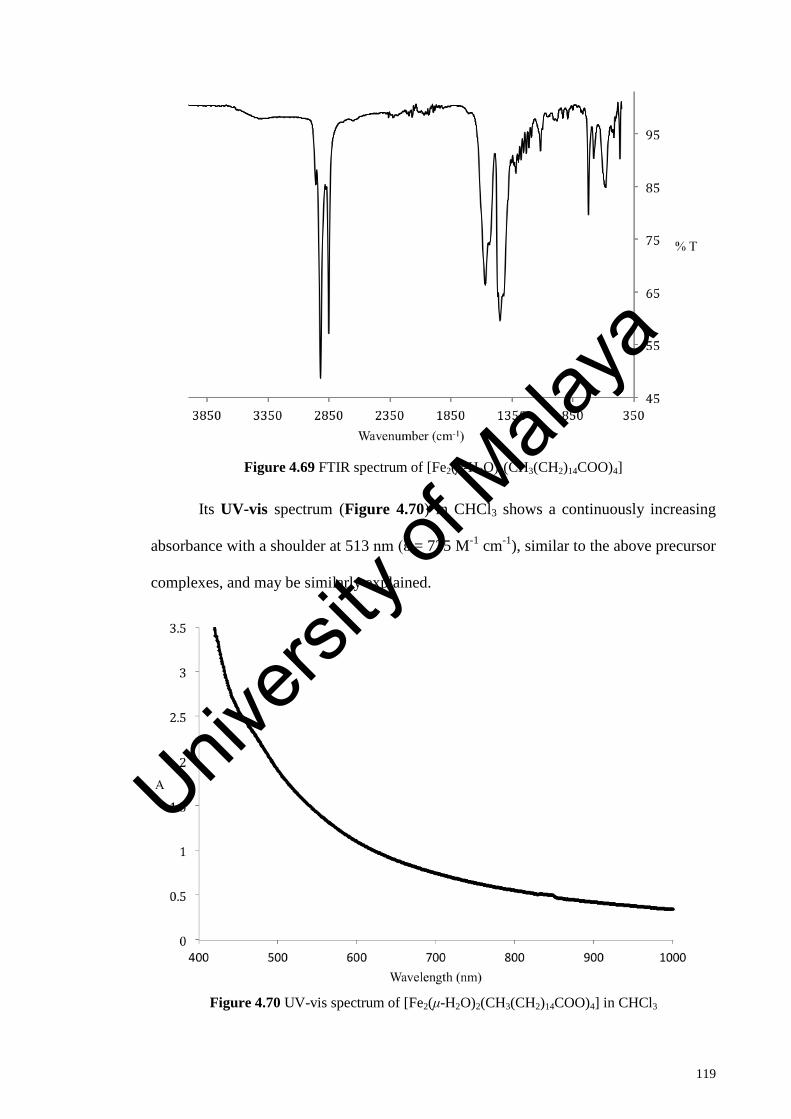
119
Figure 4.69 FTIR spectrum of [Fe2(μ-H2O)2(CH3(CH2)14COO)4]
Its UV-vis spectrum (Figure 4.70) in CHCl3 shows a continuously increasing
absorbance with a shoulder at 513 nm (ε = 735 M-1 cm-1), similar to the above precursor
complexes, and may be similarly explained.
Figure 4.70 UV-vis spectrum of [Fe2(μ-H2O)2(CH3(CH2)14COO)4] in CHCl3
Univers
ity of
Mala
ya

120
Its χMcorrT value, calculated as before from the values of its formula weight
(1169.4 g mol-1), mass susceptibility (χg; 6.78 x 10⁻⁶ cm3 g-1), molar susceptibility
(χm; 7.93 x 10⁻³ cm3 mol-1), diamagnetic correction factor (χD; -5.85 x 10⁻⁴ cm3 mol-1)
and corrected molar susceptibility (χmcorr; 8.51 x 10⁻³ cm3 mol-1), was 2.54 cm3 K mol-1
at 298 K. Accordingly, [Fe2(μ-H2O)2(CH3(CH2)14COO)4] was made up of 42.1% HS
and 57.9% LS Fe(II) atoms at this temperature.
[Fe2(μ-H2O)2(CH3(CH2)14COO)4] reacted with bpy to form a reddish solid (yield
= 51%). The results of the elemental analyses (C, 66.8%; H, 9.6%; N, 2.8%) were in
good agreement for [Fe2(CH3(CH2)14COO)4(bpy)(H2O)2] (9) (C, 67.0%; H, 10.3%; N,
2.1%; FW = 1325.5 g mol-1).
Its FTIR spectrum (Table 4.6; Figure 4.71) shows the presence of the expected
functional groups. Hence, the Δνcoo values were 135 cm-1 and 140 cm-1, indicating two
chelating CH3(CH2)14COO- ligands.
Figure 4.71 FTIR spectrum of 9
Univers
ity of
Mala
ya
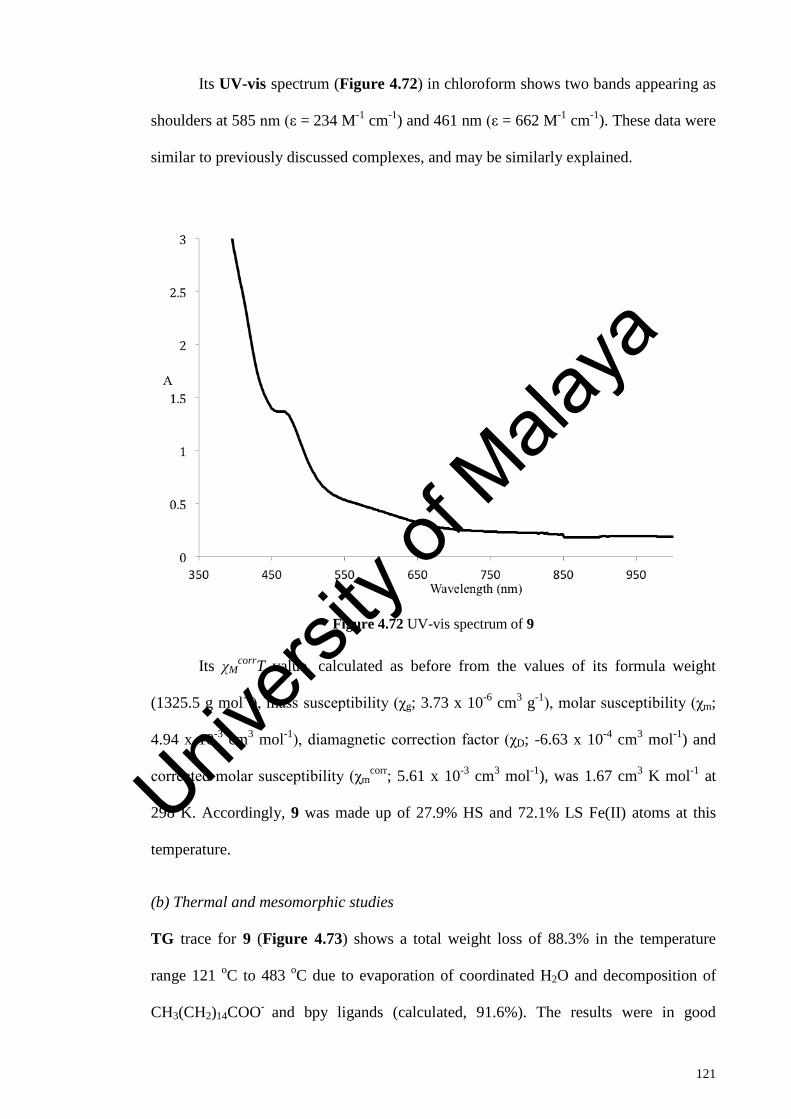
121
Its UV-vis spectrum (Figure 4.72) in chloroform shows two bands appearing as
shoulders at 585 nm (ε = 234 M-1 cm-1) and 461 nm (ε = 662 M-1 cm-1). These data were
similar to previously discussed complexes, and may be similarly explained.
Figure 4.72 UV-vis spectrum of 9
Its χMcorrT value, calculated as before from the values of its formula weight
(1325.5 g mol-1), mass susceptibility (χg; 3.73 x 10⁻⁶ cm3 g-1), molar susceptibility (χm;
4.94 x 10⁻³ cm3 mol-1), diamagnetic correction factor (χD; -6.63 x 10⁻⁴ cm3 mol-1) and
corrected molar susceptibility (χmcorr; 5.61 x 10⁻³ cm3 mol-1), was 1.67 cm3 K mol-1 at
298 K. Accordingly, 9 was made up of 27.9% HS and 72.1% LS Fe(II) atoms at this
temperature.
(b) Thermal and mesomorphic studies
TG trace for 9 (Figure 4.73) shows a total weight loss of 88.3% in the temperature
range 121 oC to 483 oC due to evaporation of coordinated H2O and decomposition of
CH3(CH2)14COO- and bpy ligands (calculated, 91.6%). The results were in good
Univers
ity of
Mala
ya
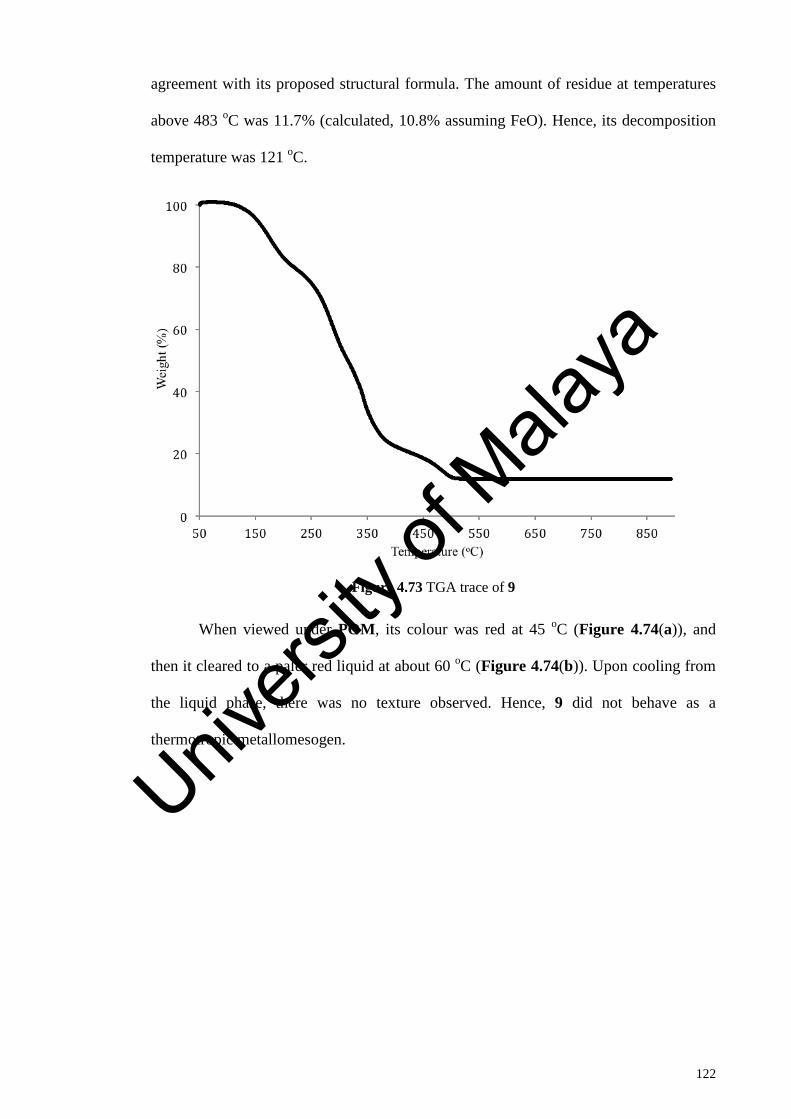
122
agreement with its proposed structural formula. The amount of residue at temperatures
above 483 oC was 11.7% (calculated, 10.8% assuming FeO). Hence, its decomposition
temperature was 121 oC.
Figure 4.73 TGA trace of 9
When viewed under POM, its colour was red at 45 oC (Figure 4.74(a)), and
then it cleared to a paler red liquid at about 60 oC (Figure 4.74(b)). Upon cooling from
the liquid phase, there was no texture observed. Hence, 9 did not behave as a
thermotropic metallomesogen.
Univers
ity of
Mala
ya
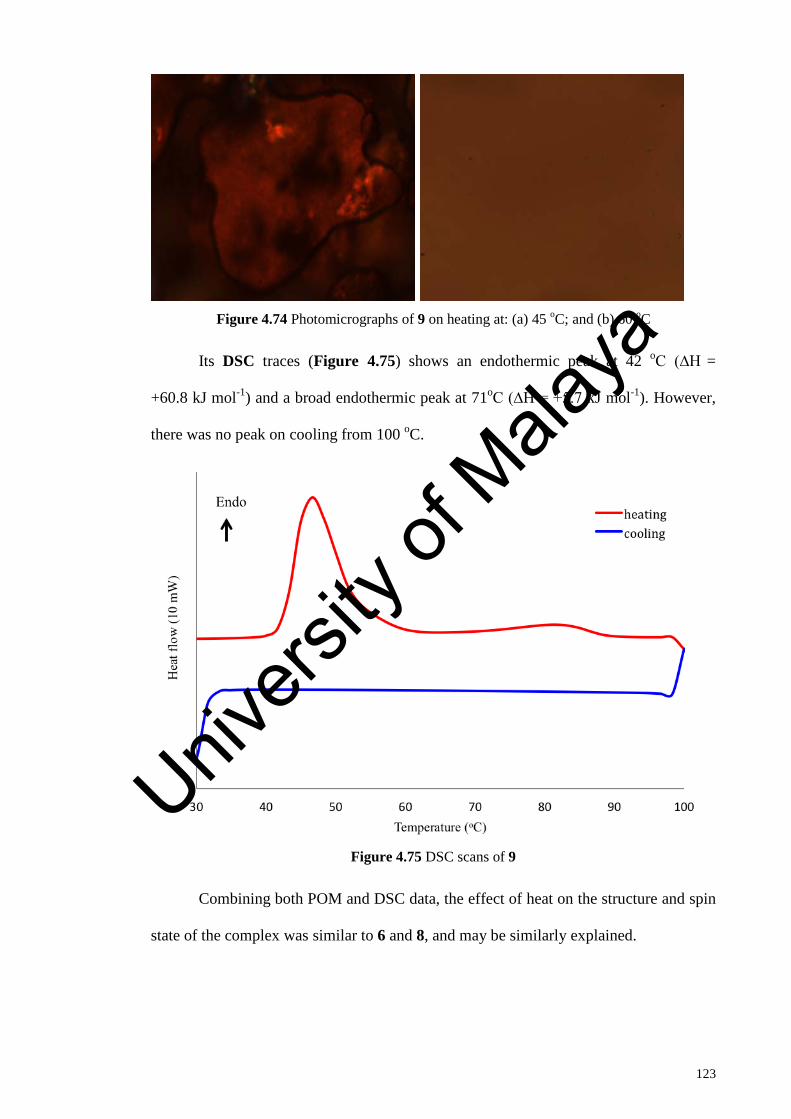
123
Figure 4.74 Photomicrographs of 9 on heating at: (a) 45 oC; and (b) 60 oC
Its DSC traces (Figure 4.75) shows an endothermic peak at 42 oC (∆H =
+60.8 kJ mol-1) and a broad endothermic peak at 71oC (∆H = +5.7 kJ mol-1). However,
there was no peak on cooling from 100 oC.
Figure 4.75 DSC scans of 9
Combining both POM and DSC data, the effect of heat on the structure and spin
state of the complex was similar to 6 and 8, and may be similarly explained.
Univers
ity of
Mala
ya

124
4.2.5 Summary
To summarize, the analytical data for the precursor complexes, [Fe2(μ-H2O)2(R)4].xH2O
(R = CH3(CH2)6-14COO) and the complexes formed from their reactions with bpy (6-9)
are shown in Table 4.7 and Table 4.8, respectively.
Table 4.7 Precursor complexes of complexes 6 - 9
Proposed chemical formula Δνcoo (cm-1)
λmax, nm (ε, M-1 cm-1)
χMcorrT
(cm3 K mol-1) [Fe2(μ-H2O)2(CH3(CH2)8COO)4].H2O 138 464 (138 ) 3.47 (57.8 % HS)
[Fe2(μ-H2O)2(CH3(CH2)10COO)4].2H2O 128 469 (919) 0.44 (7.4 % HS)
[Fe2(μ-H2O)2(CH3(CH2)12COO)4].2H2O 110 591 (774) 2.73 (45.5 % HS)
[Fe2(μ-H2O)2(CH3(CH2)14COO)4] 124 513 (735) 2.54 (42.1 % HS)
The precursor complexes were aqua bridged dinuclear molecules with chelating
carboxylate ligands, and were made up of both HS and LS Fe(II) atoms at room
temperature.
Table 4.8 Complexes 6 - 9
Proposed chemical formula Δνcoo (cm-1)
λmax, nm (ε, M-1 cm-1)
χMcorrT
(cm3 K mol-1) Tdec (oC) M*
[Fe2(CH3(CH2)8COO)4(bpy)(H2O)2] (6; red semi-solid)
107 138
585 (375) - 156 No
[Fe2(CH3(CH2)10COO)4(bpy)2(H2O)2].2H2O (7; red semi-solid)
133 358 (99) - 129 Yes
[Fe2(CH3(CH2)12COO)4(bpy)(H2O)2] (8; red solid)
144 138
575 (510)
1.43 (23.7 % HS) 146 No
[Fe2(CH3(CH2)14COO)4(bpy)(H2O)2] (9; red solid)
135 140
585 (234)
1.67 (27.9% HS) 121 No
*M = mesomorphism
All complexes were dinuclear molecules involving bridging bpy and chelating
carboxylate ligands, and have both HS and LS Fe(II) atoms at room temperature.
However, compared to their precursor complexes, there were higher percentages of LS
Fe(II) atoms, consistent with stronger Fe(II)-N(bpy) bonds. On heating, the colour of
all complexes changed from red to paler red, indicating a higher proportion of HS Fe(II)
in the complex, proposed to arise from the dissociation of [Fe2(R)4(bpy)(H2O)2] to
Univers
ity of
Mala
ya

125
[Fe(R)2(bpy)] and [Fe(R)2(H2O)2]. The complexes were thermally stable in the
temperature range of 121 oC to 156 oC, and their decomposition temperatures decreased
with increasing number of carbon atoms in the alkyl chain, as similarly observed for
Cu(II) complexes and may be similarly explained. Only 7 behaved as a thermotropic
metallomesogen due to its more symmetrical structure.
4.3 [Cu2(p-ROC6H4COO)4(bpy)2]
The general steps for the syntheses of [Cu2(p-CH3(CH2)nOC6H4COO)4(bpy)2], where n
= 9 (10), 11 (11), 13 (12), and 15 (13), are shown in Scheme 4.4.
p-HOC6H4COOCH3RBr
p-ROC6H4COOCH3KOH p-ROC6H4COOK
CuSO4.5H2O
[Cu2(p-ROC6H4COO)4]bpy
[Cu2(p-ROC6H4COO)4(bpy)2]
Scheme 4.4 Synthetic steps for [Cu2(p-ROC6H4COO)4(bpy)2], where R = CH3(CH2)n
4.3.1 [Cu2(p-CH3(CH2)9OC6H4COO)4(bpy)2] (10)
(a) Synthesis and structural elucidation
The first step in the synthesis of [Cu2(p-CH3(CH2)9OC6H4COO)4(bpy)2] (10)
(Scheme 4.3) involved the synthesis of p-CH3(CH2)9OC6H4COOCH3 from the reaction
of p-HO-C6H4COOCH3 and BrCH2(CH2)8CH3. The ester was obtained as a white
powder in good yield (63 %). Its elemental analytical results (C, 73.7%; H, 10.3%)
were in good agreement with the calculated values (C, 73.9%; H, 9.7%; FW =
292.4 g mol-1). Its chemical formula was further ascertained by 1H-NMR spectroscopy.
The spectrum is shown in Figure 4.76 and the peak assignments are shown in Table
4.9.
Univers
ity of
Mala
ya
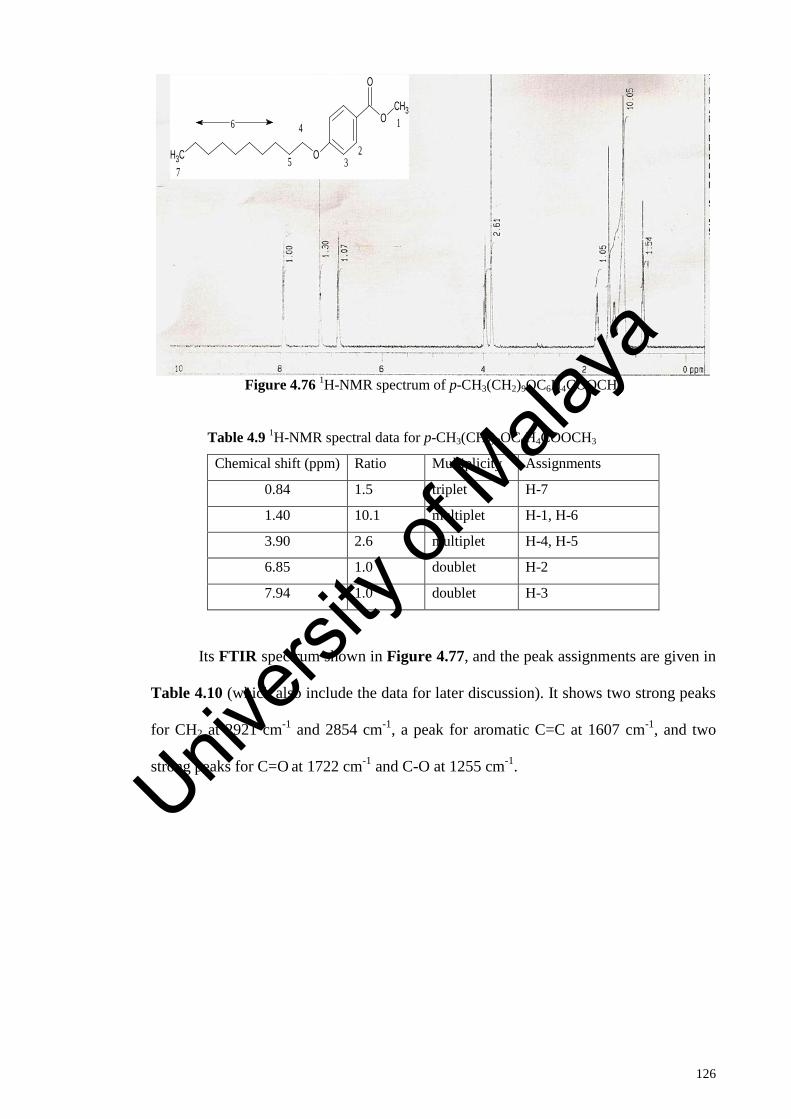
126
Figure 4.76 1H-NMR spectrum of p-CH3(CH2)9OC6H4COOCH3
Table 4.9 1H-NMR spectral data for p-CH3(CH2)9OC6H4COOCH3
Chemical shift (ppm) Ratio Multiplicity Assignments
0.84 1.5 triplet H-7
1.40 10.1 multiplet H-1, H-6
3.90 2.6 multiplet H-4, H-5
6.85 1.0 doublet H-2
7.94 1.0 doublet H-3
Its FTIR spectrum shown in Figure 4.77, and the peak assignments are given in
Table 4.10 (which also include the data for later discussion). It shows two strong peaks
for CH2 at 2921 cm-1 and 2854 cm-1, a peak for aromatic C=C at 1607 cm-1, and two
strong peaks for C=O at 1722 cm-1 and C-O at 1255 cm-1.
OCH3
O
O
CH31
23
4
75
6
Univers
ity of
Mala
ya

127
Figure 4.77 FTIR spectrum of p-CH3(CH2)9OC6H4COOCH3
Univers
ity of
Mala
ya

128
Table 4.10 FTIR data in (cm-1) and assignments (R = p-CH3(CH2)nOC6H4)
Compound CH2 (asym)
CH2 (sym) C=O C-O COO
(asym) COO (sym)
C=C (aro) C-N
RCOOCH3 (n = 9) 2921 2854 1722 1255 - - 1607 -
RCOOCH2CH3 (n = 11) 2915 2851 1708 1280 - - 1608 -
RCOOCH2CH3(n = 13) 2915 2851 1708 1284 - - 1609 -
RCOOCH3(n = 15) 2914 2850 1278 1287 - - 1609 -
RCOOK (n = 9) 2921 2853 - - 1543 1391 1598 -
RCOOK (n = 11) 2920 2851 - - 1543 1393 1600 -
RCOOK (n = 13) 2921 2852 - - 1543 1394 1600 -
RCOOK (n = 15) 2919 2851 - - 1543 1395 1601 -
[Cu2(RCOO)4(H2O)2].2H2O (n = 9)
2921 2853 - - 1594 1428 1607 -
[Cu2(RCOO)4(H2O)2].2H2O (n = 11) 2918 2851 - - 1608 1431 1609 -
[Cu2(RCOO)4(H2O)2].2H2O (n = 13) 2917 2851 - - 1609 1435 1610 -
[Cu2(RCOO)4(H2O)2] (n = 15) 2918 2850 - - 1604 1436 1610 -
[Cu2(RCOO)4(bpy)2].2H2O (n = 9; complex 10) 2924 2855 - - 1590 1384
1373 1601 1304
[Cu2(RCOO)4(bpy)2] (n = 11; complex 11) 2919 2853 - - 1593 1417/
1364 1607 1308
[Cu2(RCOO)4(bpy)2] (n = 13; complex 12) 2918 2852 - - 1594 1418/
1364 1606 1308
[Cu2(RCOO)4(bpy)2] (n = 15; complex 13) 2917 2851 - - 1594 1435/
1370 1609 1310
The second step involved alkaline hydrolysis of p-CH3(CH2)9OC6H4COOCH3
using KOH. The product was a white powder and its yield was 35%. The results of the
elemental analyses (C, 64.3%; H, 7.5%) were in good agreement with those calculated
for the salt (C, 64.5%; H, 8.0%; FW 316.5 g mol-1). Its FTIR data (Table 4.10;
Figure 4.78) show the presence of the expected functional groups. Hence, the Δνcoo
value for p-CH3(CH2)9OC6H4COO- ion was 152 cm-1.
Univers
ity of
Mala
ya

129
Figure 4.78 FTIR spectrum of p-CH3(CH2)9OC6H4COOK
The third step involved reacting p-CH3(CH2)9OC6H4COOK with CuSO4.5H2O
to form the precursor complex, [Cu2(p-CH3(CH2)9OC6H4COO)4(H2O)2] (yield = 44%).
The results of the elemental analyses (C, 64.3%; H, 8.8%) were in good agreement
with the calculated values (C, 64.2%; H, 8.2%); FW 1272.6 g mol-1). Its FTIR data
(Table 4.10; Figure 4.79) show the presence of the expected functional groups. Hence,
the Δνcoo value for p-CH3(CH2)9OC6H4COO- ion was 166 cm-1, which was higher than
the value for p-CH3(CH2)9OC6H4COOK (152 cm-1), indicating that
p-CH3(CH2)9OC6H4COO- ion was coordinated to the Cu(II) centre as a bidentate
bridging ligand. Univers
ity of
Mala
ya
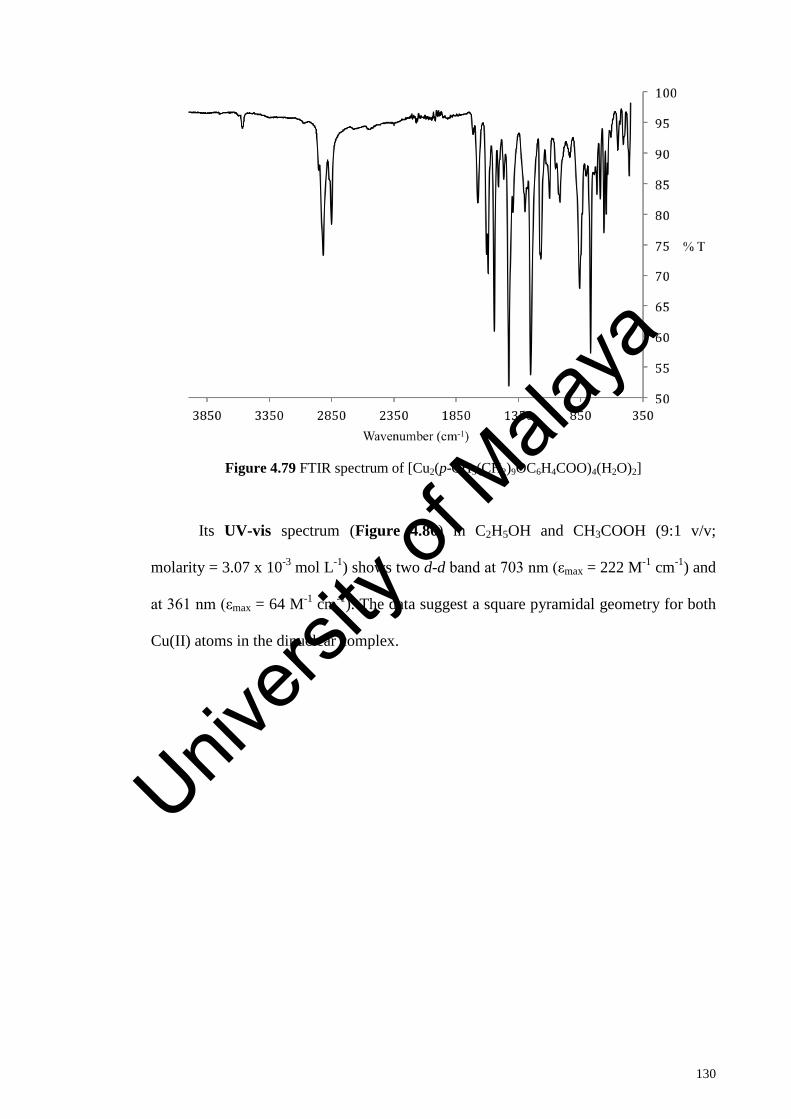
130
Figure 4.79 FTIR spectrum of [Cu2(p-CH3(CH2)9OC6H4COO)4(H2O)2]
Its UV-vis spectrum (Figure 4.80) in C2H5OH and CH3COOH (9:1 v/v;
molarity = 3.07 x 10⁻³ mol L-1) shows two d-d band at 703 nm (εmax = 222 M-1 cm-1) and
at 361 nm (εmax = 64 M-1 cm-1). The data suggest a square pyramidal geometry for both
Cu(II) atoms in the dinuclear complex.
Univers
ity of
Mala
ya

131
Figure 4.80 UV-vis spectrum of [Cu2(p-CH3(CH2)9OC6H4COO)4(H2O)2]
Its μeff value, calculated as previously done using its formula weight
(1272.6 g mol-1) and the values of mass susceptibility (χg; 6.50 x 10⁻⁷ cm3 g-1), molar
susceptibility (χm; 8.27 x 10⁻⁴ cm3 mol-1), diamagnetic correction factor
(χD; -6.36 x 10⁻⁴ cm3 mol-1) and corrected molar susceptibility
(χmcorr; 1.46 x 10⁻³ cm3 mol-1), was 1.87 BM at 298 K. It is noted that value was lower
than [Cu2(CH3(CH2)8COO)4(H2O)2] (2.2 BM), indicating a stronger antiferromagnetic
interaction, probably due to less structural distortion and/or the stronger Cu-O bond of
the former complex.
[Cu2(p-CH3(CH2)9OC6H4COO)4(H2O)2] reacted with bpy to form a blue powder
(yield = 65%). The results of the elemental analyses (C, 66.7%; H, 7.8%; N, 3.3%)
were in good agreement with those calculated for
[Cu2(p-CH3(CH2)9OC6H4COO)4(bpy)2].2H2O (10) (C, 66.7%; H, 7.6%; N, 3.5%; FW
1584.9 g mol-1).
Its FTIR data (Table 4.10; Figure 4.81) shows the presence of the expected
functional groups. Hence, the Δνcoo values were 206 cm-1 and 217 cm-1, in agreement
Univers
ity of
Mala
ya
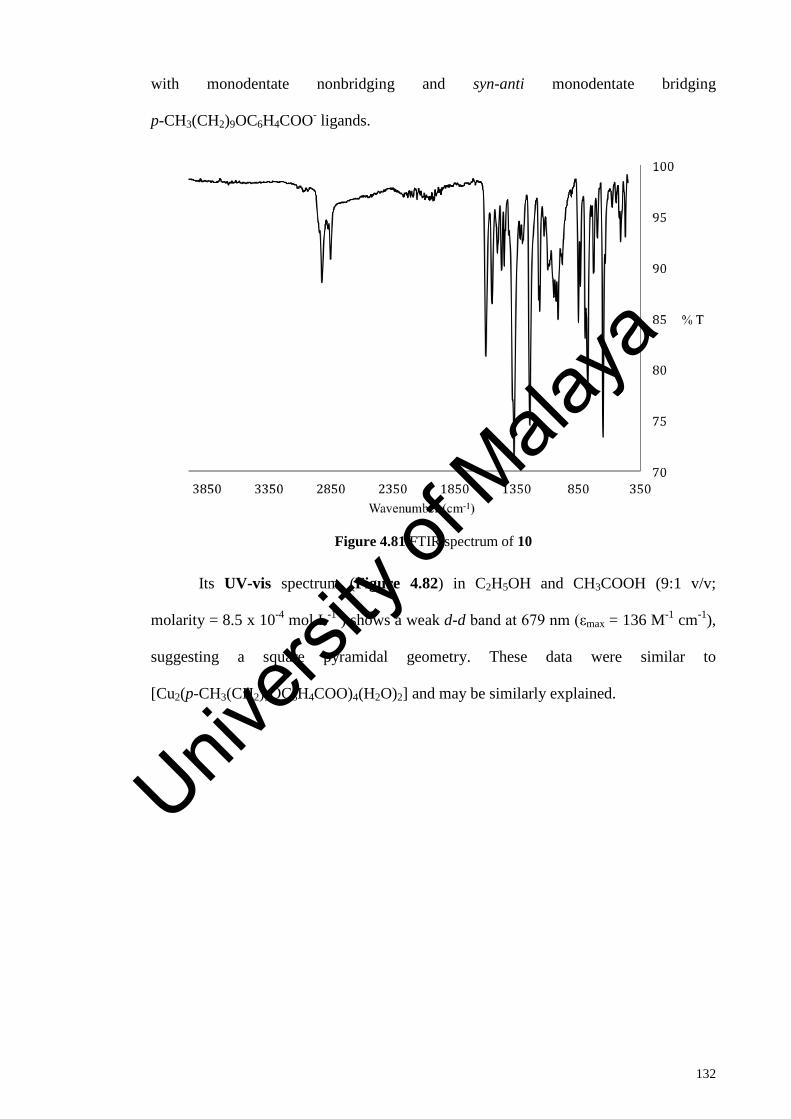
132
with monodentate nonbridging and syn-anti monodentate bridging
p-CH3(CH2)9OC6H4COO- ligands.
Figure 4.81 FTIR spectrum of 10
Its UV-vis spectrum (Figure 4.82) in C2H5OH and CH3COOH (9:1 v/v;
molarity = 8.5 x 10⁻⁴ mol L-1 ) shows a weak d-d band at 679 nm (εmax = 136 M-1 cm-1),
suggesting a square pyramidal geometry. These data were similar to
[Cu2(p-CH3(CH2)9OC6H4COO)4(H2O)2] and may be similarly explained.
Univers
ity of
Mala
ya

133
Figure 4.82 UV-vis spectrum of 10
Its μeff value, calculated as before from its formula weight (1548.9 g mol-1) and
the values of mass susceptibility (χg; 1.80 x 10⁻⁶ cm3 g-1), molar susceptibility
(χm; 2.79 x 10⁻³ cm3 mol-1), diamagnetic correction factor (χD; -7.74 x 10⁻⁴ cm3 mol-1)
and corrected molar susceptibility (χmcorr; 3.56 x 10⁻³ cm3 mol-1), was 2.92 BM at 298 K.
The value was higher than its precursor; [Cu2(p-CH3(CH2)9OC6H4COO)4(H2O)2]
(1.87 BM) and the expected value for a dinuclear Cu(II) complex (S = ½;
g = 2; 2.45 BM [22]. This suggest ferromagnetic interactions between the two Cu(II)
centres.
(b) Thermal and mesomorphic studies
TG trace for 10 (Figure 4.83) shows an initial weight loss of 2.0% at 79 oC due
evaporation of lattice H2O (calculated, 2.3%), followed by a major weight loss of 86.2%
in the temperature range 240 oC to 568 oC due to the decomposition of
p-CH3(CH2)9OC6H4COO- and bpy ligands (calculated, 91.8%). The results are in good
agreement with its proposed structural formula. The amount of residue at temperatures
Univers
ity of
Mala
ya

134
above 568 oC was 11.8% (calculated, 10.0% assuming CuO). Hence, its decomposition
temperature was 240 oC, which was significantly higher compared to
[Cu2(CH3(CH2)8COO)4(bpy)2] (2) (Tdec = 177 oC). This is as expected since the R-COO
bond is stronger in arylcarboxylates than alkylcarboxylates.
Figure 4.83 TGA trace of 10
When viewed under POM, 10 started to melt at 107 oC and to clear at about
150 oC. On cooling from I, an optical texture was observed at 121 oC (Figure 4.84(a)),
which was typical of columnar liquid crystals. In comparison, its precursor complex,
[Cu2(p-CH3(CH2)9OC6H4COO)4(H2O)2], was observed to melt at 130 oC and clear to an
isotropic liquid at 160 oC. Upon cooling from this temperature, an optical optical texture
that was different from 10 was observed at 142 oC (Figure 4.84(b)). These observations
indicate that both 10 and its precursor complex behaved as different thermotropic
metallomesogens.
Univers
ity of
Mala
ya

135
Figure 4.84 Photomicrographs of: (a) 10 on cooling at 121 oC; and
(b) [Cu2(p-CH3(CH2)9OC6H4COO)4(H2O)2] on cooling at 142 oC
The DSC traces for 10 (Figure 4.85) shows a sharp endothermic peaks at 118
oC (∆H = +81 kJ mol-1) assigned to Cr2-M transition, and two overlapping endothermic
peaks at 144 oC (∆Hcombined = +115 kJ mol-1) assigned to M-I transition. On cooling, an
exothermic peak at 121 oC (∆H = -81 kJ mol-1) and two overlapping endothermic peaks
at 92 oC (∆Hcombined = 27 kJ mol-1) assigned to I-M and M-Cr2 transitions, respectively.
Figure 4.85 DSC scans of 10
Univers
ity of
Mala
ya
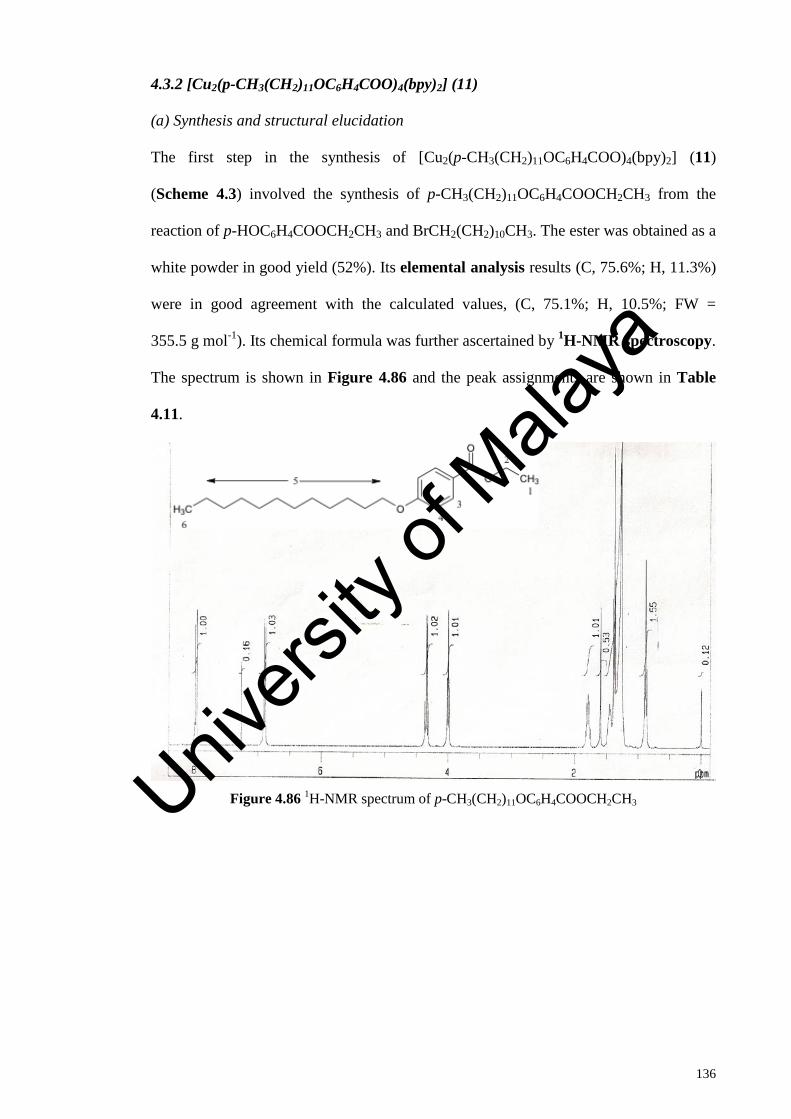
136
4.3.2 [Cu2(p-CH3(CH2)11OC6H4COO)4(bpy)2] (11)
(a) Synthesis and structural elucidation
The first step in the synthesis of [Cu2(p-CH3(CH2)11OC6H4COO)4(bpy)2] (11)
(Scheme 4.3) involved the synthesis of p-CH3(CH2)11OC6H4COOCH2CH3 from the
reaction of p-HOC6H4COOCH2CH3 and BrCH2(CH2)10CH3. The ester was obtained as a
white powder in good yield (52%). Its elemental analysis results (C, 75.6%; H, 11.3%)
were in good agreement with the calculated values, (C, 75.1%; H, 10.5%; FW =
355.5 g mol-1). Its chemical formula was further ascertained by 1H-NMR spectroscopy.
The spectrum is shown in Figure 4.86 and the peak assignments are shown in Table
4.11.
Figure 4.86 1H-NMR spectrum of p-CH3(CH2)11OC6H4COOCH2CH3
Univers
ity of
Mala
ya

137
Table 4.11 1H-NMR spectral data for p-CH3(CH2)11OC6H4COOCH2CH3
Chemical shift (ppm) Ratio Multiplicity Assignments
0.60 1.5 triplet H-6
1.2-1.5 10.9 multiplet H-5
4.00 1.01 triplet H-1
4.34 1.02 quartet H-2
6.85 1.0 doublet H-3
7.98 1.0 doublet H-4
The ester formed colourless crystals on recrystallisation from chloroform. The
single crystal X-ray crystallographic data and structure refinement for the crystal are
shown in Table 4.12, selected bond lengths and angles are shown in Table 4.13, and
ORTEP presentations and packing patterns are shown in Figure 4.87.
Univers
ity of
Mala
ya

138
Table 4.12 Crystallographic data nd refinement details for p-CH3(CH2)11OC6H4COOCH2CH3
Empirical formula C21H34O3
Formula weight 334.48
Temperature (K) 296(2)
Crystal system Monoclinic
Space group P21/C
Unit cell dimension
a = 23.008(5) Å α = 90o
b = 14.532(3) Å β = 94.409(3)o
c = 5.8960(12) Å γ = 90o
V (Å3) 1965.5(7)
Z 4
ρ (calcd) (g cm-3) 1.130
μ (mm-1) 0.073
F(000) 736
θ range (o) 0.89 – 28.31
Index ranges −30 ≤ h ≤ 30 ; −19 ≤ k ≤ 19; −7 ≤ l ≤ 7
Reflections collected 25919
Independent reflections, Rint 4849, 0.05251
Completeness to θ 99.3 %
Data / restraints / parameters 4849 / 0 / 219
Goodness-of-fit on F2 1.177
Final R indices [I > 2σ(I)] R1 = 0.0716; wR2 = 0.2080
R indices (all data) R1 = 0.0890; wR2 = 0.2222
∆ρmax, ∆ρmin (e Å-3) 0.410, -0.304
Table 4.13 Selected bond lengths (Å) and angles (o) for p-CH3(CH2)11OC6H4COOCH2CH3
Bond length Angle
C(13)-O(1) 1.367(3) O-C-O 123.8(2)
C(17)-O(2) 1.338(3) O-C-C 106.52(19)
C(17)-O(3) 1.212(3) C-O-C 116.0(2)
C(1)-C(2) 1.531(4) O-C-H 110.4
C(1)-H(23) 0.9600
Univers
ity of
Mala
ya

139
(a)
(b)
Figure 4.87 (a) Molecular structure, and (b) packing diagram for
p-CH3(CH2)11OC6H4COOCH2CH3 viewed along crystallographic c-axis.
Univers
ity of
Mala
ya

140
Its FTIR data (Table 4.10; Figure 4.88) shows the presence of the expected
functional groups.
Figure 4.88 FTIR spectrum of p-CH3(CH2)11OC6H4COOCH2CH3
The second step involved alkaline hydrolysis of
p-CH3(CH2)11OC6H4COOCH2CH3 using KOH. The product was a white powder and its
yield was 49%. The results of the elemental analyses (C, 65.3%; H, 9.0%) were in
good agreement with the calculated values for p-CH3(CH2)11OC6H4COOK (C, 66.2%;
H, 8.5%; FW 344.5 g mol-1). Its FTIR data (Table 4.10; Figure 4.89) show the
presence of the expected functional groups. Hence, the Δνcoo value for
p-CH3(CH2)11OC6H4COO- ion was 150 cm-1. Univers
ity of
Mala
ya

141
Figure 4.89 FTIR spectrum of p-CH3(CH2)11OC6H4COOK
The third step involved reacting p-CH3(CH2)11OC6H4COOK with CuSO4.5H2O
to form the precursor complex, [Cu2(p-CH3(CH2)11OC6H4COO)4(H2O)2].2H2O (yield =
25%). The results of the elemental analyses (C, 64.6%; H, 8.7%) were in good
agreement with those calculated (C, 64.2%; H, 8.8%); FW 1420.9 g mol-1). Its FTIR
data (Table 4.10; Figure 4.90) show the presence of the expected functional groups.
Hence, the Δνcoo value was 177 cm-1, which was higher than the value for p-
CH3(CH2)11OC6H4COOK (150 cm-1), indicating that p-CH3(CH2)11OC6H4COO- ion was
coordinated as a bridging bidentate ligand. Univers
ity of
Mala
ya

142
Figure 4.90 FTIR spectrum of [Cu2(p-CH3(CH2)11OC6H4COO)4(H2O)2].2H2O
Its UV-vis spectrum (Figure 4.91) in C2H5OH and CH3COOH (9:1 v/v;
molarity = 2.37 x 10⁻³ mol L-1) shows two weak d-d bands at 703 nm
(εmax = 330 M-1 cm-1) and at 356 nm (εmax = 165 M-1 cm-1), suggesting a square
pyramidal geometry at both Cu(II) centres. These data were similar to the previous
discussed complexes and may be similarly explained.
Univers
ity of
Mala
ya

143
Figure 4.91 UV-vis spectrum of [Cu2(p-CH3(CH2)11OC6H4COO)4(H2O)2].2H2O
Its μeff value, calculated as previously done using its formula weight
(1420.9 g mol-1) and the values of mass susceptibility (χg; 2.49 x 10⁻⁷ cm3 g-1), molar
susceptibility (χm; 3.54 x 10⁻⁴ cm3 mol-1), diamagnetic correction factor
(χD; -7.10 x 10⁻⁴ cm3 mol-1) and corrected molar susceptibility
(χmcorr; 1.06 x 10⁻³ cm3 mol-1), was 1.59 BM at 298 K. The value was lower than the
shorter alkyloxy chain analog, [Cu2(p-CH3(CH2)9OC6H4COO)4(H2O)2] (1.87 BM),
indicating a strong antiferromagnetic interaction in the former.
[Cu2(p-CH3(CH2)11OC6H4COO)4(H2O)2].2H2O reacted with bpy to form a blue
powder (80%). The results of the elemental analysis (C, 68.0%; H, 8.1%; N, 3.3%)
were in good agreement with the calculated values for
[Cu2(p-CH3(CH2)11OC6H4COO)4(bpy)2] (11) (C, 69.0%; H, 8.0%; N, 3.4%;
FW 1661.1 g mol-1).
Its FTIR data (Table 4.10; Figure 4.92) show the presence of the expected
functional groups. Hence, the Δνcoo values were 176 cm-1 and 229 cm-1, in agreement
Univers
ity of
Mala
ya

144
with monodentate nonbridging and syn-anti monodentate bridging
p-CH3(CH2)11OC6H4COO- ligands.
Figure 4.92 FTIR spectrum of 11
Its UV-vis spectrum (Figure 4.93) in C2H5OH and CH3COOH (9:1 v/v;
molarity = 1.69 x 10⁻³ mol L-1) shows a weak d-d band at 675 nm (εmax = 117 M-1 cm-1),
suggesting a square pyramidal geometry at both Cu(II) centres. These data were similar
to the previous discussed complexes.
Univers
ity of
Mala
ya
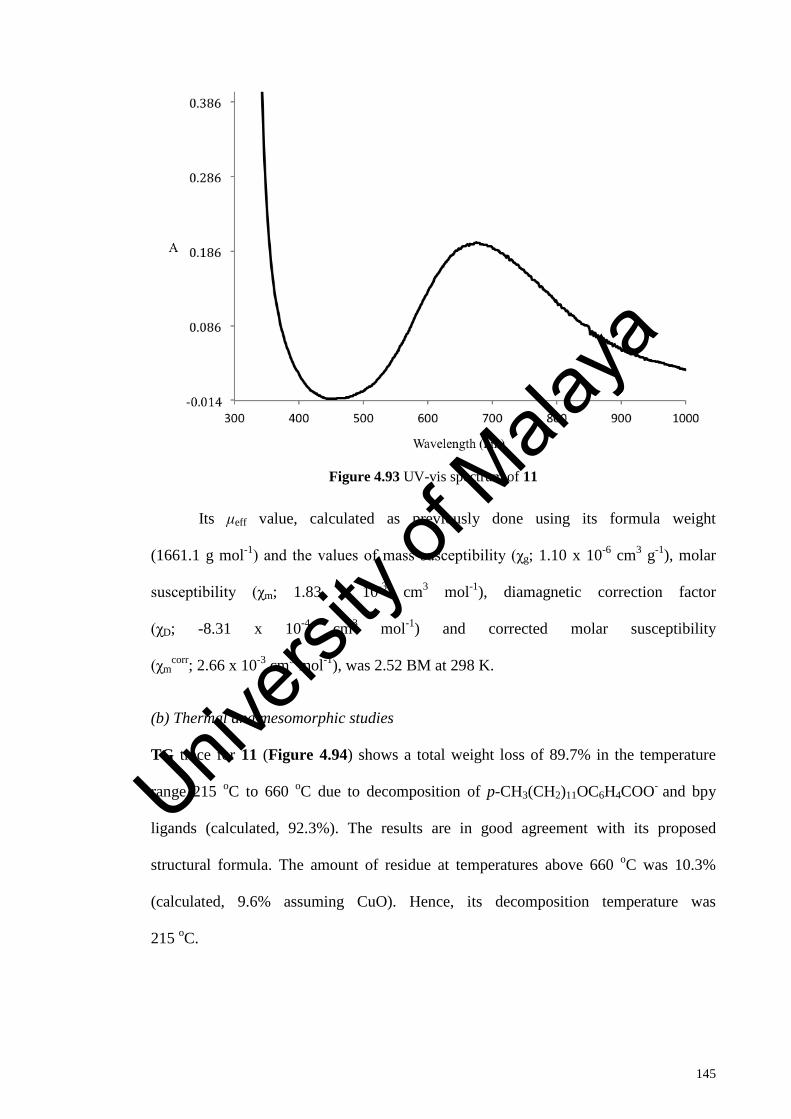
145
Figure 4.93 UV-vis spectrum of 11
Its μeff value, calculated as previously done using its formula weight
(1661.1 g mol-1) and the values of mass susceptibility (χg; 1.10 x 10⁻⁶ cm3 g-1), molar
susceptibility (χm; 1.83 x 10⁻³ cm3 mol-1), diamagnetic correction factor
(χD; -8.31 x 10⁻⁴ cm3 mol-1) and corrected molar susceptibility
(χmcorr; 2.66 x 10⁻³ cm3 mol-1), was 2.52 BM at 298 K.
(b) Thermal and mesomorphic studies
TG trace for 11 (Figure 4.94) shows a total weight loss of 89.7% in the temperature
range 215 oC to 660 oC due to decomposition of p-CH3(CH2)11OC6H4COO- and bpy
ligands (calculated, 92.3%). The results are in good agreement with its proposed
structural formula. The amount of residue at temperatures above 660 oC was 10.3%
(calculated, 9.6% assuming CuO). Hence, its decomposition temperature was
215 oC.
Univers
ity of
Mala
ya
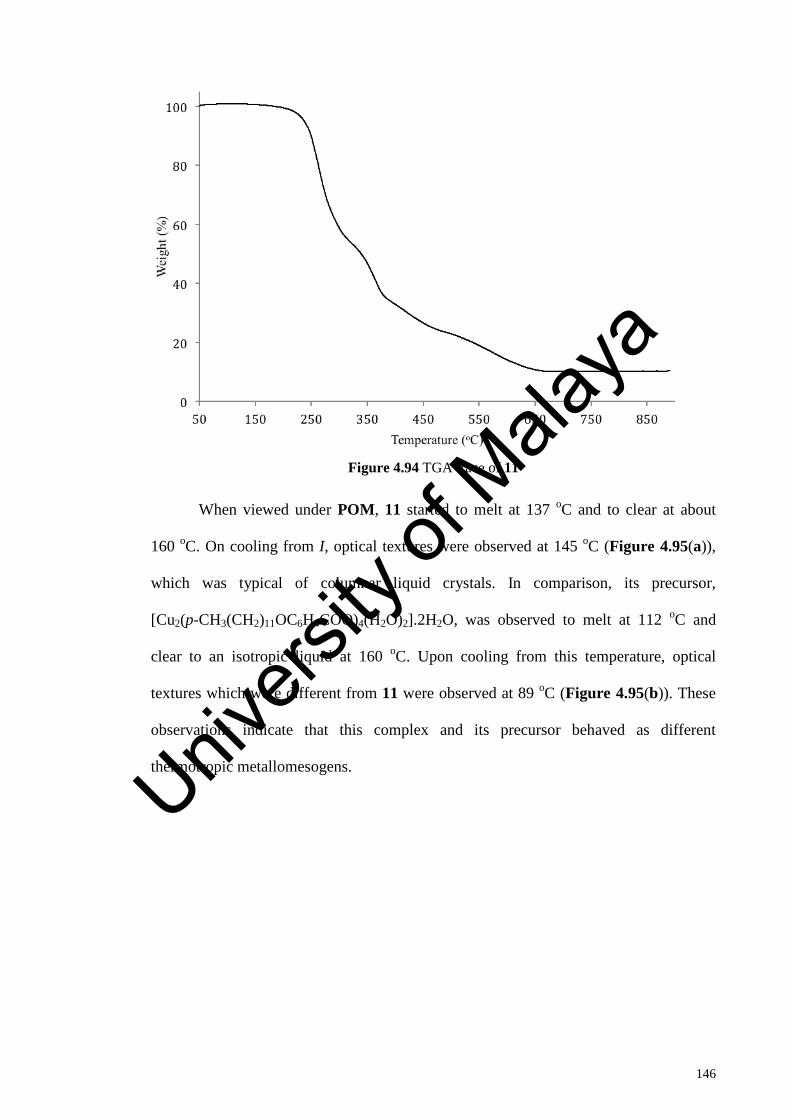
146
Figure 4.94 TGA trace of 11
When viewed under POM, 11 started to melt at 137 oC and to clear at about
160 oC. On cooling from I, optical textures were observed at 145 oC (Figure 4.95(a)),
which was typical of columnar liquid crystals. In comparison, its precursor,
[Cu2(p-CH3(CH2)11OC6H4COO)4(H2O)2].2H2O, was observed to melt at 112 oC and
clear to an isotropic liquid at 160 oC. Upon cooling from this temperature, optical
textures which were different from 11 were observed at 89 oC (Figure 4.95(b)). These
observations indicate that this complex and its precursor behaved as different
thermotropic metallomesogens.
Univ
ersity
of M
alaya
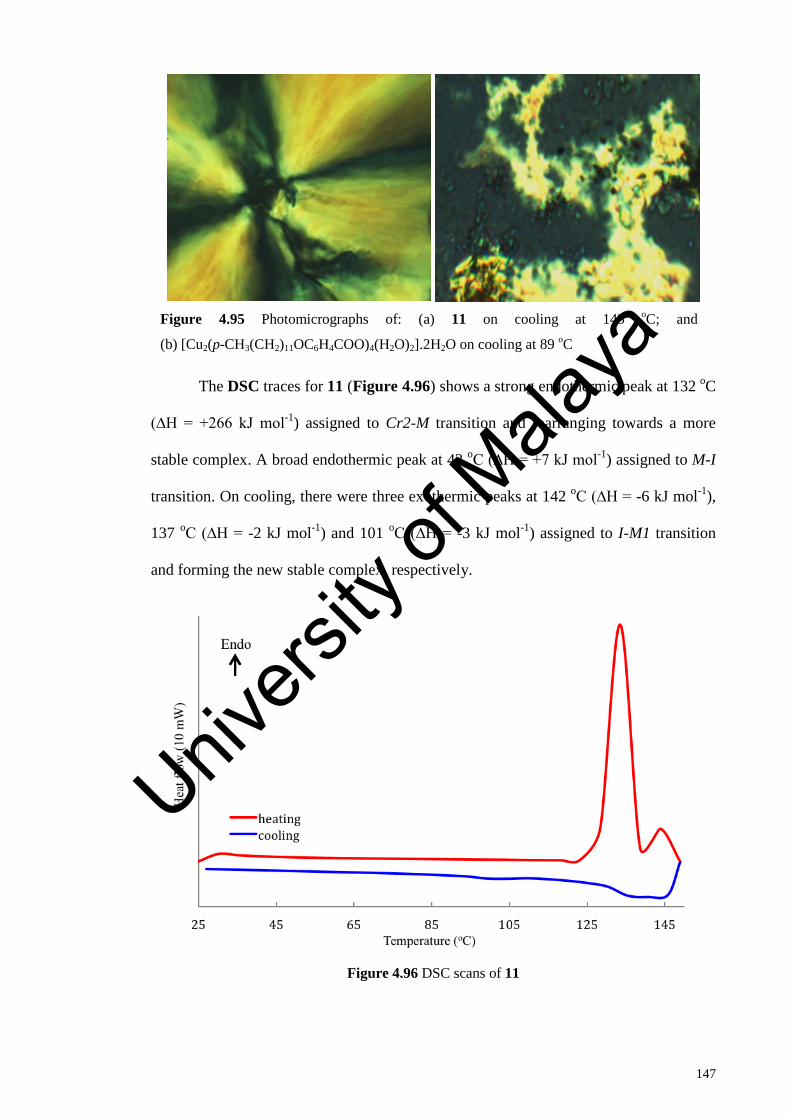
147
Figure 4.95 Photomicrographs of: (a) 11 on cooling at 145 oC; and
(b) [Cu2(p-CH3(CH2)11OC6H4COO)4(H2O)2].2H2O on cooling at 89 oC
The DSC traces for 11 (Figure 4.96) shows a strong endothermic peak at 132 oC
(∆H = +266 kJ mol-1) assigned to Cr2-M transition and rearranging towards a more
stable complex. A broad endothermic peak at 43 oC (∆H = +7 kJ mol-1) assigned to M-I
transition. On cooling, there were three exothermic peaks at 142 oC (∆H = -6 kJ mol-1),
137 oC (∆H = -2 kJ mol-1) and 101 oC (∆H = -3 kJ mol-1) assigned to I-M1 transition
and forming the new stable complex, respectively.
Figure 4.96 DSC scans of 11
Univers
ity of
Mala
ya
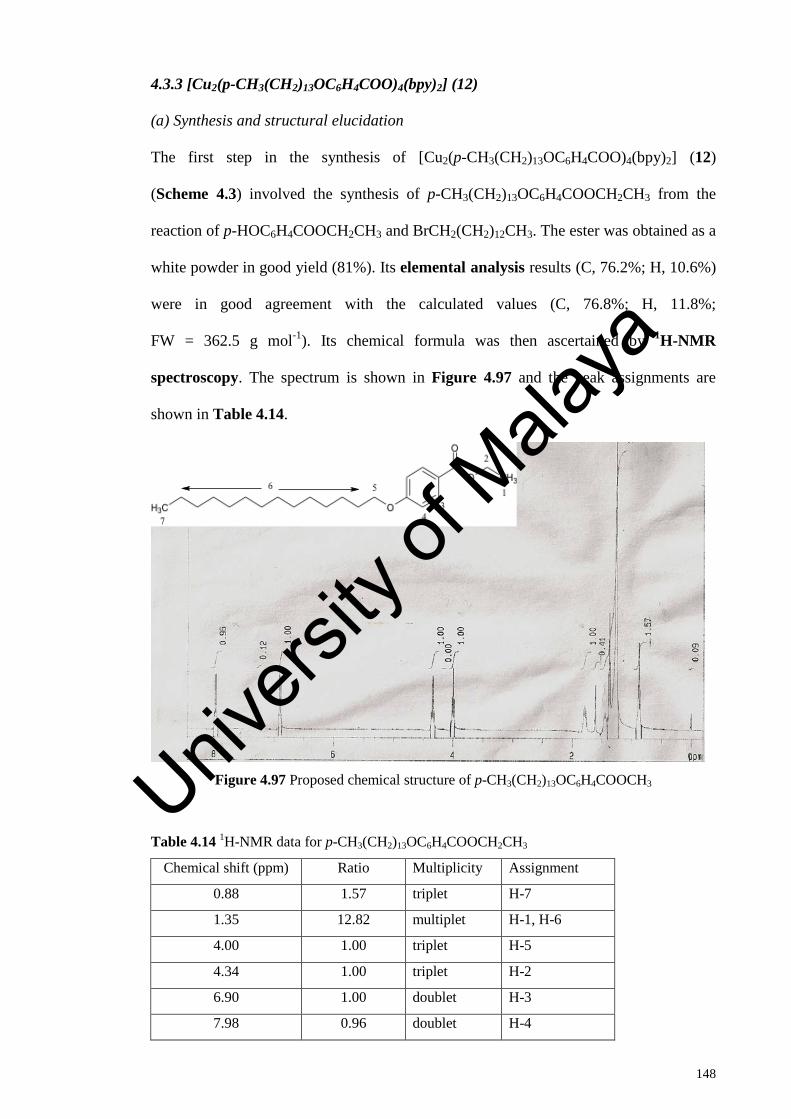
148
4.3.3 [Cu2(p-CH3(CH2)13OC6H4COO)4(bpy)2] (12)
(a) Synthesis and structural elucidation
The first step in the synthesis of [Cu2(p-CH3(CH2)13OC6H4COO)4(bpy)2] (12)
(Scheme 4.3) involved the synthesis of p-CH3(CH2)13OC6H4COOCH2CH3 from the
reaction of p-HOC6H4COOCH2CH3 and BrCH2(CH2)12CH3. The ester was obtained as a
white powder in good yield (81%). Its elemental analysis results (C, 76.2%; H, 10.6%)
were in good agreement with the calculated values (C, 76.8%; H, 11.8%;
FW = 362.5 g mol-1). Its chemical formula was then ascertained by 1H-NMR
spectroscopy. The spectrum is shown in Figure 4.97 and the peak assignments are
shown in Table 4.14.
Figure 4.97 Proposed chemical structure of p-CH3(CH2)13OC6H4COOCH3
Table 4.14 1H-NMR data for p-CH3(CH2)13OC6H4COOCH2CH3
Chemical shift (ppm) Ratio Multiplicity Assignment
0.88 1.57 triplet H-7
1.35 12.82 multiplet H-1, H-6
4.00 1.00 triplet H-5
4.34 1.00 triplet H-2
6.90 1.00 doublet H-3
7.98 0.96 doublet H-4
Univers
ity of
Mala
ya

149
Its FTIR data (Table 4.10; Figure 4.98) show the presence of the expected
functional groups.
Figure 4.98 FTIR spectrum of p-CH3(CH2)13OC6H4COOCH2CH3
The second step involved alkaline hydrolysis of
p-CH3(CH2)13OC6H4COOCH2CH3 using KOH. The product was a white powder and its
yield was 52%. The results of the elemental analyses (C, 67.7%; H, 8.9%) were in
good agreement for those calculated for p-CH3(CH2)13OC6H4COOK (C, 66.8%;
H, 8.9%; FW 372.6 g mol-1). Its FTIR spectrum (Table 4.10; Figure 4.99) shows the
presence of the expected functional groups. Hence, the Δνcoo value for
p-CH3(CH2)13OC6H4COO- ion was 149 cm-1. Univers
ity of
Mala
ya

150
Figure 4.99 FTIR spectrum of CH3(CH2)13OC6H4COOK
The third step involved reacting p-CH3(CH2)13OC6H4COOK with CuSO4.5H2O
to form the precursor complex, [Cu2(p-CH3(CH2)13OC6H4COO)4(H2O)2].2H2O (yield =
40%). The results of the elemental analyses (C, 65.0%; H, 8.8%) were in good
agreement for the stated formula (C, 65.8%; H, 9.2%); FW 1533.1 g mol-1). Its FTIR
data (Table 4.10; Figure 4.100) show the presence of the expected functional groups.
Hence, the Δνcoo value for p-CH3(CH2)9OC6H4COO- ion was 174 cm-1, which was
higher than the value for p-CH3(CH2)13OC6H4COOK (149 cm-1) indicating that
p-CH3(CH2)9OC6H4COO- ion was coordinated as a bridging bidentate ligand.
Univers
ity of
Mala
ya

151
Figure 4.100 FTIR spectrum of [Cu2(p-CH3(CH2)13OC6H4COO)4(H2O)2].2H2O
Its UV-vis spectrum (Figure 4.101) in C2H5OH and CH3COOH (9:1 v/v;
molarity = 1.71 x 10⁻³ mol L-1) shows two d-d bands at 705 nm (εmax = 195 M-1 cm-1)
and 369 nm (εmax = 84 M-1 cm-1). The data suggest a square pyramidal geometry for
both Cu(II) atoms in the complex.
Figure 4.101 UV-vis spectrum of [Cu2(p-CH3(CH2)13OC6H4COO)4(H2O)2].2H2O
Univers
ity of
Mala
ya
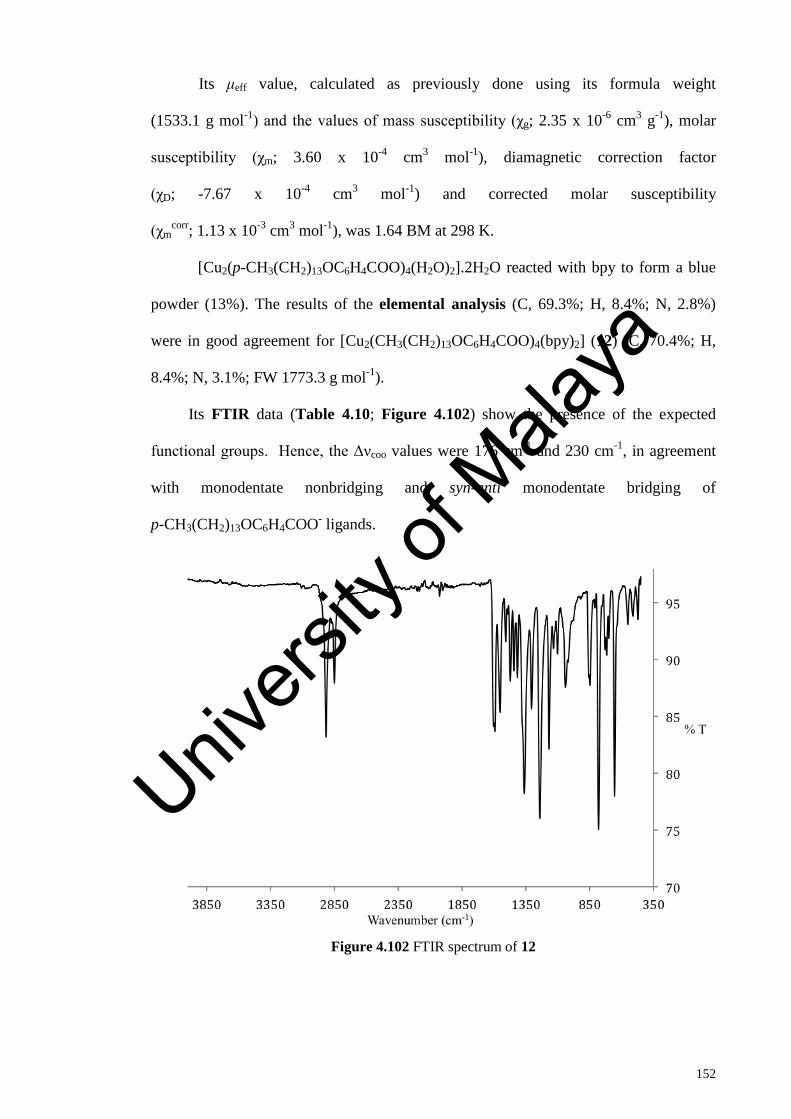
152
Its μeff value, calculated as previously done using its formula weight
(1533.1 g mol-1) and the values of mass susceptibility (χg; 2.35 x 10⁻⁶ cm3 g-1), molar
susceptibility (χm; 3.60 x 10⁻⁴ cm3 mol-1), diamagnetic correction factor
(χD; -7.67 x 10⁻⁴ cm3 mol-1) and corrected molar susceptibility
(χmcorr; 1.13 x 10⁻³ cm3 mol-1), was 1.64 BM at 298 K.
[Cu2(p-CH3(CH2)13OC6H4COO)4(H2O)2].2H2O reacted with bpy to form a blue
powder (13%). The results of the elemental analysis (C, 69.3%; H, 8.4%; N, 2.8%)
were in good agreement for [Cu2(CH3(CH2)13OC6H4COO)4(bpy)2] (12) (C, 70.4%; H,
8.4%; N, 3.1%; FW 1773.3 g mol-1).
Its FTIR data (Table 4.10; Figure 4.102) show the presence of the expected
functional groups. Hence, the Δνcoo values were 176 cm-1 and 230 cm-1, in agreement
with monodentate nonbridging and syn-anti monodentate bridging of
p-CH3(CH2)13OC6H4COO- ligands.
Figure 4.102 FTIR spectrum of 12
Univers
ity of
Mala
ya

153
Its UV-vis spectrum (Figure 4.103) in C2H5OH and CH3COOH (9:1 v/v;
molarity = 9.92 x 10⁻⁴ mol L-1) shows a d-d band at 661 nm (εmax = 317 M-1 cm-1),
suggesting a square pyramidal geometry at both Cu(II) atoms in the complex.
Figure 4.103 UV-vis spectrum of 12
Its μeff value, calculated as previously done using its formula weight
(1773.3 g mol-1) and the values of mass susceptibility (χg; 1.10 x 10⁻⁶ cm3 g-1), molar
susceptibility (χm; 1.95 x 10⁻³ cm3 mol-1), diamagnetic correction factor
(χD; -8.87 x 10⁻⁴ cm3 mol-1) and corrected molar susceptibility
(χmcorr; 2.84 x 10⁻³ cm3 mol-1), was 2.61 BM at 298 K.
(b) Thermal and mesomorphic studies
TG trace for 12 (Figure 4.104) shows a total weight loss of 80.3% in the temperature
range 170 oC to 583 oC due to decomposition of p-CH3(CH2)13OC6H4COO- ion and bpy
ligands (calculated, 91.1%). The results are in good agreement with its proposed
structural formula. The amount of residue at temperatures above 583 oC was 19.7%
Univers
ity of
Mala
ya
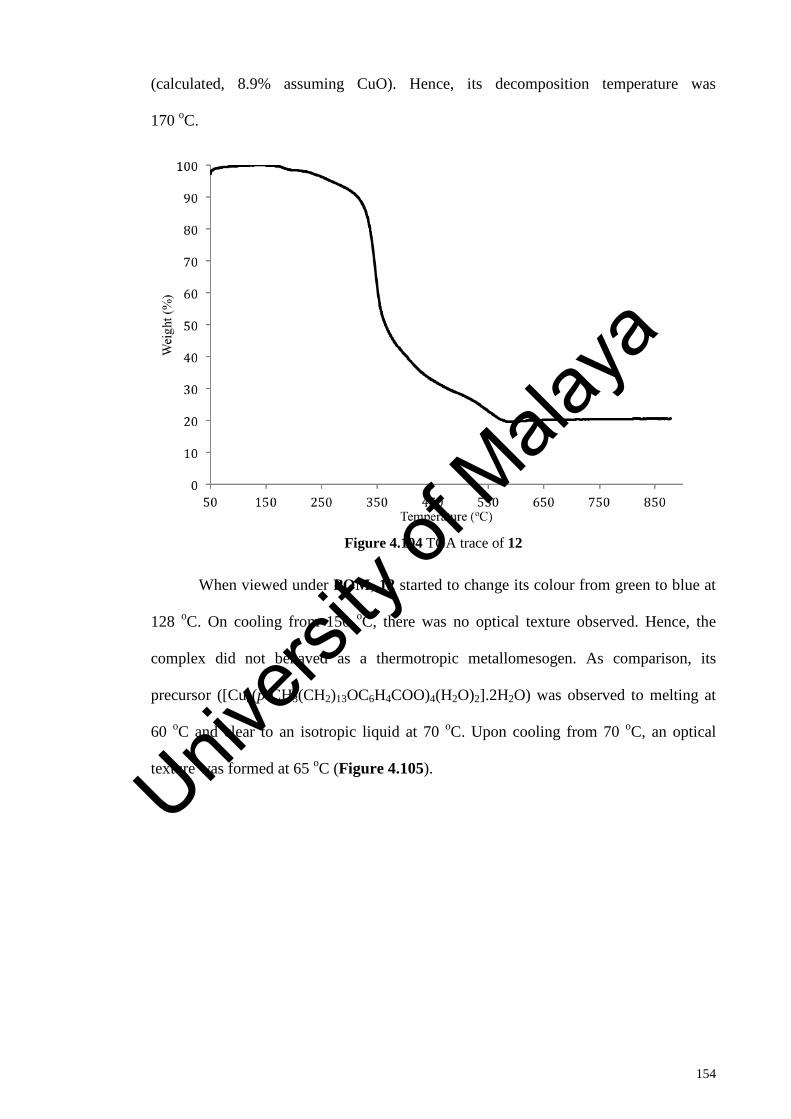
154
(calculated, 8.9% assuming CuO). Hence, its decomposition temperature was
170 oC.
Figure 4.104 TGA trace of 12
When viewed under POM, 12 started to change its colour from green to blue at
128 oC. On cooling from 150 oC, there was no optical texture observed. Hence, the
complex did not behaved as a thermotropic metallomesogen. As comparison, its
precursor ([Cu2(p-CH3(CH2)13OC6H4COO)4(H2O)2].2H2O) was observed to melting at
60 oC and clear to an isotropic liquid at 70 oC. Upon cooling from 70 oC, an optical
texture was formed at 65 oC (Figure 4.105).
Univers
ity of
Mala
ya

155
Figure 4.105 Photomicrographs of [Cu2(p-CH3(CH2)13OC6H4COO)4(H2O)2].2H2O on cooling at
65 oC
The DSC traces for 12 (Figure 4.106) shows an endothermic peak at 133 oC
(∆H = +193 kJ mol-1) due to structural rearranging towards a more stable complex. On
cooling from 150 oC, there were no exothermic peaks observed. On reheating, there was
no similar peak observed supporting the structural changes of the complex. This was
supported with the POM.
Figure 4.106 DSC scans of 12
Univers
ity of
Mala
ya
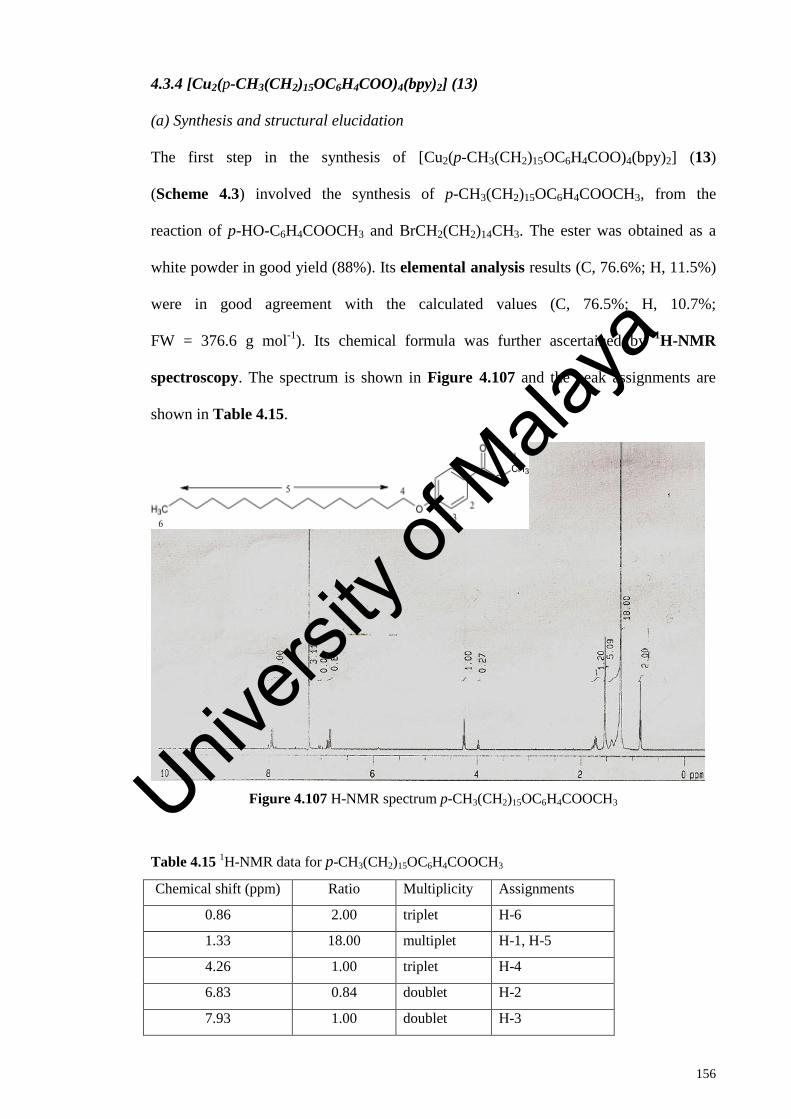
156
4.3.4 [Cu2(p-CH3(CH2)15OC6H4COO)4(bpy)2] (13)
(a) Synthesis and structural elucidation
The first step in the synthesis of [Cu2(p-CH3(CH2)15OC6H4COO)4(bpy)2] (13)
(Scheme 4.3) involved the synthesis of p-CH3(CH2)15OC6H4COOCH3, from the
reaction of p-HO-C6H4COOCH3 and BrCH2(CH2)14CH3. The ester was obtained as a
white powder in good yield (88%). Its elemental analysis results (C, 76.6%; H, 11.5%)
were in good agreement with the calculated values (C, 76.5%; H, 10.7%;
FW = 376.6 g mol-1). Its chemical formula was further ascertained by 1H-NMR
spectroscopy. The spectrum is shown in Figure 4.107 and the peak assignments are
shown in Table 4.15.
Figure 4.107 H-NMR spectrum p-CH3(CH2)15OC6H4COOCH3
Table 4.15 1H-NMR data for p-CH3(CH2)15OC6H4COOCH3
Chemical shift (ppm) Ratio Multiplicity Assignments
0.86 2.00 triplet H-6
1.33 18.00 multiplet H-1, H-5
4.26 1.00 triplet H-4
6.83 0.84 doublet H-2
7.93 1.00 doublet H-3
Univers
ity of
Mala
ya

157
Its FTIR data (Table 4.10; Figure 4.108) show the presence of the expected
functional groups.
Figure 4.108 FTIR spectrum of p-CH3(CH2)15OC6H4COOCH3
The second step involved alkaline hydrolysis of p-CH3(CH2)15OC6H4COOCH3
using KOH. The product was a white powder and its yield was 85%. The results of the
elemental analyses (C, 63.7%; H, 9.7%) were in good agreement for
p-CH3(CH2)15OC6H4COOK.2H2O (C, 63.3%; H, 9.5%; FW 436.7 g mol-1). Its FTIR
data (Table 4.10; Figure 4.109) show the presence of the expected functional groups.
Hence, the Δνcoo value for p-CH3(CH2)15OC6H4COO- ion was 148 cm-1
Univers
ity of
Mala
ya
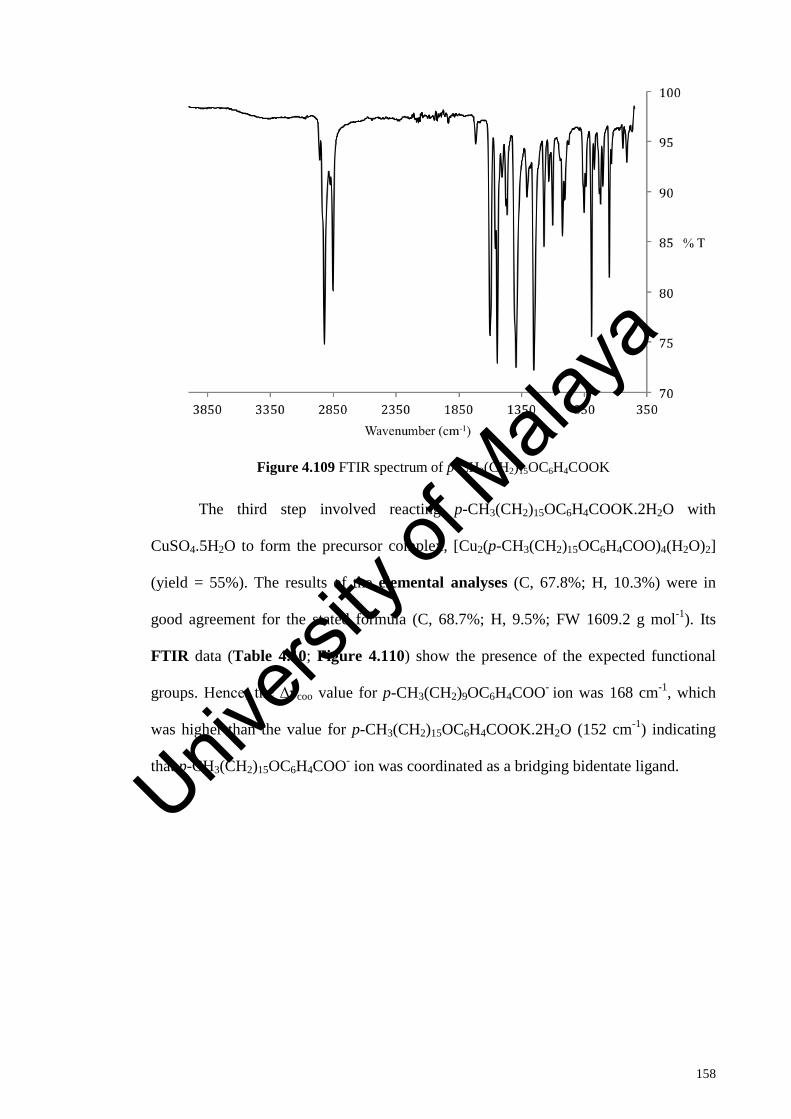
158
Figure 4.109 FTIR spectrum of p-CH3(CH2)15OC6H4COOK
The third step involved reacting p-CH3(CH2)15OC6H4COOK.2H2O with
CuSO4.5H2O to form the precursor complex, [Cu2(p-CH3(CH2)15OC6H4COO)4(H2O)2]
(yield = 55%). The results of the elemental analyses (C, 67.8%; H, 10.3%) were in
good agreement for the stated formula (C, 68.7%; H, 9.5%; FW 1609.2 g mol-1). Its
FTIR data (Table 4.10; Figure 4.110) show the presence of the expected functional
groups. Hence, the Δνcoo value for p-CH3(CH2)9OC6H4COO- ion was 168 cm-1, which
was higher than the value for p-CH3(CH2)15OC6H4COOK.2H2O (152 cm-1) indicating
that p-CH3(CH2)15OC6H4COO- ion was coordinated as a bridging bidentate ligand.
Univers
ity of
Mala
ya

159
Figure 4.110 FTIR spectrum of [Cu2(p-CH3(CH2)15OC6H4COO)4(H2O)2]
Its UV-vis spectrum (Figure 4.111) in C2H5OH and CH3COOH (9:1 v/v;
molarity = 1.51 x 10⁻³ mol L-1) shows two d-d bands at 708 nm (εmax = 160 M-1 cm-1)
and 364 nm (εmax = 140 M-1 cm-1). These suggest a square pyramidal geometry for both
Cu(II) atoms in the complex.
Figure 4.111 UV-vis spectrum of [Cu2(p-CH3(CH2)15OC6H4COO)4(H2O)2]
Univers
ity of
Mala
ya

160
Its μeff value, calculated as previously done using its formula weight
(1609.2 g mol-1) and the values of mass susceptibility (χg; 6.90 x 10⁻⁷ cm3 g-1), molar
susceptibility (χm; 1.11 x 10⁻³ cm3 mol-1), diamagnetic correction factor
(χD; -8.05 x 10⁻⁴ cm3 mol-1) and corrected molar susceptibility
(χmcorr; 1.91 x 10⁻³ cm3 mol-1), was 2.14 BM at 298 K.
[Cu2(p-CH3(CH2)15OC6H4COO)4(H2O)2] reacted with bpy to form a blue
powder (yield = 83%). The results of the elemental analysis (C, 70.0%; H, 9.1%; N,
2.0%) were in good agreement for [Cu2(p-CH3(CH2)15OC6H4COO)4(bpy)2] (13)
(C, 71.3%; H, 8.8%; N, 2.8%; FW 1885.5 g mol-1).
Its FTIR data (Table 4.10; Figure 4.112) show the presence of the expected
functional groups. Hence, the Δνcoo values were 159 cm-1 and 224 cm-1, in agreement
with monodentate nonbridging and syn-anti monodentate bridging
p-CH3(CH2)15OC6H4COO- ligands.
Figure 4.112 FTIR spectrum of 13
Univers
ity of
Mala
ya
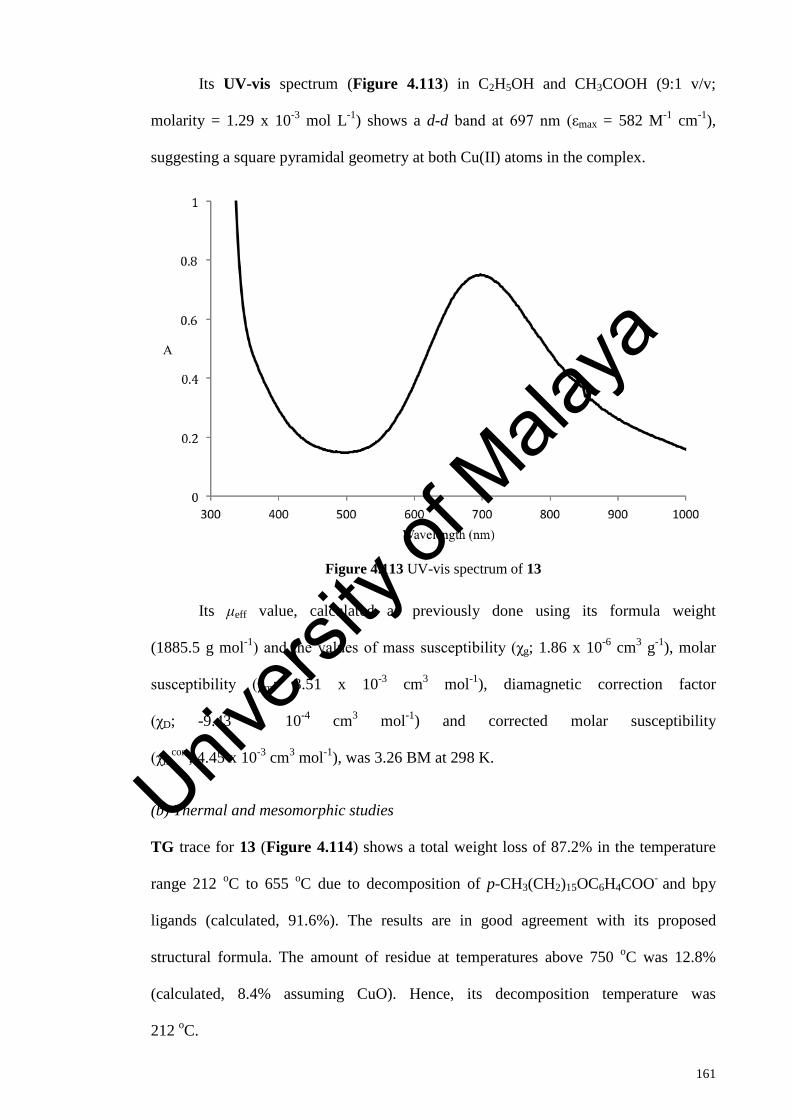
161
Its UV-vis spectrum (Figure 4.113) in C2H5OH and CH3COOH (9:1 v/v;
molarity = 1.29 x 10⁻³ mol L-1) shows a d-d band at 697 nm (εmax = 582 M-1 cm-1),
suggesting a square pyramidal geometry at both Cu(II) atoms in the complex.
Figure 4.113 UV-vis spectrum of 13
Its μeff value, calculated as previously done using its formula weight
(1885.5 g mol-1) and the values of mass susceptibility (χg; 1.86 x 10⁻⁶ cm3 g-1), molar
susceptibility (χm; 3.51 x 10⁻³ cm3 mol-1), diamagnetic correction factor
(χD; -9.43 x 10⁻⁴ cm3 mol-1) and corrected molar susceptibility
(χmcorr; 4.45 x 10⁻³ cm3 mol-1), was 3.26 BM at 298 K.
(b) Thermal and mesomorphic studies
TG trace for 13 (Figure 4.114) shows a total weight loss of 87.2% in the temperature
range 212 oC to 655 oC due to decomposition of p-CH3(CH2)15OC6H4COO- and bpy
ligands (calculated, 91.6%). The results are in good agreement with its proposed
structural formula. The amount of residue at temperatures above 750 oC was 12.8%
(calculated, 8.4% assuming CuO). Hence, its decomposition temperature was
212 oC.
Univers
ity of
Mala
ya
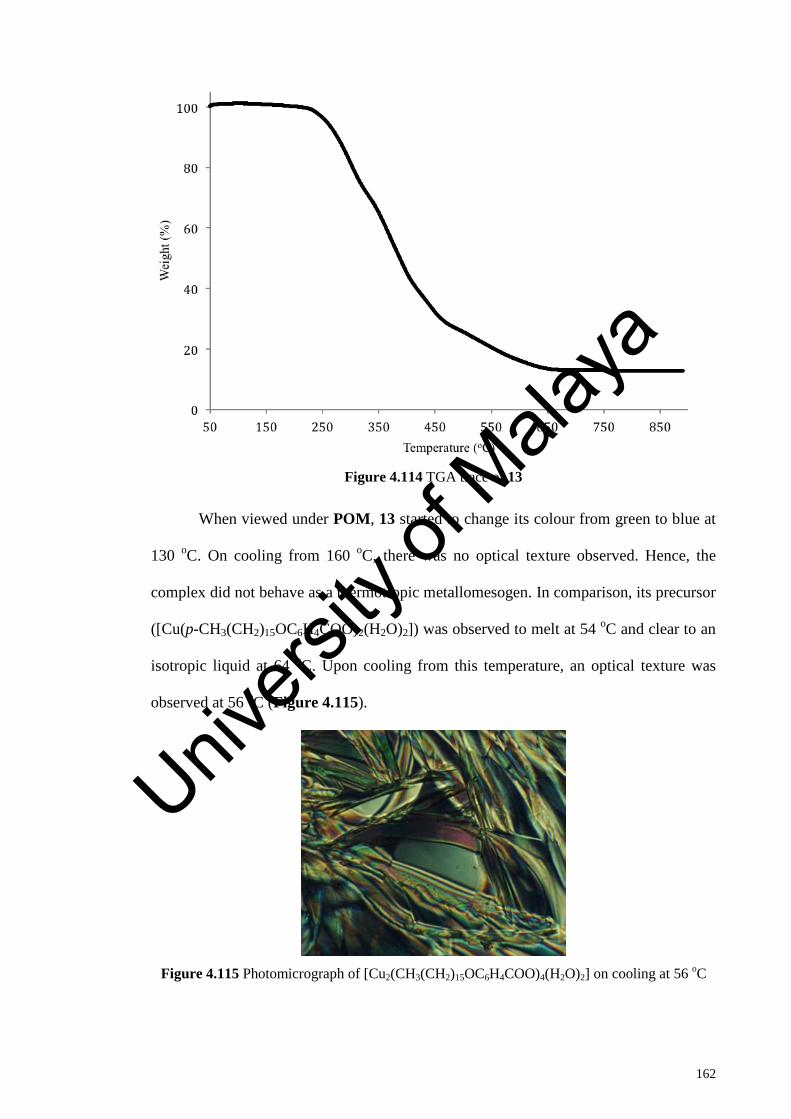
162
Figure 4.114 TGA trace of 13
When viewed under POM, 13 started to change its colour from green to blue at
130 oC. On cooling from 160 oC, there was no optical texture observed. Hence, the
complex did not behave as a thermotropic metallomesogen. In comparison, its precursor
([Cu(p-CH3(CH2)15OC6H4COO)2(H2O)2]) was observed to melt at 54 oC and clear to an
isotropic liquid at 64 oC. Upon cooling from this temperature, an optical texture was
observed at 56 oC (Figure 4.115).
Figure 4.115 Photomicrograph of [Cu2(CH3(CH2)15OC6H4COO)4(H2O)2] on cooling at 56 oC
Univers
ity of
Mala
ya
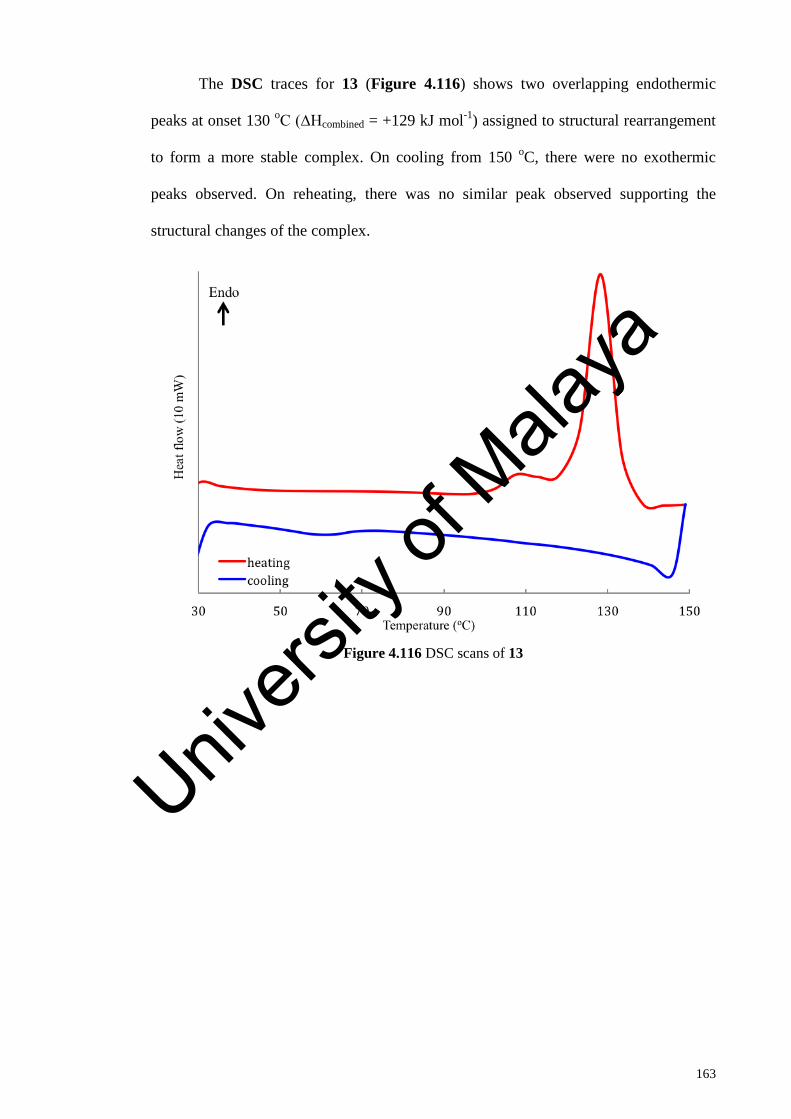
163
The DSC traces for 13 (Figure 4.116) shows two overlapping endothermic
peaks at onset 130 oC (∆Hcombined = +129 kJ mol-1) assigned to structural rearrangement
to form a more stable complex. On cooling from 150 oC, there were no exothermic
peaks observed. On reheating, there was no similar peak observed supporting the
structural changes of the complex.
Figure 4.116 DSC scans of 13
Univers
ity of
Mala
ya
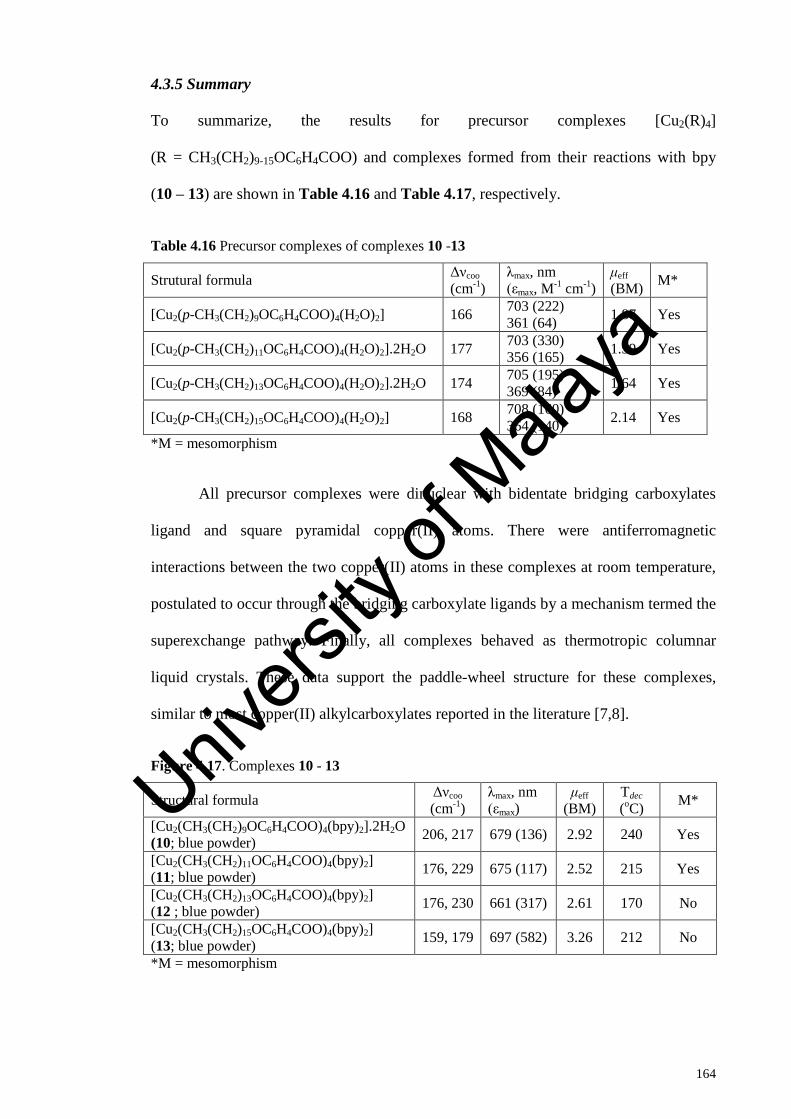
164
4.3.5 Summary
To summarize, the results for precursor complexes [Cu2(R)4]
(R = CH3(CH2)9-15OC6H4COO) and complexes formed from their reactions with bpy
(10 – 13) are shown in Table 4.16 and Table 4.17, respectively.
Table 4.16 Precursor complexes of complexes 10 -13
Strutural formula Δνcoo (cm-1)
λmax, nm (εmax, M-1 cm-1)
μeff (BM) M*
[Cu2(p-CH3(CH2)9OC6H4COO)4(H2O)2] 166 703 (222) 361 (64) 1.87 Yes
[Cu2(p-CH3(CH2)11OC6H4COO)4(H2O)2].2H2O 177 703 (330) 356 (165) 1.59 Yes
[Cu2(p-CH3(CH2)13OC6H4COO)4(H2O)2].2H2O 174 705 (195) 369 (84) 1.64 Yes
[Cu2(p-CH3(CH2)15OC6H4COO)4(H2O)2] 168 708 (160) 364 (140) 2.14 Yes
*M = mesomorphism
All precursor complexes were dinuclear with bidentate bridging carboxylates
ligand and square pyramidal copper(II) atoms. There were antiferromagnetic
interactions between the two copper(II) atoms in these complexes at room temperature,
postulated to occur through the bridging carboxylate ligands by a mechanism termed the
superexchange pathway. Finally, all complexes behaved as thermotropic columnar
liquid crystals. These data support the paddle-wheel structure for these complexes,
similar to most copper(II) alkylcarboxylates reported in the literature [7,8].
Figure 4.17. Complexes 10 - 13
Structural formula Δνcoo (cm-1)
λmax, nm (εmax)
μeff (BM)
Tdec (oC) M*
[Cu2(CH3(CH2)9OC6H4COO)4(bpy)2].2H2O (10; blue powder) 206, 217 679 (136) 2.92 240 Yes
[Cu2(CH3(CH2)11OC6H4COO)4(bpy)2] (11; blue powder) 176, 229 675 (117) 2.52 215 Yes
[Cu2(CH3(CH2)13OC6H4COO)4(bpy)2] (12 ; blue powder) 176, 230 661 (317) 2.61 170 No
[Cu2(CH3(CH2)15OC6H4COO)4(bpy)2] (13; blue powder) 159, 179 697 (582) 3.26 212 No
*M = mesomorphism
Univers
ity of
Mala
ya
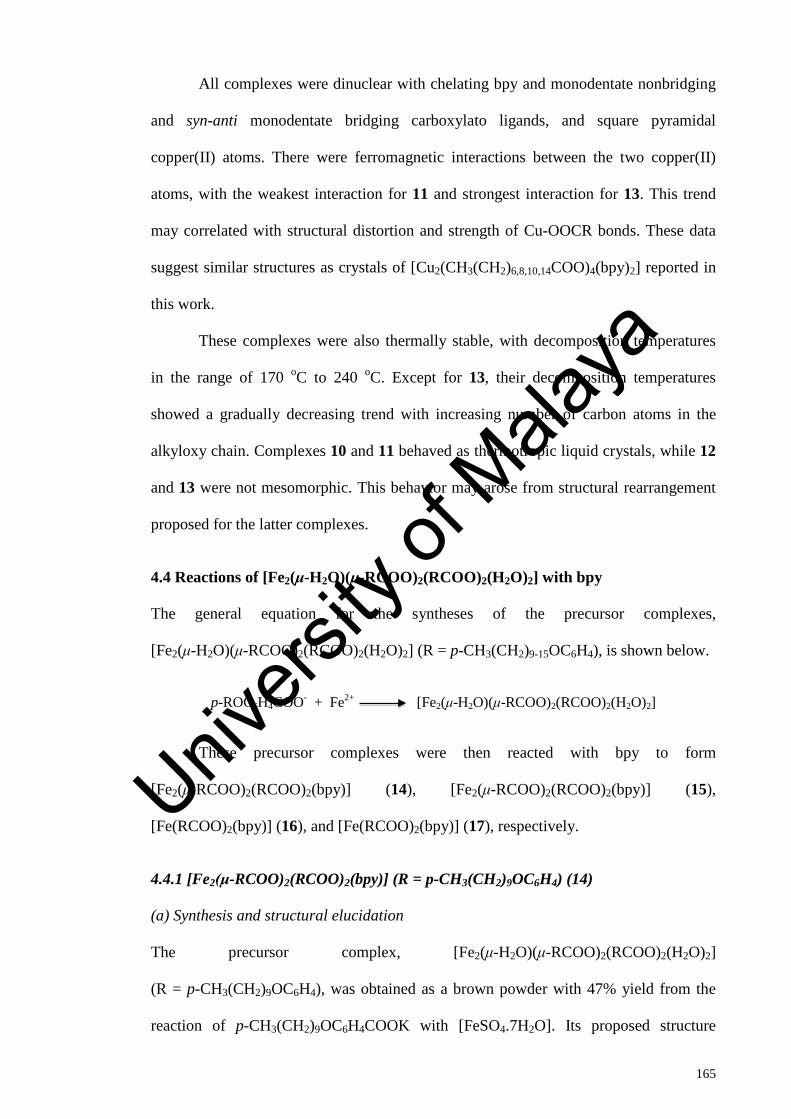
165
All complexes were dinuclear with chelating bpy and monodentate nonbridging
and syn-anti monodentate bridging carboxylato ligands, and square pyramidal
copper(II) atoms. There were ferromagnetic interactions between the two copper(II)
atoms, with the weakest interaction for 11 and strongest interaction for 13. This trend
may correlated with structural distortion and strength of Cu-OOCR bonds. These data
suggest similar structures as crystals of [Cu2(CH3(CH2)6,8,10,14COO)4(bpy)2] reported in
this work.
These complexes were also thermally stable, with decomposition temperatures
in the range of 170 oC to 240 oC. Except for 13, their decomposition temperatures
showed a gradually decreasing trend with increasing number of carbon atoms in the
alkyloxy chain. Complexes 10 and 11 behaved as thermotropic liquid crystals, while 12
and 13 were not mesomorphic. This behavior may arose from structural rearrangement
proposed for the latter complexes.
4.4 Reactions of [Fe2(μ-H2O)(μ-RCOO)2(RCOO)2(H2O)2] with bpy
The general equation for the syntheses of the precursor complexes,
[Fe2(μ-H2O)(μ-RCOO)2(RCOO)2(H2O)2] (R = p-CH3(CH2)9-15OC6H4), is shown below.
p-ROC6H4COO- + Fe2+ [Fe2(μ-H2O)(μ-RCOO)2(RCOO)2(H2O)2]
These precursor complexes were then reacted with bpy to form
[Fe2(μ-RCOO)2(RCOO)2(bpy)] (14), [Fe2(μ-RCOO)2(RCOO)2(bpy)] (15),
[Fe(RCOO)2(bpy)] (16), and [Fe(RCOO)2(bpy)] (17), respectively.
4.4.1 [Fe2(μ-RCOO)2(RCOO)2(bpy)] (R = p-CH3(CH2)9OC6H4) (14)
(a) Synthesis and structural elucidation
The precursor complex, [Fe2(μ-H2O)(μ-RCOO)2(RCOO)2(H2O)2]
(R = p-CH3(CH2)9OC6H4), was obtained as a brown powder with 47% yield from the
reaction of p-CH3(CH2)9OC6H4COOK with [FeSO4.7H2O]. Its proposed structure
Univers
ity of
Mala
ya
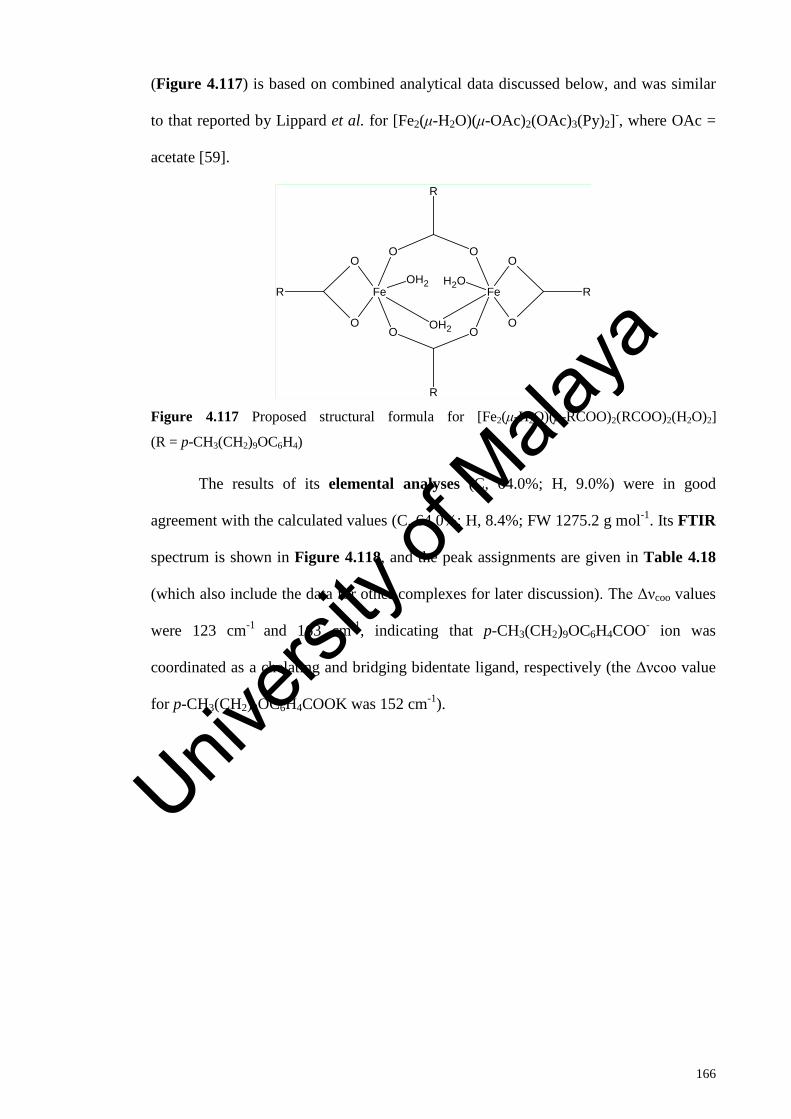
166
(Figure 4.117) is based on combined analytical data discussed below, and was similar
to that reported by Lippard et al. for [Fe2(μ-H2O)(μ-OAc)2(OAc)3(Py)2]-, where OAc =
acetate [59].
Fe
O
O OH2
OH2
O
O
Fe
O
O
O
O
H2ORR
R
R
Figure 4.117 Proposed structural formula for [Fe2(μ-H2O)(μ-RCOO)2(RCOO)2(H2O)2]
(R = p-CH3(CH2)9OC6H4)
The results of its elemental analyses (C, 64.0%; H, 9.0%) were in good
agreement with the calculated values (C, 64.0%; H, 8.4%; FW 1275.2 g mol-1. Its FTIR
spectrum is shown in Figure 4.118, and the peak assignments are given in Table 4.18
(which also include the data for other complexes for later discussion). The Δνcoo values
were 123 cm-1 and 163 cm-1, indicating that p-CH3(CH2)9OC6H4COO- ion was
coordinated as a chelating and bridging bidentate ligand, respectively (the Δνcoo value
for p-CH3(CH2)9OC6H4COOK was 152 cm-1).
Univers
ity of
Mala
ya

167
Figure 4.118 FTIR spectrum of [Fe2(μ-H2O)(μ-RCOO)2(RCOO)2(H2O)2]
(R = p-CH3(CH2)9OC6H4)
Table 4.18 FTIR data in (cm-1) and assignments (R = p-CH3(CH2)nOC6H4)
Compound CH2
(asym)
CH2
(sym)
COO
(asym)
COO
(sym)
C=C
(aro) C-N
[Fe2(μ-H2O)(μ-RCOO)2(RCOO)2(H2O)2]
(n = 9) 2919 2854 1593
1471,
1430 1606 -
[Fe2(μ-H2O)(μ-RCOO)2(RCOO)2(H2O)2]
.H2O
(n = 11)
2917 2852 1594 1470,
1431 1605 -
[Fe2(μ-H2O)(μ-RCOO)2(RCOO)2(H2O)2]
(n = 13) 2917 2851 1597
1471,
1433 1606 -
[Fe2(μ-H2O)(μ-RCOO)2(RCOO)2(H2O)2]
(n = 15) 2918 2850 1594
1472,
1429 1606 -
[Fe2(μ-RCOO)2(RCOO)2(bpy)];
(n = 9; complex 14) 2919 2853 1595
1470,
1431 1606 1307
[Fe2(μ-RCOO)2(RCOO)2(bpy)];
(n = 11; complex 15) 2918 2852 1579
1470,
1418 1606 1307
[Fe(RCOO)2(bpy)];
(n = 13; complex 16) 2916 2851 1598 1470 1606 1307
[Fe(RCOO)2(bpy)];
(n = 15; complex 17) 2917 2850 1597 1470 1607 1308
Univers
ity of
Mala
ya
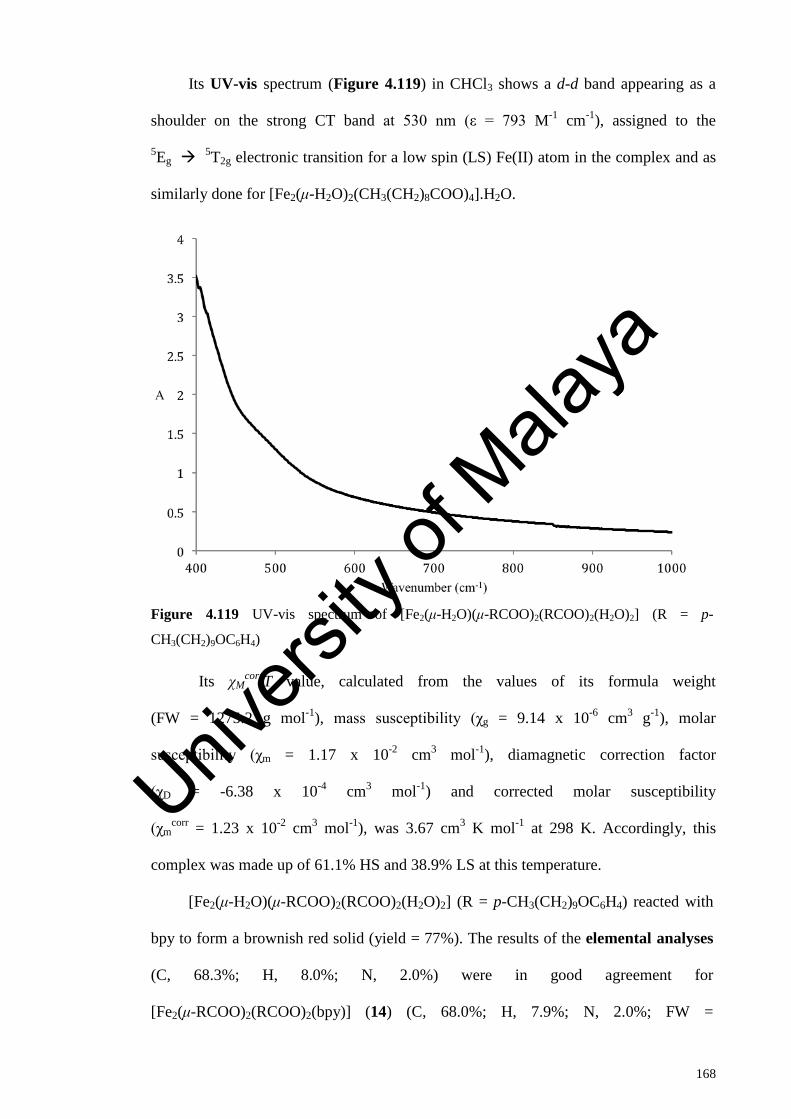
168
Its UV-vis spectrum (Figure 4.119) in CHCl3 shows a d-d band appearing as a
shoulder on the strong CT band at 530 nm (ε = 793 M-1 cm-1), assigned to the
5Eg 5T2g electronic transition for a low spin (LS) Fe(II) atom in the complex and as
similarly done for [Fe2(μ-H2O)2(CH3(CH2)8COO)4].H2O.
Figure 4.119 UV-vis spectrum of [Fe2(μ-H2O)(μ-RCOO)2(RCOO)2(H2O)2] (R = p-
CH3(CH2)9OC6H4)
Its χMcorrT value, calculated from the values of its formula weight
(FW = 1275.2 g mol-1), mass susceptibility (χg = 9.14 x 10⁻⁶ cm3 g-1), molar
susceptibility (χm = 1.17 x 10⁻² cm3 mol-1), diamagnetic correction factor
(χD = -6.38 x 10⁻⁴ cm3 mol-1) and corrected molar susceptibility
(χmcorr = 1.23 x 10⁻² cm3 mol-1), was 3.67 cm3 K mol-1 at 298 K. Accordingly, this
complex was made up of 61.1% HS and 38.9% LS at this temperature.
[Fe2(μ-H2O)(μ-RCOO)2(RCOO)2(H2O)2] (R = p-CH3(CH2)9OC6H4) reacted with
bpy to form a brownish red solid (yield = 77%). The results of the elemental analyses
(C, 68.3%; H, 8.0%; N, 2.0%) were in good agreement for
[Fe2(μ-RCOO)2(RCOO)2(bpy)] (14) (C, 68.0%; H, 7.9%; N, 2.0%; FW =
Univers
ity of
Mala
ya
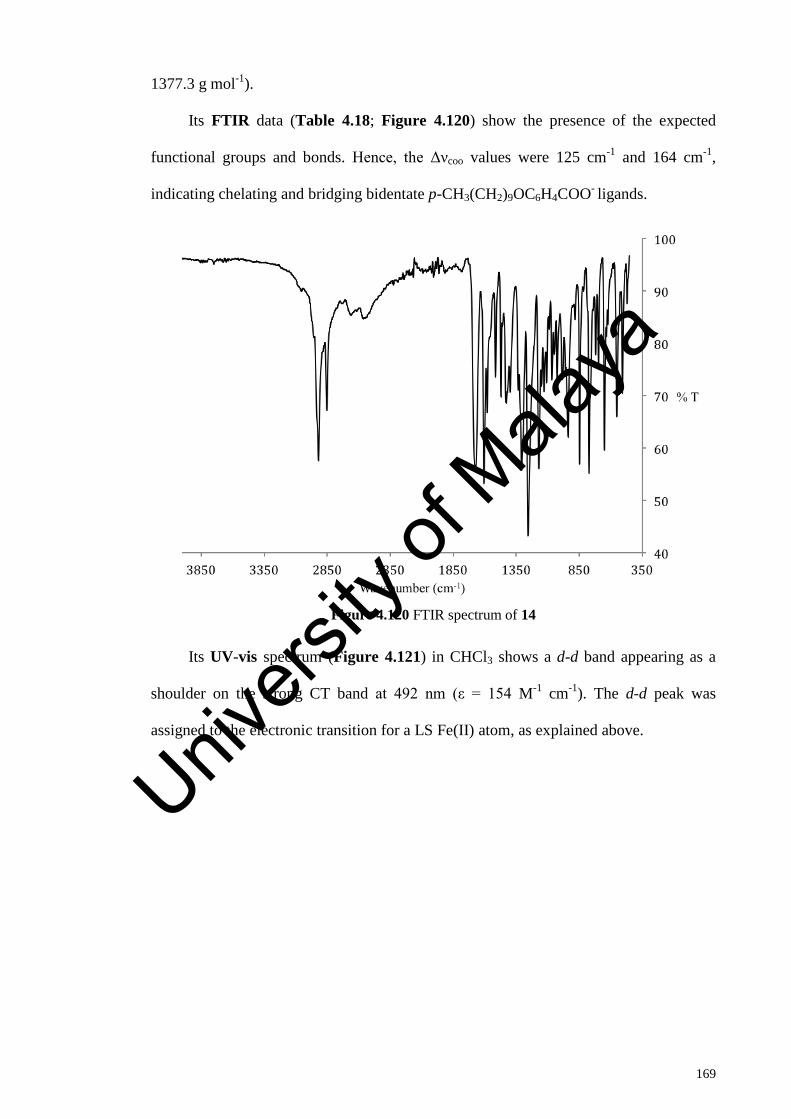
169
1377.3 g mol-1).
Its FTIR data (Table 4.18; Figure 4.120) show the presence of the expected
functional groups and bonds. Hence, the Δνcoo values were 125 cm-1 and 164 cm-1,
indicating chelating and bridging bidentate p-CH3(CH2)9OC6H4COO- ligands.
Figure 4.120 FTIR spectrum of 14
Its UV-vis spectrum (Figure 4.121) in CHCl3 shows a d-d band appearing as a
shoulder on the strong CT band at 492 nm (ε = 154 M-1 cm-1). The d-d peak was
assigned to the electronic transition for a LS Fe(II) atom, as explained above.
Univers
ity of
Mala
ya

170
Figure 4.121 UV-vis spectrum of 14
Its χMcorrT value, calculated from the values of its formula weight
(FW; 1377.3 g mol-1), mass susceptibility (χg; 2.64 x 10⁻⁶ cm3 g-1), molar susceptibility
(χm; 3.64 x 10⁻³ cm3 mol-1), diamagnetic correction factor (χD; -6.89 x 10⁻⁴ cm3 mol-1)
and corrected molar susceptibility (χmcorr; 4.32 x 10⁻³ cm3 mol-1), was 1.29 cm3 K mol-1
at 298 K. Accordingly, 14 was made up of 21.5% HS and 78.5% LS Fe(II) atoms. It is
noted that the value of HS was lower than its precursor
[Fe2(μ-H2O)(μ-RCOO)2(RCOO)2(H2O)2] (R = p-CH3(CH2)9OC6H4; 61.1% HS and
38.9% LS) at this temperature.
Combining the data above, it is proposed that 14 was dimeric with chelating and
bridging bidentate p-CH3(CH2)9OC6H4COO- and N-bridging bpy ligands
(Figure 4.122). Its proposed structure was similar to that reported for
[Fe2(BEAN)(μ-O2CPhCy)3].(OTf), where BEAN =
2,7-bis(N,N-diethylaminomethyl)-1,8-naphthyridine by He et al. [58] and
Fe2(μ-H2O)(μ-O2CCF3)2(μ-XDK)(TMEN)2], where XDK =
Univers
ity of
Mala
ya
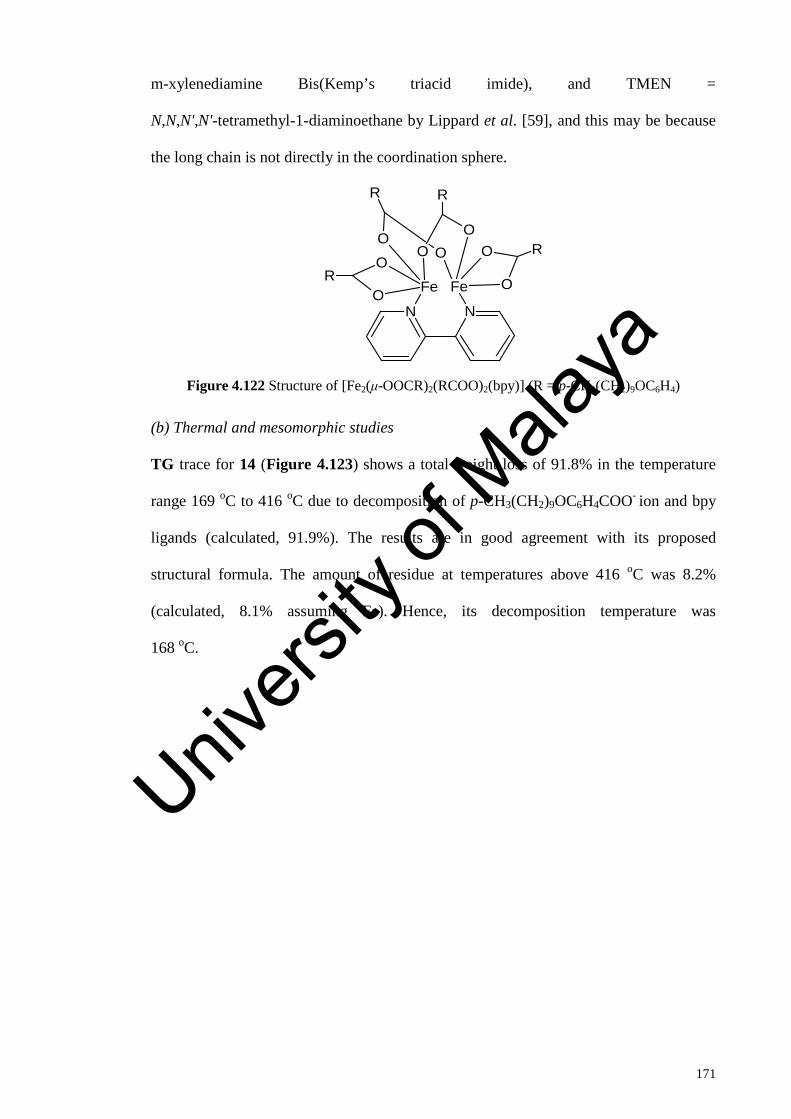
171
m-xylenediamine Bis(Kemp’s triacid imide), and TMEN =
N,N,N',N'-tetramethyl-1-diaminoethane by Lippard et al. [59], and this may be because
the long chain is not directly in the coordination sphere.
N NFe Fe
OOO
O
O
O
R
R
R
OO
R
Figure 4.122 Structure of [Fe2(μ-OOCR)2(RCOO)2(bpy)] (R = p-CH3(CH2)9OC6H4)
(b) Thermal and mesomorphic studies
TG trace for 14 (Figure 4.123) shows a total weight loss of 91.8% in the temperature
range 169 oC to 416 oC due to decomposition of p-CH3(CH2)9OC6H4COO- ion and bpy
ligands (calculated, 91.9%). The results are in good agreement with its proposed
structural formula. The amount of residue at temperatures above 416 oC was 8.2%
(calculated, 8.1% assuming Fe). Hence, its decomposition temperature was
168 oC.
Univers
ity of
Mala
ya
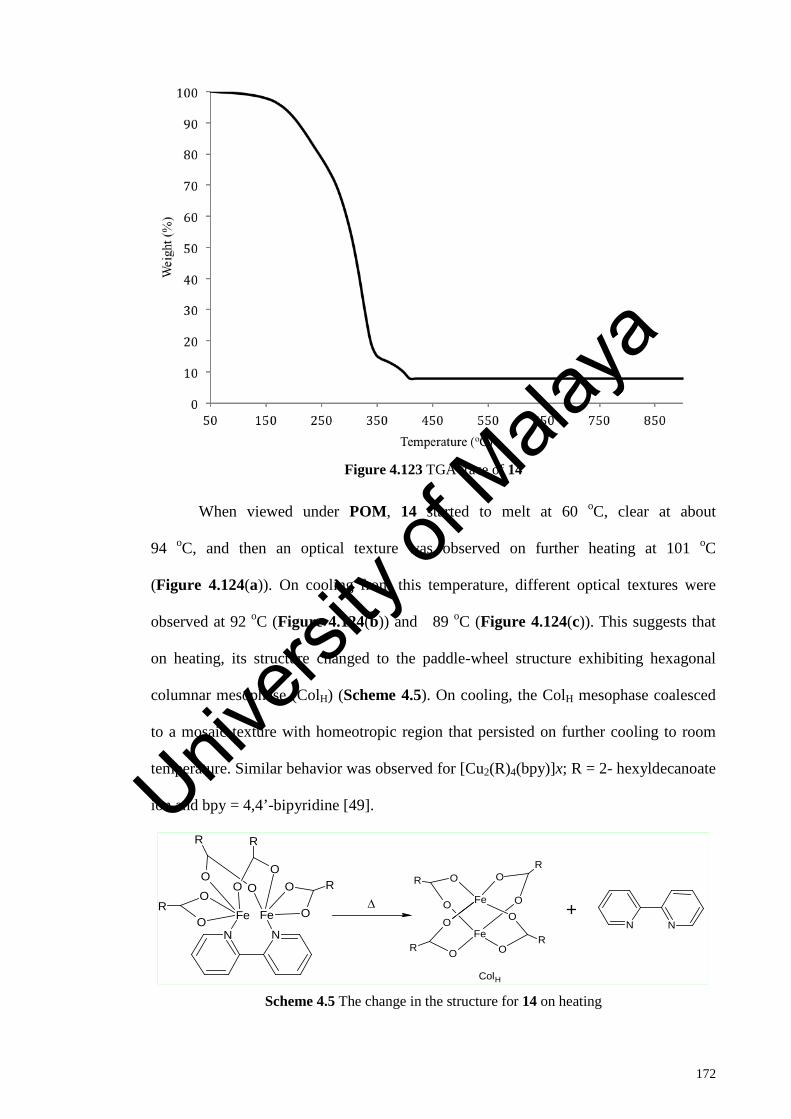
172
Figure 4.123 TGA trace of 14
When viewed under POM, 14 started to melt at 60 oC, clear at about
94 oC, and then an optical texture was observed on further heating at 101 oC
(Figure 4.124(a)). On cooling from this temperature, different optical textures were
observed at 92 oC (Figure 4.124(b)) and 89 oC (Figure 4.124(c)). This suggests that
on heating, its structure changed to the paddle-wheel structure exhibiting hexagonal
columnar mesophase (ColH) (Scheme 4.5). On cooling, the ColH mesophase coalesced
to a mosaic texture with homeotropic region that persisted on further cooling to room
temperature. Similar behavior was observed for [Cu2(R)4(bpy)]x; R = 2- hexyldecanoate
ion and bpy = 4,4’-bipyridine [49].
N NFe Fe
OOO
O
O
O
R
R
R
OO
R
FeO
OO
O
FeO
O
O
OR
R
R
R
∆ +N N
ColH Scheme 4.5 The change in the structure for 14 on heating
Univers
ity of
Mala
ya

173
For comparison its precursor complex, [Fe2(μ-H2O)(μ-RCOO)2(RCOO)2(H2O)2]
(R = p-CH3(CH2)9OC6H4), was observed to melt at 130 oC and to clear to an isotropic
liquid at 160 oC. Upon cooling from this temperature, optical textures different from 14
were observed at 127 oC (Figure 4.124(d)). These observations indicate that both 14
and its precursor complex behaved as different thermotropic metallomesogens.
(a) (b)
(c) (d)
Figure 4.124 Photomicrographs of: (a) 14 on heating at 101 oC; (b) 14 on cooling at
92 oC; (c) 14 on cooling at 89 oC; and (d) [Fe2(μ-H2O)(μ-RCOO)2(RCOO)2(H2O)2]
(R = p-CH3(CH2)9OC6H4) on cooling at 127 oC
The DSC traces for 14 (Figure 4.125) shows an endothermic peaks at 59 oC
(∆H = +31 kJ mol-1) assigned to its melting temperature, and two overlapping
endothermic peaks at 87 oC (∆Hcombined = +90 kJ mol-1) assigned to the breaking of the
Fe-N(bpy) and Fe-O bridging bonds. On cooling, there were a weak exothermic peak at
Univers
ity of
Mala
ya
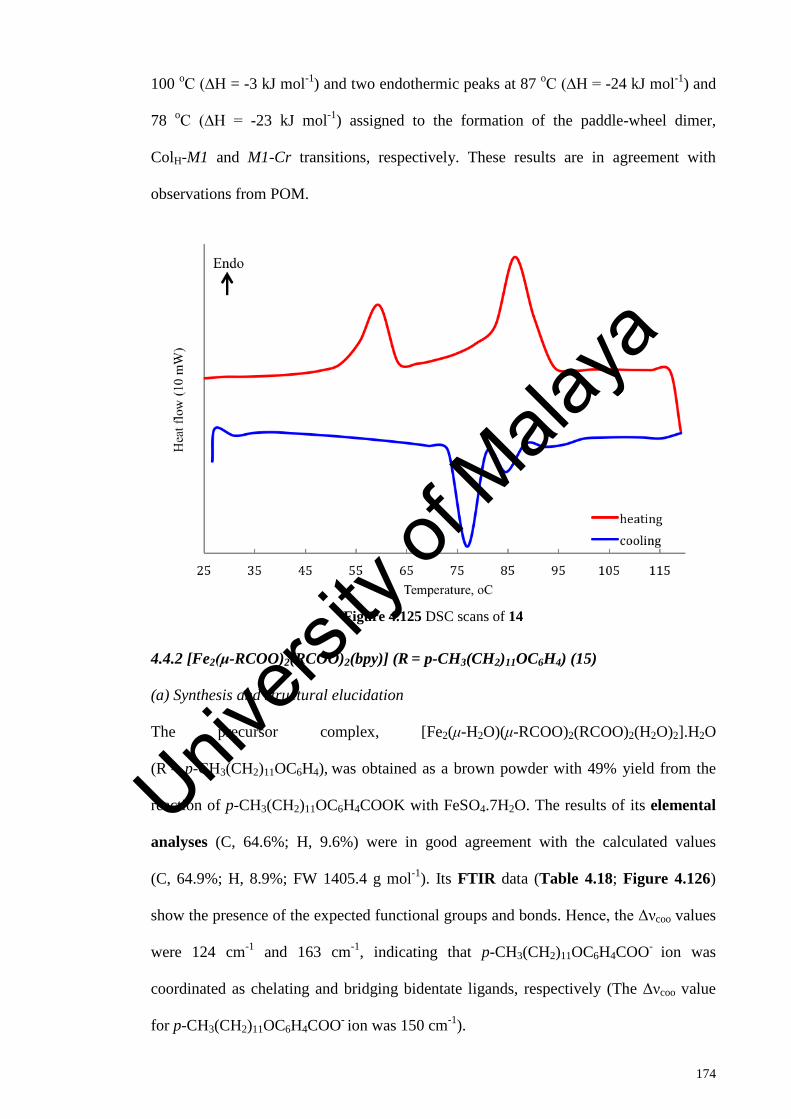
174
100 oC (∆H = -3 kJ mol-1) and two endothermic peaks at 87 oC (∆H = -24 kJ mol-1) and
78 oC (∆H = -23 kJ mol-1) assigned to the formation of the paddle-wheel dimer,
ColH-M1 and M1-Cr transitions, respectively. These results are in agreement with
observations from POM.
Figure 4.125 DSC scans of 14
4.4.2 [Fe2(μ-RCOO)2(RCOO)2(bpy)] (R = p-CH3(CH2)11OC6H4) (15)
(a) Synthesis and structural elucidation
The precursor complex, [Fe2(μ-H2O)(μ-RCOO)2(RCOO)2(H2O)2].H2O
(R = p-CH3(CH2)11OC6H4), was obtained as a brown powder with 49% yield from the
reaction of p-CH3(CH2)11OC6H4COOK with FeSO4.7H2O. The results of its elemental
analyses (C, 64.6%; H, 9.6%) were in good agreement with the calculated values
(C, 64.9%; H, 8.9%; FW 1405.4 g mol-1). Its FTIR data (Table 4.18; Figure 4.126)
show the presence of the expected functional groups and bonds. Hence, the Δνcoo values
were 124 cm-1 and 163 cm-1, indicating that p-CH3(CH2)11OC6H4COO- ion was
coordinated as chelating and bridging bidentate ligands, respectively (The Δνcoo value
for p-CH3(CH2)11OC6H4COO- ion was 150 cm-1).
Univers
ity of
Mala
ya

175
Figure 4.126 FTIR spectrum of [Fe2(μ-H2O)(μ-RCOO)2(RCOO)2(H2O)2].H2O
(R = p-CH3(CH2)11OC6H4)
Its UV-vis spectrum (Figure 4.127) in CHCl3 shows a continuously increasing
absorbance from about 800 nm with a d-d band appearing as a shoulder on the strong
CT band at 486 nm (ε = 1392 M-1 cm-1). The d-d peak was assigned to the electronic
transition for a LS Fe(II) atom, as explained above.
Univers
ity of
Mala
ya

176
Figure 4.127 UV-vis spectrum of [Fe2(μ-H2O)(μ-RCOO)2(RCOO)2(H2O)2].H2O
(R = p-CH3(CH2)11OC6H4)
Its χMcorrT value, calculated from the values of its formula weight
(FW = 1405.4 g mol-1), mass susceptibility (χg = 6.78 x 10⁻⁶ cm3 g-1), molar
susceptibility (χm = 9.53 x 10⁻³ cm3 mol-1), diamagnetic correction factor
(χD = -7.03 x 10⁻⁴ cm3 mol-1) and corrected molar susceptibility
(χmcorr = 1.02 x 10⁻² cm3 mol-1), was 3.04 cm3 K mol-1 at 298 K. Accordingly, this
complex was made up of 50.7% HS and 49.3% LS Fe(II) atoms at this temperature.
[Fe2(μ-H2O)(μ-RCOO)2)(RCOO)2(H2O)2].H2O (R = p-CH3(CH2)11OC6H4) reacted
with bpy to form a brownish red solid (yield = 74%). The results of the elemental
analyses (C, 70.0%; H, 8.0%; N, 2.3%) were in good agreement for
[Fe2(μ-RCOO)2(RCOO)2(bpy)] (15) (C, 69.3%; H, 8.4%; N, 1.9%; FW =
1489.5 g mol-1).
Its FTIR data (Table 4.18; Figure 4.128) show the presence of the expected
functional groups and bonds. Hence, the Δνcoo values were 109 cm-1 and 161 cm-1,
Univers
ity of
Mala
ya

177
indicating chelating and bridging bidentate p-CH3(CH2)11OC6H4COO- ligands,
respectively.
Figure 4.128 FTIR spectrum of 15
Its UV-vis spectrum (Figure 4.129) in CHCl3 shows a d-d band appearing as a
shoulder on the strong CT band at 511 nm (ε = 340 M-1 cm-1). The d-d peak was
assigned to the electronic transition for a LS Fe(II) atom, as explained above.
Univers
ity of
Mala
ya

178
Figure 4.129 UV-vis spectrum of 15
Its χMcorrT value, calculated from the values of its formula weight
(FW; 1489.54 g mol-1), mass susceptibility (χg; 2.22 x 10⁻⁶ cm3 g-1), molar susceptibility
(χm; 3.30 x 10⁻³ cm3 mol-1), diamagnetic correction factor (χD; -7.45 x 10⁻⁴ cm3 mol-1)
and corrected molar susceptibility (χmcorr; 4.05 x 10⁻³ cm3 mol-1), was 1.21 cm3 K mol-1
at 298 K. Accordingly, 15 was made up of 20.2% HS and 79.8% LS Fe(II) atoms at this
temperature.
(b) Thermal and mesomorphic studies
TG trace for 15 (Figure 4.130) shows a total weight loss of 93.2% in the temperature
range 172 oC to 492 oC due to decomposition of p-CH3(CH2)11OC6H4COO- and bpy
ligands (calculated, 92.5%). The results are in good agreement with its proposed
structural formula. The amount of residue at temperatures above 492 oC was 6.8%
(calculated, 7.5% assuming pure Fe). Hence, its decomposition temperature was 172 oC.
Univers
ity of
Mala
ya
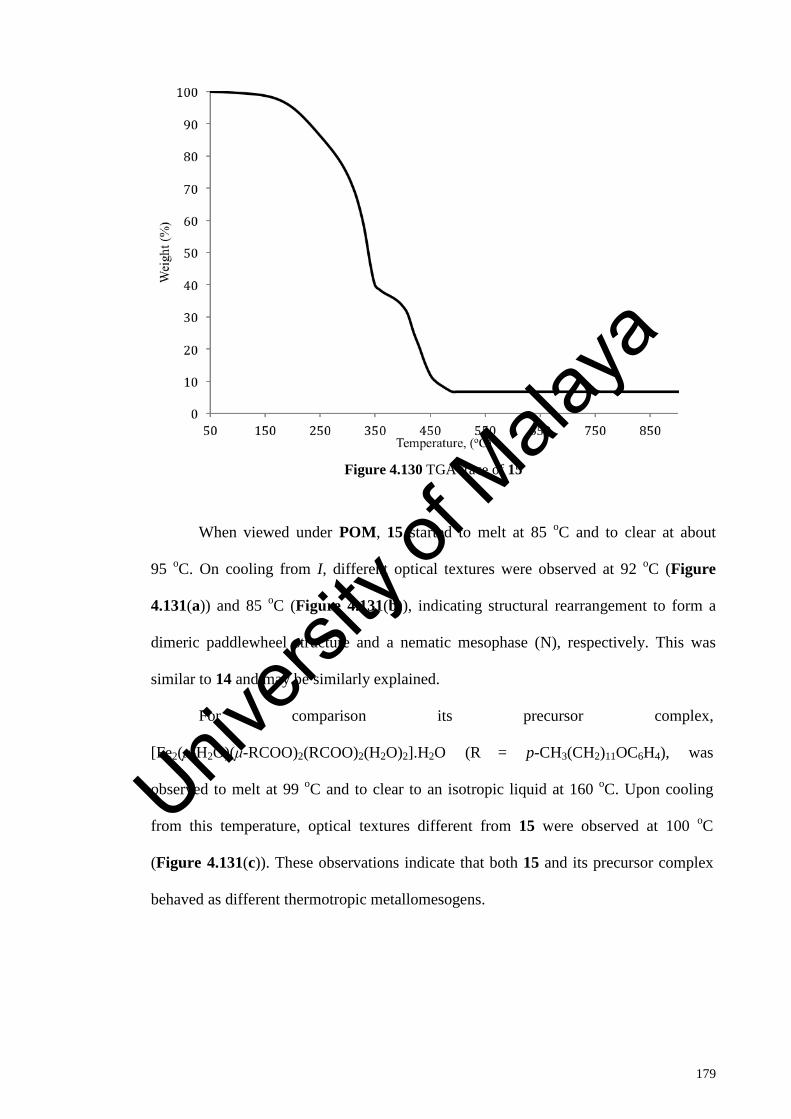
179
Figure 4.130 TGA trace of 15
When viewed under POM, 15 started to melt at 85 oC and to clear at about
95 oC. On cooling from I, different optical textures were observed at 92 oC (Figure
4.131(a)) and 85 oC (Figure 4.131(b)), indicating structural rearrangement to form a
dimeric paddlewheel structure and a nematic mesophase (N), respectively. This was
similar to 14 and may be similarly explained.
For comparison its precursor complex,
[Fe2(μ-H2O)(μ-RCOO)2(RCOO)2(H2O)2].H2O (R = p-CH3(CH2)11OC6H4), was
observed to melt at 99 oC and to clear to an isotropic liquid at 160 oC. Upon cooling
from this temperature, optical textures different from 15 were observed at 100 oC
(Figure 4.131(c)). These observations indicate that both 15 and its precursor complex
behaved as different thermotropic metallomesogens.
Univers
ity of
Mala
ya

180
(a) (b) (c)
Figure 4.131 Photomicrographs of: (a) 15 on cooling at 92 oC; (b) 15 on cooling at 85 oC; and
(c) [Fe2(μ-H2O)(μ-RCOO)2(RCOO)2(H2O)2].H2O (R = p-CH3(CH2)11OC6H4) on cooling at
100 oC
The DSC traces for 15 (Figure 4.132) shows two endothermic peaks at 76 oC
(∆H = +13 kJ mol-1) assigned to Cr2-M transition, and at 86 oC (∆H = +17 kJ mol-1)
assigned to M-I transition. On cooling, a weak exothermic peak at 101 oC
(∆H = -4 kJ mol-1) and two endothermic peaks at 82 oC (∆H = -32 kJ mol-1) and at 66 oC
(∆H = -21 kJ mol-1) assigned to I-M1, M1-M2 and M2-Cr transitions, respectively.
Figure 4.132 DSC scans of 15
Univers
ity of
Mala
ya

181
4.4.3 [Fe(p-CH3(CH2)13OC6H4COO)2(bpy)] (16)
(a) Synthesis and structural elucidation
The precursor complex, [Fe2(μ-H2O)(μ-RCOO)2(RCOO)2(H2O)2]
(R = p-CH3(CH2)13OC6H4COO), was obtained as a brown powder in good yield (55%)
from the reaction of p-CH3(CH2)13OC6H4COOK with [FeSO4.7H2O]. The results of its
elemental analyses (C, 66.6%; H, 9.6%) were in good agreement with the calculated
values (C, 67.3%; H, 9.3%; FW 1499.6 g mol-1). Its FTIR data (Table 4.18; Figure
4.133) shows the presence of the expected functional groups. Hence, the Δνcoo values
were 126 cm-1 and 164 cm-1 indicating that p-CH3(CH2)13OC6H4COO- was coordinated
as a chelating and bridging bidentate ligands, respectively (the Δνcoo value for
p-CH3(CH2)13OC6H4COO- ion was 149 cm-1).
Figure 4.133 FTIR spectrum of [Fe2(μ-H2O)(μ-RCOO)2(RCOO)2(H2O)2]
(R = p-CH3(CH2)13OC6H4COO)
Its UV-vis spectrum (Figure 4.134) in CHCl3 shows a d-d band appearing as a
shoulder on the strong CT band at 493 nm (ε = 751 M-1 cm-1). The d-d peak was
assigned to the electronic transition for a LS Fe(II) atom, as explained above.
Univers
ity of
Mala
ya
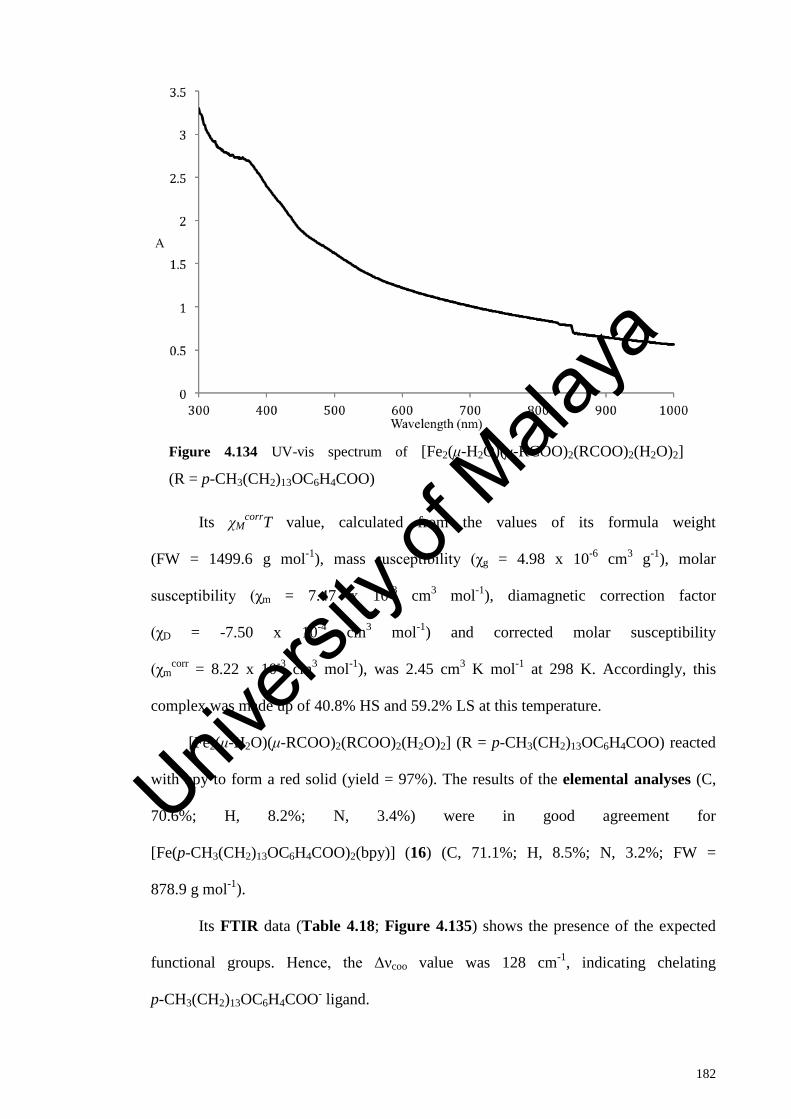
182
Figure 4.134 UV-vis spectrum of [Fe2(μ-H2O)(μ-RCOO)2(RCOO)2(H2O)2]
(R = p-CH3(CH2)13OC6H4COO)
Its χMcorrT value, calculated from the values of its formula weight
(FW = 1499.6 g mol-1), mass susceptibility (χg = 4.98 x 10⁻⁶ cm3 g-1), molar
susceptibility (χm = 7.47 x 10⁻³ cm3 mol-1), diamagnetic correction factor
(χD = -7.50 x 10⁻⁴ cm3 mol-1) and corrected molar susceptibility
(χmcorr = 8.22 x 10⁻³ cm3 mol-1), was 2.45 cm3 K mol-1 at 298 K. Accordingly, this
complex was made up of 40.8% HS and 59.2% LS at this temperature.
[Fe2(μ-H2O)(μ-RCOO)2(RCOO)2(H2O)2] (R = p-CH3(CH2)13OC6H4COO) reacted
with bpy to form a red solid (yield = 97%). The results of the elemental analyses (C,
70.6%; H, 8.2%; N, 3.4%) were in good agreement for
[Fe(p-CH3(CH2)13OC6H4COO)2(bpy)] (16) (C, 71.1%; H, 8.5%; N, 3.2%; FW =
878.9 g mol-1).
Its FTIR data (Table 4.18; Figure 4.135) shows the presence of the expected
functional groups. Hence, the Δνcoo value was 128 cm-1, indicating chelating
p-CH3(CH2)13OC6H4COO- ligand.
Univers
ity of
Mala
ya
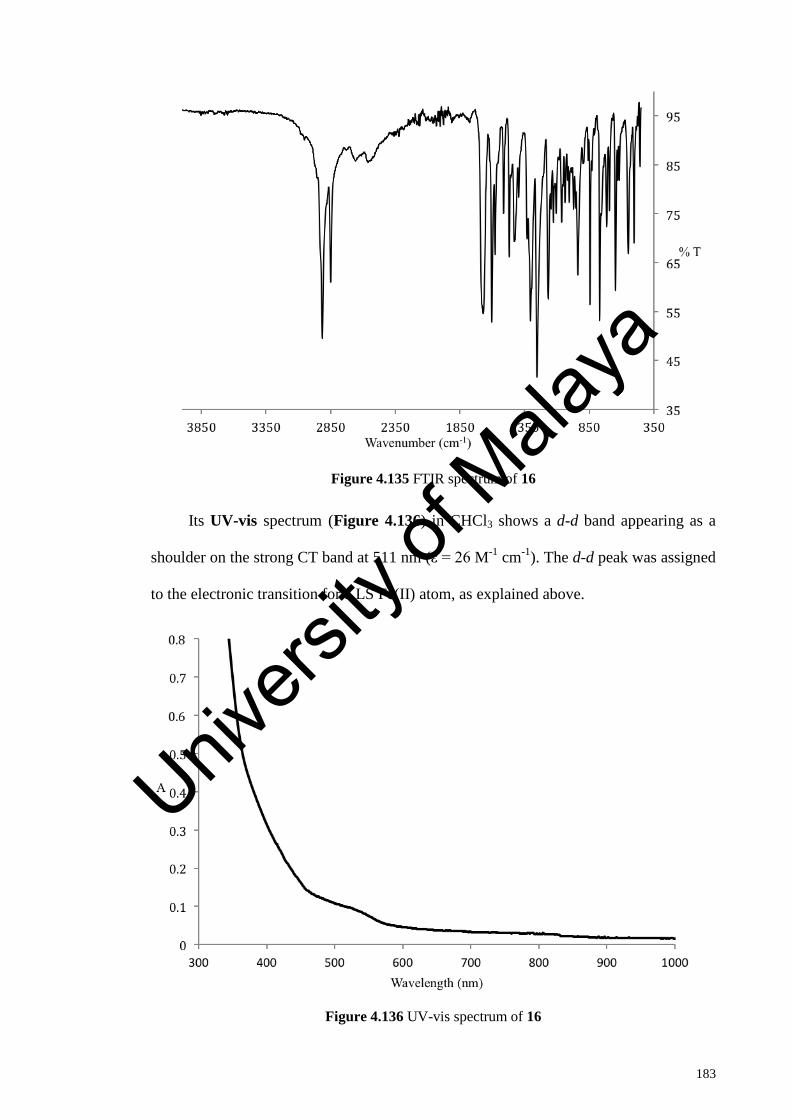
183
Figure 4.135 FTIR spectrum of 16
Its UV-vis spectrum (Figure 4.136) in CHCl3 shows a d-d band appearing as a
shoulder on the strong CT band at 511 nm (ε = 26 M-1 cm-1). The d-d peak was assigned
to the electronic transition for a LS Fe(II) atom, as explained above.
Figure 4.136 UV-vis spectrum of 16
Univers
ity of
Mala
ya

184
Its mass susceptibility was 0. Hence, 16 was diamagnetic (made up of 100% LS
Fe(II) atoms).
(b) Thermal and mesomorphic studies
TG trace for 16 (Figure 4.137) shows a total weight loss of 91.9% in the temperature
range 161 oC to 469 oC due to decomposition of p-CH3(CH2)13OC6H4COO- and bpy
ligands (calculated, 93.6%). The results are in good agreement with its proposed
structural formula. The amount of residue at temperatures above 469 oC was 8.1%
(calculated, 8.2% assuming FeO). Hence, its decomposition temperature was 161 oC.
Figure 4.137 TGA trace of 16
When viewed under POM, 16 started to melt at 86 oC and to clear at about
110 oC. On cooling from I, different optical textures were observed at 100 oC
(Figure 4.138(a)), and 92 oC (Figure 4.138(b)), indicating formation of nematic
globule mesophase (N). This was similarly explained as above.
In comparison, its precursor complex, [Fe2(μ-H2O)(μ-RCOO)2(RCOO)2(H2O)2]
(R = p-CH3(CH2)13OC6H4COO) was observed to melt at 102 oC and to clear to an
Univers
ity of
Mala
ya
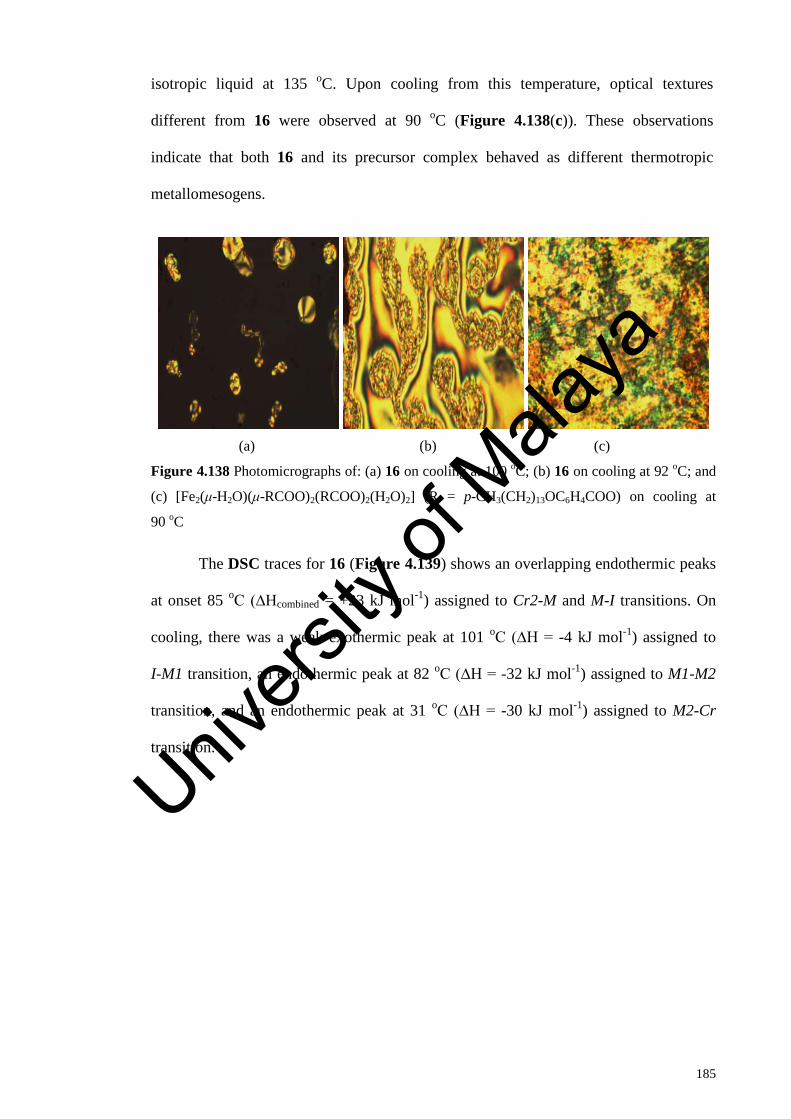
185
isotropic liquid at 135 oC. Upon cooling from this temperature, optical textures
different from 16 were observed at 90 oC (Figure 4.138(c)). These observations
indicate that both 16 and its precursor complex behaved as different thermotropic
metallomesogens.
(a) (b) (c)
Figure 4.138 Photomicrographs of: (a) 16 on cooling at 100 oC; (b) 16 on cooling at 92 oC; and
(c) [Fe2(μ-H2O)(μ-RCOO)2(RCOO)2(H2O)2] (R = p-CH3(CH2)13OC6H4COO) on cooling at
90 oC
The DSC traces for 16 (Figure 4.139) shows an overlapping endothermic peaks
at onset 85 oC (∆Hcombined = +23 kJ mol-1) assigned to Cr2-M and M-I transitions. On
cooling, there was a weak exothermic peak at 101 oC (∆H = -4 kJ mol-1) assigned to
I-M1 transition, an endothermic peak at 82 oC (∆H = -32 kJ mol-1) assigned to M1-M2
transition, and an endothermic peak at 31 oC (∆H = -30 kJ mol-1) assigned to M2-Cr
transition.
Univers
ity of
Mala
ya

186
Figure 4.139 DSC scans of 16
4.4.4 [Fe(p-CH3(CH2)15OC6H4COO)2(bpy)] (17)
(a) Synthesis and structural elucidation
The precursor complex, [Fe2(μ-H2O)(μ-RCOO)2(RCOO)2(H2O)2]
(R = p-CH3(CH2)15OC6H4), was obtained as a brown powder with 42% yield from the
reaction of p-CH3(CH2)15OC6H4COOK with FeSO4.7H2O. The results of its elemental
analyses (C, 68.9%; H, 9.4%) were in good agreement with the calculated values
(C, 68.6%; H, 9.6%; FW 1611.8 g mol-1). Its FTIR data (Table 4.18; Figure 4.140)
shows the presence of the expected functional groups. Hence, the Δνcoo values were
122 cm-1 and 165 cm-1, indicating that p-CH3(CH2)15OC6H4COO- ion was coordinated
as a chelating and bridging bidentate ligands, respectively (the Δνcoo value for
p-CH3(CH2)15OC6H4COO- ion was 148 cm-1).
Univers
ity of
Mala
ya

187
Figure 4.140 FTIR spectrum of [Fe2(μ-H2O)(μ-RCOO)2(RCOO)2(H2O)2]
(R = p-CH3(CH2)15OC6H4)
Its UV-vis spectrum (Figure 4.141) in CHCl3 shows a d-d band appearing as a
shoulder on the strong CT band at 594 nm (ε = 751 M-1 cm-1). The d-d peak was
assigned to the electronic transition for a LS Fe(II) atom, as explained above.
Univers
ity of
Mala
ya
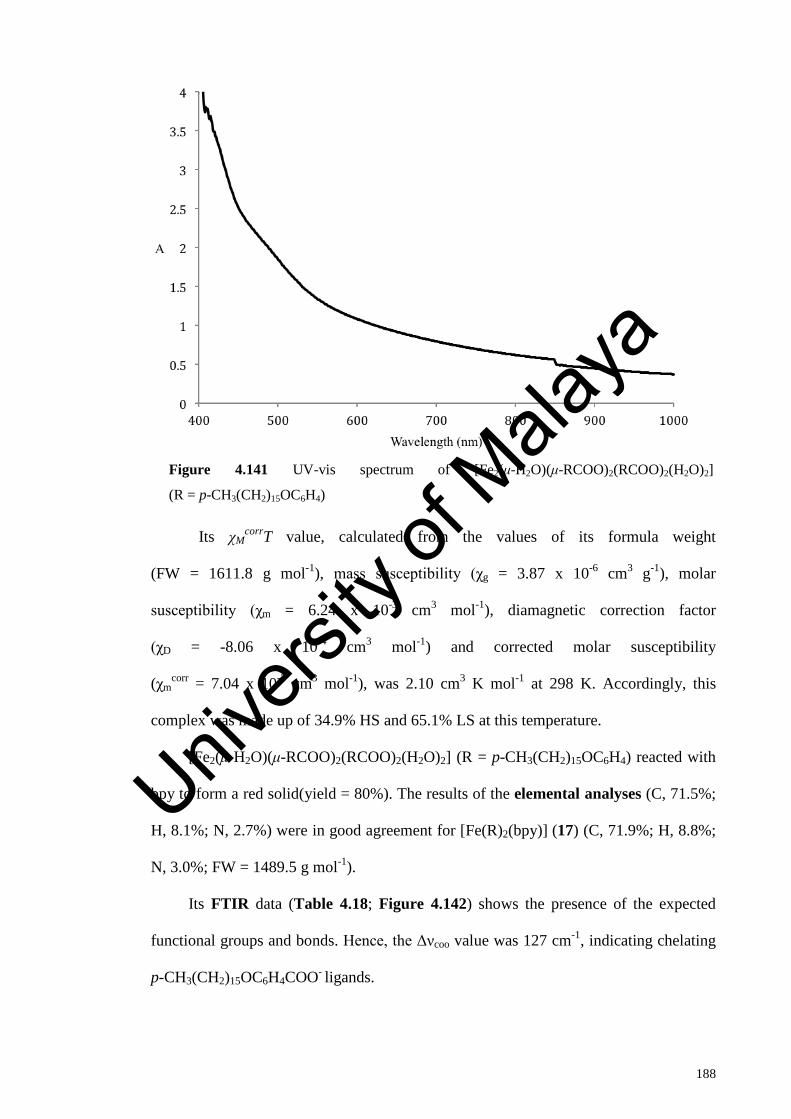
188
Figure 4.141 UV-vis spectrum of [Fe2(μ-H2O)(μ-RCOO)2(RCOO)2(H2O)2]
(R = p-CH3(CH2)15OC6H4)
Its χMcorrT value, calculated from the values of its formula weight
(FW = 1611.8 g mol-1), mass susceptibility (χg = 3.87 x 10⁻⁶ cm3 g-1), molar
susceptibility (χm = 6.24 x 10⁻³ cm3 mol-1), diamagnetic correction factor
(χD = -8.06 x 10⁻⁴ cm3 mol-1) and corrected molar susceptibility
(χmcorr = 7.04 x 10⁻³ cm3 mol-1), was 2.10 cm3 K mol-1 at 298 K. Accordingly, this
complex was made up of 34.9% HS and 65.1% LS at this temperature.
[Fe2(μ-H2O)(μ-RCOO)2(RCOO)2(H2O)2] (R = p-CH3(CH2)15OC6H4) reacted with
bpy to form a red solid(yield = 80%). The results of the elemental analyses (C, 71.5%;
H, 8.1%; N, 2.7%) were in good agreement for [Fe(R)2(bpy)] (17) (C, 71.9%; H, 8.8%;
N, 3.0%; FW = 1489.5 g mol-1).
Its FTIR data (Table 4.18; Figure 4.142) shows the presence of the expected
functional groups and bonds. Hence, the Δνcoo value was 127 cm-1, indicating chelating
p-CH3(CH2)15OC6H4COO- ligands.
Univers
ity of
Mala
ya

189
Figure 4.142 FTIR spectrum of 17
Its UV-vis spectrum (Figure 4.143) in CHCl3 shows a d-d band appearing as a
shoulder on the strong CT band at 422 nm (ε = 255 M-1 cm-1). The d-d peak was
assigned to the electronic transition for a LS Fe(II) atom, as explained above.
Figure 4.143 UV-vis spectrum of 17
Univers
ity of
Mala
ya
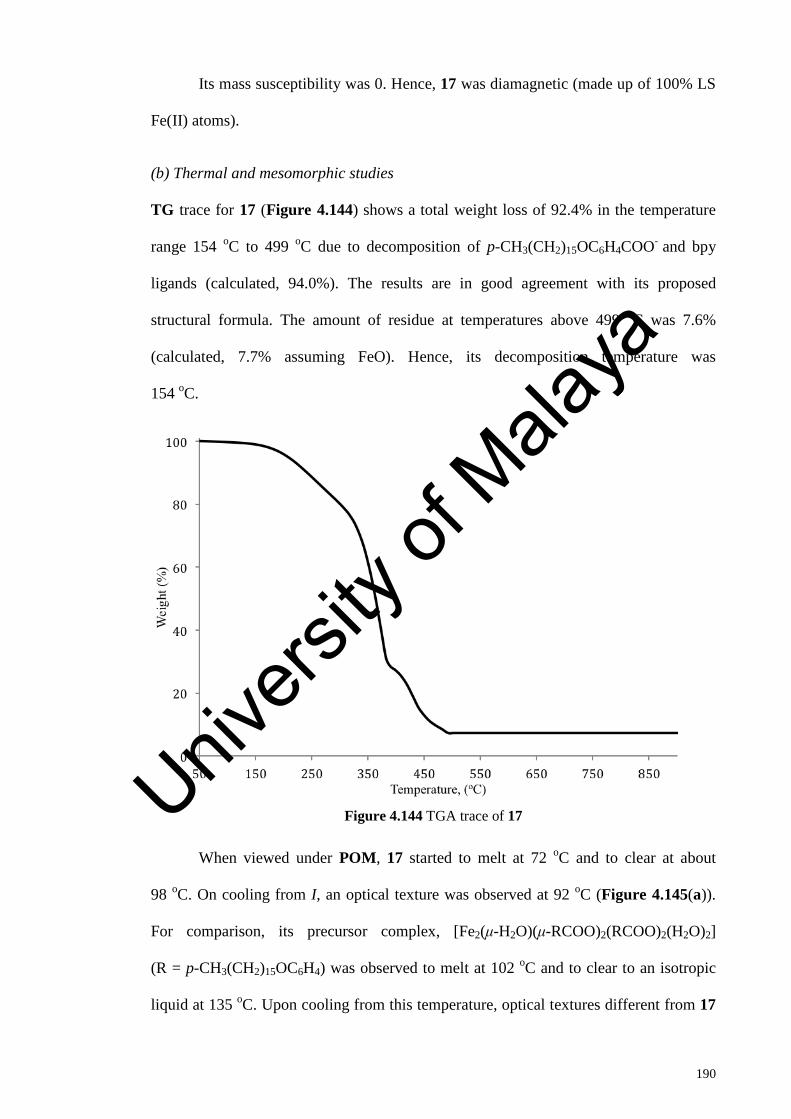
190
Its mass susceptibility was 0. Hence, 17 was diamagnetic (made up of 100% LS
Fe(II) atoms).
(b) Thermal and mesomorphic studies
TG trace for 17 (Figure 4.144) shows a total weight loss of 92.4% in the temperature
range 154 oC to 499 oC due to decomposition of p-CH3(CH2)15OC6H4COO- and bpy
ligands (calculated, 94.0%). The results are in good agreement with its proposed
structural formula. The amount of residue at temperatures above 499 oC was 7.6%
(calculated, 7.7% assuming FeO). Hence, its decomposition temperature was
154 oC.
Figure 4.144 TGA trace of 17
When viewed under POM, 17 started to melt at 72 oC and to clear at about
98 oC. On cooling from I, an optical texture was observed at 92 oC (Figure 4.145(a)).
For comparison, its precursor complex, [Fe2(μ-H2O)(μ-RCOO)2(RCOO)2(H2O)2]
(R = p-CH3(CH2)15OC6H4) was observed to melt at 102 oC and to clear to an isotropic
liquid at 135 oC. Upon cooling from this temperature, optical textures different from 17
Univers
ity of
Mala
ya
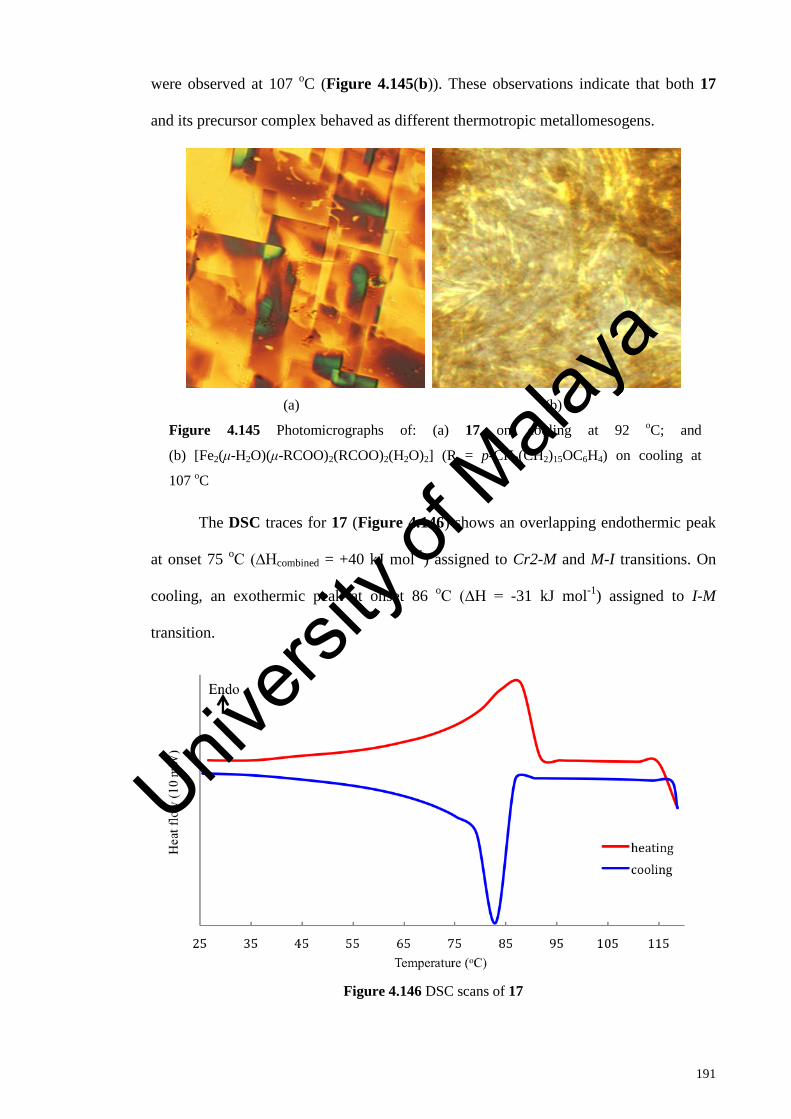
191
were observed at 107 oC (Figure 4.145(b)). These observations indicate that both 17
and its precursor complex behaved as different thermotropic metallomesogens.
(a) (b)
Figure 4.145 Photomicrographs of: (a) 17 on cooling at 92 oC; and
(b) [Fe2(μ-H2O)(μ-RCOO)2(RCOO)2(H2O)2] (R = p-CH3(CH2)15OC6H4) on cooling at
107 oC
The DSC traces for 17 (Figure 4.146) shows an overlapping endothermic peak
at onset 75 oC (∆Hcombined = +40 kJ mol-1) assigned to Cr2-M and M-I transitions. On
cooling, an exothermic peak at onset 86 oC (∆H = -31 kJ mol-1) assigned to I-M
transition.
Figure 4.146 DSC scans of 17
Univers
ity of
Mala
ya
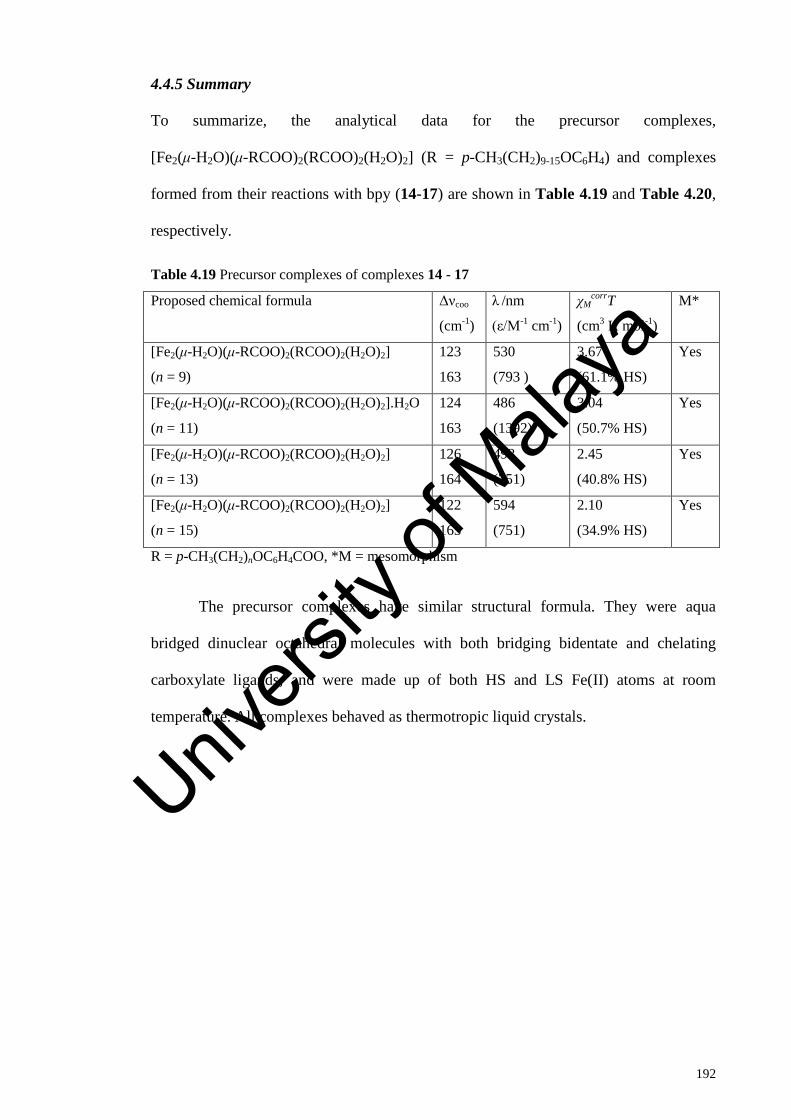
192
4.4.5 Summary
To summarize, the analytical data for the precursor complexes,
[Fe2(μ-H2O)(μ-RCOO)2(RCOO)2(H2O)2] (R = p-CH3(CH2)9-15OC6H4) and complexes
formed from their reactions with bpy (14-17) are shown in Table 4.19 and Table 4.20,
respectively.
Table 4.19 Precursor complexes of complexes 14 - 17
Proposed chemical formula Δνcoo
(cm-1)
λ /nm
(ε/M-1 cm-1)
χMcorrT
(cm3 K mol-1)
M*
[Fe2(μ-H2O)(μ-RCOO)2(RCOO)2(H2O)2]
(n = 9)
123
163
530
(793 )
3.67
(61.1% HS)
Yes
[Fe2(μ-H2O)(μ-RCOO)2(RCOO)2(H2O)2].H2O
(n = 11)
124
163
486
(1392)
3.04
(50.7% HS)
Yes
[Fe2(μ-H2O)(μ-RCOO)2(RCOO)2(H2O)2]
(n = 13)
126
164
493
(751)
2.45
(40.8% HS)
Yes
[Fe2(μ-H2O)(μ-RCOO)2(RCOO)2(H2O)2]
(n = 15)
122
165
594
(751)
2.10
(34.9% HS)
Yes
R = p-CH3(CH2)nOC6H4COO, *M = mesomorphism
The precursor complexes have similar structural formula. They were aqua
bridged dinuclear octahedral molecules with both bridging bidentate and chelating
carboxylate ligands, and were made up of both HS and LS Fe(II) atoms at room
temperature. All complexes behaved as thermotropic liquid crystals.
Univers
ity of
Mala
ya

193
Table 4.20 Complexes 14 - 17
Proposed chemical formula Δνcoo
(cm-1)
λmax, nm
(ε, M-1 cm-1)
χMcorrT
(cm3 K mol-1)
Tdec
(oC)
M*
[Fe2(μ-RCOO)2(RCOO)2(bpy)]
(n = 9, 14; brownish red solid)
125
161
492
(154)
1.29
(21.5% HS)
169 Yes
[Fe2(μ-RCOO)2(RCOO)2(bpy)]
(n = 11, 15; brownish red solid)
146
161
511
(340)
1.21
(20.2% HS)
172 Yes
[Fe(RCOO)2(bpy)]
(n = 13, 16; red solid)
147 511
(26)
0
(100 % LS)
161 Yes
[Fe(RCOO)2(bpy)]
(n = 15, 17; red solid)
127 422
(255)
0
(100% LS)
154 Yes
R = p-CH3(CH2)nOC6H4COO, *M = mesomorphism
Complexes 14 and 15 were dinuclear involving bridging bpy, and bridging and
chelating carboxylate ligands, and have both HS and LS Fe(II) atoms at room
temperature. In contrast, complexes 16 and 17 were mononuclear involving chelating
bpy and carboxylate ligands, and have 100% LS Fe(II) atoms at room temperature
indicating stronger Fe-N and Fe-O bonds.
The complexes were thermally stable in the temperature range of 154 oC to
172 oC. Their decomposition temperatures decreased with increasing number of carbon
atoms in the alkyl chain, as similarly observed for Cu(II) complexes and may be
similarly explained.
All complexes behaved as thermotropic liquid crystals. On heating, it is
proposed that the bridging bpy ligands in 15 and 16 dissociated and the molecules
formed [Fe2(RCOO)4] with the paddle-wheel structure.
4.5 Molecular modelling
Molecular modelling was performed for copper(II) complexes in order to study the
magneto-structural correlation, and for iron(II) complexes to ascertain their proposed
structures by comparing their simulated FTIR spectra with the experimental spectra.
Univers
ity of
Mala
ya
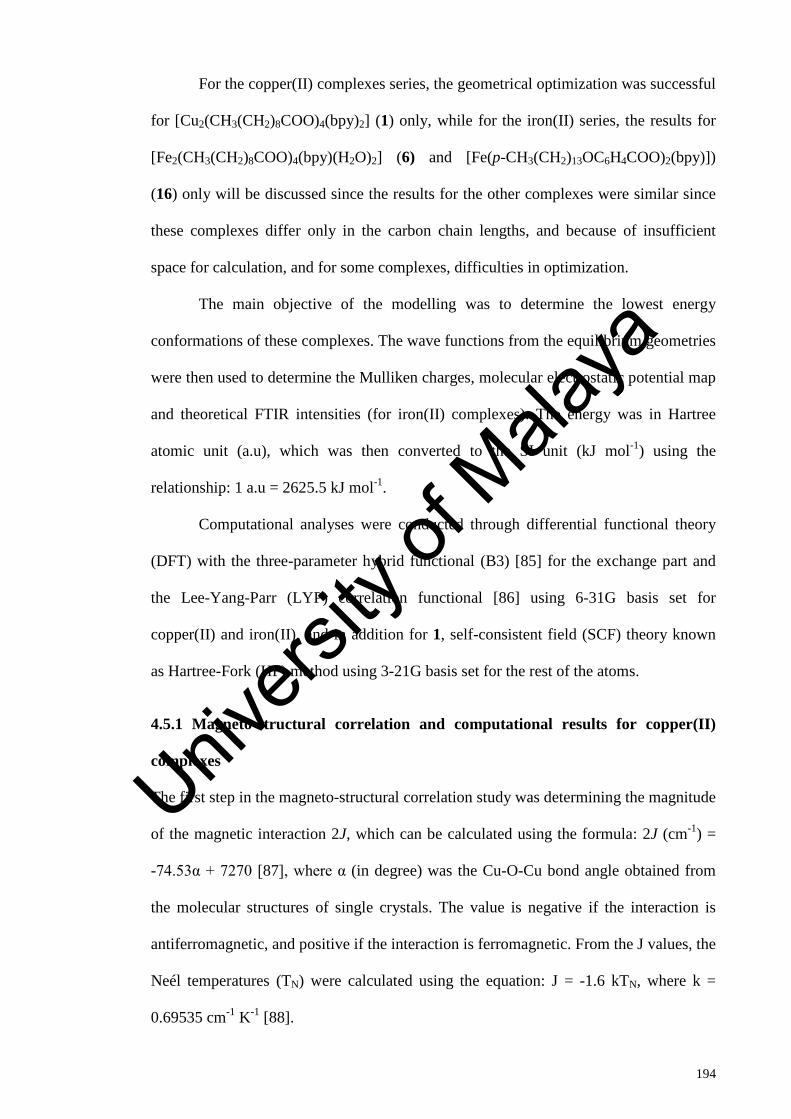
194
For the copper(II) complexes series, the geometrical optimization was successful
for [Cu2(CH3(CH2)8COO)4(bpy)2] (1) only, while for the iron(II) series, the results for
[Fe2(CH3(CH2)8COO)4(bpy)(H2O)2] (6) and [Fe(p-CH3(CH2)13OC6H4COO)2(bpy)])
(16) only will be discussed since the results for the other complexes were similar since
these complexes differ only in the carbon chain lengths, and because of insufficient
space for calculation, and for some complexes, difficulties in optimization.
The main objective of the modelling was to determine the lowest energy
conformations of these complexes. The wave functions from the equilibrium geometries
were then used to determine the Mulliken charges, molecular electrostatic potential map
and theoretical FTIR intensities (for iron(II) complexes). The energy was in Hartree
atomic unit (a.u), which was then converted to the SI unit (kJ mol-1) using the
relationship: 1 a.u = 2625.5 kJ mol-1.
Computational analyses were conducted through differential functional theory
(DFT) with the three-parameter hybrid functional (B3) [85] for the exchange part and
the Lee-Yang-Parr (LYP) correlation functional [86] using 6-31G basis set for
copper(II) and iron(II), and in addition for 1, self-consistent field (SCF) theory known
as Hartree-Fork (HF) method using 3-21G basis set for the rest of the atoms.
4.5.1 Magneto-structural correlation and computational results for copper(II)
complexes
The first step in the magneto-structural correlation study was determining the magnitude
of the magnetic interaction 2J, which can be calculated using the formula: 2J (cm-1) =
-74.53α + 7270 [87], where α (in degree) was the Cu-O-Cu bond angle obtained from
the molecular structures of single crystals. The value is negative if the interaction is
antiferromagnetic, and positive if the interaction is ferromagnetic. From the J values, the
Neél temperatures (TN) were calculated using the equation: J = -1.6 kTN, where k =
0.69535 cm-1 K-1 [88].
Univers
ity of
Mala
ya
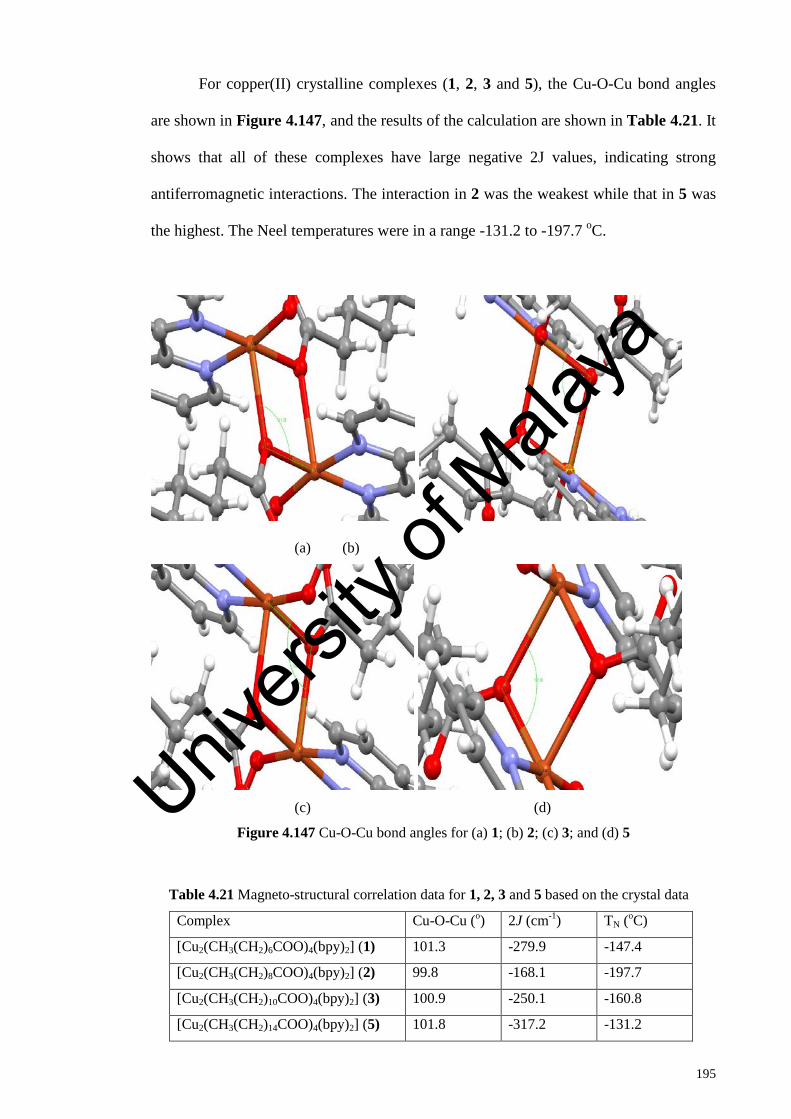
195
For copper(II) crystalline complexes (1, 2, 3 and 5), the Cu-O-Cu bond angles
are shown in Figure 4.147, and the results of the calculation are shown in Table 4.21. It
shows that all of these complexes have large negative 2J values, indicating strong
antiferromagnetic interactions. The interaction in 2 was the weakest while that in 5 was
the highest. The Neel temperatures were in a range -131.2 to -197.7 oC.
(a) (b)
(c) (d)
Figure 4.147 Cu-O-Cu bond angles for (a) 1; (b) 2; (c) 3; and (d) 5
Table 4.21 Magneto-structural correlation data for 1, 2, 3 and 5 based on the crystal data
Complex Cu-O-Cu (o) 2J (cm-1) TN (oC)
[Cu2(CH3(CH2)6COO)4(bpy)2] (1) 101.3 -279.9 -147.4
[Cu2(CH3(CH2)8COO)4(bpy)2] (2) 99.8 -168.1 -197.7
[Cu2(CH3(CH2)10COO)4(bpy)2] (3) 100.9 -250.1 -160.8
[Cu2(CH3(CH2)14COO)4(bpy)2] (5) 101.8 -317.2 -131.2
Univers
ity of
Mala
ya

196
The above results are in agreement with the relationship proposed by Baggio et
al. [29]. However, the experimental magnetic data (Section 4.2.6) showed that the
interaction between the two copper(II) atoms were ferromagnetic based on the
assumption that the geometry of copper(II) atoms was octahedral (g = 2).
Molecular modelling was then performed for all copper(II) complexes but was
only successful for 1. The minimized energy from the optimized structure of 1 (Figure
4.148), was -6127.99 a.u (-1.61 x 10⁷ kJ mol-1). Some selected geometrical parameters,
such as the predicted bond lengths and angles, were compared with the X-ray
diffraction data (Table 4.22). The theoretical and experimental data showed that the
bond lengths and angles were similar. Based on the theoretical Cu-O-Cu bond angles,
the 2J value was -220.3 cm-1 and TN was -174.2 oC, which were in good agreement with
the values calculated from the experimental data.
Figure 4.148 Optimised structure of 1
Univers
ity of
Mala
ya

197
Table 4.22 Comparison of bond lengths (Å) and angles (o) for 1
Theoretical Experimental
Bond length
Cu(1)-O(4) 1.999 1.930
Cu(1)-O(7) 1.950 1.968
Cu(1)-O(3) 2.389 2.381
Cu(1)-N(9) 1.963 2.006
Cu(1)-N(8) 1.980 2.048
Angle
O(4)-Cu-O(3) 78.36 78.70
O(4)-Cu-N(8) 102.43 103.60
O(3)-Cu-N(8) 174.13 173.60
O(4)-Cu-N(9) 93.44 93.60
O(3)-Cu-N(9) 94.77 95.50
N(8)-Cu-N(9) 80.71 80.20
O(4)-Cu-O(7) 90.65 91.40
O(3)-Cu-O(7) 90.59 90.35
N(8)-Cu-O(7) 173.83 172.50
N(9)-Cu-O(7) 95.15 95.64
4.6.2 Computational results and FTIR comparison for iron(II) complexes
All iron(II) complexes were not single crystals, and their structures were proposed
based on combined instrumental data.
The minimized energy from the optimized structure of 6 (Figure 4.149(a)) and
16 (Figure 4.149(b)) obtained using 6-31G basis set, were -5346.83 a.u
(-1.40 x 10⁷ kJ mol-1) and -3535.68 a.u (-9.29 x 10⁶ kJ mol-1), respectively. Univers
ity of
Mala
ya

198
(a)
(b)
Figure 4.149 Optimized structure of: (a) 6, and (b) 16
The calculated FTIR intensities were then compared to the experimental
intensities (Figure 4.150). The frequencies were scaled by a factor of 0.98 because of
the overestimates calculation by B3LYP method [66]. The main functional groups of
this complex were COO of the carboxylate ligand, C=C of the aromatic ring, C-N of
bpy, and CH2 of the alkyl chain. To achieve structural characterization, it is important to
determine the vibrations of these groups. The assignments of the peaks were tabulated
in Table 4.23, which shows good agreement between the theoretical and experimental
Univers
ity of
Mala
ya
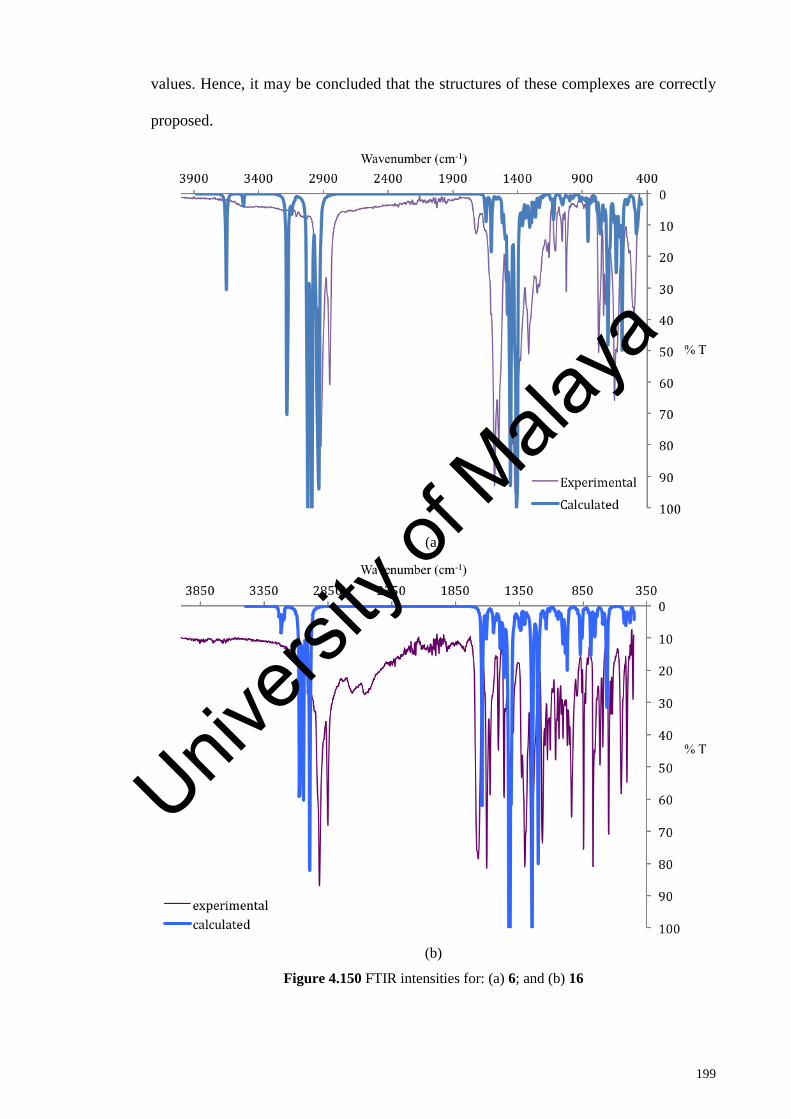
199
values. Hence, it may be concluded that the structures of these complexes are correctly
proposed.
(a)
(b)
Figure 4.150 FTIR intensities for: (a) 6; and (b) 16
Univers
ity of
Mala
ya

200
Table 4.23 Comparison of experimental and calculated data for FTIR peaks of 6 and 16
6 16
Functional group Theoretical Experimental Theoretical Experimental
CH2(asym) 2991, 2944 2923 2997 2916
CH2(sym) 2936 2854 2993 2851
COO(asym) 1507 1549 1608 1598
COO(sym) 1445 1442/1411 1434 1470
C=C 1606 1580 1643 1606
C-N 1296 1318 1307 1307
Univers
ity of
Mala
ya
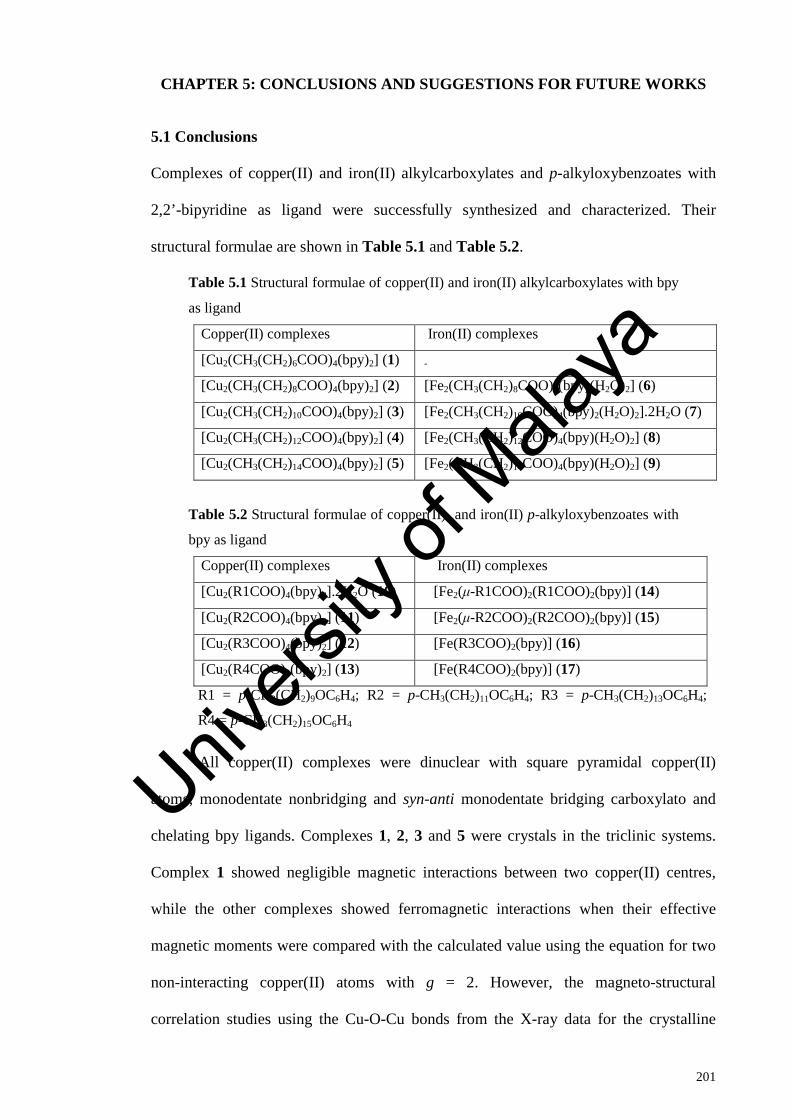
201
CHAPTER 5: CONCLUSIONS AND SUGGESTIONS FOR FUTURE WORKS
5.1 Conclusions
Complexes of copper(II) and iron(II) alkylcarboxylates and p-alkyloxybenzoates with
2,2’-bipyridine as ligand were successfully synthesized and characterized. Their
structural formulae are shown in Table 5.1 and Table 5.2.
Table 5.1 Structural formulae of copper(II) and iron(II) alkylcarboxylates with bpy
as ligand
Copper(II) complexes Iron(II) complexes
[Cu2(CH3(CH2)6COO)4(bpy)2] (1) -
[Cu2(CH3(CH2)8COO)4(bpy)2] (2) [Fe2(CH3(CH2)8COO)4(bpy)(H2O)2] (6)
[Cu2(CH3(CH2)10COO)4(bpy)2] (3) [Fe2(CH3(CH2)10COO)4(bpy)2(H2O)2].2H2O (7)
[Cu2(CH3(CH2)12COO)4(bpy)2] (4) [Fe2(CH3(CH2)12COO)4(bpy)(H2O)2] (8)
[Cu2(CH3(CH2)14COO)4(bpy)2] (5) [Fe2(CH3(CH2)14COO)4(bpy)(H2O)2] (9)
Table 5.2 Structural formulae of copper(II) and iron(II) p-alkyloxybenzoates with
bpy as ligand
Copper(II) complexes Iron(II) complexes
[Cu2(R1COO)4(bpy)2].2H2O (10) [Fe2(μ-R1COO)2(R1COO)2(bpy)] (14)
[Cu2(R2COO)4(bpy)2] (11) [Fe2(μ-R2COO)2(R2COO)2(bpy)] (15)
[Cu2(R3COO)4(bpy)2] (12) [Fe(R3COO)2(bpy)] (16)
[Cu2(R4COO)4(bpy)2] (13) [Fe(R4COO)2(bpy)] (17)
R1 = p-CH3(CH2)9OC6H4; R2 = p-CH3(CH2)11OC6H4; R3 = p-CH3(CH2)13OC6H4;
R4 = p-CH3(CH2)15OC6H4
All copper(II) complexes were dinuclear with square pyramidal copper(II)
atoms, monodentate nonbridging and syn-anti monodentate bridging carboxylato and
chelating bpy ligands. Complexes 1, 2, 3 and 5 were crystals in the triclinic systems.
Complex 1 showed negligible magnetic interactions between two copper(II) centres,
while the other complexes showed ferromagnetic interactions when their effective
magnetic moments were compared with the calculated value using the equation for two
non-interacting copper(II) atoms with g = 2. However, the magneto-structural
correlation studies using the Cu-O-Cu bonds from the X-ray data for the crystalline
Univers
ity of
Mala
ya

202
complexes and the calculated 2J values showed strong antiferromagnetic interactions
between the two copper(II) atoms. The latter results was supported by the results of
molecular modeling for 1, which showed good agreement between the experimental and
calculated structures. Their decomposition temperatures were in the range of
161 – 240 oC, and in general, showed a gradually decreasing trend with increasing
number of carbon atoms in the alkyl(oxy) chains. Complexes 1 – 5, 10 and 11 behaved
as thermotropic liquid crystals, while 12 and 13 were not mesomorphic.
All iron(II) complexes with alkylcarboxylato were dinuclear with chelating
carboxylato and bridging bpy ligands. On the other hand, complexes with
p-alkyloxybenzoato ligands were dinuclear involving bridging and chelating
carboxylato and bridging bpy ligands for 14 and 15, and mononuclear involving
chelating carboxylato and bpy ligands 16 and 17. Molecular modelling performed for 6
and 16 showed good agreement between the experimental and simulated FTIR spectra,
supporting the proposed structure formulae for these complexes. All dinuclear
complexes were made up of both HS and LS iron(II) atoms at room temperature with
higher percentage of LS iron(II) atoms, while all mononuclear complexes have 100%
LS iron(II) atoms at room temperature. The complexes were thermally stable in the
temperature range of 121 oC to 172 oC. Their decomposition temperatures decreased
with increasing number of carbon atoms in the alkyl chain, as similarly observed for
copper(II) complexes. All complexes with the alkylcarboxylato ligands have higher
percentages of HS Fe(II) on heating, due to dissociation of [Fe2(R)4(bpy)(H2O)2] to
[Fe(R)2(bpy)] and [Fe(R)2(H2O)2]. Complexes 6, 8 and 9 were not mesomorphic while
all other complexes behaved as thermotropic liquid crystals. On heating, it is proposed
that the bridging bpy ligands in 14 and 15 dissociated and the molecules formed
[Fe2(RCOO)4] with the paddle-wheel structure.
Univers
ity of
Mala
ya
203
5.2 Suggestions for Future Works
Variable-temperature small and wide angles X-ray scattering (SWAXS) experiments for
the mesomorphic complexes are needed to confirm their mesophases.
In designing novel functional metallomesogens with more challenging
requirements and for high-technology applications, combination of spin crossover and
liquid crystalline behavior may lead to a number of advantages. For example,
convenient processing SCO materials in the form of thin films, enhancement of spin
transition signals, switching and sensing in different temperature regimes, or
achievement of photo- and thermochromism in Fe(II) containing liquid crystals [89-94].
Hence, to gain further insight about the SCO, Superconducting Quantum Intefering
Device (SQUID) is an important tool to use as it measures the molar magnetic
susceptibility as a function of temperature. From the SQUID data, important data, such
as the SCO temperature (T½) and thermal hysteresis (ΔT) can be determined for the
iron(II) complexes.
The SCO studies may also be extended to complexes of manganese(II) (valence
electronic configuration d5) and cobalt(II) (valence electronic configuration d7).
Other potential uses of the copper(II) complexes, such as in medical
applications, and of the iron(II) complexes, such as in dye-sensitised solar cells [95-97]
and thermoelectricity, which converts heat energy directly to electricity [62,98], may be
explored.
Finally, this research may be extended for complexes with carboxylato ligands
with odd number of carbon atoms and branched chains, and with alkyl(oxy) substituted
2,2’-bipyridine in order to reduce their melting temperatures, and hence minimised
decomposition and structural changes on heating.
Univers
ity of
Mala
ya
204
REFERENCES
[1] Marcos. M., Romero, P.; Serrano, J. L. (1985) Journal of Chemical Society, Chemical Communications, 1641
[2] Barberá, J.; Levelut, A. M.; Marcos, M.; Romero, P.; Serrano, J. L. (1991) Liquid Crystals, 10, 119-126
[3] Valko, M., Mazur, M., Morris, H., Klement, R., Williams, C. J., Melnik, M. (2000) Journal of Coordination Chemistry, 52, 129-138
[4] Hamza, F., Kickelbick, G. (2009) Macromolecules, 42, 7762-7771
[5] Moncol, J., Vaskova, Z., Stachova, P., Svorec, J., Silanpaa, R., Mazur, M., Valigura, D. (2010) Journal of Chemical Crystallography, 40(2), 179-184
[6] Yu, Y. –H, Ren, C.Y., Hou, G. –F., Ye, H., Gao, J. –S. (2012) Journal of Coordination Chemistry, 65, 4137-4146
[7] Doyle, A., Felcman, J., Gambardella, M. T. P., Verani, C. N., Tristao, M. L. B. (2000) Polyhedron, 19, 2621-2627
[8] Kozlevcar, B., Leban, I., Petric, M., Petricek, S., Roubeau, O., Reedjik, J., Segedin, P. (2004) Inorganica Chimica Acta, 357, 4220-4230
[9] Agterberg, F. P. W., Provokluit, H. A. J., Driessen, W. L., Reedjik, J., Oevering, H., Buijis, W., Veldman, N., Lakin, M. T., Spek, A. L. (1998) Inorganica Chimica Acta, 267(2), 183-192
[10] Iqbal, M., Ahmad, I., Ali, S., Muhammad, N., Ahmed, S., Sohail, M. (2013) Polyhedron, 50(1), 524-531
[11] Wein, A. N., Cordeiro, R., Owens, N., Olivier, H., Hardcastle, K. I., Eichler, J. F. (2009) Journal of Flourine Chemistry, 130(2), 197-203
[12] Cabaniss, S. E., McVey, I. F. (1995) Spectrochimica Acta Part A: Molecular and Biomolecular Spectroscopy, 51(13), 2385-2395
Univers
ity of
Mala
ya

205
[13] Rodil, S. E., Ferrari, A. C., Robertson, J., Muhl, S. (2002) Thin Solid Films, 420, 122-131
[14] Joobeom Seo, S. –T. M., Kim, J., Lee, S. S., Park, K. –M. (2003) Bulletin of Korean Chemical Society, 24, 1393-1395
[15] Chen, Y., Zhang, Y. –H., Zhao, L. –J. (2004) Physical Chemistry Chemical Physics, 6, 537-542
[16] Mithun, R. A. K. P., Mukherjee, A., Munirathinam, N., Akhil, R. C. (2007) Indian Journal of Chemistry, 46A, 227-237
[17] Gómez-Saiz, P., Garcia-Tojal, J., Maestro, M. A., Mahia, J., Arnaiz, F. J., Rojo, T. (2002) Polyhedron, 21(22), 2257-2263
[18] Vafazadeh, R., Hayeri, V., Willis, A. C. (2010) Polyhedron, 29(7), 1810-1814
[19] Wang, Y. Y., Shi, Q. Z., Gao, Y. C., Huo, X. (2000) Polyhedron, 19(8), 891-898
[20] Bharati, K. S., Sreedaran, S., Rahiman, A. K., Rajesh, K., Narayanan, V. (2007) Polyhedron, 26, 3993-4002
[21] Pajtasova, M., Ondrusova, D., Jona, E., Mojumdar, S. C., L’Alikova, S., Bazylakova, T., Gregor, M. (2010) Journal of Thermal Analysis and Calorimetry, 100, 769-777
[22] Kahn, O. (1993) Molecular Magnetism, VCH Publisher, Inc., USA
[23] Shriver, D. F., Atkins, P. W., Inorganic Chemistry, Oxford University Press 4rd ed., p600
[24] Kato, M., Jonassen, H. B., Fanning J. C. (1964) Chemical Reviews, 64, 99-128
[25] Youngme, S., Cheansirisomboon, A., Danviturai, C., Pakawatchai, C., Chaichit, N., Engkagul C., Van Albada, G. A., Costa, J. S., Reedjik, J., (2008) Polyhedron, 27(7), 1875-1882
[26] Melnik, M. (1982) Coordination Chemistry Reviews, 42, 259-293
Univers
ity of
Mala
ya

206
[27] Rodríguez-Fortea, A., Alemany, P., Alvarez, S., Ruiz, E. (2001) European Journal of Chemistry, 7(3), 627-637
[28] Crawford, V. H., Richardson, H. W., Wasson, J. R., Hodgson, J., Hatfield, W. E. (1976) Inorganic Chemistry, 15(9), 2107-2110
[29] Baggio, R., Garland, M. T., Manzur, J., Peña, O., perec, M., Spodine, E., Vega, A. (1999) Inorganica Chimica Acta, 286(1), 74-79
[30] Abdullah, N., Al-Hakem, Y., Abdullah, N., Samsudin, H., Ahmad Tajidi, N. S. (2014) Asian Journal of Chemistry, 26(4), 987-990
[31] Castro, M. A., Rusjan, M., Vega, D., Peña, O., Weyhermüller, T., Cukiernik, F. D., Slep, L. D. (2011) Inorganica Chimica Acta, 374, 499-505
[32] Mohamaddin., M. I., Abdullah, N. (2010) Central European Journal of Chemistry, 8, 1090
[33] Santos-Martell, R. G., Ceniceros-Olguin, A., Larius-Lopez, L., Rodriguez-Gonzales, R. J., Navarro-Rodriguez, D., Donnio, B., Guillon, D. (2009) Liquid Crystals, 36(8),787-797
[34] Serrano, J. L. (2008) Metallomesogen: Synthesis, Properties, Applications. Weinham, Federal Republic of Germany: VCH Verlagsgesellschaft mBH
[35] Park, L. Y., Rowe, J. M. (1998) Chemistry of Materials, 10, 1069-1075
[36] Rodriguez, F., Principles of Polymer System, 4th edn. Washington: Taylor & Francis
[37] Elias, H. G. (1984) Macromolecules: Structure and Properties New York: Plenum Press
[38] Maldivi, P., Bonnet, L., Giroud-Godquin, A. M., Ibn-Elhaj, M., Guillon, D., Skoulious, A. (1993) Advanced Materials, 5, 909
[39] Attard, G. S., Cullum, P. R. (1990) Liquid Crystals, 8(3), 299-309
Univers
ity of
Mala
ya
207
[40] Ramos, M. R., Martinez, F. J. C., Lopez-Andres, S., Garcia-Perez, M. V., Redondo, M. I. Y., Torres, M. R., Garrido, L., Rodriguez, J. A. C. (2008) Crystal Growth and Design, 8(7), 2547-2554
[41] Donnio, B. (2002) Current Opinion in Colloid and Interface Science, 7, 371-394
[42] Demus, D., Richter, L. (1978) Textures of Liquid Crystals; Verlag Chemie Berlin p92
[43] Reger, D. I., Debreczeni, A., Smith, M. D. (2012) Inorganic Chemistry, 51, 1068-1083
[44] Che Mat, A. N., Abdullah, N., Khaledi, H., Tee, J. T. (2011) Acta Crystallography, 67, 599-600
[45] Baggio, R., Calvo, R., Garland, M. T., Peña, O., Perec, M., Slep, L. D. (2007) Inorganic Chemistry Communications, 10, 1249
[46] Martin, R. L., Waterman, H. (1959) Journal of the Chemical Society, 1359-1370
[47] Harrison, W., Rettig, S., Trotter, J. (1972) Journal of the Chemical Society-Dalton Transactions, 1852-1856
[48] Konar, S., Manna, S. C., Zangrando, E., Chaudhuri, R. N. (2004) Inorganica Chimica Acta, 357, 1593-1597
[49] Abdullah, N., Hashim, R., Ozair, L. N., Al-Hakeem, Y., Samsudin, H., Anita Marlina, Salim, M., Mohd Said, S., Subramanian, B., Nordin, A. R. (2015) Journal of Material Chemistry C, 3, 11036-11045
[50] Tafili-Kryeziu, M., Weil, M., Muranka, T., Bousseksou, A., Hasegawa, M., Jun, A. (2013) Dalton Transactions, 42, 15796-15804
[51] Konig, E., Madeja, K. (1966) Chemical Communications, 61-62
[52] Mohammed, R., Chanstanet, G., Tuna, F., Malkin, T. L., Barret, S. A., Kilner, C. A. (2013) European Journal of Inorganic Chemistry, 819-831
Univers
ity of
Mala
ya
208
[53] Lu, X., Chau, K. –S., Wei, S., Deng, Z., Ding, N., Zhao, L., Wu, C. –M. L., Guo, W. (2013) Jourrnal of Organometallic Chemistry, 741-742, 168-175
[54] Ha, N. N., Mai, A. T., Dang, X. T., Luong, T., Thu, T. (2014) Journal of Solar Energy Engineering, 137(2),21006-21010
[55] Yoneda, K., Adachi, K., Hayami, S., Maeda, Y., Katada, M., Fuyuhiro, A., Kawata, S., Kaizaki, S. (2006) Chemical Communications, 45-47
[56] Reynolds, R. A. III, Dunham, W. R., Coucouvanis, D. (1998) Inorganic Chemistry,
37(6), 1232-1241
[57] Coucouvanis, D., Reynolds, R. A. III, Dunham, W. R. (1995) Journal of American Chemical Society, 117,7570-7571
[58] He. C., Lippard, S. (2001) Journal of Inorganic Chemistry, 40, 1414-1420
[59] Edit, Y., T., Lippard, S. J. (2014) Chemical Reviews, 104, 987-1012
[60] Abdullah, N., Mohd Said, S., Anita Marlina, Roslan, M. F., Azil, A., Nordin, A. R. (2015) The Scientific World Journal, 1-8
[61] Ferrere, S. (2000) Chemistry of Materials, 12,1083-1089
[62] Abdullah, N., Elsheikh, M. H., Nik Ibrahim, N. M. J., Mohd Said, S., Mohd Sabri, M. F., Hassan, M. H., Anita Marlina (2015) Royal Society of Chemistry Advances, 5, 50999- 51007
[63] Zheng, Y. –Z., Xue, W., Tong, M. –L., Chen, X. –M., Grandjean, F., Long, G. J. (2008) Inorganic Chemistry, 47, 4077-4087
[64] Dykstra, C. E. (1986) Ab Initio Calculations of the Structure and Properties of Molecules, Elsevier Amsterdam
[65] Sagdinc, S., Pir, H. (2009) Spectrochimica Acta Part A, 73, 181-194
[66] David, M. C., Meijer, A. J. H. M., Tsoi, W., C., Charlton, M. D. B., Kim, J. –S., Lidzey, D. G. (2010) Journal of Physical Chemistry A, 114, 11920-11927
Univers
ity of
Mala
ya

209
[67] Sheldrick, G. M. (1996) SADABS. University of Göttigen, Germany
[68] Bruker (2007) APEX2 and SAINT. Bruker AXS. Inc., Madison, Winconsin, USA
[69] Sheldrick, G. M. (2008) Acta Crystallography Sect A: 64, 112-122
[70] Macrae, C. F., Edgington, P. R., McBabe, P., Pidcock, E., Shields, G. P., Taylor, R., Towler, M., Van de Streek, J. (2006) Journal of Applied Crystallography, 39, 452-457
[71] Agterberg, F. P. W., Kluit, H. A. J. P., Drissen, W. L., Oevering, H., Buijis, W., Lankin, M. T., Spek, A. L., Reedjik, J. (1997) Inorganic Chemistry, 36(20), 4321-4328
[72] Maldonado-Rogado, M. A., Vinuelas-Zahinos, E., Luna-Giles, F., Bernalte-Garcia,
A. (2007) Polyhedron, 26, 1173-1181
[73] Garcia-Tojal, J., Lezama, L., Pizarro, J. L., Insausti, M., Arriortua, M. I., Rojo, T. (1999) Polyhedron, 18. 3703-3711
[74] Wang, A. (2012) Acta Crystallography E, 68, 43
[75] Asem, S., Buchanan, R. M., Mashuta, M. S. (2011) Acta Crystallography E, 60, 577
[76] Perlepes, S. P., Huffman, J. C., Christou, G. (1992) Polyhedron, 11, 1471-1479
[77] Chisholm, M. H., Kober, E. M., Ironmonger, D. J., Thornton, P. (1985) Polyhedron, 4(2), 1869-1874
[78] Petric, M., Leban, I., Segedin, P. (1995) Polyhedron, 14, 983
[79] Moita, M. F. R., Duarte, M. L. T. S., Fausto, R. (1994) Journal of Chemical Society Faraday Transactions, 90(19), 2953-2960
[80] Korendovych, I. V., Kryatov, S. V., Reiff, W. M., Rybak-Akimova, E. V. (2005) Inorganic Chemistry, 44(24), 8656-8658
[81] Deacon, G. B., Philips, R. J. (1980) Coordination Chemistry Reviews, 33, 227-250
Univers
ity of
Mala
ya
210
[82] Hogg, R., Wilkins, R.G. (1962) Journal of Chemical Society (Resumed) 341-350
[83] Judge, J. S., Baker Jr, W. A. (1967) Inorganica Chimica Acta, 1, 68-72
[84] Sorai, M. (2004) Heat Capacity Studies of Spin Crossover Systems, in Spin Crossover in Transition Metal Compounds III. Springer Berlin Heidelberg, 153-170
[85] Becke, A. D. (1993) Journal of Chemical Physics, 98, 5648-5652
[86] Lee, C. Yang, W., Parr, R. G. (1988) Physical Review, 37B, 785-789
[87] Cao-Yuan, N. (2011) Crystal Growth & Design, 11, 2874-2888
[88] Jotham, R. W., Kettle, S. F. A., Marks, J. A. (1972) Journal of Chemical Society Dalton, 428-438
[89] Gaspar, A. B. Ksenofontov, V., Seredyuk, M., Gütlich, P. (2005) Coordination Chemistry Reviews, 249, 2661-2676
[90] Seredyuk, M., Gaspar, A. B. Ksenofontov, V., Galyametdinov, Y., Kusz, J. Gütlich, P. (2008) Journal of American Chemical Society, 130(4), 1431-1439
[91] Seredyuk M., Gaspar A.B., Ksenofontov V., Galyametdinov Y., Kusz, J., Gütlich, P. (2008) Advanced Functional Materials, 18, 2089-2101
[92] Seredyuk, M., Gaspar, A.B., Ksenofontov, V., Reiman, S., Galyametdinov, Y., Haase, W., Rentschler, E., Gütlich, P. (2006) Chemistry of Materials, 18, 2513-2519
[93] Seredyuk, M., Gaspar, A.B., Ksenofontov, V., Reiman, S., Galyametdinov, Y., Haase, W., Rentschler, E., Gütlich, P. (2006) Hyperfine Interactions, 166(1-4), 385-390
[94] Seredyuk, M., Gaspar, A.B., Ksenofontov, V., Galyametdinov, Y., Verdaguer, M., Villain, F., Gütlich, P. (2008) Inorganic Chemistry, 47(22), 10232-10245
[95] Ferere, S., Gregg, B. A. (1998) Journal of American Society, 120, 843-844
Univers
ity of
Mala
ya
211
[96] Ferere, S. (2000) Chemistry of Materials, 12, 1083-1089
[97] Ferere, S. (2002) Inorganica Chimica Acta, 329, 79-92
[98] Abraham, T. J., MacFarlane, D. R., Pringle, J. M. (2013) Energy & Environmental Science, 6, 2639-2645
Univers
ity of
Mala
ya