iim interim management survey 2010 · iim interim management survey 2010 ... the 5th annual interim...
TRANSCRIPT

IIM Interim Management Survey 2010 October 2010

2
The greater the difficulty the more glory in surmounting it. Skilful pilots gain their reputation from storms and tempests.
Epicetus, 55-135 AD

3
An Introduction from Tony Evans, IIM Director Firstly, on behalf of the IIM, I wish to thank everyone who took the time and made the effort to contribute to this survey. The survey provides few surprises about the difficult state that the interim market finds itself in. The whole community has to continue to market itself as effectively as possible and this applies to the individual interim, whether a ‘new starter’ or long standing practitioner aiming to operate in the public or private sectors. And whilst we are all doing our best to attract business, you might like to spare a moment’s thought for who, if anyone, concerns themselves about the impact of regulatory activity and how this might seriously damage our industry? An Introduction from Ad van der Rest, IIM Director & Survey author The 5th Annual Interim Management Survey 2010, devised by the Institute of Interim Management collected feedback from 642 members of the Interim Management community. Those surveyed were predominantly Interim Managers, but also included Service Providers and Consultants. The data was collected during July and August 2010 via a range of online sources, and primarily the IIM’s own ‘Interim Management – IIM’ group on LinkedIn with more than 2,100 Interim Management community group members. A further ‘Pulse’ survey in December 2010 of 106 people allowed for some updated trends to be assessed. Winter 2010 updated data is marked “¬” in this report”. We expect a statistical significance of better than + 4% with a 95% confidence for most of the key questions, though where data has been filtered, this falls to + 6%. The Institute of Interim Management The Institute of Interim Management (IIM) has since September 2002, been a fully independent professional Institute incorporated as a not-for-profit organisation. The Institute is run by a volunteer team of seasoned Interim Managers and is committed to supporting Interim Managers and working collaboratively with other sectors of the Interim Management community. The Institute’s LinkedIn group, ‘Interim Management – IIM’ acts as one of the Institute’s ‘windows’ onto the Interim community, sharing Interim thought leadership and assistance as part of its support to the Interim community as a whole. http://www.iim.org.uk http://www.linkedin.com/groups?gid=2339933
4
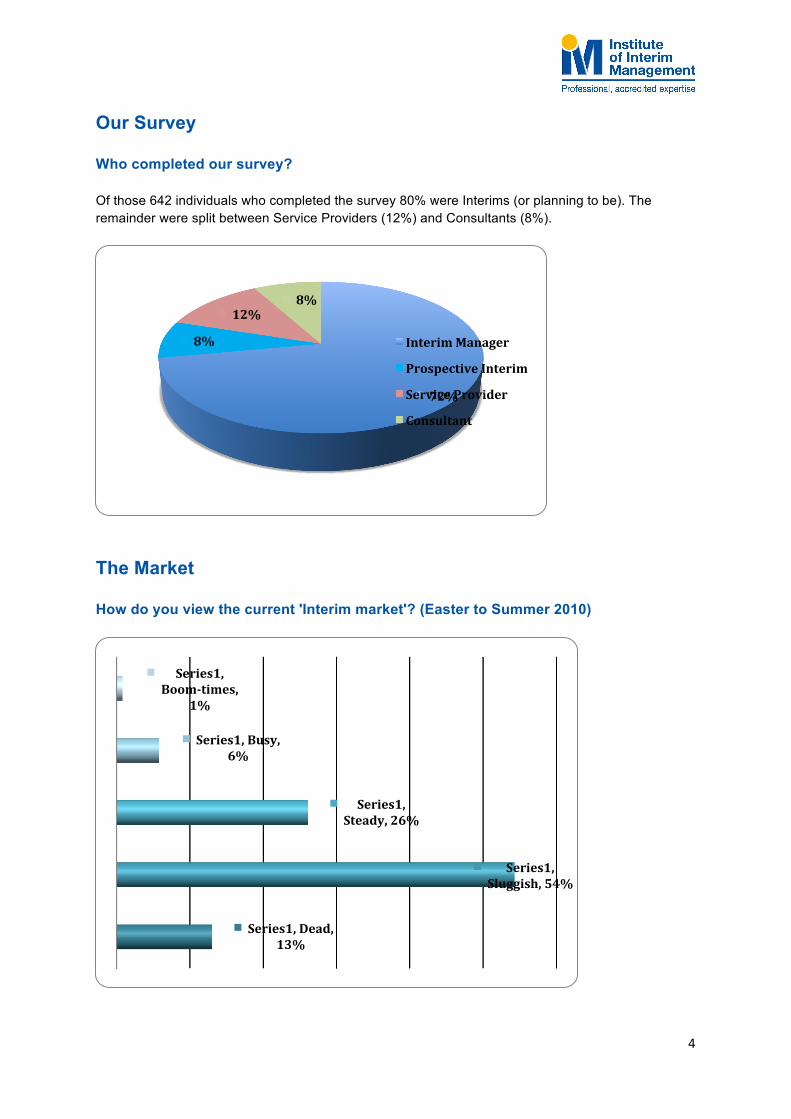
Our Survey Who completed our survey? Of those 642 individuals who completed the survey 80% were Interims (or planning to be). The remainder were split between Service Providers (12%) and Consultants (8%).
The Market How do you view the current 'Interim market'? (Easter to Summer 2010)
72%
8%
12% 8%
Interim Manager
Prospective Interim
Service Provider
Consultant
Series1, Dead, 13%
Series1, Sluggish, 54%
Series1, Steady, 26%
Series1, Busy, 6%
Series1, Boom-‐times,
1%

5
Firmly in "Sluggish" territory. No surprises there. How do you view the state of the 'Interim Market' in context (2007 – Q4 2010)? ¬
Interim Managers experienced a continued sluggish market through the second half of 2010. Boom-time Busy Steady Sluggish Dead
Line: 20-80% of the response distribution. Shaded box: 40-60% of the response distribution. Looking forward, how active do you expect the 'Interim Market' will be in the future: ¬ Interim Managers anticipated a continuing difficult but improving market in 2011, reaching and edging to and beyond a ‘Steady’ market in 2012 and 2013. Boom-time Busy Steady Sluggish Dead
Line: 20-80% of the response distribution. Shaded box: 40-60% of the response distribution.

6
When do you foresee the market improving from the current levels?
The Interim community’s anticipation for improvement is predominantly in 2011 at some point, with 61% expecting the improvement by the start of 2011, and up to 86% expecting it by the end of 2011. How do you foresee the change of government will impact the Interim Management profession over the remainder of the Parliament?
Series1, Double dip,
8%
Series1, Autumn 2010,
28%
Series1, Start of 2011, 33%
Series1, Late 2011, 17%
Series1, A very long time, 8%
Series1, Negatively, Interim
Management will suffer, 15%
Series1, Slightly negatively, there will be some 'down-‐sides' for
Interims, 30%
Series1, No particular positive or
negative effect due to
government change, 25%
Series1, Slightly positive, there will be some 'up-‐sides' for Interims, 25%
Series1, Positively, Interim
Management will beneNit, 5%

7
The change of government would not appear to have a primary impact in people’s minds on the future direction of the interim market in the UK. The variety of opinion is quite evenly distributed.
About Interim Managers The following data about Interim Managers was collected only from the Interim Managers surveyed. Interim Manager gender split
20% of the Interim Managers surveyed are female.
Interim Manager age split by decade age
Our survey has half the Interim Managers (50%) between 50-59.
Series1, Male, 80%,
80%
Series1, Female, 20%, 20%
Male
Female
Series1, 30-‐39, 4%,
4% Series1, 40-‐49, 29%, 29%
Series1, 50-‐59,
50%, 50%
Series1, 60-‐69,
18%, 17%
30-‐39
40-‐49
50-‐59
60-‐69

8
Interim Manager working location
Interim Management remains a London & the South East-centric activity with 63% of those surveyed working in that part of the country.
Interim Manager functional assignments
Board & General Mgt. remains a key pursuit for Interims. (16%) Various Change, Project and Turnaround activities occupy nearly a third of activity (29%) Nearly half have their activities defined by their various business functions (48%) with Finance
being the largest (16%)
Series1, Finance, 16%
Series1, Board & General Mgt, 16% Series1,
Human Resources,
13%
Series1, Change
Management, 13%
Series1, Programme/Project Mgt,
10%
Series1, Turnaround,
6%
Series1, Procurement & Supply Chain, 5%
Series1, Operations,
4% Series1, IT, 4%
Series1, Marketing/PR/Comms,
3% Series1, Sales,
2%
Series1, Other, 5%

9
Interim Manager sector assignments ¬
64% of Interim Managers are working in the Private sector, across FTSE 100. Large and SME. 32% are in Public Sector. Interim Manager operational seniority
Most Interims operate at an Executive or Director level (56%)
Series1, Private FTSE 100, 12%
Series1, Private Large,
26%
Series1, Private SME,
26%
Series1, Public Sector, 32%
Series1, Not For ProNit & Charity, 3%
Series1, CEO/MD/GM, 18%, 18%
Series1, Director, 38%, 38%
Series1, Manager, 21%, 21%
Series1, Project Manager, 18%, 18%
Series1, Other, 5%, 5%
CEO/MD/GM
Director
Manager
Project Manager
Other

10
Series1, Change
Management, 34%
Series1, Specialist skills, 27%
Series1, A 'gap'
assignment, 17%
Series1, Turnaround,
11%
Series1, Added
resources, 10%
Most remaining Interims (39%) operate at a Line or Project Management level. Reasons for the last Interim Manager assignment ¬
The biggest driver for Interim assignment were Change projects and activities (34%) Next were driven by specialist skills (27%). In third place, the classic ‘gap’ assignment (17%).
Interim Management experience (measuring year Interim business started trading)
Series1, 1990, 3%
Series1, 1991, 1%
Series1, 1992, 1%
Series1, 1993, 2%
Series1, 1994, 2%
Series1, 1995, 3%
Series1, 1996, 2%
Series1, 1997, 4%
Series1, 1998, 2%
Series1, 1999, 3%
Series1, 2000, 10%
Series1, 2001, 6% Series1, 2002,
5%
Series1, 2003, 6%
Series1, 2004, 6%
Series1, 2005, 9%
Series1, 2006, 7%
Series1, 2007, 10% Series1, 2008,
9% Series1, 2009, 8%
Series1, 2010, 4%

11
The length of Interim Management experience shows not only the increasing numbers of people becoming Interims in recent years, but also the steady growth of ‘Interim Management’ as an activity. Biggest years for becoming an Interim Manager were 2000, 2005, 2007 & 2008. The average ‘Interim Management experience’ is 7.2 years (7.5 years male, 6.2 years female) for our surveyed Interims, based on their business start-dates.
Fees ¬ What’s the ‘headline’ day-rate?
Day rates were down in 2009/10 over 2008/9. The ‘headline’ average rate reached £607 per day in Summer 2010, down from £627, and softened further to £596 by Winter 2010. We also asked for Interim’s to share their ‘best’ and ‘worst’ rates. Both the average ‘best’ and ‘worst’ rates fell from 2008/9 into 2009/10 and up to Winter 2010. Day rate segmented by rate earned
Day rates are close to normally distributed from £100 to £1,700. 67% of the range of day rates fall between £400 and £800.
Highest achieved,
2008/9, £692
Highest achieved,
2009/10, £684
Highest achieved, Q4 2010, 671
Average, 2008/9, £627
Average, 2009/10, £607
Average, Q4 2010, 596
Lowest achieved,
2008/9, £564
Lowest achieved,
2009/10, £543
Lowest achieved, Q4 2010, 531
Highest achieved
Average
Lowest achieved
12
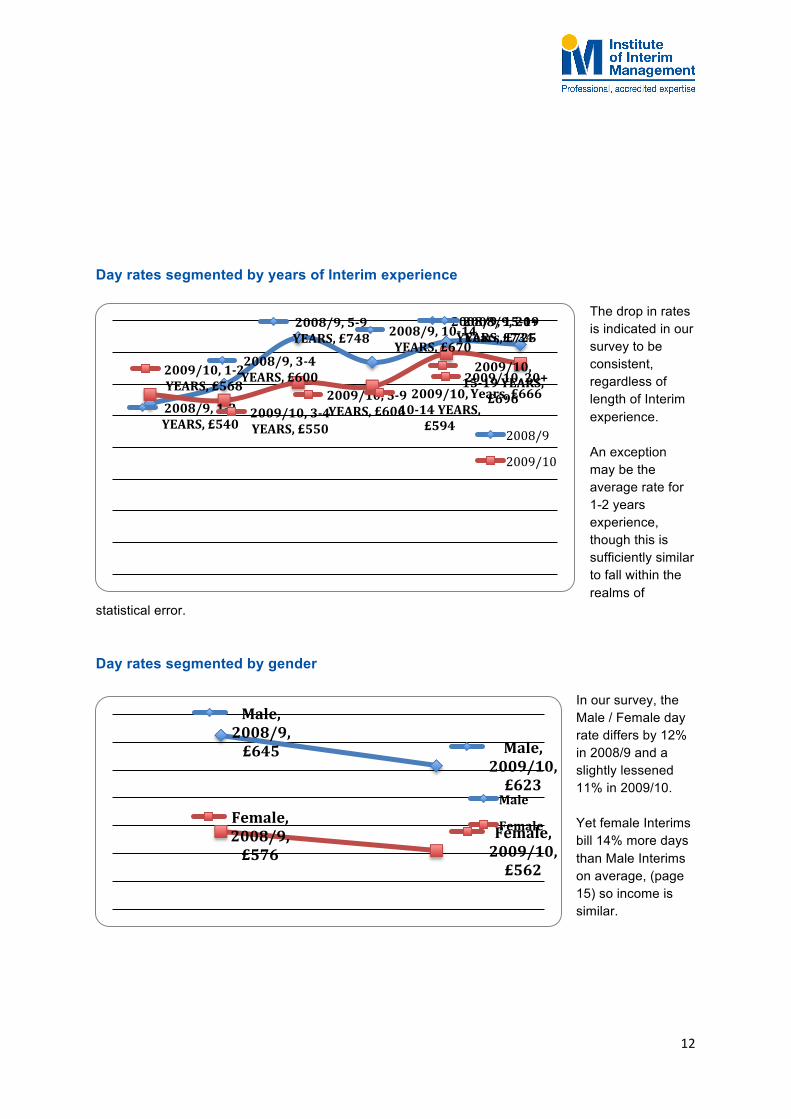
Day rates segmented by years of Interim experience
The drop in rates is indicated in our survey to be consistent, regardless of length of Interim experience. An exception may be the average rate for 1-2 years experience, though this is sufficiently similar to fall within the realms of
statistical error. Day rates segmented by gender
In our survey, the Male / Female day rate differs by 12% in 2008/9 and a slightly lessened 11% in 2009/10. Yet female Interims bill 14% more days than Male Interims on average, (page 15) so income is similar.
2008/9, 1-‐2 YEARS, £540
2008/9, 3-‐4 YEARS, £600
2008/9, 5-‐9 YEARS, £748 2008/9, 10-‐14
YEARS, £670
2008/9, 15-‐19 YEARS, £734 2008/9, 20+ Years, £725
2009/10, 1-‐2 YEARS, £568
2009/10, 3-‐4 YEARS, £550
2009/10, 5-‐9 YEARS, £606
2009/10, 10-‐14 YEARS,
£594
2009/10, 15-‐19 YEARS,
£696 2009/10, 20+ Years, £666
2008/9
2009/10
Male, 2008/9, £645 Male,
2009/10, £623
Female, 2008/9, £576
Female, 2009/10, £562
Male
Female

13
Day rates segmented by function
Segmented by function, day rates are mostly downward, 2009/10, over 2008/9. IT have had the biggest proportionate drop of 16%. Most other functions, Turnaound, Finance, Project Mgt, HR, Marketing & Sales dropped 10%

14
Series1, 2008/9, 157
Series1, 2009/10, 140
Series1, Q4 2010, 136
Change Management only dropped 2% Operations and Procurement rates grew by 5% Board & General Management rates grew by 9% What are the ‘headline’ days billed? ¬
The average days billed over a year before, shows a drop of about 11%. The average day-rate fell by a more modest 3% overall, but together this shows an average 14% drop in income. A further slight drop was noticed by Winter 2010.
What is the range of days billed?
15
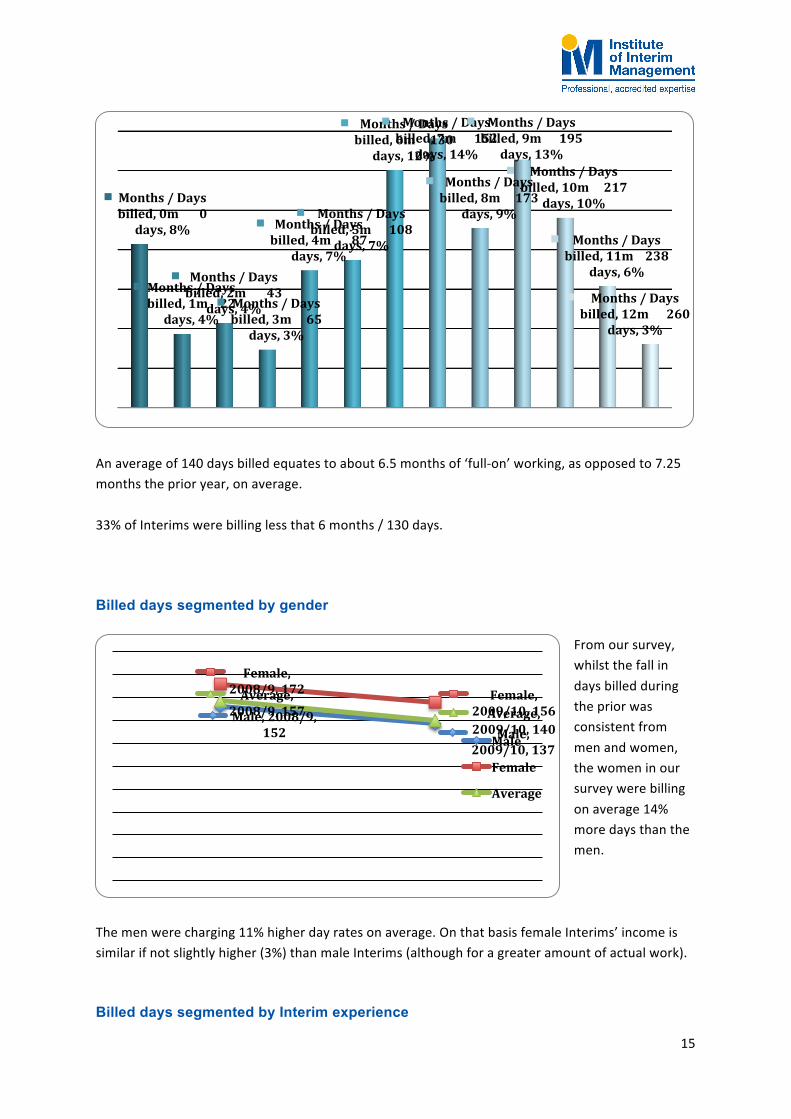
An average of 140 days billed equates to about 6.5 months of ‘full-‐on’ working, as opposed to 7.25 months the prior year, on average. 33% of Interims were billing less that 6 months / 130 days. Billed days segmented by gender
From our survey, whilst the fall in days billed during the prior was consistent from men and women, the women in our survey were billing on average 14% more days than the men.
The men were charging 11% higher day rates on average. On that basis female Interims’ income is similar if not slightly higher (3%) than male Interims (although for a greater amount of actual work). Billed days segmented by Interim experience
Months / Days billed, 0m 0 days, 8%
Months / Days billed, 1m 22 days, 4%
Months / Days billed, 2m 43
days, 4% Months / Days billed, 3m 65
days, 3%
Months / Days billed, 4m 87
days, 7%
Months / Days billed, 5m 108
days, 7%
Months / Days billed, 6m 130
days, 12%
Months / Days billed, 7m 152
days, 14%
Months / Days billed, 8m 173
days, 9%
Months / Days billed, 9m 195
days, 13% Months / Days
billed, 10m 217 days, 10%
Months / Days billed, 11m 238
days, 6%
Months / Days billed, 12m 260
days, 3%
Male, 2008/9, 152 Male,
2009/10, 137
Female, 2008/9, 172 Female,
2009/10, 156 Average,
2008/9, 157 Average, 2009/10, 140
Male
Female
Average

16
Series1, Working, 51%, 51%
Series1, Not working, 49%, 49% Working
Not working
The billing profile shows more established Interims have suffered somewhat on billing days over the last year. New Interims have not only done better than 2008/9 (which could be down to newly setting up) but compare well to more experienced Interims. Working Status Are you currently on assignment? ¬
Barely more than half (53%) of Interims were on assignment in the Summer of 2010. This had fallen back even further to 51% by the Winter of 2010.
2008/9, 1-‐2 Years, 137
2008/9, 3-‐4 Years, 164
2008/9, 5-‐9 Years, 166
2008/9, 10-‐14 Years, 163 2008/9, 15 Years +, 152
2009/10, 1-‐2 Years, 163
2009/10, 3-‐4 Years, 159
2009/10, 5-‐9 Years, 143
2009/10, 10-‐14 Years,
129
2009/10, 15 Years +, 142
2008/9
2009/10

17
How are you finding demand for your services: Busier, quieter or the same as last year?
More Interims found 2010 quieter than last year (46%), though 20% find it busier.
Assignment status by gender
Filtered by gender, 12% more female Interims are reporting that they are ‘on assignment’ than their male counterparts (63% vs. 51%).
Assignment status by region - % on assignment
Interim Managers, Same, 34%
Interim Managers, Busier, 20%
Interim Managers,
Quieter, 46%
Chart Title
On assignment by gender, Male,
51%
On assignment by
gender, Female, 63%
18
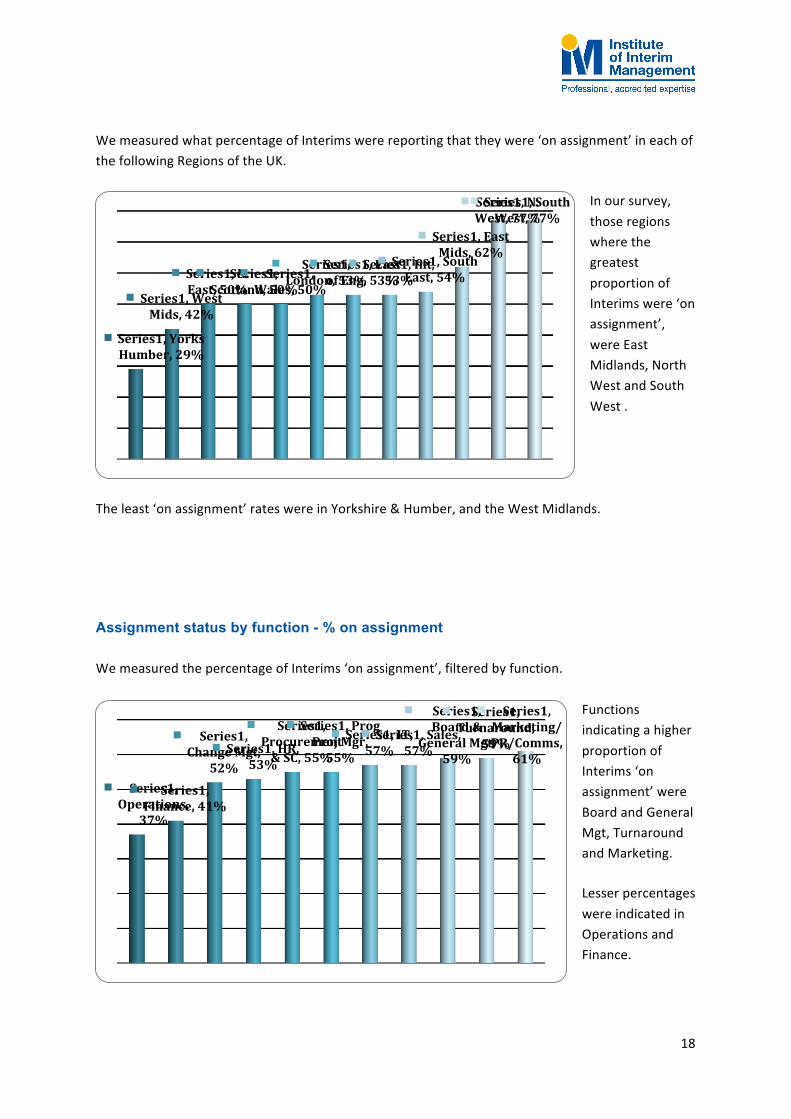
We measured what percentage of Interims were reporting that they were ‘on assignment’ in each of the following Regions of the UK.
In our survey, those regions where the greatest proportion of Interims were ‘on assignment’, were East Midlands, North West and South West .
The least ‘on assignment’ rates were in Yorkshire & Humber, and the West Midlands. Assignment status by function - % on assignment We measured the percentage of Interims ‘on assignment’, filtered by function.
Functions indicating a higher proportion of Interims ‘on assignment’ were Board and General Mgt, Turnaround and Marketing. Lesser percentages were indicated in Operations and Finance.
Series1, Yorks Humber, 29%
Series1, West Mids, 42%
Series1, N. East, 50%
Series1, Scotland, 50%
Series1, Wales, 50%
Series1, London, 53%
Series1, East of Eng, 53%
Series1, Int, 53% Series1, South East, 54%
Series1, East Mids, 62%
Series1, N. West, 77% Series1, South West, 77%
Series1, Operations,
37%
Series1, Finance, 41%
Series1, Change Mgt,
52% Series1, HR,
53%
Series1, Procurement & SC, 55%
Series1, Prog Proj Mgr, 55%
Series1, IT, 57% Series1, Sales,
57%
Series1, Board &
General Mgt, 59%
Series1, Turnaround,
59%
Series1, Marketing/PR/Comms,
61%

19
Assignment status by sector - % on assignment
Finally, we filtered on sector. The proportion of Interims ‘on assignment’ appears least when working with Small and Medium Enterprises (and International SME’s.
Greater proportions are ‘on assignment’ in larger Private Sector busineses (Private listed companies, International major companies and Private FTSE 100 coompanies). Public Sector has slightly more Interims on assignment than the average (58% vs. 53% average) In our survey, Interims in the Not-‐For-‐Profit and Charity sectors appeared with the greatest proportion of Interims on assignment. If you are off-assignment, for how long has this lasted? ¬
Of the 47% of Interims currently off-‐assignment, their average time off-‐assignment is 6.2 months. (Measured in Winter 2010, up from 5.9 in Summer 2010).
On the plus side 83% have gaps within the year.
Series1, Private SMEs,
42%
Series1, Int SMES, 47%
Series1, Private Listed,
47%
Series1, Int Majors, 54%
Series1, Private FTSE100, 56%
Series1, Public Sector,
58%
Series1, NFP -‐ Charities, 74%
Series1, 0-‐2 months, 36%
Series1, 3-‐5 months, 26%
Series1, 6-‐8 months, 13%
Series1, 9-‐11 months, 9%
Series1, 12-‐14 months, 8%
Series1, 15-‐17 months, 3%
Series1, 18-‐20 months, 3% Series1, 21-‐23
months, 1%
Series1, 2 years +, 3%

20
What was the duration of your last assignment? ¬ Interims surveyed reported on the duration of their last assignment, as follows:
The average assignment is 8.8 months in length (at Winter 2010, 8.7 months in Summer 2010). Over half of assignments run 6-‐17 months (56%) Less than 10% run 18 months or longer.
We even had a handful of Interims claim assignments running beyond 4 years. Not what would be associated with the term ‘Interim’. How big is your financial buffer? ¬ (how many months off-assignment before the money runs out?)
In times of financial stability, the size of an Interim Manager’s ‘financial buffer’ becomes very important.
Series1, 0-‐2 months, 11%
Series1, 3-‐5 months, 23%
Series1, 6-‐8 months, 23%
Series1, 9-‐11 months, 15% Series1, 12-‐14
months, 14%
Series1, 15-‐17 months, 4%
Series1, 18-‐20 months, 5%
Series1, 21-‐23 months, 1%
Series1, 2 years +, 3%
Series1, Negative, 9%
Series1, 0, 12%
Series1, 1-‐2 m, 6%
Series1, 3-‐5 m, 21% Series1, 6-‐8 m,
19%
Series1, 9-‐11 m, 3%
Series1, 12-‐17 m, 14%
Series1, 18-‐23 m, 2%
Series1, 2 years +, 14%

21
48% of Interims surveyed reported financial buffers of less than 6 months. Given that 47% of Interims are not ‘on assignment’, and that the average assignment gaps is indicated to be at least 5.9 months, it would be reasonable to infer that perhaps 20-‐25% of Interim Managers are facing some difficult financial decisions. Buffer size in Winter 2010 was consistent with Summer 2010. Yet with all this gloom, the following statistics are telling: So how committed are you to a career as an Interim Manager?
Despite tough times, 57% cite Interim Management as their only career choice. Including those who would prefer Interim but would take Perm, that committed group reaches 83% of the sample.
Interim business type and tax What type of Interim business do you have?
Series1, Limited Company, 89%
Series1, Umbrella
Company, 6% Series1, Sole Trader, 4%
Series1, LLP, 1%
Series1, Totally
Interim, it's my only
preference, 57%
Series1, Would prefer Interim but will take perm, 25% Series1, I
would happily work perm or Interim, 15% Series1, I'd
rather be back in a
perm job, 3%
22
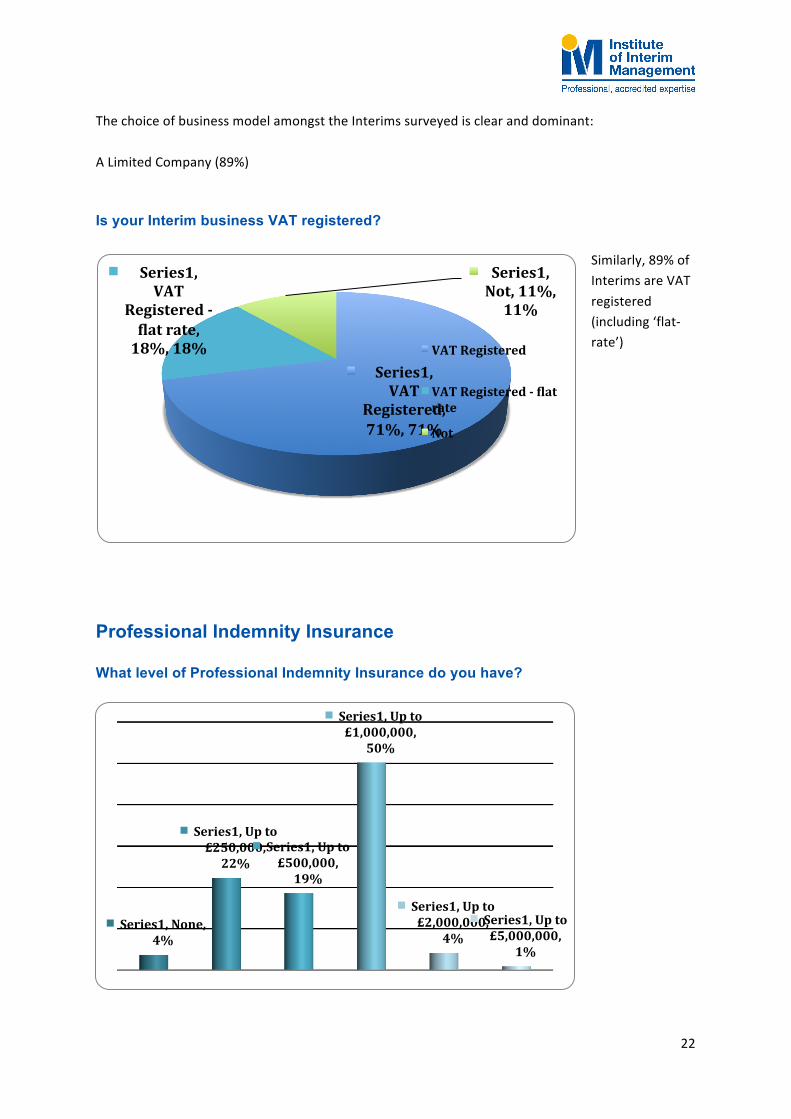
The choice of business model amongst the Interims surveyed is clear and dominant: A Limited Company (89%) Is your Interim business VAT registered?
Similarly, 89% of Interims are VAT registered (including ‘flat-‐rate’)
Professional Indemnity Insurance What level of Professional Indemnity Insurance do you have?
Series1, VAT
Registered, 71%, 71%
Series1, VAT
Registered -‐ Nlat rate, 18%, 18%
Series1, Not, 11%, 11%
VAT Registered
VAT Registered -‐ Nlat rate
Not
Series1, None, 4%
Series1, Up to £250,000, 22%
Series1, Up to £500,000, 19%
Series1, Up to £1,000,000,
50%
Series1, Up to £2,000,000,
4% Series1, Up to £5,000,000,
1%

23
The most common PI cover is £1,000,000 How much do you pay for your Professional Indemnity Insurance?
72% of Interims pay less than £500 for typically £1,000,000 of PI cover (see chart above). From which professional organisation do you get discounted PI insurance?
Travel away from home
Series1, IIM, 27% Series1, CIPD,
25%
Series1, IoD, 10% Series1, IMAI,
8% Series1, PCG,
8% Series1, BASW, 6%
Series1, CMI, 6% Series1, BCS,
4% Series1,
ICAEW, 4%
Series1, £0-‐99, 4%
Series1, £100-‐199, 9%
Series1, £200-‐299, 24%
Series1, £300-‐399, 23%
Series1, £400-‐499, 12%
Series1, £500-‐599, 9%
Series1, £600-‐699, 6%
Series1, £700-‐799, 6% Series1,
£800-‐899, 4%
Series1, £900-‐999, 0%
Series1, £1000+, 4%
24
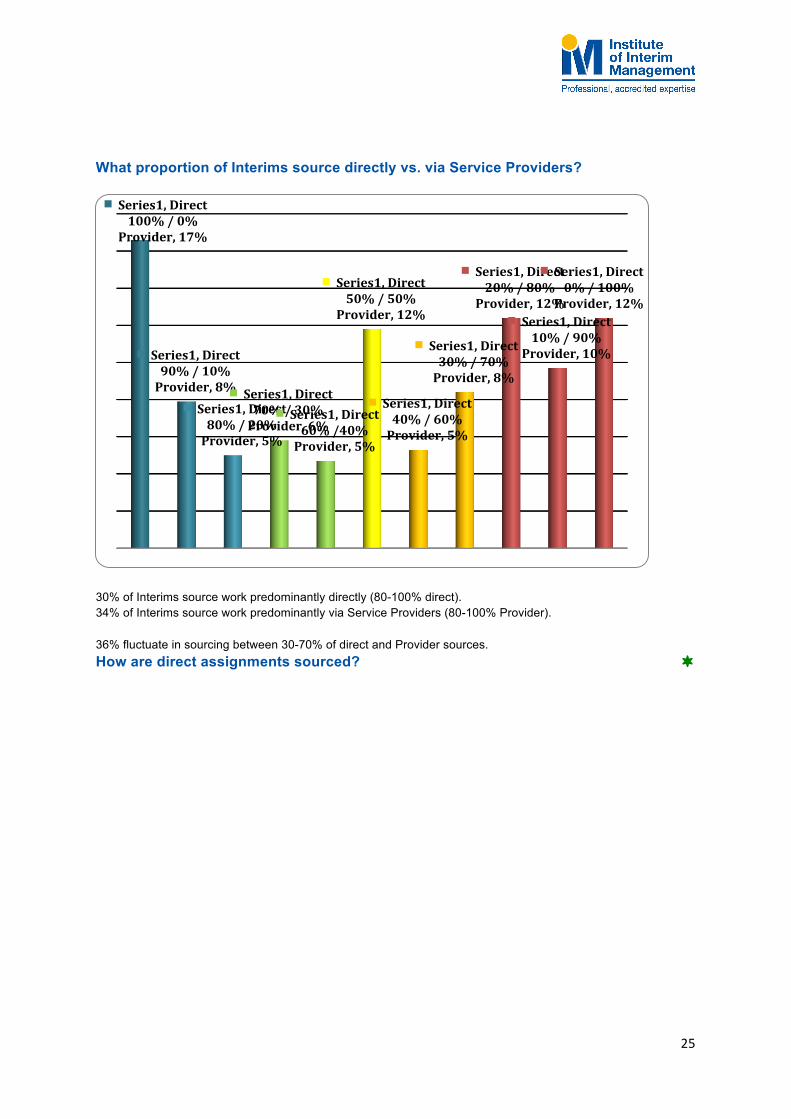
Series1, Direct,
50%, 50%
Series1, Service
Providers, 50%, 50%
Direct
Service Providers
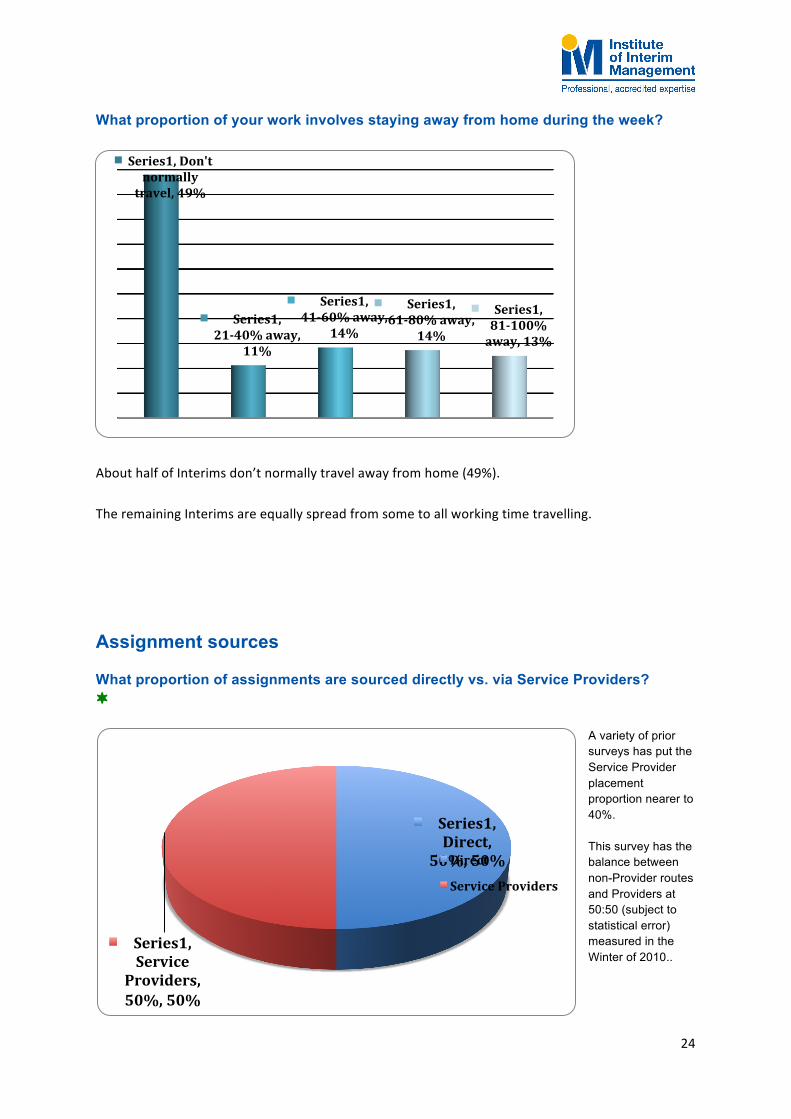
What proportion of your work involves staying away from home during the week?
About half of Interims don’t normally travel away from home (49%). The remaining Interims are equally spread from some to all working time travelling.
Assignment sources What proportion of assignments are sourced directly vs. via Service Providers? ¬
A variety of prior surveys has put the Service Provider placement proportion nearer to 40%. This survey has the balance between non-Provider routes and Providers at 50:50 (subject to statistical error) measured in the Winter of 2010..
Series1, Don't normally travel, 49%
Series1, 21-‐40% away,
11%
Series1, 41-‐60% away,
14%
Series1, 61-‐80% away,
14%
Series1, 81-‐100% away, 13%
25
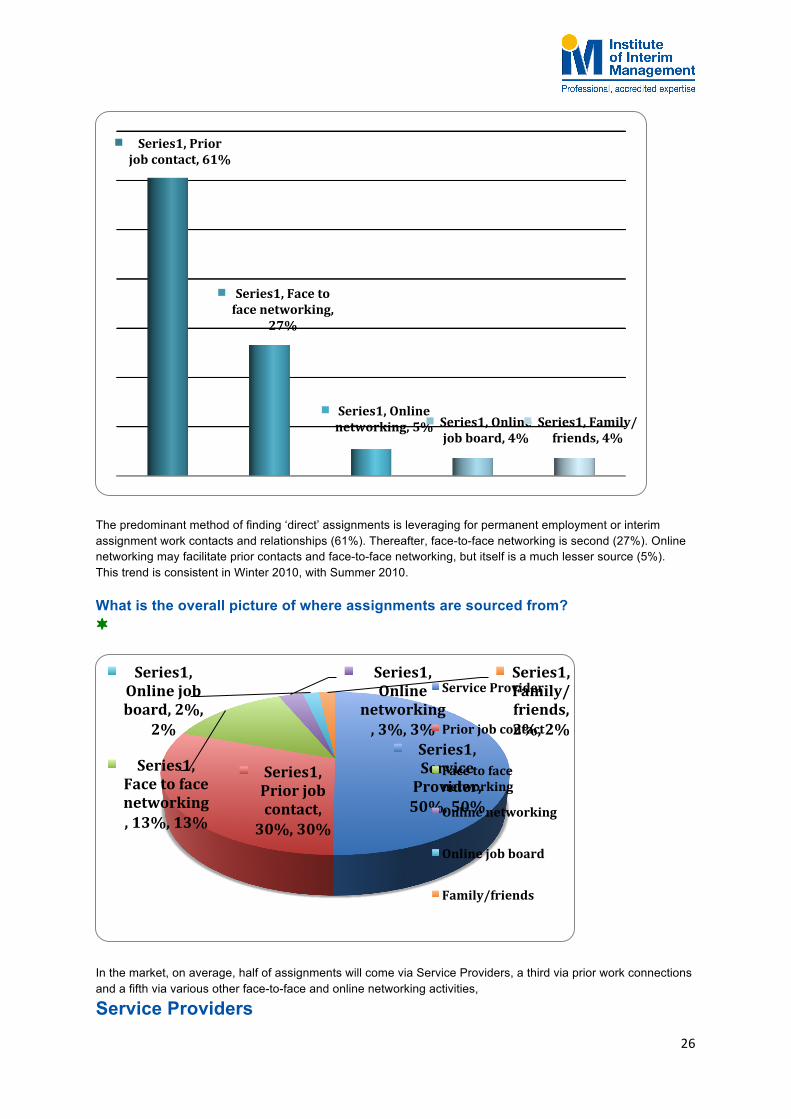
What proportion of Interims source directly vs. via Service Providers?
30% of Interims source work predominantly directly (80-100% direct). 34% of Interims source work predominantly via Service Providers (80-100% Provider). 36% fluctuate in sourcing between 30-70% of direct and Provider sources. How are direct assignments sourced? ¬
Series1, Direct 100% / 0%
Provider, 17%
Series1, Direct 90% / 10% Provider, 8%
Series1, Direct 80% / 20% Provider, 5%
Series1, Direct 70% / 30% Provider, 6%
Series1, Direct 60% /40% Provider, 5%
Series1, Direct 50% / 50%
Provider, 12%
Series1, Direct 40% / 60% Provider, 5%
Series1, Direct 30% / 70% Provider, 8%
Series1, Direct 20% / 80%
Provider, 12% Series1, Direct 10% / 90%
Provider, 10%
Series1, Direct 0% / 100%
Provider, 12%
26
The predominant method of finding ‘direct’ assignments is leveraging for permanent employment or interim assignment work contacts and relationships (61%). Thereafter, face-to-face networking is second (27%). Online networking may facilitate prior contacts and face-to-face networking, but itself is a much lesser source (5%). This trend is consistent in Winter 2010, with Summer 2010. What is the overall picture of where assignments are sourced from? ¬
In the market, on average, half of assignments will come via Service Providers, a third via prior work connections and a fifth via various other face-to-face and online networking activities,
Service Providers
Series1, Prior job contact, 61%
Series1, Face to face networking,
27%
Series1, Online networking, 5% Series1, Online
job board, 4% Series1, Family/friends, 4%
Series1, Service Provider, 50%, 50%
Series1, Prior job contact, 30%, 30%
Series1, Face to face networking, 13%, 13%
Series1, Online
networking, 3%, 3%
Series1, Online job board, 2%,
2%
Series1, Family/friends, 2%, 2%
Service Provider
Prior job contact
Face to face networking
Online networking
Online job board
Family/friends
27
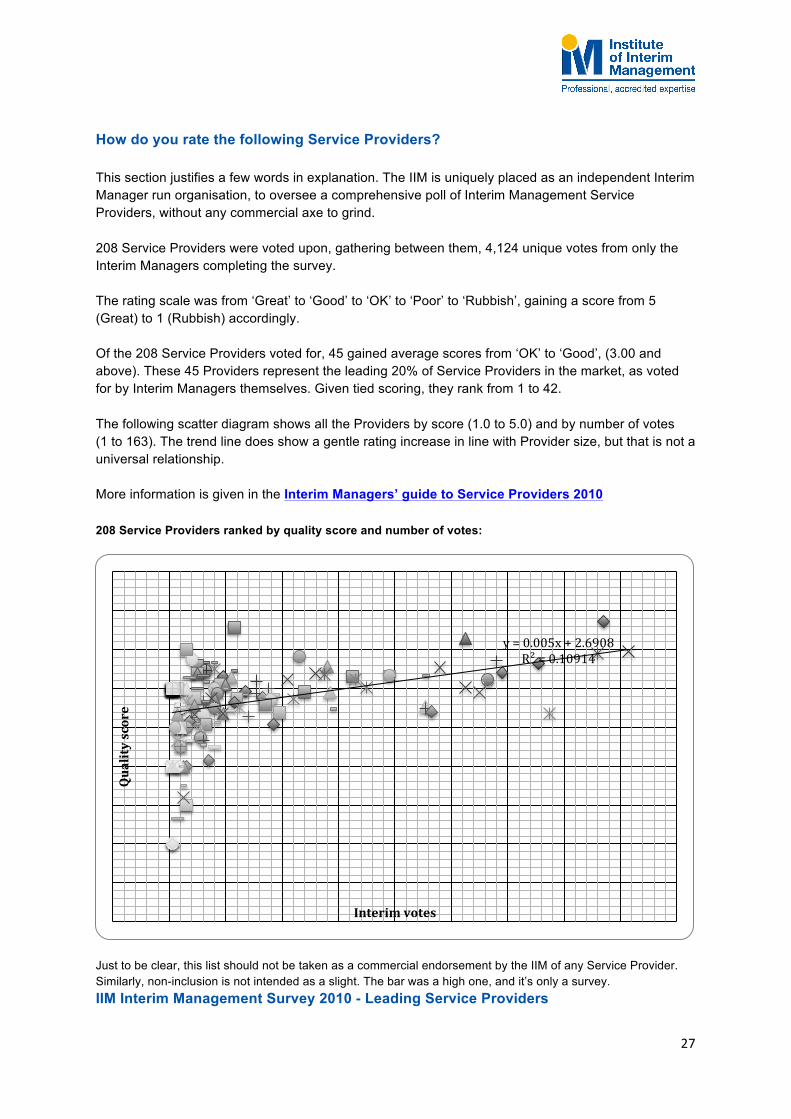
How do you rate the following Service Providers? This section justifies a few words in explanation. The IIM is uniquely placed as an independent Interim Manager run organisation, to oversee a comprehensive poll of Interim Management Service Providers, without any commercial axe to grind. 208 Service Providers were voted upon, gathering between them, 4,124 unique votes from only the Interim Managers completing the survey. The rating scale was from ‘Great’ to ‘Good’ to ‘OK’ to ‘Poor’ to ‘Rubbish’, gaining a score from 5 (Great) to 1 (Rubbish) accordingly. Of the 208 Service Providers voted for, 45 gained average scores from ‘OK’ to ‘Good’, (3.00 and above). These 45 Providers represent the leading 20% of Service Providers in the market, as voted for by Interim Managers themselves. Given tied scoring, they rank from 1 to 42. The following scatter diagram shows all the Providers by score (1.0 to 5.0) and by number of votes (1 to 163). The trend line does show a gentle rating increase in line with Provider size, but that is not a universal relationship. More information is given in the Interim Managers’ guide to Service Providers 2010 208 Service Providers ranked by quality score and number of votes:
Just to be clear, this list should not be taken as a commercial endorsement by the IIM of any Service Provider. Similarly, non-inclusion is not intended as a slight. The bar was a high one, and it’s only a survey. IIM Interim Management Survey 2010 - Leading Service Providers
y = 0.005x + 2.6908 R² = 0.10914
Quality score
Interim votes

28
Ranking ISP Score Votes
1 Veredus 3.86 154 2 Pilot Partners 3.78 23 3 Interim Partners 3.65 105 4 BIE Interim 3.47 163 5 Odgers Interim 3.45 152 6 Gatenby Sanderson Interim 3.41 46 7 Green Park 3.35 116
8 Methods Consulting 3.33 15 Postern 3.33 12
10 Alium Partners 3.32 131 11 Kingsley Search & Selection 3.30 10 12 Practicus 3.29 56 13 Penna 3.27 96 14 Langley Search & Selection 3.25 16
15 CIPFA Placements 3.23 13 RSA Interim 3.23 13 Top Interim 3.23 22
18 Archer Mathieson 3.22 78
19 Boyden 3.20 118 International Interim Management 3.20 10 Jarvis Johnson 3.20 10
22 Morgan Law 3.19 52 23 VMA Interim Performers 3.18 55
24
Brooklands Executives 3.17 78 Choralis Consulting 3.17 12 Impact Executives 3.17 90 Rawson Downey 3.17 12
28 FRP Transition (formerly Vantis) 3.16 19 29 Heidrick & Struggles 3.15 65 30 Walker-‐Cox 3.14 22
31 EIM Executive Interim Management 3.12 42 Hoggett Bowers 3.12 66 Russam GMS 3.12 113
34 Digby Morgan 3.10 31 35 PIR Interims 3.08 12
36 Axiom 3.06 17 Metzger 3.06 18 Rialto Consultancy 3.06 17
39 BK Cornerstone 3.05 20
40 Executives Online 3.01 105 Norman Broadbent 3.01 70
42
BIS Henderson 3.00 16 Goodman Masson 3.00 35 Marble Hill Partners 3.00 19 Mason & Nurse Associates 3.00 10
Honourable mentions

29
There were a few Providers getting high average scores but who didn’t quite get the ’10 votes’ necessary to go into the list. They are well worth an ‘honourable mention’ for the quality feedback about their services from a small selection of Interims.
Ranking ISP Score Votes
Honourable Mention
Hutchinson Consultancy 3.1-‐3.5 < 10 Intermediate Management
Solace Enterprises Turnoak
There were also some fine Service Providers whose average scores fell agonisingly close to a 3.00+ score. So with a nod to ‘statistical error’, had a handful of votes gone differently, these might have been in our main list. They still attracted decent scores which put these Service Providers into the ‘top 30%’ of the 208 Service Providers voted upon in our survey.
Ranking ISP Score Votes
Honourable Mention
Albemarle
Very close to 3.00
110 AMTEC Interim 31 Armadillo 23 Campion Willcocks 33 Consult Interim 15 Curzon Interim 26 Dbi Consulting 12 Executive Network Interim 17 Finegreen 36 Hudson 57 Martin Ward Anderson 24 Pace Executive Resourcing 17 Purcon 16 Robert Walters 37 Sand Resources 12 Tribal Interim 48 Walker Hamill 12 WH Marks Sattin 44
30
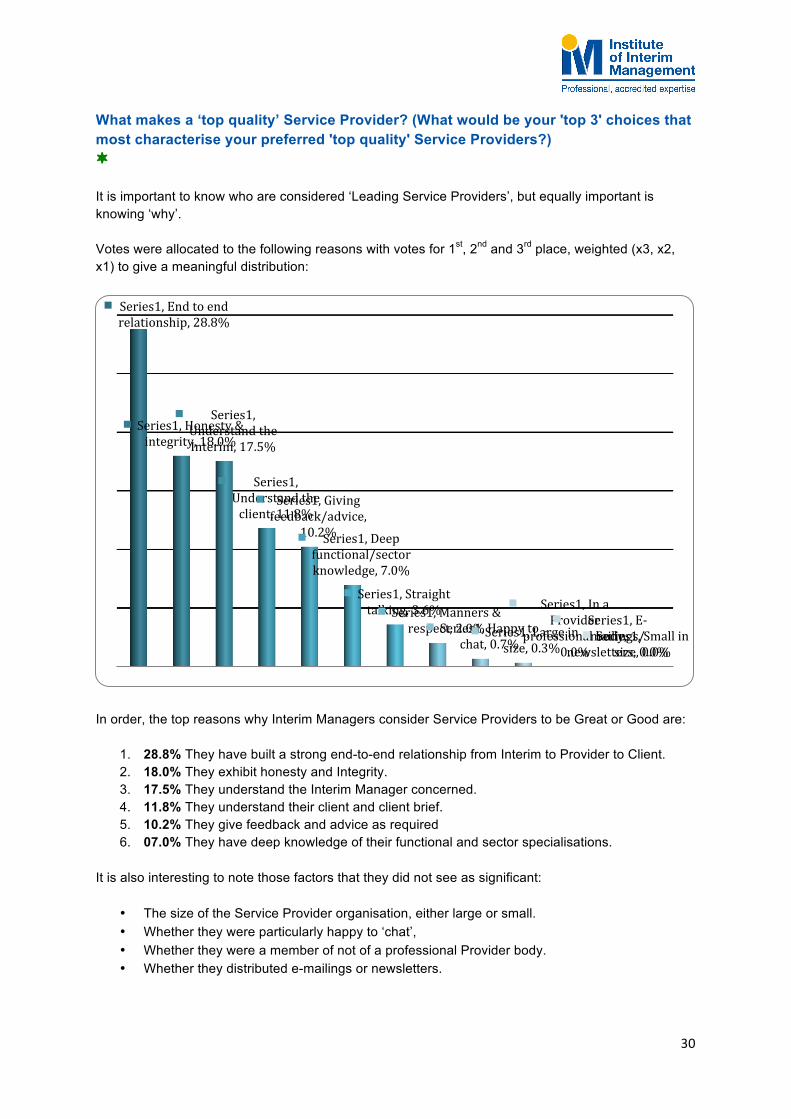
What makes a ‘top quality’ Service Provider? (What would be your 'top 3' choices that most characterise your preferred 'top quality' Service Providers?) ¬ It is important to know who are considered ‘Leading Service Providers’, but equally important is knowing ‘why’. Votes were allocated to the following reasons with votes for 1st, 2nd and 3rd place, weighted (x3, x2, x1) to give a meaningful distribution:
In order, the top reasons why Interim Managers consider Service Providers to be Great or Good are:
1. 28.8% They have built a strong end-to-end relationship from Interim to Provider to Client. 2. 18.0% They exhibit honesty and Integrity. 3. 17.5% They understand the Interim Manager concerned. 4. 11.8% They understand their client and client brief. 5. 10.2% They give feedback and advice as required 6. 07.0% They have deep knowledge of their functional and sector specialisations.
It is also interesting to note those factors that they did not see as significant:
• The size of the Service Provider organisation, either large or small. • Whether they were particularly happy to ‘chat’, • Whether they were a member of not of a professional Provider body. • Whether they distributed e-mailings or newsletters.
Series1, End to end relationship, 28.8%
Series1, Honesty & integrity, 18.0%
Series1, Understand the Interim, 17.5%
Series1, Understand the client, 11.8%
Series1, Giving feedback/advice,
10.2% Series1, Deep functional/sector knowledge, 7.0%
Series1, Straight talking, 3.6% Series1, Manners &
respect, 2.0% Series1, Happy to chat, 0.7%
Series1, Large in size, 0.3%
Series1, In a Provider
professional body, 0.0%
Series1, E-‐mailings/
newsletters, 0.0% Series1, Small in
size, 0.0%

31
How has the relationship changed between Interim Managers and Interim Service Providers over the last couple of years?
15% of Interims surveyed indicated an improved Service Provider relationship. 25% of Interims indicated that the relationship had worsened.
We captured some comments about Interim Managers’ perception of the Interim/ISP relationship: Some positive comments:
• They are under as much pressure to place candidates as we are to find assignments with more entrants and with less work to go around
• The best providers are focusing on the best interims, realising that a track record really counts
• The really good providers have time to talk without necessarily having an assignment to discuss. In turn, when they have found me an assignment, I don't want to let them down.
• More providers now have interim management departments whereas a few years back they didn't. There is more acceptance of the interim market as a viable "function".
Some negative comments:
• Much less personal attention and focus, too many trying to fill the same role, poor follow up - particularly when opportunities are not successful.
• Too many close to going out of business. Multiple changes of staff who turn up elsewhere. • There is a glut of would-be interims. The relationship between existing interims and providers
has suffered. There are fewer assignments. Providers must work harder to secure these. • Most are unwilling to confirm a very poor market, we are not fools! A strong belief they accept
untried in-betweeners that match a tight recent experience spec - to capture the assignment.
Some comments about the future Interim / ISP relationship
• Need better standards and regulation. Some form of customer feedback rating. • I think there are too many players now all fighting for the same number of assignments and
trying to make promises they do not necessarily keep. • Some Service Providers need to stop treating Interims as ‘inventory’. • Need more proactive and progressive promotion of the benefits that interims can bring
Series1, Very much worse
than previously,
5%
Series1, Less good than before, 20%
Series1, Pretty
similar, 60%
Series1, Somewhat improved, 11%
Series1, Much better than before,
4%

32
Interim management job sites and boards ¬ This Winter 2010 assessment of job boards and sites gathered 407 unique votes from only the Interim Managers completing the survey. The rating scale was from ‘Great’ to ‘Good’ to ‘OK’ to ‘Poor’ to ‘Rubbish’, gaining a score from 5 (Great) to 1 (Rubbish) accordingly. Of the 17 job boards & sites voted for:
• 3 gained average scores above 3.0, as good sites to have your details saved onto. • 5 gained average scores above 3.0, as good sites to search for jobs on.
This assessment is only a ‘taster’ of job boards used by Interim Managers; More sites were identified following the Winter 2010 ‘Pulse’ survey, and a more comprehensive survey will follow in due course. Leading Job sites to post your details onto Ranking Job site Score Votes
1 LinkedIn 3.44 196 2 Jobserve 3.16 60 3 Jobsite 3.08 80
Leading Job sites to search for assignments on Ranking Job site Score Votes
1 Exec-‐Appointments 3.52 176 2 Jobserve 3.29 69 3 Indeed 3.25 39 4 Changeboard 3.23 42 5 Executives On the Web 3.08 117
Just to be clear, this list should not be taken as a commercial endorsement by the IIM of any Job site. Similarly, non-inclusion is not intended as a slight. This is a ‘first pass’ of this topic.

33
The Interim Management model Will the Interim Management 'concept' have changed following the current economic difficulties?
Consensus from the Interims surveyed, favours evolution, not revolution of the ‘Interim Management ‘concept’ (59%) Comments about the future of the ‘Interim Management concept’:
• Interims will still be in demand due to their enhanced skill set and the ability to use them for short periods of time with no employment issues
• I see the demand will be more toward specialists than generalists • ISP's and professional interims will have to work harder to justify their premiums as well as
overcoming the reputational damage caused by amateurs • Model will move away from working for a single client full time to having a "portfolio" of clients
on the books at any one time, i.e. roles will be more part time than before • Interim Managers are here to stay - they provide the flexible management workforce that the
Economy needs. However there may be changes in the way that Interims are engaged and I can foresee a greater use of online recruitment - with the dangers that this entails - more impersonal, indirect, more time wasting with imprecise briefings.
Series1, It will go back to normal, 8%
Series1, Similar but
with modiNications,
59% Series1, Model will change but survive, 31%
Series1, Interim
Management is dead, 2%

34
Will Interim Management routes to market change following the current economic difficulties?
Similarly, consensus favours evolution, not revolution in respect of ‘Interim Management ‘routes to market’ (55%) Comments about future ‘routes to market’:
• Alternative routes to market will develop and intermediate firms will be less dominant - with many who don't make the grade dying.
• HR directors being pressed by procurement will seek to drive down margins and in the process develop complex processes to secure best value. Increasingly procurement will look to ISPs and be suspicious of direct sourcing.
• The whole emerging markets situation will push major change all round the world. • The internet will play a significant role going forward; LinkedIn and others have yet to develop
how best to use the internet for career development. • Communities of Interims will increase. These communities have established C level
relationships and will self refer.
Series1, It will go back to
normal, 16%
Series1, Similar but
with modiNications,
55%
Series1, There will be many changes, 25%
Series1, Everything is going to
change, 5%

35
Networking What is your general approach to face-to-face networking?
Identified as a key part of directly sourcing assignments, there are very few who embrace it with outright enthusiasm (4%). Yet 79% view it either positively or at least neutrally. At a networking event, how 'good at networking' are you?
When assessing how good they are at networking, the Interims surveyed felt there are good or at least ok (88%) at networking, but ‘Master’s’ are very rare (only 1%).
Series1, Enthusiastic,
4%
Series1, Positive, 30%
Series1, Neutral, 49%
Series1, Necessary evil, 14%
Series1, Don't want, don't need, 3%
Series1, Master of the event, 1%
Series1, Good networker,
31%
Series1, OK networker,
57%
Series1, Poor networker,
9% Series1, Wall Nlower, 2%

36
What features are important at a networking event?
The top chosen feature is having a range of attendees to network with (37%). Having access to the guest list is second (28%) A presenter and locality were rated as less important (22% & 13%)
Series1, A range of attendees, 37%
Series1, An 'open' guest list, 28%
Series1, Speaker/
presentation, 22%
Series1, Local to where I live, 13%
37
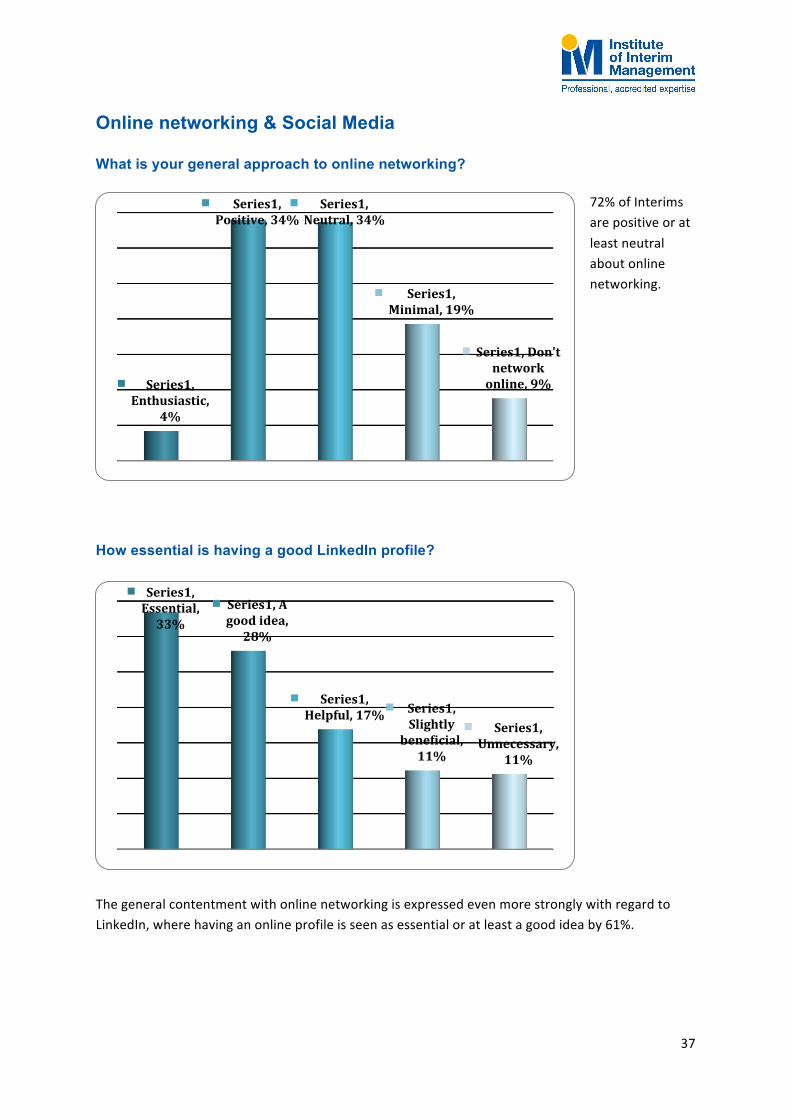
Online networking & Social Media What is your general approach to online networking?
72% of Interims are positive or at least neutral about online networking.
How essential is having a good LinkedIn profile?
The general contentment with online networking is expressed even more strongly with regard to LinkedIn, where having an online profile is seen as essential or at least a good idea by 61%.
Series1, Essential, 33%
Series1, A good idea, 28%
Series1, Helpful, 17% Series1,
Slightly beneNicial, 11%
Series1, Unnecessary,
11%
Series1, Enthusiastic,
4%
Series1, Positive, 34%
Series1, Neutral, 34%
Series1, Minimal, 19%
Series1, Don't network online, 9%

38
How essential is having your own ‘Interim Management’ website?
By contrast, the trend points to it being ‘not essential’ for an Interim to have their own website, with 46% viewing this is unnecessary or only slightly beneficial. Interim Management LinkedIn groups In all fairness, the IIM’s LinkedIn group topping the Interim group section of the IIM’s own Interim survey, probably requires taking with a ‘pinch of salt’ to avoid accusations of ‘Insider dealing’. Nearly 2,000 votes were cast for these different groups, so pleasing nonetheless. Perhaps another survey will pick up this question to provide independant validation. 7 Interim groups with 1,000+ members gained ratings of 3.00 and better. (Rating scale ‘Great-5’, ‘Good-4’, ‘OK-3’, ‘Poor-2’, ‘Rubbish’)
Ranking Interim Management LinkedIn group Score Votes 1 Interim Management -‐ IIM 3.88 621 2 Executive Interim Network 3.30 337 3 UK Interim Management 3.21 270 4 Interim Management Jobs.net 3.20 335 5 Public Sector IM Jobs Board 3.10 189 6 International Interim & Temp Mgt 3.02 133 7 Interim CFO & Controller 3.00 93
Series1, Essential, 14%
Series1, A good idea, 24%
Series1, Helpful, 18%
Series1, Slightly beneNicial, 19%
Series1, Unnecessary,
27%

39
Prospective Interims This section of questions were asked of only those individuals considering an Interim Management career and their answers were as follows: Why are you considering 'Interim Management'?
Whilst 19% of prospective Interims cite the ending of employment as a trigger, 68% give ‘professional and lifestye’ choices as the principal driver. Variety (34%) and flexibility (22%) being most favoured. Where do you expect to source assignments?
Prospective Interims dominantly forsee Service Providers as their initial assignment source (89%).
Series1, Want Interim variety,
34%
Series1, Want Nlexibility, 22%
Series1, Out of work (was
employed), 19% Series1, Want to work for self,
12% Series1,
Financially lucrative, 10%
Series1, Other, 4%
Series1, Service
Providers, 89%
Series1, Prior work
contacts, 28%
Series1, New direct clients,
24%
Series1, Don't know, 4%
40
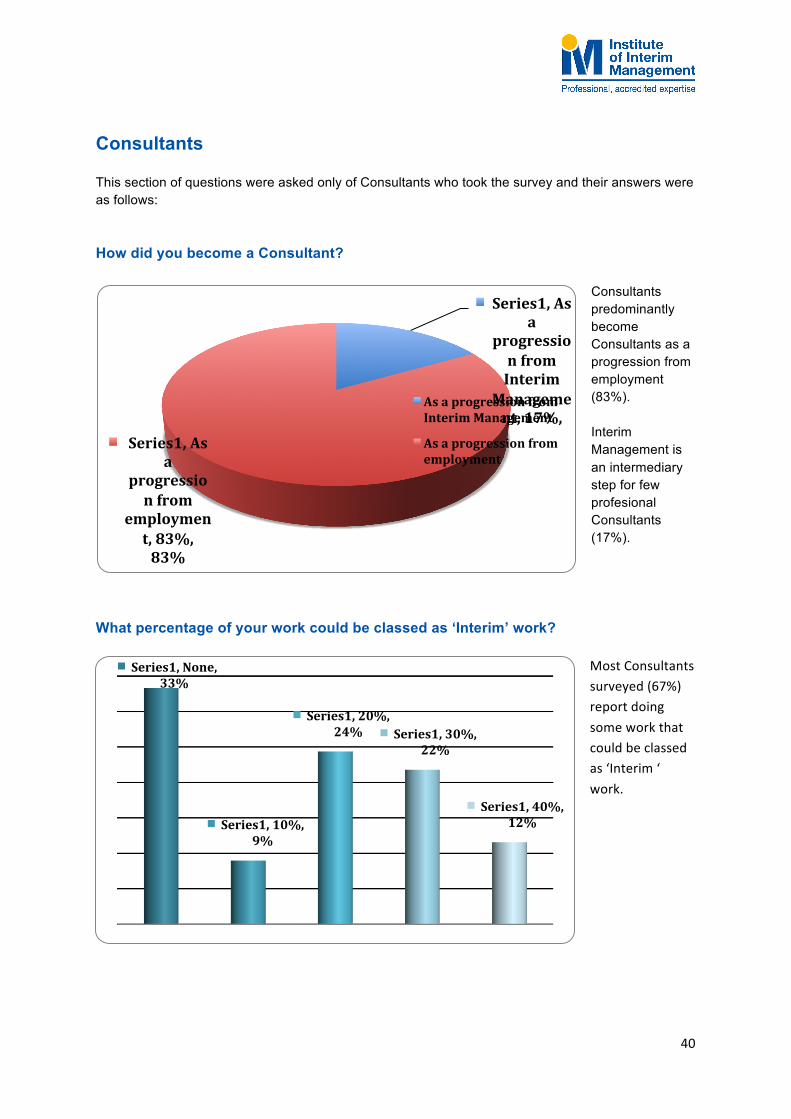
Consultants This section of questions were asked only of Consultants who took the survey and their answers were as follows: How did you become a Consultant?
Consultants predominantly become Consultants as a progression from employment (83%). Interim Management is an intermediary step for few profesional Consultants (17%).
What percentage of your work could be classed as ‘Interim’ work?
Most Consultants surveyed (67%) report doing some work that could be classed as ‘Interim ‘ work.
Series1, As a
progression from Interim
Management, 17%,
Series1, As a
progression from
employment, 83%, 83%
As a progression from Interim Management
As a progression from employment
Series1, None, 33%
Series1, 10%, 9%
Series1, 20%, 24% Series1, 30%,
22%
Series1, 40%, 12%

41
Interims and Consultancy These questions about Consultancy work were asked only of the Interim Managers who took the survey and their answers were as follows: Interims: What percentage of your work could be classed as ‘Consultancy’?
Most Interims surveyed (61%) do some form of ‘Consultancy’ alongside or within their Interim assignments. Of those who do, it represents, on average 20% of their business. Are you doing more consultancy than a year ago?
Series1, Same, 53%
Series1, Yes, more, 23%
Series1, No, less, 24%
Series1, None, 39%
Series1, 10%, 25%
Series1, 20%, 21%
Series1, 30%, 9% Series1, 40%,
7%

42
The data suggests no overall shift in the interim / consultancy balance of those Interims surveyed.
Service Providers This section of questions were asked only of Service Providers who took the survey and their answers were as follows: How do you view the state of the 'Interim Market' in recent times? ¬ Service Providers gave survey data indicating the vigor of the Interim market from 2007 onwards.For Service Providers, 2007 was a Boom-time/Busy. Vigor slid from 2008, dropping toward Sluggish/Dead in Q2 & Q3 2009. Sluggish domonated the voting for 2010. Despite optimistic noises. Boom-time Busy Steady Sluggish Dead Looking forward, how active do you expect the 'Interim Market' to be? ¬ Many Interims are still viewing the market as firmly sluggish (54%), though if the recovery is happening, then Service Providers are likely to see the leading edge of that recovery before most Interims. Providers predict 2011 as returning to Steady business. Boom-time Busy Steady Sluggish Dead

43
What percentage margin are you typically making from an Interim placement?
Margins are running from 10-‐40%. The bulk of the margin percentages are between 15-‐25%. Current ‘average margin’ is 21.3%
How has your typical margin changed over the last year?
The margin drop from 2008/9 to 2009/10 was an average of 5.1% This puts the average Service Provider margin in 2008/9 at 26.4%. 26% kept their margin steady (or grew it) in 2009/10
Series1, 10-‐15%, 7%
Series1, 15-‐20%, 38%
Series1, 20-‐25%, 38%
Series1, 25-‐30%, 10%
Series1, 30-‐35%, 2%
Series1, 35-‐40%, 5%
21% 24%
29%
Series1, same, 24%
Series1, +0-‐5%, 2%

44
Are 'career' Interims more likely to be forwarded on a client shortlist, as opposed to Redundant Senior Managers (RSM's)?
Many Interims worry that ‘Redundant Senior Managers’ are getting preferred submission to clients on the basis of cost. To this question, 83% of Service Providers expressed a committment or preference to submit professional Interims to clients. In tough times how supportive do you see most Interim Service Providers are of Interim Managers?
47% viewed the industry as either very or generally supportive. 53% of Service Providers view their industry as offering a real ‘mixed-‐bag’ or worse in its support of
Series1, Push Career
Interims, 44%
Series1, Prefer career Interims, 39%
Series1, Career
Interims & RSM's equal,
17%
Series1, Prefer RSM's,
0% Series1, Push RSM's, 0%
Series1, Very supportive,
14%
Series1, Generally, though some less, 33%
Series1, A real mixed-‐bag,
43%
Series1, Unsupportive
with exceptions,
10%
45
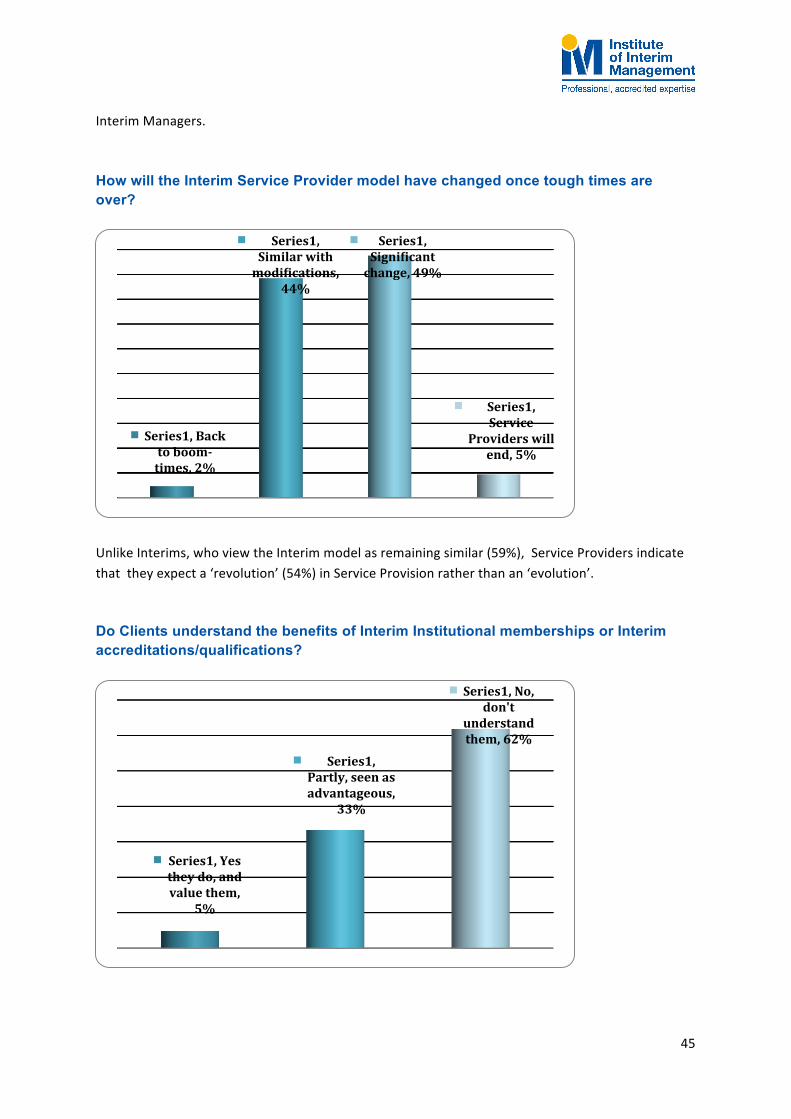
Interim Managers. How will the Interim Service Provider model have changed once tough times are over?
Unlike Interims, who view the Interim model as remaining similar (59%), Service Providers indicate that they expect a ‘revolution’ (54%) in Service Provision rather than an ‘evolution’. Do Clients understand the benefits of Interim Institutional memberships or Interim accreditations/qualifications?
Series1, Back to boom-‐times, 2%
Series1, Similar with modiNications,
44%
Series1, SigniNicant change, 49%
Series1, Service
Providers will end, 5%
Series1, Yes they do, and value them,
5%
Series1, Partly, seen as advantageous,
33%
Series1, No, don't
understand them, 62%

46
62% of Service Providers indicated Clients do not understand and thereby do not value Interim qualifications and/or Institutional memberships. 38% of Service Providers indicated that Clients do value of partly value such accreditations and qualifications.
Final comments 2010 was not the improvement on 2009 that most Interim Managers had hoped for. Signs of improvement are starting to filter through, reported by Service Providers, but many Interim Managers remain severely challenged. Day rates reduced, as did average billing days and assignment gaps lengthened. No individual factor fell away severely, but the cumulative effect can be toxic, particularly on those with dininished financial buffers. It remains a fractured and inconsistent market, yet there is optimism for 2011 and beyond. Despite all the gloom, career Interim Managers remain overwhelmingly supportive of the Interim concept, with work variety and flexibility being key reasons for ‘going Interim’. Most Interims see the ‘Interim Management model as a sustainable model for the future, with some evolutionary modifications. Networking and Online Social Media remain important considerations for Interims, though enthusiasm for these activities remains mixed and the extent to which they should be embraced remains a matter of debate. Service Providers emerge from the downturn battered but with their margins only slightly dimished. Whilst there were certaintly grumbles about some aspects about provision, Interims reported a relatively unchanged relationship with their favourite Service Providers. Service Providers themselves were less confident that the Service Provider model would prevail in the long term without more significant mofication and had mixed feelings about how their industry had supported Interim Managers in recent times. Yet many Service Providers were positively rated by Interim Managers, providing a healthy list of ‘Leading Providers’ as an output of the survey. The final piece of the jigsaw requiring further attention are the Clients. Whith ongoing evidence that many if not most clients fail to understand the Interim Management value proposition and points of differentiation that career Interim Managers offer, it falls to Interim Managers, Service Providers and Interim Management community organisations to share common understanding and work in-step to offer Clients a clear and beneficial picture of the Interim Management offering.
Additional comments from the Winter 2010 ‘Pulse’ update ¬ 2010 remained flat and sluggish through to the end of 2010, with continuing, if slight, downward pressure on day-rates, and days billed. Curiously, both the average assignment length and assignment gap appeared to be lengthening slightly. Whilst ‘green shoots’ were anticpated and talked about, the evidence from Interim Managers and Providers alike remained flat. When improvement comes, Service Providers are likely to see it first, with the net impact on the Interim community following on. This is reflected in the difference between the optimism expressed by Interim Managers and Service Providers: Providers expect 2011 to be

47
‘Steady’ business, increasing to ‘Busy’ by 2013. Interim Managers expected the remainder of 2011 would be required before ‘Steady’ business would be regained.
Institute of Interim Management 2010-11 Acknowledgements Many hundreds of people contributed to this survey from those who completed it, to those who debated and refined its findings. Particular thanks go the members of the Institute of Interim Management and the members of the ‘Interim Management – IIM’ and other Interim LinkedIn groups, where this survey has, and will doubtless continue to be debated. Institute of Interim Management http://www.iim.org.uk Interim Management – IIM LinkedIn group http://www.linkedin.com/groups?gid=2339933

48
©Institute of Interim Management -‐ Interim Management Survey 2010 – Jan 2011 (version 2.0) http://www.iim.org.uk/interim-‐survey/