iins, ft-ir and dft study of the internal dynamics of [4
TRANSCRIPT
Vol. 113 (2008) ACTA PHYSICA POLONICA A No. 4
Proceedings of the National Conference on Neutron Scattering and the ComplementaryMethods in the Investigations of the Condensed Phases, Chlewiska 2007
IINS, FT-IR and DFT Study of the
Internal Dynamics of [4-apyH][SbCl4]
K. HoÃlderna-Natkanieca,b,∗, I. Natkaniecc,b, E. Mikulid,
J. Swiergiela, V.D. Khavryutchenkoe and R. Jakubasf
aInstitute of Physics, A. Mickiewicz UniversityUmultowska 85, 61-614 Poznan, Poland
bFrank Laboratory of Neutron Physics, JINR, Dubna 141980, RussiacH. Niewodniczanski Institute of Nuclear Physics, PAS
Radzikowskiego 152, 31-342 Krakow, PolanddDepartment of Chemical Physics, Jagiellonian University
Ingardena 3, 30-060 Krakow, PolandeInstitute of Surface Chemistry, Ukrainian Academy of Science
Kiev, UkrainefFaculty of Chemistry, University of WrocÃlaw
Joliot-Curie 14, 50-383 WrocÃlaw, Poland
Dedicated to Professor Jerzy Janik on the occasion of his 80th birthday
A combination of infrared and inelastic incoherent neutron scattering
spectroscopies with the density functional theory and semi-empirical calcu-
lations was applied to propose an assignment of the vibrational spectra of
4-aminopyridine chloroantimonate(IV).
PACS numbers: 78.70.Nx, 33.20.Ea, 77.84.–s, 31.15.E–
1. Introduction
The subject of our investigation is an ionic-molecular crystal built of theorganic 4-aminopyridine cation [4-apyH]+ and the inorganic anion [SbCl4]−. Thecrystal undergoes a few phase transitions at 240/240.5, 248.5/250, 270.5/271,304/304 K, respectively, on the cooling/heating runs. The symmetries of themonoclinic elementary cell in the subsequent phases numbered from V to I onheating are as follows: P21/c ↔ (Cc) ↔ Cc ↔ C2/c ↔ C2/c [1]. The crystal of
∗corresponding author; e-mail: [email protected]
(1117)
brought to you by COREView metadata, citation and similar papers at core.ac.uk
provided by Jagiellonian Univeristy Repository

1118 K. HoÃlderna-Natkaniec et al.
[4-NH2C5H4NH][SbCl4] (abbreviation [4-apyH][SbCl4]) shows ferroelectric prop-erties in the temperature range from 240.5 to 271 K. The crystalline structure isbuilt of sheets of planar cations [4-apyH]+ separated by the chain of tetrahedralanions [SbCl4]−. The [4-apyH]+ cation is surrounded by a few anions and someclose contact interactions of the hydrogen bridge type can be distinguished [2–8].Although the hydrogen atoms of NH2, CH, and NH+ groups were in close contactwith the anion, the strongest hydrogen bridge bond is formed between the imide(NH+) group and the anion. The strongest interaction is modelled in our study.
The molecular dynamics of the crystal was studied by the neutron and theinfrared (IR) spectroscopies. The neutron vibrational spectra give the frequenciesand intensities of all normal modes; their intensities were proportional to thedisplacement of each atom performing the vibrations and the incoherent cross--section for scattered nucleus (value of incoherent cross-section of proton is severaltimes greater than that of nitrogen or carbon atoms, building the cation stu-died [9]). The IR intensity is proportional to the changes in the electrical dipolemoment of the molecule.
To make the assignment of the subsequent bands in the spectra, the struc-ture of the simple complex was optimised and the frequencies and intensities ofthe normal modes were calculated by the density functional theory (DFT) [10]and semi-empirical PM3 [11] methods. The interaction N1–H+. . .Cl is the short-
Fig. 1. Structure of the isolated molecule of [4-apyH][SbCl4] with the atom numbering
scheme [2–8].
est one, according to crystallographic data [2]. Therefore, the optimisation of thecomplex structure was performed, where this bridge is responsible for the inter-action between the cation and the anion. The structure of the complex with theatom numbering system is presented in Fig. 1.
2. MethodThe inelastic incoherent neutron scattering (IINS) spectra of the crystal
studied were recorded as a function of the incident neutrons wavelength at differ-ent temperatures on a NERA-PR spectrometer in Dubna, co-working with a pulse

IINS, FT-IR and DFT Study of the Internal Dynamics . . . 1119
reactor IBR-2 [12]. The Fourier transform infrared (FT-IR) absorption measure-ments were performed on a Bruker-EQUINOX 55 Fourier transformed infraredspectrometer.
The quantum mechanical calculation of the frequency and intensity of normalmodes were performed by semi-empirical method as less time consuming, and bythe density functional theory method using Gaussian 03 package [13].
3. Results and discussion
The IINS spectra of the crystal studied were recorded as a function of thewavelength of the incident neutrons at 20, 240, 260, and 290 K. The IINS spectrawere converted into the phonon density of states spectra Gexp(ν) as shown inFig. 2.
Fig. 2. Phonon density of state spectra of [4-apyH][SbCl4] obtained at different temper-
atures after transformation of the IINS spectra in one phonon scattering approximation,
Gexp(ν).
The low temperature Gexp(ν) spectra show a well separated band above theenergy gap of 240–350 cm−1, but below 700 cm−1. Its band width is close to theresolution power of the spectrometer. When the energy transfer increased, theintensity of selected bands as well as resolution power decreased [14, 9] accordingto the scattering law. In the low temperature Gexp(ν) spectra one may distinguishwell separated bands at 230.4, 407.8, 510.0, 544.8, 800.5 cm−1. Although onheating the intensity of the bands decreased, at room temperature the latticebranch and internal normal vibrational modes can be separated.
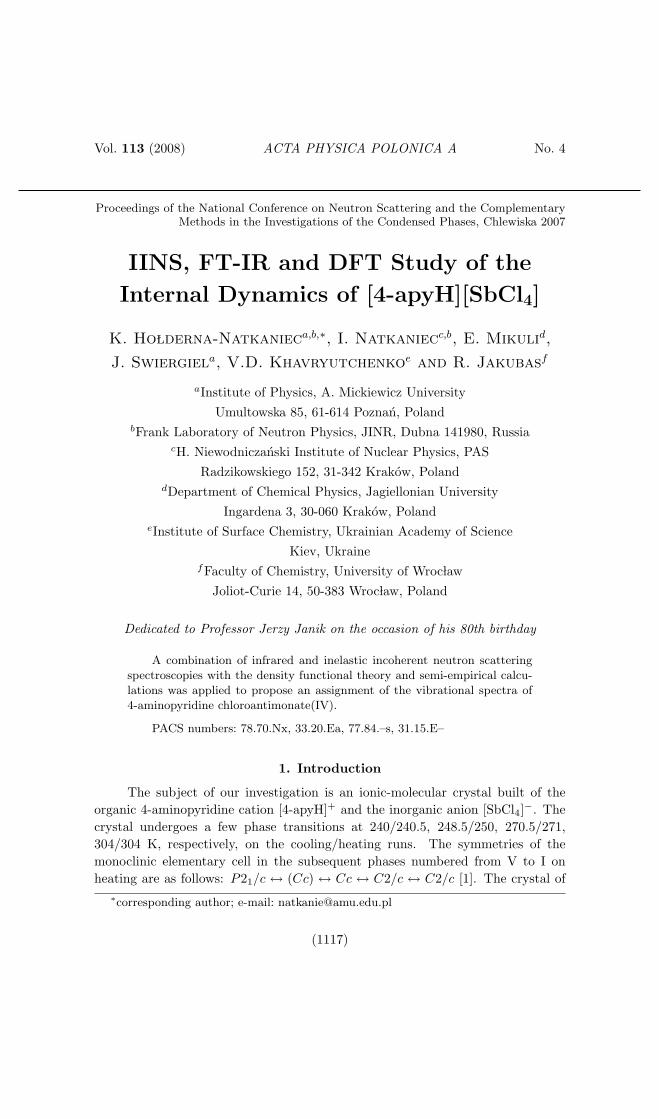
The FT-IR spectrum measured at 20 K (in nujol) is shown in the wavenumber range from 450 to 3500 cm−1 in Fig. 3. As in the range from 1750 to2580 cm−1 no bands were observed, this part of the spectrum was neglected.
1120 K. HoÃlderna-Natkaniec et al.
Fig. 3. FT-IR spectra of [4-apyH][SbCl4] recorded in nujol at 20 K.
The structures of the [4-apyH]+ cation and the [4-apyH][SbCl4] complexwere optimised by different quantum mechanical methods [10, 11, 13]. The struc-ture of the isolated [4-apyH]+ cation was optimised by the B3LYP/6-311G∗∗
method, while the structure of the complex — by the semi-empirical PM3 andB3LYP/LanL2Dz methods. The optimised structure of the complex obtained bythe semi-empirical method is close to that determined by the X-ray studies [2]; thecalculated angle N1–Cl–Sb is 91◦ while X-ray data give 93◦. The bond length andinternal angles of the skeleton of the optimised structures are collected in Table I.The data are also compared with the X-ray diffraction structure determined at100 K [2].
The values of RMS∗ were calculated in order to compare the structure of the[4-apyH]+ cation optimised by different methods with the X-ray data, accordingto the formula
RMS =
√∑(xcal − xexp)2
n,
where xcal and xexp are the calculated and experimental data, respectively. Theyare 0.008 A and 0.16◦ for the bond length and internal angles, respectively. On theother hand, the RMS were also calculated to compare the bond lengths and anglesof the [4-apyH][SbCl4] complexes optimised by the B3LYP/LanL2Dz and PM3methods with the experimental X-ray data; then the RMS values are: 0.074 A,2.06◦ and 0.112 A, 6.86◦, respectively. Therefore, the optimisation of the skeletonstructure of the studied complex of [4-apyH][SbCl4] by the DFT method gives abetter approximation of its internal structure.
Then the frequencies and intensities of normal modes in the vibrational spec-trum were calculated by quantum chemistry (QC) methods. Figure 4 shows acomparison of the low-temperature Gexp(ν) spectrum and the calculated one.

IINS, FT-IR and DFT Study of the Internal Dynamics . . . 1121
TABLE I
Geometry of [4-apyH]+ and [4-apyH][SbCl4] complex.
Bond length
[4-apyH][SbCl4] [A] [4-apyH]+ [A]
Bond X-ray B3LYP/ B3LYP/
diffraction LanL2Dz PM3 6-311G∗∗
(100 K) [2]
N1-C2 1.356 1.362 1.372 1.358
C2-C3 1.353 1.385 1.383 1.364
C3-C4 1.419 1.428 1.412 1.423
C4-C5 1.411 1.422 1.410 1.423
C5-C6 1.365 1.386 1.384 1.364
C6-N1 1.351 1.362 1.371 1.358
N2-C4 1.344 1.369 1.400 1.336
Sb1-Cl1 2.383 2.515 2.322
Sb1-Cl2 2.683 2.815 2.336
Sb1-Cl3 2.618 2.544 2.539
Sb1-Cl4 2.378 2.512 2.342
RMS ≈ 0.074 ≈ 0.112 RMS∗ ≈ 0.008
Internal angles
[4-apyH][SbCl4] [◦] [4-apyH]+ [◦]
Internal angles X-ray B3LYP/ B3LYP/
diffraction LanL2Dz PM3 6-311G∗∗
(100 K) [2]
N1-C2-C3 120.75 120.64 121.08 120.61
C2-C3-C4 119.85 119.63 119.55 119.95
C3-C4-C5 117.72 117.93 118.67 117.44
C4-C5-C6 119.76 119.57 119.67 119.95
C5-C6-N1 120.57 120.67 120.96 120.61
C6-N1-C2 121.32 121.55 120.06 121.43
C3-C4-N2 121.07 121.05 120.54 121.28
C5-C4-N2 121.21 121.02 120.61 121.28
Cl1-Sb1-Cl2 88.77 86.02 100.80
Cl1-Sb1-Cl3 89.73 92.56 101.42
Cl1-Sb1-Cl4 92.57 96.73 94.25
Cl2-Sb1-Cl3 173.93 172.76 157.26
Cl2-Sb1-Cl4 86.70 85.90 93.24
Cl3-Sb1-Cl4 87.49 82.54 80.34
RMS ≈ 2.06 ≈ 6.86 RMS∗ ≈ 0.16

1122 K. HoÃlderna-Natkaniec et al.
Fig. 4. The phonon density of state spectra of [4-apyH][SbCl4] obtained at 20 K after
transformation of the IINS spectra in one phonon scattering approximation Gexp(ν).
The Gcal(ν) spectra of [4-apyH]+ calculated by DFT method B3LYP/6-311G∗∗. The
Gcal(ν) spectra of [4-apyH][SbCl4] calculated by B3LYP/LanL2Dz and semi-empirical
PM3 methods; each calculated band is convoluted with the resolving power of the NERA
spectrometer.
Table II collects the frequencies of the bands obtained by the neutronGexp(ν) and FT-IR spectroscopy at 20 K, as well as the frequencies of normalmodes calculated by the PM3 and B3LYP/LanL2Dz for the complex and also byB3LYP/6-311G∗ for the [4apy-H] cation (columns: A — Frequencies of IINS at

IINS, FT-IR and DFT Study of the Internal Dynamics . . . 1123
TABLE II
Comparison of the experimental and calculated fre-
quencies of normal modes by different QC methods of
[4-apyH][SbCl4] complex.
A D E Assignment and potential energy
distribution (PED) [%]
δ[Cl3-Sb1-Cl1] 35%
δ[Cl3-Sb1-Cl2] 20%
17.3 23.7 δ[Cl4-Sb1-Cl2] 14%
δ[Cl1-Sb1-Cl2] 11%
χ[N1-Cl3] 6%
χ[Cl3-Sb1] 61%
23.3 42.6 χ[N1-C2] 7%
χ[N1-C6] 6%
δ[Cl4-Sb1-Cl2] 5%
δ[C2-N1-Cl3] 29%
35.8 33.6 51.3 δ[C6-N1-Cl3] 27%
χ[Cl3-Sb1] 14%
δ[N1-Cl3-Sb1] 5%
χ[N1-Cl3] 69%
52.7 46.6 56.4 χ[N1-C2] 9%
χ[N1-C6] 7%
δ[N1-Cl3-Sb1] 25%
δ[Cl3-Sb1-Cl4] 19%
60.8 47.3 75.5 δ[Cl4-Sb1-Cl2] 9%
δ[C2-N1-Cl3] 7%
δ[C6-N1-Cl3] 7%
δ[Cl1-Sb1-Cl2] 32%
70.9 73.7 89.6 δ[Cl4-Sb1-Cl2] 22%
δ[Cl3-Sb1-Cl1] 14%
δ[N1-Cl3-Sb1] 9%
88.5 84.4 105.8 δ[Cl4-Sb1-Cl1] 88%
100.5 113.5 124.4 δ[Cl4-Sb1-Cl2] 63%
δ[Cl3-Sb1-Cl4] 21%
117.5 119.1
20 K [cm−1], B — Wave numbers of IR at 20 K [cm−1], C — Frequencies of[4-apyH]+ by B3LYP/6-311G∗∗ [cm−1], D — Frequencies of [4-apyH][SbCl4] byB3LYP/LanL2Dz [cm−1], E — Frequencies of [4-apyH][SbCl4] by PM3 [cm−1]).The assignment of the bands in the phonon density of state spectrum was predicted

1124 K. HoÃlderna-Natkaniec et al.
TABLE II (cont.)
A C D E Assignment
and PED [%]
ν[Cl3-Sb1] 56%
129.6 128.0 201.6 ν[N1-Cl3] 10%
δ[N1-Cl3-Sb1] 9%
χ[C3-C4] 31%
χ[C4-C5] 31%
160 179.4 211.9 ρ[C3-C4-N2] 11%
ν[Cl3-Sb1] 6%
ρ[C4-C5-C6] 6%
ν[N1-Cl3] 50%
230.4 192.7 190.2 309.9 ν[Cl3-Sb1] 11%
ν[Sb1-Cl4] 9%
ν[Sb1-Cl2] 8%
320.9 225.9 332.5 ν[Sb1-Cl2] 83%
ν[Cl3-Sb1] 9%
282.7 338.4 ν[Sb1-Cl4] 80%
ν[Sb1-Cl1] 11%
χ[C4-N2] 58%
291.1 345.5 χ[C2-C3] 13%
χ[C6-C5] 12%
349.3 304.7 347.7 ν[Sb1-Cl1] 83%
ν[Sb1-Cl4] 9%
χ[C2-C3] 32%
χ[C6-C5] 31%
407.8 397.7 389.2 400.2 χ[C4-N2] 10%
χ[N1-C2] 8%
χ[N1-C6] 5%
δ[C3-C4-N2] 34%
418.3 415.3 421.6 415.9 δ[N2-C4-C5] 34%
χ[C6-C5] 7%
χ[C2-C3] 7%
ρ[C3-C4-N2] 48%
471.5 445.1 482.2 485.2 χ[N1-C6] 18%
χ[N1-C2] 17%
χ[C6-C5] 6%
by the PM3 method. According to the results of the calculations, performed bythe PM3 and B3LYP/6-311G∗∗ methods, the bands at the low neutron energytransfer (in the lattice branch) of the Gexp(ν) spectrum can be interpreted as the

IINS, FT-IR and DFT Study of the Internal Dynamics . . . 1125
TABLE II (cont.)
A B C D E Assignment
and PED [%]
ν[N1-Cl3] 21%
δ[C3-C4-C5] 20%
510.4 502 504.4 521.2 579.6 ν[C4-N2] 13%
δ[C2-C3-C4] 7%
δ[C4-C5-C6] 7%
δ[N1-C6-C5] 20%
544.8 526 531.8 543.7 635.8 δ[N1-C2-C3] 19%
532.6 δ[C4-C5-C6] 18%
δ[C2-C3-C4] 17%
χ[C6-C5] 30%
575.3 653.9 χ[C2-C3] 28%
ρ[C3-C4-N2] 24%
δ[C4-N2-H] 16%
δ[C4-N2-H] 13%
642-648 665.2 668.2 715.5 ρ[C3-C4-N2] 11%
δ[H-N2-H] 11%
χ[N1-C2] 8%
δ[C4-N2-H] 16%
725.9 725 701.6 745.6 793.1 δ[C4-N2-H] 16%
768 723.1 ν[C4-N2] 12%
δ[H-N2-H] 11%
ρ[C4-C5-C6] 10%
ρ[C2-C3-C4] 31%
ρ[N1-C2-C3] 25%
800.5 792 839.8 850.9 864.8 χ[N1-C2] 13%
ρ[C4-C5-C6] 12%
χ[C3-C4] 7%
δ[C2-N1-C6] 14%
854.7 866 853.5 859.6 905.4 δ[N1-C2-C3] 11%
855.3 δ[N1-C6-C5] 11%
ν[C4-N2] 10%
ν[N1-Cl3] 7%
ρ[C4-C5-C6] 38%
χ[N1-C6] 14%
874.3 870.0 918.3 ρ[C3-C4-N2] 11%
ρ[N1-C6-H] 9%
ρ[C2-C3-C4] 8%

1126 K. HoÃlderna-Natkaniec et al.
TABLE II (cont.)
A B C D E Assignment
and PED [%]
925.7 974 985.2 982.3 1004.7 χ[C2-C3] 29%
994.8 983 986.5 ρ[C2-C3-C4] 28%
997 ρ[N1-C2-C3] 25%
ρ[N1-C6-H] 33%
1010.6 1018.3 χ[C6-C5] 28%
ρ[C4-C5-C6] 21%
χ[N1-C6] 8%
δ[N1-C2-H] 18%
δ[N1-C6-H] 11%
1013.3 1018.8 1042.5 ν[C3-C4] 10%
δ[C3-C2-H] 8%
δ[C4-C5-H] 7%
δ[C4-N2-H] 36%
1059±10 1025 1038.4 1048.2 1061.0 δ[C4-N2-H] 35%
ν[C4-C5] 8%
ν[C4-N2] 12%
δ[C3-C2-H] 10%
1079 1059.6 1072.1 1114.7 ν[N1-C2] 9%
ν[N1-C6] 8%
δ[H-C6-C5] 6%
δ[H-C6-C5] 12%
δ[N1-C6-H] 10%
1126±10 1101 1101.0 1122.6 δ[C2-C3-H] 10%
δ[C4-C3-H] 9%
δ[C6-C5-H] 9%
δ[C6-C5-H] 21%
δ[C4-C5-H] 20%
1218±15 1143.1 1150.8 1159.5 δ[C2-C3-H] 13%
δ[C4-C3-H] 12%
δ[N1-C2-H] 11%
deformation in-plane, torsional out-of-plane, or stretching vibrations of the anion[SbCl4]−.
The band observed at 230.4 cm−1 can be interpreted according to thePM3 calculation results as the stretching vibrations ν [N1. . . Cl3], ν [Cl3–Sb1],ν [Sb1–Cl4], ν [Sb1–Cl2], but the first internal torsional out-of-planemode of cation is given at 211.9 cm−1. The calculations performed by

IINS, FT-IR and DFT Study of the Internal Dynamics . . . 1127
QC/B3LYP/LanL2Dz and B3LYP/6-311G∗∗ methods predict it at 190.2 and192.7 cm−1, respectively. However, a comparison of the vibrational spectrumcalculated for the isolated cation of [4-apyH]+ and the experimental neutron scat-tering ones permits concluding that the strong band at 230 cm−1 observed in thelattice branch is an internal mode of the cation.
The most intense band in the low-temperature phonon density of state spec-trum Gexp(ν) of [4-apyH][SbCl4] appears at the energy transfer of 407.8 cm−1.On the basis of the PM3 calculations the band at 400.2 cm−1 is assigned asthe out-of-plane torsion of the 4-aminopyridinum cation: χ [C4–N2], χ [N1–C2],χ [N1–C6], χ [C2–C3], χ [C6–C5]. The DFT methods predict this band at 389.2and 397.7 cm−1 for the complex, which is presented in Fig. 1, and for the isolatedcation, respectively.
Another intense band is observed in the Gexp(ν) spectrum at the energytransfer of 544.8 cm−1. The PM3 calculations predict a band at 635.8 cm−1
which may be interpreted as the deformation in-plane: δ [N1–C6–C5], δ [N1–C2–C3], δ [C4–C5–C6], δ [C2–C3–C4]. According to this assignment, the intenseGexp(ν) band in the low-temperature spectrum is related to the dynamics of theN(1)H+ group and therefore its intensity should decrease on heating. The B3LYP/6-311G∗∗ calculations predict it at 531.8 and 532.6 cm−1 , while B3LYP/LanL2Dz— at 543.7 cm−1. Intermolecular interactions of hydrogen bridge bond type be-tween the donor –N+H group and the acceptor take place in the crystal. Theyinfluence the internal structure of the cation; consequently, the frequencies of in-ternal normal modes in the cation and in the complex are different.
The subsequent band appears at 645 cm−1. The PM3 calculation givesthe normal mode at 715.5 cm−1 which may be assigned as deformational in-planeδ [C4–N2–H], δ [H–N2–H], out-of-plane torsion vibration of the 4-aminopiridiniumcation χ [N1–C2] and out-of-plane vibration ρ [C3–C4–N2]. According to theB3LYP/LanL2Dz and B3LYP/6-311G∗∗ calculations they are at 668.2 cm−1 and665.2 cm−1, respectively.
Another intense band is observed in the Gexp(ν) spectrum at the energytransfer 800.5 cm−1. On the basis of the PM3 calculations the band at 864.8 cm−1
is assigned as the out-of-plane vibration of the 4-aminopyridinum cation: ρ [C2–C3–C4], ρ [N1–C2–C3], ρ [C4–C5–C6] and the torsional out-of-plane χ [N1–C2],χ [C3–C4]. The calculations for the [4-apyH][SbCl4] complex and for the isolatedcation predict this band at 850.9 and 839.8 cm−1, respectively.
The vibrational spectra calculated by QC methods also permit analysis ofthe normal modes in IR spectra. Figure 5 presents a comparison of the spectrumrecorded experimentally at 20 K and that calculated by the B3LYP/LanL2Dzmethod. The frequencies of the observed normal modes (from neutron scatteringas well as from IR data) and the unscaled calculated frequencies for 67 vibrationalnormal modes are plotted in Fig. 6. The slope of this dependence is 0.998. It maybe noted that the deviations of the experimental frequencies from the calculated

1128 K. HoÃlderna-Natkaniec et al.
Fig. 5. Infrared absorbance of [4-apyH][SbCl4] obtained at 20 K and bars calculated
by QC method B3LYP/LanL2Dz.
Fig. 6. Comparison of frequencies of normal modes obtained experimentally by neutron
and IR methods (symbols). The lines were obtained after linear fit of both results.
ones are within several percents. The effect of vibrational anharmonicity seems tobe negligible. The stretching modes are mainly red shifted, as shown in Figs. 5and 6, because of the hydrogen bridge interaction. Also these stretching vibrationsν [N–H] at 2986, 3216, 3328, and 3429 cm−1 at 20 K undergo shifting on heating[15]. The observed changes in the intensity of Gexp(ν) and the temperature shift ofthe IR bands at 502, 790, 1194, 2986, 3216, 3329 cm−1 [15] indicate an importantrole of the N–H—Cl interactions.

IINS, FT-IR and DFT Study of the Internal Dynamics . . . 1129
4. Summary
Using the ab initio and semi-empirical calculations the influence of theN1–H. . . Cl(3) hydrogen bridge interactions in [4-apyH][SbCl4] on the vibrationalspectra has been studied. According to the X-ray data, the bond is nearly linear,the characteristic N1–H. . . Cl angle is 172.39◦, and its length is 3.267 A [2]. Thegeometries of the complex, the strongest interaction in it and vibrational frequen-cies have been obtained. The semi-empirical calculations give the structure of thecomplex analysed close to that following from the X-ray diffraction study. Theinfluence of the hydrogen bridge on the internal structure and the vibrational spec-tra (Gexp(ν) and FT-IR absorbance) has been determined. The observed decreasein the intensity of selected normal modes in the Gexp(ν) spectra on heating hasbeen interpreted as corresponding to the increasing dynamics of protons.
Acknowledgments
Financial support under the grant of the Polish Plenipotentiary at JINR isgratefully acknowledged by the authors. The calculations were performed at thePCSC in Poznan.
References
[1] R. Jakubas, Z. Ciunik, G. Bator, Phys. Rev. B 67, 024103 (2003).
[2] CCDC No. 185826–185828. Copies of this information may be obtained free of
charge from the Director, CCDC, 12 UNION Road, Cambridge CB2 1EZ, UK
(e-mail: [email protected] or http:////www.ccdc.cam.ac.uk).
[3] F.H. Allen, Acta Crystallogr. B 58, 380 (2002).
[4] I.J. Bruno, J.C. Cole, P.R. Edgington, M. Kessler, C.F. Macrae, P. McCabe,
J. Pearson, R. Taylor, Acta Crystallogr. B 58, 389 (2002).
[5] C.F. Macrae, P.R. Edgington, P. McCabe, E. Pidcock, G.P. Shields, R. Taylor,
M. Towler, J. van de Streek, J. Appl. Crystallogr. 39, 453 (2006).
[6] I.J. Bruno, J. Cole, J.P.M. Lommerse, R.S. Rowland, R. Taylor, M. Verdonk, J.
Comput. Aid. Mol. Des. 11, 525 (1997).
[7] I.J. Bruno, J.C. Cole, M. Kessler, J. Luo, W.D.S. Motherwell, L.H. Purkis, B.R.
Smith, R. Taylor, R.I. Cooper, S.E. Harris, A.G. Orpen, J. Chem. Inf. Comp.
Sci. 44, 2133 (2004).
[8] M.L. Verdonk, J.C. Cole, R. Taylor, J. Mol. Biol. 289, 1093 (1999).
[9] Neutron Data Booklet, Eds. A.J. Dianoux, G. Lander, ILL Neutrons for Sciences,
Grenoble 2003.
[10] A.D. Becke, J. Chem. Phys. 97, 9173 (1992); J. Chem. Phys. 98, 5648 (1993);
C. Lee, W. Yang, R.G. Parr, Phys. Rev. B 37, 785 (1988).
[11] I.J.P. Stewart, J. Mol. Model. 10, 155 (2004); J. Comp. Chem. 12, 320 (1991),
ibid. 10, 209 (1989); 10, 221 (1989); V.D. Khavryutchenko, COSPECO Complex
Program for Vibrational Spectroscopy, Institute of Surface Chemistry, Ukrainian
Academy of Sciences, Kiev 1990.

1130 K. HoÃlderna-Natkaniec et al.
[12] I. Natkaniec, S.I. Bragin, J. Brankowski, J. Mayer, in Proc. ICANS XII Meeting,
Abington 1993, Vol. I, 1994, RAL Report, 94-025, I, p. 89.
[13] M.J. Frish, G.W. Trucks, H.B. Schlegel, G.E. Scuseria, M.A. Robb, J.R. Cheese-
man, V.G. Zakrzewski, J.A. Montgomery, R.E. Stratmann, J.C. Burant, S. Dap-
prich, J.M. Millam, A.D. Daniels, K.N. Kudin, M.C. Strain, O. Farkas, J. Tomasi,
V. Barone, M. Cossi, R. Cammi, B. Mennucci, C. Pomeli, C. Adamo, S. Clifford,
J. Ochterski, G.A. Patersson, P.Y. Ayala, Q. Cui, K. Morokuma, D.K. Malick,
A.D. Rabuck, K. Raghavachari, J.B. Foresman, J. Cioslowski, J.V. Ortiz, B.B. Ste-
fanov, G. Liu, A. Liashenko, P. Piskorz, I. Komaromi, R. Gomperts, R.L. Martin,
D.J. Fox, T. Keith, M.A. Al-laham, C.Y. Peng, A. Nanayakkara, C. Gonzalez,
M. Challacombe, P.M.W. Gill, B.G. Johnson, W. Chen, M.W. Wong, J.L. An-
dres, M. Head-Gordon, E.S. Replogle, J.A. Pople, GAUSSIAN 03, Gaussian, Inc.,
Pittsburgh PA, 2003.
[14] W.J. Kazimirov, I. Natkaniec, Preprint P14-2003-48 JINR, Dubna 2003.
[15] K. Holderna-Natkaniec, I. Natkaniec, J. Swiergiel, unpublished results; J. Swier-
giel, Ph.D. Thesis, IF UAM, Poznan 2007.