i'j.,.,-,: electric power system for high altitude … · electric power system for high...
TRANSCRIPT

206337
-.. -" ="--,:./I2/i'J.,.,-,:
c77---
ELECTRIC POWER SYSTEM FOR HIGH ALTITUDE UAV
TECHNOLOGY SURVEY
POWER COMPUTING SOLUTIONS,
2001 Aerospace Parkway
Brook Park, Ohio 44142
INC.
CONTRACT NAS2-96011
NASA Ames Research Center
Moffett Field, California
November 16, 1997
https://ntrs.nasa.gov/search.jsp?R=19980002722 2018-08-07T05:41:38+00:00Z

- Table of Contents
Table of Figures .................................................................................................................... 4
Table of Tables ..................................................................................................................... 5
EXECUTIVE SUMMARY .......................................................................... 7
INTRODUCTION .................................................................................... 8
ENERGY SOURCE TECHNOLOGY SURVEY ................................................ 10
INTRODUCTION ....................................................................................................................... 10
SOLAR CELLS ......................................................................................................................... ! 1
Introduction ........................................................................................................................ 11
Solar Cell Performance ......................................................................................................... 12
Solar Cell Module Performance .............................................................................................. 12
Thin Film Technology ......................................................................................................... 13Cost ................................................................................................................................. 13
Selection ........................................................................................................................... 13REGENERATIVE AND NoN-REGENERATIVE FUEL CELL SYSTEMS ..................................................... 14
Introduction ........................................................................................................................ 14
H:-Air and He-O: PEM Fuel Cell Technology ........................................................................... 14Baseline PEM Fuel Cell Stack Technology .............................................................................. 16
Ancillary Components for Non-Regenerative PEM Fuel Cell Systems .......................................... 17PEAl Fuel Cell Stack Mass and Volume .................................................................................. 17
Fuel Cell Waste Heat and Heat Exchanger ................................................................................ 17
Pressurized Gas Storage Sub-systems ...................................................................................... 18
Cryogenic and Supercritical Storage Sub-systems ...................................................................... 19
Oxygen Recirculation Pump .................................................................................................. 19
Turbochargers for Air Delivery Sub-systems ............................................................................. 19
1t:0 Electrolyzer Technology for Regenerative Fuel Cell Systems ................................................ 19
Unitized Regenerative Fuel Cell / Electrolyzer Technology .......................................................... 20
Water Separator for Regenerative Fuel Cell Systems .................................................................. 20
Photovoltaic Energy Conversion for Electrolyzer Power Source ................................................... 21
Power Conditioning for the Regenerative and Non-Regenerative Fuel Cell Systems ......................... 21Fuel Cell System Performance Estimates ................................................................................. 21
BATTERIES............................................................................................................................. 22
Introduction ........................................................................................................................ 22
Primary Batteries ................................................................................................................. 22
Rechargeable Batteries .......................................................................................................... 23ALUMINUM AND LITHIUM BASED SEMI-CELLS ............................................................................... 25FLYWHEELS ........................................................................................................................... 26
Flywheel Components ......................................................................................................... 26Electric Motor/Generators ................................................................................................... 26Power and Control Electronics ............................................................................................. 27
Bearings ........................................................................................................................ 27Vacuum/Containment ........................................................................................................ 27
Flywheel Energy Storage System Options on the All Electric Aircraft ........................................... 28
Load-Leveling Systems ........................................................................................................ 28
Flywheel Batteries ............................................................................................................... 28Performance .................................................................................................................... 28
Flywheel Evaluation ............................................................................................................ 29Efficiency ....................................................................................................................... 29Cycle and Calendar Life ...................................................................................................... 29Cost .............................................................................................................................. 30
Power Computing Solutions, Inc. NAS2-96011 2

Safety ............................................................................................................................ 30Environmental Interactions ................................................................................................. 30
Flywheel Choice .............................................................................................................. 31
Flywheel Scaling ................................................................................................................ 31
DRIVE SYSTEM TECHNOLOGY SURVEY ................................................... 3 1
PROPELLERS ........................................................................................................................... 31
History. ............................................................................................................................. 32
Condor .......................................................................................................................... 32
Perseus A ........................................................................................................................ 32
Pathfinder ....................................................................................................................... 33
Grob EGRET]" .................................................................................................................. 33
Propeller Concepts and Operation ........................................................................................... 34
Dual Propeller Concept ...................................................................................................... 34
Variable Diameter Propeller ................................................................................................. 35
Application of Propellers ...................................................................................................... 36
ELECTRIC MOTORS .................................................................................................................. 36
Other Systematic Interactions of Electric Motors ....................................................................... 37
Electromagnetic Interference (EM1) ......................................................................................... 37
Brush Motors ..................................................................................................................... 38
Brushless DC Motors ........................................................................................................... 38
Induction Motors ................................................................................................................. 39
Switched Reluctance Synchronous Motors ............................................................................... 39
Permanent Magnet Induction Motors ....................................................................................... 39
Axial Flux Motors .............................................................................................................. 40
Variable Speed Operation ...................................................................................................... 40
Power Densities of Electric ]vtotors ......................................................................................... 41
Scaling Laws ...................................................................................................................... 41
ELECTRIC AIRCRAFT GEAR TRAIN AND TRANSMISSION .................................................................... 42
Single�Multi-Speed Gear Box ................................................................................................ 43
Continuously Variable Transmissions (CVT) ........................................................................... 44
Transmission Analysis ......................................................................................................... 44
Final Selection ................................................................................................................... 45
SOLAR ELECTRIC AIRCRAFT MISSION SIMULATION RESULTS ................... 45
BASELINE .............................................................................................................................. 46
SIZE FIGURE OF MERIT ............................................................................................................. 47
SPAN LOADING VS. TWIN-BOOM AIRCRAFT .................................................................................. 48
LATITUDE VARIATIONS ............................................................................................................ 49
TIME-OF-YEAR VARIATIONS ...................................................................................................... 51
GENERAL SOLAR CELL PARAMETRICS ......................................................................................... 51
PERFORMANCE BASELINE EFFECTS ON AIRCRAFT ........................................................................... 53
ALTITUDE EFFECTS ON AIRCRAFT SIZE ........................................................................................ 53
PAYLOAD MASS ...................................................................................................................... 54
ENERGY STORAGE ................................................................................................................... 54
AIRCRAFT MASS FRACTION ....................................................................................................... 56
COST .................................................................................................................................... 56
CONCLUSIONS .................................................................................... 57
APPENDIX A: AIRFOIL SELECTION ....................................................... 105
APPENDIX B: FLYWHEELS ................................................................... 1 1 1
Energy Storage Rotors ........................................................................................................ 111
Power Computing Solutions, Inc. NAS2-96011 3
Momentum Storage in a Flywheel ......................................................................................... 112Power .............................................................................................................................. 112
Synergistic Effects .............................................................................................................. 112
Table of Figures
FIGURE 1 CUINSE THIN FILM SOLAR CELL DEVELOPMENT ............................................................ 66
FIGURE 2 CDTE THIN FILM SOLAR CELL DEVELOPMENT ............................................................... 66
FIGURE 3 1997 STATE-OF-THE-ART PEM FUEL CELL PERFORMANCE .............................................. 67
FIGURE 4 H2-O2 AND H2-AIR FUEL CELL STACK PERFORMANCE PROJECTIONS FOR 2001 .................... 68
FIGURE 5 COMPARISON OF PEM FUEL CELL CURRENT-VOLTAGE RELATIONSHIPS FOR 1997 TECHNOLOGY
BASELINE WITH PERFORMANCE PROJECTIONS FOR 2001 .......................................................... 68
FIGURE 6 1997 STATE-OF-THE-ART PERFORMANCE FOR PEM H20 ELECTROLYZER STACKS ................ 69
FIGURE 7 H2-O2 UNITIZED FUEL CELL/ELECTROLYZER PERFORMANCE PROJECTION FOR 2001 ............. 70
FIGURE 8 COMPARISON OF ENERGY DENSITIES AND SPECIFIC ENERGY OF NON-REGENERATIVE FUEL CELl,
SYSTEMS FOR 1997 AND 2001 TECHNOLOGY BASELINES ......................................................... 72
FIGURE 9 SPECIFIC POWER AS A FUNCTION OF SPECIFIC ENERGY FOR VARIOUS FLYWHEEL SYSTEMS ..... 75
FIGURE 10
FIGURE 1 1
FIGURE 12
FIGURE 13
FIGURE 14
FIGURE 15
FIGURE 16
FIGURE 17
FIGURE 18
FIGURE 19
FIGURE 20
FIGURE 21
FIGURE 22
FIGURE 23
FIGURE 24
FIGURE 25
FIGURE 26
FIGURE 27
FIGURE 28
FIGURE 29
FIGURE 30
FIGURE 3 1
FIGURE 32
FIGURE 33
FIGURE 34
FIGURE 35
FIGURE 36
FIGURE 37
FIGURE 38
FIGURE 39
FIGURE 40
FIGURE 41
FIGURE 42
FIGURE 43
FIGURE 44
FIGURE 45
THE EFFECT OF PROPELLER DIAMETER ON RPM ............................................................ 75
PROPELLER DIAMETER VERSUS NUMBER OF PROPELLERS ................................................ 76
EFFECT OF PROPELLER DIAMETER ON PROPELLER EFFICIENCY .......................................... 76
EFFECT OF PROPELLER DIAMETER ON OUTPUT THRUST ................................................... 77
QUALITATIVE TORQUE-SPEED MOTOR CHARACTERISTICS .............................................. 78
QUALITATIVE EFFICIENCY CHARACTERISTICS OF AN INDUCTION MOTOR ........................... 78
AC MOTOR]CONTROLLER EFFICIENCY MAP ................................................................. 80
CONTINUOUSLY VARIABLE TRANSMISSION ................................................................... 80
WEIGHT AS A FUNCTION OF TRANSMISSION TYPE .......................................................... 81
SPECIFIC POWER AS A FUNCTION OF TRANSMISSION TYPE ............................................... 81
WEIGHT AS A FUNCTION OF TRANSMISSION TYPE .......................................................... 82
EFFICIENCY AS A FUNCTION OF INPUT SHAFT SPEED AND TRANSMISSION TYPE ................... 82
CRUISE, AVAILABLE, AND ALTITUDE AS A FUNCTION OF MISSION TIME ........................... 84
INDICATED AND TRUE VELOCITY AS A FUNCTION OF ALTITUDE ....................................... 85
ALTITUDE AND RANGE AS A FUNCTION OF MISSION TIME .............................................. 85
DRAG COEFFICIENTS AS A FUNCTION OF ALTITUDE ....................................................... 86
REYNOLDS NUMBER AS A FUNCTION OF ALTITUDE ........................................................ 86
DRAG AS A FUNCTION OF ALTITUDE ........................................................................... 87
COMPARISON OF SPAN AND TWIN BOOM AIRCRAFT ...................................................... 89
COMPARISON OF SPAN AND TWIN BOOM AIRCRAFT DRAGS(75 KG PAYLOAD) ..................... 89
COMPARISON OF SPAN AND TWIN BOOM AIRCRAFT DRAGS(225 KG PAYLOAD) ................... 9()
EFFECTS OF ASPECT RATIO ON SPAN AND TWIN BOOM AIRCRAFT WING AREA ..................... 90
EFFECTS OF ASPECT RATIO ON SPAN AND TWIN BOOM AIRCRAFT WING SPAN ..................... 91
EFFECTS OF LATITUDE ON WING AREA (0 KM ROA) ....................................................... 91
EFFECTS OF LATITUDE ON WING LOADING (0 KM ROA) ................................................. 92
EFFECTS OF LATITUDE ON WING AREA (1000 KM ROA) .................................................. 92
EFFECTS OF LATITUDE ON WING LOADING (1000 KM ROA) ........................................... 93
EFFECTS OF TIME OF YEAR ON WING AREA (1000 KM ROA) ........................................... 93EFFECTS OF SOLAR CELL EFFICIENCY ON WING AREA .................................................... 94
EFFECTS OF SOLAR CELL EFFICIENCY ON WING LOADING ............................................... 94
EFFECTS OF SOLAR CELL SPECIFIC MASS ON WING AREA ................................................ 95
EFFECTS OF SOLAR CELL SPECIFIC MASS ON WING LOADING ........................................... 95
EFFECTS OF PERFORMANCE BASELINE ON WING AREA (0 KM ROA) ................................... 96
EFFECTS OF PERFORMANCE BASELINE ON WING AREA (1000 KM ROA) .............................. 96
EFFECTS OF MAXIMUM ALTITUDE ON WING AREA (0 KM ROA) ....................................... 97
% CHANGE FROM BASELINE AS A FUNCTION OF SOLAR CELL TYPE ON WING AREA (0 KM ROA)97
Power Computing Solutions, Inc. NAS2-96011 4

FIGURE 46 EFFECTS OF SOLAR CELL TYPE ON WING AREA (1000 KM ROA) ........................................ 98
FIGURE 47 % CHANGE FROM BASELINE AS A FUNCTION OF SOLAR CELL TYPE ON WING AREA (1000 KM
ROA) ............................................................................................................................ 98FIGURE 48 PAYLOAD MASS AND SOLAR CELL EFFECT ON WING AREA (0 KM ROA) ........................... 99
FIGURE 49 PAYLOAD MASS AND SOLAR CELL EFFECT ON WING AREA (1000 KM ROA) ...................... 99
FIGURE 50 ENERGY STORAGE SELECTION EFFECT ON WING AREA (1000 KM ROA) ........................... 100
FIGURE 51 ENERGY STORAGE SELECTION EFFECT ON WING LOADING (1000 KM ROA) ...................... 102
FIGURE 52 BATTERY CHARGE STATE AND ALTITUDE AS A FUNCTION OF MISSION TIME (1000 KM ROA)I (}2
FIGURE 53 WEIGHT FRACTION BREAKDOWN FOR A SINGLE JUNCTION 1997 BASELINE SPAN LOADED
AIRCRAFT ..................................................................................................................... 1 (13
FIGURE 54 WEIGHT FRACTION BREAKDOWN FOR A MULTI-JUNCTION 1997 BASELINE SPAN LOADED
AIRCRAFT ..................................................................................................................... 1 (13
FIGURE 55 WEIGHT FRACTION BREAKDOWN FOR A SYNERGISTIC AMORPHOUS 1997 BASELINE SPAN
LOADED AIRCRAFT ......................................................................................................... 104
FIGURE 56 APPROXIMATE COST COMPARISON OF AIRFRAMES WITH VARIOUS SOLAR CELL TYPES ........ 104
FIGURE 57
FIGURE 58
FIGURE 59
FIGURE 60
FIGURE 61
FIGURE 62
FIGURE 63
FIGURE 64
FIGURE 65
FIGURE 66
FIGURE 67
AIRFOIL PROFILE FOR THE LIEBECK 1003 .................................................................... 106
POWER FACTOR AS A FUNCTION OF EL FOR THE LIEBECK L1003M .................................. 106
CL vs REYNOLDS NUMBER FOR THE LIEBECK L 1003M .................................................. 107
CD vs REYNOLDS NUMBER FOR THE LIEBECK L1003M .................................................. 107
POWER FACTOR FOR THE WORTMAN FX-63-137-MOD ................................................... 108
CL AS A FUNCTION OF REYNOLDS # FOR THE WORTMAN FX-63-137-MOD ......................... 108
CD AS A FUNCTION OF REYNOLDS # FOR THE WORTMAN FX-63-137-MOD ........................ 109
POWER FACTOR FOR THE CLARK Y ............................................................................ 109
CD(CL=0.0) AS A FUNCTION OF REYNOLDS # FOR THE CLARK Y 5.9% ............................. 110
CD(CL=.45) AS A FUNCTION OF REYNOLDS # FOR THE CLARK Y 5.9% ............................. 110
AIRCRAFT CONTROL SYSTEM MASS VS. ASPECT RATIO ................................................. 114
Table of Tables
TABLE
TABLE
TABLE
TABLE
TABLE
TABLE
TABLE
TABLE
TABLE
TABLE
TABLE 1 1
TABLE 12
TABLE 13
TABLE 14
TABLE 15
TABLE 16
TABLE 17
TABLE 18
TABLE 19
TABLE 20
TABLE 21
TABLE 22
TABLE 23
TABLE 24
1 AIRCRAFT MISSION REQUIREMENTS ................................................................................ 58
2 ELECTRIC POWERTRAIN COMPONENTS ANALYZED FOR THE HIGH ALTITUDE UAV ................. 58
3 HISTORY OF SOLAR POWER AIRCRAFT ............................................................................ 59
4 SELECTION CRITERIA FOR CANDIDATE POWER SYSTEMS TO BE CONSIDERED ........................ 59
5 QUALITATIVE RANKINGS OF CANDIDATE UAV POWER SYSTEMS ....................................... 60
6 III-V CELL DEVELOPMENTS AT AM 1.5 & 25°C .............................................................. 61
7 SILICON SOLAR CELL DEVELOPMENTS AT AM 1.5 & 25°C ................................................ 61
8 POLYCRYSTALLINE THIN FILM CELL DEVELOPMENTS AT AM 1.5 & 25°C ............................ 61
9 AMORPHOUS SILICON CELL DEVELOPMENTS AT AM 1.5 & 25°C ........................................ 62
10 MULTI-JUNCTION CELL DEVELOPMENTS AT AM 1.5 & 25°C ............................................ 62
PLANAR MODULE DEVELOPMENTS AT AM 1.5 & 25°C ................................................... 62
CONCENTRATOR SINGLE CELL DEVELOPMENTS AT AM 1.5 & 25°C ................................. 63
CONCENTRATOR MULTI-JUNCTION SINGLE CELL DEVELOPMENTS AT AM 1.5 & 25°C ......... 63
CONCENTRATOR MODULE DEVELOPMENTS AT AM 1.5 & 25°C ........................................ 63
THIN FILM SOLAR ARRAY MODULE AT AM 1.5 .............................................................. 64
THIN FILM SOLAR CELL MODULE PERFORMANCE AT 25 ° C .............................................. 64
SINGLE JUNCTION / SINGLE CRYSTAL SOLAR CELL MODULE PERFORMANCE AT 25 ° C ......... 64
ULTRA THIN GAAS SOLAR CELL MODULE PERFORMANCE AT 25 ° C .................................. 65
MULTI-JUNCTION SOLAR CELL MODULE PERFORMANCE AT 25 ° C .................................... 65
SOLAR CELL CLASSIFICATIONS ................................................................................... 67
REPORTED AND ASSUMED MK 7 STACK CHARACTERISTICS .............................................. 67
REPORTED AND ASSUMED ELECTROLYZER STACK CHARACTERISTICS ................................. 69
STANDARD CHARACTERISTIC PROFILE CORRELATION'S FOR FUEL CELL SYSTEMS ................ 71
PRIMARY BATTERY SYSTEM PERFORMANCE CHARACTERISTIC PROFILE ESTIMATES ............... 72
Power Computing Solutions, Inc. NAS2-96011 5

TABLE 25 UNITED STATES ADVANCED BATTERY CONSORTIUM BATTERY GOALS ............................... 73
TABLE 26 SECONDARY BATTERY SYSTEM PERFORMANCE CHARACTERISTIC PROFILE ESTIMATES .......... 73
TABLE 27 FLYWHEEL THEORETICAL MAXIMUM SPECIFIC ENERGY ................................................. 74
TABLE 28 FIXED VS. VARIABLE PITCH PROPELLERS ...................................................................... 77
TABLE 29 QUALITATIVE CHARACTERISTICS OF CANDIDATE MOTORS ............................................... 79
TABLE 30 QUALITATIVE RANKINGS OF CANDIDATE DRIVETRAIN ................................................... 83
TABLE 31 TWELVE ORIGINAL MISSIONS, MULTI-JUNCTION CELLS 1997 BASELINE ............................ 84
TABLE 32 BASE CASE SAAC OUTPUT ....................................................................................... 88
TABLE 33 SAAC OUTPUT FOR THE LITHIUM PRIMARY CELL CASE ................................................. 101
Power Computing Solutions, Inc. NAS2-96011 6

EXECUTIVE SUMMARY
In support of the National Aeronautics and Space Administration's Environmental
Research Aircraft and Sensor Technology (ERAST) Program, Power Computing
Solutions, Inc. (PCS) completed a nine month contract to assess electric powertrain
technologies with application to high altitude Unmanned Aerial Vehicles (UAV). The
contract objectives were to determine the feasibility of achieving the aircraft mission
requirements outlined in Table 1 using electric powertrain components that were available
on January 1, 1997 and using electric powertrain components that are projected to be
available on January 1, 2001.
PCS, Inc. assembled the performance data base for the 1997 technology baseline
and projected the performance for the 2001 technology baseline for those powertrain
components listed in Table 2. For both the 1997 and 2001 performance baselines, PCS,
Inc. devised performance characteristic profiles to estimate mass, volume, and efficiency
for each powertrain component listed in Table 2. Building upon a previously devised solar
electric UAV simulation platform, PCS, Inc. included the performance characteristic
profiles and added flight simulation capabilities for Liebeck, Wortman, and Clark Y
airfoils. One hundred twenty five solar electric UAV configurations and missions were
simulated. In addition to those requirements listed in Table 1, the simulations were carried
out for both span loaded and twin boom airframes at latitudes of 0 deg, 25 deg, and 40 deg
with mission start dates of March 15 and June 15. Since there was no time-of-day
requirement for reaching the maximum altitude, all aircraft took off at dawn. Throughout
the analyses, synergistic design opportunities were investigated with the premise that
specific benefits may be realized, for example, ifa single component can serve multiple
functions, such as a battery being used for energy storage as well as for a structural
component of the aircraft.
For each UAV mission simulation, the airframe structure, powertrain configuration
(type of solar cells, energy storage options) and performance baseline (1997 or 2001) were
specified. The output of each simulation included the smallest wing area (for specified
aspect ratio) needed to accomplish the specified mission. All of the candidate aircraft were
able to meet the mission requirements which included the 0 km radius of action using solar
cell power with no energy storage. For the 1000 km radius of action requirement, only the
lowest efficiency (amorphous silicon) photovoltaic system was unable to achieve the
missions. Those results dictated that in general, photovoltaic power alone was best for the
missions of interest and energy storage capability yielded modest benefit. Exceptions to
Power Computing Solutions, Inc. NAS2-96011 7

thiswerecalculatedfor themostchallengingmissions.For example,for the low altitude
(90kft.), high payloadmass(225kg),long radius&action (1,000 km) case at 40 deg
latitude, the use of primary batteries allowed a reduction of approximately 15% in wing
area compared to the analogous aircraft using only solar power. For those cases using
primary batteries, the aircraft wing loading increased slightly, from about 1.02 lb/ft 2 to
about 1.09 lb/ft 2. Rechargeable energy storage systems were not beneficial for any of the
mission simulations mainly because the 35 minute required time at altitude was too small to
warrant the need for rechargeable systems.
One synergistic design opportunity was found to have significant benefits for these
missions. By using a mylar substrate, the amorphous silicon solar cells could also be used
as the outer airfoil covering. This enabled these relatively low efficiency cells to produce
aircraft with wing areas comparable to their higher efficiency solar cell (single junction and
multi-junction) counterparts, thereby allowing tremendous cost savings. One of the most
important conclusions from this effort was that the use of the high efficiency (multi-
junction) solar cells or the use of the synergistic amorphous silicon solar cell configuration
yields aircraft that can accomplish the majority of the missions of interest for any latitude
between 0 deg, and 55 deg Hence, instead of oversizing a single aircraft or procuring
several different aircraft with less effective solar cell configurations, a single versatile
aircraft can be constructed and implemented to accomplish a majority of the solar electric
UAV missions of interest.
INTRODUCTION
The first solar electric Unmanned Aerial Vehicle (UAV) program started over 20
years ago with the Sunrise I and has continued to the present. Table 3.0 shows the
progression of solar powered aircraft from the early Sunrise I and II aircraft with wing
spans of about 30 feet to Aerovironment's Pathfinder aircraft with a wing span of 100 feet.
The capabilities of each successive aircraft has also increased dramatically. This is best
shown by Aerovironment's success in setting a world altitude record of over 71,000 ft.
with Pathfinder in July of 1997. This increase in capabilities can be directly related to the
improvements in energy source technology as well as the introduction of lightweight
materials with which the aircraft are made. Aerovironment, under funding by the National
Aeronautics and Space Administration (NASA) Environmental Research Aircraft and
Sensor Technology (ERAST) program is now developing two new solar electric aircraft.
One of these new aircraft is designed to fly at 100,000 ft while the other is designed to be
Power Computing Solutions, Inc. NAS2-96011

capableof continuousflight (dayandnightduringanarrowrangeof seasonsandlatitudes)
by addinganenergystoragesystemto asolarcell powergenerationsystem.
While all of thesesystemshavepushedthecurrentState-of-the-Art(SOA)for both
aircraftdesignandenergysourcetechnology,it is still achallengeto developasolar
poweredaircraftwhich is inexpensive,capableof sustainedflight overawide rangeof
seasonsandlatitudes,andcapableof carryingsignificantpayloads. The rapid
advancements in energy storage and electric drivetrain technologies being achieved through
electric vehicle and renewable energy development programs worldwide may enable a more
cost effective and capable electric aircraft in the future.
In support of NASA's ERAST Program, Power Computing Solutions, Inc. (PCS)
completed a nine month contract to assess electric powertrain technologies with application
to high altitude Unpiloted Aerial Vehicles (UAV). This study was specifically designed by
NASA Ames Research Center to ascertain which, if any, technologies would enable the all
electric aircraft to perform the missions outlined by the ERAST Leadership Committee.
The contract objectives were to determine the feasibility of achieving the aircraft mission
requirements outlined in Table 1 using electric powertrain components that were available
in 1997 and using electric powertrain components that are projected to be available in 2001.
This effort included a survey and characterization of energy source technologies, a survey
and characterization of drive system technologies, an analysis of airframe concepts, and an
analysis of aircraft component integration concepts. The most promising energy sources,
drive components, and aircraft structures were then integrated to produce conceptual UAV
designs for which mission simulations were conducted. Throughout the analyses,
synergistic design opportunities were investigated with the premise that specific benefits
may be realized, for example, ifa single component can serve multiple functions, such as a
battery being used for energy storage as well as for a structural component of the aircraft.
For the energy source and drive system technology surveys, candidate systems
were identified, ranked for UAV suitability, and downselected for further analysis and
incorporation into the integrated aircraft mission simulations. The detailed analyses
resulted in standard characteristic profiles that were used to estimate the mass, volume, and
efficiency of the individual components that were selected. Two technology baselines were
required for each standard characteristic profile, one baseline for performance demonstrated
and/or predicted in 1997 and one baseline for performance predicted in 2001. PCS, Inc.
assembled the performance data base for the 1997 technology baseline and projected the
performance for the 2001 technology baseline for those powertrain components listed in
Table 2. Performance of the integrated total powertrain was considered to be much more
Power Computing Solutions, Inc. NAS2-96011

importantthanperformanceof asingleisolatedpowertraincomponent,henceatotalsystemsapproachwasundertakenfor all of theanalysesperformedfor thiscontract.The
powertrainanalysesincludedall of thoseitemsin Table2 andthefundamentalperformancecharacteristicsof eachof thoseitemswasdevisedto atleastafirst orderlevel.
Spanloadedairframesandtwin boomairframeswereconsideredfor thiscontract.
ConceptualUAV designswerecreatedbyintegratingthedifferentpowertraincomponentswith thetwotypesof airframes.ThePCSSolarAircraft SystemSimulator(SAACwas
developedby incorporatingthestandardcharacteristicsprofilesfor thepowertrain
componentsalongwith theappropriatedatafor Liebeck,Wortman,andClarkY airfoils
intoapreviouslydevisedsolarelectricUAV simulationcode.Onehundredtwentyfive
solarelectricUAV configurationsandmissionsweresimulated.In additionto those
requirementslistedin Table1,thesimulationswerecarriedat latitudesof 0°, 25°, and40°
with missionstartdatesof March 15andJune15. Sincetherewasno time-of-day
requirementfor reachingthemaximumaltitude,all aircrafttookoff atdawn. The
simulationresultsincludedthesmallestwing area(for specifiedaspectratio)neededto
accomplishthespecifiedmission. Thoseresultswereusedto assessthepotential
advantagesanddisadvantagesof thevariousenergysourceanddrivesystemcomponents.
Eachtaskis describedin detailin thefollowing sections.
ENERGY SOURCE TECHNOLOGY SURVEY
Introduction
There is an extraordinarily large number of electrical power systems that can be
considered for the solar-electric powered UAVs. Solar cells, non-rechargeable (primary)
and rechargeable (secondary) batteries, fuel cells, semi-cells, flywheels, and capacitors are
candidates for the UAV. Microwave and laser beamed power systems can also be
considered. The best power system(s) cannot be determined a priori, but rather a total
systems approach must be undertaken to determine the best power system configuration for
specific mission requirements. For this contract, the mission requirements were defined up
front (Table 1), but the energy storage requirements (if any) needed to satisfy the mission
requirements were certainly not known before the required mission simulations were
conducted. It was therefore necessary to rank and prioritize the candidate power systems
and then to select several of those candidate power system technologies that would be
characterized and included in the aircraft mission design/analysis and simulation tasks.
Power Computing Solutions, Inc. NAS2-96011 10

Theenergy
1.2.
3.
4.
5.
6.
sourcetechnologysurveycanbebrokeninto sixdistinctparts:
SolarCells
Non-RegenerativeandRegenerativeFuelCellsPrimaryandSecondaryBatteries
FlywheelsSemi-cells
Capacitors
A qualitativerankingsystemwasdevisedin orderto compareandto prioritizethecandidate
powersystems.Thecriteriathatwereappliedfor selectingthecandidatepowersystemsto
beincludedin theanalysesarelistedin Table4andtherelativerankingsareshownin Table5. Therelativerankingsthatwereassignedby PCS,Inc.accountedfor inputfrom the
openliterature,interviewswith variousexperts,anddirectexperiencesof PCS,Inc.
personnel.Of all thecandidatepowersystemslistedin Table5,only thesemi-cellsand
capacitorswerenotselectedfor analysisfor this study. Forthepowersystemtechnologiesthatweredeemedsuitablefor theUAV, thestandardperformancecharacteristicsprofiles
weredevisedfor boththe 1997and2001timeframes.A generaldiscussionof the
candidateenergysourcetechnologiesandthestandardcharacteristicsprofilesfor themost
suitabletechnologiesfollows.In additionto theabovementionedenergysourcesaninvestigationof microwave
andlaserbeamedpoweraircraftwasperformed.While theseaircraftmayindeedbe
smallerbecauseof the increasedenergyflux (whencomparedwith thesun),the
requirementof atransmissiontower(or seriesof towers),groundinfrasmactureand
supportlogisticsnecessaryfor suchanoperationmadethesesystemsimpractical.
Secondly,thesesystemsweredeemedunacceptablebecauseof safetyconcernsof
aircraft/wildlifepassingthroughtheenergytransmissionbeam.
Solar Cells
Introduction
A solar cell or photovoltaic cell (PV) is a solid state semiconductor device which
converts solar energy into electrical energy using the photovoltaic effect. When photons of
sufficient energy strike the top surface of the cell they liberate electrons from the
Power Computing Solutions, Inc. NAS2-96011 11

z_
semiconductor material (for example silicon). To take advantage of this liberation of
electrons a solar cell separates the electrons from the semiconductor material before they
have a chance to recombine to the material. This is accomplished by an internal electric field
which is produced in the cell by a p-n junction. This junction is formed very near the front
surface of the cell by diffusing n type dopant into the p type semiconductor to make a n/p
junction. The net effect of the junction is to produce an electric field with a polarity which
accelerates electrons toward the front surface and holes toward the rear surface of the cell.
Electrical contacts are added to the front and back of the cell in order to utilize this flow of
electrons.
Solar Cell Performance
There are three main types or classes of solar cells under production today, thin
film, single junction and multiple junction. The theory behind the operation of each type of
solar cell is the same, however the materials and manufacturing techniques used for each
class differ. In addition to the types of solar cells just listed there are various solar energy
concentrator devices which can enhance the performance of the PV' s.
There have been significant advances in solar cell development over the last
decade. Tables 6 through 13 summarize this development for thin film, single junction and
multi-junction solar cells constructed of various materials. These tables represent the state
of the art in single cell and submodule production of the cells and materials listed.
Solar Cell Module Performance
Obviously, single cell or small submodules do not represent how these solar cells
would perform in a solar aircraft. The efficiencies given in the single cell modules are
probably not attainable in mass production. However these tables do indicate which types
of cells and materials hold the most promise. In order to get a more realistic estimate of the
performance of various types of solar cells one has to look at the performance of full
modules. Tables 14 though 19 list solar cell module performance for various solar cell
types and these numbers are more indicative of the types of performance which could be
achieved in the electric aircraft.
Power Computing Solutions, Inc. NAS2-96011 12

Thin Film Technology
Of all the cells studied, perhaps the most rapid development has come in the area of
thin film solar cells. Over the past 20 years significant changes in efficiency have taken
place. Figures 1.0 and 2.0 show the rapid increase in efficiency as a function of time over
the last 20 years for both CdTe and CulnSe cells.
Cost
For solar aircraft applications both the cost and durability of the solar cell modules
are of concern. Even though the multi-juntion and single junction crystalline cell s have the
highest performance, their applications toward solar powered aircraft have disadvantages.
Except for basic Silicon cells, single and multi-junction solar cells can be very costly $500
per cell or more i. This cost would be prohibitive in using these cells to populate the wing
surface of a fleet of Pathfinder sized solar aircraft. Also the majority of these cells are
extremely brittle. This quality makes their use in an aircraft whose wings must flex and
move under aerodynamic loading an engineering challenge not to mention ground handling.
Selection
If only cost and integration issues are used as the criteria for the selection of a solar
cell type then the PVs which hold the most promise in solar powered aircraft are the thin
film solar cells. The cost of these cells is low and they are fairly flexible. They have the
potential to be used as the aerodynamic surface of the aircraft and conform to its curves.
Although the efficiency of this type of cell is less than that of crystalline cells developments
are still being made and the efficiency levels of these cells have increased significantly since
their initial development. Figures 1 and 2 show major advancements in two types of thin
film cells over the past two and a half decades.
Because each of the solar cell types has characteristics which may make it the most
desirable for an electric aircraft, none were eliminated from consideration. Therefore, from
this data, PCS estimated an overall characteristic efficiency, mass and cost of each type of
solar cell on a per module basis which is an attempt to best represent and differentiate each
type of solar cell. Table 20 shows this comparison.
Power Computing Solutions, Inc. NAS2-96011 13

Regenerative and Non-Regenerative Fuel Cell Systems
Introduction
Fuel cell systems are characterized by the energy conversion components. These
include the fuel cell stacks, energy storage component, reactants and tankage, as well as the
ancillary components such as piping, valves, heat exchangers, product water separators,
and recirculation pumps. Electrolyzer stacks are also required for regenerative fuel cell
systems. For this study, four different non-regenerative fuel cell system types were
analyzed along with one type of regenerative fuel cell system. The non-regenerative fuel
cell system types all included the same fuel cell stack(s) but differed in the reactant storage
and/or reactant feed systems. Those four different system types were:
1. Gaseous hydrogen storage and gaseous oxygen storage,
2. Gaseous hydrogen storage and multiply turbocharged air feed system,
3. Cryogenic hydrogen storage and cryogenic oxygen storage, and
4. Cryogenic hydrogen storage and multiply turbocharged air feed system.
For the single type of regenerative fuel cell system that was analyzed, only gaseous
hydrogen storage and gaseous oxygen storage were assumed.
Although several different fuel cell types may potentially be feasible for solar
electric aircraft propulsion systems, only proton exchange membrane (PEM) fuel cells were
analyzed for this study because:
1. PEM fuel cell systems are best suited for operation on pure hydrogen, which is the
only fuel that was considered for this study,
2. For regenerative fuel cells, the only electrolyzer technology that can be considered
for flight applications is PEM,
3. A tremendous amount of resources are being invested worldwide in PEM systems
for light duty transportation applications, hence, small lightweight PEM hardware
may be significantly advanced over the 1997 performance baseline.
H2-Air and H2-O 2 PEM Fuel Cell Technology
There are at least one dozen PEM fuel cell stack designs that could be selected as the
baseline PEM hardware for this study. The main problem common to all but one of those
designs is that each of those stacks was designed for H2-air operation for ground
Power Computing Solutions, Inc. NAS2-96011 14

transportationapplications.Thetargetlifetimeof thosestacksis only about3,000hrs.and
thelifetimeonpureoxygen,ratherthanair,wouldundoubtedlybesignificantlylessthan
that. Forall PEMapplicationsusingpureoxygenratherthanair, somedevelopmentwill
berequiredsuchaschangingthegasflowfields to accommodatethepureoxygen.A PEM
fuel cellpreviouslydevelopedfor UnmannedUnderseaVehiclepropulsionapplicationunderaNASA LeRCContractwasdesignedfor operationonpure02andmaybebest
suitedfor thesolarUAV. However,operatinglife of thatsystemmuststill besubstantiated
for theUAV missions.TheUUV PEM stackdesignwassubsequentlymodifiedandis
currentlybeingdevelopedfor the light dutyvehicleapplicationsusingH2-Air,soboththe
H2-O2andH2-Airoptionscanbeconsideredfor thebasicUUV design.Withoutknowing
aprioriwhichtypeof fuel cell systemconfiguration(H2-O2or H2-Air) wouldbebestsuited
for themissionrequirements,hardwarecurrentlybeingdevelopedbyBallardPower
Systems,Inc.wasconsideredto bethebaselinePEMfuel cell. Ballardwasselectedbecausetheyaretheworld leaderin thetransportationPEMfuel cell stacktechnologyand
theyaretheonly companywhichhasa semi-productionfacility for fabricatingPEM fuel
cell stacks.Furthermore,therehasalreadybeensomedevelopmentwork for pureoxygen
operationonBallardhardware.BallardhardwarewasalsoconsideredthePEMfuel cellstackbaselinefor the2001timeframesinceanenormousamountof developmentfunding
is beingappliedto commercializingtheBallardhardwarefor groundtransportation
applicationswherelow stackvolumeandlow stackweightaregoals.
Onesignificantnoteto consideris thatNASA ispursuingimprovementsto the
existingSpaceShuttleFuelCell Systemandwill soondecideif theexistingalkalinefuel
cell systemshouldbereplacedby aPEMfuel cell system_. As partof thatShuttleFuel
Cell UpgradeProgram,NASA hasawardedtwo short-term(90day)contracts(onetoInternationalFuelCellsandoneto AlliedSignalAerospace)to deviseconceptualPEMfuel
cell systemdesignsusingtheirrespectivefuel celltechnologybaselines.In additionPCS
Inc.wasawardedacontractto developancillarycomponentmodelsfor theshuttlefuel cell
program_i_.Someof thesecomponentmodelswereusedin this study. Bothof theother
contractswill becompletedin 12/97andNASA plansto pursuesystemhardware
developmenteffortsvia competitiveprocurementsopento all PEM fuel cell developers.
Throughthisprogram,theremaybesignificantadvancesin PEMfuel cell system
developmentfor H2-O2operationandby 2001,PEMfuel cellsfor aerospaceapplications
utilizing pureoxygenmaybereadilyavailable.
Power Computing Solutions, Inc. NAS2-96011 15

Baseline PEM Fuel Cell Stack Technology
The Ballard Power Systems, Inc. Mk 7 hardware was considered state-of-the-art
for the 1997 performance baseline. Pow, et al. iv reported that 17 full-sized Mk 7 stacks
have been produced as of November 1996, therefore, the hardware is assumed to be
available. Overall stack performance is acceptable at the high power density regime but the
Mk 7 lifetime has not been fully verified. Full rated power for the Mk 7 is 32 kW and this
value was used for the 2001 performance baseline. It was assumed for this study that since
the Mk 7 hardware has not been fully verified for operating lifetime, the maximum rated
power for the Mk 7 as reported by Pow et al. was decreased by 22% from full rated power
for the 1997 performance baseline, or 25 kW. The rationale for this was that sufficient
lifetime could be achieved with the present Mk 7 design if the stack was operated at power
levels less than full rated power.
The PEM fuel cell stack characteristics assumed for this study are listed in Table 21
and the electrochemical performance baseline and projections are shown in Figures 3 and 4.
The fuel cell stack current-voltage relationships for the 1997 performance baseline are
shown in Figure 5 for H2-Air and for FL2-O2. For the 2001 performance projection, it was
assumed that full rated power could be sustained while maintaining acceptable life
endurance. Also, the projected improvements from the 1997 timeframe to 2001 would
occur at the higher current density regimes since the ongoing development efforts are
targeting the light duty transportation applications where high power density is required.
This translates to an improvement in the current-voltage curves at higher current densities
but not necessarily at the lower current densities as shown in Figures 3 and 4.
The operating point (current and voltage) for the fuel cell system must be selected
and this choice will have an effect on the total system mass and volume. For example, if
the fuel cell is operated in a low current density, high voltage efficiency regime, then a
relatively large fuel cell stack is required but the amount of required reactants is relatively
small. Conversely, if the fuel cell is operated in a high current density, low voltage
efficiency regime, then a relatively small fuel cell stack is required but the amount of
required reactants is relatively large. Since no overnight flight requirements were imposed
for this study, it was estimated that the discharge period for a fuel cell would be small.
For the small discharge time period, it is best to minimize the fuel cell stack mass and
volume as opposed to the reactant mass and a volume, hence the performance characteristic
profiles are based upon fuel cell operation in the high current density regime.
Power Computing Solutions, Inc. NAS2-96011 16

Ancillary Components for Non-Regenerative PEM Fuel Cell Systems
For each fuel cell system type, a hydrogen storage sub-system, an oxygen (or air)
supply sub-system, a stack heat exchanger and a power conditioner were included for the
mass and volume estimations. Pressurized gas, and cryogenic storage sub-systems were
included for both the 1997 technology baseline and for the 2001 technology baseline for
both hydrogen and for oxygen. For the hydrogen-air systems, a multi-staged
turbocharging sub-system for air was analyzed in place of gaseous or cryogenic oxygen.
For the non-regenerative PEM fuel cell systems, the hydrogen supply sub-system consisted
of gaseous or liquid storage vessels, a resistance heater if cryogenic hydrogen storage was
implemented, and a hydrogen recirculation pump (when needed). Similarly, the oxygen
supply sub-system consisted of gaseous or liquid storage vessels, a resistance heater if
cryogenic oxygen storage was implemented, and an oxygen recirculation pump. For air
systems, a turbocompressor took the place of the oxygen storage vessels, the oxygen
recirculation pump, and the cryogenic tank resistance heater.
PEM Fuel Cell Stack Mass and Volume
Fuel cell stack mass and volume were scaled to the Ballard Mk 7 specifications that
were reported by Pow et al. As noted in Table 21, the mass correlations are valid for at
least twenty single cells per stack. This was because the stack endplates and tierod masses
were "distributed" among the overall single cell mass, that is, the stack mass is computed
solely from the number of single cells per stack. (So the calculated mass of a two cell
stack, for example, would be less than the actual stack mass because the estimated end plate
and tierod masses would be lower than actual). The amount of reactants required for the
entire mission was calculated from the operating current, the total number of single cells,
and the operating time. For all cases, an extra 10 mole% of hydrogen was added to
account for venting losses and tankage residuals. Likewise, for pure oxygen systems, an
extra 10 mole% was assumed but for the air systems, 100 mole% excess air flow was
assumed.
Fuel Cell Waste Heat and Heat Exchanger
High power density fuel cell operation requires some degree of cooling for
operating times greater than fifteen to thirty minutes. For short peak power bursts, the fuel
cell stack can most likely withstand the amounts of generated heat. The fuel cell waste heat
was estimated to be:
Power Computing Solutions, Inc. NAS2-96011 17

Waste Heat per Stack (Watts) = IFC*(1.25-VFc)*(number of cells/stack)
where: Ivc is the fuel cell stack current (Amps) and
VFc is the average single cell operating voltage (Volts).
Based upon previously developed correlations for aerospace heat exchangers v, the heat
exchanger mass was simply estimated to be 4 kg/kW heat duty and the heat exchanger
volume was estimated to be one liter per kW heat duty. For the 2001 timeframe, a 25%
reduction in heat exchanger mass and volume was assumed.
Pressurized Gas Storage Sub-systems
Storage vessels for high pressure gas containment were characterized by the initial
storage temperature and pressure, the tank efficiency factor, and the safety factor. The
tank volume was set equal to the volume of the stored gas, ie., the tank thickness was
ignored in the tank volume calculation. Ideal gas behavior was assumed for the stored
reactants and a 10 mole% excess of stored reactant was assumed. The tank efficiency
factor was defined as { PbeVAV }where Pb is the tank burst pressure (psia), V is the
internal tank volume (in.3), and W is the tank weight (lbs.). The unit for tank efficiency is
always quoted as "inches". Tank efficiency factors can vary from 50,000 to 3,000,000 in.
depending upon several factors, including the materials of construction and the number of
fill cycles that are needed. High efficiency factors translate into small, lightweight tanks.
Standard off-the-shelf steel tanks have efficiency factors between 50,000 and 280,000 in.
and store gases at around 2,200 psia for the larger tanks (5+ ft. cylinders, 1+ ft. diameter)
and up to 6,000 psia for the smaller bottles (1 ft. cylinder, 4 in. diameter). Lightweight
tanks are constructed of a thin metal liner which serves as a gas diffusion barrier wrapped
with a composite material or fiber to provide strength. Tanks rated for 3,000 psia storage
are commercially available today and have efficiency factors of 800,000 in. For the 1997
performance baseline, a pressure vessel efficiency factor of 800,000 in., representative of a
Kevlar wrapped tank, was used. For the 2001 performance baseline, an efficiency factor
of 1,000,000 in., representative of a carbon fiber wrapped tank, was used. From the
known volume of reactant required, the tankage mass was calculated as:
W(lbs.) = (SFePbV) / (Tank eft. factor) (where SF is the safety factor)
The safety factor can be viewed as a factor for determining the tank wall thickness.
A safety factor of 2 for example, can mean that the tank shall be constructed with wall
thickness twice the theoretical value needed for a specified storage pressure. Typical safety
factors for commercial applications are around 4 while most aerospace applications have
Power Computing Solutions, Inc. NAS2-96011 18

safety factors around 1.5. For the 1997 performance baseline, a safety factor of 2 was
assumed while a 1.5 factor of safety was assumed for the 2001 baseline. For both
technology baselines, the storage pressure was assumed to be 3,000 psia.
Cryogenic and Supercritical Storage Sub-systems
For non-regenerative fuel cell systems, hydrogen and oxygen can be stored as
cryogens or in their supercritical states. The lightest weight tankage option is that currently
used on the Space Shuttle but that system is extremely costly. Another option is that which
was originally designed for the fuel cell powered UUV which is heavier than the Space
Shuttle tanks but less costly. The UUV system was considered for both the 1997 and the
2001 baselines.
Oxygen Recirculation Pump
For the Ballard Mk 7 fuel cell stack, it is necessary to use an excess amount of
oxygen (or air) to carry the product water out of the fuel cell stack. This gas/liquid mixture
must be separated under most operating regimes and the oxygen gas should be recycled
back to the fuel cell stack inlet. The oxygen compressor which would accomplish the
recirculation was assumed to consume about 10% of the gross stack output power and
assumed to weigh about 0.5 kg for both the 1997 and 2001 technology baselines.
Turbochargers for Air Delivery Sub-systems
PCS, Inc. has previous experience in developing turbocharger performance and
sizing models for high altitude internal combustion engine aircraft. Even at the 100 kft
altitude, where three stages of turbocharging may be required for H2-air fuel cell operation,
this type of oxidant delivery sub-system may be smaller and lighter than the gaseous and
cryogenic storage options. No detailed analyses were performed for this contract, but
some conservative mass and volume values for a turbocharging system, including parasitic
power requirements, were assigned for the turbocharger system. The reference design
point was for a 6 kW (gross power) H2-air fuel cell system using 100% excess air where
the turbocompressor mass and volume was scaled from a three-stage turbocharged system
currently being researched at NASA Lewis Research CenterC
H20 Electrolyzer Technology for Regenerative Fuel Cell Systems
1997.
Hamilton Standard PEM electrolyzer hardware was considered state-of-the-art for
The hardware design has been fully verified at various levels of single cell and stack
Power Computing Solutions, Inc. NAS2-96011 19
sizes vii so the 1997 and 2001 performance baselines that were developed for regenerative
fuel cell systems in this study incorporated the Hamilton Standard electrolysis hardware.
The PEM electrolyzer stack characteristics that were assumed for this study are
listed in Table 22. The electrolyzer performance curves are shown in Figure 6 for both the
1997 and 2001 technology baselines. Performance was assumed to be identical for both
baselines since no known development efforts are underway to improve upon the 1997
baseline performance.
Unitized Regenerative Fuel Cell / Electrolyzer Technology
Hamilton Standard has previously conducted some development work for a unitized
regenerative fuel cell/electrolyzer system, This technology was not available for the 1997
timeframe but it was assumed that such a system could be implemented in the 2001
timeframe. The mass and dimensional characteristics listed in Table 22 for the dedicated
electrolyzer were assumed to also apply to the unitized design. The projected current-
voltage characteristics of the unitized stack are shown in Figure 7.
Water Separator for Regenerative Fuel Cell Systems
For regenerative fuel cell systems it is necessary to remove the fuel cell product
water from the fuel cell and separate the water from the excess oxygen (if any). The means
by which the product water must be removed and separated from the excess oxygen is
dependent upon the fuel cell stack design. For the Ballard Mk 7 fuel cell stack, which was
considered to be the baseline fuel cell for this contract, the water must be carried out of the
fuel cell stack by excess oxygen. (In contrast, the UUV fuel cell design, for example,
includes a water transport plate which separates the water and excess oxygen internally and
excess oxygen flow is not mandatory). Once the oxygen/water mixture exits the fuel cell
stack, the oxygen and water must be separated. The oxygen can be recycled to the fuel cell
stack inlet and the water can be stored for subsequent electrolysis. There are several types
of water separators that can implemented. PCS, Inc. completed a conceptual design
modeling effort for a space shuttle PEM fuel cell system where two types of water
separators were modeled: a passive membrane separator, and a dual function water
separator/oxygen recycle compressor unit. vi" For this contract, a passive water separator
was considered as the baseline where no direct parasitic power was required for separator
operation but only a 3 psi maximum pressure drop would be imposed on the regenerative
fuel cell system. (The recycle compressor was sized to overcome this pressure drop as
well as the pressure drop in the fuel cell stack). Based upon the PCS, Inc. models and the
Power Computing Solutions, Inc. NAS2-96011 20

literature,thepassivewaterseparatormasswasassumed to be 5 kg with a volume of O.5
liters for both the 1997 and 2001 technology baselines.
Photovoltaic Energy Conversion for Electrolyzer Power Source
Normally, the solar-regenerative fuel cell system mass and volume must include
those values for the solar cells. The power required by the electrolyzer is determined from
the amount of water that needs to be electrolyzed and the time available to carry out the
electrolysis process and both of those parameters are calculated in the solar electric aircraft
mission analysis code. But since the photovoltaic cells are always assumed to be mounted
upon the airframe, all of the photovoltaic mass and volume associated with the electrolyzer
sub-subsystem are included in the airframe sizing algorithms and no photovoltaics are
included in the regenerative fuel cell system sizing algorithms.
Power Conditioning for the Regenerative and Non-Regenerative Fuel Cell
Systems
Fuel cell and electrolyzer stacks can be designed to minimize power management
and distribution requirements by tailoring the single cell dimensions and total number of
single cells. For this contract, the power management device was assumed to weigh 4.0
kg/kW gross power and occupy 0.5 liter/kW gross power for each fuel cell and
electrolyzer.
Fuel Cell System Performance Estimates
The fuel cell system standard characteristic profiles for mass and volume estimates
are summarized in Table 23. Mass and volume estimates for the non-regenerative fuel cell
systems are shown in Figure 8 for a 5 kW (net power) fuel cell operating for 10 hours. The
endpoints of each line represent the 1997 performance baseline (lower left point for each
line) and the 2001 performance baseline (upper right point for each line). By definition, the
slope of each line must be non-negative. Clearly, the energy density of the liquid hydrogen
(LH2) systems are best for both technology baselines but there was not much difference in
specific energies for the 1997 baseline. For the 2001 baseline, the systems which utilize
gaseous hydrogen storage exhibit the best specific energies but the liquid storage systems
still have superior energy densities. The energy densities of the gaseous storage systems
did not improve noticeably from the 1997 baseline to the 2001 baseline since the same
storage pressure (3,000 psia) was assumed for both. But the specific energy increased
dramatically for the cases with gaseous storage because the tank efficiency factors were
Power Computing Solutions, Inc. NAS2-96011 21

increasedby 25%(from 800,000in. to 1,000,000in.) for the2001baselineandthe
storagetank safetyfactorwasdecreasedby 25%(from 2 to 1.5)for the2001baseline.
Therewerenosuchimprovementsprojectedfor thesupercriticalstoragetanks. Also,since
thefuel cell stackperformancefor the 1997baselinewasassumedto be22%lessthanthe2001baseline,morereactantswererequiredfor the1997baselinethanfor the2001
baseline.Thisallowedfor noticeable energy density and specific energy improvements in
the systems which utilized liquid reactant storage but only slight energy density
improvements for those system with gaseous storage. It is especially interesting to note
that the HE-air systems with a turbocharger are comparable to the pure 02 systems.
Batteries
Introduction
Batteries transform chemical potential energy into electrical energy. In general,
batteries are broken into two distinct categories
1. Primary Batteries which can not be recharged, but have higher performance than
2. Secondary or Rechargeable Batteries which can be recharged.
Each category is discussed below.
Primary Batteries
A myriad of primary batteries are available today ranging from the low cost
commercial alkaline batteries that are used in ordinary flashlights to the higher cost lithium
batteries that are predominantly used by the military. Four primary battery types were
selected for analysis in this study: the commercial off the shelf(COTS) D-size alkaline
battery, the zinc-silver oxide (AgO-Zn) battery, the lithium-sulfur dioxide (Li-SO2) battery,
and the lithium thionyl chloride (Li-SOCI) battery. These four primary batteries span the
range of inexpensive, low performing systems to the most expensive, best performing
systems. For these primary battery systems, it was assumed that no heat exchanger would
be needed, since the discharge time would be much smaller for a primary battery than for a
secondary battery for the missions required in this study. It was also assumed that no
discharge controller would be required since the battery would not be used for more than
one mission, that is a 100% depth-of-discharge would be acceptable. Obviously, no
charge controller is needed. Listed in Table 24 are the primary battery characteristics that
were used. The standard characteristic profiles for both the 1997 and the 2001
performance baselines are identical for the primary batteries since no significant
Power Computing Solutions, Inc. NAS2-96011 22
developmenteffortsareunderwayto improvetherespectiveperformancewithin thetimeframeof interest.
Rechargeable Batteries
Many different types of secondary battery systems have been under development
for terrestrial, space, and military applications. Even though most of the new development
programs are targeting rechargeable nickel metal-hydride and rechargeable lithium batteries,
there are still significant ongoing efforts worldwide which are focused upon improving the
secondary lead-acid and secondary nickel cadmium batteries. Those are the four secondary
battery types were included for analysis in this study.
Out of all of the ongoing battery development programs, the electric automobile
battery development programs which are supported by the United States Advanced Battery
Consortium (USABC) have most direct relevance to this effort. The UAV, like the electric
automobile, requires power system components that are small, light, safe, durable,
environmentally clean, easy to integrate and operate, and cost effective on a life cycle
basis. The main differences between the UAV application and electric automobile
application are the power profiles (the electric automobile battery will be designed to the
Federal Urban Driving Cycle while the UAV may have drastically different
charge/discharge profiles), battery recharging flexibility (the electric automobile can make
use of ground based charging and controller stations that may be too large and heavy for
on-board UAV battery chargers/controllers), ease of maintenance (the electric automobile
will have more flexibility to design a battery system with maintenance requirements in
mind), and possibly cost (electric automobile batteries will probably need to be less
expensive than a UAV battery). Because advances in the USABC sponsored battery
development programs would be beneficial to a battery powered UAV, the projected goals
of the USABC were used for the 2001 performance characteristics for the UAV. In Table
25, the near-term and the long-term goals of the USABC are shown for comparison
purposes.
There are several design variations for each of the four rechargeable battery types
(lead-acid, nickel-cadmium, nickel-hydrogen, lithium) considered for this contract. As an
example, there are sealed valve regulated lead-acid batteries and flooded lead-acid batteries.
There are back-to back anode, 26% and 31% KOH electrolyte nickel-hydrogen batteries.
There are also nickel-metal hydride batteries with different hydride formulations and there
Power Computing Solutions, Inc. NAS2-96011 23

aremetalliclithium, intercalated lithium, lithium-ion, and lithium-ion polymer batteries.
For this study, general performance characteristics were defined to represent each battery
type for both the 1997 and 2001 performance baseline. Listed in Table 26 are generally
accepted state-of-the-art characteristics for the rechargeable battery types included in this
study. Published battery performance parameters were used for the 1997 performance
baseline while the long-term goals of the USABC were assumed to be relevant for the 2001
performance baseline. The long-term USABC goals were planned to be met in 1998. At
present, the long-term goals for most of those categories listed in Table 25 have still not
been validated at multi-kilowatt power levels. It was assumed then, for this effort, that the
2001 performance baseline for the secondary batteries will be equivalent to the long-term
goals of the USABC.
Present state-of-the-art and projected performance and cost characteristics varied
somewhat among the battery experts that were consulted by PCS, Inc. for this effort. Most
of the performance discrepancies were borne out by the challenges of scaling up the battery
size (power and energy capacity) while most of the cost discrepancies were a result of
differing marketing forecasts. The battery report published by the California Air Resources
Board (CARB) was used as the guideline for assessing the technology readiness levels of
various battery technologies, i× The comprehensive summary of the current state-of-the-art
of rechargeable batteries published by Pellerin x provided a superb basis for assigning the
1997 performance baseline characteristics.
It should have been a simple matter to discard from this study those secondary
batteries which have the lowest nominal specific energies and energy densities, however,
this was not done because the mission requirements for this study required only 35 minutes
at altitude with no flight time restrictions and synergistic effects may make the larger,
heavier secondary battery systems feasible. Some of the factors which may allow for this
include thermal conditions, charge/discharge limitations, cost, and synergistic effects with
the aircraft itself (such as using the battery system as part of the airframe structure).
Furthermore, since some of the electric vehicles on the road today utilize lead-acid batteries
(General Motors EV1, for example) there is ample evidence that the nominally lower
energy dense and specific energy batteries should be investigated as part of this study.
Se¢ond0,ry Bo,ttery_ System Ancillary. Components
Similar to the fuel cell systems, the rechargeable battery systems require several
ancillary components which include, charge/discharge controllers, heat exchangers, power
Power Computing Solutions, Inc. NAS2-96011 24
conditioners,andsupportstructure.Theassumptionswhichwerediscussedfor fuel cell
heatexchangersandpowerconditionerswerealsoappliedtotherechargeablebatterysystems,ie.,4 kg/kWheatexchangerand4 kg/kWfor powerconditioning.A prime
exampleof theimportanceof thesebatterysystemancillarycomponentscanbe illustrated
by examiningthenickel-hydrogenbatterysystemwhichwill beimplementedfor the
InternationalSpaceStation.Thenominalenergydensityof about50Wh/kg for theSpace
Stationnickel-hydrogenbatteryis muchgreaterthanthe6.5Wh/kg energydensityof theentirebatterysystem(notevenincludingthecharge/dischargecontroller)×'.
Standard Characteristic Profiles for Secondary Battery Sy_tem_
The standard characteristic profiles that were devised for the candidate secondary
battery systems are shown in Table 26 with sample calculations for a 5 kW (net) power
output with a 12 hour charge and 12 hour discharge period.
Aluminum and Lithium based semi-cells
The semi-cell systems can be described as hybrids between batteries and fuel cells.
For these systems, there is one consumable (or sacrificial) electrode, usually the anode (or
fuel electrode), and one gas diffusion electrode, usually the cathode. The aluminum-
oxygen (and aluminum-air) and the lithium hydrogen-peroxide systems are examples of
semi-cells. Both the lithium based and aluminum based semi-cell systems must be
considered strictly as primary systems since the only means for system recharging involves
direct mechanical replacement of the fuel electrodes (ie. lithium, aluminum) which are
consumed during the energy conversion reactions. The most significant development
efforts for the aluminum based semi-cells were conducted in the early-mid 1980's for
electric automobiles and from 1991-1997 for the NAVY Unmanned Undersea Vehicle
program. There has been no significant development work for lithium semi-cells since the
late 1970's and little system level data exist at all for those systems. Since neither one of
these systems was considered to be available in 1997 they were not selected as a candidate
power system for this contract. Furthermore, there was no indication that any development
efforts for the lithium based systems are being planned in the near future, therefore, no
improvements to the current state-of-the-art were foreseen. There is some interest from the
U.S. Navy in continuing the development of the Aluminum-oxygen semi-cell system (for
submarines) but no programs are being conducted today.
Power Computing Solutions, Inc. NAS2-96011 25

In addition to the relatively low technology readiness levels for the aluminum and
lithium semi-cells, there are system level issues that must be overcome for these semi-cell
technologies to be practical. The main concern is that the reaction products dissolve in the
electrolyte. This degrades the electrochemical performance, thus, the reaction products
must be removed from the electrolyte solution to maintain high performance. This
requirement dictates that extra components be added to the system and causes significant
system level complexities. While it is possible to overcome the system level complexities,
the semi-cells were not included for analysis for this contract due to the low ratings for all
categories except specific energy and energy density.
Flywheels
Power Computing Solutions, Inc. has completed a survey of flywheel energy
storage systems for use in an all electric airplane. Flywheel researchers at the NASA Lewis
Research Center were contacted and participated in this overview of current state-of-the-art
(SOA) flywheel systems and their predicted performance in four years, x" Currently, much
work is underway to study, build and integrate flywheel energy storage systems.
Terrestrially, flywheels are being integrated into hybrid vehicles under the Partnership for
the Next Generation of Vehicles (PNGV) and are also being considered as a dual purpose
energy storage/momentum wheel system for future satellites. A discussion of flywheel
basics, their maximum energy storage potential, and potential synergistic effects are
detailed in Appendix B.
Flywheel Components
A typical flywheel storage system consists of five distinct components:
1. An energy storage rotor
2. A reversible electric motor/generator
3. Bearings to support the rotating components, containment and vacuum housing
4. High/Low-power electronics to convert and condition electrical power as well as
measure and control system functions
5. A structure to support the bearings. ×"_
Electric Motor�Generators
Kinetic energy is transferred into and out of a flywheel system through its
motor/generator set. When operating as a motor, electrical energy is converted to torque by
Power Computing Solutions, Inc. NAS2-96011 26

the motor and applied to the rotor causing it to spin more rapidly. In the generator mode,
the stored kinetic energy is taken from the rotor and, and through the motors
mechanical/electrical coupling adds electric energy to the system while slowing the rotor
down. Each time the motor/generator is used, the inefficiencies of the pair will result in
some power loss. Therefore high efficiency motor/generator sets are required.(see Electric
Motor Section)
Power and Control Electronics
In order to improve the efficiency of power transfer between the flywheel's
motor/generator and the vehicle's other systems, most flywheel systems incorporate high-
power electronics. For several of these types of motor/generator sets, such as permanent-
magnet types that employ pulse-width modulation to vary their power input and output,
power electronics are required. Once again, because all of the power going into and out of
the flywheel system must go through the power electronics, efficiency is very important.
Low-power or control electronics are also necessary to control the addition or removal of
power to the flywheel system. Some autonomous means for up/down loading of power
must be developed and are usually included in a single power/control electronics subsystem
"box".
Bearings
Bearings are required to support the rotating parts of the flywheel system. In
addition to supporting the static weight of these parts, they must also resist the dynamic
loads that are encountered during operation. In addition, the bearing system must provide
for very low drag so that the rotors do not slow down significantly because of friction.
Two types of bearings are used in flywheel systems: ball bearings that support the rotor
mechanically, and magnetic bearings that support the rotor with magnetic attraction and/or
repulsion forces. In all of the applications considered for the electric aircraft, magnetic
bearings were used as the baseline.
Vacuum/Containment
A flywheel rotor spinning rapidly in the air would experience two very undesirable
effects. The first is that large aerodynamic drags would result from the high speed of the
rotors and secondly is that these high speed aerodynamic drags would produce great
amounts of heating of the rotor to the point of potential mechanical failure or combustion.
All flywheels must therefore be encased in an evacuated airtight housing. In addition to
Power Computing Solutions, Inc. NAS2-96011 27
maintainingavacuum,the high energies contained by the flywheel rotor must be contained
in the event of a failure of one of the flywheel components. If a carbon fiber rotor is used
and a failure occurs, the very hot carbon dust, which would be created by the disintegrating
rotor, when exposed to oxygen has the potential to cause an explosion (This has actually
occurred).
Flywheel Energy Storage System Options on the All Electric Aircraft
Flywheels are considered for two types of energy storage systems. The first is for
load leveling, and the second is for the replacement of a battery system. Load leveling
systems store relatively small amounts of energy and cycle frequently during their operation
and in general have high specific power. Flywheel batteries store much greater amounts of
energy and are designed to fully substitute for chemical batteries in electric vehicles.
Load-Leveling Systems
The majority of work in flywheels for load-leveling comes from the work on hybrid
automobiles. During the short periods when extra power is needed (such as hill climb,
passing, etc. ) the stored energy in a flywheel is used to provide these peak power
requirements. As will be shown later by looking at current flywheel systems, flywheels
are particularly well suited to this task with their very high specific power and moderate
specific energy. After the excess required power period is over, the remaining energy
system would then speed up the flywheel to its' previous state with some form of
regenerative braking in the case of the hybrid vehicle or though some other energy source.
In this analysis it was assumed that rapid transients in aircraft power output would not be
required, therefore, flywheels which provide high specific power were not considered as
candidates.
Flywheel Batteries
Performance
Flywheels used as the sole source of energy storage on the vehicle would have to,
in essence, perform just as a chemical battery would. Therefore, flywheel batteries should
be compared directly with chemical batteries. Compared to load-leveling flywheel systems,
the higher ratio of energy to power needed for these "battery" applications are a greater
challenge for flywheels. One distinct advantage that flywheels should have over battery
systems is their cycle life. Table 25 below shows the various USABC goals for battery
development. The battery goals are, in general much better than those shown by flywheels
Power Computing Solutions, Inc. NAS2-96011 28

to datein termsof specificenergy.Table28showsalist of candidateflywheelmaterials
whichhavebeenproposedalongwith theirmaximumenergystoragedensity. Someof thematerialshavebeenintegratedinto flywheelsystemsandtheseareindicatedby a_/.The
maximumtheoreticalspecificenergyfor aflywheelis a little over400W-hr/kg. Carbon
fiber compositespossessthehigheststrengthtoweight ratiofor thecandidateflywheel
rotormaterials.Thisallowsthemto storethesameamountof energyin a lighterrotor than
ispossiblewith othermaterials.Remember,thenumbersgivenaboveareonly for the
rotoranddonot includethemotor/generator,bearings,containmentvesselandpowerconditioningandcontrol. Practicalrotors,thosedesignedto operatein therealworld with
all of theirancillaryequipment,couldperhapsachieve1/2of thetheoreticalmaximumXIV
specific energy.
Flywheel Evaluation
Efficiency
Round trip efficiencies of over 90% have been demonstrated in tests at Oak Ridge
National Laboratory for flywheel systems, xv In comparison most batteries are well below
80%. Several different components lead to the high overall efficiency of the flywheel
system.
The first is high motor/generator efficiencies. Because of the effect for a
rechargeable system the motor efficiency is essentially used for both power input and
power output the efficiency of the set is especially important. Secondly, lowering the
efficiency of the motor/generator set leads to additional heat build up in a vacuum enclosure
which has the potential to reduce life and degrade the components.
A second component of the power loss comes from the aerodynamic drag
associated with the spinning rotor. To reduce this drag, a near vacuum is pulled (10 _ torr)
to obtain run-down times on the order of 200 days. This level of vacuum is achievable
with today's technologies. Another obvious loss mechanism is the bearings used to
support the spinning rotor. However, test of a fully magnetic bearing indicated losses of
less than one percent per day.
Cycle and Calendar Life
Flywheels should have long service lives, especially if magnetic bearings are used.
The bearings and power electronics should provide adequate life for the flywheel system.
The principal life limiting factor is fatigue of the flywheel rotor. Each time the flywheel is
Power Computing Solutions, Inc. NAS2-96011 29

accelerated/deceleratedto extractpower,therotoris fatigued.Enoughof thesecyclesnear
theburstspeedof therotorwill causeafailure. Thesolutionis to deratetheflywheel
speed.Thiscausessomedecreasein theperformanceof thesystembut it isusuallyminimal. Most&the performance predictions in the flywheel literature are based on a life
of at least 100,000 deep cycles.
Cost
Because of the limited number of high performance flywheel systems, cost
numbers high specific energy flywheels are difficult to obtain. The best current estimate
according to NASA is a system from American Flyweel Systems (AFS) with a composite
fiber rotor. AFS estimates that a production run of 20 flywheel battery modules at 40 kWh
each would cost approximately $6,000.00. Given 500 discharge cycles as the target
discharge (corresponding to a 2 or 3 year driving cycle) for a total of 1.5 cents/kW-hr-
cycle. Comparatively a lead-acid battery would be about 22 cents/kW-hr-cycle.
Obviously, flywheel systems cannot be currently produced at these price points but they do
have that potential.
Safety
The primary risks associated with energy storage in flywheel systems arise from a
failure of the rotor. A failure of a fiber composite flywheel cause a vaporization of the
epoxy matrix and the resulting vapor can explode, xvi However, most fiber composite
wheels show a less alarming failure mode by increasing the temperature of the surrounding
materials without explosion and turning the fibers into a "fluffy ball". Of more importance
to the aircraft could be the momentum transfer to the aircraft. Concerns in automotive
applications of a vehicle roll over or spin would most likely be exacerbated for aircraft
applications. One solution to the problem is to reduce the total energy stored in each
flywheel thereby reducing the effects of a failure. This however leads to higher system
mass.
Environmental Interactions
Flywheels should pose little adverse affects on the environment. Especially when
compared with chemical batteries, flywheel systems have few direct wastes and have no
emissions for the life of the unit.
Power Computing Solutions, Inc. NAS2-96011 30

Flywheel Choice
Figure 9 presents all of the known companies currently working on flywheel
systems and their projected specific energy and power. The most promising of the
flywheel systems shown above for solar aircraft appears to be that by U.S. Flywheel
Systems (USFS). This company is entirely privately funded and so most of its' research is
kept proprietary. The USFS flywheel projects a system-level specific power of 600 W/kg
and a specific energy of 132 W-hr/kg, both of which are better than most chemical
batteries. The USFS flywheel uses a fiber composite rotor spinning at 90,000 RPM. The
Energy Density for the system is 109 W-hr/L and a Power density of 489 W/L These
masses and volumes do not include power electronics.
Flywheel Scaling
The following Algorithms were used to scale the flywheel system with the USFS flywheel
system used as a baseline:
Rotor Mass = Energy Storage/Rotor Specific Energy
Motor Mass = Peak Motor Power * Motor Specific Mass (See Motor Correlation )
Bearing Mass = Bearing Specific Mass * Peak Motor Power
Web Mass = 4% * Rotor Mass
Power Conditioning Mass = Power Conditioning Specific Mass * Peak Power
Structure = 100% * Sub total Weight (1997)
= 50% * Sub total Weight (2001)
DRIVE SYSTEM TECHNOLOGY SURVEY
Table 30 shows the results of the drive train qualitative survey. Each of the
components listed in this table is discussed in more detail.
Propellers
The use of a propeller in order to generate thrust for subsonic flight dates to the
beginning of powered flight. The design and use of propellers under most flight conditions
is well understood due to its long history of use and development. However, in certain
Power Computing Solutions, Inc. NAS2-96011 31

areas of flight, such as high altitude (over 70 kft) applications, the history of propellers is
sparse if not entirely absent. There has been very little work done in the design and
construction of propellers that are capable of operating within the regime of interest for this
contract, ie. 90-100 kft. This regime is unique because it requires the propeller to operate
within a low Reynolds Number, High Mach Number flow field. Also, if the same
propeller is used for takeoff and climb then it must be capable of operating over an
extremely large change in atmospheric density. These two concerns are the main obstacles
to designing and constructing a propeller for high altitude, low speed applications. Table
28 shows the relative advantages and disadvantages of the two most commonly used
propeller control systems. Ducted propellers and ducted fans were investigated for this
contract but, in the end because of the large size of the propellers and extreme weight
sensitivity of electric aircraft were considered unsuitable for this application.
History
There is not a lot of history related to the design of high altitude propellers. None to
date have been developed and tested to altitudes higher than 71,000 ft (Pathfinder).
Although there is no direct historical reference to the use of propellers at altitudes between
24.4 km (80,000 ft) and 30.5 km (100,000 ft), the examination of those designed for
lower altitudes will still provide trends that should be applicable to high altitude propellers.
Condor
The Condor aircraft was a high altitude unmanned military demonstration aircraft
constructed in the 1980's as a reconnaissance aircraft. It presently holds the record for
piston driven high altitude aircraft with a flight at 20.4 km (67,000 ft). The propeller used
in the condor was designed by Hartzell Propeller Co. of Piqua OH. It's a variable pitch
three bladed propeller. The propeller blades are of kevlar composite construction. Each
blade weighs approximately 8.2 kg (18 lbs) and the whole propeller system including the
pitch control mechanism weights approximately 74 kg (163 lb).
Perseus A
The Perseus A was designed as an unpiloted atmospheric science vehicle capable of
flight up to 24.4 km (80,000 ft). To date it has reached an altitude of 15.2 km (50,000 ft).
The flight to 15.2 km (50,000 ft) used a 2.8 m (9.2 ft) diameter propeller. This is not the
Power Computing Solutions, Inc. NAS2-96011 32

samepropellerwhichwasdesignedfor useat 24.4km (80,000ft). To datethehigh
altitudepropellerhasbeenusedto altitudesup to 12.2km (40,000ft). Thehighaltitude
propellerhas2 bladesandis 4.4m (14.4ft) in diameter.It is constructedof atubularspar
with a light weightcompositeshellandis designedto absorb50kw (67hp)of powerat
altitude. Thepropellerpitch isactuatedby anelectricmotor. Whenthismotoris inactiveabreaklocksthebladesattheir currentpitch. Thisbreakingsystemenablestheelectric
motorto beshutdownwhennot inuse. Thepropellerbladesweighapproximately7kg
(15.5lb) andthepitchcontrolmechanismweighsapproximately3kg ( 6.5 lb). The
PerseuspropellerwasdesignedusingtheXrotorpropellercodedevelopedatMIT.
Strato 2C
TheStrato2C is ahighaltitudemannedaircraftusedfor environmentalresearch.It
usestwo5 bladedvariablepitchpropellerswith adiameterof 6m (19.7ft). Thepropellers
areconstructedwith awoodensparandacompositeshell. Thepropellerpitch is controlled
by ahydraulicgovernorwhich is drivenby thepropellergearboxandintegratedinto the
gearboxoil system.Dueto thefairly low cruiseRPM(approximately640)a conventionalfeatheringsystemwith counterweightswasnotused. Insteadanall hydraulicsystemis
used.Thissystemhasaseparateemergencyfeatheringpumpsuppliedwith oil out of a
separatevolumein thegearboxoil sump.Thepropelleris designedto absorb300kw (400
hp)or shaftpowerfrom theengine.
Pathfinder
The Pathfinder aircraft constructed by Aerovironment Inc. holds the present altitude
record of 71,000 ft. This aircraft is powered by 6 electric motors and propellers. The
propellers are fixed pitch with a composite construction.
Grob EGRETT
The Grob EGRETT is an atmospheric science aircraft built by the Grob company of
Germany. It is a twin engine propeller driven aircraft. The maximum altitude it has reached
was 16.5 km (54,000 ft) in 1988.
Power Computing Solutions, Inc. NAS2-96011 33

Propeller Concepts and Operation
The ability to transfer power to the air stream is directly proportional to the
atmospheric density of the air. For a given rpm the horsepower absorbed by the propeller
and transferred to the air stream at 24.4 km (80,000 ft) will be about 1/30 th that absorbed
at sea level. Due to this dramatic reduction in performance between sea level and the
cursing altitude a number of concepts have been proposed that can increase the performance
of the propeller through the altitude range. Aside from the airfoil selection and twist of the
propeller blade there are two main factors which will significantly effect the performance of
the propeller at a given altitude. These are the diameter and RPM of the propeller. RPM is
limited by propeller tip Mach number constraints. Typically the propeller tip Mach number
limit is around 0.75 Mach. This is done to avoid the formation of shock waves on the
propeller blade. Shock waves can have a number of adverse effects on the performance of
the propeller. Due to the pressure gradient through the shock wave the drag of the propeller
blade can increase significantly. Also since most propeller blades are fairly flexible once a
shock wave forms the change in the pressure field on the surface of the blade can cause the
blade to twist thereby allowing the shock travel along the blade section. This motion of the
shock wave over the surface of the blade can initiate a flutter in the blade which can
severely reduce its performance if not destroy the propeller. This relationship between the
allowable RPM and diameter is shown in Figure 10. Because of the restrictions on RPM
the most effective way of increasing the output power of a propeller is by increasing its
diameter.
Dual Propeller Concept
The dual propeller concept is based on the premise that if you use two separate
propellers, one designed for low altitude operation and one designed for high altitude
operation, then the overall propulsion efficiency will increase throughout the complete
altitude range of the aircraft. By reducing the altitude range the propeller has to operate
within the propeller design can be tailored to give higher efficiency. A side benefit to this
concept is that it allows for easier takeoff since only the smaller low altitude propeller needs
to be used thereby reducing the necessary ground clearance needed. This concept is
particularly applicable to an aircraft that has only one or two engines / propellers. The
greater the number of engine / propellers that are used the smaller the required propeller
diameter. So as the number of engine / propellers increases the advantage of using a dual
propeller system decreases. Figure 11 shows how the number of engines / propellers
effect the required propeller diameter necessary to produce a given thrust level.
Power Computing Solutions, Inc. NAS2-96011 34
A dualpropellersystemwouldoperateby havingthelargepropellerfixed in a
horizontalpositionduringtakeoffandlanding. Thesmallerpropellerwouldbeusedfortakeoffandclimbto somepredetermineddesignaltitude.After takeoffthe largepropeller
wouldbereleasedandleft to freelyrotatewith thebladesin thefeatheredconfigurationin
orderto minimizedrag.Oncetheinitial designaltitudefor the largerpropellerwasreachedit wouldbelockedto thedriveshaftandthepitchangleadjustedto its propersetting.The
smallerpropellerwouldbeleft to rotatewith thelargerpropelleralthoughits contributionto
thethrustgeneratewoulddecreasesignificantlyastheaircraftcontinuedto climb in altitude.
Oneof themaindrawbacksto thedualpropellerconceptis theextraweightand
complexityof thedualpropellersystem.A dualshaftisneededwhichwouldallow the
largepropellertorotateindependentlyof thesmallerpropeller.Thelargepropellermust
alsobecapableof rotatingfreelyof thedriveshaftandthereforemusthaveaclutch
mechanismto engageanddisengageit from thedriveshaft.Boththelargeandsmall
propellerwouldalsoneedits ownpitchcontrolmechanism.And finally thecontrolsystem
neededto operatethedualpropellersystemwouldbemuchmorecomplicatedthenthat
usedfor a singlepropellersystem.
Variable Diameter Propeller
Sikorsky Aircraft has recently done work on developing a variable diameter
propeller for a tiltrotor aircraft. The ability to vary the diameter of the propeller throughout
the flight would have significant benefits for a high altitude aircraft. As the air density
decreases the diameter could increase in order to keep the thrust generated constant. It
would also aid in takeoff and landing by reducing the ground clearance needed by the
aircraft. However, the present state of the art of this type of propeller does not lend itself
toward use on a light weight high altitude aircraft. The propeller presently under
development is for a vertical takeoff and landing aircraft. The requirements for this aircraft
are much different then those of a high altitude aircraft therefore the weight and power
absorption capability of this propeller would not be applicable. Also the present propeller
is capable of extending its diameter approximately 30%, for high altitude aircraft
applications the percentage increase would need to be greater, on the order of 50% or more.
It is possible to continue development of the concept toward a propeller which would be
usable by a high altitude aircraft however the cost and timeframe associated makes this
development prohibitive. Although this concept is interesting, due to its present state of
early development and lack of synergy with present development programs this concept
Power Computing Solutions, Inc. NAS2-96011 35

cannotbeconsideredasaviablealternativeto aconventionalpropellersystem.
Application of Propellers
For a solar powered aircraft there are some unique requirements that may influence
the type of propeller selected. As with Pathfinder, solar powered aircraft will have a very
low wing loading. In order to achieve this it is beneficial to distribute the weight of the
aircraft over the length of the wingspan as much as possible. The power generation is also
unique in the respect that it is not centralized at one location in the aircraft but rather
distributed over the entire wing surface. Because of these two issues it can be seen how a
multiple engine aircraft with the engines spaced evenly along the wing span would have its
advantages. From Figure 12 it can be seen how the diameter of a propeller will decrease
with the addition of multiple engine / propeller systems. There are however some positive
and negative effects of reducing the propeller diameter. The maximum RPM the propeller
will be capable of operating at will increase as the diameter is decreased, as shown in
Figure 11. This has a positive effect on the propeller performance since the propeller can
now run at a higher Reynolds number. However the efficiency of the propeller and its
output thrust will decrease as the diameter is decreased. This is shown in Figure 13. For
this analysis an efficiency of 85% was used over the entire range of operation.
Electric Motors
It must be recognized that all electric motors are AC (alternating current) motors.
Direct current (DC) motors must have some mechanism provided to form the inversion
function. In the case of brush type machines, for example, the brushes acting upon the
commutator switch the motor windings to invert the currents. As the speed of any AC
motor is a function of it's source frequency, variable speed operation of a motor requires
supplying a variable frequency drive synchronous with its rotation. Establishing rotor
speed and/or position necessitates that some form of rotor sensing be provided. Depending
upon the type of motor used, rotor sensing could consist of speed, and perhaps position.
Electronically controlled motor drives have reached a high level of sophistication, with the
power voltage ratings of the electronic switches being the principle present limitation. An
understanding of the differences between fixed bus operation from a utility source, and
operation from an electronically controlled source having both variable voltage and variable
frequency has allowed motors to be designed specifically for electronic control. One major
systematic difference with electronically controlled motors is that when they are operated as
constant power devices they exhibit a negative input impedance. This impedance is a
Power Computing Solutions, Inc. NAS2-96011 36

consequenceof maintainingconstantpower. For example,if thesupplyvoltagedrops,themotorcontrollerwill drawincreasedcurrentto maintainthepower. Theeffectsof negative
inputimpedancemayvaryfrom increasedvoltagecrosscouplingto totalsysteminstabilitywhenseveralsuchloadsshareacommonbus. In orderto identify suchsysteminteractions
a completehighfidelity systemmodelof thesource,thecontroller,themotor,andtheload
dynamicsmustbeimplemented.
Other Systematic Interactions of Electric Motors
One item of particular importance is that when motors are being driven, energy may
flow in either direction. In addition to the "forward" energy supplied to the load, reverse
energy may result from overhauling or pulsating loads such as aerodynamic forces acting
upon a control surface, or a propeller being shadowed by a fuselage (this may be more
prevalent in a "pusher" aircraft configuration). Reverse energy also results from uncoupled
energy being returned to the source. This is often considered as a power factor effect but it
actually represents over-excitation of the motor for its particular operating point, caused by
improper design. The power system must be capable of accepting this reverse energy if
serious voltage transients and system interactions are to be avoided. In particular, diodes
must be avoided in the input. These dynamic load effects are not defined by either the
vendor of the motor, or that of the controller. Also, the dynamics of a motor/controller
combination are not easily measured during static testing conditions such as those provided
by dynamometers. As a result, system interactions such as reverse currents, crosstalk, and
electromagnetic interference (EMI) have been greatly underestimated during the system
design stage and surprises have occurred during operation. Today, dynamic test loads are
available for lower powered machines, and adequate computer models are available to
define system interactions once a total system design is complete. In as much as many of
these effects are based upon currents that do not create useable torque, proper operation of
the motors can do much to avoid their creation.
Electromagnetic Interference (EMI)
As electronically controlled motors will be operating with high transient currents,
the various motors operating simultaneously are potential sources for mutual interference.
To achieve electromagnetic control while minimizing system mass will require recognition
of the peculiarities of each motor with its driver and their systematic interactions and
impacts. In particular, any circulating energy must be contained within the smallest
Power Computing Solutions, Inc. NAS2-96011 37

possiblevolume,themotordrivesystemmustbelinealin all four quadrants, and inductive
current effects must be controlled by exploiting cancellation effects such as that experienced
with strip line conductors. High frequency transients associated with "Hard Switching" of
the power electronics should be avoided through design. EMI testing during dynamic
operation of the motors will require an elaborate test facility, and ultimately will rely upon
system simulation of the dynamic effects. Electromagnetic control (EMC) is vital, many
system failures previously attributed to external interference have been in fact self-induced
system interactions.
Brush Motors
Brush motors are the most highly developed and the least expensive. The short life
of the brushes at high altitude, maintenance in general, and electrical noise are major
technical problems. These motors may be either voltage controlled, or have their back emf
varied by field control. For most aeronautical applications, these motors have been
replaced by the so-called brushless motors.
Brushless DC Motors
A brushless DC motor is one in which the field excitation is provided by permanent
magnets, and the brush (switching) function is performed by semi-conductor switches. It
is classes as a fixed excitation synchronous machine. Control of the switching
semiconductors requires establishing the actual position of the rotor. These motors were
developed in order to avoid the problems experienced with brush type motors and have
found wide application in lower powered machines. Control of this type of motor is
generally achieved by varying the supply voltage. Field weakening to deliver more torque
at higher speeds is achieved only at the expense of reduced power factor. These motors
have been developed for terrestrial applications including electric vehicle traction drives, but
due to cost considerations, systems with high power densities and high multiple
horsepower ratings at present seem to be largely limited to military applications. With these
motors, maximum power and maximum efficiency occur at different operating points
which makes careful analysis of the vendor data mandatory.
Power Computing Solutions, Inc. NAS2-96011 38

Induction Motors
Induction motors are potentially the least expensive and certainly the most rugged of
the available motor types. Optimum control of an induction motor is possible when both
frequency and voltage are independently controlled (Field Orientation). Due to their
asynchronous operation, induction motors are more easily designed to avoid torque
conflicts than synchronous machines when operated in situations requiring torque
summation. These motors have simple rugged construction and are torque controllable
over a wide range of speed, easily over a 3:1 RPM range. Their characteristic rotor loss
may be minimized through design, but remain a concern to be addressed for high power or
high altitude operation. The many advantages of induction motors have made them the
most popular machine for present day electric vehicle propulsion for applications up to
several hundred horsepower. NASA LeRC has spent several years in the development of
induction motors and the associated field oriented controllers to a high state of
development. Detailed dynamic system models devised by Krauss and Associates of
induction motors and controllers are available and readily adaptable. For application to the
main propulsion system, high speed induction motors would be prime candidates. Other
motor requirements would have to be evaluated on actual systematic trades. One possible
concern would be the cooling of the rotor, particularly at altitude.
Switched Reluctance Synchronous Motors
Switched reluctance synchronous motors have highly salient poles having minimum
mutual coupling. They are simple rugged machines which display low rotor loss. Due to
the lack of coupling between phases, they may continue to operate under some failure
modes. These machines have been developed in large sizes most noticeably as military
aircraft starter generators, but few civilian applications have been made to date. As a result
of their limited application, their system costs are still high. The control of these motors in
four quadrants is complex, and characterized by high transient currents returning back into
the power system. The power factor of these machines is generally lower than that of
competing machines, and their output torque is subject to pulsation, nevertheless, the
switched reluctance motor remains a viable option for propulsion.
Permanent Magnet Induction Motors
The University of Wisconsin at Madison has been developing a motor that
combines some of the characteristics of induction and permanent magnet machines.
Power Computing Solutions, Inc. NAS2-96011 39

Althoughresultsarepromising,no industrialbaseexistsfor eitherof thesemotors,or fortheir controls.
Axial Flux Motors
These machines are generally most suitable for very high speed applications. Their
rotors are typically comprised only of magnetic material with all windings located
externally. One variation would be the conventional automobile alternator which uses a
combination of axial and radial flux paths with the rotor winding consisting of a solenoid.
Several types of these machines exist: The Lundell such as that used in NASA LeRC's
Brayton Cycle Generator, The Rice and more recently the "Electric Turbine" (American
Motor Systems). As a group, these high speed machines display poorer performance than
more conventional types. As a result of the increased air gaps and the resulting higher
leakage reactance, as a group, they are longer, heavier, and less efficient.
Variable Speed Operation
Every motor develops a generated back emf proportional to its excitation and
rotational speed. In any system, physical limits such as source voltage, component
limitations, arc over, etc. limit the maximum voltage available. Similar limits apply to the
maximum available current to avoid power quality problems. Figure 14 qualitatively
depicts a typical motor torque vs. speed characteristic with limits upon current and voltage.
Maximum current (Point 1) may be drawn until limited by the back emf (point 2). Field
weakening allows higher speed at reduced torque, resulting in constant power operation
(point 2 to point 3). Square law loads such as those from variable pitched propellers would
appear as shown in the figure. Efficiency characteristics of a typical induction motor
appear as shown in Figure 15. By varying the voltage to frequency ratio, high efficiency
may be realized over a wide range of speed. Relatively complex controls are used with
induction motors in high power servo applications. However, propulsion systems do not
require servo type bandwidths which are typically several hertz. The reduced torque rate
requirements will simplify the control and optimization of efficiency or torque per amp
rather than torque response. Such control schemes are under development at Paul Krauss
and Associates (West Lafayette, IN) and at Motive Power Development (San Diego, CA).
Once maximum efficiency is obtained over a wide operating range, a fixed gear reduction
could represent the minimum mass system if the propeller characteristics would
Power Computing Solutions, Inc. NAS2-96011 40

accommodatethis. If avariablepitchpropelleris required,controllingthemotortorque
duringpitchchangeswould reducethegearloadingexperiencedduringbothpitchchange
andoperation.
Power Densities of Electric Motors
The torque developed by a motor is a function of the magnetic flux density and the
area of the air-gap (rotor surface). This leads to the concept of"Magnetic Shear" which
may be on the order of 10 psi at the available flux density and the resulting torque is, in
turn, more dependent upon the magnetic material being applied than the particular machine
type. For equally sophisticated machines, the power densities realized are subject to the
same physical laws and limitations. The "soft" magnetic materials presently applied to high
power density electric motors may be placed into two categories: Silicon Iron materials,
typified by flux densities of 1.5 to 1.9 Tesla with material costs of dollars per pound and
materials containing Cobalt exhibiting flux densities of 2.2 to 2.5 Tesla and costing over
fifty times more. This increased performance at the expense of greatly increased cost has
tended to group high performance motors into two groups. In military/aerospace
applications, the systematic advantage of lower weight is a good trade against system
performance. For civilian applications, particularly those which anticipate eventual volume
production, the high fixed cost of the high flux density materials is prohibitive.
If the flux density of a motor is maintained constant, its torque is constant and the
shaft power will vary directly with its rotational speed. There are limitations to motor shaft
speed, rotor critical speed, rotor surface speed, the gearing required to match the rotor to
the load.
Scaling Laws
If the speed and magnetic flux density of a machine is held constant, the current
rating of its windings will increase as the square of dimensional change due to the increased
cross section of the conductors. The total flux in the magnetic path will increase as the
square of the dimensional change, as will the voltage rating. As a result, the power
capability of the motor increases as the fourth power of dimension. The machine volume
and weight will vary as the cube of the dimension. As a result, power density of a motor
will increase as the 4/3 power. In actual experience, this is somewhat optimistic. The
California Department of Energy scales electric vehicle traction motors as:
Power Computing Solutions, Inc. NAS2-96011 41
Weight(lbs.)=5000x(horsepower)/RPM
with additionalfactorsof 3 for inductionmotorsand5for permanentmagnetmotors. As
thisratioignorestheadvantageof scale,it is suspectfor applicationoverawidepower
level rangebut shouldprovideadequatescalingfor ourpowerrange.
Somequalitativemotorcharacteristicsareshownin Table 29. For this effort, both
a DC brushless machine and an induction machine were selected as baseline motors
because of they appear to be the most adaptable for civilian motive applications. The
baseline induction motor selected for this study is one that was developed by Sundstrand
under a contract to NASA LeRC. That contract did not require that the motor be optimized
for any particular configuration or application. Its dimensions are 4.25" diameter, x 10"
length (including the resolver) for a volume of 142 in) (2.33 1), single or dual stator, and it
weighs about 9.1 kg (20 lb.). Half of that weight is comprised of the electronics and the
other half of the weight is comprised of the housing. Peak RPM is 14,600 with 300 in.lb.
torque with a constant operational efficiency of over 95% at a nominal power of just over 8
kW. For the brushless DC motor, the baseline mass was 7.4 kg (16.3 lbs.), the baseline
volume was 86 in) ( 1.41 1) with nominal power of 5 kW at 95% efficiency. For the
1997 performance baseline, the scaling laws described previously (i.e., power density
changes with 4/3 power of dimension and volume and mass each change with 3rd power of
dimension) were applied to the baseline motor characteristics listed above. For the 2001
performance baseline, a 1/3 reduction in volume and mass from the 1997 baseline was
assumed. It was determined that the 1/3 reduction in both mass and volume could be
achieved through reductions primarily in the motor housing. While the option for the
brushless DC motor was available, there was no significant difference in calculated motor
performance between the induction motor and the brushless DC motor. Hence, since the
actual data were available for the induction motor, the simulation cases reported later
incorporated the induction motor.
Electric Aircraft Gear Train and Transmission
Shaft power leaving the electric motor in the all electric aircraft is connected to a
propeller through either a simple shaft rotating at the same speed as the propeller or is
coupled through a transmission of some type which provides either fixed or variable
multiplication of the motors speed. When used, a transmission(single/multiple ratios or
Power Computing Solutions, Inc. NAS2-96011 42

continuouslyvariable)providessomeamountof decouplingbetweentheelectricmotorand
thepropellersothataircraftperformancewill beenhanced.
To findbestaircraftperformance,atradeis performedby couplingdifferentmotors
with apropellerwith andwithoutspeedreductionsandtransmissionsandstudyingaircraftperformancevariations. Mostof themotorsconsideredcandidatesfor thisclassof aircraft
(BrushlessDC,andInductionMotors)whencoupledwith modemcontrolsystemscan
operateefficientlyoverawiderangeof speeds(about3:1)withoutsufferinga major
reductionin efficiency.Figure16showsatypicalDC Brushlessmotorefficiencyplotasafunctionof speedandtorqueoutput.×v_i
AerovironmentsPathfinderaircra_usesBrushlessDC electricmotorsdirectly
coupledwith eachpropeller.Thesepropellersturnfrom 600RPMat sea-levelto 1,800
RPMSat 100kft whenoperatingat full powerandhaveafixedpitch,xvi" Themotors
electroniccontrollerlimits themotorto 2,000RPM.
Smallhighspeedmotorsproducethehighestpoweroutputperunitweightbut,
whencoupledwith theentireaircraftmaynotprovidefor thelowestaircraftweight.
Severalof thepotentialmotorcandidatescanoperateathigh speeds( >2,000rpm). Inaddition,thesehighspeedmotorswill needtheadditionof aspeedreductiontransmission
whichaddsweightto theto theaircraft. Thismaynotprovidethebestoverallaircraft
performanceunlessatransmissionisused.Forthis study,severaltypesof transmissions
wereconsidered.Theywere: thesinglespeedreductiongearbox, themulti-speedgear
box,andtheContinuouslyVariableTransmission(CVT). Eachof thesewill bediscussed
in greaterdetailbelow.
Single/Multi-Speed Gear Box
The single speed gearbox offers the ability to couple a high speed motor with a low
speed propeller with the simplest transmission system (excluding straight shaft coupling).
While providing a light weight solution, the single speed gearbox may require that the
motor have a relatively wide operating range (high efficiency over a wide speed range)
and/or that the propeller have a variable pitch mechanism.
A multi-speed transmission offers the ability to operate the motor/propeller
combination at higher combined efficiency points over its operating range and/or may
eliminate the need for a variable pitch propeller. The single/multi-speed gear box
algorithms are based on data received from NASA Lewis Research Center? TM NASA
Lewis provided the following guidelines for the analysis.
Power Computing Solutions, Inc. NAS2-96011 43
A typicalwell engineeredspurgearboxefficiencyhasa.5%losspergearmesh
includingfourbearings.For spiralbevelgearseachmeshlosswouldbeabout.75%. A
satisfactorymethodof estimatingweightfor atransmissioncanbefoundusingabout.050
lbs/ft-lb of outputtorqueplus5lbs for eachclutchand5 lbsfor eachbreak.
Forthisanalysisit wasassumedthatEpicyclicGearingwouldbeused.Epicyclic
gearingis afamilyof geararrangementswhichincludestwo of themostcommongeartypes:planetaryparallelshaftdrivesandthebevelgeardifferential.For aPlanetarygear
arrangementtherangeof ratiosnormallyusedis from 3:1to 12:1.xx Forthis analysisif
therequiredgearratio isgreaterthan12:1,two Planetarygearsetsareusedandthe .050
lbs/ft-lb of outputtorqueis doubled.
Continuously Variable Transmissions (CVT)
The CVT, invented in 1886 can achieve infinitely many gear ratios over it's
operating range. This allows the motor/propeller combination to operate at its highest
efficiency points over its entire range of operation. Many types of CVT's have been
designed for the conventional automobile. In addition, considerable development has taken
place to integrate flywheel/CVT systems into hybrid vehicles. TM Currently Volvo and
Honda offer CVT's on passenger cars. Honda offers the Civic CVT which can be
purchased in the U.S.
Four types of CVT's were compared for this study. The Steel V-belt, Flat belt,
Toroidal traction, and the Cone-roller traction. Figure 17 shows an overview of the V-belt
Van Doorne CVT.
Transmission Analysis
For this analysis each of the transmission candidates were modeled to the same
criteria so that a comparison could be made. For the four CVT candidates, an earlier
NASA study ×x_iwas used as the guide, while for the single/multi-speed gear box systems
the previously discussed algorithms were used.
In order that each system was compared at the same power/torque throughput, the
NASA design study for the CVT's is used as the baseline. Each of the transmission
candidates were required to have a maximum output torque of 330 ft-lb, a maximum
Transient Power of 75 kW, and a RPMin/RPMout of 21,000/3000. Reliability for the
CVT's was set at 90% for 2,600 hrs at 16 kW (the same as current automatic
transmissions).
Power Computing Solutions, Inc. NAS2-96011 44

Figure 18showsaweightcomparisonfor thevarioustransmissioncandidates.
ThisshowstheSingle/multi-speedreductiongearboxweightlessthan1/2thatof the
lightestCVT theCone-rollerTractionSystem.Figure19showsspecificpowerasa
functionof transmissiontype.
Figure20andfigure21showspeakefficiencyasatransmissiontypeandtransmissionefficiencyasafunctionof speedfor theCVT candidates.Efficiencyfor the
single/multispeedgearbox isassumedconstantoverit's operatingrange.While all theCVT's haverelativelyflat efficiencycurves,nonecomparewith theefficiencyof
single/multi-speedgearboxsystem.While thesetransmissioncomparisonsweredone,at
significantlyhigherthroughtorquethanthefinal aircraftcandidatemotorsrequired,the
relativesizesandefficienciesshouldholdovertheentirerange.
Final Selection
With theonly remainingcandidatesbeingthesingle/multi-speedgearboxes,a
comparisonbetweentheweightof ahighspeedmotorcoupledwith agearreductionvs.aheavier,slowermotorneedsto bemade.Thiswasdoneusingthecorrelationsfor
transmissionsandelectricmotorsdiscussedearlierin thereport. Assumingahighspeed
motor(50,000rpm)coupledwith asinglespeedreductiontransmission,which allowsthe
propellerto operateatup to 2000RPM,yieldsatotalweightof 1pound.Thereductioninmassfor a 1kWemotorwhengoingfrom ahighspeedmotorto a low speedmotor
increasesmotorweightbyoverapound(seespeed-powerrelationshipin electricmotor
section).Dueto theaddedcomplexityof asinglespeedtransmissionandafterconsultationwith NASA Amesit wasdecidedthattheno transmissionwouldbeused.
SOLAR ELECTRIC AIRCRAFT MISSION SIMULATION
RESULTS
The original intent of using the 12 design missions chosen by NASA was to
evaluate electric propulsion systems' feasibility on missions of scientific interest. It was
originally anticipated that different combinations of equipment would be needed to meet the
different requirements and that some missions would be just too demanding to meet with
any combination. Neither case proved true. Table 31 shows that for all twelve missions
considered, the multi-junction cells would provide an aircraft which could meet every
mission. Indeed, all of the solar cell candidates would provide, without energy storage an
aircraft capable of meeting the mission requirements (shown in Table 1) except for
Power Computing Solutions, Inc. NAS2-96011 45
amorphoussiliconcellswhichwouldcouldnotmeetthe 1000km ROA missionat either90
or 100kft for the 150kg and225kg payloads.While thesizeof theUAV changedto meet
thevaryingrequirements,all missionscouldbesatisfiedby thesamemix of technologies.
Thiswasanimportantandsurprisingconclusion;however,it left manyquestionsunanswered.Therefore,astrategyof identifyingkeyquestionsof interestandtestcases
designedto addressthosequestionswasdevisedin consultationwith NASA Ames. In
orderto limit thevastarrayof permutationspossible,asignificantdownselectof missions
wasrequired.To thisend,oneof themostdemandingmissionswasselectedasabaseline,to which individualmissionsandtechnologicalchangeswerecompared.
Baseline
A Baseline Case was selected in order to make relative aircraft comparisons
between the various energy storage candidates, drivetrain components, and mission
options. This Baseline case was then used to make decisions about the relative advantages
and disadvantages of various technologies and missions and to help reduce the size of the
trade space. This baseline case is used as the comparison point unless a particular trade
would better be highlighted through a different mission or airframe choice. All variations
from the baseline are listed in the text below.
The baseline mission parameters selected are as follows:
• 25 degree latitude:
• 1000 km radius of action(ROA)
• 100 lift maximum altitude
• 1997 Technology Components
• Silicon Solar Cells
• Aspect Ratio of 20
• 150 kg Payload
• June 15 Mission Start Date
• Span Loaded Airframe.
Using Power Computing Solutions, Inc. Solar Aircraft Analysis Code (SAAC)
any combination of mission and energy source/energy storage technologies can be
simulated. This however does not ensure that the required missions will be successful with
the aircraft components and time of year/latitude selected. SAAC was used to provide all
the results shown below.
Power Computing Solutions, Inc. NAS2-96011 46

Figure 22 shows a plot of cruise power(level flight), available power from the solar
arrays, and altitude as a function of time. The aircraft takes off when the available power
and the cruise power are equal and, when excess power is generated it is translated into lift.
Table 1 shows a SAAC summary output for an aircraft which will fly this required mission
profile.
Figure 23 shows true and indicated velocity as a function of altitude. Clearly the
indicated velocity is almost constant over the entire climb to altitude but true velocity is
changing as a function of the square root of the relative density ratio. Figure 24 shows
aircraft range and altitude as a function of mission time. From Figures 23 and 24 it is
clear that for those missions where range determines the wing size, an aircraft which can
quickly climb to altitude and cruise at high velocities is preferred.
Figure 25 shows the induced and profile drag coefficients for both the tail and the
wing on a span loaded aircraft. The tail, in this case is the airfoil used for trim drag.
Notice that Wing induced drag drops with increasing altitude but profile drag increases for
both the wing and the tail. This drop in induced drag is a direct result of the falloff of the
lift coefficient (CI) with Reynolds number in the thin air of the upper atmosphere for the
Liebeck airfoil. (See Appendix A) The Tail induced drag is very small because the size of
tail chosen and the low trim forces required. Figure 26 shows the Reynolds number fall
off of both the wing and the tail as a function of altitude. The much lower Reynolds
number of the tail is due to the smaller cord length.
Figure 27 shows the aircraft total drag and its' constituent components as a
function of altitude. Clearly the wing makes up the vast majority of the drag because of its
large size. The other components are all less than an order of magnitude lower with the
fuselage drag being the smallest.
Size Figure of Merit
It is general practice in the aviation community to use gross weight as an indication
of overall aircraft size. While this works well for more conventional designs, it has less
utility for solar powered UAVs. The reason is that important comparisons can be inferred
from gross weight, like overall cost and relative size. With solar powered UAVs, these
values cannot be reduced, and therefore inferred from weight. Since the cost of these
machines is dominated by the solar cells and the physical size of the vehicle is very much
larger per pound than one is generally used to, a better figure of merit to use is wing area.
This is true because solar power is bought by the square meter. Also, for a fixed aspect
Power Computing Solutions, Inc. NAS2-96011 47

ratio ( which dominates this study), both wing span and chord can be easily inferred.
Weight will still tend to track with wing area as long as solar cell class and aspect ratio are
held constant, but will not otherwise. As an example, results to be presented later show
that while the synergistic amorphous silicon and multi-junction solar cells yield essentially
the same wing area ( and are therefore physically the same size vehicles), the multi-
junction solar cell design has twice the wing loading. This implies that the gross weight is
twice as large. However, payload and range are unchanged, so the lighter design should
be more attractive. Or is it? Very low wing loading introduces many operational recovery
issues and generally lower flight speeds. This could mean that the heavier, higher wing
loading design would be more operationally flexible. At the very least, it is obvious that
using weight as a figure of merit is inadequate, and that using wing area is better for this
class of air vehicles.
Span Loading vs. Twin-Boom Aircraft
Because of the unusual flight regime in which this aircraft will be required to fly, a
fundamental question arises as to how the aircraft should be configured. There are two
distinct categories of aircraft which this contract delved into, the span loaded airframe and
the Twin-Boom. The first is a "flying wing or span loaded" airframe which utilizes a low
pitching moment airfoil which has this pitching moment compensated by a tail integrated
under the trailing edge of the primary airfoil. The second is a Twin-Boom airframe which
uses a primary airfoil with better low Reynolds number characteristics (when compared to
the span loaded wing) with a higher pitching moment, which requires a boom cantilevered
tail be used to counteract this large pitching force.
Because of the low Reynolds number, effects on the primary airfoil should be seen
most clearly for the highest flying aircraft, where this low Reynolds number is experienced
for the longest time (See Figure 26 above). The baseline case for this comparison is as
follows:
• 0 degree latitude
• 1000 km radius of action(ROA)
• 100 kft maximum altitude
• 1997 Technology Components
• Single Junction Solar Cells
• Aspect Ratio of 20
Power Computing Solutions, Inc. NAS2-96011 48
• June15MissionStartDate.
Figure28showsabarchartof wing areaasafunctionof payloadfor bothTwin-BoomandSpanLoadedairframes.Thisfigure showsthatawing areareductioncanbe
achievedby selectingaspanloadedairframeoveratwin-boomconfiguredaircraftfor all
payloadmassesatthesemissionselectedparameters.Figures29and30showtotal aircraftdragasafunctionof altitudefor anaircraftwith a75kg and225kg payloadrespectively.
With the largerpayloadsandwingsthetwin-boomaircraftbeginsto realizesomeof the
potentialof thebetterperformingairfoil,but still overallproducesalargeraircraft.
Becauseselectedaspectratiohasadirecteffectonchordlengthandtherefore
Reynoldsnumber,thechoiceof anaspectratioof 20needsto beevaluatedin thecontextofselectinganairframetype.To morefully exploretheeffectof aspectratiosonaircraft
performance(bothtwin boomandspanloadedairframes)additionalrunsweremadeat
aspectratiosof 10and30. Figure31showstheeffectof aspectratioonaircraftwing size.
Clearly,for low aspectratiowings(relativelyhighReynoldsnumbers)thereis a significantadvantageto thespanloadedairframe.As aspectratiosincrease,theadvantagesof the
superiorlow Reynoldsnumberbehaviorof theWortmanairfoil appearsand,at anaspectratioof 30providesthetwinboomaircrafthasasmalleroverallwing areathanthespan
loadedairframe.Figure32showswing spanasafunctionof wing aspectratio. While the
overallwing areadoesindeedgodownastheaspectratio is increasedthewing spanhasa
minimumataroundaaspectratioof 20.Becausewing spanisan importantoperationalconstraintin aircraftof thesesizestheaspectratiofor this studywasselectedat20. The
spanloadedairframeisusedfor comparingtheremainingenergysources,drivetrain
components,andmissions.TheAerovironmentPathfinderaircrafthasaaspectratioof12.3.
Latitude Variations
Mission flexibility is a key for almost any aircraft. In the case of the all electric
aircraft, the ability to operate over a wide range of latitudes greatly increases its value to the
user. Figure 33 shows a plot of aircraft wing area as a function of latitude for four
different solar cell types for aircraft with the following characteristics:
• 0 degree latitude
• 0 km radius of action(ROA)
• 100 kft maximum altitude
Power Computing Solutions, Inc. NAS2-96011 49

• 1997TechnologyComponents
• 150kgPayload
• AspectRatioof 20
• June 15 Mission Start Date
• Span Loaded Airframe.
The largest aircraft by a significant fraction is the amorphous silicon aircraft where
the integration of the aircraft skin and the amorphous solar cells is not possible. Multi-
Junction silicon cells provide the best performing aircraft at all latitudes, while single
junction silicon cells make an airframe about double the size of the multi-junction system.
While currently considered 2001 technology, amorphous silicon cells integrated into a
mylar covering of the wing provides significant performance enhancements over both the
plain amorphous and the single junction silicon cells. In addition, Figure 33 clearly shows
that either a multi-junction aircraft or the synergistic amorphous both provide better "wide
latitude" mission capability with little change in overall aircraft size. Also notice that during
missions with a 6/15 start date, the minimum aircrat_ size is not found when operating the
aircraft at the equator but rather when operated from about 20 to 30 degrees. This is due to
the increased length of the day at these mid latitudes at that time of year while still providing
a high enough sun angle to not greatly affect the performance of the cells. At higher
latitudes, while the daylight is longer at this date the low sun angles produce aircraft of
increasing size.
A second factor which impacts directly on operational capability of an aircraft is
wing loading. Figure 34 shows wing loading as a function of latitude for these four solar
cell types. Interestingly, while the synergistic amorphous and the multi-junction aircraft
both provided similar airframe wing areas, the multi-junction system provides significantly
higher wing loading than the amorphous aircraft, leading to a selection of a multi-junction
airframe as the preferred candidate if these are the only parameters considered. Multi-
junction cell issues arise when compared with amorphous silicon on the basis of cost,
aircraft installation, and fragility.
Figure 35 shows wing area as a function of latitude for the same mission
parameters as given above except that a 1000 km ROA is required. Aircraft with non-
synergistic amorphous silicon cells did not provide a solution at any latitude so they are not
included in this chart. Once again, multi-junction and synergistic amorphous cells provide
the smallest airframes while single junction silicon cells produce about a doubling of the
multi-junction wing area. Figure 36 shows wing loading as a function of latitude for this
Power Computing Solutions, Inc. NAS2-96011 50

missionandincreasesthewingloadingdifferentialbetweenamorphousandmulti-junctionaircraft.
Time-of- Year Variations
Along with the ability to operate over a wide latitude, the ability to operate at all
times of the year improves aircraft capability. Figure 37 shows wing area as a function of
time of year for an aircraft with the following characteristics:
• 25 degree latitude
• 1000 km radius of action(ROA)
• 100 kft maximum altitude
• 1997 Technology Components
• 150 kg Payload
• Aspect Ratio of 20
• Span Loaded Airframe
• Single Junction Silicon Cells.
Between a March 15 start and June 15 start a difference in wing area of about 50%
is found. Between March 1 and March 15 an increase in wing area of over 100% occurs.
No solutions were found for January or February mission start times. The dramatic
increase in plane size required to accomplish the mission is the result of the lower sun
angles and limited daylight. This combination make solar aircraft operations earlier than
mid March or after late October highly unlikely for this mission.
General Solar Cell Parametrics
While not a requirement of the study, it is useful to look at aircraft size trends as a
function of solar cell parameters. While it is obvious that higher efficiency solar cells in
combination with lighter weight solar cells provide better aircraft performance, how much
and at what cost remains the key issue. Should great expense be placed in obtaining the
highest performing, lightest weight cell s or could nearly the same performance be realized
by less costly, lower performing cells?
Figure 38 shows wing area as a function of solar cell efficiency for an aircraft with
the following characteristics:
• 0 degree latitude
Power Computing Solutions, Inc. NAS2-96011 51

• 100 kft maximum altitude
• 150 kg Payload
• Aspect Ratio of 20
• Span Loaded Airframe
• 6/15 Mission Start
• Solar Cell Specific Mass of 1.0 kg/m2.
The range of solar cell efficiencies was chosen to span the range from low
efficiency amorphous to high efficiency multi-junction cells. Clearly, when choosing
between low and high solar cell efficiencies, both the 0 km ROA and the 1000 km ROA
benefit from higher efficiency cells. Using a constant specific mass cell ( 1 kg/m 2) dramatic
increases in wing area occur below solar cell efficiencies of 20%. Above about 20 %
however, the slope is quickly flattening out. For the 1000 km ROA a greater benefit can be
achieved by going to higher efficiency cells. Going from 20% efficiency cells to 25%
efficiency cells, a reduction in area of about 30% occurs for the 1000 km ROA while for
the 0 km ROA a reduction in wing area of about 20% occurs.
Figure 39 shows wing loading as a function of solar cell efficiency, and as expected
shows increases in wing loading as a function of increasing solar cell efficiency. Wing
loading is increased by 38% for the 1000 km ROA and by 36% for the 0 km ROA.
Figure 40 shows wing area as a function of solar cell specific mass with the range
representing the range of mass from the amorphous silicon cells to SOA multi-junction
cells. For these cases, solar cell efficiency was held constant at 15%. Once again
significant reductions in wing area can be found by reducing solar cell specific mass.
Reductions in wing area from 225 m 2 to 150 m 2 (33 % reduction ) occurred when reducing
solar cell specific mass from 1. kg/m 2 to .2 kg/m 2 for the 0 km ROA case while reductions
from 325 m 2 to 175 m 2 (53% reduction ) occurred when going over the same range of solar
cell specific masses for the 1000 km ROA case. Figure 41 shows wing loading as a
function of solar cell specific mass for these same two cases. A reduction in wing loading
of about only about 3.5 % occurs for the 0 km ROA case while for the 1000 km ROA a
reduction of 5% occurred. Obviously, the only way to significantly improve wing loading
is to increase the solar cell efficiency.
Power Computing Solutions, Inc. NAS2-96011 52

Performance Baseline Effects on Aircraft
Figure 42 shows the effects of 1997 technology and 2001 technology on the all
electric aircraft. Comparisons are made on predictions of solar cell performance for the
single junction, multi-junction, and the synergistic amorphous silicon cells. Plain
amorphous was not looked at further based on the discussion earlier in this report. The
following describes the common parameters for this comparison:
• 25 degree latitude
• 100 kft maximum altitude
• 150 kg Payload
• Aspect Ratio of 20
• Span Loaded Airframe
• 6/15 Mission Start
• 0 km Radius of Action.
The worst performer is the 1997 single junction cell type. A reduction in area of
nearly 50 % can be achieved by the projected improvements in the SOA single junction
solar cells in 2001. Current multi-junction cells produce aircraft similar to the 2001
timeffame single junction cells, while multi-junction Year 2001 cells provide the smallest
aircraft. Figure 43 shows the same basic comparison except with a 1000 km ROA.
Altitude Effects on Aircraft Size
As the required altitude of the aircraft increases, significant reductions in the
atmospheric density drive up aircraft size. Figure 44 and 45 shows wing area and %
Change in Wing area from the base case as a function of altitude for single and multi-
junction cells as well as synergistic amorphous. The baseline case is the single junction
silicon cells at an altitude of 90 kft while all aircraft have the following characteristics:
• 25 degree latitude
• 150kgPayload
• Aspect Ratio of 20
• Span Loaded Airframe
• 6/15 Mission Start
• 0 km Radius of Action.
Power Computing Solutions, Inc. NAS2-96011 53
Noticethatgoingfrom 90kft to 100 kfl for the single junction aircraft produces
over a 50% in required wing area, yet for multi-junction cells produces a change of only
about 25%. The synergistic amorphous aircraft changes wing area by 20%.
Figures 46 and 47 show the same aircraft mission except with a ROA of 1000 km.
The same basic relative trends hold except that the high power per wing area multi-junction
solar cell aircraft shows greater reductions in wing area with increasing range requirements.
Payload Mass
Of great interest to the user of any aircraft is its ability to carry useful amounts of
payload. This contract called for mission simulations with 75 kg, 150 kg and 225 kg
payloads. The baseline aircraft mission was used with the various payloads.
Figure 48 shows a comparison with these three payloads in combination with the
various solar cell types on a 0 km ROA mission. The single junction cells provide a 70%
increase in wing area when changing from a 75 kg payload to a 225 kg payload. The
multi-junction cells provide a 71% increase in wing area and the synergistic amorphous
provide a 110% increase in area. The amorphous system offers less growth potential than
either the single or multi-junction celled airframes.
Figure 49 shows this same except with a ROA of 1000 km. For the single junction
aircraft an increase in wing area of 67% occurs when changing from a payload of 75 kgs to
225 kgs. For the Multi-junction solar cell aircraft a change in area of 78% occurred while
for the synergistic amorphous cells a change in area of 80% occurred.
Comparing the differences in missions for the 225 kg, single junction cells we find
that an increase in wing areas from 230 m 2 to 260 m 2 occurs. For the multi-junction cells
no increase in area is required because the same aircraft which made a 0 km ROA can make
a 1000 km ROA. For the synergistic amorphous cells an increase in area from 175 m 2 to
195 m 2 occurs.
Energy Storage
This studies original intent was to look at the influences of various energy source
and drive train technologies on the all electric aircraft. Unfortunately, because of the
missions considered it was not possible to find which energy storage technologies provide
true enabling capability for the all electric aircraft. As was shown in the results section,
Power Computing Solutions, Inc. NAS2-96011 54

everyoneof themissionsstudiedcouldbeperformedwith atleastthreesolar-onlyaircraftwith currenttechnologies.Now thequestionturnsto: canenergystoragetechnologies
providebenefitsto theaircraftstudied?Becauseeachof themissionsconsideredwas
possiblewithoutstoredenergy,themissionselectedto compareenergystoragesystems
neededtobeaschallengingaspossiblefor theall electricaircraft. Themissionparameters
chosento showthebenefitsof energystoragemostclearlyareasfollows:
• 40degreelatitude
• 225kg Payload
• 90kft maximumaltitude
• AspectRatioof 20
• SpanLoadedAirframe
• 6/15 Mission Start
• 1000 km Radius of Action.
A note about the mission selection. In general, most of the airframes are most
challenged by the ROA requirements. The aircraft are driven to obtain their altitude quickly
and then race at maximum altitude to their final range and altitude requirements. As was
shown earlier, the higher the altitude the faster the aircraft travels. Because of this,
selecting 90 kft as the maximum aircraft altitude reduced forward velocity, thereby, making
the mission more challenging than the 100 kfl aircraft.
In addition to the mission selection, several of the energy storage candidates were
not simulated. This reduction in the candidate energy storage systems was possible
because of the fact that all of the missions could be performed in a single day and therefore
no recharge system was needed. All of the rechargeable systems have poorer specific
energies and specific masses than their primary counter parts. For example a regenerative
fuel cell requires either a unitized fuel cell or a separate electrolyzer to separate the collected
water. Both regenerative systems included additional mass which would not be used. For
the batteries, all primary systems can operate at higher Depth-of-Discharge (DOD) and have
higher specific energies than their rechargeable counterparts. For these reasons only
primary systems were considered.
Figure 50 shows a bar chart of wing area as a function of energy storage option.
Significant reductions in wing area can be achieved by the addition of a small amount of
energy storage. Wing area is reduced from 182 m z to 167 m 2 (8% reduction) by the
addition of 2000 W-hr of Alkaline D-cells and is reduced to 157 m 2(15% reduction) by the
Power Computing Solutions, Inc. NAS2-96011 55

additionof 2000W-hr of Lithium cells. Greaterandlessamountsof energystorage
producedlargeraircraft. Noticethatfuel cellsarenot includedon thechart. Becausethefuel cell itself is sizedfor its peakpowerrequirementandtheenergystoragerequirementis
low, thespecificenergyof thefuel cell with arelativelyhighpoweroutput/ low energy
storage ratio produces a system with very poor specific energy. For a 2000 W-hr case with
a peak power output of about 15 kW a specific energy of about 30 W-hr/kg occurs. The
off-the-grocery store shelf D-cells have a specific energy of about 60 W-hr/kg. The
flywheel system produces a specific energy of about 50 W-hr/kg. It was found that this
mission required at least a 55 W-hr/kg energy storage system to find any benefits to energy
storage. Table 33 shows the output from the SAAC for the Lithium battery energy storage
case.
With this reduction in wing area, some increase in wing loading should be
experienced. Figure 51 shows wing loading for the three systems studied. Wing loading
improvements of about 8% occurred for both energy storage options occurred over the
solar-only choice.
Figure 52 shows both Altitude and Lithium Battery level as a function of mission
time. Notice that the benefit the lithium battery gives to the aircraft is additional time at
altitude which allows the aircraft to increase its range most effectively.
Aircraft Mass Fraction
One characteristic of interest is the relative mass fraction of each subsystem which
makes up the entire aircraft. Figures 53, 54 and 55 show percent Weight Breakdown for
the single junction, multi-junction, and synergistic amorphous aircraft flow under the
baseline conditions. Payload mass fractions vary from about 17% for the single junction,
26% for the multi-junction cells, to 36% of the payload mass for the synergistic amorphous
cells. These are all quite high payload mass fractions. When both payload and solar cell
mass fractions are combined the totals are 40% of the aircraft weight for the single junction
aircraft, 41% for the multi-junction aircraft, to 37% for the synergistic amorphous aircraft.
This indicates a direct tradeoff of solar cell for payload mass fraction in the aircraft while
the sum of the other mass fractions remaining almost constant.
Cost
While it is difficult to calculate the cost of any unbuilt or unique aircraft, one
method to estimate the relative cost is to look at component costs and thereby speculate on
Power Computing Solutions, Inc. NAS2-96011 56
relativeaircraftcosts.Figure 56 shows a bar chart of aircraft solar cell uninstalled cost for
the baseline mission. Great differences in the cost/m 2 of the solar array occur when
looking at each aircraft. It does, however, take a significantly smaller airframe to perform
the same mission with better performing solar cells. Capital costs for the single junction
cells needed to meet the mission requirements are about $4 million while a reduced size
multi-junction aircraft needs almost $18 million to perform the same mission. Amorphous
cells require only about $2 million. One factor which does not show up in these numbers
is the aircraft integration costs. Both single junction and multi-junction cells require
significant time and resources to integrate the cells into a airframe. The amorphous cells
offer the potential to greatly reduce integration costs by doing double duty of providing the
aerodynamic cover for the wing with cells because of the flexible mylar substrate sheet on
which the amorphous cells sit. This "double duty" has the potential to make these aircraft
significantly less expensive to build.
CONCLUSIONS
This analysis suggests that there is some potential for the all electric aircraft to find a
niche in high altitude reconisance or atmospheric research. The combination of advances in
energy storage and drive train technologies as well as modem construction methods and
materials may lead to a practical (while still very large) aircraft which can meet a significant
amount of the ERAST mission requirements. Questions of recurring costs for each aircraft
and operational limitations have been addressed and, if acceptable could provide a viable
platform for atmospheric research. Further work needs to address the potential for the
aircraft to be able to perform all of the ERAST mission altitude requirements at any time of
day or night. This will lead to considerably different aircraft because of the large
requirements expected for these missions.
Acknowledgments
Special thanks to Andy Hahn of Ames Research Center for all his help in the
completion of this contract.
Power Computing Solutions, Inc. NAS2-96011 57

RequiredAltitudes
RequiredPayloadMasses
RequiredRadiusof Action
TimeRequiredatAltitude
27.44km ( 90,000ft .)30.49km (lO0,O00ft .)
75kg (341bs.)150kg (681bs.)225 kg (102lbs.)
0km1000km (621miles)
35 minutes continuos
Table 1 Aircraft Mission Requirements
Table 2UAV
Solar Cells
Primary Battery SystemsSecondary Battery SystemsNon-Regenerative PEM Fuel Cell SystemsRegenerative PEM Fuel Cell SystemsFlywheel SystemsElectric Motors
PropellersTransmissions
Electric Powertrain Components Analyzed for the High Altitude
Power Computing Solutions, Inc. NAS2-96011 58

Gross Weigk
(lb)
Wing Area
(ft2)Wing Span:
(n/Solar Cell
Power Q/C)
Average
A_eed(fVs)
Gross Weigh
per Cell
Power 0b/Wi
Gross Weigh
per Wing
Area (lb/ft 2)
Propulsion
EnergySource
Recharging
Subsystem
Date of Firsl
Flight
Sunrise I
Solar
Sunrise II Solar Riser Solar One Solar I
Solar
Gossamer
Penguin165
Solar
Challenger340
RaptorPathfinder
27.5 22.5 290 400 440 380
90 90 260 260 237 313 266 800
32 32 30 68 52 72 47 100
450 578 400 864 1800 541 2500 11,400
25 35 29 42 65 22 36 52
61 39 725 463 244 305 136 33
0.31 0.25 1.12 1.54 1.86 0.53 1.28 0.48
Solar Solar Solar
None
Battery
Solar ArrayChargingwhile on
Ground
19791975
Battery
Solar Array
Chargingwhile on
Ground
1979
None
Battery
Solar Array
Chargingwhile on
Ground
19801974
None
1980
Table 3
Criteria
None
1980
Availability
None
1993
Reliability
Energy Density andSpecific Energy
Safety
Emissions/Environmental Impact
Life Cycle Cost
Table 4 Selection Criteria for
History of Solar Power Aircraft
Comments
The hardware must be procurable within the relevanttimeframe (ie., 1997 or 2001) or it was not considered.
Higher priority was given to those systems which are
presently undergoing advanced development to improve the_erfonnance characteristics in the 2001 timeframe.
Hardware with proven reliability received higher priorities.
Those systems with smaller numbers of components
received higher priorities.
The smallest, lightest systems received higher priorities.All ancillary components and operating constraints were
included in the system. Power mass and volume
estimates, including temperature requirements and heal
rejection requirements.
Hardware that could be safely handled, installed, recovered,
and operated received hi_her priorities.
The systems with lowest emissions and the least hazardous
disposal protocols received higher priorities.
The least expensive systems received higher priority.Relative installation and maintenance costs were estimated.
Candidate Power Systems to be Considered
Power Computing Solutions, Inc. NAS2-96011 59

0
o_o_
o_o
_D
_>
C_e-I
0;>
u3
0
e-I
o ;> _> ;> ;> ;>
0 0
.= .= ._ _ _ o
__o o_ _o_
0
o_
0
f',l
Z
G
o
o
N3
o
o

Classification Area cm 2
GaAs 3.91
Cr]cstallineGaAs 4.00
Ge Substrate
GaAs 4.00
Thin Film
GaAs
Submodule 21.0 16
InP 21.9 4.02
CrystallineIcc - Closed Circuit Current
Voc - Open Circuit VoltageAM 1.5 - Air Mass 1.5
Efficiency %
25.1
24.3
23.3
Table 6
Woc
1.022
1.035
1.011
4.04
0.878
Ioc
mA / cm 2
28.2
27.6
27.6
6.6
29.3
Fill Factor
%
87.1
85.3
83.8
80
85.4
Test Center
& Date
NREL
3/90
NREL
3/89
NREL
4/90
NREL
4/90
NREL
4/90
III-V Cell Developments at AM 1.5 & 25°C
Description
KopiaAIGaAs windov
ASEC
AIGaAs windov
Kopia5 mm CLEFT
Kopia4 CLEFT cells
Sp Spire
Epitaxal
Classification
crystalline
moderate area
multi-
crystalline
large mult-
c ,rystalline
thin crystalline
suppoaed film
large thin film
Efficiency %
24.0
21.6
17.8
17.2
17.0
14.9
14.2
Area cm 2
4.00
45.7
1.0
100
4.02
1.02
100
Woc
0.709
0.694
0.628
0.610
0.651
0.600
0.608
Icc
mA / cm 2
40.9
39.4
36.2
36.4
32.6
31.4
30.0
Fill Factor
%
82.7
78.1
78.5
77.7
80.3
79.2
78.1
Test Center &
Date
Sandia
9/94
Sandia
4/93
Sandia
3/94
JQA3/93
Sandia
9/94
Sandia
12/88
JQA3/93
Table 7
Classification
Cd TeCell
CdTe
Submodule
CIGS
Cell
CIGSES
Submodule
Silicon Solar Cell Developments at AM 1.5 & 25°C
Efficiency %
15.8
9.8
1.05
63.6
6.636
69.1
Area cm 2 Voc
0.843
6.62
0.644
7.49
Fill Factor
%
74.5
69
72.2
68
Icc
mA / cm 2
25.1
2.2
29.9
2.49
Description
UNSW
Perl
UNSW
Perl
GeorgiaTech
Sharp (mech.
Textured t
ANU20 mm thick
Astro Power
Test Cente_
& Date
NREL
6/92
NREL
5/93
NREL
8/93
NREL
4/94
Table 8
Mitsubishi
60 mm tlfick
Description
South Florida
CSVT
Solar Cells Inc.
13.9 NRELCIGS on Glass
12.7 SemensPrism Cover
Polycrystalline Thin Film Cell Developments at AM 1.5 & 25°C
Power Computing Solutions, Inc. NAS2-96011 61
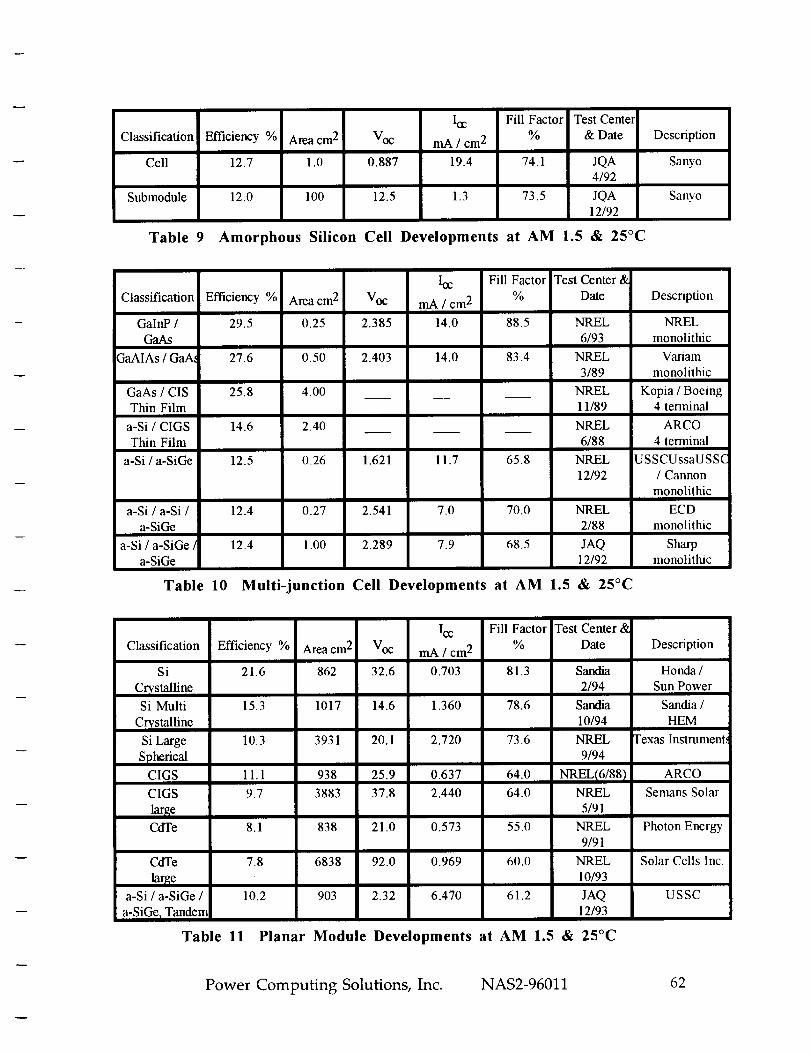
Classification
Cell
Submodule
Table 9
Efficiency %
12.7
12.0
Area cm 2
1.0
100
Woc
0.887
12.5
IGC
mA / cm 2
19.4
1.3
Fill Factor
%
74.1
73.5
Test Center
& Date
JQA4/92
JQA12/92
Amorphous Silicon Cell Developments at AM 1.5 & 25°C
Classification
GalnP /
CmAs
GaAIAs / GaA,
GaAs / CIS
Thin Film
a-Si / CIGS
Thin Film
a-Si / a-SiGe
Efficiency %
29.5
27.6
25.8
14.6
12.5
a-Si / a-Si /
a-SiGe
a-Si / a-SiGe /
a-SiGe
Table 10
Area cm 2
0.25
0.50
4.00
2.40
0.26
12.4 0.27
12.4 1.00
Multi-
Woc
2.385
2.403
1.621
2.541
2.289
_cmA/cm 2
14.0
14.0
11.7
Fill Factor
%
88.5
83.4
65.8
70.0
68.5
unction Cell Developments at AM 1.5
Test Center &
Date
NREL
6/93
NREL
3/89
NREL
11/89
NREL
6/88
NREL
12/92
NREL2/88
JAQ12/92
& 25°C
Description
Sanyo
Sanyo
Description
NREL
monolithic
Variam
monolithic
Kopia / Boeing4 terminal
ARCO
4 terminal
USSCUssaUSSC
/ Cannon
monolithic
ECD
monolithic
Sharpmonolithic
Classification
Si
Crystalline
Si Multi
Crystalline
Si Large
SphericalCIGS
CIGS
largeCdTe
CdTe
largea-Si / a-SiGe /
a-SiGe, Tandem
Table 11
Icc Fill Factor Test Center &
Efficiency % Area cm 2 Voc mA / cm 2 % Date
21.6 862 32.6 0.703 81.3 Sandia
2/94
15.3 1017 14.6 1.360 78.6 Sandia
10/94
10.3 3931 20.1 2.720 73.6 NREL9/94
11.1 938 25.9 0.637 64.0 NREL/6/88 )
9.7 3883 37.8 2.440 64.0 NREL5/91
8.1 838 21.0 0.573 55.0 NREL
9/91
7.8 6838 92.0 0.969 60.0 NREL
10/93
10.2 903 2.32 6.470 61.2 JAQ12/93
Planar Module Developments at AM 1.5 & 25°C
Power Computing Solutions, Inc. NAS2-96011
Description
Honda /
Sun Power
Sandia /
HEM
l'exas Instrument_
ARCO
Semans Solar
Photon Energy
Solar Cells Inc.
USSC
62

Classification
GaAs
Si
Si (Moderate
/Si
9 a e)GaAs
(Si substrate)
Table 12
Efficiency %
27.6
26.5
25.7
21.6
21.3
Area cm 2
0.126
0.150
1.21
20.0
0.126
Concentrator Single Cell
Concentration
255
140
74
11
237
Test Center &
Date
Sandia
5/91
Sandia5/87
Sandia
7/93
Sandia
9/90
Sandia
5/91
Description
Spire
Stanford
point contactSun Power
rear contact
UNSW
laser - _rooved
Spire
Developments at AM 1.5 & 25°C
Classification
GaAs / GaSb
InP / GaInAs
GaAs / GainAsP
GainP / GaAs
GaAs / Si
Efficiency %
32.6
31.8
30.2
30.2
29.6
Area cm 2
0.053
0.063
0.053
0.103
0.317
Concentration
/su )100
50
40
180
350
Test Center &
Date
Sandia
10/89
NREL
8/90
NREL
10/90
Sandia3/94
Sandia
9/88
Description
Boeingmeclmnical stack
NREL
monolithic 3 temlinal
NREL
stacked 4 temlinal
NREL
monolithic 2 terminal
Varian / Stanford /
Sandia mechanical
stack
Table 13 Concentrator Multijunction Single Cell Developments at AM 1.5& 25°C
Classification
GaAs / GaSb
Submodule
Si
Module
Efficiency %
25.1
20.3
Area cm 2
41.4
1875
Concentration
_suns)57
80
Test Center &Date
Sandia
3/93
NREL
4/89
Description
Boeing3 mechanical stack
units
Sandia / UNSW /
ENTECH
t 12 cells)
Table 14 Concentrator Module Developments at AM 1.5 & 25°C
Concentration - Concentration Ratio of Concentrator Lens (Solar Flux at Cell / Solar Fluxwith No Concentration)
Power Computing Solutions, Inc. NAS2-96011 63

Company Material
Solar Cells Inc. CdTe
Solar Cells Inc. CdTe
APS a-Si / a-Si
Semans Solar CIS
Semans Solar CIS
BP Solar CdTe
ECD a-Si / a-Si / a-SiGe
Golden Photon CdTc
Solarx a-Si / a-SiGe
USSC a-Si / a-Si
Fuji a-Si / a-Si1
Semans Solar CIS
Matsushita Batter:¢ CdTeUSSC a-Si / a-SiGe / a-SiGe
BP Solar CdTe
Table 15
Area (cm2)
7_2006,693
11,522
3_8323,859
4,540
3,906
3,528
3,432
3,676
1,200938
1,200903
706
Efficiency %
8.4
8.6
4.6
11.2
10.2
8.4
7.8
7.7
7.8
6.2
8.9
11.1
8.7
10.2
10.1
Thin film Solar Array Module at AM 1.5
Power (W)
60.3
57.7
53.0
43.1
39.3
38.2
30.6
27.5
26.9
22.8
10.7
10.4
10.0
9.2
7.1
Classification
MJ a-SI
CIGS
CIGS
CdTe
Table 16
Efficiency
8
10
10
% Thicknessmm
< 50 withKAPTON
< 50 withKAPTON
< 50 withKAPTON
Specific Mass
k_ / m20.100
O.100
O.100
Thin Film Solar Cell Module Performance at 25 ° C
Module
Specific Mass
k_ / m 20.375
0.375
0.286
Classification
Si (K6)
(Spectrolab/Si (K6)
/sl ctrolab/Si
(Seman /CmAs/Ge
(Spectrolab / ASEC)
Efficiency %
15
15
15
18
Thicknessmm
110
150
350
125
Specific Mass
k_ / m 20.253
0.345
0.805
0.663
Module
Specific Mass
k_ / m20.508
0.591
1.005
0.877
Table 17 Single Junction / Single Crystal Solar Cell Module Performanceat 25 ° C
Power Computing Solutions, Inc. NAS2-96011 64

Classification
GaAs (Spire)
GaAs (Spire)
GaAs (Astropower)
Table 18
Efficiency %
18
18
18
Thickness
mm
5
(- 105 with 3 mi
cover_lass_5
(_ 70 with
TEDLAR /3
(_ 103 with 3 mi
cover_lass
Specific Mass
k/_ / m 2
0.228
0.116
0.217
Module
Specific Mass
k/_ / m 2
Ultra Thin GaAs Solar Cell Module Performance at 25 ° C
0.485
0.295
0.475
Classification
GainP2 / GaAs
GainP2 / GaAs
GainP2 / GaAs
Table 19
Efficiency %
24
24
24
Thickness
mm
125
(standard 5 1/2 mil_5
(- 105 with 3 mill
cover_,lass t5
Specific Mass
k_ / m 2
0.663
0.228
0.116
Module
Specific Mass
k_ / m 2
0.877
(- 70 with TEDLAR)
Multi-Junction Solar Cell Module Performance at 25 ° C
0.485
0.295
Power Computing Solutions, Inc. NAS2-96011 65

18
16
14
12
10
8
6
4
2
0
1975
Thin Film Solar Cell Development
CuInSe
1980 1985 1990 1995
Year
Univ. Maine
BoeingARCOiEuro CIS
_xNREL
Figure I CulnSe Thin Film Solar Cell Development
1976 1978
Thin Film Solar Cell Development
CdTe
1980 1982 1984 1986 1988 1990 1992
Year
_m atsushitaono Solar
dak
etekotonEnergy
iv. S. FloridaSolar
Figure 2 CdTe Thin Film Solar Cell Development
Power Computing Solutions, Inc. NAS2-96011 66

Thin Film
Single Junction
Efficiency at AMO
Multiple Junction
(Air Mass 0)
1997 2001
8% 10 %
15%
23 %
Table 20
20 %
28 %
Module Mass
_k_ / m2_1997 2001
0.286 0.375
0.295 1.005
0.485 0.877
Solar Cell Classifications
Cost
(Dollars
1997
100
5 to 3.5 (for10 to 13% Si)100 (for 15%
Si K6_When Mature
per Watt)
2001
5to 1.5
_lgro)ected)500 (for 18%
GaAs/Ge)
Estimated to bc3 to 5 Times
the Cost of Si
Cell Dimensions: 25 cm Height; 25 cm Width; cell pitch': 2.15 cells/cm
Cell Active Area: 400 cmg/cell (80% of cell envelope)Cell Mass: 285 g/cell (includes estimate for endplates, tie rods, etc.)
(intended for at least 20 cells/stack)
Current Density - Voltage Relationship (Figure 1)" : V = m*cd + b(V = voltage, volts/cell; cd = current density mA/cm 2 )
For 1997 H2-AirFor 1997 H2-O 2For 2001 H2-AirFor 2001 H2-O 2
m = -0.000248; b = 0.887m = -0.000248; b = 0.927m =-0.000155; b = 0.887m = -0.000155; b = 0.927
Table 21 Reported and Assumed Mk 7 Stack Characteristics
1
A
m
>o 0.8
_9
0.64=dBO
>
_ 0.4
O
o
0.2
i .............................................................................
i_i_i_i_i_i_ii_iiiii_iiii_i_i_i_iiiii_iii_ii_i_iii_i_iiiiiiiiiiiii_iiiiiiiiiiiiiiiiiiiiiiiiiiiiiiiiiiiiiiii_i_i_i_iiiii_i_i_i_i_i_i_i_iii_i_i_iii_iiii_iiiii_iiiii_iiii_iiiiiiiiiiiiii_!_iiii_iiiiiiii!i_iiiiiiiiiiiiiiiiiiiiiiiiiiiiiiiiii!iiiiiiii_iiiiiiii!_iiiii_i_iiiiiiiii_i_iiiiiiiiiiiiiiiiiiiiiiiiiiiiiiiiiiiiii_iiiii_i_iiiiiiiii_i_iiiiii!iiiii i_ ii!iiiii!i!i!ili!i!i!i!i!i!ii!i!i!i!iiiiiii_iiiii_iiiiiiiiiiiiiiiii_iii_
iiiiiiiiiiiiil-- - .2-o2 iiiiiiiiiiiiiiiiii!i!i!iiiii!iiiiiii!iiiiiiiiiiiiiiiiiiiiiiiiiiiiiiiiiiii
F500 1000
Current Density (ASF)
Figure 3 1997 State-of-the-Art PEM Fuel Cell Performance
Power Computing Solutions, Inc. NAS2-96011 67

0.8
O
0.6,O>=
04,
02
x==xxxxx_x==x==xx==x== :_=S!=Sxi$ !$iS_$i$i:_$i$_$i$i$i$i$i$i$i$i$i$i$::ii::$iSx=x====xxx: x=x==xxxxxxx=:
_iiiiiii_ii_i_ii_i_i_::::`Y_::_:_i_ii_ii_ii_i_i_i_i_i_i_i_i_i_i_i_i_i_i_iii_iiiiiiiiiiiiiiiiiiiiii_ii_ii_i_ii_!_ii_i!_i_!_ii_iii_i_iiii_i_i_i_i_i_i_!_!_!_!_i_i_i_ii_iiiii_iii_::::::::::::::::::::: x.:::::::.. :::::::::::::::::::::::::::::::::::::::::::::::: $:;:: :_:i::_:_:::::::::::::::::::::::::::::::::::::::::::::::::::::::::::::::::::::::........................ .......... _..... ................................. :...:...:.:..:.:.:.:.:.:.:.:.:.:.:.1+:.1.;.:.:;:: ;...:;..: ............................................................. . -..:.:.:.:.:.:.:.:.:.:_%;.;_.:,_.:,;,:+;,;+;,:+;+:.;.:,:.;.:,:.;.:.:.:.:.::.:: :.:::: ::.: ;:: ;;: :::;;;;. :; .:;. :..: ................................::::::::::::::::::::::::::::::::::::: ========================================================================================:.:_:::::::::::::::::::::::::::::::::::::::::::::::::::::::::::
i i_ii_?_i_ii_ii_ii_ii!iiiiiiiiiiiiiiiiiii!i_ii_ii_;_i____i_ii_ii_iiiiiiiii?i!_:i$i::::::.:.:.:..!.i.i"!'f' :':':'::::::::::::::::::::::::i_i_:_:i::i_i_i_i_iiii_iii _!iiiiii_ii!!ilili!ii?ii!iiiiiiiiiiiiiii_iiiii_!ill _ilii_i!_ii_i__ ____
200 400 6oo Boo _ooo
Current Density (ASF)
-- H2-AIR ]
~ _ - H2- 02 1E
Figure 4 H2-O2 and H2-Air Fuel Cell Stack Performance Projections for2001
o 0.8
m
>
0.6
0.4
iiiiiiiiiiiiiiiiiiii_*:::,.%iiiiiiiii_iiiiiiii!iiiii!i_i_i_i_i!i!iiiiiiiiiiiiiiiiiiiiiiiiiiiiiiiiiiiiiiiiiiiiiiiiiiiiiiiiiiiiiiiiiiiiiiiiiiiiiiiiiiii!iiiiiiiiiiiiii!!ii!iii!ii!ii_i!_!iiiii.iii.lii.li.i....'::::.:[i:_:,_i.i.i.i.i.igiii.iii.i.i.i.i.i.ii.i.iiiiiiiii.liiiiliiiiiiiiiiiiiiiiiiiiiiiiii:i:iii:iii:i:i:i:i:i:i:i:i:i:i:i:i:i:i:i:i:i:i:i:i::i:i:.:£:i:i:.:::.:::.::
iiiiii!iiiiiiiiiiiii:: .. i'":$::i:!i_ i _i_ i i_i i_i i i_ililiili l iiiiiii::::::::: _E_._._!_E_E_]_i_i_i_iiii!i=i!!_i!ii!!i!!1!!!!_i!_2!!E_!_!_E_!_1_E_[_E_!_E_E_i_E_!_!_IH2-AIR (2001 Pro ect_on)
:: =: x: x: x: x: x: x: x: x, -:x':::::$i$_:i::::::::::::::::::::::::::::::::::::::::::::::::::::::::::::::::::::::::::::::::::::::::::::::::::::::::::::::::i_ii:_i_i__i_i__ :!
:::::::::::::::::::::::::::::::::::::::::::::::::::::::::::::::::::::::::::::::::::::::::...... .................._:_:__::::.::::._s__s_i__i!_i_.i?_,_.i_ .....................................................[I............................................. _:::_ .................... II H2-O2 (2001 Prole_bo,,):_:::::::::::::::::::::::::::::::::::::::::::::::::::::::::::__::_:__::_::_:::::::::::::::::::::::::::: . .. ==============================================================
:: :::: :::::::::::::::::::::::::::::::::::::::::::::::::::::::::::::::::::::::::::::::::::i:_:._:.:::::::::::::::::::::::::::::::::::::::::::::::::::!::!i_i:::::::::::::::::::::::::::::::::::::::::::...... ":'::::i:i_i::?::::i::_:::::::::::::::::::::::::::::::::i::::iii::::::::I _'_'-- H2-O2 1997 Baseline iI
::::: :+:':+:':+: :':':+::::: ::: :: ;:::::::: :::::::::::: ::: ::::: ::: :::::::::::' ======================L
0 200 400 600 800 1000
Current Density (ASF)
Figure 5 Comparison of PEM Fuel Cell Current-Voltage Relationships for1997 Technology Baseline with Performance Projections for 2001
Power Computing Solutions, Inc. NAS2-96011 68

CellDimension:18cm diameter;214cm 2 active cell area,
cell pitch : 3 cells/cmCell Mass: 150 g/cell (includes estimate for endplates, tie rods, etc.)
(intended for at least 10 cells/stack)
Current Density - Voltage Relationship (Figure 1)* : V = m*cd + b(V = voltage, volts/cell; cd = current density mA/cm 2 )For 1997 ' m = 0.0001704; b = 1.497For 2001 • m = 0.0001704; b = 1.497 (Same as for 1997)
Table 22 Reported and Assumed Electrolyzer Stack Characteristics
(Asterisk denotes assumed or estimated characteristic)
18
_J
1.2
200 dO0 800 800 1000
Current Density (ASF)
Figure 6 1997 State-o_the-Art Performance for PEM H20 ElectrolyzerStacks
Power Computing Solutions, Inc. NAS2-96011 69

19
1.7-
1.5.
-_ 1.3.
_ 0.9U
07
05
03
:::::::::::::::::::::::::::i:8: :_:::::::::::::::::::::::::::i:8i:i8:i8:i:i:i:i:i:!:i:Bi:i:i:::!:T:'_:-:i_3 _iiiiiiiiiiiii:::::::... !!i :::::::::::::::::::::::: :I:I:I:I:I:BI:BI:I:I:_:I:I:I:I:I:I:I:I:I_IHIH ii ili
_:i:i:!:!:E8!:i:!:i:!:i:i:ii!:i:i!:iiiiiiiiiiiiiiiiiiiiiilH____kE_H:i_iii:i:i:i:i:!:!:i:i:i:i:i:i:i:i:i:i8i:i8:8_:i:::::::::::::::::::::::::::::::::::::::::::::::::i:i:i:i:i:_:i::i::i:i:i:i:i:::T:i_!_ii:i:<:_:i:i:iii:::::::::::::::::::::::
200 400 600 800 1000
Current Density (ASF)
_SOA Fuel
Cell
.................... URFC Fuel
Cell
...... SOA
Electrolyzer
.... URFC
Electrolyzer
Figure 7 H2-O2 Unitized Fuel Cell/Electrolyzer Performance Projection for2001
Power Computing Solutions, Inc. NAS2-96011 70

Type System System Scaling Laws
Wh/k_ °) Wh/1 °) Fuel Cell S_¢stem(2); Electrolyze? s)
Primary I-I2(g)-Oz(g ) 1997 390 156 Am= 135; Bm=1241 ; Cm=1230; Dm=OO
Av= 222; Bv=276; Cv=550; Dv--m
Primary I-[2(g)-O2(g ) 2001 531 167 Am= 163; Bm=2055 ; Cm=1554; Dm=OC
Av-- 357; Bv=288; Cv=577; Dv=m
Primary H2(g)-Air 1997 385 215 Am= 163; Bm=1149; Cm=m; Dm=100
A_= 260; Bv=256; C_=oo; D_=260
Primary H2(g)-Air 2001 531 212 Am= 189; Bm=1881 ; Cm=O% Dm=125
A_= 329; B_=264; C_=o% D,.=329
Primary LOH-Air 1997 423 594 Am= 163; Bm=1401; Cm=°% Dm=100
Av= 260; B_=1126; C_=o% D_=260
Primary LOH-Air 2001 484 665 Am= 189; Bm=1441; Cm=m; Dm=125
Av= 329; B_=1158; Cv=oo; D,.=329
Primary LOH-LOX 1997 370 566
Primary LOH-LOX 2001
H20 Elelctrolyzer 1997Baseline (4,6)
H20 Elelctrolyzer 2001Baseline (s,6)
Hz(g)-O:(g ) RFC _°, 1997
HT.(g)-O:(8) RFC t_' 2001
4O0
NA
(117 k_)NA
(77 k_)222
316
Table 23 Standard Characteristic
Systems
(1)
(2)
(3)
645
NA
(521)NA
(37.4 1)137
151
Profile
Am= 135; Bm=1505; Cm=933; Dm =oo
A_= 222; Bv=1210; C_=2488; D_=oo
Am= 163; Bm=1576; Cm=977; Drn =oo
Av = 357; Bv=1260; Cv=2604; Dv=OCE = 3.871F °) = 30.2
E = 2.68F °) = 28.8
Additive for H2(g)-Oz(g ) 1997Baseline
Additive for I-Iz(g)-O_(g ) 2001 Baseline
Correlations for Fuel Cell
Example Results for 12 Hour Fuel Cell Operation and 12 Hour ElectrolyzerOperationSystem Mass (kg) = 1.15*FCP*(1/Am+FCOT*[1/Bm+I/Cm]+I/Dm}System Volume (1) = 1.10*FCP*{ 1/A_+FCOT*[1/B_+I/Cv]+I/Dv}System Mass (kg) = 3.871*E*(FCOT/EZOT)System Volume (1) = 1.1 *E* {0.57 I*[FCOT/EZOT]+ 1 }
FCP = Net Fuel Cell System Power (Watts). Range is 750 - 40,000 Watts
FCOT = Fuel Cell System Operating Time (hrs.)
EZOT = Electrolyzer System Operating Time (hrs.)
E= constant ; F -- kg water required to be electrolyzed.(4) or PV assumed 64 W/m 2 and 0.4 kg/m 2 (considered as part of airframe)(5) For PV assumed 80 W/m 2 and 0.3 kg/m 2 (considered as part of airframe)(6) PV volume not included
Power Computing Solutions, Inc. NAS2-96011 71
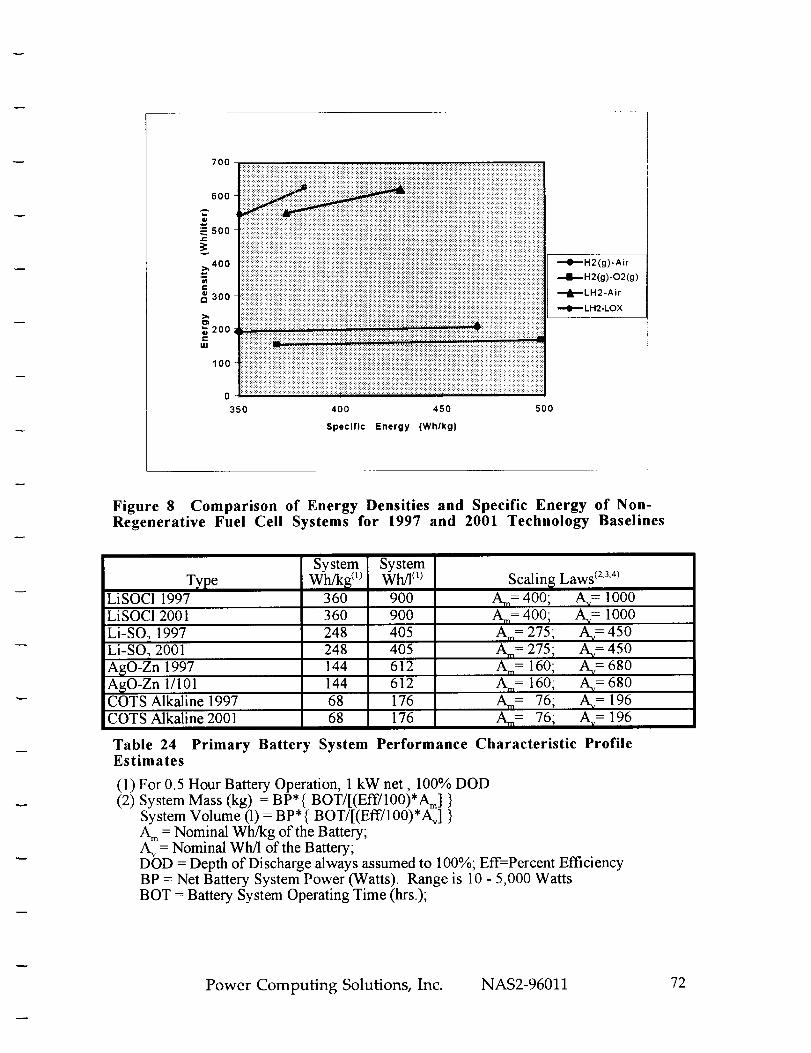
700
600
5oo
4O0
300
>,O)
200oc
IM
100
0
35O
,r::::::::::::::::::::::::::::::::::::::::::::::::::::::::::::::::::::::::::::::::::::::::::::::::::::::::::::::::::::::::::::::::::::::::::::: :::!:::_:i::!_
400 450 500
Specific Energy (Wh/kg)
_H2(g)-Air
,--II,_H2(g)-O2(g)
_LH2-Air
LH2-LOX
Figure 8 Comparison of Energy Densities and Specific Energy of Non-Regenerative Fuel Cell Systems for 1997 and 2001 Technology Baselines
System SystemWh/1 o_T_Te Wh/k_ (1)
LiSOCI 1997 360 900
LiSOCI 2001 360 900248 405iLi-SOe, 1997
Li-SOT, 2001
AsO-Zn 1997iAgO-Zn 1/101COTS Alkaline 1997
COTS Alkaline 2001
248 405
144 612144
6868
612
176
176
Scalin_ Laws (2'3'4)
Am= 400;
Am= 400 i
Am= 275;
Am= 275;Am= 160;
Am= 160;
Am= 76;
Am= 76;
Av= 1000
Av= 1000Av=450
Av=450
Av=680
Av= 680
A.,= 196
Av= 196
Table 24 Primary Battery System Performance Characteristic ProfileEstimates
(1) For 0.5 Hour Battery Operation, 1 kW net, 100% DOD(2) System Mass (kg) = BP*{ BOT/[(Eff/100)*Am] }
System Volume (1) = BP*{ BOT/[(Eff/100)*Av] }A m = Nominal Wh/kg of the Battery;A_ = Nominal Wh/1 of the Battery;DOD = Depth of Discharge always assumed to 100%; Elf=Percent EfficiencyBP = Net Battery System Power (Watts). Range is 10 - 5,000 WattsBOT = Battery System Operating Time (hrs.);
Power Computing Solutions, Inc. NAS2-96011 72
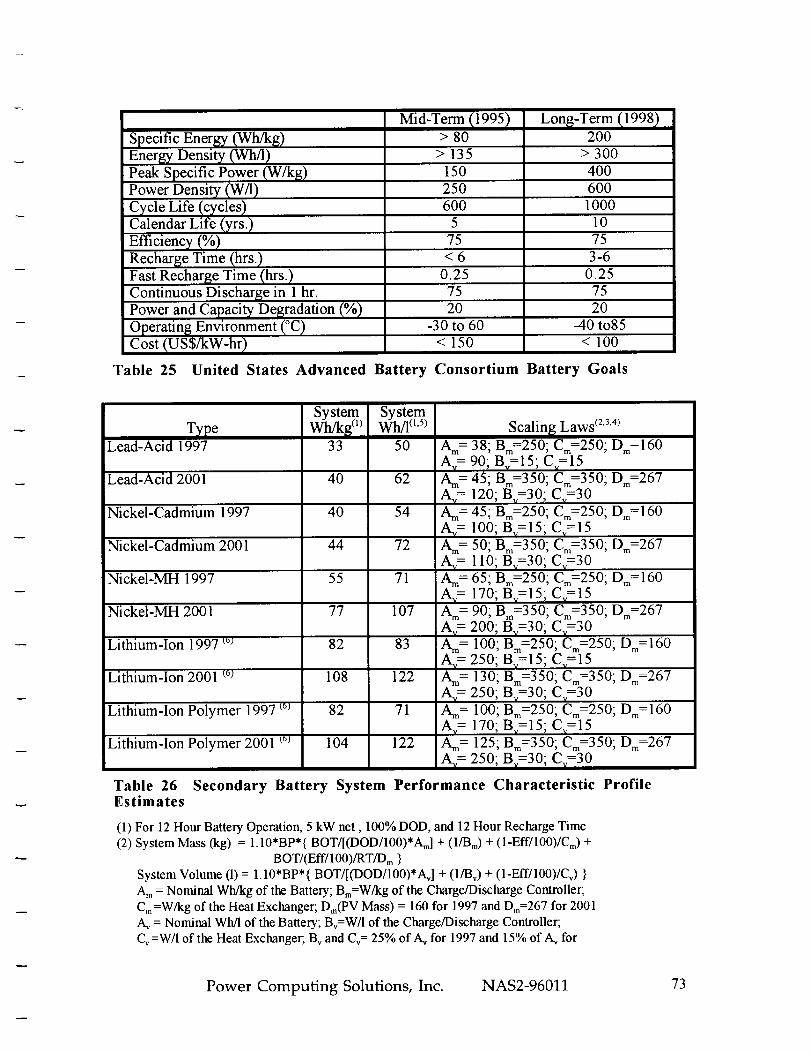
Specific Energy (Wh/kg)
Energy Density (Wh/l)
Peak Specific Power (W/k_;)
Power Density (W/l)
Cycle Life (cycles)
Calendar Life (yrs.)Efficiency (%)
Rechar_;e Time (hrs.
Fast Recharge Time (hrs.
Mid-Term t1995)> 80
Long-Term (1998)200
> 135 > 300
150 400250 600
600 1000
10
75 75
< 6 3-6
0.25 0.25
Continuous Discharge in 1 hr. 75 75
Power and Capacity Degradation (%) 20 20
Operating Environment (°C) -30 to 60 -40 to85Cost (US$/kW-hr < 150 < 100
Table 25 United States Advanced Battery Consortium Battery Goals
System SystemWh/1 o,5)Type Wh/kg °_
Lead-Acid 1997 33 50
Lead-Acid 2001 4O 62
Nickel-Cadmium 1997 40 54
Nickel-Cadmium 2001 44 72
Nickel-MH 1997 55 71
Nickel-MH 2001 77 107
Lithium-Ion 1997 to_
Lithium-Ion 2001 t°)
82
108
83
Lithium-Ion Polymer 1997 _oJ
122
82 71
Scalin_ Laws (2'3'4_
Am= 38; Bin=250; Cm=250; Dm=160Av= 90; Bv=15; Cv=15
Am= 45; Bm=350; Cm=350; Dm=267Av= 120; By=30; Cv=30Am= 45; Bm=250; Cm=250; Dm=160
Av= 100; Bv=15; Cv=15Cm=350; Dm=267
Cv=30Cm=250; Dm=160
Am= 50; Bm=350;
Av= 110; By=30;iAm= 65; Bm=250;
Ay = 170; Bv=15; Cv--15Am= 90; Bm=350; Cm=350; Dm=267
Av= 200; By=30; Cv=30Am= 100; Bm=250; Cm=250; Dm=160Av= 250; Bv=15; Cv=15
Am= 130; Bm=350; Cm=350; Dm=267Av= 250; By=30; Cv=30Am= 100; Bm=250; Cm=250; Dm=160
A,,= 170; Bv=15; Cv=15Lithium-Ion Polymer 2001 to) 104 122 Am= 125; Bin=350; Cm=350; Dm=267
Av= 250; By=30; Cv=30
Table 26 Secondary Battery System Performance Characteristic ProfileEstimates
(1) For 12 Hour Battery Operation, 5 kW net, 100% DOD, and 12 Hour Recharge Time(2) System Mass (kg) = 1.10*BP*{ BOT/[(DOD/100)*Am] + (1/Bin) + (1-Eff/100)/Cm) +
BOT/(Eff/100)/RT/Dm }System Volume (1)= 1.10*BP*{ BOT/[(DOD/100)*A_] + (1/Bv) + (1-Eff/100)/Cv) }Am= Nominal Wh/kg of the Battery; Bm=W/kg of the Charge/Discharge Controller;
Cm=W/kg of the Heat Exchanger; Dm(PV Mass) = 160 for 1997 and Dm=267 for 2001Av= Nominal Wh/1 of the Battery; By=W/1 of the Charge/Discharge Controller;C_=W/1 of the Heat Exchanger; B_ and Cv= 25% of A_ for 1997 and 15% of A_for
Power Computing Solutions, Inc. NAS2-96011 73

2001.(Forlithiumtechnology,bothByandCvmaybereduced).DOD=DepthofDischarge(%);Eft=PercentRoundTripEfficiency
(WhodWl_,,*100%)BP = Net Battery System Power (Watts). Range is 100 - 40,000 WattsBOT = Battery System Operating Time (hrs.); RT = Recharge Time (hrs.)
(3) For PV assumed 64 W/m 2 and 0.4 kg/m 2(4) For PV assumed 80 W/m 2 and 0.3 kg/m 2(5) PV volume not included(6) Lithium Technology not Available in 1997 for > 1 kW, Probably Available for 2001
Material
Graphite (_iber)1995
CompositeStrength(GPa) *
Spectra ® (fiber)
Kevlar ® (fiber)S-glass (fiber)
E-glass(fiber) qSilicon-nitride
ceramic
4.8
Graphite (fiber) 3.41989
1.4
Maraging steel
Titanium alloy
Magnesium alloy
Table 27
1.8
2.1
1.8
.92
CompositeDensity(kg/m3)
.28
Flywheel Theoretical Maximum
* Ultimate Strengthrupture for ceramics
1609
Theoretical
Maximum
Specific Energy
W-hr/kg)414
1609 293
1039 187
1375 182
2190 133
2205 113
3250 39
2.1 7860 37
1.2 4500 37
1790 22
Specific Energy
for fibers, yield strength for metals, modulus of
Power Computing Solutions, Inc. NAS2-96011 74

7000
6000
5OOO
_4000
3000
2000
lOOO
Specific Power as a Function of Specific Energy for Flywheel Systems Currently Under
Development
) Ame rican Flywheel Sys te_- "
I KamanEle ct r omabme tic_
i: Magnet Motor
}:_RocketdyneSalCon "Patriot"
Trinity Flywheel Batleries
_,Unique Mobilily
-U_S. Flywheel Systems
..,,University of Texas-GEM
:.:.United Techno 1o gies
Worm Flywheel Corsortium
USABCmid-term balte D'goal
USABC long-term batle D, goal
50 100 150 200
Specific Energy (W-hr/kg)
Figure 9 Specific Power as a Function of Specific Energy for VariousFlywheel Systems
Variation in Maximum RPM with Diameter
forvarious flight Mach numbers
Figure 10 The Effect of Propeller Diameter on RPM
Power Computing Solutions, Inc. NAS2-96011 75

Figure II Propeller Diameter Versus Number of Propellers
:+:.:.:-.......
,:yf:-:
_i:i:i:i:
=._._._.
_:<+:-
Diameter
Diametrz {m_
Figure 12 Effect of Propeller Diameter on Propeller Efficiency
Power Computing Solutions, Inc. NAS2-96011 76

Thrust versus Diameter
for 2 and 3 Bladed Propellegs
Diameter (m:l
Figure 13 Effect of Propeller Diameter on Output Thrust
Fixed Pitch
Variable Pitch
Table 28
Advantages
Light WeightSimple Controls
Heavier
Needs Control System
Disadvantages
Less Performance
May Constrain Mission Altitude
Higher PerformanceMay be Mission Enabling
Fixed vs. Variable Pitch Propellers
Power Computing Solutions, Inc. NAS2-96011 77

CurrentLimit
TORQUE
(1) (2) Propeller Loadings at
Pitch Settings
SPEED VoltageLimit
Figure 14 Qualitative Torque-Speed Motor Characteristics
Figure 15
TORQUE
Motor
Propeller Loadings at
Different Pitch Settings
/
ISPEED
Qualitative Efficiency Characteristics of an Induction Motor
Power Computing Solutions, Inc. NAS2-96011 78
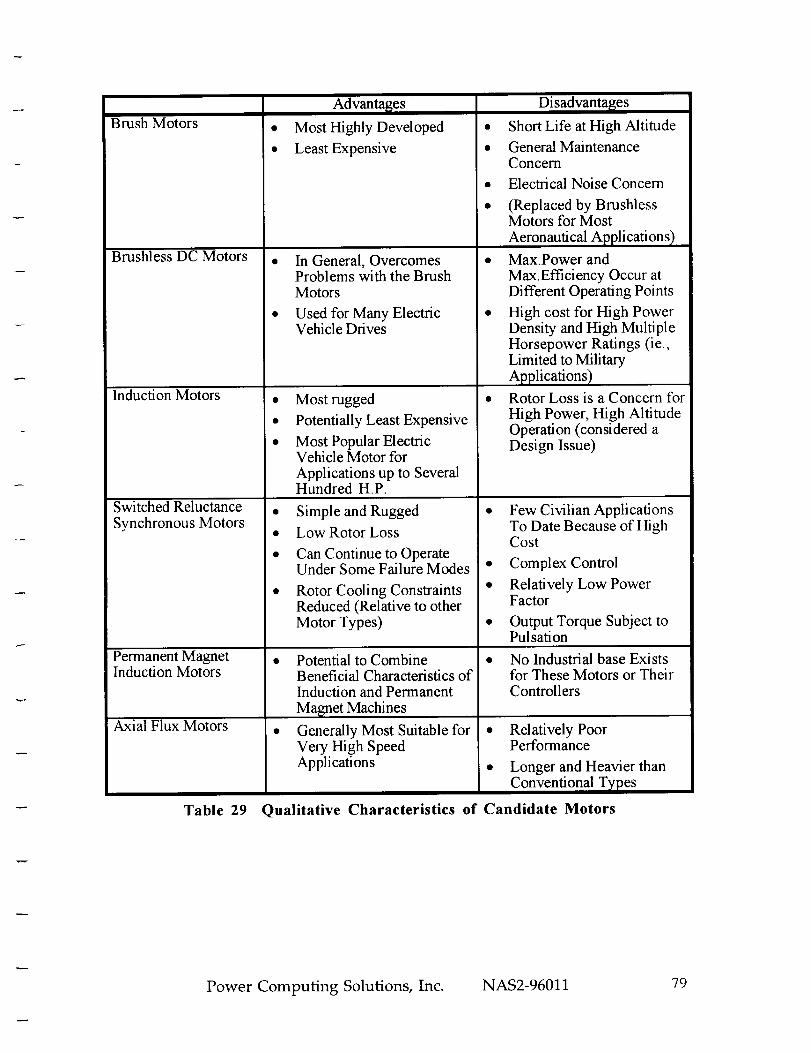
Brush MotorsAdvantages
• Most Highly Developed
• Least Expensive
BrushlessDCMotors
Induction Motors
Switched Reluctance
Synchronous Motors
Permanent MagnetInduction Motors
Axial Flux Motors
Table 29
• In General, OvercomesProblems with the BrushMotors
• Used for Many ElectricVehicle Drives
Most rugged
Potentially Least Expensive
Most Popular ElectricVehicle Motor for
Applications up to SeveralHundred H.P.
• Simple and Rugged
• LowRotor Loss
• Can Continue to OperateUnder Some Failure Modes
• Rotor Cooling ConstraintsReduced (Relative to otherMotor Types)
• Potential to CombineBeneficial Characteristics ofInduction and Permanent
Magnet Machines
• Generally Most Suitable for
Very High SpeedApplications
Disadvantages
• Short Life at High Altitude
• General MaintenanceConcern
• Electrical Noise Concern
• (Replaced by BrushlessMotors for Most
Aeronautical Applications)
• Max.Power and
Max.Efficiency Occur atDifferent Operating Points
• High cost for High PowerDensity and High MultipleHorsepower Ratings (ie.,Limited to Military
Applications)
• Rotor Loss is a Concern for
High Power, High AltitudeOperation (considered aDesign Issue)
• Few Civilian ApplicationsTo Date Because of HighCost
• Complex Control
• Relatively Low PowerFactor
• Output Torque Subject toPulsation
No Industrial base Existsfor These Motors or TheirControllers
• Relatively PoorPerformance
• Longer and Heavier than
Conventional T),pes
Qualitative Characteristics of Candidate Motors
Power Computing Solutions, Inc. NAS2-96011 79

AC Motor/Controller Efficiency, Map
Figure 16 AC Motor/Controller Efficiency Map
A Continuously Variable TransmissionVan Doorne type push-belt OVT
Push-belt Foroe
Driving pulley Driven pLlley8ta_clJa_es
_.................... i....,,,,...,,.._.,..._I ................... I........._.u_,,m_,_._,_ V-groo ve
//,t I I
.. LJ.\:,,/ uInput from engine, //;'_, " / "_""_ Output to _JI3e_,:s
_ia"orque-converl_r /'/ f KX, ]
//// t 1
Spring steel bends / _-/ / Acluated 13a_es
C_O$$_cIion of v-belt l:la1_
Figure 17 Continuously Variable Transmission
Power Computing Solutions, Inc. NAS2-96011 80

Single Speed and CVT Weight as a Function of Transmission
Type, Max Torque=330 Ib-ft, Max Pow=100 HP,Speed Range 14to 28 kRPM
_._,_,_i:_o ___
_,,, :,_:_,__:_, ._
_=4oN_i_
30 _._..._
iffl
::::::::::::::::::::::_::_:::__:__
,_ _ _,_:_ $_::_,i
_ ........_..,._ .._._._ :_::_:_:_.,_:_ :::_:::_::_:_:,._: ::_.,,__::x.:._:_:_:,:_::_#. _::_i,_::_::
-$en
iiiiili/i/i_/iliiiiiiii_ii/i_iiii_!!
:._:_:: :: . _?._:_:_ ::_: :._:_:_
_ii_,_ "_'::'_._t_l/i_/i/ ._._,,'_
:_*_<:_i. :::_:_:_::
:::::::::::::::::::::::::::
:::::::::::::::::::::::::::::::::::::::
_:_._:_ _,_¢_,¢_:_:_:::::::::::::::::::::::::_ _ _:_:+_<,_,_,.?.,_:_,_:_,_:_,'_:_f_::
_. _ii_:::_,::::_._ .::_?:.:_._:
_i_i._:._:,.,::.<:_:_ :+.x.:.:.:.__ "_:._._:':
:_:_::::_: :_:_:::::
o ._
o I.-
::::::::::::::::::::::::::::::::::
::'.:::.__,_,_:?._:__:__:__:::::
II Steel V-Belt
• Flat Belt
[] Toroidal Traction
Cone-Roller Traction
• Single Reduction Sun/Planetar
Figure 18 Weight as a Function of Transmission Type
Specific Power as a Function of CVT Type
7
Flat Belt Toroidal Cone- Honda Single
traction roller Civic CVT Speed
traction PlanetaryGear Set
CVTTTpe
In Spec Power P_wer / kg]
Figure 19 Specific Power as a Function of Transmission Type
Power Computing Solutions, Inc. NAS2-96011 81

,,.a
Peak Efficiency as a Function of Transmission Type
98
97
95 ,
94 :
93 ,
92 :
91
89 r__
b>
N
_:<_:..,_:_,,:_,x_.:.:_:_
_.,,':_.:._._
i_._. :,x¥:_._<:
_.. _:,_
:,.N_:;¢: :::::::::_:::
rn
N
_:._,_:,_:_:_: ._:
_'.__:_',':".'::::_:,:,_::,_i_l_:_i:..:_::_!:::_i:__:.'.
_ _ _:8'._:_:.'::_:_.:_:_&._:?._:__:_:_:,x_:
::_:%
.o_
5S_
::::::::_:_:_::_::::_:,_,_:!:_i_:_.:.x_:,% :-'.
_.:.:_.:,:,.x.:._.:_,:::q:.:,'_:.:,..:+:.:_.:,:._..::'?,. :_.:.:.:
::_i._%/i_ri_lfi,__::__i_f!_"'" ..... _....:_:_4:::::::_:-.:_:,':_:_:_:__ x _:,_,___,_:
:.__:_,,x_x: :__:.,_:,._:,_:,_" ",_ :.:.::::...... _, .,..,,_.._ _.,__::
,:,+.x+'_'_':.:_,x_x...:.:,_.._:._._:.,. ::.:_:.q_:
_i.__:_:_:_ _._._:,_:_iii
_:_¢'_._ili_ _.:_¢ _':._ ::_::::
p:_,:_,. ...:_,_:_:_:__:+ :+:::_::.:
_ o ,5 _C_
Steel V-Belt ]
Flat Belt /
Toroidal Traction i
Cone-Roller Traction
S ng e Reduct on Sun/P anetary
Transmission Type
Figure 20 Weight as a Function of Transmission Type
96%
95%
94%
"-- 93%
_;_ 92%
"-_ 91%
M_
90%
89%
88%
Comparison of Predicted CVT Efficiencies at Average Output
Operating Conditions (22 HP, 3000 RPM)
:_::::_:_:_:_:_:_:_:
_&:i,_:_:_:_:_!_:_!:_
::::::::::::::::::::::::::
__:_:_:_._._&"::_._:
::::::::::::::::::::::::::::::
87%
14000 21000 28000
_Steel V-Belt
_Flat Belt
..........................Toroidal Traction
:'_........... Cone-Roller Traction
Input Shaft Speed(RPM)
Figure 21 Efficiency as a Function of Input Shaft Speed and TransmissionType
Power Computing Solutions, Inc. NAS2-96011 82

_0
0
L_
_i _ _ _ _ __
m
C_
J_
E_
_0
Z
O
0
o_j
rb_
0
_1__ _ _ __,

90,000 ft
100,000 ft
Table 31
0 km ROA 1000 km ROA
75 k_ 150 k_ 225 k_ 75 kg 150 k_ 225 k_Yes Yes Yes Yes Yes Yes
Yes Yes Yes Yes Yes Yes
Twelve Original Missions, Multi-Junction Cells 1997 Baseline
Figure 22
Power Required, Power Available, and Altitude as a Function o[ Time
25 Deg]1000 km ROAJI50 kgs[PB=O/Silicon/6-15
J_#a'_avail (kWXSpan) I
Ti_lh_)
Cruise, Available, and Altitude as a Function of Mission Time
Power Computing Solutions, Inc. NAS2-96011 84
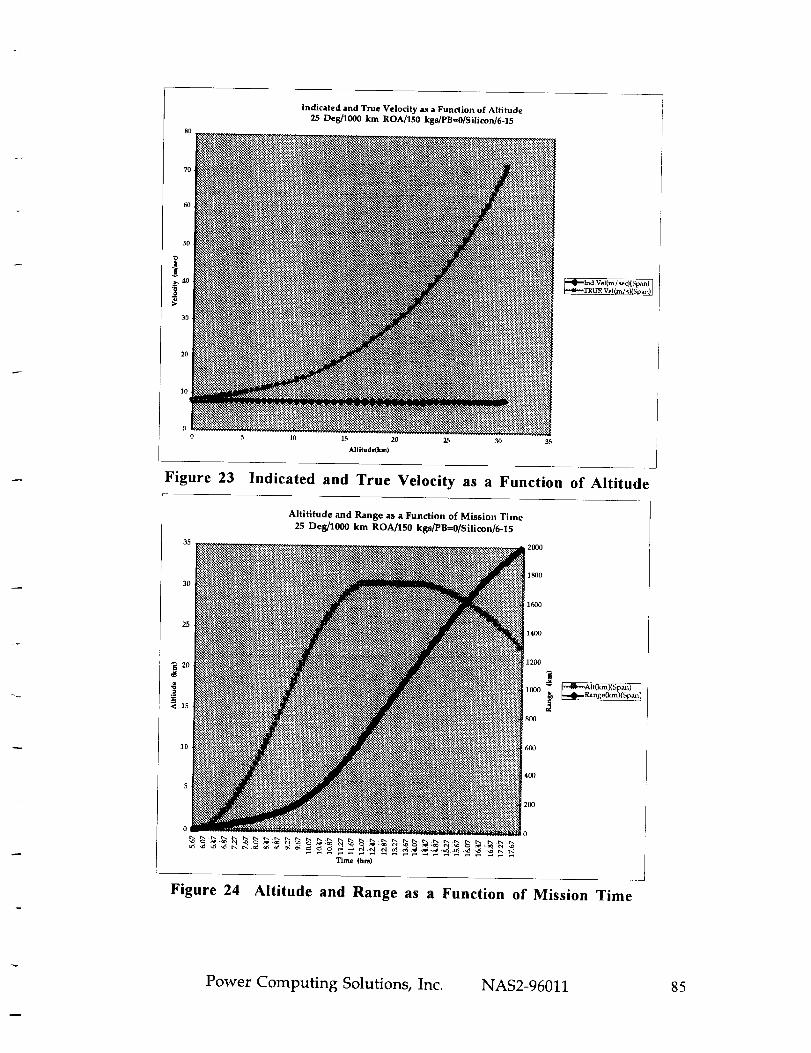
Indicated and True Velocity as a Funciion of Altitude
25 Deg/1000 km ROA/150 kgs/PBffi0/Silicon/6-15
TRUEVe| s S _r_
0 5 10 15 20 2._ 30 35
Allitude(km)
Figure 23 Indicated and True Velocity as a Function of Altitude
Altititude and Range as a Function of Mission Time
25 Deg/lO00 km ROA/150 kgs/PB--O/Silicon/6-15
_me(hm)
2000
1800
1600
1400
8.[111
401)
2N)
0
Figure 24 Altitude and Range as a Function of Mission Time
Power Computing Solutions, Inc. NAS2-96011 85

Drag Coefficients as a Function of Altitude
25 Deg/1000 km ROA/150 kgs/PB=0/Silicon/6-15
_T w mg _ Oil,,pan) I
i_f, CDt.'(st, aa) I
all COl(Span)
all CDp(Span
0 5 lfl 15 20 2_ _ 35
Altltttde(km)
Figure 25 Drag Coefficients as a Function of Altitude
Wing and Tail Reynolds Number as a Function of Altitude
25 Deg/1000 km ROA/150 kgs/PB=0/Silicon/6-1$
fl 5 10 15 20 25 30 35
Altitude (ken)
Figure 26
uag l(e4,bp an)il Re(Span
Reynolds Number as a Function of Altitude
Power Computing Solutions, Inc. NAS2-96011 86

Drag as a Function of Altitude
25 Deg/1000 km ROA/150 kgs/PB=0/Silico_6-15
Figure 27 Drag as a Function of Altitude
_nTaii Drag(Span) ]
_._._Fu _ Drag(Span)
..,_Tota Drag Span)
Power Computing Solutions, Inc. NAS2-96011 87

Mission Date at Take-off
Mission Duration (days)
Latitude (deg)
Maximum Altitude (km)Minimum Time Duration at Max. Altitude (hrs)
Minimum Radius of Action (km)
Payload Mass (kg)
Payload Power (W)XXXXXXXXXXXXXX
Airframe Type:
Wing Area
Wing SpanWing Aspect Ratio
Wing Loading
Airframe Output Data
Span Loaded
6\150.00
25.00
30.49
0.58
1000.00
150.00
0.00XXXXXXXXXXXXXX
204.00 m^2
63.87 meters
20.00
0.90 lb/ft^2
Propeller Type :
Propeller Efficiency (%)
Propeller Diameter (m)
Propeller Blade Aspect RatioXXXXXXXXXXXXXX
Drivetrain Performance Baseline:
Solar Cell Type :Solar Cell Efficiency (%)
Solar Cell Specific Mass (kg/sq m)
Solar Cell Approximate Cost (1997 $)
Type of Energy Storage System •
Motor Type :
Motor Efficiency (%)
Power Conditioning Efficiency (%)Electrical Power Generated at Mid-Day(watts)
Engine Mass (kg)
Propeller Mass (kg)
Solar Cell Mass (kg)
Fuselage Mass (kg)
Spar MassRib Mass
Leading Edge Mass
Trailing Edge MassControl Mass
Covering Mass
Fixed Pitch
Power Subsystem
85.000
4.40
14.00XXXXXXXXXXXXXX
Single Junction
92.13 kg
14.97 kg
83.84 kg
14.37 kg13.71 kg
116.26 kg
None
Induction Motor
1997
15.0001.005
$ 5.1Million
95.000
95.000
30898.18
64.13 kg
41.56 kg205.02 kg
51.62 kg
Total Wing MassBoom Mass
Tail Mass (kg)
Payload Mass
Energy Storage System Mass (kg)
335.29 kg0.00 kg
49.20 kg
150.00 kg
0.00 kg
TakeOff Time
Total Mass 896.00 kg5.57 hours
Table 32 Base Case SAAC Output
Power Computing Solutions, Inc. NAS2-96011 88
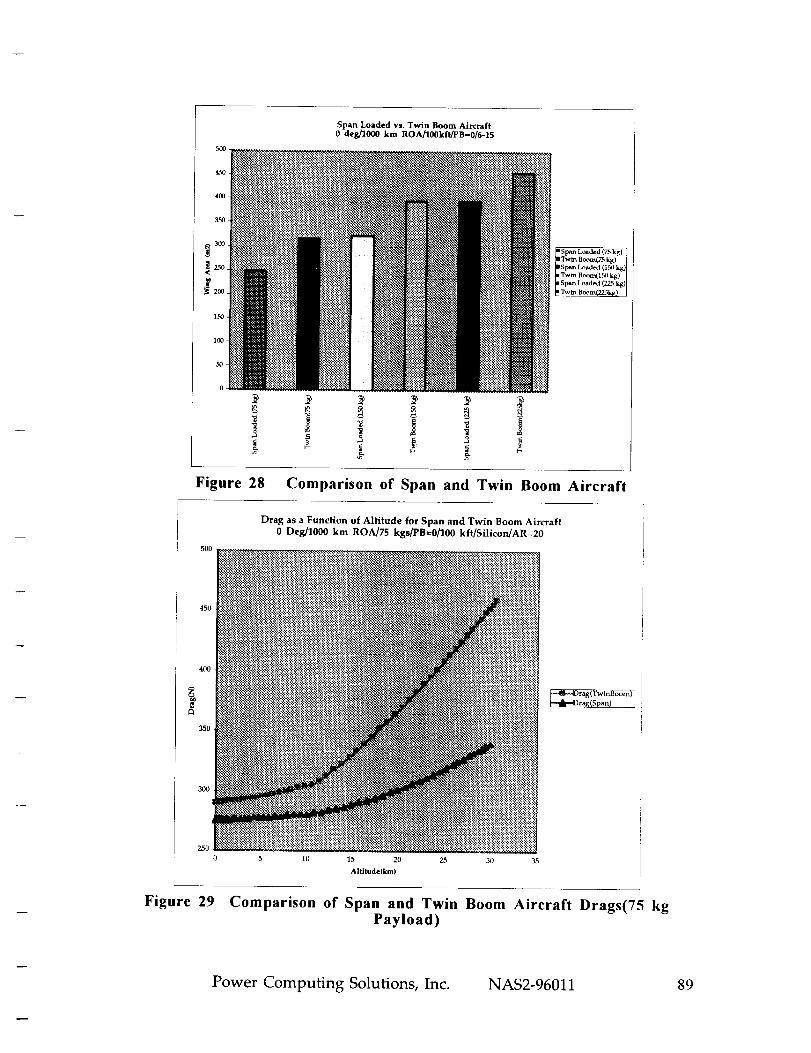
50O
45O
40O
3S0
_ 3c_IN)
_ 2c_
loo
N)
o
Span Loaded vs. Twin Boom Aircraft
0 des]1000 km ROAl100kftfl)B=016-15
3 _ _o _ 3
Span Loaded (75 kg) 1
_ 1N_ Booat(TS kg)
_l_n Loaded (1._) kg) I
]i'I_v_ Boora(l_) kg) J
_$pan Load.d (21g kg)]
Figure 28 Comparison of Span and Twin Boom Aircraft
500
Drag as a Function of Altitude for Span and Twin Boom Aircraft
0 Deg/1000 km ROA/75 kga/PB=0/100 kfl/Silicon/AR=20
450
400
35o
30o
25O
0 5 10 15 20 25 30 35
Alflludefkm)
rag(TwmBoom) I
r,_(Span)
Figure 29 Comparison of Span and Twin Boom Aircraft Drags(75 kgPayload)
Power Computing Solutions, Inc. NAS2-96011 89

Figure 30
900
8O0
7O0
(-,DO
400
200
100
0
Figure 31
Drag as a Function of Altitude for Span and Twin Boom Aircraft0 Deg/1000 km ROA/225 kgs/PB=0/100 kfffSilicon/AR=20
rAg/Span)
5 it) 15 20 25 .'_) 35
Altit ude(km)
Comparison of Span and Twin Boom Aircraft Drags(225 kgPayload)
Span Loaded vs. Twin Boom Aircraft25 deg/150 kg/1000 km ROAfI00 kfffPB=0/6-15
mSpan Loaded (AR=10)mmTwin Boom(AR=]0)ISpan Loaded (AR=20)
mmTwtnBoom(AR=20) [mSF,anLoaded (AR=30)iTwin Boom(AR=30)
Effects of Aspect Ratio on Span and Twin Boom Aircraft WingArea
Power Computing Solutions, Inc. NAS2-96011 90
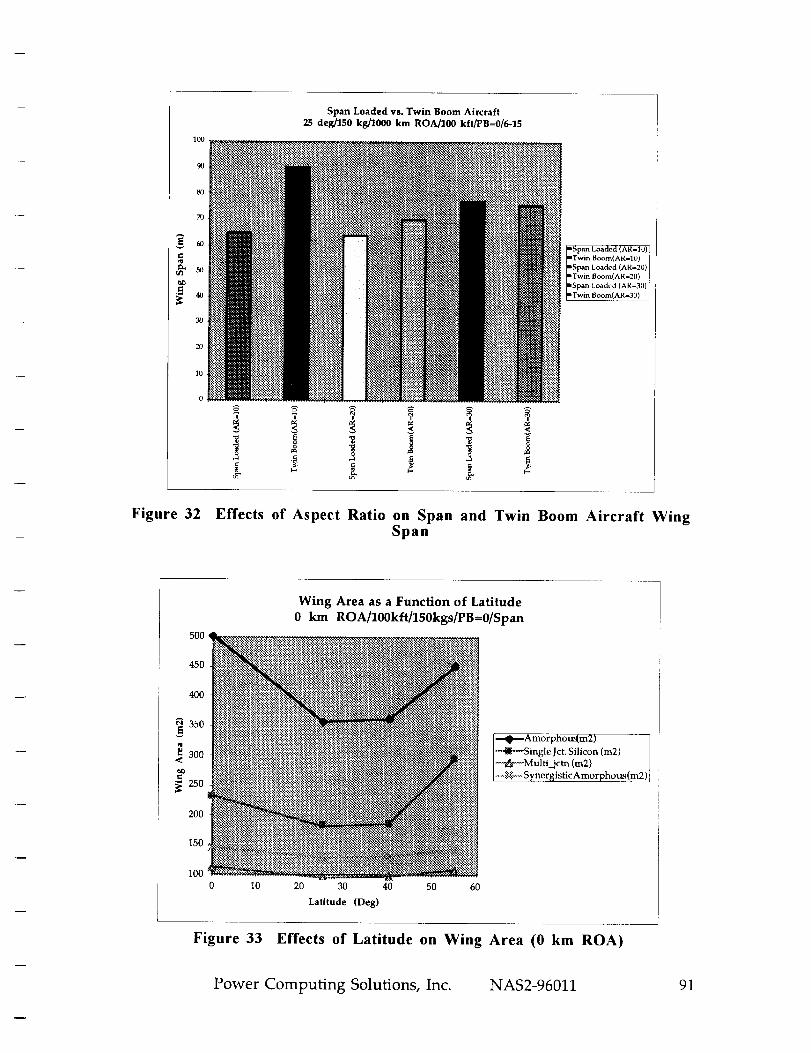
lOO .....m __.'_.._ _._ -.:._:::__,
_5_N_gNN+m ._',_',,_.__ ._.__._.,"._.
20 _
'° .tli._,_
0
&
Span Loaded vs. Twin Boom Aircraft25 deg/150 k_/1000 km ROA]_00 kft/PB=0/6-15
_:__:__._,_:__.:::_:_i_:_:_:_._:_:_'.__'_i_I_.:.._:._. _
N_NNN_
NN_N
H:_R
H_:_:_
?
&
_i_,_.:._,_,
?
&
:._:__._'.':.:_::._._:_!:::,_:_
: ,'-:_x x_:
_Ii_'x_' :_:
_::i:_,_ .:_:_:
,:_._..'::_ :_,_:
,.,_.._ ,+_
!
mSpan Loaded (AR-IO) J
• Twin Boom(AR-10) j
*Span Loaded (AR-20)
*Twin Boom(AR-20)
_Span Loaded (AR130)
_Tw n I_oom(AR-.,30
Figure 32 Effects of Aspect Ratio on Span and Twin Boom Aircraft WingSpan
500
450
4OO
350e_
,_300
_ 25o
200
150
lOO
.............
_............
_............_............
..-...-.-..=..- ..-.-.._........... _:_::::_:
. .........
lO
Wing Area as a Function of Latitude
0 km ROA/100kft/150kgs/PB=0/Span
--@--Amorphou_m2)•_41-_Single Jet.Silicon (m2)---_r-_Multi_jctn (m2).....§:_:......SynergisVicAmorphous(m2 ) i
20 30 40
Latitude (Deg)
50 60
Figure 33 Effects of Latitude on Wing Area (0 km ROA)
Power Computing Solutions, Inc. NAS2-96011 91
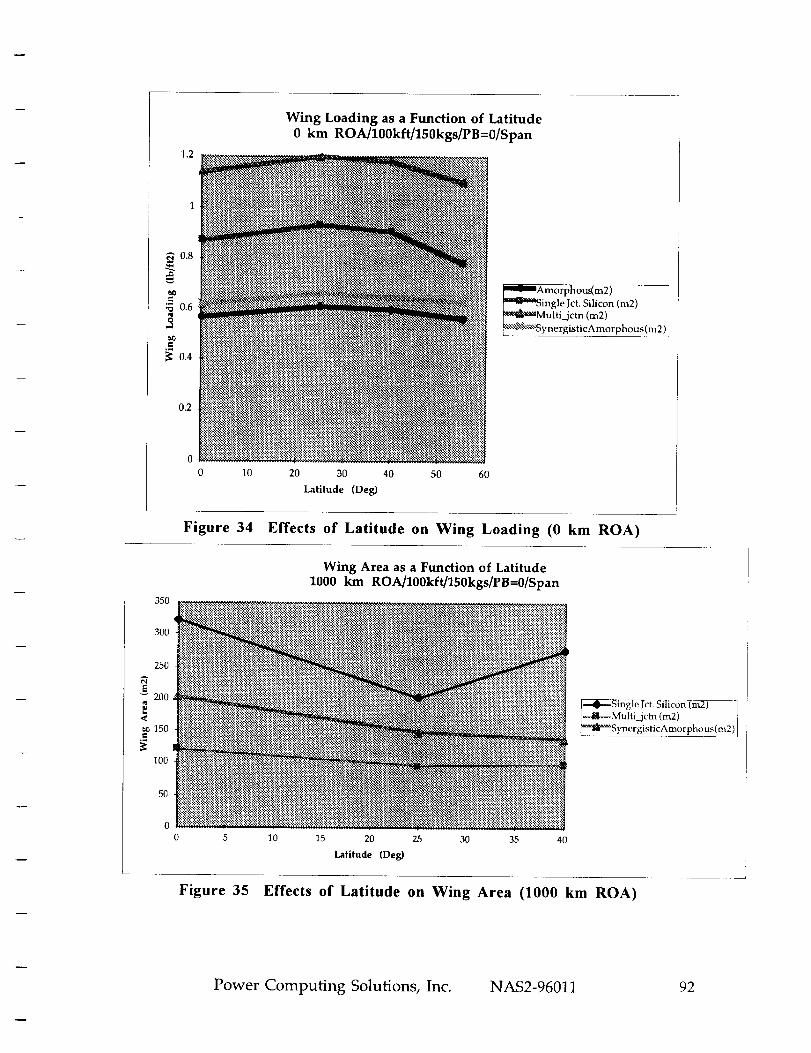
1.2
3.6
3.4
).2
Wing Loading as a Function of Latitude0 km ROA/100kft/150kgs/PB=0/Span
0 10 20 30 40 50 60
Latitude (Deg)
_Amorphous(m2)
"u'Om_ingle Jct. Silicon (m2)
_Multi_jctn (m2)
_-_xq\"x_SynergisticA morphous (m2)
Figure 34 Effects of Latitude on Wing Loading (0 km ROA)
350
300
250
200
150
100
50
0
Wing Area as a Function of Latitude1000 km ROA/100kft/150kgs/PB=0/Span
5 10 15 20 25 30 35
Latitude (Degl
4O
Single Jct._'-n_ -]Multi_jctn (m2)
SynergisticAmorphous(m2) I
Figure 35 Effects of Latitude on Wing Area (1000 km ROA)
Power Computing Solutions, Inc. NAS2-96011 92
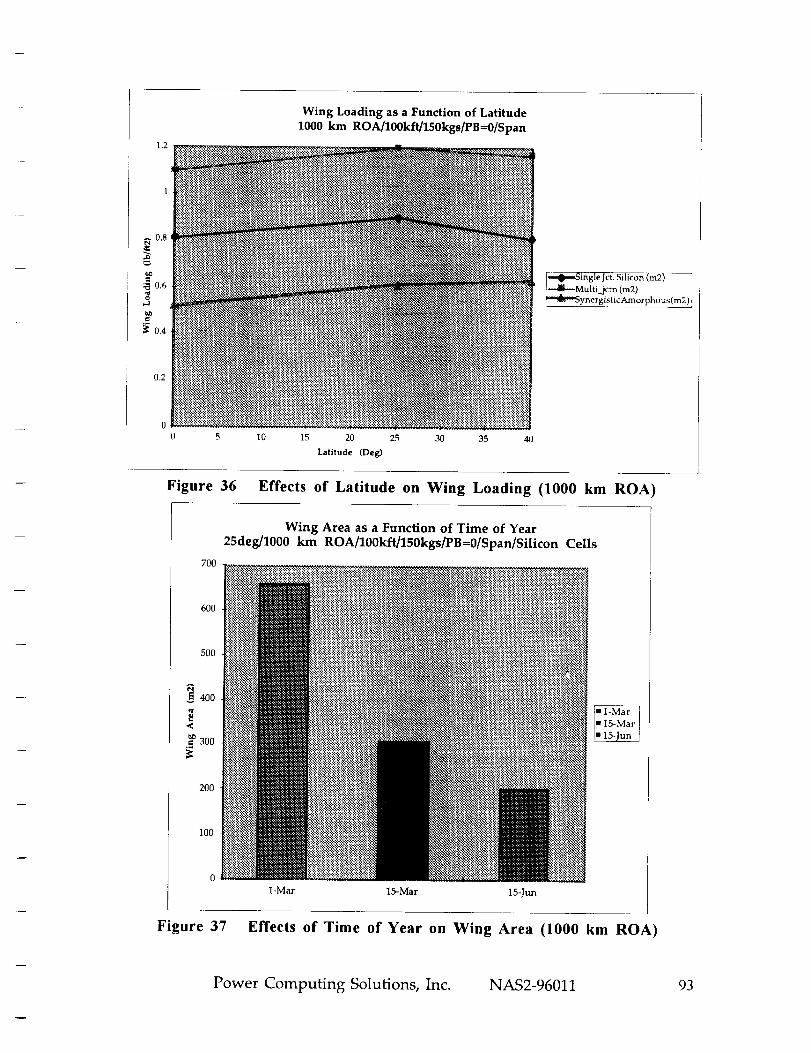
3
Wing Loading as a Function of Latitude
1000 km ROA/100kft/150kgs/PB=0/Span
0 5 10 15 20 25 30 35 40
Latitude (Deg)
I_ingle Jct. Silicon (m2) ]
[_Multi jctn (m2) ]y'mmmbynergisticAmor phous(m2) j
Figure 36 Effects of Latitude on Wing Loading (1000 km ROA)
70(
60£
506
_ 300
_00
k00
Wing Area as a Function of Time of Year25deg/1000 km ROA/100kft/150kgs/PB=O/Span/Silicon Cells
1-Mar 15-Mar I5-Jun
Figure 37 Effects of Time of Year on Wing Area (1000 km ROA)
Power Computing Solutions, Inc. NAS2-96011 93

60O
500
4O0
_ am
200
100
Wing Area as a Function of Solar Cell EfficiencyOdes/lO00 km ROA/100kftflS0kgs/6-15
010 12 14 16 18 20 22 24 26
Solar Cell Efficiency (%)
Wing Area(m2) 2000 km IWt_k_A_a[m2) 0km
Figure 38 Effects of Solar Cell Efficiency on Wing Area
1.4
1.2
1
_ 0.8
{0.6
0.4
0.2
0
10
Wing Loading as a Function of Solar Cell Efficiency0deg/1000 km ROA/100kft/150kgs/6-15
12 14 16 18 20 22 24 26
Solar Cell Effidency (o_;)
Wing L_adi_lb ! tt^2) 200(Y_
_---,,I_._ Wing Load ing(lb / it ^2 ) )kxn
Figure 39 Effects of Solar Cell Efficiency on Wing Loading
Power Computing Solutions, Inc. NAS2-96011 94
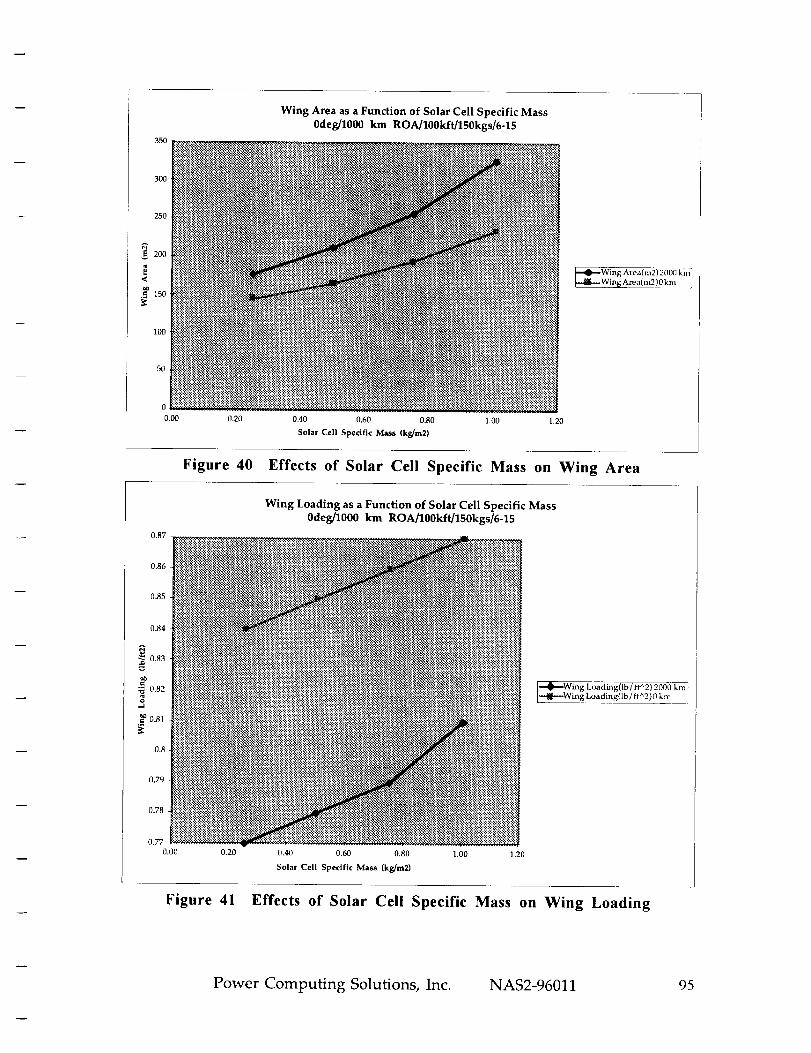
0.00
Wing Area as a Function of Solar Cell Specific Mass0deg/1000 km ROA/100kft/150kgs/6-15
0.20 0.40 0.60 0.80 1.00
Solar Cell Specific Mass (kg,/m2)
1.20
_Wing Area(m2) 2000km]
Win8 Area(m2)0km
Figure 40 Effects of Solar Cell Specific Mass on Wing Area
0.87
0.86
0.85
0.84
083
:_ 0.82
)==i
0.81
0.8
0.79
0.78
0.77
0.00
Wing Loading as a Function of Solar Cell Specific Mass0deg/1000 km ROA/100kft/150kgs/6-15
0.20 0.40 0.60 0.80 1.00 1.20
Solar Cell Specific Mass (kg/m2)
_Wing Loading(lb / ft^2) 2000 k na]
---,Lt--Wing Loading(lb / ft^2) O km J
Figure 41 Effects of Solar Cell Specific Mass on Wing Loading
Power Computing Solutions, Inc. NAS2-96011 95

200
180
160
140
_ 120
100 •
80.
60
40
20
0
Figure 42
Figure 43
Wing Area as a Function of Performance Baseline and Solar Cell Type25 Deg/0 km ROA/100 kft/6-15
Siticon/lO0 ktt/O k.m/lJB=O
GaAsSing[e-Jcn/100 kft/O km/PB=l
Muiti-Jcn /100 kft/O km/PB=O
Multi-J_n /100 kft/O km/PB=l
_c_nn/e_ _ic Amorphou_s / 100kf, / 0
-_ -_._ _ _._ .#_•_o ;_ _ _
Effects of Performance Baseline on Wing Area (0 km ROA)
Wing Area as a Function of Performance Baseline and Solar Cell Type
25 Deg/1000 km ROA/'100 kft/6-15
Sl]iconll00 kf//20(}O tan/PB=0GaAsShlgle Jcn/1 (X) kf//2000km/PB=]
Multi-Jcn /100 kf//20(K) km/PB=0
Multi-Jcn /ll)0 kft/2lXX) km/I'B=!
Synergkstic Amorphous / ll)0kft / 2(X)0kh_IPB=l
_, _7 _s _ _-":- t_ _
Effects of Performance Baseline on Wing Area (1000 km ROA)
Power Computing Solutions, Inc. NAS2-96011 96

200
180
160
140
[20
tO0
_ 8D
60
40
2(1
0
Figure 44
Wing Area as a Function of Solar Cell Type and MaximumAltitude
25 km Loaded
IMutti-Jcn /90 kft/0 km
i SynergL_ tic Amorphous / 90kft/0km
iSilicon/It)() kft/0 km
IMulti Jcn /100 kft/t) km
I SynergLsti¢/_morpho_s / I0t)kft / 0 km
d _
+ ++ + -_
Effects of Maximum Altitude on Wing Area (0 km ROA)
60
50
40
30
_°
_._ -1121
-20
-30
-40
-50
% Change in Wing Area as a Function of Solar Cell Type and
Maximum Altitude
25 De km ROA/150 Dan Loaded
IMulti-Jcn /90 kfl/0km
IISynergLstic r
Amorphous/90 kft/(_km ]
IlSilicon/100 kft/ll kn_.
IIMulti-JCnkm /100 kft/O l
Figure 45 % Change from Baseline as a function of Solar Cell Type onWing Area (0 km ROA)
Power Computing Solutions, Inc. NAS2-96011 97
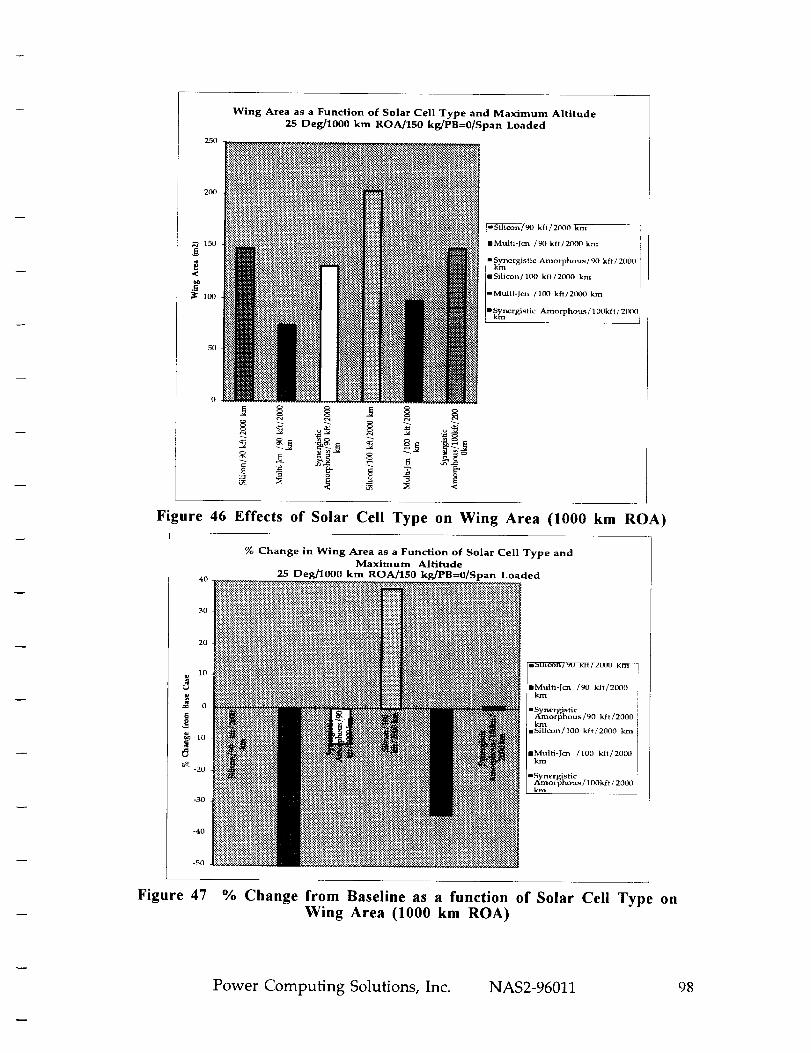
25O
Wing Area as a Function of Solar Cell Type and Maximum Altitude
25 Deg/1000 km ROA/150 kg/PB=0/Span Loaded
200
150
100
50
mSilicon/90 kft/2000 km
• Multi-Jcn /90 kft/20(h9 km
m Synergistic Amorphous / 90 kft / 2000km
• Silicon/1(30 kft / 2000 km
mMulfi-Jcn /100 kfi/2000 kln
ml_nergistic Amorphous / 100k ft / 2000
Figure 46 Effects of Solar Cell Type on Wing Area (1000 km ROA)
40
30
2O
10
q_
o
-10 .
d5-20
-30 .
-40
-5O
%Change in Wing Area as a Function of Solar Cell Type and
Maximum Altitude
25 Deg]1000 km ROA/150 kg/PB=0/Span Loaded
m_llleon/"_u K_Tf ZUtlU I(nl
IMutti-Jcn /90 Mt/2Cll0km
I Synerl_istic-a2mor'lShous / 90 k/t/2000km
mSilicon/100 kft/2000 kna
Ik_lti-Jcn /100 kft/200o
ISynergistic [
_morphous / 1 00kft / 2000 J
Figure 47 % Change from Baseline as a function of Solar Cell Type onWing Area (1000 km ROA)
Power Computing Solutions, Inc. NAS2-96011 98

_O0
5O
Figure 48
Wing Area as a Function of Payload Mass and Solar Cell Type100 kft/0 km ROA/PB=0
kgs
Payload Mass and Solar Cell Effect on Wing Area (0 km ROA)
Wing Area as a Function of Payload Mass and Solar Cell Type100 kft/1000 km ROA/PB=0
Figure 49
I $ilicont 100 kft / 20tX)
km/l_=01150 kgs
i Silicon/100 kf_ / 2000
knx / PB =O / 22.5 kgs
•_}'gVo/_°_d"/_°°"iMulii-lcn /10D kft/2D00
km/t'_=0/1 SO kgs
• Multi-Jcn / 10O kft/21)00krn/PB=O/225 kgs
• Synergist icAt-m_rphrms / 100kft/2000km/75kgs
• SynergisticAnx_r_htms / 1170 kft 12tX)(Ikin/150kgs
• SynergisticAmorphous/lD0kft / 2f_)0
km/22Skgs
Payload Mass and Solar Cell Effect on Wing Area (1000 kmROA)
Power Computing Solutions, Inc. NAS2-96011 99

185
180
175
170
_165
<
._ 160
15s
15o
145
14o
Wing Area as a Function of Energy Storage System
40 Deg/PB=0/225 kgs/90 kft/1000 km ROA
{_._ _,¢,_., ,. .
,._$,', x x
iNN ,
Alkaline
• No Storagel
ImAIkalme_Lithium
Figure 50 Energy Storage Selection Effect on Wing Area (1000 km ROA)
***************Solar Aircraft Analysis Code SAAC)***********
Mission Date at Take-off 6\15
Mission Duration (days) 0.00
Latitude (deg) 40.00
Maximum Altitude (km)
Minimum Time Duration at Max. Altitude (hrs
27.44
0.58
Minimum Radius of Action (km) i000.00
Payload Mass (kg)
Payload Power (W)
225.00
0.00
XXXXXXXXXXXXXX Airframe Output Data
Airframe Type:
Wing Area
Wing Span
Wing Aspect Ratio
Wing Loading
XXXXXXXXXXXXXX
Span Loaded
157.00
56.04
20.00
1.09
m^2
meters
ib/ft^2
Propeller Type :
Propeller Efficiency (%)
Propeller Diameter (m)
Propeller Blade Aspect Ratio
Fixed Pitch
85.000
4.40
14.00
XXXXXXXXXXXXXX Power Subsystem XXXXXXXXXXXXXX
Power Computing Solutions, Inc. NAS2-96011 100
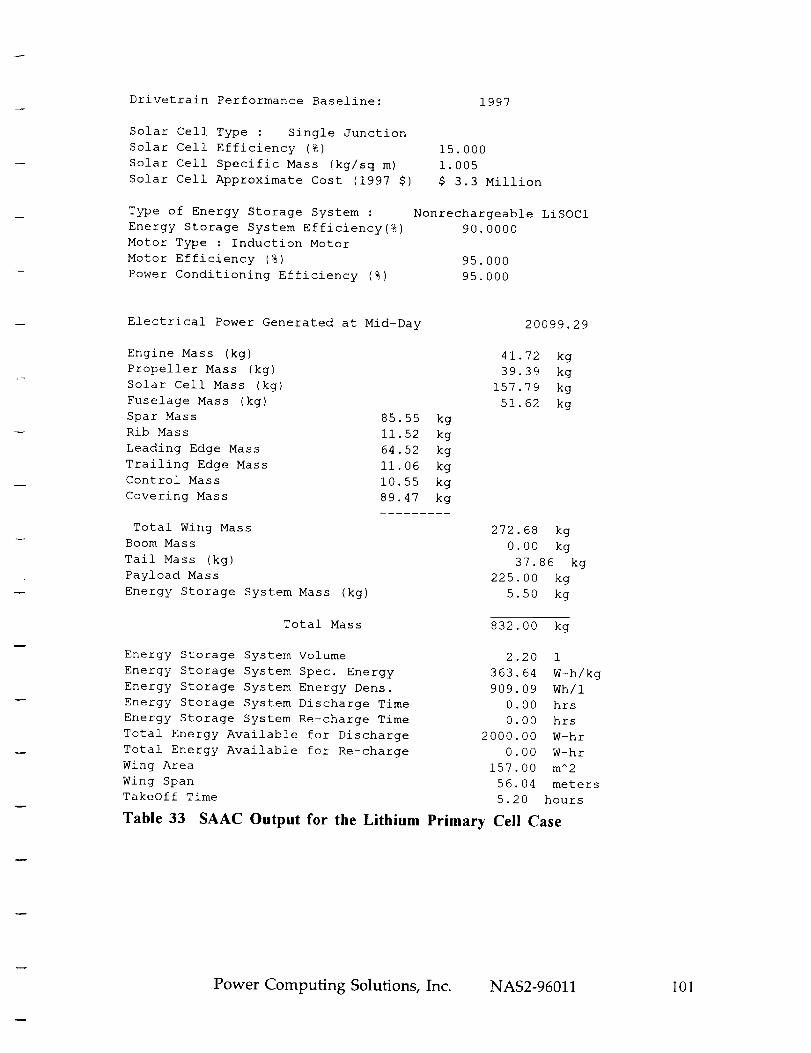
Drivetrain Performance Baseline:
Solar Cell Type : Single Junction
Solar Cell Efficiency (%)
Solar Cell Specific Mass (kg/sq m)
Solar Cell Approximate Cost (1997 $)
Type of Energy Storage System :
Energy Storage System Efficiency(%)
Motor Type : Induction Motor
Motor Efficiency (%)
Power Conditioning Efficiency (%)
1997
15.000
1.005
$ 3.3 Million
Nonrechargeable LiSOCI
90.0000
95.000
95.000
Electrical Power Generated at Mid-Day 20099.29
Engine Mass (kg)
Propeller Mass (kg)
Solar Cell Mass (kg)
Fuselage Mass (kg)
Spar Mass
Rib Mass
Leading Edge Mass
Trailing Edge Mass
Control Mass
Covering Mass
85.55
11.52
64.52
11.06
10.55
89.47
kg
kg
kg
kg
kg
kg
41.72 kg
39.39 kg
157.79 kg
51.62 kg
Total Wing Mass
Boom Mass
Tail Mass (kg)
Payload Mass
Energy Storage System Mass (kg)
272.68 kg
0.00 kg
37.86 kg
225.00 kg
5.50 kg
Total Mass 832.00 kg
Energy Storage System Volume
Energy Storage System Spec. Energy
Energy Storage System Energy Dens.
Energy Storage System Discharge Time
Energy Storage System Re-charge Time
Total Energy Available for Discharge
Total Energy Available for Re-charge
Wing Area
Wing Span
TakeOff Time
2.20 1
363.64 W-h/kg
909.09 Wh/l
0.00 hrs
0.00 hrs
2000.00 W-hr
0.00 W-hr
157.00 m^2
56.04 meters
5.20 hours
Table 33 SAAC Output for the Lithium Primary Cell Case
Power Computing Solutions, Inc. NAS2-96011 101

Figure 51 Energy Storage Selection Effect on Wing Loading (1000 kmROA)
Battery Level and Altitude as a Function of Mission Time
Lab-40 Deg/225 kg/90 kft/Lithium Battery/Total W-hr-2000/1000 km ROA
0A
Figure 52 Battery Charge State and Altitude as a Function of Mission Time
(1000 km ROA)
Power Computing Solutions, Inc. NAS2-96011 102
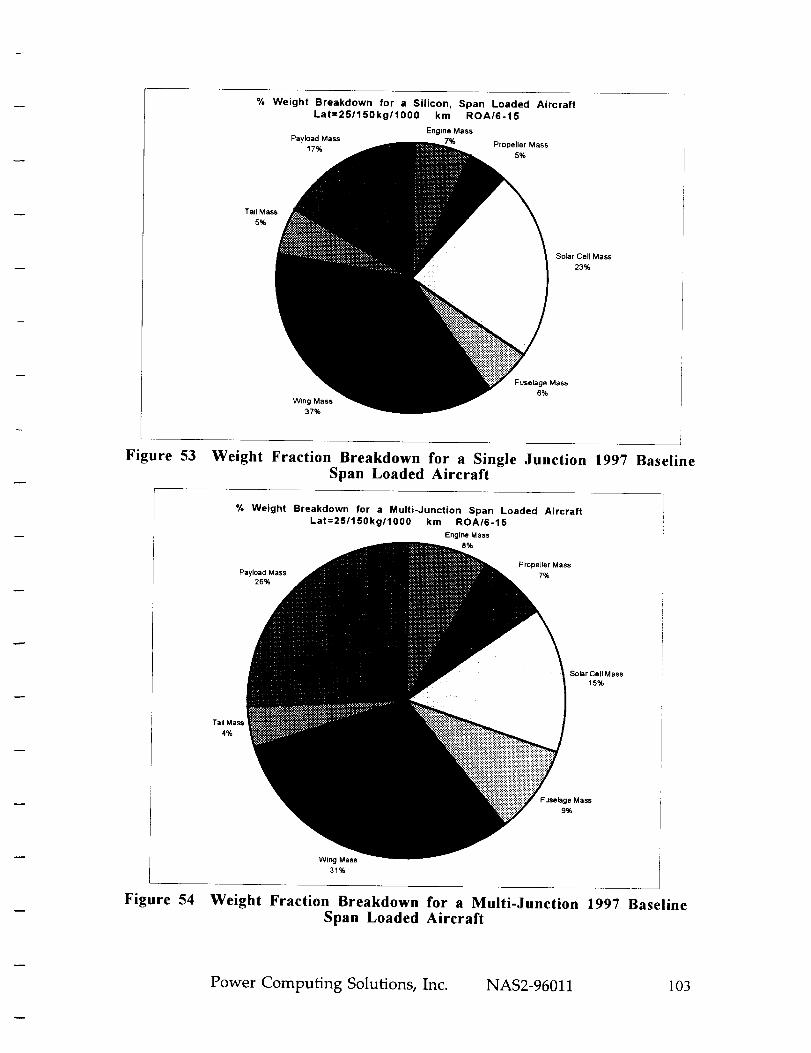
% Weight Breakdown for a Silicon, Span Loaded Aircraft
Lat=251150kg11000 km ROA/6-15
Engine Mass
Payload Mass 7% Propeller Mass17% 5%
Tail Mass
5%
So_rCellMass
23%
Wing Mass37%
Fuselage Mass6%
Figure 53
Figure 54
Weight Fraction Breakdown for a Single Junction 1997 BaselineSpan Loaded Aircraft
% Weight Breakdown for a Multi-Junction Span Loaded Aircraft
Lat=25/150kg/1000 km ROAI6-15
Engine Mass8%
Payload Mass26%
Propeller Mass
7%
Solar Cell Mass15%
Tail M
4%
Fuselage Mass9%
Wing Mass31%
Weight Fraction Breakdown for a Multi-Junction 1997 BaselineSpan Loaded Aircraft
Power Computing Solutions, Inc. NAS2-96011 103

% Weight Breakdown for a Synergistic Amorphous, Span Loaded Aircraft
Latm25/150kg11000 km ROAI6-15
Engine MM$ Propefler Mass
1% 9%
Solar C,JI Mass
1%
Tail Mass
Wing Mass
Figure 55 Weight Fraction Breakdown for a Synergistic Amorphous 1997Baseline Span Loaded Aircraft
18
16
14
Aircraft Solar Cell Approximate CostSpan Loaded Aircraft Lat=-25/150kg/1000 km ROA/6-15
Single Junction Multi-Junction Synergistic Amorphous
[e Junction ]
• Multi-Junction /
g SynergLstic Amorphou_]
Figure 56 Approximate Cost Comparison of Airframes with Various SolarCell Types
Power Computing Solutions, Inc. NAS2-96011 104

APPENDIX A: AIRFOIL SELECTION
To show the effects of airfoil choice on aircraft size, three separate airfoils were
used in this study. The airfoil data was provided by NASA Ames Research Center. Two
of these airfoils were chosen for their ability to demonstrate the tradeoffs between an airfoil
with a small pitching moment, requiring a small tail but with poorer performance at low
Reynolds numbers versus an airfoil with a large pitching moment requiring a large (and
boomed) tail with better low Reynolds number performance. Both the Twin-Boom and the
Span loaded aircraft are considered span loaded. The difference in the simulation is that the
pitching moment is compensated by a long tail in the twin-boom aircraft and the pitching
moment is compensated on the span loaded aircraft by a tail just aft of the wing. This is the
basic trade explored for the twin boom versus span loaded aircraft part of the study.
The airfoil chosen for the span loaded aircraft (corresponding to the low pitching
moment airfoil) is the Liebeck L1003 20% thick airfoil. Figure 57 shows the basic airfoil
geometry used for calculating surface area of the airfoil. Figure 58 shows the Power
Factor vs. CI lines for the airfoil along with the operating line chosen for this airfoil to
maximize power factor. Figure 59 and 60 show the regressions and plot of CI and Cd as a
function of Reynolds number for this operating line.
A Wortman FX63, 13.7 % thick airfoil was used for the twin-boom aircraft. It has
a much high pitching moment than the Liebeck ( about -. 12 vs. -.04) but it has better low
Reynolds number Cd and Cl performance. Figures 61, 62, and 63 show the power factor,
lift, and drag correlation's used for this study.
The Clark Y 5.9% thick airfoil was chosen for the tail section of both the span
loaded and twin boom aircraft. Its operation is based on compensating the pitching
moment generated by the primary airfoil. Therefore once the moment of the primary airfoil
is generated the tail section must compensate for it by exerting an equal and opposite force.
Based on the necessary C1 of the airfoil, an interpolation is performed between the CI vs.
Cdprofile at a C1 of 0 and a C1 vs. Cdprofile at a CI of .45. This provides the profile drag
of the airfoil. Figures 64, 65, and 66 show the power factor plot, and the Lift and Drag
profiles of the airfoil.
Power Computing Solutions, Inc. NAS2-96011 105

0.160 '
0.140 '
0120 '
0100 '
0.080 "
0060 "
0040 "
0020 m
0.000
O0 000
-0020 "
Figure 57 Airfoil Profile for the Liebeck 1003
2O O0
o oc02
Figure 58
Llebeck L1003M Pow_ Factor (ARm20)
04 O_ Oe 1 12 14 16 1 _ 2CL
Power Factor as a Function of CI for the Liebeck LI003M
Power Computing Solutions, Inc. NAS2-96011 106
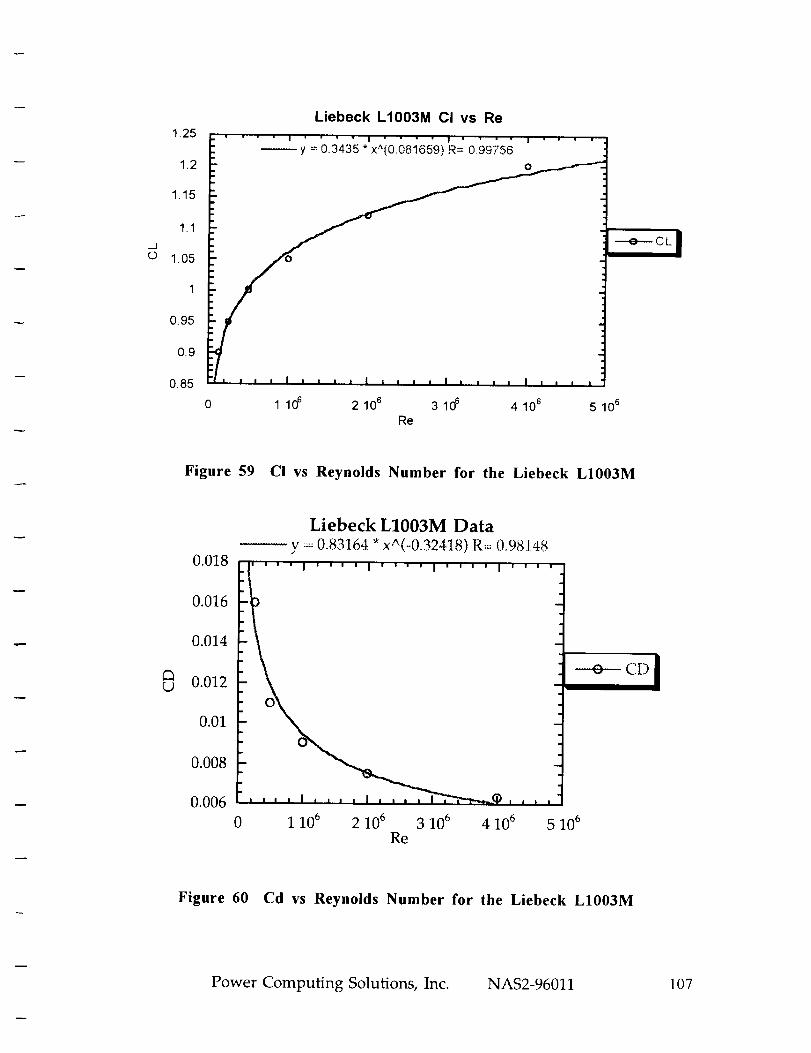
1.25
1.2
1.15
1.1
1.05
1
0.95
0.9
0.85
Liebeck L1003M CI vs Re
! I I I
y = 0.3435 * x^(0.081659) R= 0.99756
' = _ = I i I a I I = = = ! I a a i J I = = , I
1106 2106 3106 4106 5106Re
Figure 59 Ci vs Reynolds Number for the Liebeck L1003M
Liebeck L1003M Data
-- y = 0.83164 * x,"(--0.32418) R= 0.981480.018
0.016 i , ,, ,,
0.014
CD I_ 0.012
0.01
0.008 I
0.006 .... i .... ) , ,, , i ,,-";m--,-._O, , ,
0 1 106 2 106 3 106 4 106 5 106Re
Figure 60 Cd vs Reynolds Number for the Liebeck L1003M
Power Computing Solutions, Inc. NAS2-96011 107

WOR'rMAN FX$3-137-MOD PO_ Factor [ARI20)
40 o0
3o 00
+_oo
1ooo
ooo __ i i o_s l i.o o_ o, o_ i I 14 16cL
Figure 61 Power Factor for the Wortman FX-63-137-mod
1.3
1,2
11
0.9
08
Wortman FX-63-137-mod a
.......... _ ........................ ° LL m .......................
: _ ............ _ .......... _1_._4
)Imlm_lllmllllmllmllllllm5 0 5 1 10 _ 15 10 _ 2 10 6 2.5 10 _
Figure 62 CI as a Function of Reynolds # for the Wortman FX-63-137-
mod
Power Computing Solutions, Inc. NAS2-96011 108
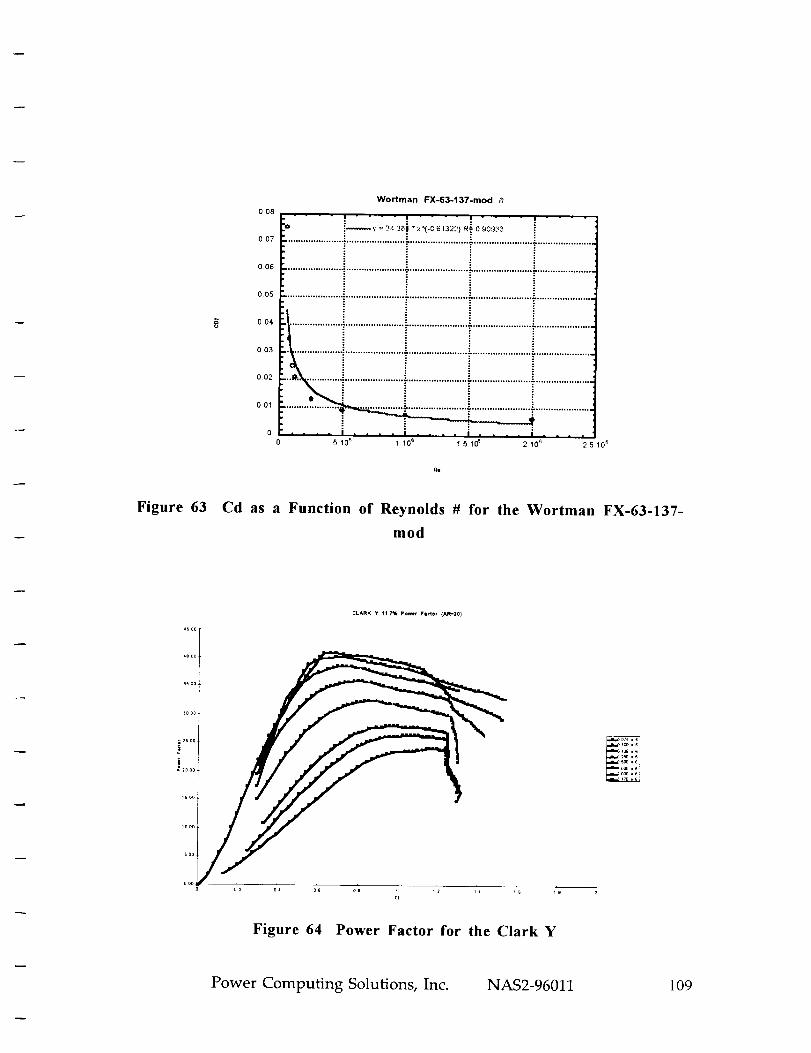
Figure 63
Wortman FX-63-137-mod co
0.08
I ........ ! .... | ........
:_v : 3,: '3a_ "x_(-O '.,a.'132:,i ,_:" o90933
oo,006
008 .,
004 ............................................. = ......................................................................
0.03
oo_ . ..............._.......................".......................- ....................i
oo, _.. ' i ) i i
0 .... I .... I - - • • I .... ! . . ,
5105 1 ,0 s 1510 _ 210 s 2510 _
Cd as a Function of Reynolds # for the Wortman FX-63-137-
rood
CLARK Y 11 7_ Power Factor (AR-20)
AS°° l
O2 O4 OS oB 1 12 14 _G 1B
cl
Figure 64 Power Factor for the Clark Y
Power Computing Solutions, Inc. NAS2-96011 109
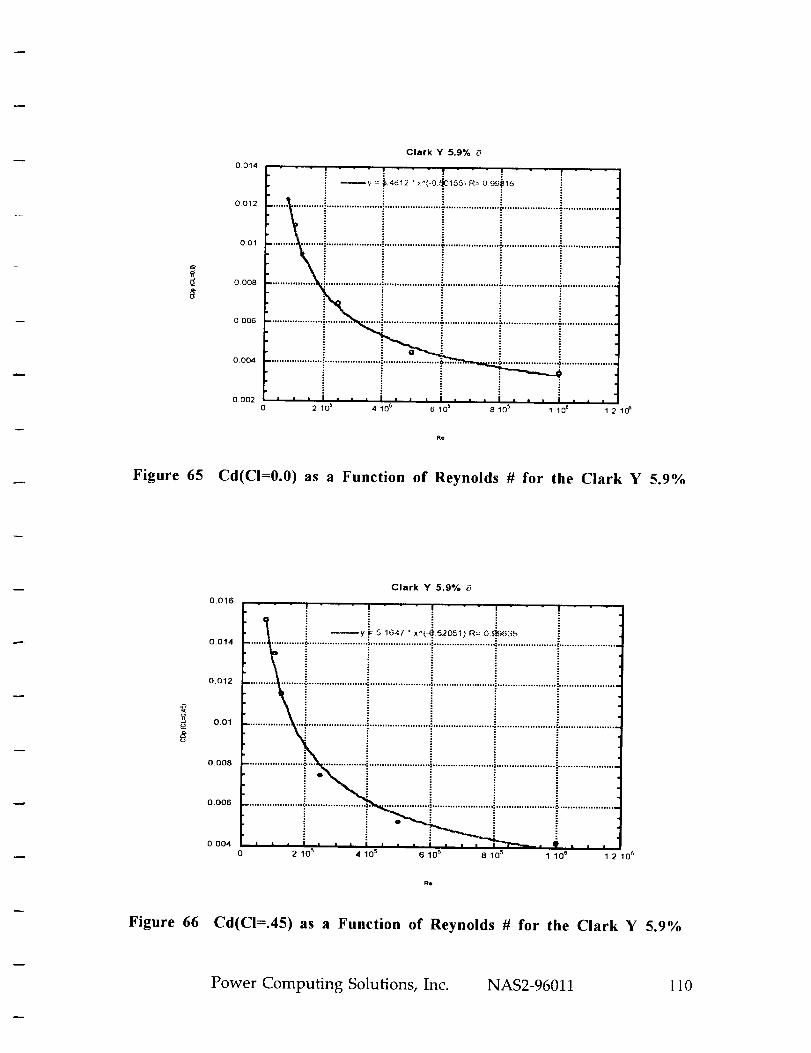
0014
0.012
0.01
0 008
0006
0 004
0.002
Clark Y 5.9% (3
| i i
--y = _4612 * :'^(-f) _,1551 ,c;t.: 0 99_16I
.........................................)......................i.....................+.....................+.....................
................... .:...................... .: ...................... _, ..................... ,F ..................... _ .....................
o i + )
• , • I • • • I I " , I m I • I • • , I , , •
2 105 4 105 6 105 8 105 1 10 e 12 1_
Figure 65 Cd(CI=0.0) as a Function of Reynolds # for the Clark Y 5.9%
0,016
0.014
0.012
0.01
0.008
0.006
0.004
Clark Y 5.9% 0
_y i" 5 1647 * x"(-I: 52051) R== 0..(_)635
................... .........................................................................................................................
=,
...................... _" .................... _........................ i ........................ i ....................... _.......................
...................... ;.. ....................... = ................... +........................ =........................ _, ......................
i - " i i
2 105 4 105 6 105 8 105 1 106 12 10 e
Figure 66 Cd(C!=.45) as a Function of Reynolds # for the Clark Y 5.9%
Power Computing Solutions, Inc. NAS2-96011 110

APPENDIX B: FLYWHEELS
Energy Storage Rotors
The flywheel rotor stores energy by the rotation of the rotor. The amount of energy stored
is proportional to the mass of the rotor, the square of its radius, and the square of the speed
of its rotation. Ideally, it is desirable to spin a small rotor at very high speeds, because this
maximizes specific energy and minimizes momentum. Practically, the strength of rotor
material, the maximum speed capability of the motor/generator, aerodynamic drag, and
bearing losses all establish upper limits on the maximum operating speed. For a hollow
ring or cylinder (which is representative of an ideal flywheel system) the polar moment of
inertia is given by:
where:
m-- mass of the rotor
r0 = outside radius of the rotor
r_ = inside radius of the rotor
1 ( 2 2)1:-2miCro--_ )1
The kinetic energy, Ek, stored in a flywheel is given by the relationship
Ek:lIco 2
where:
(D is the angular frequency
The ratio of stored energy to mass is called the specific energy of the flywheel, and the ratio
of stored energy to volume is called the energy density. The theoretical maximum specific
energy of a candidate flywheel rotor material can be calculated if the maximum strength and
density of the material are known. This maximum specific energy is derived from the hoop
stress equation and is given by the following:
m 2pwhere
O" is the material strength
/9 is the material density.
Power Computing Solutions, Inc. NAS2-96011 111

Because all real rotors have some size to them, much of their material is placed away from
the outer surface, where it stores less energy than it is theoretically capable of. Therefore,
all real flywheels will always have lower specific energy than predicted by this equation.
This equation given above is useful when comparing various materials for their potential to
flywheel energy storage systems.
Momentum Storage in a Flywheel
The angular momentum, of a rotating body is equal to:
At=I(D
Conservation &momentum of a rotating flywheel tends to maintain the orientation of the
axis of spin. If a torque is applied such that it would tend to change the orientation of this
axis, conservation &momentum results in another torque acting 90 degrees away from the
applied torque, and in the plane of the axis of spin. This phenomenon is called the
"gyroscopic effect" and it can produce substantial torque. For aircraft and vehicular
flywheels, it is desirable to minimize the momentum of the spinning rotor in order to
minimize the gyroscopic effect and its potential effects on vehicle handling.
Specific energy can be maximized and momentum can be minimized by spinning a small
rotor, made from a lightweight but strong material, at very high speeds.
Power
The power for a rotating systems is defined by:
P= Toowhere:
T is the torque applied by or applied to the motor/generator.
Assuming that the maximum torque of a flywheel's motor/generator at any particular speed
is constant, the maximum power will increase in direct proportion to the maximum speed of
the rotor. Operation at high speeds therefore increases the specific power and power
density of electric motor/generators.
Synergistic Effects
One opportunity was explored for using the flywheel energy storage systems to not
only function as an energy storage device but to also eliminate the aircraft control system.
Currently, flywheels are under consideration to replace not only the battery energy storage
Power Computing Solutions, Inc. NAS2-96011 112

subsystem on spacecraft, but to also double as control systems for these spacecraft. By
appropriate positioning and control of flywheels, a net torque can be placed on the
spacecraft by a combination of spin up/spin-down of the flywheels used for energy
storage. At most, this could eliminate the need for any control surfaces on the aircraft. The
following correlation to estimate control mass for the solar aircraft:
Masscontrols (kg) =. 3006 *
where:
Sw is the wing area (m2)
AR is the Aspect Ratio of the aircraft's Wing
Sw
AR .5
Figure 10 shows control system mass as a function of aspect ratio for various
aircraft wing areas. Previous studies have shown that for a 200 W-hr/kg energy storage
system solar aircraft the total aircraft mass is about 1500 kg. ×X_ This example shows that,
at most the removal of the control system on the aircraft would change the total mass of the
aircraft by about 3% to .3%.
Other possibilities for using the flywheels for a second function include using their
structure, designed to contain a rotor failure, as part of the aircraft structure itself.
Assuming that the energy storage requirements for the aircraft is 6 kW for a 12 hour dark
period equates to a energy storage requirement of 72 kW-hr. Using the USFS energy
density of 109 W-hr/Liter equates to 660 liters of volume or 23.3 ft _ needed for energy
storage.
u
=
Power Computing Solutions, Inc. NAS2-96011 113

Aircraft Control System Mass as a Function of Aspect IRatio for Various Wing Areas
1::::::::::::::::::::::::::::: _*'_--;:<--_'_ _ I ' " _" = * [ "wing Area(m2) 2001/:_:.V'_ng Area(m2) 300 I
Em 25 X I }1( w xWing Area(m2)4oo /::i ..... L " " '" _" _" ..x. _|... XWincl Area(m2) 500/'
0
1 0 20 30 40 50
Aspect Ratio
Figure 67 Aircraft Control System Mass vs. Aspect Ratio
Power Computing Solutions, Inc. NAS2-96011 ! !4

_Brinker, D. Personal Communication, NASA Lewis Research Center, Solar Cell Research, August 1997.
ii Warshay, M. et al., "The NASA Fuel Cell Upgrade Program for the Space Shuttle Orbiter", August1997, IECEC.
_iiPower Computing Solutions, Inc. "Component Modules for PEM Fuel Cell System ConceptualDesigns", NASA LeRC Contract C-79578-E, August 1997.
iv Pow, R., Reindle, M. Tillmetz, W., "1996 Fuel Cell Seminar Abstracts, pages 276-279, November1997.
vKohout, L., NASA Lewis Research Center, NASA TM 101980, June 1989.
viMockler T., Maldonado J., Schmitz, P. "A Triply Turbocharged Rotax 912 for High Altitude UAV,1994, NASA Lewis Internal Document
vi, McElroy, et al., NASA Space Electrochemical Research and Technology Conference Proceedings, 1991.viii Ibid iii
i× California Air Resources Board, CARB Report on Electric Vehicle Batteries, 1995.
× Pellerin, Alain, "Are You Talking Batteries", Electric & Hybrid Vehicle Technology '96, pages 68-75.'_ Green, Robert, Personal Communiction, NASA Lewis Research Center, March 1997.
'_1Raymond Beach, NASA Lewis Research Center Flywheel Contact.
_ "An Assessment of Flywheel Energy Storage Technology for Hybrid and Electric Vehicles", AbacusTechnology Corporation, Prepared for the U.S. DOE, 1996._v Ibid. ii
xvCoyner, John V., "Flywheel Energy Storage System for Utilities and Their Customers", lecture notes,
Oak Ridge National Laboratory Energineering Technology Division, Oak Ridge, TN
×_ Beachley, A Comparison of Accumulator and Flywheel Energy Storage for Motor Vehicle Applications.×'_ DOE Hybrid Electric Vehicle Web Site, http://www.hev.doe.gov, 1997
x_ii Parks, Bill, Personal Communication, Aerovironment, April 1997.
_× R. Tew, Personal Communication, NASA Lewis Research Center, April 1997.
'_ David W. South, Jon R. Mancuso, Mechanical Power Transmission Components, Marcel Dekker, Inc.1994, p589.
x_ Richard J. Parker, Stuart H. Loewenthal, George, Fischer, "Design Studies of Continuously VariableTransmissions for Electric Vehicles", NASA TM-81642, 1981.x_i Ibid v.
,_i, A. Colozza, "Effect of Power System Technology and Mission Requirements on High Altitude LongEndurance Aircraft", NASA CR-194455, February 1994.
Power Computing Solutions, Inc. NAS2-96011 115