ijcsr-volume2-issue3 special issue
TRANSCRIPT

8/17/2019 ijcsr-volume2-issue3 special issue
http://slidepdf.com/reader/full/ijcsr-volume2-issue3-special-issue 1/164
IJCSRInternational JournalImpact Factor: GIF – 0.676
Indexed over 23 databases.
Dr.BGR Publications3/30/2016

8/17/2019 ijcsr-volume2-issue3 special issue
http://slidepdf.com/reader/full/ijcsr-volume2-issue3-special-issue 2/164
2016; IJC
Available at: http://www.drbg
SR. 2(3): http://www.drbgrpublications.in/ijcsr.p
olume 2; Issue 3 [Special
IJCSR
rpublications.in/ijcsr.php
hp; ISSN: 2454-5422
Issue] 2016

8/17/2019 ijcsr-volume2-issue3 special issue
http://slidepdf.com/reader/full/ijcsr-volume2-issue3-special-issue 3/164
2016; IJC
Int
A Ne
Sarah Tucke
SR. 2(3): http://www.drbgrpublications.in/ijcsr.p
rnational Conference on
w Horizon in MaterialsDate
11th March, 2016
Organized by
Department of Physics
r College (Autonomous), Tamilnadu, India
hp; ISSN: 2454-5422

8/17/2019 ijcsr-volume2-issue3 special issue
http://slidepdf.com/reader/full/ijcsr-volume2-issue3-special-issue 4/164
2016; IJC
About Sarah Tucker Colleg
Sarah Tucker College, fou
minority institution of highe
the Tirunelveli Diocesan
University. The motto of the
The mission is 'Service T
through earnest academic p
society. It seeks to serve a
academic standards and its
‘with A' Grade in 5th January
About the Physics Depart
Physics was introduced as a
the Postgraduate level in 19
in laying stress on teachin
counseling. The Departmen
excellent results and univer
have had M.Sc., Physics cou
state of excellence under the
faculty.
Objective of the Internatio
To expose the recent develstudents, research scholars a
SR. 2(3): http://www.drbgrpublications.in/ijcsr.p
(Autonomous), Tamilnadu, India
ded in 1895 enjoys a heritage of 120 ye
r education for women. It functions under
Trust Association affiliated to Manonm
college is "So run that ye may obtain the in
rough Knowledge'. The college strives t
rsuit and aims at creative and empathetic
long with the holistic development of its
reputation were acknowledged by the NAA
2013.
ent
core subject at the Undergraduate level in 1
9. Ever since its inception, the Department
, in service education, interdisciplinary ac
t is notified for its consistently good aca
ity top ranks. Ours was the only women's
rse affiliated to M.K.U. The department has
able guidance of efficient heads and dedica
al Conference
opments, applications and innovations ind faculty members of other discipline.
hp; ISSN: 2454-5422
ars as a Christian
he management of
aniam Sundaranar
orruptible crown".
owards excellence
involvement in the
inmates. The high
C and reaccredited
68 and elevated to
has been a pioneer
tivities and carrier
emic record with
college in 1979 to
rown to its present
ted members of the
aterial science to

8/17/2019 ijcsr-volume2-issue3 special issue
http://slidepdf.com/reader/full/ijcsr-volume2-issue3-special-issue 5/164
2016; IJC
International Conferen
Editor in Chief
B.Govindarajan
Associate Editors
Mrs. A. Effie Cordelia, As
Mrs. S.G. Pushpalatha Gra
Dr. J. Juliet Latha Jeyakum
Editors
Mrs. R. Jeyam Jebaraj, As
Mrs. P. Elizabeth Jeyarani
Mrs. D. Jegathi Jasmine,
Dr. F. Jeyamangalam, Ass
Mrs. T. Varthini, Assc. Pr
Dr. S. Lincy Mary PonmaDr. D. Jencylin Navarani,
Mrs. S. Kumutha, Asst. P
Mrs. M.P. Rameela, Asst.
Mrs. K. Sofiya Diana, Ass
Mrs. R. Juliet Jeyanthi, A
Mrs. P. Jeyaseeli, Asst. Pr
Miss. V. Bala Shunmugaj
SR. 2(3): http://www.drbgrpublications.in/ijcsr.p
e on “A new hori zon in mater ials” E
c. Prof.,
elin, Asst. Prof.,
ari, Asst. Prof.,
sc. Prof.,
, Assc. Prof.,
ssc. Prof.,
c. Prof.,
of.,
ni, Asst. Prof., Asst. Prof.,
of.,
Prof.,
t. Prof.,
st. Prof.,
of.,
thi, Asst. Prof.,
hp; ISSN: 2454-5422
itorial Board

8/17/2019 ijcsr-volume2-issue3 special issue
http://slidepdf.com/reader/full/ijcsr-volume2-issue3-special-issue 6/164
2016; IJC
Patron
Dr. Usha Godwin
Convener
Mrs. R. Suganthi Christina
Organizing Secretary
Mrs. S.G. Pushpalatha Gracel
Members
Mrs. R. Jeyam Jebaraj
Mrs. P. Elizabeth Jeyarani
Mrs. D. Jegathi Jasmine
Mrs. A. Effie Cordelia
Dr. F. Jeyamangalam
Mrs. T. VarthiniDr. J. Juliet Latha Jeyakumari
Dr. S. Lincy Mary Ponmani
Dr. D. Jencylin Navarani
Mrs. S. Kumutha
Mrs. M.P. Rameela
Mrs. K. Sofiya Diana
Mrs. R. Juliet JeyanthiMrs P. Jeyaseeli
Miss V. Bala Shunmugajothi
SR. 2(3): http://www.drbgrpublications.in/ijcsr.p
ORGANIZING COMMITTEE
in
hp; ISSN: 2454-5422

8/17/2019 ijcsr-volume2-issue3 special issue
http://slidepdf.com/reader/full/ijcsr-volume2-issue3-special-issue 7/164
2016; IJC
To
The Organisers,
Department of Physics,
Sarah Tucker College,
Tirunelveli.
I feel immensely please
Materials” (INHIM16 ) by our
Many of the greatest in
all made in the same way. The
sinks! Another noteworthy tree i
Einstein provided us with hicounterintuitive for many peopl
surprise people to realize how
an atom is considered to be almo
So a study on the facts o
I too appreciate to the
Teaching & Non-teaching staff
innovations in material science t
SR. 2(3): http://www.drbgrpublications.in/ijcsr.p
Greetings
in conducting the International Conference on
Department of Physics.
entions are due to the power of Physics. Trees,
lack Ironwood tree is so dense that it does not f
s the red wood: the bark of a red wood tree is re
classical theory of relativity. One area ofe is that as objects move faster they actually g
uch of the universe is made up of empty space.
st entirely empty space.
f Physics is really surprising
fforts taken by the Patron, the Convener, the
of our college to expose the recent developm
o students research scholars and faculty member
hp; ISSN: 2454-5422
“A New Horizon in
for example, are not
loat on water; it just
sistant to fire. Albert
the theory that is t larger. It may also
. The composition of
rganizing Secretary,
ents, applications &
of other discipline

8/17/2019 ijcsr-volume2-issue3 special issue
http://slidepdf.com/reader/full/ijcsr-volume2-issue3-special-issue 8/164
2016; IJC
Materials h
the revolution is only just be
transportation, human health,
sources or developing stronger,
of materials used by scientists i
20th century expanded greatly
brought materials science much
wanted from engineered product
modify existing ones is still only
The possibility of influencing
opportunities that we are only
chemistry is breaking down ba
world that we live in. Worldwid
competition and advantage. Und
generous support of manageme
material science.
I congratulate the organizing coPhysics, Sarah Tucker College
industrialists and materials scie
material science. I convey m
conference.
Tirunelveli – 7
07.03.2016
SR. 2(3): http://www.drbgrpublications.in/ijcsr.p
Foreword
ve undergone a revolution in the past century,
inning. Innovative materials play essential ro
and industrial productivity.Whether explorin
lighter materials and sophisticated devices. In e
n products and systems was very limited. The
he number of materials and our knowledge of
more close to manufacturing as we sought to des
s. Now, in the 21st century, the ability to design
in its infancy, and the potential is limitless and e
material composition and properties at the
just starting to explore; the convergence of
rriers. Innovation in materials is transforming
, materials are seen as a priority for innovation b
erstanding the new horizon in materials in future
t, decided to conduct the conference to promot
mmittee of the conference and the entire teamfor steering the young minds. The presentation
tist expose the recent developments, applicatio
y best wishes and compliments for the succe
hp; ISSN: 2454-5422
but in many respects
les in clean energy,
alternative energy
rlier days, the range
developments of the
their properties, and
ign the properties we
new materials and to
xciting.
tomic scale creates
iology, physics and
engineering and the
ut also as a source of
, the college with the
new innovations in
of the department of from academicians,
s and innovations in
ssful conduct of the

8/17/2019 ijcsr-volume2-issue3 special issue
http://slidepdf.com/reader/full/ijcsr-volume2-issue3-special-issue 9/164
2016; IJC
Office:
Associate Professor and Head Dept. of Physics,Sarah Tucker College,Tirunelveli - 627007,Tamil Nadu, India.
Materials Science is aof matter, Engineering appScience is very important fnuclear fusion, biomaterialsreplacement materials.
Research on materialproperties and formation ofprocesses for manufacturingmaterials: light weight compand silicon microchips for the
This International Cobrings together Scientists, Reexposure to the recent develo
following areas: Nanomaterials Biomaterials Theoretical Ph Advanced Mat Computational Applications o
The call for papers eScholars. We have receivedpresentation that reveals theINHIM’16 will be a rewardi
participants. On behalf of theSpeakers, Delegates and wisacademically refreshing inter
The blessing of the Alon “A New Horizon in Materi
SR. 2(3): http://www.drbgrpublications.in/ijcsr.p
Mrs. Suganthi Christina, M.Sc.,
Reside
, B 143Tirunel
Phone:Cell: 9
PREFACE
n interdisciplinary subject spanning the Phylications and Industrial manufacturing pror the development in nanotechnology, qand metallurgy as well as medical technol
s is essential to study the relationship betmaterials. It also includes development of
them. Modern society is heavily depensites for faster vehicles, optical fibres for t
information revolution which is the need of
nference on “A New Horizon in Mater
earch Scholars, Graduate and Post Graduatements, applications and innovations in Mate
ysics erial Characterization
Material Science f Materials
voked a good response from Faculty, Studpapers for the oral presentation and 27 p
enthusiasm generated by the Conference. Ing experience academically as well as scie
organizing committee I extend a warm weh them a pleasing experience, an intellectuction during the Conference.
mighty God is the prime factor for this Internals”.
(Mrs.
hp; ISSN: 2454-5422
.Phil
nce:
.G.O “B” Colony, veli - 627007. 0462-2553320
42447151
sics and Chemistry ocesses. Materials
antum computing, gies such as bone
een the structure, new materials and dent on advanced elecommunications
the hour.
als - INHIM’16”
students to provide rials Science in the
ents and Research pers for the poster
am confident that ntifically to all the
lcome to the Guest ally rewarding and
ational Conference
Suganthi Christina)
Convenor

8/17/2019 ijcsr-volume2-issue3 special issue
http://slidepdf.com/reader/full/ijcsr-volume2-issue3-special-issue 10/164
2016; IJC
S.No
IJCSR41
Low Loss Dielectric Materials fo
Bindu Gunupudi, Christopher M
IJCSR42
Synthesis and characterization of
T.Athi Sakthi Grawya and S.Pus
IJCSR43
Synthesis and Characterization o
M.Sankareswari, R.Vidhya, A.Az
IJCSR44
Synthesis and characterization of
R.Vidhya, M.Sankareswari, A. Az
IJCSR45
Synthesis and characterization ofGROWN by solution method
D.Jencylin NavaRani, P.SelvarajIJCSR46
Investigation on the nucleation ki
N.Balasundari, P.Selvarajan, S.
IJCSR47
Investigation on structural, spectalanine oxalate single crystals
S.Lincy Mary Ponmani, P.Selvar
IJCSR48
Synthesis and characterization ofhydrate
S.G.Pushpalatha Gracelin, C.Kri
IJCSR49
Studies on the Mechanical and TCrystals
A. Effie Cordelia and S. Perumal
IJCSR50
Electrical conductivity measuremedium
M.P.Rameela, Vinu Bharathi and
IJCSR51
Systematical calculation of Alphexcited states of daughter
G. M. Carmel Vigila Bai and R.
IJCSR52
Synthesized and Characterization
R.Anitha, E.Kumar and D. Muth
IJCSR53 Studies on molecular interactionsdifferent temperatures
K. Umamakeshvari and U. Sank
IJCSR54
Z - Scan measurement and imped
R. Jothi mani, P. Selvarajan and
IJCSR55
Studies on optical and mechanica
I.Stella Jeya Christy, A. Effie Co
IJCSR56
Thermal and Dielectric Propertie
A.Roselin, A. Sumathi, A. Effie C
SR. 2(3): http://www.drbgrpublications.in/ijcsr.p
IndexArticles
r Metal and Superconducting Microwave Resonator Circuits
irhead and Mark Colclough
zinc oxide nano particle by sol-gel route
pam
f SiO2 Doped TiO2 Thin Films: Influence of Coating Cycles
hagu Parvathy and K.Neyvasagam
Cu-TiO2 thin films by Sol-Gel process
haghu parvathiand K.Neyvasagam
L-ALANINE DOPED GLYCINE Lithium chloride CRYSTALS
an, S.Lincy Mary Ponmani and N.Balasundari netics of urea doped Bis glycine picrate
incy Ponmani and D.JencylineNavarani
oscopic and mechanical properties of organic non-linear optical D
ajan, D.Jencylin and N.Balasundari
semi organic nonlinear optical material: Ammonium Tartrate Tetra
ishnan and P.Selvarajan
hermal Properties of Sulphamic Acid Doped Glycine NLO Single
ents of pure and nickel sulphate doped KDP crystals grown by gel
T. Asaithambi
decay half-lives of heavy nuclei from ground state to ground and
ithya Agnes
of cerium dioxide (ceria) nanoparticles by using a microwave ove
raj
of Bromoform and Ethyl bromide with Benzene at four
r
ance analysis of L-alanine alaninium nitrate single crystals (LAAN
C.Parvathiraja
l properties of DL-malic acid doped ADP single crystals
rdelia S. Perumal
s of DL-Malic Acid Doped ADP NLO Single Crystals
ordelia and S. Perumal
hp; ISSN: 2454-5422
Page No
353
359
366
379
391
403
-
411
420
428
439
447
455
460
)
472
478
487

8/17/2019 ijcsr-volume2-issue3 special issue
http://slidepdf.com/reader/full/ijcsr-volume2-issue3-special-issue 11/164
2016; IJC
,
IJCSR57
Solvothermal Synthesis and CharNanostructures
A.Suganthi, S.John Kennady Vet
IJCSR58
Optical and Structural Characteri
S. Karpagavalli , S .John Kenna A. Suganthi
SR. 2(3): http://www.drbgrpublications.in/ijcsr.p
acterization of Manganese Doped Copper Oxide Flower Like
anathan,S.Perumal,D.Priscilla Koilpillai andS.Karpagavalli
zation of Cobalt Doped Manganese Oxide Nanoparticles
dy, Vethanathan, S.Perumal, D. PriscillaKoilpillai and
hp; ISSN: 2454-5422
497
503

8/17/2019 ijcsr-volume2-issue3 special issue
http://slidepdf.com/reader/full/ijcsr-volume2-issue3-special-issue 12/164
Volume: 2; Issue: 3 [Special Issue]; March-2016; pp 353-358. ISSN: 2454-5422
Low Loss Dielectric Materials for Metal and Superconducting MicrowaveResonator Circuits
Bindu Gunupudi1*, Christopher Muirhead and Mark Colclough
School of Physics & Astronomy, University of Birmingham, Edgbaston, Birmingham, United Kingdom B15 2TT
*Corresponding Author Email Id: [email protected]
Abstract
The materials used for fabrication of microwave resonator circuits are vital in
determining key resonator parameters. These microwave resonator circuits have a wide
range of applications such as in the telecommunications industry, in the manufacture of
non-invasive blood glucose monitoring devices, kinetic inductance detector devices and
to build circuits for studies for quantum mechanical properties. Here we describe the use of
a low loss dielectric substrate and a superconducting material to fabricate coupled,superconducting, microwave resonator circuits. We have used oxidized silicon substrates
that have a low loss tangent and a dielectric constant of ~ 11.2. The resonator
structures were fabricated on thin film niobium which has a superconducting critical
temperature of ~ 9.2 K. The resonators were found to have high quality factors ~ 105 at 1
K, which was sufficient for our experiments. The behaviour of these circuits was
investigated thoroughly, both theoretically as well as experimentally. An in-situ tuning
mechanism was designed, constructed and implemented successfully to tune the
resonators at low temperatures. A thorough analysis was done to determine the
optimum material that could be used for our tuning probe. It was ascertained that macor,
an insulating material, that did not cause any interference in the electromagnetic
environment could be used for this purpose. Tuning of resonators was performed
without degrading the resonators’ quality factors, which is a significant experimental
achievement. These coupled resonator devices, when cooled to low temperatures ~ 20 mK
could further be used to study quantum mechanical properties of macroscopic objects.

8/17/2019 ijcsr-volume2-issue3 special issue
http://slidepdf.com/reader/full/ijcsr-volume2-issue3-special-issue 13/164
2016; IJC
Keywords: Coupled Mi
Microwave Resonators
Introduction
The aim of the work descri
coupled, superconducting, m
temperatures. There has bee
as substrates for resonator ci
no losses within the dielec
dielectric cause the saturatio
measured signal as well as aresonant frequency [2].
The second part of the work
can be used in-situ to tune t
There are extensive repo
superconducting microwave
method was designed and
achieved. The details of this
Materials and Methods
The most commonly used s
their low loss tangent at fre
have used oxidized Silicon
film (~ 200 nm) niobium wh
on the substrates. The cou
photolithography on 10 x 5
to a copper PCB and then e
were made by placing the
temperature of ~ 1.3 K. A
Network Analyser was
measurements on the sample
SR. 2(3): http://www.drbgrpublications.in/ijcsr.p
rowave Resonators, Low loss substr
ed in this paper is to investigate the behav
icrowave resonators and to be able to tune t
considerable research on dielectric materia
rcuits [1]. The most important aspect being t
ric substrate. At temperatures T < 1 K, ir
n of two-level systems (TLS) and contribute
ffect the permittivity ϵ of the substrate, ther
describes the design and working of a tuni
he microwave resonant frequencies at cryog
ts in the literature about the various
resonator [3]. In this experimental proj
implemented and tuning of resonators
mechanism are explained in the subsequent s
ubstrate materials are silicon and sapphire.
uencies ~ 6 GHz and at temperatures ~ 1
substrates. In order to fabricate the resona
ich is superconducting below Tc ~ 9.2 K wa
led resonator structures were fabricated u
mm2 diced wafers. The sampled were glue
nclosed in a copper cavity. Low tempera
sample enclosure in a liquid helium cry
ector
used to make microwave transmissio
s.
hp; ISSN: 2454-5422
tes, Tuning of
ior of a system of
hem in-situ at low
ls that can be used
at there should be
regularities in the
to the noise in the
by the microwave
g mechanism that
enic temperatures.
ways to tune a
ct, a mechanical
was successfully
ections.
This is because of
K. In our case, we
or structures, thin
s sputter deposited
sing conventional
d and wirebonded
ure measurements
ostat with a base
and reflection

8/17/2019 ijcsr-volume2-issue3 special issue
http://slidepdf.com/reader/full/ijcsr-volume2-issue3-special-issue 14/164
2016; IJC
In order to design a tunin
resonators, a series of tests
as insulating materials, suc
transmission was measure
microwave modes and henc
thermal contraction at low t
be a suitable material for o
tuning probe. A tuning disc,
bottom end of the macor rod
inductance was reduced and
Results and Discussion
In our coupled resonators s
weak coupling between the
and measured transmission r
K.
(a)
Fig. 1 (a) Shows a sample t
from a system of coupled re
104. This figure is taken fro
SR. 2(3): http://www.drbgrpublications.in/ijcsr.p
g probe that could be used to tune the s
ere performed at room temperature. Both
h as brass, nylon and macor were tested.
d it was seen that conducting materi
e could not be used. On taking into account
emperatures, it was decided that macor, a
ur
made of niobium on oxidized silicon substra
. As it was lowered over one of the resonat
hence there was an increase in its resonant fr
stem, we first studied the effect on the fre
resonators. Fig.1b shows a comparison bet
esponse from a system of coupled microwav
(b)
at is glued and wirebonded to a copper PCB
sonators at T = 1.3 K. The resonator qualit
reference [4].
hp; ISSN: 2454-5422
ystem of coupled
onducting as well
The background
als affected the
properties such as
n insulator would
te was glued to the
rs on the chip, the
quency.
quencies due to a
een the predicted
e resonators at ~ 1
. (b) Transmission
factors are ~ 6 x

8/17/2019 ijcsr-volume2-issue3 special issue
http://slidepdf.com/reader/full/ijcsr-volume2-issue3-special-issue 15/164
2016; IJC
Fig. 2 (a) Shows the eff
enclosure. (b) Shows the
enclosure. This figure is tak
The effect of coupling on th
thoroughly investigated. A
Experiments were conducte
tuning probes on the microw
conducting and insulating p
probe caused a shift in the b
of interest. An insulating p
whilst being lowered into the
In our experiments, an insu
following reasons: firstly be
i.e., ~ 1 K; secondly, it hasthirdly, a small dielectric
capacitance of the microwav
SR. 2(3): http://www.drbgrpublications.in/ijcsr.p
ct of lowering a brass (conducting) rod
ffect of lowering a nylon (insulating) ro
n from reference [4].
resonant frequencies of a few coupled reso
mechanism that enabled tuning of resonato
d to study the effect of inserting conducti
ave background transmission. As shown in
obe were lowered into the sample enclosur
ackground resulting in unwanted modes in t
obe was preferred since it had no effect
sample enclosure.
lating material called macor was used. It
cause it is rigid when cooled to temperatur
a relatively small coefficient of differenti constant and hence, it would not signif
e resonators.
hp; ISSN: 2454-5422
into the sample
into the sample
nator samples was
rs was developed.
ng and insulating
Figs. 2a and 2b, a
e. The conducting
e frequency range
n the background
as chosen for the
es of our interest,
l contraction, and icantly affect the

8/17/2019 ijcsr-volume2-issue3 special issue
http://slidepdf.com/reader/full/ijcsr-volume2-issue3-special-issue 16/164
2016; IJC
Fig. 3 A schematic of our t
chip. This figure is taken fro
Lastly, the effect of tuning t
the tuning probe through the
(a)
Fig. 4 (a) A photograph of
simulated and measured c
lowered over one of the reso
SR. 2(3): http://www.drbgrpublications.in/ijcsr.p
uning probe being lowered onto one of the
reference [4].
he resonators in-situ was studied. This was
lid of the sample enclosure as shown in Fig.
(b)
an assembled tuning mechanism set-up. (b)
ange in the resonant frequency when th
ators. This figure is taken from reference [4]
hp; ISSN: 2454-5422
resonators on the
done by lowering
4a below.
A comparison of
tuning probe is
.

8/17/2019 ijcsr-volume2-issue3 special issue
http://slidepdf.com/reader/full/ijcsr-volume2-issue3-special-issue 17/164
2016; IJC
Fig. 4b shows the effect of t
tuning probe was lowered.
in AIM Spice and measured
Thus we were successful in
systems as well as in tuning
Acknowledgements
I would like to thank the
Gary Walsh for technical ass
References[1] Hammer, G., et al. "S
applications."Superconducto
[2] Barends, R. et al. “C
superconducting resonators”
[3] Healey, J. E., et al.
Applied Physics Letters 93.4
[4] Gunupudi, Bindu. Cou
electro- mechanical interacti
SR. 2(3): http://www.drbgrpublications.in/ijcsr.p
he resonant frequency of one of the resonat
There is an excellent agreement between
data.
the studies of coupled superconducting mi
ne of their resonant frequencies at low temp
niversity of Birmingham for the College
istance and Mr.Krishnarao Gunupudi for his
uperconducting coplanar waveguide reson
r Science and Technology 20.11 (2007): S40
ontribution of dielectrics to frequency an
Applied Physics Letters, 92, 223502 (2008)
Magnetic field tuning of coplanar wave
(2008): 043513
pled superconducting microwave resonato
n. Diss. University of Birmingham, 2015
hp; ISSN: 2454-5422
rs over which the
the predicted data
crowave resonator
eratures.
Elite Scholarship,
suggestions.
ators for detector
8
noise of NbTiN
uide resonators."
rs for studies of

8/17/2019 ijcsr-volume2-issue3 special issue
http://slidepdf.com/reader/full/ijcsr-volume2-issue3-special-issue 18/164
Volume: 2; Issue: 3 [Special Issue]; March-2016; pp 359-365. ISSN: 2454-5422
Synthesis and characterization of zinc oxide nano particle by sol-gel route
T.Athi Sakthi Grawya and S.Pushpam*
Assistant Professor*, Department of Physics, N.M.S.S.Vellaichamy Nadar College, Nagamalai, Madurai, India.
*Corresponding Author Email Id: [email protected]
Abstract
This detailed study is report about the synthesis and characterization of Zinc oxide nano
particle (ZnO). ZnO is an important member of semiconducting material of II, VI group. Due
to its unique properties, ZnO is the richest family of nano structure among all semiconducting
materials. This paper shows that ZnO nano particle is prepared by sol-gel method. Here, ZnO
nano particle is readily synthesized using zinc acetate dihydrate as a precursor and ethyl
alcohol as solvent. The ZnO nano particle which is obtained from this method by drying
process at 80°C in a hot air oven. And the sample were characterized by X-Ray diffraction
(XRD), Fourier transform infrared spectroscopy (FTIR), UV-Visible spectroscopy. The
particle size measurement which is done by XRD scherrer’s formula. The average particle
size of the prepared ZnO nano powder is 44.37nm. UV-Visible spectroscopy revealed the
formation of ZnO nano particles. The absorption spectrum shows a sharp absorbance onset at
275nm which indicates an almost uniform size of the nano particles. After this, FTIR
spectrum of the ZnO nano particles synthesized by sol-gel method which was acquired in the
range of 400-4000 correlated to metal oxide bond (ZnO). The FTIR spectra peak at
414.7 indicates the characteristic absorption bands of ZnO nano particles. Also the UV-
Visible absorption spectrum and XRD shows a typical spectrum for ZnO nano particles.
Keywords: ZnO nano particles, Sol-gel, XRD, UV, FTIR.
Introduction
Today, when the world is surrounding on the roof of technology and electronics, mostly
dominated by compatible electronic equipments and thereby creating the need for materials
8/17/2019 ijcsr-volume2-issue3 special issue
http://slidepdf.com/reader/full/ijcsr-volume2-issue3-special-issue 19/164
2016; IJC
possessing versatile propertie
of material a very common
independence of India the
elements Germanium (Ge) a
property like low melting poi
surface from electrical leaka
better fabrication technology
As time passes on, the rapid
was very well fulfilled by
optoelectronic devices. GaAs
carrier mobility and highersuited for optoelectronics dev
the future world, something
world therefore now demand
band gap, higher electron mo
investigation about such a ma
is a wide gap semiconductor
only has this ZnO possessedand sensor applications.
Also ZnO has been commonl
range of applications. This
enthusiasm to develop prope
ZnO has been used in medica
ZnO is catching fire right fro[1] and optical properties
electroluminescence decay
manufacturing of simpler Zn
[3]. Also with a progress in
cathodluminescence (CL), ca
[4-7].
SR. 2(3): http://www.drbgrpublications.in/ijcsr.p
s. After digging the pages of history for the
ategory of material comes out that is “se
amily of semiconductors is dominated b
nd Silicon (Si). Germanium get famous du
t and lack of natural occurring germanium
ge where as silicon dominates the commer
nd application to integrated circuits for diffe
rowing world demands speed along with tec
aAs which ease the path for the design
which is a direct band gap semiconductor
ffective carrier velocity in comparison toices. But this do not leads to the completion
ore is required that is high temperature elect
s a material that should possess inherent pr
bility as well as higher breakdown field stre
terial the name of compound comes out is “
material very well satisfying the above requi
any versatile properties for UV electronics
y used in its polycrystalline form over hund
ignites many research minds all over the
r growth and processing techniques for the
l treatment for quite number of years in Chi
the beginning of 1950, with a number of r[2] like N-type conductivity, absorp
arameter. The decade of 1970 for Zn
O devices like ceramic varistors, piezoelec
the study of variety of characterization t
acitance – voltage studies (CV), electrical co
hp; ISSN: 2454-5422
search of such type
iconductor”. Since
our very known
e to possession of
xide to prevent the
cial market for its
rent purposes.
hnology. This need
of high speed and
possessing higher
Si makes it better of requirement for
ronics devices. The
operties like larger
gth. So on making
Zinc Oxide” which
red properties. Not
, spintronic devices
red years in a wide
world and creates
synthesis of ZnO.
a. The research on
views on electrical tion spectra and
passes away in
ric transducers etc
echniques such as
nduction and so on

8/17/2019 ijcsr-volume2-issue3 special issue
http://slidepdf.com/reader/full/ijcsr-volume2-issue3-special-issue 20/164
2016; IJC
In the field of ZnO research
different growth parameters a
to production of high quality
the main focus. ZnO has now
it presents very interesting p
range synthesis.
Materials and Methods
ZnO nano particles were sy
techniques [8], wet chemical
Thermal decomposition meth
Here, the ZnO nano particles
sample was analyzed by mea
recorded on ultraviolet – vi
synthesized material was ch
mid-infra red range (400 – 400
All the chemical reagents in
guaranteed – grade, and were
In this experiment, the sol - g
NPs). In a typical procedure
distilled water with continuou
was heated to 50°C and 300
3ml of H2O2 was added drop
almost clear solution. Thiscentrifuged and washed sever
After washing the ZnO nano
of ZnO will occur during the
SR. 2(3): http://www.drbgrpublications.in/ijcsr.p
the last decade was mainly concerned w
nd processing techniques. Thus currently re
, reproducible P-type conducting ZnO for d
become one of most studied material in the
roperties for optoelectronics and sensing ap
nthesized by several different methods, s
l method [9], green chemistry [10], micro
od [12, 13], and chemical vapour decompo
were prepared by sol-gel method. The crys
ns of X-ray diffractometer (XRD).The absor
ible (UV-Vis) spectrometer. The composi
racterized by Fourier transform infrared s
).
this experiment were obtained from com
used as received without further treatment.
l method was used for preparation of ZnO n
6.3g of zinc acetate dihydrate was added t
s stirring to dissolve zinc acetate completely
l of absolute alcohol was added slowly with
ise to the vessel and mixed it using a magn
solution was incubated for 24 hours andal times with double distilled water to remo
articles is dried at 80°C in a hot air oven. C
rying process.
hp; ISSN: 2454-5422
ith optimization of
earch work related
vice application is
last seven years as
plications, in nano
uch as the sol-gel
ave method [11],
ition method [14].
tal structure of the
bance spectra were
tion quality of the
pectroscopy in the
mercial sources as
ano particles (ZnO-
200 ml of double
. Then the solution
stirring. After this,
tic stirrer to get an
the solution was ve the by products.
mplete conversion

8/17/2019 ijcsr-volume2-issue3 special issue
http://slidepdf.com/reader/full/ijcsr-volume2-issue3-special-issue 21/164
2016; IJC
Results and Discussion
X-Ray Diffraction Analysis
The crystallinity was determi
an XPERT-PRO Diffractome
about 0.3 g of dried ZnO part
glass sample container, and
The phase purity and composi
XRD. Figure (1.1) shows a ty
A number of Bragg reflectio
corresponding to (100), (002
ZnO nano particles by using
powder can be calculated by
D = 0.9λ/
Where λ is the wavelength o
(FWHM) and θ is the angle o
is found to be 44.37nm.
Figure (1
UV- Optical Absorption Sp
Electromagnetic radiation suc
characterized by a wavelen
approximately 400 to 800
SR. 2(3): http://www.drbgrpublications.in/ijcsr.p
ed by XRD powder diffraction. Analysis is
ter system equipped with a Cukα (K=1.54
icles were deposited as a randomly oriented
the XRD patterns were recorded between
tion of the particles obtained by a sol - gel p
pical XRD pattern of ZnO nano particles, pr
ns with 2θ values of 36.12°, 31.63° and 3
), (101) planes[15,16] which shows a typic
JCPDS 36-1451. The crystallite size (D) of
sing Scherrer’s formula.
Cos θ
f X rays used (1.54060 Å), β is the fullwidt
f diffraction. The crystallite size of prepared
.1):- X-Ray Powder Diffraction patterns of Z
ctroscopy
h as visible light is commonly treated as a w
gth or frequency. Visible wavelengths co
m [17,18]. The UV – optical spectra of Z
hp; ISSN: 2454-5422
erformed by using
A°) source, Here,
powder into a plexi
0° to 80° angles.
ocess examined by
pared in this work.
.30° are observed
al XRD pattern of
the prepared nano
h at half maximum
ZnO nano powder
nO nano particles
ve phenomenon,
ver a range from
nO is recorded in

8/17/2019 ijcsr-volume2-issue3 special issue
http://slidepdf.com/reader/full/ijcsr-volume2-issue3-special-issue 22/164
2016; IJC
SCHIMADZU UV-VISIBLE
shows the UV-Vis optical abs
dried in air at 80°C. The ab
which indicates an almost uni
Fi
FTIR
FT-IR is an effective method
Transform Infrared, the pref
were characterized by FTIRthrough a sample. Some of th
passed through (transmitted).
transmission, gives informat
spectroscopy useful for sever
• FTIR can identify unknown
• FTIR can determine the qual
• FTIR can determine the amo
Figure (1.3) shows the FTI
method, [23] which was aqui
500 correlated to me
1500 corresponds to the
bending vibrations. The pea
bending vibrations respective
SR. 2(3): http://www.drbgrpublications.in/ijcsr.p
SPECTRO PHOTOMETER from 200-80
orption spectrum of ZnO nano particles as sh
orption spectrum shows a sharp absorbanc
form size of the nano particles [19-22].
gure (1.2):- UV-Visible absorption of ZnO n
to reveal the composition of products. FTI
rred method of infrared spectroscopy. The
spectroscopy. In infrared spectroscopy, IRe infrared radiation is absorbed by the samp
The resulting spectrum represents the molec
ion of type of bonding in the sample. T
l types of analysis.
materials
ity or consistency of a sample
unt of components in a mixture.
spectrum of the ZnO nano particles synt
red in the range of 400-4000 . The ban
tal oxide bond (ZnO). The peaks in th
C=O bonds. The adsorbed band at 1544
k at 1340 and 1512 corresponds
ly. The peaks in the range of 1600 to 4000
hp; ISSN: 2454-5422
nm. Figure (1.2)
own in figure (1.2)
onset at 275 nm,
ano particle
stands for Fourier
prepared samples
radiation is passed le and some of it is
ular absorption and
is makes infrared
hesized by sol-gel
between the 450-
e range of 1400-
is assigned O-H
to C=O and O-H
indicates the

8/17/2019 ijcsr-volume2-issue3 special issue
http://slidepdf.com/reader/full/ijcsr-volume2-issue3-special-issue 23/164
2016; IJC
functional group present in it
nano particles, the peak at 41
Conclusion
ZnO nanoparticles have been
average particle size of ZnO
exhibit the UV absorption p
shows stretching vibrations a
cost for producing ZnO nano
Acknowledgement
I am grateful to Dr.P.Gna
N.M.S.S.Vellaichamy Nadar
thank Dr.S.Pushpam, Assist
constant guidance and encour
References
[1] A.R. Hutson, Phys.Rev.,1
[2] G.Heiland, E.Mollwo, F.S
[3] Shyam Sundar Pareek and
[4] M.Matsuoka, J.App.Phys.,
[5] P.R.Emtage, J.App.Phys.,
[6] M.Inada, J.Phys.,17 (1978
SR. 2(3): http://www.drbgrpublications.in/ijcsr.p
. Also the figure (1.3) shows the typical spe
.7 is the characteristic absorption of Z
Figure (1.3):- FTIR Spectrum of ZnO nano
prepared using sol-gel method. XRD resu
nano particle is 44.37 nm. The synthesized
ak at 275nm. In FT-IR spectroscopy pure
t 400-4000 The present work proves it
articles.
adurai, Head of the Department, Depar
ollege for his encouragement of this work.
ant Professor, N.M.S.S.Vellaichamy Nada
agement.
8 (1957) 222-230
tockmann, Solid State Phys.,8 (1959) 193-19
Kapil Pareek, IOSR J.App.phy (IOSR-JAP),
10 (1971) 736
8 (1977) 4372-4384
) 1-10
hp; ISSN: 2454-5422
ctrum of pure ZnO
O bond.
articles
lt which shows the
ZnO nanoparticles
ZnO nanoparticles
is simple and low
tment of Physics,
I would also like to
r College for her
6
3(2):(2013)16-24

8/17/2019 ijcsr-volume2-issue3 special issue
http://slidepdf.com/reader/full/ijcsr-volume2-issue3-special-issue 24/164
2016; IJC
[7] F.S.Hickerne, J.App.Phys.
[8] Ameer A, Faheem A, Nis
(2010): 399-402
[9] Yadav A, Virendra P, Kat
641-5
[10] Jayaseelan C, Abdul Ra
Bagavana A, et al, A , 90 (201
[11] Deepali S, Sapna S, Ka
(2011), 9661-72
[12] Yang Y, Li X. and Bao
[13] Tonto P. Phatanasri S. an
[14] Wu B.J. and liu S. C, Ad
[15] Liu B and Zeng H.C, J.
[16] Shen G.Z, Cho J.H, Xo
5496
[17] Ashtaputre S.S, Dephpa
Urban J, Huram S.K, Gosavi
[18] P.K. Giri, S. Bhattachary
Nanotechnology, 11, (2011),
[19] Guo L, Cheng X. Y, Ya
(2001) 123-127
[20] Marcos R.M., Daniel S.
[21] Shingo T, Atsushi N, Ta
[22] Tanujjal B, Karthik K. L
725[23] Gupta T.K, Ceramic J.
SR. 2(3): http://www.drbgrpublications.in/ijcsr.p
, 44 (1973)1061-1071
hat A, Chaman M, Naqvi A H, J. Alloys an
he A A, Sheela R, Deepti Y, Sundaramoorth
human A, Vishnu Kirthi A, Marimuthua S,
2) 78-84
itha B S, Jaspreet R, Mohinder K, App Su
, Chemical physics letters 373. (2003), 22-2
d P. Praserthdam, Ceramics International 34:
vanced materials 14; (2002), 215 -218
m.Chem. Soc, 125, (2003), 4430-4431
J.K, Xi G.C. and Lee C. J, Phys chem. B,
de A., Marathe S, Wankhede M.E, Chiman
.W. and Kullkarni S.K, Phys, 65,(2005), 61
ya, B.Chetia, Satchi kumari, Dilip K. Singh,
1-6
n Y. J. and Ge W. K, Materials science and
. and Antonio M. N, Material letters, 125. (
eharu T. and Hiroyuki Wada, Materials. 4, (
, Soumik S and Joydeep D, J. Nanotechnol
ater. Res., 7, (1992), 3280-3295
hp; ISSN: 2454-5422
d Compounds ,496,
y, et al, 29, (2006),
Santhoshkumar T,
face Science , 257,
: (2008), 57-62
109, (2005), 5491-
pure J, Parischa R,
-620
J. Nanoscience and
engineering, C16.
014) 75-77
2011), 1132-1143
gy. 4, (2013), 714-

8/17/2019 ijcsr-volume2-issue3 special issue
http://slidepdf.com/reader/full/ijcsr-volume2-issue3-special-issue 25/164
Volume: 2; Issue: 3 [Special Issue]; March-2016; pp 366-378. ISSN: 2454-5422
Synthesis and Characterization of SiO2 Doped TiO2 Thin Films: Influence of
Coating Cycles
M.Sankareswari1, R.Vidhya1, A.Azhagu Parvathy2 and K.Neyvasagam3*
1 PG Department of Physics, V.V.Vanniaperumal College for Women, Virudhunagar, India.
2 UG Department of Physics, V.V.Vanniaperumal College for Women, Virudhunagar, India.*3 PG and Research Department of Physics, The Madura College, Madurai, India.
*Corresponding Author Email Id: [email protected]
Abstract
Silica doped Titanium di oxide (SiO2-TiO2) thin films (different coating cycles 4, 6
& 8) were prepared by spin coating deposition on glass substrate. The prepared films
were pre annealed at 100oC for 10 minutes and post annealed at 400oC for 3 hours.
Structural and optical properties of the synthesized films were analyzed as a function
of coating cycle. X-Ray Diffractometer (XRD), Scanning Electron Microscope
(SEM), Energy Dispersive X-Ray Analysis (EDAX), UV – Vis spectrometer and
Photoluminescence spectrometer (PL) were used to explore the structural,
morphological, stoichiometric ratio and optical properties of the SiO2 doped TiO2
thin films. All the films exhibited the anatase phase, tetragonal structure with
preferential orientation along the (101) plane. X-Ray line profile analysis was
carried out to determine the micro structural properties such as crystallite size, microstrain, dislocation density, number of crystallites and stress of the SiO 2 doped TiO2
thin films. The crystallite size was found to increase as the coating cycle increases.
Morphological studies revealed that the fractured structure on the surface of the
films. The stoichiometric ratio of the film was confirmed by EDAX analysis.
Surface roughness of the film was characterized by Atomic Force Microscope
(AFM). Optical parameters such as band gap, extinction coefficient and refractive
index were estimated by optical absorption measurements. Optical band gap valueswere found to decrease with the increase in coating cycle. Photoluminescence

8/17/2019 ijcsr-volume2-issue3 special issue
http://slidepdf.com/reader/full/ijcsr-volume2-issue3-special-issue 26/164
2016; IJC
studies displayed that st
560 nm. The results o
coating cycle has strong
thin films.
Key Words: Thin film,
Vis.
Introduction
TiO2 is the most attracti
its properties from fund
has three modification
brookite (orthorhombic
applications such as op
several factors which d
particle size, crystallini
structure, the TiO2 film
to understand the phase
[5]. The addition of La
improve the thermal sta
increase the adhesion a
a key issue in device st
the annealing temperatu
thin film synthesis su
chemical vapour deposi
sol-gel technique is onederiving unique metast
homogeneity [9].
In the present work,
substrates for various c
carried out to determi
structural parameters s
SR. 2(3): http://www.drbgrpublications.in/ijcsr.p
rong emission peaks were observed at 485
f structural and optical characteristic study
effect on structural and optical properties of
TiO2, SiO2, spin coating, XRD, SEM, ED
e materials in nano science and nano techn
amental and practical point of view [1]. C
hases which are rutile (tetragonal), anatase
). Titania nano particles received much
tical devices, sensors and solar cell applica
etermine the performance of TiO2 for appli
ty and the morphology [2 - 4]. Dependin
can be tailored for different applications. S
structure of TiO2 when it is deposited on dif
O3, CeO2, CuO, Fe2O3, SiO2 or other oxide
bility [6]. Additionally the presence of som
d mechanical stability of thin film on subst
ability [6, 7]. The phase transformation of
re and dopant [8]. Many methods have bee
h as sol-gel technique [9], hydrothermal
ion [11], physical vapour deposition [12] etc
of the most widely used methods due to iable structure at low reaction temperature
iO2 doped TiO2 thin films were deposit
oating cycles (4, 6 and 8). X-ray diffracti
e the structural properties of the deposite
uch as crystallite size, micro strain, disl
hp; ISSN: 2454-5422
m, 542 nm and
suggested that
nano crystalline
X, AFM, UV-
logy because of
ystalline titania
(tetragonal) and
interest for its
tions. There are
cations such as
g on the phase
o it is necessary
ferent substrates
s into TiO2 can
e dopants could
ates which play
iO2 depends on
established for
methods [10],
., Among them,
ts possibility of s and chemical
ed on to glass
n analysis was
d films. Micro
cation density,

8/17/2019 ijcsr-volume2-issue3 special issue
http://slidepdf.com/reader/full/ijcsr-volume2-issue3-special-issue 27/164
2016; IJC
number of crystallites a
ray line profile analys
optical properties wer
dispersive analysis by
effect of coating cycles
of the SiO2 doped TiO2
Experimental details
SiO2 doped TiO2 thin fil
chemicals were analyti
purification. The precu(TTIP) and Tetra Ethyl
were selected as solvent
Nano structure SiO2 do
4ml TTIP was mixed w
to stabilize the solution
and the solution was s
substrates (25mmx75m
rpm/30s. The films wer
repeated to obtain 4 co
more samples of 6 and
400°C for three hours.
The deposited films we
All the measurements wof the films were obtain
0.15405 nm) in steps
examination of the fil
microscope. The optica
calculated using (Schim
– 5301) Photoluminesc
measured by using (Sur
SR. 2(3): http://www.drbgrpublications.in/ijcsr.p
d stress were estimated from x-ray diffracti
is technique. Surface morphology, film c
analyzed using scanning electron micr
-rays and optical absorption techniques re
on the structural, morphological and optica
thin films were studied and the results are dis
ms were prepared using sol – gel spin coatin
cal reagent grade and used directly with
sors of TiO2 and SiO2 were Titanium TetrOrtho Silicate (TEOS) respectively. Ethanol
and stabilizer of TTIP.
ed TiO2 thin films were prepared by the fol
ith 30ml ethanol. Then 1ml acetic acid was
. 0.1 ml TEOS was added into the matrix
tirred for one hour. The films were deposi
x2mm) by the spin coating method with
preannealed at 100°C for five minutes. Th
ting cycles. The same method was followed
8 coating cycles. Finally all the films were
e characterized extensively using the follow
ere performed at room temperature. X-ray did using X’ pert pro diffractometer with Cu
of 0.1 over the 2 range of 20° - 80°.
s was done using Hitachi (s-3000H) sc
l data and PL spectra of the SiO2 doped
adzu 1800) UV – Vis – NIR spectrometer and
nce spectrometer. The thickness of the pre
est SJ – 301) stylus profilometer.
hp; ISSN: 2454-5422
n data using X-
omposition and
oscopy, energy
pectively. The
l characteristics
cussed.
g technique. All
ut any further
Iso Propoxide and acetic acid
lowing method.
dropped slowly
f TiO2 solution
ted on to glass
speed of 3000
procedure was
to prepare two
ost annealed at
ing instruments.
ffraction pattern α radiation (K =
Morphological
anning electron
TiO2 films was
(Schimadzu RF
ared films was

8/17/2019 ijcsr-volume2-issue3 special issue
http://slidepdf.com/reader/full/ijcsr-volume2-issue3-special-issue 28/164
2016; IJC
Results and discussion
Structural studies
To study the crystallin
number of coating cycle
XRD pattern recorded f
shown in Figure1.
Fig .1: XRD Pattern ofcoating cycles c) 4 co
The XRD result shows
orientation along (1 0 1)
(0 4 0), (2 0 0) peaks.
the height of peaks. It is
SiO2 doped TiO2 thin fil
were found to be in agre
The average crystal size
maximum (FWHM) dat
Where is the FWHM
(CuKα=0.15405 nm). A
increase which reveals t
SR. 2(3): http://www.drbgrpublications.in/ijcsr.p
quality of the SiO2 doped TiO2 thin fil
s, the films were subjected to X-ray diffracti
or SiO2 doped TiO2 thin films for different
iO2 doped TiO2 thin films for a) 8 coating cating cycles
that all the films have anatase phase wit
plane. All the prepared SiO2 doped TiO2 fil
hen the coating cycle increases, there is a s
observed that there is no change in the phase
ms. Table 1 shows the observed and calculat
ement with standard JCPDS data (File no. 8
of the deposited film was determined from
using the following Scherrer formula
0 .9( ) D n m
C o s
λ
β θ
in radians is the Bragg’s angle, λ is the x
s the coating cycle increases, the intensity o
hat the crystallinity increases due to the pre
hp; ISSN: 2454-5422
s for different
on analysis. The
oating cycles is
cles b) 6
h a preferential
ms have (1 0 1),
light increase in
structure of the
ed values which
-4203).
Full Width Half
(1)
ray wavelength
f the peaks also
ferential growth
8/17/2019 ijcsr-volume2-issue3 special issue
http://slidepdf.com/reader/full/ijcsr-volume2-issue3-special-issue 29/164
2016; IJC
of the SiO2 doped TiO2.
found to increase from
cycles.
In addition to the chang
of coating cycles. Cryst
It needs to be addresse
doped TiO2 thin film is
where ‘D’ is the crysta
results are summarized
cycle increases.
The micro strain
=ε
From Table 1, it is obse
to 0.036 for 8 coatings.
that lattice imperfection
The number of crystallidetermined using the rel
3N =
t
D
where t is the thickness
Fig 2(a) and (b) show
variation of thickness a
Malliga et al., [13] obse
Table 1: Structural
CoatingCycles
2θ (degree)
Observed Standard
4 25.254 25.304
6 25.245 25.304
8 25.256 25.304
SR. 2(3): http://www.drbgrpublications.in/ijcsr.p
The crystallite size of the SiO2 doped TiO
20.22 nm for 4 coating cycles to 53.93 n
es in crystallite size, crystal defects may oc
l dislocation is the main defect related to the
d and hence the dislocation density availa
alculated from the given formula,
2
1 D
δ (2)
llite size of the SiO2 doped TiO2 thin fil
in table 1. The dislocation density decrease
of the SiO2 doped thin film was measured us
C o s θ
4 (3)
ved that the strain value decreases from 0.09
he decrease in strain with increase in coatin
is due to increase in crystallite size.
tes per unit area (N) of the SiO2 doped Tiation
(4)
of the film .The calculated values are summa
the variation of crystallite size & dislocat
d micro strain respectively with number of
rved similar results in their investigation on
parameters of SiO2 doped TiO2 thin films for various coating c
(hkl)orientation
Phase andcrystalstructure
Thickness(µm)
CrystallitesizeD (nm)
DislocatioDensityδX1014
lines /m2
101 Anatase,tetragonal
1.8 20.22 24.45
101 Anatase,tetragonal
1.9 40.43 6.12
101 Anatase,tetragonal
2 53.93 3.43
hp; ISSN: 2454-5422
thin films was
for 8 coating
ur by the effect
crystallite size.
ble in the SiO2
. The observed
s as the coating
ing the relation
8 for 4 coatings
g cycles implies
2 thin film was
rized in Table 1.
ion density and
coating cycles.
iO2.
cles.
n
MicrostrainµX10-3
No. of crystallitesper unitareaNX1016
0.09 21.8
0.05 2.87
0.03 1.27

8/17/2019 ijcsr-volume2-issue3 special issue
http://slidepdf.com/reader/full/ijcsr-volume2-issue3-special-issue 30/164
2016; IJC
Fig 2 (a) variation of
Morphological and Co
Figure 3 shows the SEthin films. The films
During the drying and a
as a result of contractio
the layer and substrate
TiO2 thin films produc
suggest a high photo cat
thin film improves with
Fig.3 SEM micrograp
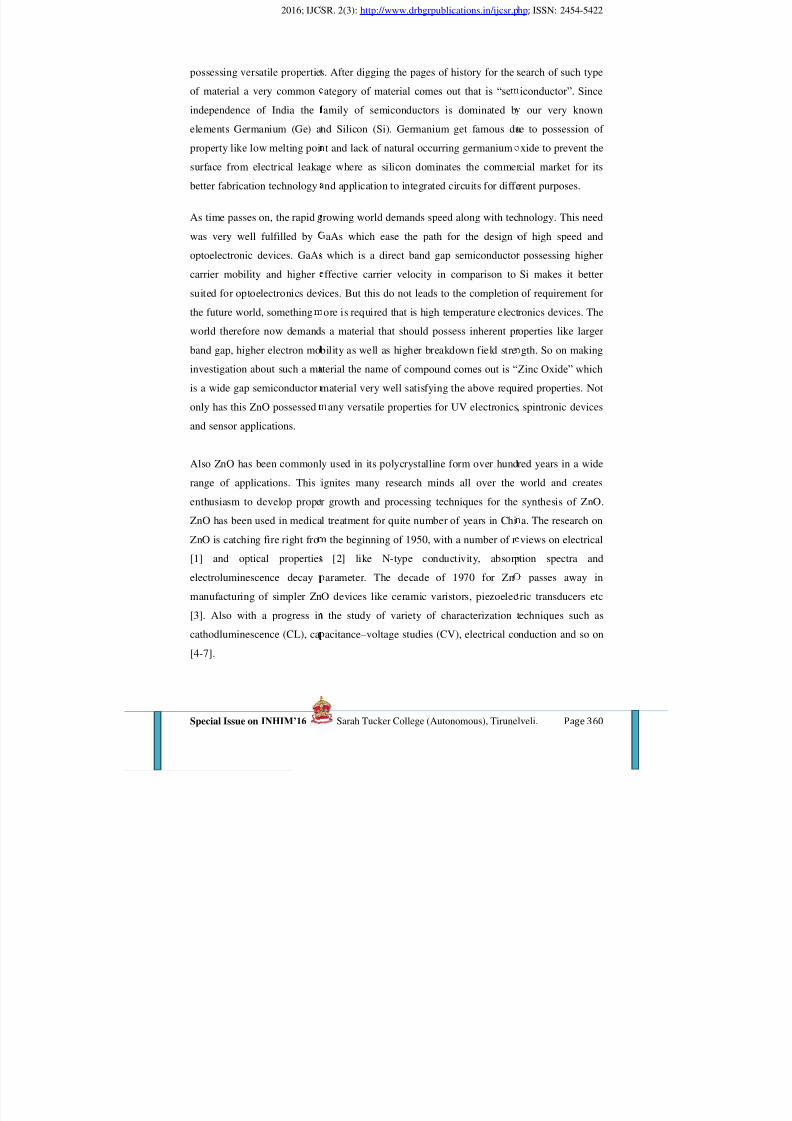
Figure 4(a) & (b) sho
coating cycles and 8 co
and O. The presence of
and would change it to
higher a value [14].
SR. 2(3): http://www.drbgrpublications.in/ijcsr.p
rystallite size & dislocation density and 2 (b
micro strain with coating cycles
positional analysis
micrographs of 4 and 8 coating cycles ofroduced by this technique indicate fractur
nnealing processes of the films, crack forma
n, stress and different thermal coefficients
[5]. The fractured surface morphology of
d by this technique which resulted in a la
alytic activity. The results also suggest that u
increasing coating cycles.
hs of SiO2 doped TiO2 thin films (a) 4 coatin
coating cycles
s the EDAX pattern of SiO2 doped TiO2
ting cycles. EDAX results indicated the mai
SiO2 in the thin film could destroy the lin
Ti – O – Si. This aspect can shift binding
hp; ISSN: 2454-5422
) thickness &
iO2 doped TiO2
d morphology.
tion takes place
of expansion of
the SiO2 doped
ge surface area
niformity of the
g cycles (b) 8
thin films of 4
peaks of Ti, Si
age of Ti-O-Ti
energy of Si to
8/17/2019 ijcsr-volume2-issue3 special issue
http://slidepdf.com/reader/full/ijcsr-volume2-issue3-special-issue 31/164
2016; IJC
Fig.4 EDAX spectra of
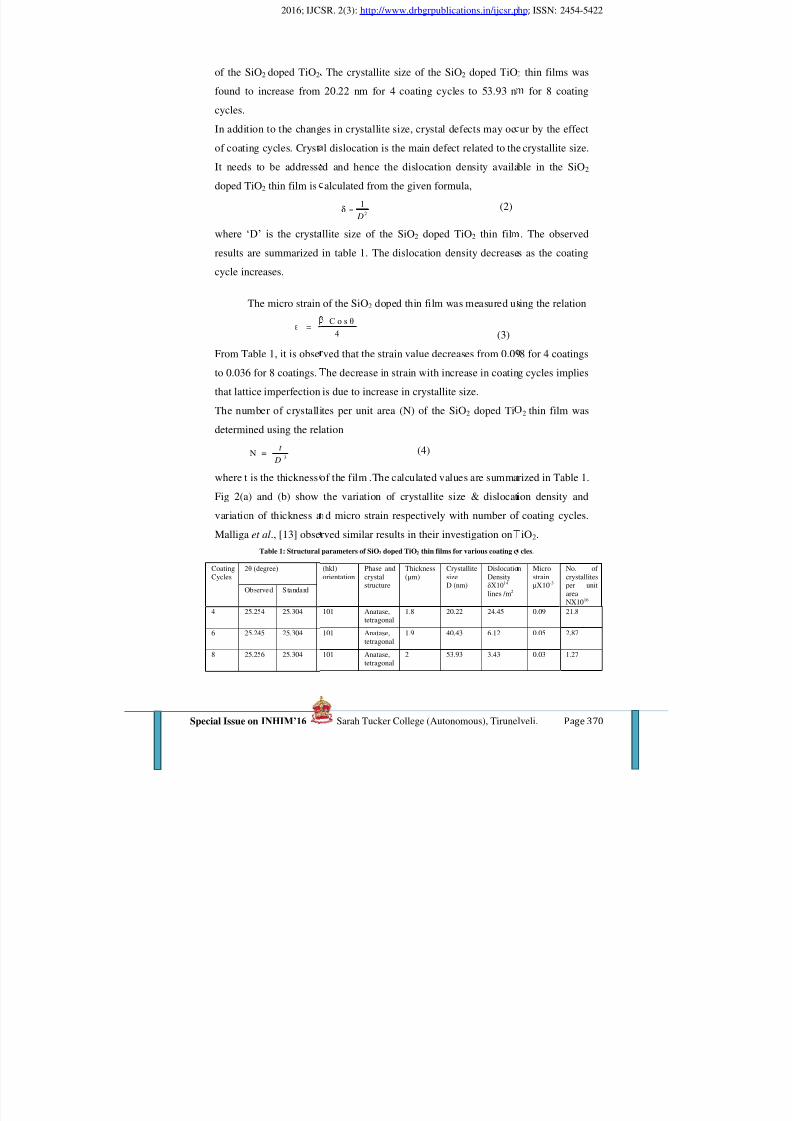
Atomic Force Micros
of the thin film. AFM i
cycles is shown in Figu
doped TiO2 thin film are
Fig.5 AFM ima
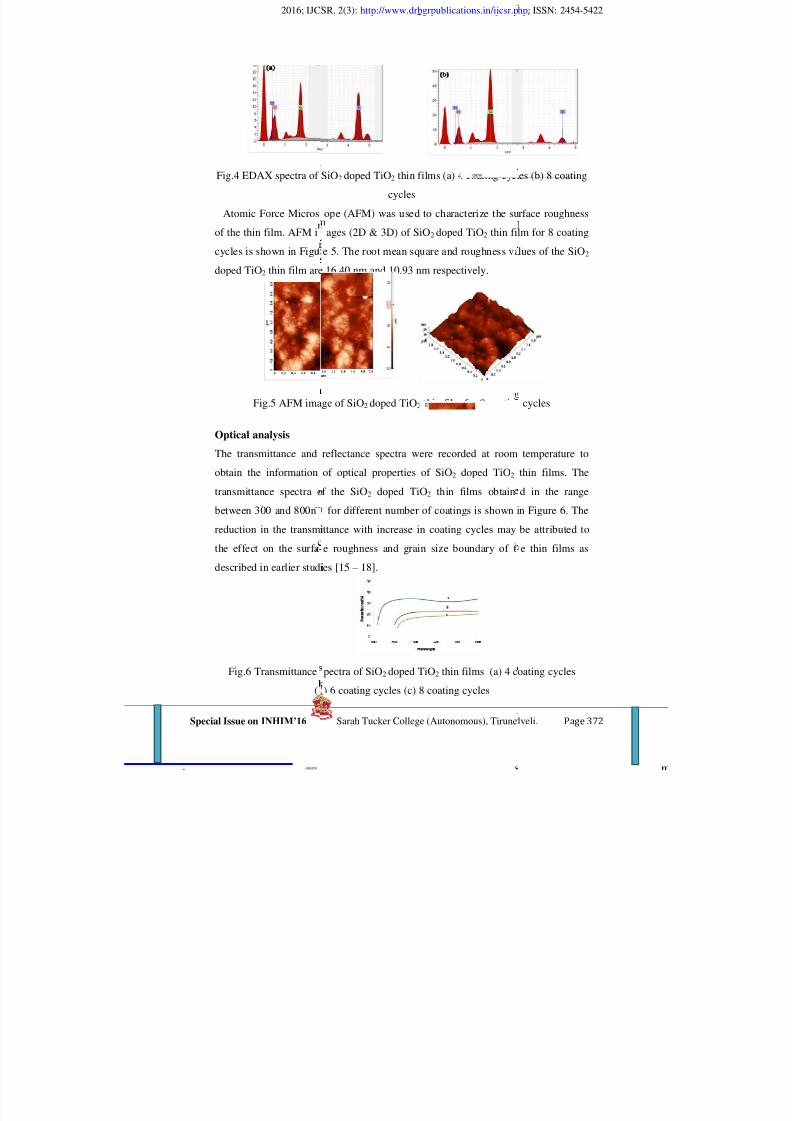
Optical analysis
The transmittance and
obtain the information
transmittance spectra o
between 300 and 800n
reduction in the transmi
the effect on the surfa
described in earlier studi
Fig.6 Transmittance
(
SR. 2(3): http://www.drbgrpublications.in/ijcsr.p
SiO2 doped TiO2 thin films (a) 4 coating cycl
cycles
ope (AFM) was used to characterize the su
ages (2D & 3D) of SiO2 doped TiO2 thin fi
e 5. The root mean square and roughness va
16.40 nm and 10.93 nm respectively.
ge of SiO2 doped TiO2 thin film for 8 coatin
reflectance spectra were recorded at room
of optical properties of SiO2 doped TiO2
f the SiO2 doped TiO2 thin films obtain
for different number of coatings is shown i
ittance with increase in coating cycles may
e roughness and grain size boundary of t
ies [15 – 18].
pectra of SiO2 doped TiO2 thin films (a) 4 c
) 6 coating cycles (c) 8 coating cycles
hp; ISSN: 2454-5422
es (b) 8 coating
rface roughness
lm for 8 coating
lues of the SiO2
cycles
temperature to
thin films. The
d in the range
n Figure 6. The
be attributed to
e thin films as
oating cycles

8/17/2019 ijcsr-volume2-issue3 special issue
http://slidepdf.com/reader/full/ijcsr-volume2-issue3-special-issue 32/164
2016; IJC
The reflectance spectra
coating cycles is shown
as wavelength increases
films with 4 coating cyc
Fig.7 Reflectanc
(
The nature of transition i
(h k hα ν ν
Where is the absorptenergy gap in eV and
transition present in the
the material is direct all
material is indirect allo
with photon energy (h
coating cycles are show
Fig. 8 a) Direct an
(a) 4 coatin
SR. 2(3): http://www.drbgrpublications.in/ijcsr.p
of the SiO2 doped TiO2 thin films for diff
in Figure 7. It shows that the reflectance th
. The highest reflectance value of about 70
les.
e spectra of SiO2 doped TiO2 thin films (a) 4
) 6 coating cycles (c) 8 coating cycles
s determined using the following equation
) m
g E (5)
ion coefficient in cm-1, hγ is the photon eA is a constant. The value of ‘m’ determi
material. If m = 1/2 indicates that the transi
owed and m = 2 indicates that the transition
ed. A plot of (αhγ)2 with photon energy (
) for SiO2 doped TiO2 thin films obtained
in Figure 8 (a) and 8 (b).
b) Indirect band gap of SiO2 doped TiO2 thi
g cycles (b) 6 coating cycles (c) 8 coating cy
hp; ISSN: 2454-5422
rent number of
e film increases
is obtained for
coatings
nergy, Eg is an nes the type of
tion involved in
involved in the
γ) and (αhγ)1/2
for 4, 6 and 8
n films for
les

8/17/2019 ijcsr-volume2-issue3 special issue
http://slidepdf.com/reader/full/ijcsr-volume2-issue3-special-issue 33/164
2016; IJC
Extrapolation of linear
value of the material. T
in the present work are
and 8 coating cycles r
attributed to quantum si
The values of refractive
the following equations
1 ^ 0 .5n =
1 ^ 0 .5 R
R
K =4α λ
π
where n is the refractiv
is the reflectance (%).
coating cycles is show
observed at 6 for 8 coat
films for 6 coating cycl
The refractive index va
is observed in extinctio
Figure 10.
Fig.9 Refractive Inde
(a) 8 coatin
SR. 2(3): http://www.drbgrpublications.in/ijcsr.p
portion of the graph to X-axis (energy) giv
he direct and indirect band gap values of th
found to be 3.4, 3, & 2.8 eV and 3.2, 2.8 &
spectively.The reason for decrease in ban
e effect.
index n and extinction coefficient (K) are d
(7) and (8)
(6)
(7)
index of the material, K is the extinction c
The variation of refractive index with ene
in Figure 9. The maximum value of ref
ing cycles. Also refractive index values of t
s and 4 coating cycles are estimated at 4 an
iation may be due to the film thickness. Th
coefficient of the SiO2
doped TiO2
thin fil
x versus photon energy for SiO2 doped TiO2
g cycles (b) 6 coating cycles (c) 4 coating cy
hp; ISSN: 2454-5422
s the band gap
films obtained
2.6 eV for 4, 6
gap energy is
etermined using
efficient and R
rgy for various
ractive index is
e prepared thin
2 respectively.
same variation
ms as shown in
thin films for
les

8/17/2019 ijcsr-volume2-issue3 special issue
http://slidepdf.com/reader/full/ijcsr-volume2-issue3-special-issue 34/164
2016; IJC
Fig.10 Extinction coef
for (a) 8 coati
To further validate the
emission spectroscopy
spectra observed at exc
doped TiO2 films exhib
visible range. The peak
[19]. The structural de
referred to as native poi
energy levels of the ban
doped TiO2 thin films a
intensities for different
TiO2 thin films increase
due to the improvement
increase in the coatin
contribute its usage as a
Fig. 11 PL spectra o
SR. 2(3): http://www.drbgrpublications.in/ijcsr.p
icient versus photon energy for SiO2 doped
ng cycles (b) 6 coating cycles (c) 4 coating c
crystalline quality of the thin films, ph
was used and the results are illustrated in
itation wavelength of 410 nm demonstrate t
it three peaks (485nm, 542nm and 560nm)
s in the visible region are associated with s
ects of a seed solution exhibited in the vi
nt defects and include oxygen vacancies whi
d gap [20 – 21]. It was observed that the P
re almost in the same wavelength position b
number of coating cycles. The PL intensity
with increase in number of coating cycles.
in quality and increase in oxygen vacancie
cycles could improve the structural qu
transducer in biosensing applications [22].
SiO2 doped TiO2 thin films for (a) 8 coating
coating cycles (c) 4 coating cycles
hp; ISSN: 2454-5422
iO2 thin films
ycles
toluminescence
Figure 11. PL
hat all the SiO2
which lie in the
ructural defects
sible region are
ch present deep
peaks of SiO2
ut have varying
of SiO2 doped
This increase is
. It reveals that
lity which can
cycles (b) 6

8/17/2019 ijcsr-volume2-issue3 special issue
http://slidepdf.com/reader/full/ijcsr-volume2-issue3-special-issue 35/164
2016; IJC
Conclusion
SiO2 doped TiO2 thin fi
spin coating technique
analysis revealed that th
with preferential orienta
to be 20.22 nm, 40.43 n
coating cycles respecti
density, strain and stres
have fractured structur
elements are obtained.
film has a direct band g3.2, 2.8 & 2.6 eV for
increases with increas
suggested that thickness
topography was found
coating cycles. These r
films were considerabl
SiO2 doped TiO2 films a
Reference
1. Castillo,N., Olguin,D.,
properties of TiO2 thin f
50(4), 382, 2004
2. Mahsid,S., Askari,M.,
Nano particles preparati
589, 2009
3. Wang C.C and Ying J.
and rutile Titania and na
4. Liu,T., Wang,W., Ma,T
of titania prepared by u
3005, 2003
SR. 2(3): http://www.drbgrpublications.in/ijcsr.p
lms were deposited successfully onto glass
or 4, 6 and 8 coating cycles respectively.
e prepared films have anatase phase with tetr
tion along (1 0 1) plane. Also the crystallite
m and 53.93 nm for 4 coating cycles, 6 coati
ely. The micro structural parameters suc
were estimated. Surface morphology show
. EDAX analysis revealed that films wit
ptical absorption measurements indicated th
ap value of 3.4, 3 & 2.8 eV and indirect ba, 6 and 8 coating cycles respectively. PL s
in number of coating cycles. The resu
of the film increases as the coating cycle in
by using AFM. The uniformity of the film
esults showed that the properties of SiO2 d
influenced by the coating cycles and the
re desirable material for photo catalytic appli
CondeA., Gallaro Jimenez,S. Structural an
ilm prepared by spray pyrolysis. Rensta Mex
Ghamsari,M.S., Afshar,N., Lahuti,S. Mix
on using sol-gel method. J. Alloys and com
. Sol-gel synthesis and hydro thermal proce
no crystal. Chem. Mater. 11,3113-3120,199
., Tao,J., Zhang,J and Hu,T. Synthesis and
sing a photo assisted sol-gel method. Lang
hp; ISSN: 2454-5422
substrates using
-ray diffraction
agonal structure
size was found
ng cycles and 8
as dislocation
d that the films
Ti, O and Si
at the deposited
nd gap value of pectra intensity
lt of thickness
reases. Surface
increases with
oped TiO2 thin
nano crystalline
cations.
morphological
icana De Fisica.
ed – phase TiO2
ounds. 47, 586-
ssing of anatase
characterization
our. 19, 3001-

8/17/2019 ijcsr-volume2-issue3 special issue
http://slidepdf.com/reader/full/ijcsr-volume2-issue3-special-issue 36/164
2016; IJC
5. Shanmugam,S., Muthar
TiO2 thin film on cu sub
Trends & Technology. 1
6. Lek Sikong., Jiraporn
Effect of doped SiO2 an
photocatalyst prepared
30(3), 385-391,2008
7. Z.Wenguang, L.Weimin
films. J.Sci.Chin.B.45 (
8. Yuranova,T., Mosteo,
textiles surface modifie
A: Chemical. 244, 160-1
9. Bischof,B.L., and Aner
porous anatase TiO2. Ch
10. Jinghuanzhang., XinXi
photo catalytic properiti
Hazarclous Materials, 1
11. Dongjin Byun, Yong
Photocatalytie TiO2 d
Materials. 73, 199-206,
12. Balachandran,K., Venc
Composite using sol g
stability. IJEST, 2(8), 3
13. Malliga,P., Pandiarajan,
Thickness on structural
film .IOSR J. Applied P14. Rahmani,E., Ahmadpou
TiO2 nano crystalline th
709-713, 2011
15. Xu,L,Lix. Influence of
thin films prepared by s
16. Tcheliebou,F., Ryu,H.S.
optical properties of Ba
SR. 2(3): http://www.drbgrpublications.in/ijcsr.p
asu,D and Haslan A,H. Structural analysis
strate for various annealing temperatures. In
4 (2),57-60, 2014
amchan., Kalayanee Kooptarnond and Suth
d calcinations temperature on phase transfo
by sol – gel method. Songklanakarin J. Sci.
, W.Chengtao Tribological investigations of
002)
., Bandara,J., Laub,D and Kiwi,J. Self-
by photoactive SiO2 /TiO2 Coating. J. Mo
67,2005
son,M.A. Peptization process in the sol-ge
em.Mater.7,1772 - 1778, 1995
o, JunminNan. Hydro Thermal hydrolysi
es of nano-TiO2 with an adjustable crystall
6-617-622, 2010
ki Jin, Bumjoonkim Joongkee Lee,
eposition by chemical vapour deposition
2000
atesh,R, Rajeshwari Sivaraj. Synthesis of N
l method. Effect of ize, surface morpholo
95-3700, 2010
J., Prithivikumaran,N and Neyvasagam,K. I
and optical properties of Sol – Gel spin C
hysics. 6, 22-28,2014 r,A., Zebarjad,M .Enhancing the photocata
in film by doping with SiO2. Chemical En
Fe – doping on the structural and optical pr
l gel method. J. Crystal Growth.312,851-85
., Hong,C.K., Park,W.S., Baik,S. On the mi
Sr TiO3 films.Thin solid films .299, 14-17, 1
hp; ISSN: 2454-5422
of RF sputtered
. J. Engineering
am Niyomwas .
rmation of TiO2
& Technology.
sol-gel ceramic
leaning cotton
lecular catalysis
l preparation of
synthesis and
ine structure. J.
alkeum Park.
. J. Hazadous
ano TiO2 – SiO2
gy and thermal
fluence of Film
ated TiO2 thin
lytic activity of
ineering J. 174,
operties of ZnO
5, 2010
rostructure and
997

8/17/2019 ijcsr-volume2-issue3 special issue
http://slidepdf.com/reader/full/ijcsr-volume2-issue3-special-issue 37/164
2016; IJC
17. Xu,L., Zheng,G., Lai
photoluminescence pro
583,560-565, 2014
18. Singh,A., Singh,S., J
characterization, magn
xFe2O4 nanocomposite
19. Fabbri.F., Villani.M.,
green luminescence on
2014
20. Thandavan.TMK., Gani
and Raman properties
Vapour Deposition of
21. Jin.X., Gotz.M., Wille.S
self reporting marerials
elastomers. AdvMater.
22. Hariindraprasad.R., Has
zinc oxide nano structu
applications. PLOS ON
SR. 2(3): http://www.drbgrpublications.in/ijcsr.p
,M., Pei,S. Annealing impact on the
erties of ZnO thinfilms on Ag substrate. J
shi,B.D., Shukla,A., Yadav,B,C., Tando
tic properties and gas sensing applicatio
. Mater Science Semiconductor Process, 27
atellani.A., Calzolari.A., Cicero.G. Zn v
non polar surfaces in ZnO nano structures.
.SMA., SanWong.C., Nor.R. Enhanced Ph
f Al doped ZnO nano structures using Th
ethanol assisted with heated Brass. PLOS O
., Mishra.y.k., Adelung.R., Zollfranf.C. A n
:stress sensitive photoluminescence in Zn
5,1342-1347, 2013
him.U., Subash C.B Gopinath. Low tempe
red thin film based transducer: Characteriza
. 10(7), 1-20, 2015
hp; ISSN: 2454-5422
structural and
. Alloys comp.
n,P. Synthesis,
ns of ZnxCu1-
,934-949,2014
acancy induced
ci Rep 4:5158,
toluminescence
rmal Chemical
e.10,2015
vel concept for
tetrapod filled
rature annealed
tion for sensing

8/17/2019 ijcsr-volume2-issue3 special issue
http://slidepdf.com/reader/full/ijcsr-volume2-issue3-special-issue 38/164
Volume: 2; Issue: 3 [Special Issue]; March-2016; pp 379-390. ISSN: 2454-5422
Synthesis and characterization of Cu-TiO2 thin films by Sol-Gel process
R.Vidhya1, M.Sankareswari1, A. Azhaghu parvathi2 and K.Neyvasagam3*
1PG Department of Physics, V.V.Vanniaperumal College for Women, Virudhunagar, India.2UG Department of Physics, V.V.Vanniaperumal College for Women, Virudhunagar, India.
*3PG and Research Department of Physics, The Madura College, Madurai, India.
*Corresponding Author Email Id: [email protected]
Abstract
Copper doped TiO2 (Cu-TiO2) thin films have been deposited onto the microscopic glass
substrate by spin coating technique. The influence of varying coating cycles (3, 5 and 7) on
the structural, surface morphological and optical properties of the films have been studied by
X-ray diffraction method (XRD), Scanning Electron Microscopy (SEM) with Energy
Dispersive X-ray Analysis (EDAX), Atomic Force microscopy (AFM), UV-Vis absorption
spectroscopy (UV-Vis-NIR), and Photoluminescence (PL) study. The X-ray diffraction
pattern of Cu-TiO2 films confirmed the tetragonal crystal structure of anatase phase with a
strong orientation along (1 0 1) plane. The X-ray line profile analyses have been carried out
to determine the micro structural parameters such as crystallite size, micro strain and
dislocation density. The thickness of the films was about 0.96 µm to 1.8 µm using stylus
profilomer. Morphological studies have revealed that grains are agglomerated, irregular with
mosaic like structure. The elemental compositions of the films were confirmed by EDAXspectrum. The UV-Visible spectral analysis showed the transmittance and band gap (direct &
indirect) were found to decrease with increase in coating cycles. The room temperature PL
spectra of Cu-TiO2 thin films show blue and green emissions at 485 nm and 545 nm with
excitation at 410 nm. These results suggest that the varying coating cycles is an important
parameter for the improvement of structural and optical quality of Cu-TiO2 thin films derived
by sol-gel spin coating technique.

8/17/2019 ijcsr-volume2-issue3 special issue
http://slidepdf.com/reader/full/ijcsr-volume2-issue3-special-issue 39/164
2016; IJC
Keywords: Cu-TiO2 thin fi
EDAX.
Introduction
Titanium dioxide (TiO2) is o
moreover, it has been wi
catalysts/catalyst for environ
and ultra-violet absorber in s
reasonable, because TiO2 is
chemical stability, high me
different crystal structure:
(orthorhombic). The anatas
photocatalyst due to slow rec
rutile and brookite [4].
However, exploring the prop
area of research. In this regar
transition metal like Cu [5], C
copper (Cu) was found to bebecause of its notable effects
plays an important role on t
optical or electronic propertie
species on the surface of the
Cu doped TiO2 thin films, in
sputtering [14], sol-gel proces
over other synthesis techniquand crystalline phase.
In our work, we prepared the
with varying coating cycles o
been investigated.
SR. 2(3): http://www.drbgrpublications.in/ijcsr.p
lm, spin coating method, XRD, AFM, UV-
e of the most important semiconductor ma
dely used in fuel cell, solar energy
ental remediation process, white pigment i
unscreen cream [1-3]. Such wide range of
an inexpensive, environmentally friendly
hanical strength and photo activation. Ti
rutile (tetragonal), anatase (tetragon
crystalline TiO2 has been found to b
mbination rate of excited electron and hole
erties of TiO2 for improving its efficiency i
s, modifications of intrinsic properties of T
o, V [6], Fe [7] and Nb [8] have long been p
ne of the most considerable element amongon the activity of TiO2. The existence of
he activity, because Cu could influence th
s of TiO2 [10] as well as the number of oxy
iO2 [11]. A number of methods have been
cluding chemical vapor deposition [12], sp
s [15] etc. Among these, sol gel technique h
es for its excellent control over chemistry, h
Cu-TiO2 films by sol-gel spin coating meth
n structural, surface morphological and opti
hp; ISSN: 2454-5422
Visible, PL, SEM,
erials in daily life;
conversion, photo
n paints and paper
application is quite
material with high
2 possesses three
l) and brookite
the most active
ompared to that of
s still an emerging
iO2 by doping with
roposed. Specially,
the transition metal Cu species at TiO2
e particle size [9],
en or intermediate
reported to prepare
ray pyrolysis [13],
s many advantages
omogeneity, purity
od. Their influence
cal properties have

8/17/2019 ijcsr-volume2-issue3 special issue
http://slidepdf.com/reader/full/ijcsr-volume2-issue3-special-issue 40/164
2016; IJC
Materials and Methods
Raw materials
Titanium (IV) isoproxide (T
(Cu (NO3)2.3H2O) were used
was used as a solvent.
Preparation of Cu-TiO2 thi
Cu – TiO2 thin films were p
technique reported previousl
was mixed with ethanol and
added and stirred for 15 min.TiO2 host lattice, required
(NO3)2.3H2O) as a dopant pr
added to the mixture and stirr
cleaned with soap solution, a
were ultrasonically cleaned fo
The gel was dropped onto the
rpm/30 s by using a spin coa
furnace. The process of spin
three-coating film. Two mor
three, five, and seven layer co
Characterizations
The XRD pattern of Cu-
characterized by X-Ray diffra
was operated at 40 KV and
surface morphological obser
SEM and S-Flash 6130 Bruk
using Surfest SJ-301 (Stylus
400-700 nm by using the
Photoluminescence (PL) spe
SR. 2(3): http://www.drbgrpublications.in/ijcsr.p
IP, 99.95 %, Sigma-Aldrich), and copper (I
as raw materials. Ethanol (C2H5OH, 99.9
films
repared at room temperature by using so
[16]. A stoichiometric amount of titanium
agnetically stirred for 10 min, and then gla
To achieve the desired concentration of Custoichometric amount of Copper II Nitr
cursor was dissolved in ethanol. This dopan
ed vigorously for 2 hour. Prior to deposition
cetone, chromic acid and distilled water. Fi
r 30 minute.
cleaned glass substrates which were rotated
ter. The coated layer was dried at 100°C fo
ning and drying was repeated for two mor
films of five and seven coatings were als
ated films annealed at 500°C for 3 hour were
iO2 thin films obtained for various co
ction (XRD) using X’PERT-PRO X - ray di
30 mA with CuKα1 radiation of waveleng
ations and elemental analysis were done b
r EDAX respectively. The thickness of the
rofilometer). UV-Visible spectra were reco
(Schimadzu 1800) UV-VIS-NIR spect
tra were recorded using (Schimadzu RF-5
hp; ISSN: 2454-5422
I) nitrate trihydrate
, Merck Germany)
l – gel spin coating
(IV) isopropoxide
ial acetic acid was
ion as a dopant in ate trihydrate (Cu
t solution was then
the substrates were
ally the substrates
at a speed of 3000
5 min in a muffle
times to obtain a
prepared. Finally,
also synthesized.
ating cycles were
ffractometer which
th 1.5406 A°. The
y EV018 Carlzeiss
ilms was measured
ded in the range of
ophotometer. The
301) luminescence

8/17/2019 ijcsr-volume2-issue3 special issue
http://slidepdf.com/reader/full/ijcsr-volume2-issue3-special-issue 41/164
2016; IJC
spectrophotometer with xen
excitation wavelength of 410
Results and Discussion
XRD analysis
The XRD patterns of differen
by spin coating method is sho
Figure1: XRD pattern of C
The observed XRD patterns
anatase phase with high inten
0 0), (2 1 1) and (0 0 2) are
consistent with JCPDS fileintensity of the peaks increas
values measured using stylus
The crystallite size was deter
=
where D = particle size (nm)
beam in A° , β = full widt
SR. 2(3): http://www.drbgrpublications.in/ijcsr.p
on lamp as the light source at room te
nm.
t coating cycles of Cu-TiO2 thin films coated
wn in figure 1.
-TiO2 films for different coating cycles
show that the coated films have tetragonal
ity peak in (1 0 1) orientation. The other ori
also observed for all the samples with low
no. 89-4203. From the XRD pattern, it iss with increase in number of coating cycles.
profilometer are given in Table 1.
ined using the Debye- Scherrer’s formula,
( ) (1)
, k = shape factor (0.94), λ = wavelength o
h at half maximum (FWHM) of the promi
hp; ISSN: 2454-5422
perature with an
on glass substrate
BCC structure of
ntations (2 1 0), (2
intensities which is
observed that the The film thickness
the incident X-ray
ent peak, and θ =

8/17/2019 ijcsr-volume2-issue3 special issue
http://slidepdf.com/reader/full/ijcsr-volume2-issue3-special-issue 42/164
2016; IJC
diffraction (Bragg) angle. Fr
with increase in coating cycle
et.al, [17]. Using the size of t
(µ) has been determined from
δ =
µ =
where t is the film thickness
values were summarized in T
cycle increases, the crystallit
strain decreases which reveals
Figure: 2(a) Variation of
thickness and strain with di
Table 1: Micro stru
Number of coatings
CrystalliteD (nm
3 55.3
5 65.77
7 76.1
SR. 2(3): http://www.drbgrpublications.in/ijcsr.p
om the calculation it is found that the cryst
s. Similar results have been shown by earlie
e crystallites, the dislocation density (δ) an
the relations given below
(2)
(3)
. The calculated crystallite size, dislocation
able 1. From the calculation it was observed
size also increases whereas the dislocation
the improved crystalline structure.
rystallite size and dislocation density &
ferent coatings of Cu-TiO2 thin films
tural parameter of Cu-TiO2 thin films wicoating cycles
size )
Thickness t(µm)
Dislocationdensity(δ) lines/m2
0.96 3.27
1.30 2.31
1.8 1.73
hp; ISSN: 2454-5422
llite size increases
r literature saranya
strain in the films
density and strain
that as the coating
density and micro
2(b) variation of
h varying
Strain µ (x10-3)
36.01
30.03
26.15

8/17/2019 ijcsr-volume2-issue3 special issue
http://slidepdf.com/reader/full/ijcsr-volume2-issue3-special-issue 43/164
2016; IJC
Surface morphology with El
The SEM micrographs of Cu-
Figure 3.
Figure 3: SEM images for (
coating cycles of Cu-TiO2 th
From the morphological im
agglomerated, irregular grain
in nucleation over growth an
composition of the films w
shown in figure c and d whic
SR. 2(3): http://www.drbgrpublications.in/ijcsr.p
emental analysis
TiO2 thin films prepared at various coating c
) 5 (b) 7 coating cycles with EDAX spectr
in films
ge it is observed that the prepared Cu-Ti
size and island like structure. Increase in c
d the film surface observed to be closely p
s identified by EDAX measurement. The
demonstrates the presence of Ti, O and Cu i
hp; ISSN: 2454-5422
ycles are shown in
m for (c) 5 (d) 7
2 thin films were
ating cycle results
acked. The surface
EDAX results are
n the spectrum.
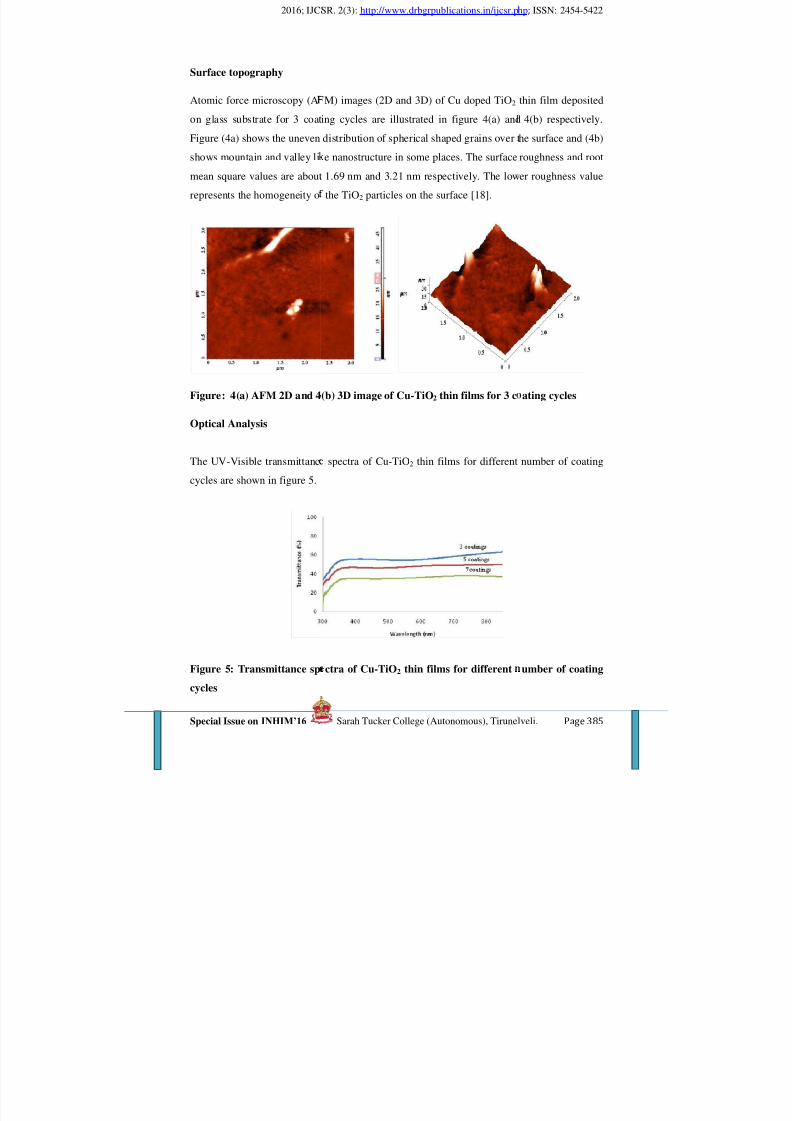
8/17/2019 ijcsr-volume2-issue3 special issue
http://slidepdf.com/reader/full/ijcsr-volume2-issue3-special-issue 44/164
2016; IJC
Surface topography
Atomic force microscopy (A
on glass substrate for 3 coat
Figure (4a) shows the unevenshows mountain and valley li
mean square values are about
represents the homogeneity o
Figure: 4(a) AFM 2D and 4
Optical Analysis
The UV-Visible transmittanc
cycles are shown in figure 5.
Figure 5: Transmittance sp
cycles
SR. 2(3): http://www.drbgrpublications.in/ijcsr.p
M) images (2D and 3D) of Cu doped TiO2
ing cycles are illustrated in figure 4(a) and
distribution of spherical shaped grains over te nanostructure in some places. The surface
1.69 nm and 3.21 nm respectively. The low
the TiO2 particles on the surface [18].
(b) 3D image of Cu-TiO2 thin films for 3 c
spectra of Cu-TiO2 thin films for different
ctra of Cu-TiO2 thin films for different
hp; ISSN: 2454-5422
thin film deposited
4(b) respectively.
he surface and (4b) roughness and root
er roughness value
ating cycles
number of coating
umber of coating

8/17/2019 ijcsr-volume2-issue3 special issue
http://slidepdf.com/reader/full/ijcsr-volume2-issue3-special-issue 45/164
2016; IJC
From UV-Visible plots, it is
increase of film thickness.
maximum for the film with th
350 nm for all the Cu-TiO2 th
in transmittance is due to a
electrons from the valence ba
The band gap energy (Eg) ca
band gap value can be obtaine
αhν =
Where A is a constant related
direct transition and n = 2 f
incident photon energy and E
(hν) is shown in Figure 6. Th
of the plot (αhν)2 versus hν t
for different number of coatin
Figure 6: (a) Direct and (
number of coating cycles
SR. 2(3): http://www.drbgrpublications.in/ijcsr.p
bserved that the optical transmittance is fou
he transmittance in the visible region w
ree coating cycles. The transmittance found t
in film and approaches to zero at around 30
bsorption of light caused by the excitation
d to the conduction band of TiO2 [19].
n be estimated from the optical absorption
d from the optical absorption spectra by usin
A(hν − E ) (4)
to the effective masses associated with the b
r indirect transition, α is the absorption co
g is the optical band gap. The plot of (αhν)2
optical band gap is obtained by extrapolatin
α = 0. The direct and indirect band gap of
g cycles are shown in figure 6(a) and 6(b) re
b) Indirect bandgap of Cu-TiO2 thin f
hp; ISSN: 2454-5422
d to decrease with
as observed to be
o decrease at about
nm. This decrease
and migration of
easurements. The
g Tauc’s relation
ands and n = ½ for
efficient, hν is the
with photon energy
g the linear portion
Cu-TiO2 thin films
pectively.
lms for different

8/17/2019 ijcsr-volume2-issue3 special issue
http://slidepdf.com/reader/full/ijcsr-volume2-issue3-special-issue 46/164
2016; IJC
The direct and indirect band
to decrease with increase in n
in film density and increase
literature malliga et.al, [20].
The extinction coefficient (
calculated from
k =
n =
Figure 7: (a) Extinction coe
films for different number o
From the figure, it is obser
coating cycle and this due to
increases with respect to co
cycles is in the range of 2.5 t
film [21].
TableCoatingcycles
Di
357
SR. 2(3): http://www.drbgrpublications.in/ijcsr.p
ap energy values of the Cu-TiO2 thin films (
umber of coating cycles which might be the
in crystal size. Similar results have been
K) and refractive index (n) of Cu-TiO2 t
(5)
+( )
− K (6)
fficient and (b) Refractive index vs Energ
f coating cycles
ed that the extinction coefficient increase
increase in absorption. The refractive inde
ting cycle. The value of refractive index
o 3.1 which is higher than bulk anatase due
2: Optical Data of Cu-TiO2 Thin Filmsrect bandgap
(eV)Indirect bandgap
(eV)Transmit
(%)
3.2 3.0 603.0 2.8 452.8 2.6 35
hp; ISSN: 2454-5422
Table. 2) are found
esult of the change
shown by earlier
hin film has been
y of Cu-TiO2 thin
s with increase in
x of the films also
f different coating
to thickness of the
tance

8/17/2019 ijcsr-volume2-issue3 special issue
http://slidepdf.com/reader/full/ijcsr-volume2-issue3-special-issue 47/164
2016; IJC
Photoluminescence Analysis
The most valuable informati
PL spectra. The PL spectra
temperature with excitation
characterized by three emissi
nm (2.6 eV) can be attributed
of phonons in TiO2 lattice. T
In general, it has been observ
response [20].
Figure 8: PL spectra of Cu-
Conclusion
Cu-TiO2 thin films have betechnique with different coati
films have tetragonal crystal s
also observed that the crystal
with increasing number of c
shows that the films are wit
confirms the presence of Ti,
optical band gap (both direct
SR. 2(3): http://www.drbgrpublications.in/ijcsr.p
n on the quality and purity of the films ma
of Cu-TiO2 thin films for different coati
avelength of 410 nm is shown in figure 8.
on bands. A blue emission with a peak cent
to indirect recombination via defect states
e peak at 545 nm (2.2 eV) corresponds to
ed that the transparency in the films advers
iO2 thin films for different number of co
n deposited onto glass substrates using sng cycles. X-ray diffraction analysis reveale
tructure with preferential orientation along (
lite size increases but dislocation density a
atings due to increase in film thickness. S
h irregular grains with flake like morpholo
O and Cu. Optical study revealed that the
and indirect) decrease but PL band emission
hp; ISSN: 2454-5422
y be obtained from
ng cycles at room
Each PL spectra is
ered at around 486
ith the interaction
iO2 anatase phase.
ly affects their PL
ting cycles
l-gel spin coating d that the prepared
1 0 1) plane. It was
nd strain decreases
urface morphology
gy. EDAX spectra
transmittance and
intensity increases
8/17/2019 ijcsr-volume2-issue3 special issue
http://slidepdf.com/reader/full/ijcsr-volume2-issue3-special-issue 48/164
2016; IJC
with increase in number of c
has strong effect on structura
application in photo catalytic
References
[1] O. Carp, C. L. Huis
dioxide”,Prog. Solid State Ch.
[2] G. R. Dey, “Chemic
catalyticreaction on TiO2 und
217-226, 2007
[3] K. Koˇc’ı, L. Obalov´a acatalysts”, Chem. Pap. 62(1),
[4] Weerachai Sangchay,
Photocatalytic and Antibacter
19-27, 2013
[5] S S Roy, A H Bhuiyan,”
Titanium Oxide Thin Films”
[6] Bhattacharyya K, Varma
doping and its oxidation state
ethene. J. Phys Chem C 2008
[7] Arana J, Dona-Rodrigue
Navio JA, Pena JP: Gas-pha
with Fe, Pd and Cu. J Mol Ca
[8] Li W, Wang Y, Lin H, Sh
Band gap tailoring of Nd3-do
[9] B. Zhu, Q. Guo, X. Huan
and catalytic per-formance o
Catal. A: Chem. 249(1-2), 21
[10] L. S. Yoong, F. K. C
photocatalyst for hydrogen pr
[11] B. Xin, P. Wang, D. Di
TiO2 photocatalytic activity”,
SR. 2(3): http://www.drbgrpublications.in/ijcsr.p
ating cycles. These results confirm that var
l & optical properties of Cu-TiO2 thin films
activities.
an and A. Reller, “Photo induced reac
. 32 (1-2), 33-177, 2004
l reduction of CO2 to different prod
er diverse conditions: An overview”, J. Nat.
d Z. Lacn´y “Photocatalytic reduction of C 1-9, 2008
ek Sikong, Kalayanee Kooptarnond an
ial Activity of Cu-Doped TiO2 Thin Films”,
ptical Characterization of Synthesized Pure
RPN J. Sci. & Technology, 5(8), 2015
S, Tripathi AK, Bharadwaj SR, Tyagi AK:
on the photocatalytic activity ofTiO2 for gas
JM, Gonzalez-Diaz O, Rendon ET, Meli
se ethanol photocatalytic degradation study
tal A: Chem, 215:153-160, 2004
ah SI, Huang CP, Doren DJ, Rykov SA, Che
ped TiO2 nanoparticles. ApplPhys Lett, 83:4
g, S. Wang, S. Zhang, S. Wu and W. Huang
f TiO2 nanotubes-supported gold and cop-
-217 2006
ong and B. K. Dutta, “Development of
oduction under visible light”, Energy. 34 (10
g, J. Liu, Z. Ren and H. Fu,“Effect of surf
Appl. Surf. Sci. 254(9), 2569-2574, 2008
hp; ISSN: 2454-5422
ying coating cycles
and high potential
tivity of titanium
cts during photo
. Gas Chem. 16(3),
2 over TiO2 based
Walailak, “The
Sci & Tech, 10(1)
and Copper Doped
: Effect of vanadia
-phase oxidation of
an JAH, Colon G,
with TiO2 doped
n JG, Barteau MA:
143-4145, 2003
, “Characterization
er particles”, Mol.
opper-doped TiO2
), 1652-1661, 2009
ace species on Cu-
8/17/2019 ijcsr-volume2-issue3 special issue
http://slidepdf.com/reader/full/ijcsr-volume2-issue3-special-issue 49/164
2016; IJC
[12] Hongfu Sun, Chengyu
Ming Liu, “Photocatalytic
atmosphere pressure”, J. non-
[13] S. S. Roy, J. Podder, “S
thin films deposited by spray
[14] M. Sreedhar, Neelaka
Saravanan , Arul Maximus R
films prepared by reactive R
2015
[15] M.J. Alam and D. C. Ca
Films Deposited on Titaniu
Technology, 14, pp. 776-780,
[16] R.Vidhya, M.Sankares
structural and optical properti
Special Issue 37, PP. 42-46, 2
[17] Saranya Amirtharajan
Prithivikumaran Nataraja,” E
silicon substrates -effect of U
[18] Suzana segota, Lidij
characterization and photoc
10.034, 2010
[19] A.K.M. Muaz, U. H
temperatures on the morph
synthesized by the sol-gel me
2015
[20] P. Malliga, J. Pandiarajthickness on structural and o
Phys, vol 6, pp 22-28, 2014
[21] V. Ramya, K. Neyvasa
Benil, “ Studies on chemical
Mater Sci: Mater Electron, 26
SR. 2(3): http://www.drbgrpublications.in/ijcsr.p
ang, Shihong Pang, Xiping Li, Ying Tao,
TiO2 f ilms prepared by chemical v
rystalline solids”, 354, pp.1440-1443, 2008
nthesis and optical characterization of pure
yrolysis”, JOAM, Vol. 12, pp.1479 -1484, 2
ta Reddy, Parthasarathi Bera, D. Rama
abel, C. Anandan, P. Kuppusami and J. Bri
magnetron sputtering”, Applied Physics A
meron, “Characterization of Transparent Co
m Dioxide Film by a Sol-gel Process”, Su
2001
ari and K.Neyvasagam,” Effect of anneali
es of Cu-TiO2 thin film”, Int. J. Technical R
016
, Pandiarajan Jeyaprakash, Jeyakumar
lectrical investigation of TiO2 thin films c
and visible light illumination”, Appl Nano
curkovic, Davor ljubas and Nenad t
talytic properties of sol-gel TiO2 films, Ce
ashim, K.L.Thong, and Wei-wen Liu, “E
ology, optical and electrical properties o
thod and deposited on Al/TiO2/SiO2/p-Si”,
n, N. Prithivikumaran and K. Neyvasagam,ptical properties of sol-gel spin coated TiO2
am, R. Chandramohan, S. Valanarasu and
bath deposited CuO thin films for solar c
, pp 8489-8496, 2015
hp; ISSN: 2454-5422
Huajuan Tang and
por deposition at
nd Cu doped SnO2
010
handran, K. Gobi
itta, “Cu/TiO2 thin
, 120, pp. 765-773,
nductive ITO Thin
rface and Coatings
ng temperature on
es. & Applications,
n Natarajan and
oated on glass and
ci, 2015
masic, Synthesis,
amic International,
ffect of annealing
f TiO2 thin films
icrosyst Technol.,
“Influence of film thin film”, J Appl
A. Milton Franklin
lls application”, J.
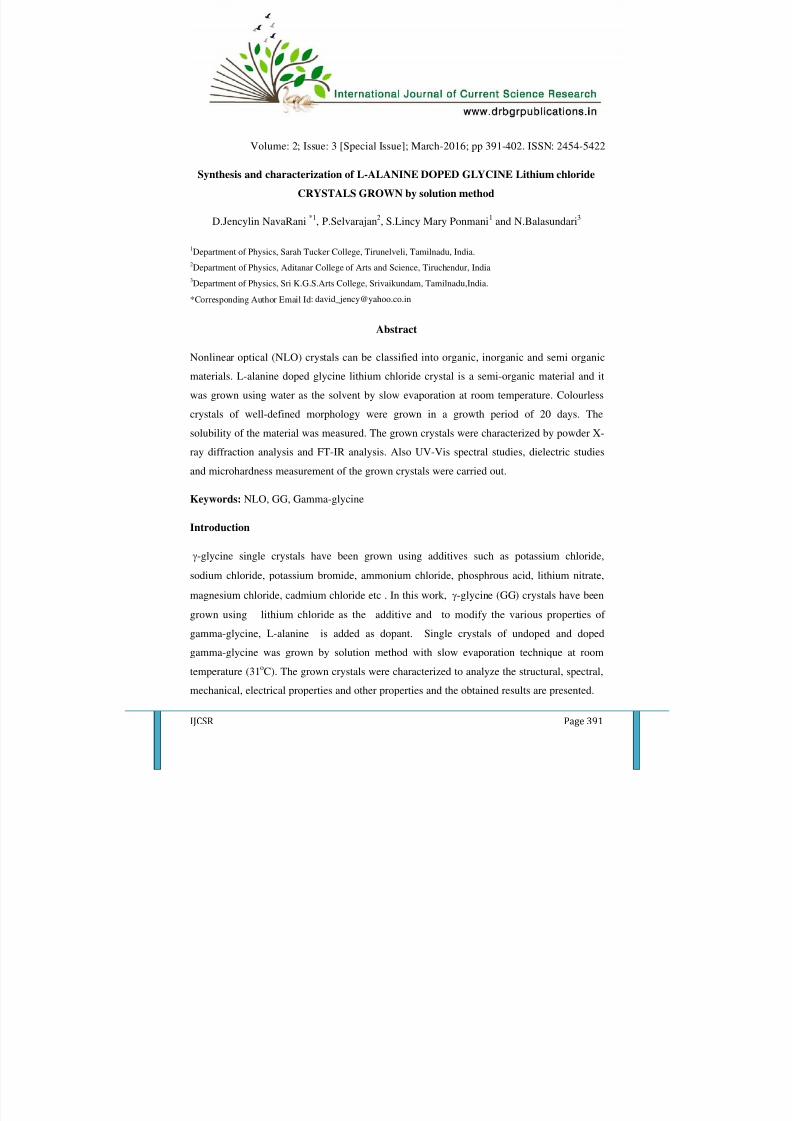
8/17/2019 ijcsr-volume2-issue3 special issue
http://slidepdf.com/reader/full/ijcsr-volume2-issue3-special-issue 50/164
Volume: 2; Issue: 3 [Special Issue]; March-2016; pp 391-402. ISSN: 2454-5422
Synthesis and characterization of L-ALANINE DOPED GLYCINE Lithium chloride
CRYSTALS GROWN by solution method
D.Jencylin NavaRani *1, P.Selvarajan2, S.Lincy Mary Ponmani1 and N.Balasundari3
1Department of Physics, Sarah Tucker College, Tirunelveli, Tamilnadu, India.2
Department of Physics, Aditanar College of Arts and Science, Tiruchendur, India3Department of Physics, Sri K.G.S.Arts College, Srivaikundam, Tamilnadu,India.
*Corresponding Author Email Id: [email protected]
Abstract
Nonlinear optical (NLO) crystals can be classified into organic, inorganic and semi organic
materials. L-alanine doped glycine lithium chloride crystal is a semi-organic material and it
was grown using water as the solvent by slow evaporation at room temperature. Colourless
crystals of well-defined morphology were grown in a growth period of 20 days. The
solubility of the material was measured. The grown crystals were characterized by powder X-
ray diffraction analysis and FT-IR analysis. Also UV-Vis spectral studies, dielectric studies
and microhardness measurement of the grown crystals were carried out.
Keywords: NLO, GG, Gamma-glycine
Introduction
-glycine single crystals have been grown using additives such as potassium chloride,
sodium chloride, potassium bromide, ammonium chloride, phosphrous acid, lithium nitrate,
magnesium chloride, cadmium chloride etc . In this work, -glycine (GG) crystals have been
grown using lithium chloride as the additive and to modify the various properties of
gamma-glycine, L-alanine is added as dopant. Single crystals of undoped and doped
gamma-glycine was grown by solution method with slow evaporation technique at room
temperature (31oC). The grown crystals were characterized to analyze the structural, spectral,
mechanical, electrical properties and other properties and the obtained results are presented.

8/17/2019 ijcsr-volume2-issue3 special issue
http://slidepdf.com/reader/full/ijcsr-volume2-issue3-special-issue 51/164
2016; IJC
Materials and Methods
Sample preparation
Single crystals of gamma-gly
lithium chloride in 1:1 mola
prepared and the calculated
distilled water and by stirrin
prepared and this solution w
solution was allowed for slo
single crystals of gamma-gly
purity. To grow L-alanine d
of L-alanine were added in
obtained by slow evaporation
observed that all the grown cr
(i)
Figure 1: The grown
crystal, ii) 2 m
Measurement of solubility
The solubility is the amount
temperature and it is measur
and L-alanine doped gamma
results that the solubility valu
glycine crystals and as the c
solubility is found to decrease
SR. 2(3): http://www.drbgrpublications.in/ijcsr.p
cine ( -glycine) was grown by taking AR
r ratio. Initially, the aqueous solution of lit
amount of glycine was added into it. By a
g using a hot plate magnetic stirrer, satu
as filtered using high a quality filter paper
evaporation to obtain the crystals. It took a
cine (GG). The sample was re-crystallized a
ped gamma-glycine crystals, 1 mole%, 2 m
to the solutions of gamma-glycine and si
technique. The grown crystals are displayed
ystals are transparent, colourless and non-hy
(iii)
crystals: i) 1 mole% of L-alanine doped gam
ole% of L-alanine doped gamma-glycine cry
f solute present in 100 ml of saturated sol
d by gravimetrical method. The solubility
-glycine are presented in the figure 2. It is
es decrease when L-alanine is added as the d
oncentration of these dopant increase in th
.
hp; ISSN: 2454-5422
grade glycine and
hium chloride was
ding more double
rated solution was
.Then the filtered
bout 20 days to get
ain to improve the
ole% and 3 mole%
ngle crystals were
in the figure 1. It is
roscopic.
ma-glycine
stal
tion at a particular
urves for the pure
observed from the
opant into gamma-
host crystals, the

8/17/2019 ijcsr-volume2-issue3 special issue
http://slidepdf.com/reader/full/ijcsr-volume2-issue3-special-issue 52/164
2016; IJC
30
28
30
32
34
36
38
40
42
44
46
48
S o l u b i l i t y ( g / 1 0 0 m l )
Figure 2: Solubility cur
Characterization technique
X-ray diffraction (XRD) pr
characterization of crystals a
bondangles, molecular orien
determined by X-ray crystallXRD method to estimate
MACH3/CAD4 single X-ra
optical transmission spectrum
a Perkin Elmer UV-vis-NIR s
For this study, an optically p
study, microhardness measu
(Leitz Weitzier hardness test
and deformation characteris
calculated using the relation
the diagonal length of indenta
crystalline samples were mea
SR. 2(3): http://www.drbgrpublications.in/ijcsr.p
35 40 45 50
Temperature (oC)
Pure GG Sample
GG+ L-alanine (1mole%)
GG+ L-alanine (2mole%)
GG+ L-alanine (3mole%)
es for undoped and L-alanine doped gamma
ovides an efficient and practical method
nd the molecular structure, atomic coordin
tation and packing of molecules in singl
graphy. The grown crystals were subjected tthe lattice parameters by employing
diffractometer with Mo K radiation (λ
of the samples was recorded in the 190- 11
pectrometer (model-Lambda 35).
lished single crystal of thickness 2mm was
rements were done using a Vickers micr
er). Hardness test provides useful informati
tics of materials. The Vickers microhard
Hv = 1.8544 P/d2 kg/mm2, where P is the
tion impression. Dielectric constant and diel
ured using a two probe arrangement and an
hp; ISSN: 2454-5422
glycine crystals.
for the structural
ates, bond lengths,
e crystals can be
o the single crystal a Bruker-Nonious
=0.71073 Ǻ). The
0 nm region using
sed. In the present
hardness indentor
on on the strength
ness number was
pplied load and d,
ctric loss values of
CR meter.

8/17/2019 ijcsr-volume2-issue3 special issue
http://slidepdf.com/reader/full/ijcsr-volume2-issue3-special-issue 53/164
2016; IJC
Results and Discussion
XRD studies for identificati
From the Single crystal x-ray
doped crystals of gamma-gl
dimensions obtained by singl
The diffraction data shows a
slight changes in the values
gamma-glycine samples com
Table 1: Unit cell con
Crystal
Undoped gamma-glycin
GG crystal doped with
of L-alanine
GG crystal doped with
of L-alanine
GG crystal doped with
of L-alanine
Powder XRD studies for theare given in the figures 3 . Th
of crystallinity is high. The
package and the obtained Mil
(JCPDS file No. 06-0230)..
The unit cell parameters obta
almost the same with the data
SR. 2(3): http://www.drbgrpublications.in/ijcsr.p
n of crystal structure
diffraction study, it is noticed that all the
cine crystallize in hexagonal crystal struc
crystal XRD studies for the sample are sh
very good match with the data reported in
of lattice parameters have been noticed fo
ared to pure gamma-glycine crystal.
stants of undoped and doped gamma-glyc
Axial
dimensions (Å)
Angular
parameters
(degrees)
e (GG)a= b=7.023 (2)
c=5.4780(1)
== 90o
=120o
1 mole %
a=b=7.092(4)
c=5.501(2)
== 90o
=120o
mole %
a=b=7.102(3)
c=5.507(6)
== 90o
=120o
mole %
a=b=7.111(3)
c=5.510(1)
== 90o
=120o
grown crystals were carried out and the recoe sharp diffraction peaks in the patterns indi
diffraction peaks were indexed using the
ller indices (hkl values) were compared wit
he powder XRD data for the samples are gi
ined from powder XRD diffraction method
obtained from single crystal XRD method.
hp; ISSN: 2454-5422
rown undoped and
ture. The unit cell
own in the table 1.
the literature and
L-alanine doped
ine crystals
Unit cell
volume
Å3
234.04
239..82
240.41
241.29
rded XRD patterns cate the percentage
indexing software
the standard chart
ven in the tables 2.
are observed to be

8/17/2019 ijcsr-volume2-issue3 special issue
http://slidepdf.com/reader/full/ijcsr-volume2-issue3-special-issue 54/164
2016; IJC
Figure 3: Powder X-ray diff
Table 2: Values of 2-theta
for GG s
Critical nucleation paramet
Nucleation kinetic studies w
gamma-glycine using a cons
S.No. 2Ө (d1 21.67
2 25.09
3 29.05
4 29.95
5 33.39
6 35.74
7 38.758 42.22
9 52.01
10 60.22
11 68.66
SR. 2(3): http://www.drbgrpublications.in/ijcsr.p
ractogram for GG crystal doped with 1 mole
, interplanar distance, Miller indices and
ample doped with 1 mole % of L-alanine
rs
re performed for the grown crystals of u
tant temperature bath (CTB). From these s
grees) d ( ) Hkl4.097 101
3.546 2-10
3.070 200
2.980 111
2.681 2-21
2.509 102
2.321 3-102.138 2-31
1.756 103
1.535 400
1.365 3-33
hp; ISSN: 2454-5422
% of L-alanine
elative intensity
ndoped and doped
tudies, the data of
I/Imax (%)37.93
43.1
100
67.2
70.6
36.2
37.927.5
27.5
31.0
24.1

8/17/2019 ijcsr-volume2-issue3 special issue
http://slidepdf.com/reader/full/ijcsr-volume2-issue3-special-issue 55/164
2016; IJC
critical nucleation parameters
nucleation phenomena that a
plots of induction period vers
sample doped with L-alanin
understand that the inductio
induction period is observed t
800
1000
1200
1400
1600
I n d u c t i o n
p e r i o d
s e c o n d s )
Figure 4: Plots of induc
Dielectric studies
The grown crystals were c
constant and loss factor. Th
material. The dielectric loss
dielectric and an insulated p
factor (tan ) versus log of fre
and 80 oC are presented in
for the undoped and doped
conductivity of the grown
temperature of the crystals is
and this results in an enhance
SR. 2(3): http://www.drbgrpublications.in/ijcsr.p
were obtained and these data will be usefu
re taking place in the supersaturated soluti
us supersaturation ratio for undoped gamma
e is presented in the figures 4. From t
n period decreases with supersaturation ra
o be increased when gamma-glycine is dope
1.22 1.24 1.26 1.28 1.30
Supersaturation ratio (S)
Pure GG Sample
GG +L-alanine(1 mole%)
GG +L-alanine(2 mole%)
GG +L-alanine(3 mole%)
tion period versus supersaturation ratio for g
samples doped with L-alanine
t, polished and subjected to the measure
e lower the dielectric loss the more effec
angle is an important parameter both for
rtion . The plots of dielectric constant (ε r)
quency for the samples at different tempera
he figure5. The variations of AC conductivi
gamma-glycine crystals are shown in the
crystals increases with increase in temp
increased, there is a possibility of weakenin
d conductivity .
hp; ISSN: 2454-5422
l to understand the
ns of samples The
-glycine (GG), GG
e results one can
tio values and the
with L-alanine.
mma-glycine
ment of dielectric
tive is a dielectric
the material of a
and dielectric loss
ures such as 30, 50
y with temperature
figures 6. The AC
rature. When the
of hydrogen bond

8/17/2019 ijcsr-volume2-issue3 special issue
http://slidepdf.com/reader/full/ijcsr-volume2-issue3-special-issue 56/164
2016; IJC
25
30
35
40
45
50
55
60
65
70
75
80
85
D i e l e c t r i c c o n s t a n t (
r )
Figure 5: Variation of di
added ga
40
4
6
8
10
12
14
16
18
a c
x 1 0 - 7 ( m ) - 1
Figure 6: Temperature
do
SR. 2(3): http://www.drbgrpublications.in/ijcsr.p
2 3 4 5 6
log f
C
C
C
ielectric constant with frequency for 1 mole
ma-glycine crystal at different temperatures
50 60 70 80
Temperature (oC)
Pure GG sample
GG+L-alanine (1 mole%)
GG+L-alanine (3 mole%)
ependence of AC conductivity for undoped
ed gamma-glycine crystals at 103 Hz
hp; ISSN: 2454-5422
of L-alanine
and L-alanine

8/17/2019 ijcsr-volume2-issue3 special issue
http://slidepdf.com/reader/full/ijcsr-volume2-issue3-special-issue 57/164
2016; IJC
Fourier transform infrared
Functional groups and the
infrared spectroscopy. The
excite overtones and harmo
may be used to study the
structure. The recorded FTI
assignments for absorption b
reported in the literature .
3200 and 2400 cm-1 was due t
of NH2 and C – H of CH2 st
attributed to carboxylate grouto NH3 group. Thus, the carb
as ammonium ion in gamma-
stretching vibration. The ba
structure. The bending vibrat
at 1385 cm-1 is assigned to C
stretching. The presence of c
molecule exists in zwitter ioabsorption peaks/bands are sh
the dopants are added into the
Figure 7: FTIR spectru
SR. 2(3): http://www.drbgrpublications.in/ijcsr.p
(FTIR) spectroscopic studies
olecular structure of compounds can be i
igher-energy near-IR, approximately 140
ic vibrations. The mid-infrared, approximat
fundamental vibrations and associated ro
R spectra of the samples are shown in t
nds of infrared spectra were given in accor
he broad envelope in the higher wavenum
o hydrogen interaction with other atoms suc
retching. The bands observed at 501, 606
ps while the peaks absorbed at 1491 and 556xyl group is present as carboxylate ion and
glycine. The peak observed at 1040 cm-1 is
d at 606 cm-1 is due to the wagging
ion of CH group appears at 927 cm -1 in the
2 twisting vibration. The peak around 2885
rboxylate and ammonium ion clearly indica
nic form in gamma-glycine crystal. It isifted slightly and some bands are narrowed
lattice of gamma-glycine crystals.
m of 1 mole% of L-alanine doped gamma-gl
hp; ISSN: 2454-5422
entified using the
0 – 4000 cm−1 can
ely 4000 – 400 cm−1
tational-vibrational
he figures 7. The
ance with the data
er region between
as N – H stretching
and 683 cm-1 are
cm-1 are attributed amino group exists
assigned to C-C-N
vibration of COO-
pectrum. The peak
corresponds to CH
tes that the glycine
observed that the or broadened when
ycine sample

8/17/2019 ijcsr-volume2-issue3 special issue
http://slidepdf.com/reader/full/ijcsr-volume2-issue3-special-issue 58/164

8/17/2019 ijcsr-volume2-issue3 special issue
http://slidepdf.com/reader/full/ijcsr-volume2-issue3-special-issue 59/164
2016; IJC
Table 3. Values of w
Sam
Pure Gamma gl
GG +L-alanine
GG +L-alanine
GG +L-alanine
Determination of transmitt
index
Optical transmittance and tran
are important for single cryst
cut and polished and the speci
using a spectrophotometer in
spectra of the samples are p
evident that the grown crysthave UV lower cut-off wave
suggests that the crystals are
gap values are given in the ta
Figure 9: Transmittanc
SR. 2(3): http://www.drbgrpublications.in/ijcsr.p
rk hardening coefficient (n) for the samples
gamma-glycine
le Work hardeningcoefficient(n)
ycine(GG) 5.175
(1mole%) 5.083
(2mole%) 4.324
(3mole%) 3.914
nce, optical band gap, extinction coeffici
sparency cut-off wavelength and other linea
ls mainly used in optical applications. The
men 1.5 mm thick was subjected to transmis
the spectral region of 200 – 1100 nm. The rec
esented in the figures 9. From the transm
ls of undoped, and L-alanine doped gamlength and the transparency in the entire vi
suitable for second harmonic generation. T
le 4.
spectrum of gamma-glycine crystal doped
of L-alanine
hp; ISSN: 2454-5422
of L-alanine
nt and refractive
optical parameters
rown crystals were
sion measurements
rded transmittance
ittance spectra it is
a-glycine crystals sible region and it
he calculated band
ith 1 mole%

8/17/2019 ijcsr-volume2-issue3 special issue
http://slidepdf.com/reader/full/ijcsr-volume2-issue3-special-issue 60/164
2016; IJC
Table.4.Band g
Undo
Gam
1 mol
Gam
3 mol
Conclusion
Pure gamma glycine and L-
studies were carried out. Sin
grown by slow evaporation
structure of the grown crystal
mechanical property of the
noticed that there is an incre
alanine. The dielectric propert
Acknowledgement
The authors thank the staff
microhardness data UVvisibl
by Crecent Engineering Colle
References
T.P. Srinivasan, R. Indirajith,
J. Zaccaro, J. Matic, A.S. My
K. Allen, R.J. Davey, E. Ferr
C.S. Towler, R.J. Davey, R.
T. Balakrishnan, R. Ramesh
SR. 2(3): http://www.drbgrpublications.in/ijcsr.p
ap values for Undoped and doped gamma-gl
Sample Band gap (eV)
ed gamma-glycine
a-glycine +
% of L-alanine
a-glycine +
% of L-alanine
5.62
5.12
4.95
lanine doped gamma glycine were synthes
gle crystals of un doped and L-alanine do
technique. Single crystal XRD study rev
s. The band gap of both the samples of this
grown crystals was studied by micro hard
ase in hardness when gamma glycine cryst
y also effectively studied.
embers of St.Joseph’s college, Trichy for
spectral and FTIR data. The supports exten
ge, Chennai
R. Gopalakirhnan, J. Crystal Growth 318 (2
rson, B.A. Garetz, Cryst. Growth Des.1 (20
ri, C. Towler, G.J. Tiddy, Cryst.Growth Des.
. Lancaster, C.J. Price, J. Am. Chem.Soc. 12
abu, K. Ramamurthi, Spectrochim. Acta Par
hp; ISSN: 2454-5422
ycine
ized and solubility
ed gamma-glycine
als the hexagonal
work is found. The
ness test and it is
al is doped with l-
helping us to take
ded in the research
11) 762
1) 5
. 2 (2002) 523
6 (2004) 13347
t A69 (2008)114

8/17/2019 ijcsr-volume2-issue3 special issue
http://slidepdf.com/reader/full/ijcsr-volume2-issue3-special-issue 61/164
2016; IJC
B. Narayana Moolya, A. JaGrowth 280 (2005) 581
J. Uma, V. Rajendran, Optik 1
Sd. Zulifiqar Ali Ahamed,Raju, Arab.J. Chem. (2013) 6
M. Esthaku Peter, P. Ramasa
S.Govinda, K.V.Rao, Phys. S
B.Tareev, Physics of dielectri
SR. 2(3): http://www.drbgrpublications.in/ijcsr.p
yarama, M.R. Sureshkumar, S.M. Dharma
25 (2014) 816
.R. Dillip , P. Raghavaiah , K. Mallikarjun, 429
y Spectrochimica Acta Part A 75 (2010) 14
atus Solidi 27 (1975) 639
materials, Mir Publishers, Moscow (1979)
hp; ISSN: 2454-5422
rakash, J. Crystal
a, B. Deva Prasad
17

8/17/2019 ijcsr-volume2-issue3 special issue
http://slidepdf.com/reader/full/ijcsr-volume2-issue3-special-issue 62/164
Volume: 2; Issue: 3 [Special Issue]; March-2016; pp 403-410. ISSN: 2454-5422
Investigation on the nucleation kinetics of urea doped Bis glycine picrate
N.Balasundari1, P.Selvarajan2, S.Lincy Ponmani3 and D.JencylineNavarani3
1Depatment of Physics, Sri KGS College of Arts and Science, Srivaikundam, India.2Department of Physics, Aditanar College of Arts and Science, Tiruchendur, India.3
Department of Physics, Sarah Tucker College, Tirunelveli, India.*Corresponding Author Email Id: [email protected]
Abstract
The present communication deals with the nucleation kinetics of urea doped Bis glycine
picrate (BGP).Induction period and interfacial energy have been determined for the aqueous
solution growth of urea doped BGP. It is observed that the induction period decreases asthe
supersaturation ratio increases and hence the nucleation rateincreases. The solubility of ureadoped BGP crystal has been estimated at different temperatures. It is observed that, BGP has
apositive temperature coefficient of solubility. Nucleation parameters such as radius of the
critical nucleus, number of molecules in the criticalnucleus and critical free energy change
have also been investigated.
Keywords: Nucleation kinetics; Induction period; Interfacial energy; solubility; BGP; doping
Introduction
Crystals of amino acid family have been grown and studiedby several researchers for their
excellent nonlinear optical (NLO) properties. The study ofamino acid crystallizes with other
organic and inorganic molecules, which presents a high non-linear opticalcoefficient has
gained much attention in the last few years because of the possibility of using them in
technological devices .Picric acid forms stablepicrates with various organic molecules like
glycine through π bonding orionic bonding. BisGlycine picrate(BGP)is an organic nonlinear
optical material that belongs to monoclinic crystalsystem and the lattice parameters are a =

8/17/2019 ijcsr-volume2-issue3 special issue
http://slidepdf.com/reader/full/ijcsr-volume2-issue3-special-issue 63/164
2016; IJC
14.968 Å, b = 6.722 Å, c =
growth rate and the characteri
the present study, the nuclea
andcritical free energy ch
determined induction period f
Material synthesis and puri
The BGP was synthesized by
acid in the molar ratio of 2:
thoroughly dissolved in doub
magneticstirrer to yield a hountil the synthesized salt of p
of 0.5, 1 and 1.5 mole %were
Bisglycine picrate salt. The p
the recrystallization process.
Experimental procedure
The solution growth methodcrystals with well faceted mo
for the success of the soluti
aqueous solution by gravim
dissolving the solute in w
maintained at 30 °C (accurac
stirrer.
It isdone to have uniform
solution. After attaining satu
gravimetrically .The same pr
for undoped (pure) and urea
50ºC are presented in the figu
SR. 2(3): http://www.drbgrpublications.in/ijcsr.p
5.165 Å and β= 93.65º .Influence of urea
stics of BGP have been reported in our earli
tionparameters such as interfacial energy, v
nge were evaluated numerically using
or urea doped BGP.
ication
reacting the aqueous solutionsof high purit
1with double distilled water as the solvent.
le distilledwater and stirred well using a tem
mogeneous mixture of solution. Then the sure Bisglycine picrate was obtained. Calcula
added to the solution of Bisglycine picrate t
urity of the synthesized salts was further im
is widely used and best suited for growingrphology. Solubility measurements arean ess
n growth technique. Solubilitystudies wer
tric method. The solubility of pure BGP
ter. The solution was kept in a consta
y±0.01 °C) andcontinuously stirred using a
temperature and concentration throughoutt
ation, theequilibrium concentration of the s
cess was repeated for the urea doped BGP.
oped BGP salts at various temperatures ran
re 1.
hp; ISSN: 2454-5422
n the morphology,
er investigation .In
olume free energy
theexperimentally
glycine and picric
he reactants were
perature controlled
olution was heated ted amount of urea
obtain urea-doped
roved by repeating
goodquality single ential pre-requisite
carried out in an
as determined by
ttemperature path
otorized magnetic
he volume of the
olute was analyzed
olubility diagrams
ging from 30 ºC to

8/17/2019 ijcsr-volume2-issue3 special issue
http://slidepdf.com/reader/full/ijcsr-volume2-issue3-special-issue 64/164
2016; IJC
15
20
25
30
35
40
45
50
55
60
65
70
75
S o l u b i l i t y ( g / 1 0 0 m l )
Figure 1: Solubili
The saturated solution of pure
the nucleation experiments.T
supersaturations by employ
saturatedsolution of BGP in
inaccordance with pre deter
placed in the constant tempe
degrees above the saturate
undissolved. The bath temper
as the solution reached 303
was observed. The total ti
nucleus of detectable size w
growth of the critical nucleu
time needed between theatta
detectable size.Hence this can
of thenucleus was seen at
calculatingthe induction peri
same process was repeated fo
function of supersaturation
supersaturation increases. Th
interfacial tensionvalues.
SR. 2(3): http://www.drbgrpublications.in/ijcsr.p
30 35 40 45 50 55
Temperature(oC)
Pure BGP salt
BGP + 0.5 mole% of urea
BGP + 1 mole% of urea
BGP + 1.5 mole% of urea
ty diagram for pure and urea doped BGP
and urea doped BGP were prepared using th
he induction period was measured experim
ing the isothermal method . In this
an aqueous solution of 1.1 supersaturation
ined solubility at 303 K. The prepared sat
ature water bath. The temperature of the ba
temperature to dissolve the excess sol
ature was lowered to 303K and a stop clock
, when the nucleation formedinside the solu
e elapsed between supersaturation and th
as taken as theinduction period (τ). The ti
s to adetectable size was negligibly small,
inment of supersaturated and the appearan
be taken as induction period. The appearan
the bottom of the container. This process
ds for different supersaturation ratios (1.1
r the urea doped BGPand the obtained resul
isshown in Fig. 2. The induction period
e measured induction period values were u
hp; ISSN: 2454-5422
crystals
solubility data for
entally at different
ethod, 50 ml of
ratio was prepared
urated solutionwas
th wasraised a few
ute that remained
was started as soon
tion a bright glitter
e appearance of a
e required for the
compared with the
e of a nucleus of
e of the first speck
was repeated for
3, 1.16, 1.2 ) .The
ts were plotted as a
decreased as the
sed to estimate the

8/17/2019 ijcsr-volume2-issue3 special issue
http://slidepdf.com/reader/full/ijcsr-volume2-issue3-special-issue 65/164
2016; IJC
Figure 2.Plot of
Nucleation kinetics
The classical nucleation theor
given as ,
∆
where_Gv is the energy chan
radius of the nucleus.The firs
the second term represents t
phase and the surroundingmo
formation of a small cluste
nucleation from the saturated
∆
where∆Gv is the volume free
and k is the Bolzmann’s cocondition
d( ∆ Gv)/dr = 0. Hence, the
nucleation can be expressed a
∗ =
Here k is the Boltzmann’s c
ratio
150
200
250
300
350
400
450
500
550
600
I n d
u
c t i o n
p
e r i o
d
s e c
SR. 2(3): http://www.drbgrpublications.in/ijcsr.p
induction period ( ) vsSupersaturation r
y states that the energy requiredto form the
= ∆ +4 (1)
ge per unit volume, ‘ ’ is the interfacialte
t term in Eq. (1) represents the formation o
e differences in the chemicalpotential bet
ther liquor. Fluctuation in the supersaturated
of molecules known as embryos.The dri
solution isgiven as,
(2)
energy change, V is the specific volumeof t
stant.In the critical state, the free energy f
critical radius and the Gibbscritical free
s;
(3)
nstant, T is the absolute temperature, S is
∆ ∗ = ( ) (4)
1.10 1.12 1.14 1.16 1.18 1.20
pure BGP
BGP + 0.5 mole% of urea
BGP 1 mole% of urea
BGP 1.5 mole% of urea
Supersaturation ratio (S)
hp; ISSN: 2454-5422
tio (S)
uclei (spherical) is
sion and ‘r’ is the
f a newsurface and
een the crystalline
solution causesthe
ving force for the
he solute molecule
rmation obeys the
energy barrier for
the supersaturation

8/17/2019 ijcsr-volume2-issue3 special issue
http://slidepdf.com/reader/full/ijcsr-volume2-issue3-special-issue 66/164
2016; IJC
The rate of nucleation (i.e., th
expressed by an Arrhenius-ty
where A is the pre-exponenti(approximately A= 1 x 1030 f
The number of molecules in t
According to the classical the
induction period (τ) is related
ln
where B is a constant, R is th
theinduction period at tem
S)2againstln(τ)(fig 3)from Eq
value of ln B. The slope is giv
m
20
5.0
5.2
5.4
5.6
5.8
6.0
6.2
6.4
l n
SR. 2(3): http://www.drbgrpublications.in/ijcsr.p
e number of nuclei formed per unit time per
e equation
= ( ∆ ∗
)(5)
l factor or solution),
e critical nucleus is expressed by
= ∗
(6)
ory of homogenous nucleation(14), the
to the interfacial tension (σ) as follows
-lnB +( )
(7)
k =
universal gasconstant and NA is the Avoga
perature T and supersaturation ratio S.
. (6) is a straight line andthe intercept on t
enas,
= (8)
40 60 80 100 120
Pure BGP BGP + 0.5 mole% of urea
BGP 1 mole% of urea
BGP 1.5 mole% of urea
1 / (ln S)2
igure.3. Plot of 1/ (ln S)2vsln (τ).
hp; ISSN: 2454-5422
unitvolume) can be
dro’s number and τ
plot of 1/ (ln
e Y-axis gives the

8/17/2019 ijcsr-volume2-issue3 special issue
http://slidepdf.com/reader/full/ijcsr-volume2-issue3-special-issue 67/164
2016; IJC
Results and discussion
The solubility of Pure and ur
Fig. 1. From the graph,it is
temperature and it is found t
solubility increases with tem
solubility. Fig.2 shows the
constanttemperature. The val
supersaturated concentration
theinduction period increases
induction period againstsuper
have a controlled nucleation r
Table 1: Summary of cri
Sample
Pure BGP
BGP + 0.5mole% of urea
BGP + 1mole% of
urea
BGP + 1.5mole% of urea
1.11.11.11.
1.11.11.11.
1.11.1
1.11.
1.11.11.11.
Theinterfacial tension has bee
BGP and various mole perce
SR. 2(3): http://www.drbgrpublications.in/ijcsr.p
a doped BGP crystals as a function of temp
bserved that solubility of the samples in w
o be more for urea doped BGP than the p
perature, the samples have positive temper
induction period as a function of super
e of τ decreases and hence the nucleation
of the aqueous solution isincreased. It c
with increase in additive concentration of
saturation gives an idea of optimized inducti
ate to grow good quality singlecrystals.
ical nucleation parameters for pure and u
samples
∆G x 10-
20
(joules )
J x 10nuclei/s /volum
e
r x 10-
m
36
36
3
6
36
0.4290.2610.1770.117
0.4250.2580.1750.116
0.3080.187
0.1270.084
0.1790.1090.0740.049
3.6085.3786.5677.573
3.6435.4176.5987.591
4.8106.412
7.3958.186
6.5357.7188.3878.901
12.69.828.086.58
12.59.768.046.54
11.28.72
7.185.85
9.327.275.984.87
21.410.15.663.05
21.110.05.623.02
15.47.27
4.062.1
8.974.252.371.28
n calculated at constant temperature(room te
tage of urea doped TGS crystals from the
hp; ISSN: 2454-5422
erature is shown in
ater increases with
re BGP. Since the
ture coefficient of
saturation ratio at
ateincreases as the
n be noticed that
urea. The study of
n period in orderto
rea doped BGP
70
25
5
1
8
mperature) for pure
raph (fig.3) drawn

8/17/2019 ijcsr-volume2-issue3 special issue
http://slidepdf.com/reader/full/ijcsr-volume2-issue3-special-issue 68/164
2016; IJC
between ln τ and 1/ (lnS)2.
6.661 mJ/m2 .Using the interf
critical nucleus(r*), Gibbsfre
critical nucleushave been calc
summarized in the Table 1.I
increase ofsupersaturation an
supersaturation. That means t
lead to spurious nucleation. A
the increaseof supersaturation
is increased.
ConclusionThe fundamental nucleation
determined on the basisof the
have been experimentallyde
supersaturation conditions us
nucleation parameters such as
nucleus andthe number of
interfacial tension values.
Acknowlogements
The authors are thankful to
Regional Research Laborato
Joseph College (Trichy), M.K
References
X. Liu, Z. Wang, G. Zhang,(2007) 130-132.
Y. Zhang, H. Li, B. Xi, Y. C
J. Hernandez-Paredes, D. GlDuarte-Moller, J.Mol. Struct.
D. Eimerl, S. Velsko, L. Dav
Sachinkumar, Hotam sing ch
860
SR. 2(3): http://www.drbgrpublications.in/ijcsr.p
he calculated values of interfacial tension
acial tension value, the nucleation paramete
energy change(∆G*) and number of mo
ulated for the controlled nucleationcondition
t is notedfrom Table 1that the value of r*
consequently the nucleation rate (J) increas
he number of critical nucleiformed will be in
lso itwas observed that the values of n and
and also these parameters decrease when c
parameters of pure and urea doped B
classical nucleation theory. The solubility a
ermined. The interfacial tension was calc
ing the experimentally determinedinduction
volumefree energy, Gibbs critical free ener
molecules in the critical nucleus were d
the supported work from various resear
y (Trivandrum), Crescent Engineering Col
. University (Madurai) and Cochin Universit
. Wang, A. Duan, Z. Sun, L. Zhu, D. Xu, J
e, J. Zheng, Mater. Chem.Phys. 108 (2008)
ossman-Mitnik, H.E. Esparza-Ponce, M.E.875 (2007) 295-301.
is, F. Wang,G. Loiacona, G. Kennedy, 25 (1
oudhari, Chandrabhanseniya.Chem.Pharm.R
hp; ISSN: 2454-5422
ary from 6.473 to
rssuch as radius of
ecules (n) in the
and the results are
decreases with the
es with increase of
creased which will
G* decreases with
ncentration of urea
GP crystals were
d induction period
ulated at different
period values. The
y, radius of critical
terminedusing the
h centers such as
lege (Chennai), St
y (Cochin).
. Cryst.Growth 308
192-195.
Alvarez-Ramos, A.
89) 179 – 193.
es.,2011,3[4]. 854-

8/17/2019 ijcsr-volume2-issue3 special issue
http://slidepdf.com/reader/full/ijcsr-volume2-issue3-special-issue 69/164
2016; IJC
ChandrabhanseniyaSumit si330-336
S. Yamaguchi, M. Goto, H.1028.
T. Kai, M. Goto, K. Furuhata,
T. Uma Devi, N. Lawrence(2008) 340.
N.Balasundari, P.Selvarajan,Science and Tech. 2011, 3(12
K.Byrappa, T.Ohachi, “Cr(Springer), Norwich, New Yo
N.P. Zaitseva, L.N. Rashkovi
A.E. Nielsen, S. Sarig, J. Crys
M. volmer, A. weber, phys. c
SR. 2(3): http://www.drbgrpublications.in/ijcsr.p
ng trivedia, Santoshkumarverma JChem.Ph
Takayanagi, H. Ogura, Bull. Chem. Soc. J
H. Takayanagi, Anal. Sci. 10 (1994) 359.
, R. Ramesh Babu, K. Ramamurthi, Spect
S.Lincy Mary Ponmani and D.Jencylin R): 64-67
ystal Growth Technology”, William Ark(2003)
ch, S.V. Bogatyreva, J. Cryst. Growth 148 (1
t. Growth 8 (1971) 1.
hem. 119(1926)27
hp; ISSN: 2454-5422
arm.Res.,2011,3(6)
n.61 (1988) 1026 –
rochim.Acta A 71
ecent Research in
ndrew Publishing
995) 276.
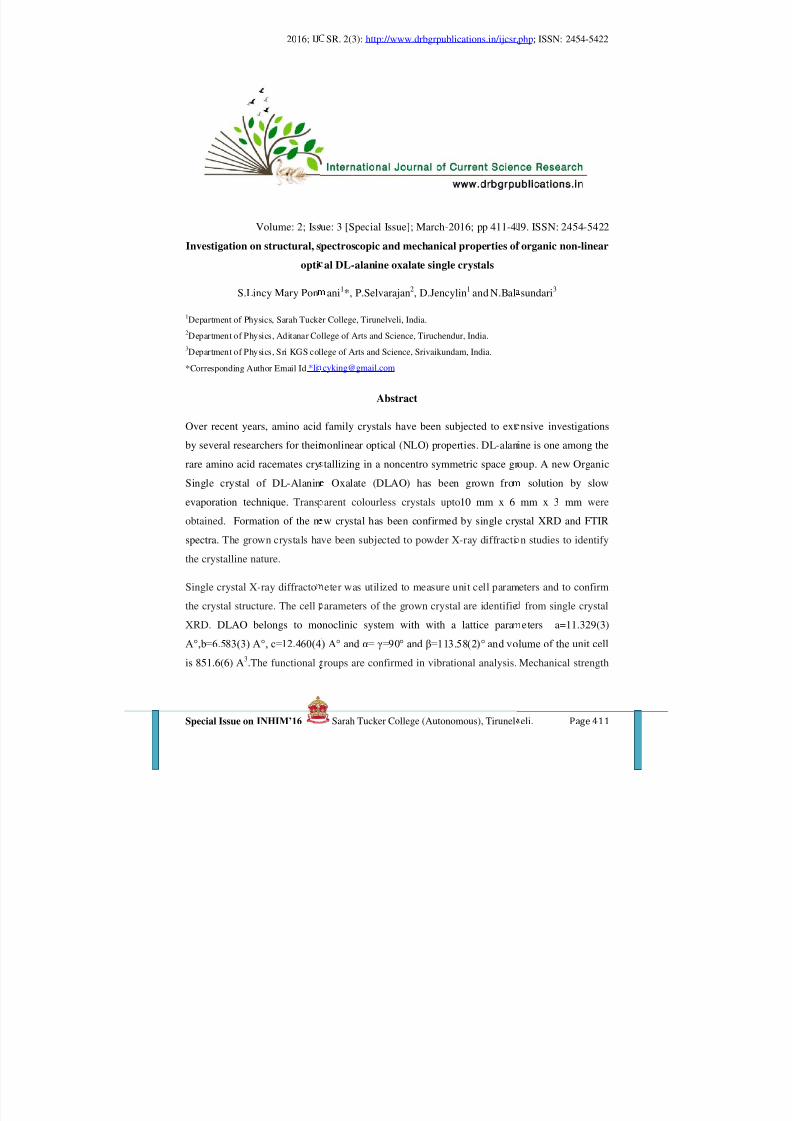
8/17/2019 ijcsr-volume2-issue3 special issue
http://slidepdf.com/reader/full/ijcsr-volume2-issue3-special-issue 70/164
2016; IJ
Volume: 2; Iss
Investigation on structural, s
opti
S.Lincy Mary Pon
1Department of Physics, Sarah Tucke2Department of Physics, Aditanar Co3Department of Physics, Sri KGS col
*Corresponding Author Email Id *li
Over recent years, amino acid
by several researchers for their
rare amino acid racemates cry
Single crystal of DL-Alanin
evaporation technique. Trans
obtained. Formation of the n
spectra. The grown crystals hathe crystalline nature.
Single crystal X-ray diffracto
the crystal structure. The cell
XRD. DLAO belongs to mo
A°,b=6.583(3) A°, c=12.460(4
is 851.6(6) A3.The functional
SR. 2(3): http://www.drbgrpublications.in/ijcsr.
ue: 3 [Special Issue]; March-2016; pp 411-41
pectroscopic and mechanical properties of
al DL-alanine oxalate single crystals
ani1*, P.Selvarajan2, D.Jencylin1 and N.Bal
r College, Tirunelveli, India.
llege of Arts and Science, Tiruchendur, India.
lege of Arts and Science, Srivaikundam, India.
Abstract
family crystals have been subjected to ext
nonlinear optical (NLO) properties. DL-alan
tallizing in a noncentro symmetric space gr
Oxalate (DLAO) has been grown fro
arent colourless crystals upto10 mm x 6
w crystal has been confirmed by single cry
ve been subjected to powder X-ray diffracti
eter was utilized to measure unit cell param
arameters of the grown crystal are identifie
noclinic system with with a lattice para
) A° and α= γ=90° and β=113.58(2)° and vo
roups are confirmed in vibrational analysis.
php; ISSN: 2454-5422
9. ISSN: 2454-5422
organic non-linear
sundari3
nsive investigations
ine is one among the
oup. A new Organic
solution by slow
mm x 3 mm were
stal XRD and FTIR
n studies to identify
eters and to confirm
from single crystal
eters a=11.329(3)
lume of the unit cell
Mechanical strength

8/17/2019 ijcsr-volume2-issue3 special issue
http://slidepdf.com/reader/full/ijcsr-volume2-issue3-special-issue 71/164
2016; IJ
of the grown material is tested
applied load is increased.
Keywords : Aminoacid; DLCrystal structure; Microhardne
Introduction
The organic materials play
modulation, optical parametric
Over recent years, amino acid
by several researchers for th
complexes are the organic or
their ability in ease of pro
understanding of the properti
requires more attention
DL-Alanine is one among the
space group. The structure of
structure is stabilized by a netcarboxyl group is present as a
literature survey, it is noticed
complexes.
Experimental studies of DL
Growth procedure
DL-alanine oxalate (DLAO) w
by slow solvent evaporation t
(AR grade) were mixed with
alanine oxalate. A saturated s
filter paper. The filtered soluti
filter paper so that the rate of
crystals were obtained after 3
distilled water in order to impr
SR. 2(3): http://www.drbgrpublications.in/ijcsr.
by Hardness studies. The value of hardnes
-alanine; Crystal growth; Single crystal; X-rass
n important role in second frequency mi
oscillation, optical bi-stability, harmonic g
family crystals have been subjected to ext
ir nonlinear optical (NLO) properties. A
semi-organic materials that have attracted g
cessing in the assembly of optical devi
s of amino acid crystals, as well as other
are amino acid racemates crystallizing in a
DL-alanine was elucidated by Subha Nand
ork of characteristic head-to-tail hydrogencarboxylate ion and amino group as ammo
that a limited number of papers are avail
O crystal
as grown from the aqueous solution using d
chnique. An equimolar amount of DL-ala
sufficiently large amount of water at 50 o
lution of 150 ml was taken and the solutio
on was taken in a beaker, which was tightly
evaporation could be minimized. Good tran
weeks and the obtained material were re-
ove their purity. The recrystallized crystalsw
php; ISSN: 2454-5422
increases when the
y Diffraction;
xing, electro-optical
neration (SHG) etc.
nsive investigations
ino acids and their
reat attention due to
ces. The complete
rganic crystals, still
on-centrosymmetric
ini et al. The crystal
ond sequences. The nium ion. From the
able on DL-alanine
ouble distilled water
nine and oxalic acid
to synthesize DL-
n was filtered using
closed with a thick
sparent, small single
crystallized twice in
ere used as the seed

8/17/2019 ijcsr-volume2-issue3 special issue
http://slidepdf.com/reader/full/ijcsr-volume2-issue3-special-issue 72/164
2016; IJ
to obtain big sized crystals
displayed in the figure 1.
Solubility measurementTo grow bulk crystals from s
solvent in which it is moderat
organic solvents like acetone,
of a crystal depends on the am
by the solubility of the materi
was determined by addinga
temperature till it was complsolubility ofDL-alanine oxalat
50°C and 55° C. The temperat
figure 2. From the result, it is
data can be used for preparin
studies.
Fig 2: Variation
SR. 2(3): http://www.drbgrpublications.in/ijcsr.
ofDL-alanine oxalate. The harvested cry
Fig 1: Photograph of DLAO crystals
lution by slow evaporation technique, it is
ly soluble. It is found that DLAO sample is
ethanol and ethanol and is reasonably solub
unt of material available in the solution, whi
l in that solvent. The solubility of DL-alani
known quantity of solute in solvent mai
letely dissolved. Using this technique, thewas evaluated at various temperatures viz.
ure dependence of solubility of DL-alanine
observed that the solubility increases with
g the saturated solution and for carrying o
of solubility with temperature for DLAO
30 35 40 45 50 55
40
60
80
100
120
140
160
S o l u b i l i t y ( g / 1 0 0 m l )
Temperature (oC)
php; ISSN: 2454-5422
tals of DLAO are
desirable to select a
sparingly soluble in
le in water. The size
ch in turn is decided
ne oxalate in water
ntained at constant
e magnitude of the . 30°C, 40°C, 45°C,
oxalate is shown in
temperature. These
t nucleation kinetic
rystal

8/17/2019 ijcsr-volume2-issue3 special issue
http://slidepdf.com/reader/full/ijcsr-volume2-issue3-special-issue 73/164
2016; IJ
Results and Discussion
X-ray diffraction studies
The cell parameters of the
diffractometer (Bruker-Nonius
monoclinic system with the ce
α= γ=90° and β=113.58(2)° a
In order to identify the diffr
subjected to powder X-ray didiffractometer. The XRD patt
were indexed using the INDE
and Steeple . The values of 2θ,
Fig 3: P
10 15
-5000
0
5000
10000
15000
20000
25000
30000
35000
( 0 1 1 )
c o u n t s
SR. 2(3): http://www.drbgrpublications.in/ijcsr.
grown crystal were obtained using si
MACH3/CAD4).It is observed that the DL
ll parameters a=11.329(3)Å, b=6.583(3) Å,
d volume of the unit cell is 851.6(6)Å 3.
action planes of the crystal of DLAO, the
fraction studies with a high resolution PANrn is shown in figure 3.The reflections of
ING software package by following the
hkl values and d-values etc. are presented i
wder XRD pattern of DLAO crystal
20 25 30 35 40 45 50 55 60 65
( 3 0 3 )
( - 1 2 2 )
( 3 1 0 )
( - 2 1 3 )
( 1 1 2 )
( - 2 1 2 )
( - 1 0 3 )
( 1 0 2 )
2θ (degrees)
php; ISSN: 2454-5422
ngle crystal X-ray
O crystal belongs to
=12.460(4) Å ° and
grown sample was
alytical X’pert PRO owder XRD pattern
rocedure of Lipson
the table 1.
70
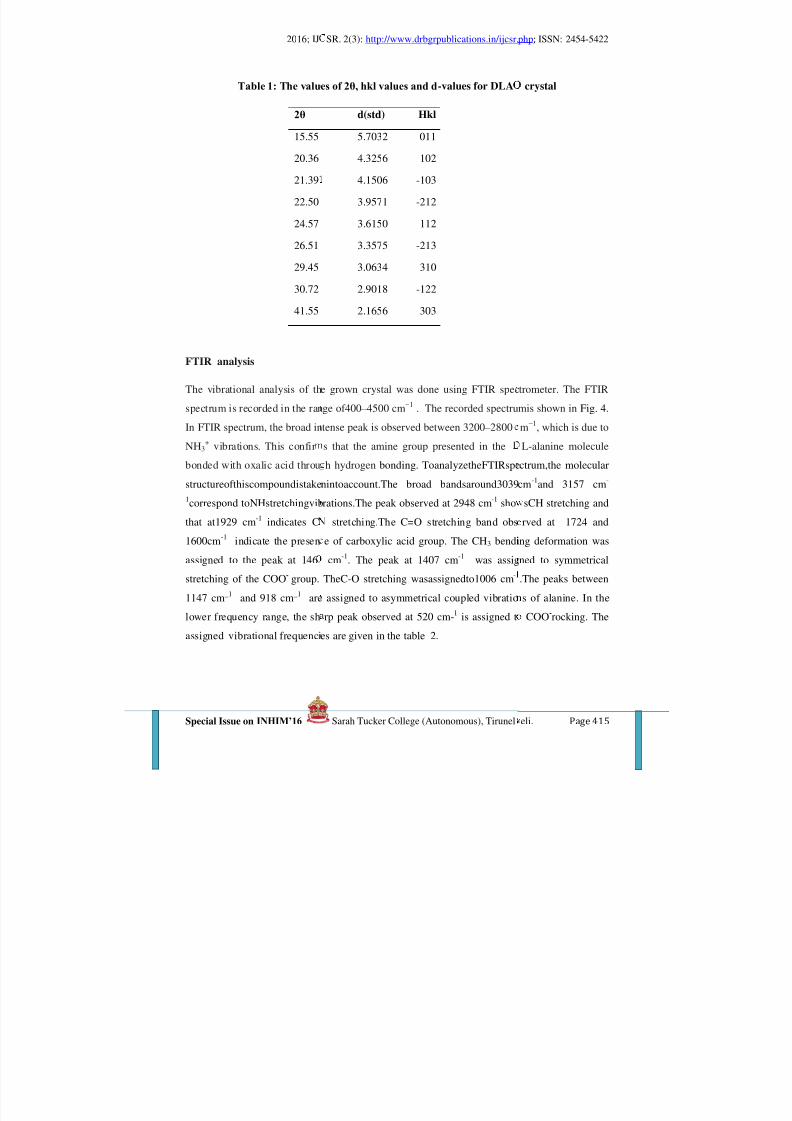
8/17/2019 ijcsr-volume2-issue3 special issue
http://slidepdf.com/reader/full/ijcsr-volume2-issue3-special-issue 74/164
2016; IJ
Table 1: The valu
2θ
15.55
20.36
21.39
22.50
24.57
26.51
29.4530.72
41.55
FTIR analysis
The vibrational analysis of th
spectrum is recorded in the ranIn FTIR spectrum, the broad in
NH3+ vibrations. This confir
bonded with oxalic acid throu
structureofthiscompoundistake1correspond toNHstretchingvib
that at1929 cm-1 indicates C
1600cm-1
indicate the presenassigned to the peak at 146
stretching of the COO- group.
1147 cm_1 and 918 cm_1 are
lower frequency range, the sh
assigned vibrational frequenci
SR. 2(3): http://www.drbgrpublications.in/ijcsr.
es of 2θ, hkl values and d-values for DLA
d(std) Hkl
5.7032 011
4.3256 102
4.1506 -103
3.9571 -212
3.6150 112
3.3575 -213
3.0634 3102.9018 -122
2.1656 303
e grown crystal was done using FTIR spec
ge of400 – 4500 cm−1 . The recorded spectrutense peak is observed between 3200 – 2800
s that the amine group presented in the
h hydrogen bonding. ToanalyzetheFTIRspe
nintoaccount.The broad bandsaround3039
rations.The peak observed at 2948 cm-1 sho
stretching.The C=O stretching band obs
e of carboxylic acid group. The CH3 bendicm-1. The peak at 1407 cm-1 was assig
TheC-O stretching wasassignedto1006 cm-1
assigned to asymmetrical coupled vibratio
rp peak observed at 520 cm-1 is assigned t
es are given in the table 2.
php; ISSN: 2454-5422
crystal
trometer. The FTIR
mis shown in Fig. 4. m−1, which is due to
L-alanine molecule
ctrum,the molecular
cm-1and 3157 cm-
sCH stretching and
rved at 1724 and
ng deformation was ned to symmetrical
.The peaks between
s of alanine. In the
COO-rocking. The
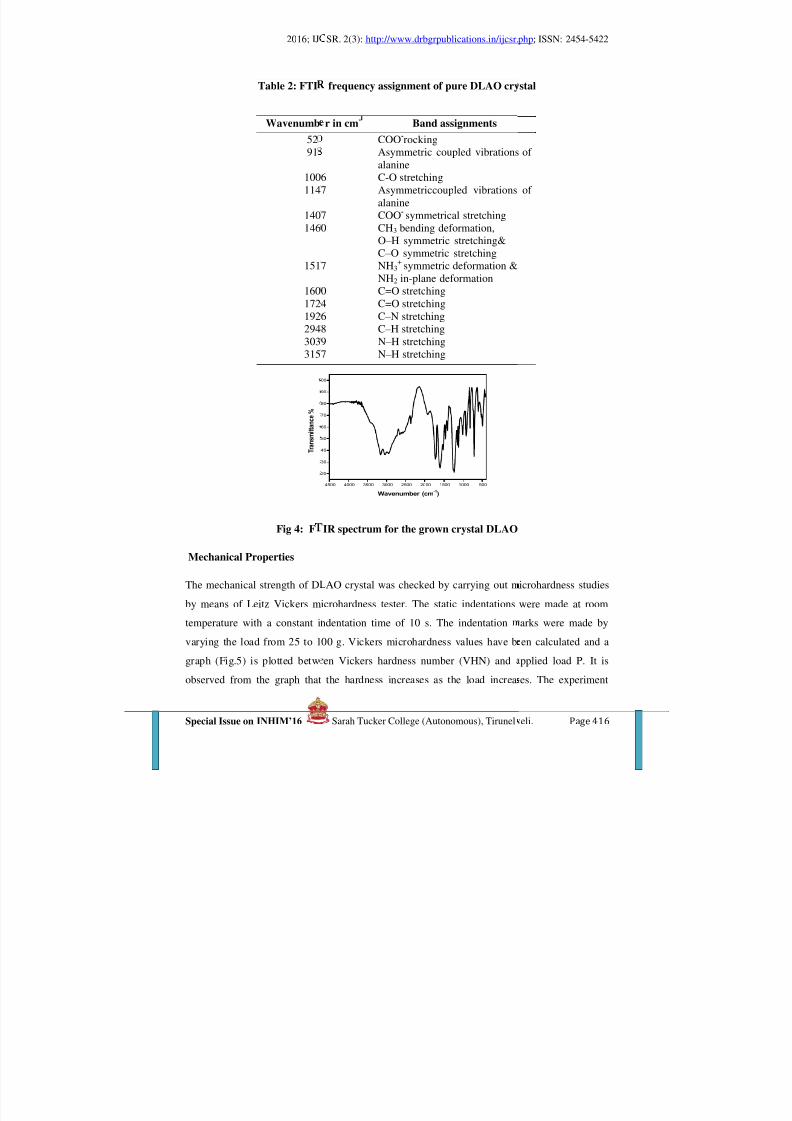
8/17/2019 ijcsr-volume2-issue3 special issue
http://slidepdf.com/reader/full/ijcsr-volume2-issue3-special-issue 75/164
2016; IJ
Table 2: FTI
Wavenumb
5291
100114
140146
151
160172192294303315
Fig 4: F
Mechanical Properties
The mechanical strength of D
by means of Leitz Vickers m
temperature with a constant i
varying the load from 25 to 1
graph (Fig.5) is plotted betw
observed from the graph that
1
T r a n s m i t t a n c e %
SR. 2(3): http://www.drbgrpublications.in/ijcsr.
frequency assignment of pure DLAO cry
r in cm- Band assignments
COO-rockingAsymmetric coupled vibrationsalanine
6 C-O stretching7 Asymmetriccoupled vibrations
alanine7 COO- symmetrical stretching0 CH3 bending deformation,
O – H symmetric stretching&C – O symmetric stretching
7 NH3
+ symmetric deformation &NH2 in-plane deformation
0 C=O stretching4 C=O stretching6 C – N stretching8 C – H stretching9 N – H stretching7 N – H stretching
IR spectrum for the grown crystal DLAO
AO crystal was checked by carrying out m
icrohardness tester. The static indentations
ndentation time of 10 s. The indentation
00 g. Vickers microhardness values have b
en Vickers hardness number (VHN) and
the hardness increases as the load increa
4500 4000 3500 3000 2500 2000 1500 1000 500
20
30
40
50
60
70
80
90
00
Wavenumber (cm-1)
php; ISSN: 2454-5422
stal
of
of
icrohardness studies
were made at room
arks were made by
en calculated and a
pplied load P. It is
es. The experiment

8/17/2019 ijcsr-volume2-issue3 special issue
http://slidepdf.com/reader/full/ijcsr-volume2-issue3-special-issue 76/164
2016; IJ
shows that the crystal of DLA
not shown in figure 5. The for
g is due to the release of th
hardening coefficient ‘n’ of th
of the log P versus log d plot (
crystal is a soft material and th
Fig 5:
Fig 6
Second Harmonic Generatio
A high density Nd:YAG laser
the powdered sample of the D
laser beam having the green e
l o g P
SR. 2(3): http://www.drbgrpublications.in/ijcsr.
breaks when a load more than 100 g is app
ation of cracks on the surface of the crystal
internal stresses generated locally by in
DLAO crystalis 3.67 and it has been deter
ig. 6). Since the work hardening coefficient i
hardness is low.
lot of Hv versus load for DLAO crystal
: Variation of log P with log d for DLAO crys
(SHG) studies
(λ=1064 nm) with a pulse duration of 6 ns
LAO. The SHG emission was confirmed fr
ission (λ=532 nm). SHG efficiency of the g
20 30 40 50 60 70 80 90 100 110
60
70
80
90
100
110
120
H v ( K
g / m m
2 )
Load (g)
1.42 1.44 1.46 1.48 1.50 1.52 1.54 1.56 1.58 1.60 1.62
1.3
1.4
1.5
1.6
1.7
1.8
1.9
2.0
log d
php; ISSN: 2454-5422
lied and this result is
beyond the load 100
entation. The work
ined from the slope
s more than 1.6, this
al
was passed through
m the output of the
rown DLAO crystal

8/17/2019 ijcsr-volume2-issue3 special issue
http://slidepdf.com/reader/full/ijcsr-volume2-issue3-special-issue 77/164
2016; IJ
is 1.13 times that of the stan
frequency conversion.
Conclusion
Solubility studies of DL-alan
temperatures and the single c
slow evaporation method. XR
The XRD studies show that th
The presence of functional gr
mechanical strength has been
has been calculated.
Acknowledgement
The authors are thankful to the
technology, Papanamcode,
Joseph’s College (Autonom
characterization.
References
J. Badan, R. Hierle, A. Periga
(Ed.), Am Chem. Soc., Washin
M. Kitazawa, R. Higuchi, M.
L. Misoguti, A.T. Varela, F. D
Opt. Mater. 6 (1994) 147
W.S. Wang, M. D Aggarwal,
Cryst.Growth 198/199 (1999)
M. SubhaNandhini, RV. Kris
(2002) 307
R.Becker and W.Doring, Ann.
D.Turnbull and J.C. Fisher, J.
SR. 2(3): http://www.drbgrpublications.in/ijcsr.
dard KDP crystal. Thus this crystal is a p
ine oxalate (DLAO) sample has been car
ystal of this sample has been grown from
studies reveal that thestructure of DLAO cr
e crystalline perfection of the grown crystal
oups in the sample has been confirmed by
hecked for the sample and the work harden
authorities of National Institute for Interdic
rivandrum, Madurai Kamaraj University,
us), Triuchirappalli for providing instru
d, J. Zyss, Am. Chem. Soc. Symp. Ser. 23
gton, 1993
akahashi, Appl. Phys. Lett. 64 (1994) 2477
Nunes, V.S. Bagnato, F.E.A. Melo, J. Men
J. Choi, T. Gebre, A.D. Shield, B.G. Pen
78
hnakumar, K. Sivakumar, S.Natarajan, Ac
Physik, 24 (1935) 719
hem.Phys., 17 (1949) 71
php; ISSN: 2454-5422
otential material for
ied out at different
aqueous solution by
ystals is monoclinic.
is reasonably good.
FTIR analysis. The
ing coefficient value
iplinary Science and
Madurai, and St.
mental facility for
, in: D.J. Williams
desFilho, S.C, Zilio,
, D.O. Frazier, J.
taCrystalogr., E 58

8/17/2019 ijcsr-volume2-issue3 special issue
http://slidepdf.com/reader/full/ijcsr-volume2-issue3-special-issue 78/164
2016; IJ
H. Lipson, H.Steeple, “Inte
Macmillan, NewYork (1970)
Ivan Kityk, MalgorzataMakow
M. Arivanandhana, K. Sankara
N.TheresitaShanthi, P.Selvaraj
SR. 2(3): http://www.drbgrpublications.in/ijcsr.
rpretation of X-ray powder Diffraction
ska-Janusik, Mol. Cryst. Liq. Cryst. 353 (20
narayanan, P. Ramasamy, J. Crystal Growth
an, C.K. Mahadevan, Curr. Appl. Physics, 9
php; ISSN: 2454-5422
Patterns”, FifthEd,
0) 513
31 (2008) 1493
(2009) 1155

8/17/2019 ijcsr-volume2-issue3 special issue
http://slidepdf.com/reader/full/ijcsr-volume2-issue3-special-issue 79/164
2016; IJ
Volume: 2; Issue: 3 [
Synthesis and characteriza
S.G.Pushpalath
1Department of Physics, Sar2Department of Physics, Ari3Department of Physics, Adi
A semiorganic non – linear opti
using water as a solvent. The
Fourier transform infrared (F
present in the grown crysta
spectroscopy. The crystal syst
Ray diffraction analysis. And t
Key words: Semi-organic, non
Introduction
Recent research is focused on
threshold good mechanical an
growth and characterization o
crystals are grown by slow
obtained is subjected to variou
SR. 2(3): http://www.drbgrpublications.in/ijcsr.
Special Issue]; March-2016; pp 420-427. IS
ion of semi organic nonlinear optical mat
Tartrate Tetra hydrate
Gracelin1, C.Krishnan2 and P.Selvarajan3
ah Tucker College, Tirunelveli, India.
ngnar Anna College, Aralvaimozhi, India.
itanar College of Ats and Science, Tiruchendur, India.
Abstract
al crystal of ATT have been grown by slow
structural and vibrational properties of the c
IR) studies confirm the vibrations of vario
l. The optical transmittance is studied t
em and lattice parameters were determined
he solubility of the crystal is determined.
-linear, slow evaporation, X-Ray diffraction.
semi organic materials due to their large lin
d thermal stability .The present investigati
f crystal of ATT(ATT) a new semi organic
evaporation technique at room temperatur
characterization studies such as XRD,FT-I
php; ISSN: 2454-5422
N: 2454-5422
rial: Ammonium
evaporation technic
rystals were studied.
s functional groups
hrough UV visible
from the crystal X-
earity, high damage
n is focused on the
material .The ATT
e.The ATT crystals
and UV-VIS.
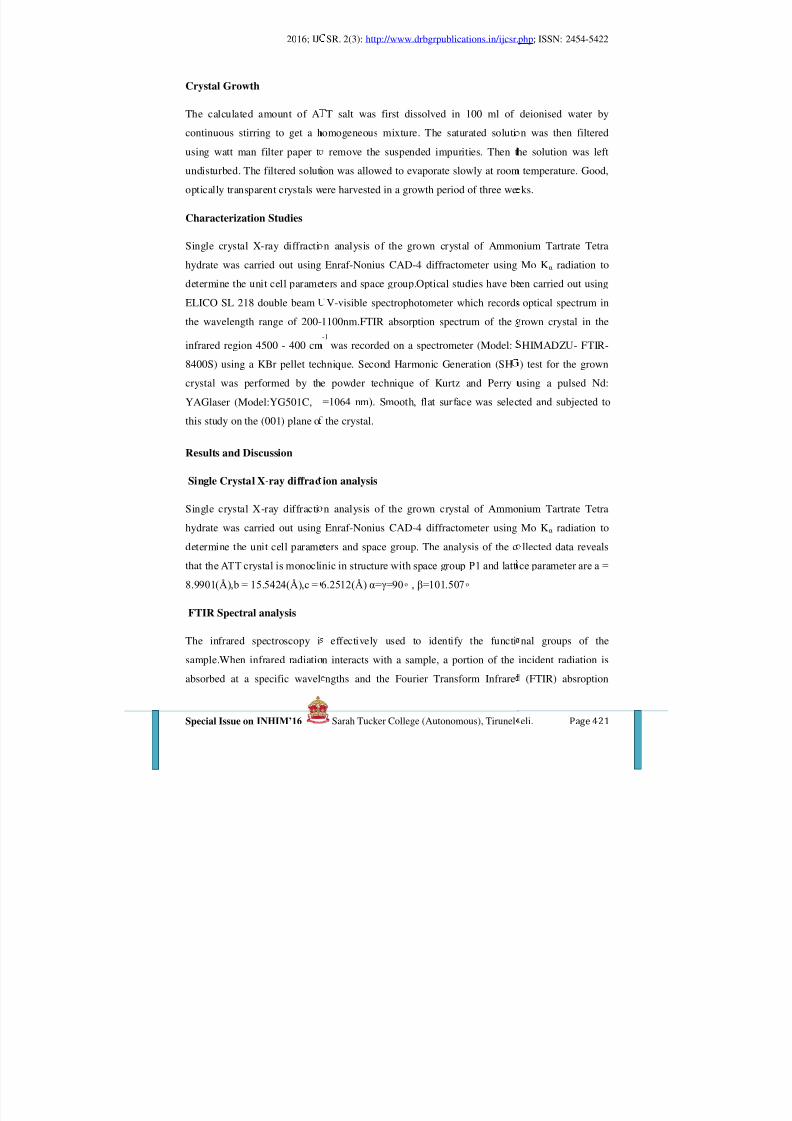
8/17/2019 ijcsr-volume2-issue3 special issue
http://slidepdf.com/reader/full/ijcsr-volume2-issue3-special-issue 80/164
2016; IJ
Crystal Growth
The calculated amount of A
continuous stirring to get a husing watt man filter paper t
undisturbed. The filtered soluti
optically transparent crystals w
Characterization Studies
Single crystal X-ray diffracti
hydrate was carried out using
determine the unit cell parame
ELICO SL 218 double beam
the wavelength range of 200-
infrared region 4500 - 400 cm
8400S) using a KBr pellet tec
crystal was performed by th
YAGlaser (Model:YG501C,
this study on the (001) plane o
Results and Discussion
Single Crystal X-ray diffrac
Single crystal X-ray diffracti
hydrate was carried out using
determine the unit cell paramethat the ATT crystal is monocli
8.9901(Å),b = 15.5424(Å),c =
FTIR Spectral analysis
The infrared spectroscopy i
sample.When infrared radiatio
absorbed at a specific wavel
SR. 2(3): http://www.drbgrpublications.in/ijcsr.
T salt was first dissolved in 100 ml of
omogeneous mixture. The saturated solutiremove the suspended impurities. Then t
on was allowed to evaporate slowly at room
ere harvested in a growth period of three we
n analysis of the grown crystal of Ammo
Enraf-Nonius CAD-4 diffractometer using
ters and space group.Optical studies have be
V-visible spectrophotometer which records
1100nm.FTIR absorption spectrum of the-1
was recorded on a spectrometer (Model:
hnique. Second Harmonic Generation (SH
e powder technique of Kurtz and Perry
=1064 nm). Smooth, flat surface was selec
the crystal.
ion analysis
n analysis of the grown crystal of Ammo
Enraf-Nonius CAD-4 diffractometer using
ters and space group. The analysis of the cnic in structure with space group P1 and latti
6.2512(Å) α=γ=90 , β=101.507
effectively used to identify the functi
n interacts with a sample, a portion of the
ngths and the Fourier Transform Infrare
php; ISSN: 2454-5422
deionised water by
n was then filtered he solution was left
temperature. Good,
ks.
nium Tartrate Tetra
Mo Kα
radiation to
en carried out using
optical spectrum in
rown crystal in the
HIMADZU- FTIR-
) test for the grown
using a pulsed Nd:
ted and subjected to
nium Tartrate Tetra
Mo Kα radiation to
llected data reveals ce parameter are a =
nal groups of the
incident radiation is
(FTIR) absroption

8/17/2019 ijcsr-volume2-issue3 special issue
http://slidepdf.com/reader/full/ijcsr-volume2-issue3-special-issue 81/164
2016; IJ
spectrum is a characteristic o
spectrum of the grown cry
spectrometer (Model: SHIMA
FTIR spectrum of cr
spectroscopic study was carri
aspects of crystals. The assi
accordance with the data r
wavenumber region between
atoms such as N – H stretchin
539cm-1 are attributed to carbo
to NH3 group. Thus, the carbo
ammonium ion in . The
vibration.The presence of ca
molecule exists in zwitter ion
FTIR analysis to analyze the p
assignments of crystal ar
Fig 1 FTIR Graph
Fig(1) FTIR Spectra Of Am
4000 3500 3000 2500
40
50
60
70
80
90
100
( T )
waven
3 7 8 8 . 8
9
3 4 5 3 . 0
4
3 2 6 4 . 3
2
2 9 1 5 . 6
8
2 7 4 1 . 3
5 2 3 7 8 . 3
2
FTI0 2 4
SR. 2(3): http://www.drbgrpublications.in/ijcsr.
functional groups of molecules in a samp
tal in the infrared region 4500 - 400 cm-1
DZU- FTIR-8400S) using a KBr pellet tech
stal is presented in the figure 1. The
d out with a view of obtaining an insigh
nments for absorption bands of infrared s
ported in the literature.The broad enve
238 and 2700cm-1 was due to hydrogen in
of NH2 and C – H of CH2 stretching. Th
xylate groups while the peaks absorbed at 61
yl group is present as carboxylate ion and a
peaks observed at 827 cm-1 are assigned
rboxylate and ammonium ion clearly indi
ic form in crystal. The grown crystal
resence of functional groups. The observed
given.
onium Tartrate Tetrahydrate.
2000 1500 1000 500
umber (cm-1)
.
2 2 8 3 . 9
6
.
2 0 4 2 . 4
7
1 9 0 8 . 1
2
1 7 4 8 . 2
0
1 5 9 9 . 4
6
1 5 3 2 . 2
9
1 1 5 6 . 4
6 9 4 2 . 1 5
9 1 4 . 9
7
6 8 6 . 2
7
6 8 10
0
2
4
6
8
10
php; ISSN: 2454-5422
le. FTIR absorption
was recorded on a
nique. The recorded
present vibrational
t into the structural
ectra were given in
lope in the higher
teraction with other
bands observed at
2 cm-1 are attributed
mino group exists as
to C-C-N stretching
cates that the ATT
s were subjected to
requencies and their
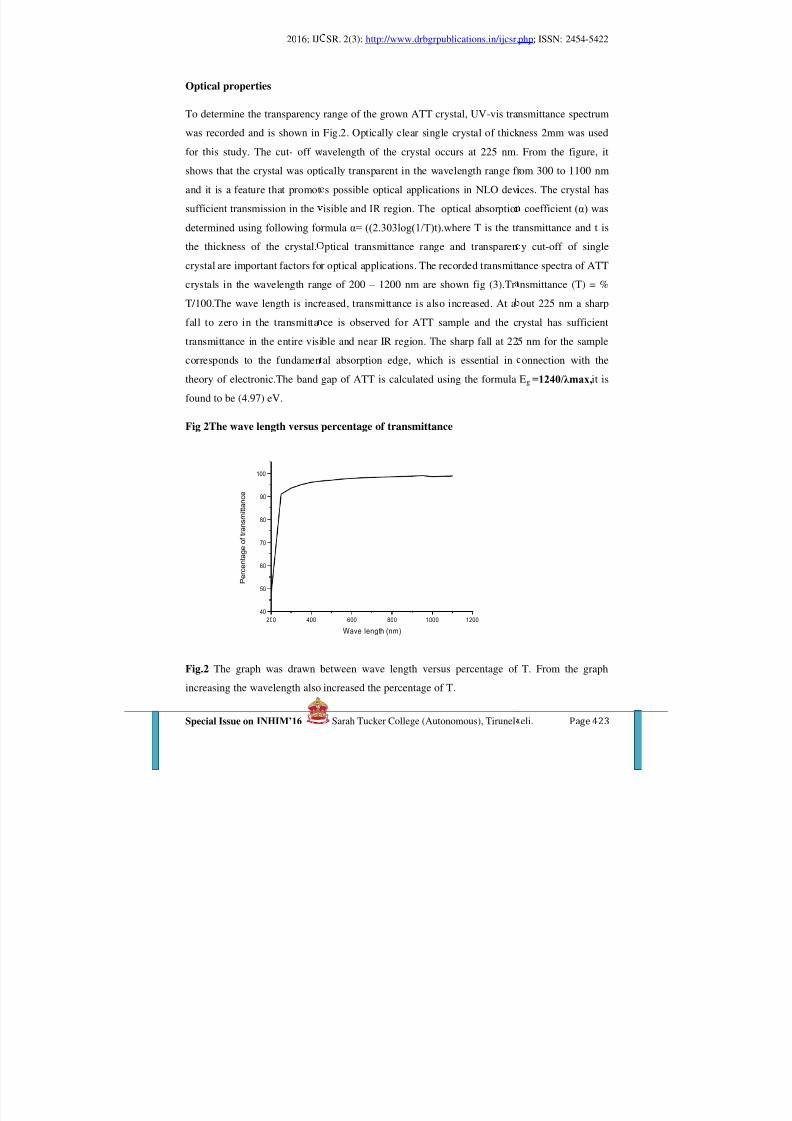
8/17/2019 ijcsr-volume2-issue3 special issue
http://slidepdf.com/reader/full/ijcsr-volume2-issue3-special-issue 82/164
2016; IJ
Optical properties
To determine the transparency
was recorded and is shown infor this study. The cut- off w
shows that the crystal was opt
and it is a feature that promot
sufficient transmission in the
determined using following fo
the thickness of the crystal.
crystal are important factors fo
crystals in the wavelength ran
T/100.The wave length is incr
fall to zero in the transmitta
transmittance in the entire visi
corresponds to the fundamen
theory of electronic.The band
found to be (4.97) eV.
Fig 2The wave length versus
Fig.2 The graph was drawn
increasing the wavelength also
200 400
40
50
60
70
80
90
100
P e r c e n t a g e o f t r a n s m i t t a n c e
SR. 2(3): http://www.drbgrpublications.in/ijcsr.
range of the grown ATT crystal, UV-vis tra
Fig.2. Optically clear single crystal of thickavelength of the crystal occurs at 225 nm.
ically transparent in the wavelength range fr
s possible optical applications in NLO dev
isible and IR region. The optical absorptio
rmula α= ((2.303log(1/T)t).where T is the tr
ptical transmittance range and transparen
r optical applications. The recorded transmitt
ge of 200 – 1200 nm are shown fig (3).Tr
eased, transmittance is also increased. At a
ce is observed for ATT sample and the c
ble and near IR region. The sharp fall at 22
al absorption edge, which is essential in
gap of ATT is calculated using the formula
percentage of transmittance
between wave length versus percentage of
increased the percentage of T.
600 800 1000 1200
Wave length (nm)
php; ISSN: 2454-5422
nsmittance spectrum
ness 2mm was used From the figure, it
om 300 to 1100 nm
ices. The crystal has
coefficient (α) was
ansmittance and t is
y cut-off of single
ance spectra of ATT
nsmittance (T) = %
out 225 nm a sharp
rystal has sufficient
5 nm for the sample
onnection with the
Eg =1240/λmax,it is
T. From the graph

8/17/2019 ijcsr-volume2-issue3 special issue
http://slidepdf.com/reader/full/ijcsr-volume2-issue3-special-issue 83/164
2016; IJ
Fig.3 The Wavelength Verse
Fig 3 The absorbance wave le
is increased.
Fig 4 Wave length ve
The graph was plotted betwe
relation is given by Reflect
reflectance is decreased also th
200 400
0.00
0.05
0.10
0.15
0.20
0.25
0.30
0.35
a b s o r b a n c e ( A )
200 400
0.00
0.05
0.10
0.15
0.20
R e f l e c t a n c e ( R )
SR. 2(3): http://www.drbgrpublications.in/ijcsr.
s the Absorbance
ngth is 249nm.The absorbance is decreased,
rsus Reflectance
en Wave length (λ) andReflection(R) as s
ance(R)=1-(T+A).The Reflectance wavele
e wavelength is increased.
600 800 1000 1200
avelength in nm
600 800 1000 1200
Wave length (nm)
php; ISSN: 2454-5422
also the wave length
hown in fig (4)The
ngth is 249nm.The

8/17/2019 ijcsr-volume2-issue3 special issue
http://slidepdf.com/reader/full/ijcsr-volume2-issue3-special-issue 84/164
2016; IJ
Fig 5 Wave length v
. The dependenc
study the band structure and
also the wave length is increas
Fig 6 Wave length v
The refractive index (n) can b
The plot between wavelength
200 400 6
0.00
0.05
0.10
0.15
0.20
A b s o r p t i o n c o e f f i c i e n t (
W
200 300 400 500 600
1.0
1.2
1.4
1.6
1.8
2.0
2.2
2.4
2.6
2.8
R e f r a c t i v e i n d e x ( n )
Wave length
SR. 2(3): http://www.drbgrpublications.in/ijcsr.
ersus absorption coefficient
of optical absorption coefficient with the ph
he type of transition of electrons.The abso
d.
ersus refractive index
determined from reflectance data using n=
nd refractive index (n) of ATT crystal is sh
00 800 1000 1200
ave length (nm)
700 800 900 1000
(nm)
php; ISSN: 2454-5422
oton energy helps to
rbance is decreased;
(1+ )/(1 − √ ).
wn in fig (6). From

8/17/2019 ijcsr-volume2-issue3 special issue
http://slidepdf.com/reader/full/ijcsr-volume2-issue3-special-issue 85/164
2016; IJ
the fig (6) it is observed that
refractive index (n) of the ATT
Fig 7 Photon of energy vers
The plot of variation of (αh ν)2
plot and it is used to find out
by the extrapolation of the line
wide bandgap,the grown cryst
Conclusion
Semi organic crystals of ATT
diffraction study shows the cr
confirms the functional grou
reveals that ATT crystals ar
transparency of about 90% wigood optical transparency an
potential candidates for NLO a
Acknowledgements
The authors are grateful to th
Anna College, Nagercoil and
encouragement given to us to
staff members of St. Jose
1 2 3
0
5
10
15
20
25
( a h v ) ^ 2
SR. 2(3): http://www.drbgrpublications.in/ijcsr.
the refractive index decreases with increas
crystal is 1.57 at 297nm.
us (αhν)2
versus h ν is shown in fig (10).This plot is
the accurate optical band gap value.The ban
ar part and the value is found to be 4.97eV.
l has large transmittance in the visible regio
as grown from slow evaporation technique.
stal belongs to monoclinic crystal system.
s present in the grown crystal. UV-Visi
optically transparent in the entire uv-vi
th a lower cut off wavelength at 225 nm.d reasonably good NLO properties, these
pplications.
e managements of Sarah Tucker College,
Aditanar College of Arts and Science,
carry out the research work. Also the author
h’s College, Trichy, Cochin University,
4 5 6 7
hv
4 . 9
7
php; ISSN: 2454-5422
ing wavelength.The
known as the Tauc’s
gap was evaluated
As a consequence of
.
Single crystal X-ray
he FT-IR spectrum
le spectral analysis
ible range and has
s ATT crystal have materials could be
Tirunelveli, Arignar
iruchendur for the
s are thankful to the
Cochin, Crescent

8/17/2019 ijcsr-volume2-issue3 special issue
http://slidepdf.com/reader/full/ijcsr-volume2-issue3-special-issue 86/164
2016; IJ
Engineering College, Chennai
experimental work.
References
G.Albrecht, R.B.Corey, J.Am.
E.Ramachandran, K.Baskaran
K. Srinivasan, J. Arumugam
Y. Iitaka, Acta Crystallogr. 11
Jan Baran , Henryk Ratajczak ,
T. Balakrishnan, R. Ramesh B
P.Selvarajan , J.Glorium Arul
R.W. Williams J. Molecular S
A. Dawson, D.R. Allan, S.A.
C.R.Pulham, L. Sawyer, Cryst.
Charles J,Pouchert, The Aldric
Company,INC,Milwaukee,Wis
P.Kalsi , Spectroscopy of Orga
J.C.Anderson, Dielectrics, Cha
J.B.Birks, J. Hart, Progress in
B.Helina, P Selvarajanand A S
1K.V. Rao, A. Samakula, J. A
E.M. Onitsch, uber die mikroh
S.K. Kurtz, T.T. Perry, J. Appl
SR. 2(3): http://www.drbgrpublications.in/ijcsr.
, VIT, Vellore, IIT, Madras, who helped
Chem. Soc.61 (1939) 1087
, S. Natarajan Cryst. Res. Technol. 42(2007)
ptical Materials 30 (2007) 40
(1958) 225
pectrochimica Acta Part A 61 (2005) 1611
bu, K. Ramamurthi Spectrochimica Acta Pa
aj, S.Perumal, J. Crystal Growth 311 (2009)
tructure (Theochem) 685 (2004) 101
elmonte, S.J. Clark, W.I.F. David, P.A.McG
Growth Des. 5 (2005)1415
h library of Infrared Spectra, Third Edn., Ald
consin (1981)
nic Compounds, Wiley Eastern, New Delhi(
pman and Hall, London, (1963)
ielectrics, Heywood, London(1959)
J Lucia Rose, Phys. Scr. 85 (2012) 055803
pl. Phys. 36 (1965) 2031
arte der metalle, Mikroscopia 2 (1947) 131
. Phys. 39 (1968) 3798
php; ISSN: 2454-5422
us to carry out the
73
rt A 69 (2008) 1114
3835
regor, S.Parsons,
rich Chemical
985)

8/17/2019 ijcsr-volume2-issue3 special issue
http://slidepdf.com/reader/full/ijcsr-volume2-issue3-special-issue 87/164
2016; IJ
Volume: 2; Iss
Studies on the Mechanical
1 Department of Physics, Sarah Tuck
2Physics Research Centre, S.T. Hind
Amino acids contain proton d
favorable pH, the natural ami
group and positively charged
nonpolar and aliphatic amino
proteins. It is not chiral and c
minimal side chain of only o
properties of crystals, here an
The dopant sulphamic acid is
Pbca, which is centrosymmcentrosymmetric crystals do n
crystals GSA had been harve
spectral analysis had been ca
harmonic nonlinear optical stu
Keywords: Single crystal X
analysis, TG-DTA, SHG effici
SR. 2(3): http://www.drbgrpublications.in/ijcsr.
ue: 3 [Special Issue]; March-2016; pp 428-4
and Thermal Properties of Sulphamic Aci
NLO Single Crystals
A. Effie Cordelia1 and S. Perumal2
r College, Tirunelveli, India.
College, Nagercoil, India.
Abstract
nor carboxylic group and proton acceptor a
o acids exist as zwitterions with a negative
amino group. Among these, Glycine (H
cid. It is also the smallest of 20 amino acids
an fit into hydrophilic and hydrophobic env
e carbon atom. As doping can alter the ph
ttempt was made to dope Glycine crystals
classical inorganic compound which crysta
tric. According to the theoretical cont show SHG. But it was fruitful indeed, as
ted as a result of doping. X-ray diffractio
ried out. Thermal stability, hardness studi
ies of the crystals were reported in this work
RD, Powder XRD, FTIR Spectrum, Vic
ncy, Third harmonic nonlinear optical para
php; ISSN: 2454-5422
8. ISSN: 2454-5422
d Doped Glycine
mino group. Thus at
ly charged carboxyl
N2CH2COOH) is a
commonly found in
ironments due to its
ysical and chemical
ith sulphamic acid.
llizes in space group
ept of SHG, the a novel NLO single
analysis and FTIR
s, second and third
.
er’s microhardness
eters
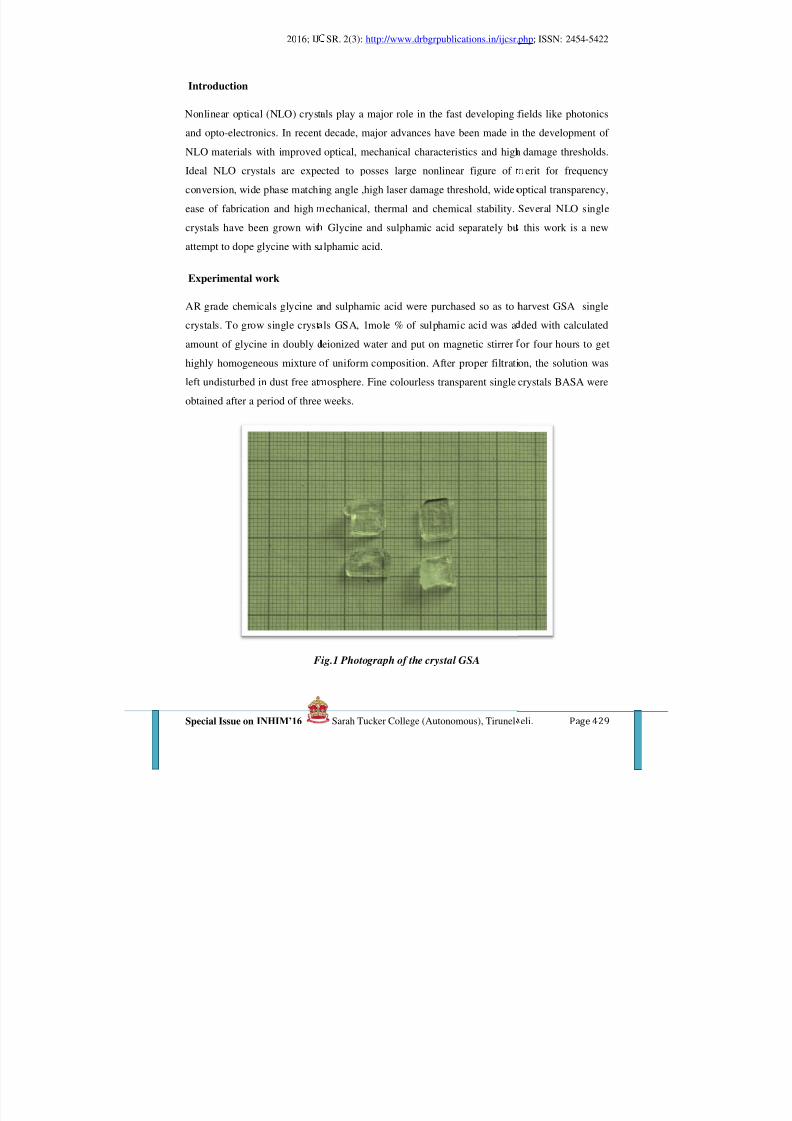
8/17/2019 ijcsr-volume2-issue3 special issue
http://slidepdf.com/reader/full/ijcsr-volume2-issue3-special-issue 88/164
2016; IJ
Introduction
Nonlinear optical (NLO) cryst
and opto-electronics. In recentNLO materials with improved
Ideal NLO crystals are expe
conversion, wide phase matchi
ease of fabrication and high
crystals have been grown wit
attempt to dope glycine with s
Experimental work
AR grade chemicals glycine a
crystals. To grow single cryst
amount of glycine in doubly d
highly homogeneous mixture
left undisturbed in dust free at
obtained after a period of three
F
SR. 2(3): http://www.drbgrpublications.in/ijcsr.
als play a major role in the fast developing
decade, major advances have been made inoptical, mechanical characteristics and high
cted to posses large nonlinear figure of
ng angle ,high laser damage threshold, wide
echanical, thermal and chemical stability.
Glycine and sulphamic acid separately bu
lphamic acid.
nd sulphamic acid were purchased so as to
ls GSA, 1mole % of sulphamic acid was a
eionized water and put on magnetic stirrer
f uniform composition. After proper filtrati
osphere. Fine colourless transparent single
weeks.
ig.1 Photograph of the crystal GSA
php; ISSN: 2454-5422
fields like photonics
the development of damage thresholds.
erit for frequency
optical transparency,
Several NLO single
this work is a new
harvest GSA single
ded with calculated
or four hours to get
on, the solution was
crystals BASA were

8/17/2019 ijcsr-volume2-issue3 special issue
http://slidepdf.com/reader/full/ijcsr-volume2-issue3-special-issue 89/164
2016; IJ
Results and discussion
Single Crystal XRD analysis
The crystals GSA were analy
Nonius MACH3/CAD4 singl
tabulated as below:
Sample System
GSA Monoclinic
For GSA, the value of = 111.
Powder XRD analysis
Powder XRD patterns of the
advance diffractometer with
powder. The sample was scan
are given in fig.2. The unit ce
index the reflecting planes. In
diffraction patterns which in
variation in the intensity of dif
the dopant sulphamic acid into
SR. 2(3): http://www.drbgrpublications.in/ijcsr.
ed for cell parameter values with compute
e crystal X-ray diffractometer and the
Table 1 Cell parameter values of GSA
a( ) b( ) c(
5.14 12.01 5.
77
grown crystals GSA was recorded using
uK (=1.5418Å) radiation after crushing
ed over the range 0-800 at the rate of 2 per
ll parameters determined from single crysta
the figure, we can notice the appearance o
icate the good crystalline nature of the
fracted beam at different planes accounts for
the host lattice.
ig.2 Powder XRD pattern of GSA
php; ISSN: 2454-5422
r controlled Bruker-
btained results are
) V( )
5 315
BRUKER AXS D8
the sample into fine
minute. The patterns
l XRD were used to
f sharp peaks in the
rown crystals. The
the incorporation of

8/17/2019 ijcsr-volume2-issue3 special issue
http://slidepdf.com/reader/full/ijcsr-volume2-issue3-special-issue 90/164
2016; IJ
Fourier Transform Infrared (
FTIR absorption spectra of t
recorded on a Lambda 35 specfigures 3. The absorption band
Table
Wave num317300289261227212
16115114013211110389696050
SR. 2(3): http://www.drbgrpublications.in/ijcsr.
TIR) spectral studies
he grown crystals in the infrared region
trophotometer using a KBr pellet technique as/peaks and their assignments are given in th
Fig.3 FTIR spectrum of GSA
2 Spectral assignments of sample GSA
er (cm- ) Spectral assignments3996
2
58821
NH3+ stretching
NH3+ stretching
C-H stretchingN-H-O stretchingN-H stretchingCombination band
C=O stretchingN-H bendingCOO- symmetric stretchCH2 twistingC-C stretchingC-C-N stretching(SO4)2 stretchingN-S stretchingCOO- waggingCOO- rocking
php; ISSN: 2454-5422
000-400 cm-1 were
nd it is shown in the table 2.
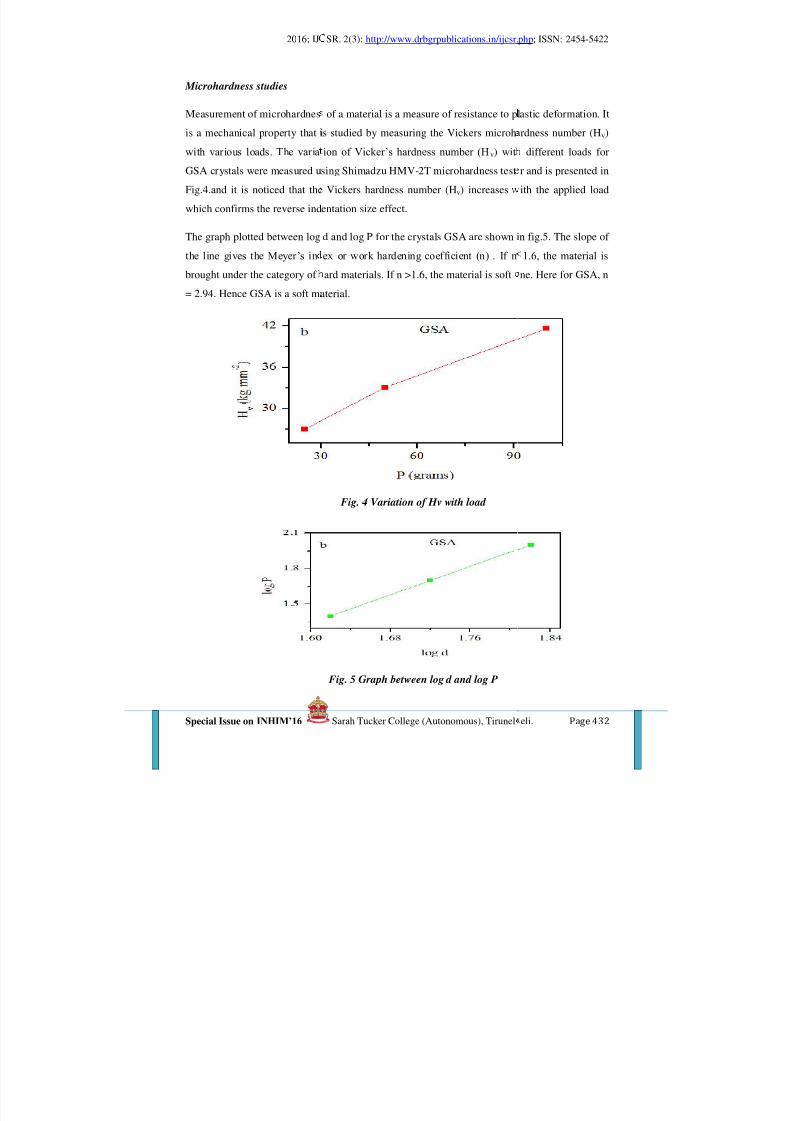
8/17/2019 ijcsr-volume2-issue3 special issue
http://slidepdf.com/reader/full/ijcsr-volume2-issue3-special-issue 91/164
2016; IJ
Microhardness studies
Measurement of microhardnes
is a mechanical property that iwith various loads. The varia
GSA crystals were measured u
Fig.4.and it is noticed that the
which confirms the reverse ind
The graph plotted between log
the line gives the Meyer’s in
brought under the category of= 2.94. Hence GSA is a soft m
SR. 2(3): http://www.drbgrpublications.in/ijcsr.
of a material is a measure of resistance to pl
s studied by measuring the Vickers microhion of Vicker’s hardness number (Hv) wit
sing Shimadzu HMV-2T microhardness test
Vickers hardness number (Hv) increases
entation size effect.
d and log P for the crystals GSA are shown i
ex or work hardening coefficient (n) . If n
ard materials. If n >1.6, the material is softaterial.
Fig. 4 Variation of Hv with load
Fig. 5 Graph between log d and log P
php; ISSN: 2454-5422
astic deformation. It
rdness number (Hv) different loads for
r and is presented in
ith the applied load
n fig.5. The slope of
1.6, the material is
ne. Here for GSA, n

8/17/2019 ijcsr-volume2-issue3 special issue
http://slidepdf.com/reader/full/ijcsr-volume2-issue3-special-issue 92/164
2016; IJ
Fig.6 Plot of yield str
and brittleness index as functi
Table 3 Calculated me
SR. 2(3): http://www.drbgrpublications.in/ijcsr.
ngth, elastic stiffness constant, fracture to
on of load
hanical parameters of GSA
php; ISSN: 2454-5422
ughness coefficient
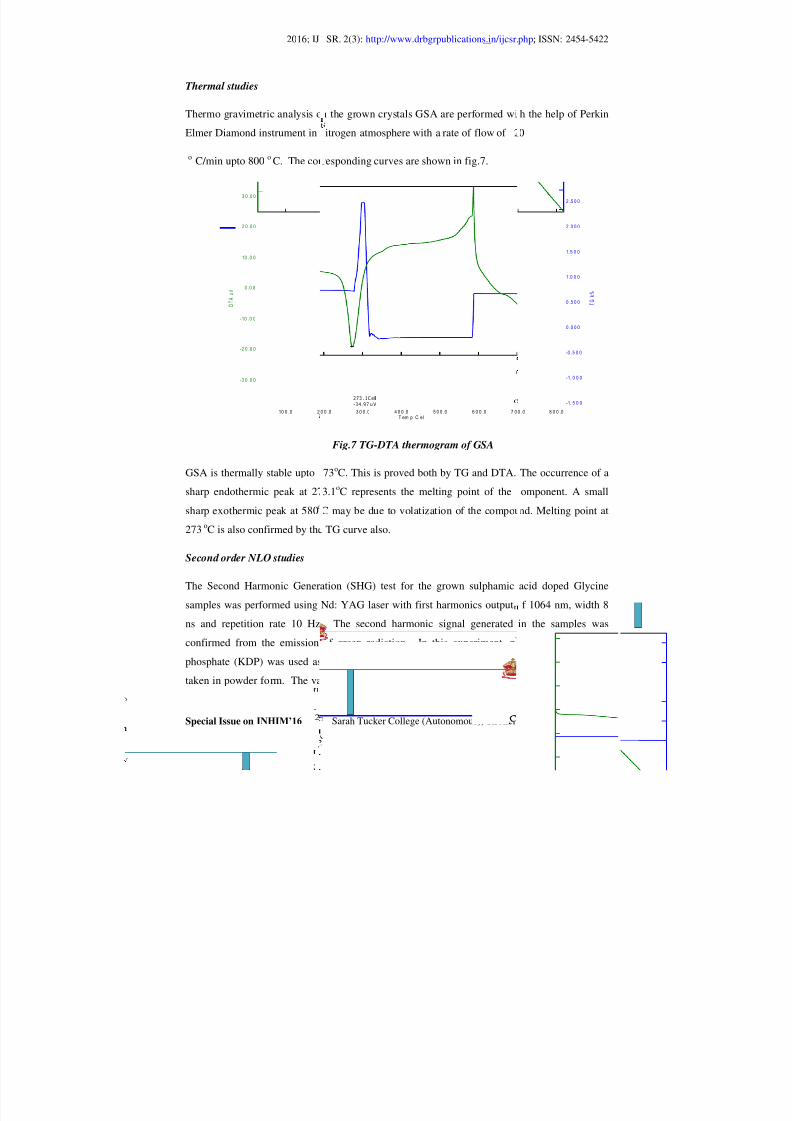
8/17/2019 ijcsr-volume2-issue3 special issue
http://slidepdf.com/reader/full/ijcsr-volume2-issue3-special-issue 93/164
2016; IJ
Thermal studies
Thermo gravimetric analysis o
Elmer Diamond instrument ino C/min upto 800 o C. The cor
GSA is thermally stable upto
sharp endothermic peak at 27
sharp exothermic peak at 580o
273 oC is also confirmed by the
Second order NLO studies
The Second Harmonic Gener
samples was performed using
ns and repetition rate 10 Hz.
confirmed from the emission
phosphate (KDP) was used as
taken in powder form. The va
210 0 .0
D T A u
V
3 0 .0 0
2 0 .0 0
10 .0 0
0 .0 0
-10 .0 0
-2 0 .0 0
-3 0 .0 0
l
SR. 2(3): http://www.drbgrpublications.in/ijcsr.
n the grown crystals GSA are performed wi
itrogen atmosphere with a rate of flow of 2
responding curves are shown in fig.7.
Fig.7 TG-DTA thermogram of GSA
73oC. This is proved both by TG and DTA.
3.1oC represents the melting point of the
C may be due to volatization of the compou
TG curve also.
ation (SHG) test for the grown sulphamic
Nd: YAG laser with first harmonics output
. The second harmonic signal generated
of green radiation. In this experiment, p
the reference. Both the reference material
lues of SHG relative efficiency of the grow
T em p C el7 06 0 0 .05 0 0 .04 0 0 .03 0 0 .00 0 .0
2 7 3 . 1 C e l
- 3 4 . 9 7 u V
php; ISSN: 2454-5422
h the help of Perkin
0
The occurrence of a
omponent. A small
nd. Melting point at
acid doped Glycine
f 1064 nm, width 8
in the samples was
tassium dihydrogen
and the samples are
crystals BASA and
8 0 0 .00 .0
T G
k %
2 .5 0 0
2 .0 0 0
1.5 0 0
1.0 0 0
0 .5 0 0
0 .0 0 0
-0 .5 0 0
-1. 0 0 0
-1. 5 0 0l

8/17/2019 ijcsr-volume2-issue3 special issue
http://slidepdf.com/reader/full/ijcsr-volume2-issue3-special-issue 94/164
2016; IJ
GSA with reference to KDP
NLO property of the samples.
applications. Due to the pres
polarizability of the molecules,
Tab
Z-Scan analysis
Third order nonlinear optical
technique. The magnitude a
absorption coefficient (β) of t
(OA) and closed aperture (CA
nonlinear absorption coefficie
experiment, Gaussian laser
direction has been taken as Z
using a convex lens and the fo
(CW) laser light 632.8 nm
optically polished 1mm thick
and the energy transmitted by
transmittance for the position
calculate the third order nonlin
is the signature for nonlinearit
SR. 2(3): http://www.drbgrpublications.in/ijcsr.
re tabulated in the table 4. The powder S
This shows that doped crystals will be better
nce of dopant into the crystal lattice, the
which tends to increase the SHG efficiency.
le 4 Value of relative SHG efficiency
Sample
Relative
SHG
Efficiency
GSA 0.613
property of the grown crystals GSA was
d sign of the nonlinear refractive index
e crystals were calculated from Z-scan dat
) Z-scan methods are used for the simultane
nt and nonlinear optical refraction for optic
eam was used for molecular excitation
– axis of the optically polished crystal. Th
al point was taken as Z=0. The monochrom
ith power 3.13 MW beam from He-Ne l
rystal was fixed in the travel range of 25 m
the sample were measured using a power m
d crystal was measured at different positi
ear optical property of the crystal. The peak
of the material.
php; ISSN: 2454-5422
G test confirms the
candidates for NLO
re is an increase in
studied by Z-scan
(n2) and nonlinear
. The open aperture
ous measurement of
al materials. In this
and its propagation
beam was focused
tic continuous wave
aser was used. The
m. The input energy
ter. The normalized
ns and was used to
followed by a valley

8/17/2019 ijcsr-volume2-issue3 special issue
http://slidepdf.com/reader/full/ijcsr-volume2-issue3-special-issue 95/164
2016; IJ
The Z-scan curves in closed a
Table 5 Third
Sample n2
10-12 cm2 /W
GSA 4.546
SR. 2(3): http://www.drbgrpublications.in/ijcsr.
d open aperture modes are illustrated in fig.
ig.9 Closed aperture Z-scan curve
harmonic nonlinear optical parameters of
β
10-6 cm/W
R.P of χ(3)
10-10
I.P of χ
10-10
1.081 7.904 9.465
Fig.8 Open aperture Z-scan curve
php; ISSN: 2454-5422
and fig.9
SA
(3) χ(3)
10-9 e.s.u
1.233

8/17/2019 ijcsr-volume2-issue3 special issue
http://slidepdf.com/reader/full/ijcsr-volume2-issue3-special-issue 96/164
2016; IJ
The values of third order nonli
the crystals GSA are given in t
the self defocusing nature of t
have saturable absorption. Thu
have now become transparent
Conclusion
Novel sulphamic acid doped
evaporation solution growth
colourless and transparent wi
studies reveal that GSA belogood crystalline nature of th
reflecting peaks. FTIR studies
functional groups present in t
from Vickers’s hardness analy
these materials are ideal can
evident that GSA has 0.613 ti
refractive index of the dopednight vision sensor devices.
absorption by the candidates
especially the self defocusing
and photonic devices.
Reference
1. D.S. Chemla and J.Z Crystals, Vol 1,2, Acad
2. H.S. Nalwa, Hand Bo
Devices, Vol.9, Acade
Kumararaman, Materia
3. Thaila T, Kumararam
Biomolecular Spectros
SR. 2(3): http://www.drbgrpublications.in/ijcsr.
near refractive index, absorption coefficient
able 5. The negative value of nonlinear refra
he crystals and nonlinear absorption value t
s the materials which are opaque to a smalle
hen a large number of photons are incident
NLO single crystals GSA were successf
method at room temperature. The crysta
th well defined external appearance. Singl
gs to monoclinic system. Powder XRD ane samples and the planes responsible fo
are utilized to identify the modes of vibrat
e crystals. The crystals belong to the categ
sis. GSA is stable upto 273 oC. Hence belo
idates for device fabrication. From SHG
es SHG efficiency of KDP. The negative t
crystals makes them prominent materials fhe open aperture transmittance data con
. The promising third order NLO proper
ature suggest their suitability for applicatio
ss, Nonlinear Optical Properties of Orgemic press, Orlanto (1987)
ok of Advanced Electronic and Photonic
ic press, New York (2001). R. Valluvan,
ls Chemistry and Physics, 97 (2006) 81
an S. Spectrochimica Acta Part A:
opy, 82 (2011) 20
php; ISSN: 2454-5422
nd susceptibility for
ctive index indicates
ells that the crystals
r number of photons
on it.
lly grown by slow
ls are found to be
e crystal diffraction
alysis elucidates the the occurrence of
ion and the possible
ry of soft materials
these temperatures,
measurement, it is
hird order nonlinear
r protection optical irmed the saturable
ties of the crystals
s in optical limiting
nic Molecules and
Materials and
. Selvaraju, S.
olecular and
8/17/2019 ijcsr-volume2-issue3 special issue
http://slidepdf.com/reader/full/ijcsr-volume2-issue3-special-issue 97/164
2016; IJ
4. Samson Yesuvadian,
Bhagavannarayana Go
Optik – Int. J. for Light
5. Lipson H, Steeple H,
edition, Macmillan, Ne
6. A.L. Smith, Applied In
7. P.R. Griffiths, J.A. De
Chichester (1986)
8. P.J. Haines, Thermal M
9. M.I. Pope, M.D. Judd,
10. www.wordftest.com/ m
11. http://www.gordonengl
12. S. Ishwar Bhat, P.
Characterization of ne
236 (2002) 318
13. C. Balarew, R. Dehlew ,
ligand co-ordination in
14. Sahadevan Suresh, Stu Lithium Potassium
Phy.(2013)8,0006
15. S.K. Bachav, N.S. Pati
of Cobalt doped Bariu
and App.,4,8,(2014),10
16. D. Jaishree, G. Kanc
thermal properties ofPhy.,(2014)
17. R. DeSalvo, N. Sheik-
refraction and absorpti
SR. 2(3): http://www.drbgrpublications.in/ijcsr.
Anbarasu Selvaraj, Martina Mejeba Xavi
davarti, Vijayan Narayanasamy, Prem An
and Electron Optics, 126 (2015) 95
Interpretation of X-ray Powder Diffracti
w York, (1970)
rared Spectroscopy 2nd edition, Holden-Day
Hoseth, Fourier Transform Infrared Spectr
ethods of Analysis, Blackie, London (1995)
ifferential Thermal Analysis, Heyden, Phila
icrohardness test
and.co.uk/hardness/vickers.html.
ohan Rao, V. Upadyaya and H.S. Na
nonlinear optical mixed borate crystals, Jo
, Application of hard and soft acids and bas
double salt structures, Jour. Solid State Che
ies on growth, microhardness and dielectri
ulphate NLO single crystals, The A
l, M.S. Kale, D.S. Bhavsar, Crystal growth
Tartarate crystals by Silica Gel Method, I
8
ana, R. Kesavasamy, Investigations on
Sulphamic acid single crystals, Advances
Bahae et al, Z-scan measurements of the ani
on in crystals, Optics Letters,Vol.18,no.3,19
php; ISSN: 2454-5422
er Methodius,
nd Devarajan,
n Pattern, 5th
(1977)
scopy, Wiley,
delphia (1997)
araja, Growth and
ur. of Crys. Growth,
s concept to explain
m.,55,1(1984)1
characterization of
frican Review of
nd characterization
t. Jour. of Eng. Res.
rowth, optical and
in Conden. Matter
sotropy of nonlinear

8/17/2019 ijcsr-volume2-issue3 special issue
http://slidepdf.com/reader/full/ijcsr-volume2-issue3-special-issue 98/164
2016; IJ
Volume: 2; Iss
Electrical conductivity me
M.P.Ra
1Department of Physics, Sarah Thuc
2P.G and Research Department of Ph
*Corresponding Author Email Id : tk
Crystals are the unacknowled
be no electronic industry, no p
is an interdisciplinary subje
engineering, metallurgy, cryst
growing interest on crystal gr
materials for technological ap
crystals have been grown by
characterization have been stusynthesize crystals which are
KH2PO4 (KDP) continues to
KDP is a representative of hyd
and nonlinear optical propert
interesting properties, we mad
in various concentrations (0.0
crystals were collected after 1electrical conductivity(resistan
different frequencies of pure a
to 1200Cusing simple two pro
electrical conductivity increase
doped KDP crystals were sligh
Keywords: KDP, NiSO4
SR. 2(3): http://www.drbgrpublications.in/ijcsr.
ue: 3 [Special Issue]; March-2016; pp 439-4
surements of pure and nickel sulphate do
grown by gel medium
eela1, Vinu Bharathi2 and T. Asaithambi2*
er College For Women, Thirunelveli, India.
ysics, Alagappa Govt. Arts College, Karaikudi, India.
Abstract
ed pillars of modern technology. Without
hotonic industry, no fiber optic communicat
ct covering physics, chemistry, material
llography, mineralogy, etc. In past few deca
wth processes, particularly in view of the i
plications. Optically good quality pure an
icrobial free gel growth method at room t
ied. Gel method is a very simple method ahaving low solubility. Potassium dihydro
be an interesting material both academica
rogen bonded materials which possess very
ies in addition to interesting electrical pro
an attempt to grow pure and nickel sulphat
2, 0.004, 0.006, 0.008 and 0.010) using gel
5 days. We get crystals with good qualityce, capacitance and dielectric constant) val
d nickel sulphate added crystal with a tempe
be setup with Q band digital LCR meter pre
s with increase of temperature. The dielectri
tly decreased compared to pure KDP crystals
php; ISSN: 2454-5422
6. ISSN: 2454-5422
ed KDP crystals
rystals, there would
ions. Crystal growth
science, chemical
es, there has been a
creasing demand of
metal doped KDP
mperature and their
d can be utilized to gen orthophosphate
lly and industrially.
good electro – optic
perties. Due to this
doped kdp crystals
method. The grown
and shaped. The dc e were measured at
rature range of 400C
sent in our lab. The
c constants of metal
.

8/17/2019 ijcsr-volume2-issue3 special issue
http://slidepdf.com/reader/full/ijcsr-volume2-issue3-special-issue 99/164
2016; IJ
Introduction
Potassium dihydrogen orthoph
both academically and industwhich possess very good electr
electrical properties. The dem
the application as frequency c
electric property of KDP cry
frequency stabilizers in electro
The excellent properties of K
resistance to damage by lacombination with reproducible
applications such as laser fusi
studies on the growth and pro
reported [3 - 4]. Potassium di
scientists due to its excellent
Microscopically, crystal growt
which are all related to the co
KDP, ADP and DKDP are the
to their exclusive properties.
electrical properties, optical tra
Materials and Methods
Pure and NiSO4 doped KDP si
analar grade KDP and NiSO4
dopant and sodium meta silica
room temperature figure (1).
damaging the cell surface .Wh
This induces nucleation and t
was carried out at room tempe
doped KDP crystals. Pure and
SR. 2(3): http://www.drbgrpublications.in/ijcsr.
osphate (KDP) KH2PO4 continues to be an
rially. KDP is a representative of hydrogeo – optic and nonlinear optical properties in a
nd for high quality large single crystals of
nversion crystal in inertial confinement fus
stal makes it useful for the construction o
ic circuit’s .
DP include transparency in a wide region
ser radiation and relatively high non- ligrowth to large size. Therefore, it is comm
on, electro-optical modulation and frequenc
perties of KDP crystals in the presence of i
hydrogen phosphate (KDP) crystal draws p
quality and possibility of growing large- s
h includes crystal morphology, crystal defe
stituent growth units and their chemical bon
only nonlinear crystal currently used for th
he grown crystals were characterized usin
nsmittance, for pure and NiSO4 doped KDP
ngle crystals are grown in sodium meta silica
ith in concentrations of 0.002, 0.004, 0.006
te (1.08g/cm3 ). During the process pH was
thyl alcohol of equal volume is added ove
en the alcohol diffuses into the set gel, it re
e nuclei are grown into the single crystals.
rature. The growth period was about 20 days
KDP doped crystals are shown in the fig (2).
php; ISSN: 2454-5422
interesting material
n bonded materials dition to interesting
DP increase due to
ion [1-2]. The piezo
f crystal filters and
of optical spectrum,
near efficiency, in only used in several
y conversion. Many
mpurities have been
rsistent attention of
ize crystals [5 - 6].
ts, and growth rate,
ding process [7 - 8].
ese applications due
dielectric constant,
rystals.
te gel medium using
, 0.008 and 0.010 of
maintained at 5-6 at
the set gel without
duces the solubility.
The crystal growth
for pure and NiSO4

8/17/2019 ijcsr-volume2-issue3 special issue
http://slidepdf.com/reader/full/ijcsr-volume2-issue3-special-issue 100/164
2016; IJ
Figure.1 Growth of pu
SR. 2(3): http://www.drbgrpublications.in/ijcsr.
re KDP doped with NiSO4 with various co
php; ISSN: 2454-5422
ncentrations

8/17/2019 ijcsr-volume2-issue3 special issue
http://slidepdf.com/reader/full/ijcsr-volume2-issue3-special-issue 101/164
2016; IJ
Fig. 2. Gel grown
Doping
Doping means adding impurity
amount of dopant solute is also
Table
Dopin
1 : 0
1 : 0
1 : 0
1 : 0
1 : 0
SR. 2(3): http://www.drbgrpublications.in/ijcsr.
ure KDP and NiSO4 added KDP crystals
to the known pure crystal .To prepare a dop
mixed along with the pure solute.
1: Doping concentrations of impurities
g ratioMass of NiSO4 Adde
.002 0.06571
.004 0.13143
.006 0.19714
.008 0.26286
.010 0.32857
php; ISSN: 2454-5422
ed crystal a required
d in gm

8/17/2019 ijcsr-volume2-issue3 special issue
http://slidepdf.com/reader/full/ijcsr-volume2-issue3-special-issue 102/164
2016; IJ
An impurity can suppress, enh
certain crystallographic faces
saturation, temperature and pH
Results and Discussions
Dielectric constant and electr
Dielectric properties are corre
when they are non- conductin
increases and the electrical
constant depends on the de
dielectric constant of materials
charge polarizations which d
polarization are active lower
reports are available about i
dielectric constant values ar
temperature dependence of die
Even though KDP has many r
perfection of crystals in our p
increasing frequency and lo
compared to the solution grow
for the enhancement of SHG
function of frequency at differ
are taking place in materials a
the pure and metal doped KD
crystals at room temperatureconstant of KDP and NiSO4 d
with increase in frequency. T
presence of all four polarizati
low values at higher frequenci
gradually. The nature of decr
crystals contain dipoles of cont
SR. 2(3): http://www.drbgrpublications.in/ijcsr.
ance or stop the growth of crystal complete
. The effects depend on the impurity
of the solution.
ical conductivity studies
lated with electro- optic properties of the
g materials. Due to the incorporation of me
conductivity increases. (fig.5,6) The mag
ree of polarization, charge displacement
is due to the contribution of electronic, ioni
pends on the frequencies [5]. At low fr
frequencies and high temperatures [6], in
ts dielectric behavior and in our present
e in good agreement with the reported
lectric constant at frequency 100Hz to 1KHz
ports on dielectric loss, the study clearly en
resent case; it is observed that the dielectric
dielectric losses were observed for the
th. The lower value of dielectric constant is
signals. The measurement of dielectric co
ent temperatures give an idea about the ele
d these parameters were measured on the p
crystals. Frequency dependences of dielect
are observed from the figures and it is obsped KDP crystals are high at low frequencie
he very high value of ϵr at low frequencie
ns namely space charge, orientation, electro
es may be due to the loss of significance o
ase of ϵr frequency suggests that pure and
inuously varying relaxation times.
php; ISSN: 2454-5422
ly. It usually acts on
oncentration, super
crystals particularly
tal ions polarization
nitude of dielectric
in the crystal. The
c, dipolar and space
quencies, all these,
KDP crystals, many
work the measured
results [7-8]. The
is shown in fig. 4,5.
sures the crystalline
loss decreases with
gel method crystal
a suitable parameter
nstant and loss as a
trical processes that
lished (010) face of
ric constant of these
erved that dielectric s and they decreases
may be due to the
nic and ionic and its
f these polarizations
NiSO4 doped KDP

8/17/2019 ijcsr-volume2-issue3 special issue
http://slidepdf.com/reader/full/ijcsr-volume2-issue3-special-issue 103/164
2016; IJ
Fig.3. Variation of dielectric
pure and NiSO4 doped KDP
Fig.4. Variation of dielectric
pure and NiSO4 doped KDP
0
100
200
300
400
500
600
700
1 2 3
0
50
100
150
200
250
300
1 2 3
SR. 2(3): http://www.drbgrpublications.in/ijcsr.
constant (εr) with temperature at frequen
rystals
constant (εr) with temperature at frequen
rystals
4 5 6 7 8
Series7
Series6
Series5
Series4
Series3
Series2
Series1
4 5 6 7 8
Series7
Series6
Series5
Series4
Series3
Series2
Series1
php; ISSN: 2454-5422
y of 100Hz for
y of 1KHz for

8/17/2019 ijcsr-volume2-issue3 special issue
http://slidepdf.com/reader/full/ijcsr-volume2-issue3-special-issue 104/164
2016; IJ
Fig.5. Variation of electrical
pure and NiSO4 doped KDP
Fig.6. Variation of electrical
pure and NiSO4 doped KDP
0
20
40
60
80
100
120
140
160
1 2
0
20
40
60
80
100
120
140
160
1 2
SR. 2(3): http://www.drbgrpublications.in/ijcsr.
onductivity (σ) with temperature at frequ
rystals
onductivity (σ) with temperature at frequ
rystals
3 4 5 6 7 8
Se
Se
Se
Se
Se
Se
Se
3 4 5 6 7 8
S
S
S
S
S
S
S
php; ISSN: 2454-5422
ency of 100Hz for
ency of 1KHz for
ries7
ries6
ries5
ries4
ries3
ries2
ries1
eries7
eries6
eries5
eries4
eries3
eries2
eries1

8/17/2019 ijcsr-volume2-issue3 special issue
http://slidepdf.com/reader/full/ijcsr-volume2-issue3-special-issue 105/164
2016; IJ
Conclusion
Pure KDP crystals and metal d
the three dimensional structu
dielectric constant and electri
and NiSO4doped KDP crystal
crystals were slightly decrea
dielectric constant more is the
the pure KDP and NiSO4 do
temperature and frequencies.
References1. X.Sun, X, Xu, Z.Gao, Y.Fu,
2. N.Zaitseva, L.Carman, I.Sm
3. Bo Wang. Chang – shuiFang
guangXu, JianqinZhang,BingL
(2008) 5341-5346.
4. N.Pattanaboonmee, P.Rama
5. Dongli Xu, Dongfeng Xue.
6. Dogli Xu, Dongfeng Xue, J.
7. Dongli Xu, Dongfeng Xue.
8. S.Balamurugan, P.Ramasam
SR. 2(3): http://www.drbgrpublications.in/ijcsr.
oped KDP crystals are grown by gel metho
res, the crystals are free from microbes.
al conductivity were measured at different
. The capacitance and dielectric constants
ed compared to pure KDP crystals. The
enhancement of SHG signals. The electrica
ped KDP crystals were found to be incre
S.Wahg, H.Zong, Y.Li, J.Cryst.Growth., 21
olsky, J.Cryst.Growth., 241 (2002) 363.
.Sheng – Iai Wang, Xun Sun, Quing-tianGu,
iu,with potassium carbonate as additives .J.C
amy, P.Manyumprocedia Engineering., 32 (
.Cryst. Growth., 310 (2008) 1385
Alloys Compd., 449 (2008) 353
.Cryst. Growth., 310 (2008) 1385
y, Spectrochimica Acta., Part A 71 (2009) 1
php; ISSN: 2454-5422
. In gel growth, due
he capacitance and
frequencies of pure
f metal doped KDP
lower the value of
l conductivity (σ) of
se with increase of
(2000) 404
i-ping Li, Xin-
ryst.Growth.,310,
012) 1019-1025.
79-1983

8/17/2019 ijcsr-volume2-issue3 special issue
http://slidepdf.com/reader/full/ijcsr-volume2-issue3-special-issue 106/164
2016; IJ
Volume: 2; Iss
Systematical calculation of
gr
G. M.
1Rani Anna Government College for
2St. John’s College, Palayamkottai, I
*Corresponding Author Email Id: rc
The alpha decay is one of th
nuclei. Using Cubic Plus Yu
isotopes of Cm nuclei in the ra
nuclei in the range 246 ≤ A ≤
states of daughter nuclei have
(β4) deformations of parent an
half-lives are compared with
Hindrance factor and branchi
decay rate is also investigated.
Keywords: Alpha decay, Q - v
Introduction
Alpha decay can provide som
The alpha decay theory was
Condon on the basis of quant
by Salomon Rosenblum [2] in
nuclei from ground to ground
Yukawa Plus Exponential mo
the parent and daughter but tre
described in section 2. The res
are given in section 4.
SR. 2(3): http://www.drbgrpublications.in/ijcsr.
ue: 3 [Special Issue]; March-2016; pp 447-4
Alpha decay half-lives of heavy nuclei fro
und and excited states of daughter
armel Vigila Bai 1 and R. Nithya Agnes 2*
women, Tirunelveli, India.
ndia.
Abstract
most important decay processes of the he
kawa Plus Exponential model, the alpha
nge 238 ≤ A ≤ 250, Cf nuclei in the range 24
56 from ground state to ground state and gr
een studied by including both quadrupole (β
daughter nuclei as well as the spin-parity e
vailable data and are found in good agreem
g ratio have been calculated. The centrifu
alue and fine structure
e reliable information on nuclear structure
formulated by Gamow[1] and independe
m tunnelling. The fine structure of alpha d
1929.In this paper we have studied the alph
and excited states of daughter nuclei using
el [3] by incorporating the ground state defo
ating the emitted cluster as a sphere. The det
lts and discussion are given in section 3. Fi
php; ISSN: 2454-5422
4. ISSN: 2454-5422
ground state to
vy and super heavy
decay of even-even
0 ≤ A ≤ 256 and Fm
und state to excited
2) and hexadecapole
fects. The computed
ent with each other.
al barrier effect on
nd nuclear reaction.
tly by Gurney and
cay was formulated
decay of even-even
(CYEM) Cubic Plus
rmation β2 and β4 of
ails of our model are
ally the conclusions

8/17/2019 ijcsr-volume2-issue3 special issue
http://slidepdf.com/reader/full/ijcsr-volume2-issue3-special-issue 107/164
2016; IJ
Cubic plus Yukawa plus Exp
In this work, the spins and the
nucleus has a quadrupole defo
If the parent nuclei have defor
reaction is taken as the origin,
centre of mass distance 'r' of th
V(r) = Vc(r) + Vn(r)+ℓ(
Here Vc is the coulom
cluster. Vn is the nuclear inter
Vdf is the change in nucle
deformations in the daughterangular momentum, and ‘µ’ is
particle in a ground state to gr
odd-odd nuclei, it could not b
added with the Coulomb barri
from the usual nuclear spin an
Ji-J j≤ ℓ≤Ji+J j an
Where Ji,∏ i and J j,∏ j are the s
The effect of atomic electrons
The energy of alpha particle e
Where Qg.s→g.s is the Q- v
excitation energy of daughter
is given by
Qg.s→g.s = ΔMP-(ΔMd+
Where Mp, Md, Mα are the m
Audi et al [5].Where the ter
nucleus caused by the surrou
energy of the Z-electrons in t
nuclei of Z ≥ 60 and k2=13.
reported by Huang et al [6].
SR. 2(3): http://www.drbgrpublications.in/ijcsr.
onential Model
parities of parent and daughter nuclei are in
mation only and the emitted cluster is consid
ations say quadruple and hexadecapole and
the potential for the post - scission region a
e fragment is given by
+1)ћ2 /2µr2 - Vdf (r) – Q
b potential between a spheroid daughter a
action energy due to finite range effects of
ar interaction energy due to quadruple
nuclei, ‘r’ is the distance between fragmenthe reduced mass . The angular momentum
und state transition of even-even nucleus is
equal to zero. In this case, the centrifugal
r. The values of natural angular momentum
parity conservation law,
πi / π j=(-1)ℓ
in and parity of parent and daughter nuclei r
on the energy of alpha particle should also b
itted from nucleus in alpha decay is
Qi=Qg.s→g.s-Ei*
lue for ground state to ground state trans
ucleus to the i ih state. The ground state to
Mα) + [ k1(ZPβ1-Zdβ1 ) - k2ZCβ2]
ass excess of parent, daughter and alpha nu
s in the brackets represent the effect of t
ding electrons. The quantity kZ β represe
e atom, where the values k1=8.7x10⁻⁶ M e
x10-6 Me V andβ2 =2.408 for Z < 60 ha
php; ISSN: 2454-5422
cluded; the daughter
ered to be spherical.
if the Q-value of the
s the function of the
(1)
d spherical emitted
Krappe et al[4]; and
and hexadecapole
centers , ‘ℓ’ is the carried by the alpha
ero . In odd-even or
barrier term must be
have been obtained
(2)
spectively.
taken into account.
(3)
ition and Ei* is the
round state Q-value
(4)
clei as tabulated by
he screening to the
ts the total binding
and β1 = 2.517 for
ve been found from

8/17/2019 ijcsr-volume2-issue3 special issue
http://slidepdf.com/reader/full/ijcsr-volume2-issue3-special-issue 108/164
2016; IJ
For a prolate sp
direction, Pik - Pichak [7] obta
Vc(r) = ln
and for an oblate spher
Vc(r) = [ (1 +
For the overlapping reg
polynomial in (r) as suggested
Vc(r) = − [ ( ) +
ri ≤ r ≤ rt
Where rt = ae +
Here ae is the semi-maj
late (or) oblate shape of the em
the daughters and the emitted
If the nuclei have spher
axis of symmetry locating sharR () = Ro [1 + ∑∝
Here R0 is the radius of equival
If we consider spheroid defor
R() = 1 + 54
and if Nilsion hexadeca(6) becomes
R()=Ro 1 + 54
Expressing the energies
life time of the decay system w
SR. 2(3): http://www.drbgrpublications.in/ijcsr.
heroid daughter nucleus with longer axis alo
ined
+
id daughter nucleus with shorter axis along t
) − ]
ion, we approximate the potential barrier by
by Nix[8]having the form
] −
Rd
or (or) minor axis of the spheroid cluster dep
itted cluster; and ri is the distance between th
article portions in the spheroid parent nucleu
oid shape, the radius vector R () making an
p surface of a deformed nuclei is given by re( )∝ ]
ent spherical nucleus.
ation 2 then
−12
pole deformation 4 is also included in the d
2 −1
2 + 94 (35
in MeV, lengths in fm and time in seconds
e use the formula,
php; ISSN: 2454-5422
g the fission
(5)
he fission direction
(6)
a third order
(7)
nding on the pro
e centers of mass of
s.
angle with the
f [3] (8)
(9)
formation then eqn
− 30 + 3)
(10)
or calculating the
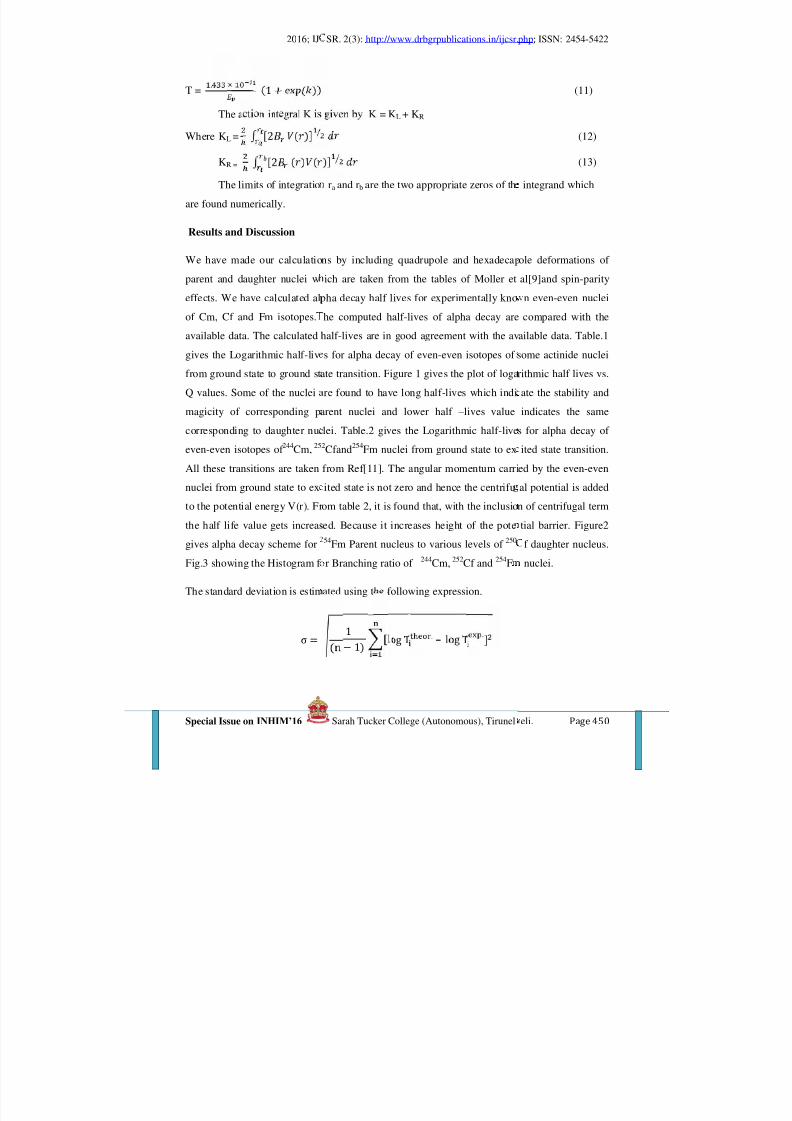
8/17/2019 ijcsr-volume2-issue3 special issue
http://slidepdf.com/reader/full/ijcsr-volume2-issue3-special-issue 109/164
2016; IJ
T = . × (1 + exp( ))
The action integral K is
Where KL = ∫ [2 ( )]
KR = ∫ [2 ( ) (
The limits of integratio
are found numerically.
Results and Discussion
We have made our calculatio
parent and daughter nuclei w
effects. We have calculated al
of Cm, Cf and Fm isotopes.
available data. The calculated
gives the Logarithmic half-liv
from ground state to ground st
Q values. Some of the nuclei
magicity of corresponding p
corresponding to daughter nuc
even-even isotopes of 244Cm, 25
All these transitions are taken
nuclei from ground state to ex
to the potential energy V(r). Fr
the half life value gets increas
gives alpha decay scheme forFig.3 showing the Histogram f
The standard deviation is estim
σ =
SR. 2(3): http://www.drbgrpublications.in/ijcsr.
given by K = KL + KR
)]
ra and rb are the two appropriate zeros of th
ns by including quadrupole and hexadecap
ich are taken from the tables of Moller et
pha decay half lives for experimentally kno
he computed half-lives of alpha decay are
half-lives are in good agreement with the av
s for alpha decay of even-even isotopes of
ate transition. Figure 1 gives the plot of loga
re found to have long half-lives which indi
arent nuclei and lower half – lives value
lei. Table.2 gives the Logarithmic half-live2Cfand254Fm nuclei from ground state to ex
from Ref[11]. The angular momentum carri
ited state is not zero and hence the centrifu
om table 2, it is found that, with the inclusio
ed. Because it increases height of the pote
54Fm Parent nucleus to various levels of 250 r Branching ratio of 244Cm, 252Cf and 254F
ated using the following expression.
1(n − 1)
[log T . – log T .]
php; ISSN: 2454-5422
(11)
(12)
(13)
integrand which
ole deformations of
al[9]and spin-parity
n even-even nuclei
compared with the
ailable data. Table.1
some actinide nuclei
rithmic half lives vs.
ate the stability and
indicates the same
s for alpha decay of
ited state transition.
ed by the even-even
al potential is added
n of centrifugal term
tial barrier. Figure2
f daughter nucleus. nuclei.

8/17/2019 ijcsr-volume2-issue3 special issue
http://slidepdf.com/reader/full/ijcsr-volume2-issue3-special-issue 110/164
2016; IJ
The estimated standard deviati
calculated by Ref [10] is 0.210
HF=
/.
/ .. The calculated HFof alpha decay to each state of
alpha decay width,
B
Where the sum n is going over
from the ground state of the pa
all ground to ground transition
Table1. Comparison of calculateactinide nuclei from ground state
Decay mode
96Cm →94Pu +2H96Cm →94Pu +2H96Cm →94Pu +2H96Cm →94Pu +2H96Cm →94Pu +2H96Cm →94Pu +2H98C f →96Cm +2H98C f →96Cm +2H98C f →96Cm +2H98C f →96Cm +2H98C f →96Cm +2H98C f →96Cm +2H98C f →96Cm +2H98C f →96Cm +2H
98C f →96Cm +2H1OOFm →98Cf +2
1OOFm →98Cf +2
1OOFm →98Cf +2
1OOFm →98Cf +2
1OOFm →98Cf +2
1OOFm →98Cf +2
SR. 2(3): http://www.drbgrpublications.in/ijcsr.
on for the half lives by our model is 0.2395
08. The hindrance Factor (HF) is calculated
is close to unity which shows better result. Tthe daughter nucleus have been evaluated wi
Γ(Qi,ℓi)×100%/ ∑(Qn,ℓn)
all states, which can be populated during the
rent nucleus. The Branching ratio value is fo
and is going on decreased for all other trans
values of logarithm of half life time for oven-evto ground state transition.
Q(MeV) LogT(s)Expt Ref[10] CYE
6.668 5.51 5.26 5.466.440 6.52 6.29 6.486.258 7.28 6.86 7.385.945 8.87 8.57 8.97
5.518 11.26 11.10 11.475.204 13.16 13.14 13.51
e 7.760 2.03 1.75 1.90 e 7.560 2.41 2.52 2.61 e 7.374 3.18 2.88 3.30 e 6.907 5.21 5.19 5.29 e 6.406 7.56 7.19 7.68 e 6.174 8.69 8.45 8.86 e 6.262 8.01 8.08 8.46 e 5.972 9.31 9.99 10.05
e 5.600 10.87 12.22 12.25e 8.421 0.17 0.31 0.39e 8.048 1.66 1.55 1.68e 7.604 3.38 3.26 3.36e 7.198 5.04 4.97 5.01e 7.354 4.14 4.08 4.42e 7.073 5.14 5.27 5.65
php; ISSN: 2454-5422
hile the same
y the formula,
he branching ratios th the help of the
alpha transition
nd to be greater for
itions.
en isotopes of some
HF(cal.)
1.12201.09650.79430.7943
0.61660.6166
1.3489 0.6310 0.7586 0.8318 0.7586 0.6761 0.3548 0.1820
0.04170.60250.95491.04711.07150.52480.3090
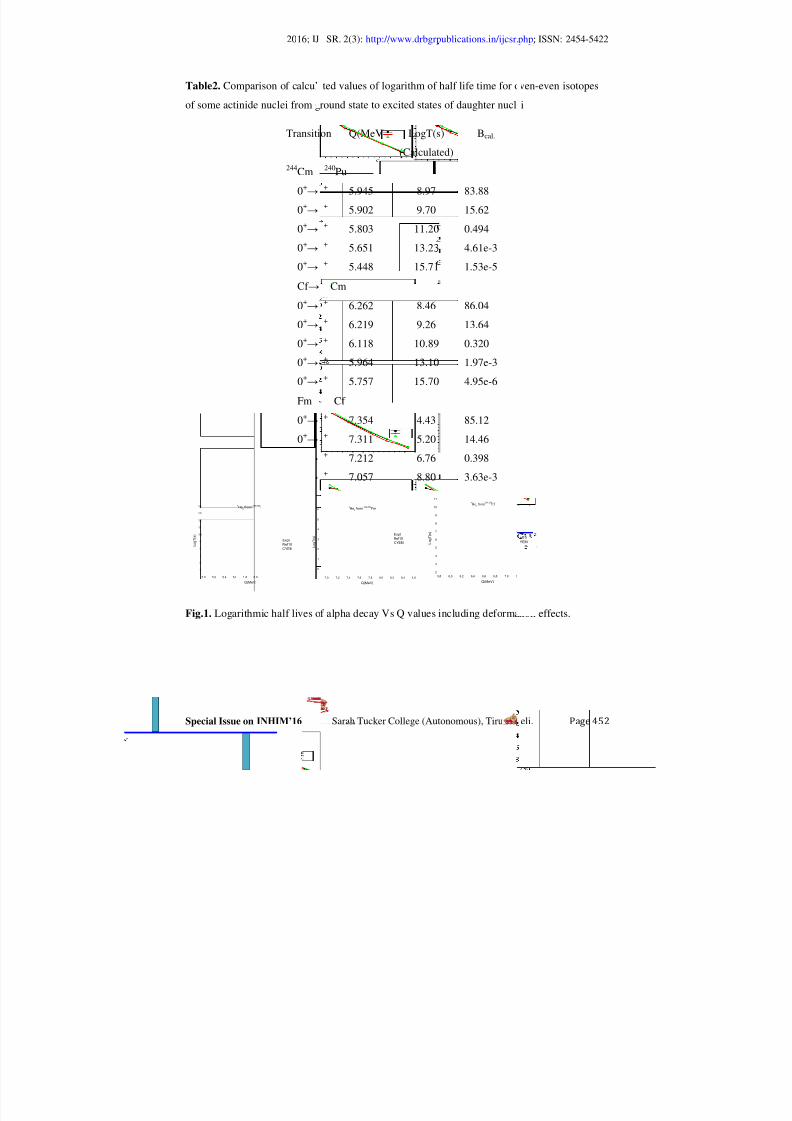
8/17/2019 ijcsr-volume2-issue3 special issue
http://slidepdf.com/reader/full/ijcsr-volume2-issue3-special-issue 111/164
2016; IJ
Table2. Comparison of calcul
of some actinide nuclei from g
Transiti
244Cm
0+→
0+→
0+→
0+→
0
+
→Cf →
0+→
0+→
0+→
0+→
0+→
Fm
0+→
0+→
0+→
0+→
Fig.1. Logarithmic half lives o
5.0 5.2 5.4 5.6 5.8 6.0 6.2 6.4 6.6 6.8
5
6
7
8
9
10
11
12
13
14 4He
2 from
238-248Cm
L o
g T ( s )
Q(MeV)
Expt.
Ref10 CYEM
. . . . . . . . .
0
1
2
3
4
5
6 -
L o g T ( s )
.
SR. 2(3): http://www.drbgrpublications.in/ijcsr.
ted values of logarithm of half life time for o
round state to excited states of daughter nucl
on Q(MeV) LogT(s)(Calculated)
Bcal.
240Pu+
+
+
+
+
5.945
5.902
5.803
5.651
5.448
8.97
9.70
11.20
13.23
15.71
83.88
15.62
0.494
4.61e-3
1.53e-5Cm
+
+
+
+
+
6.262
6.219
6.118
5.964
5.757
8.46
9.26
10.89
13.10
15.70
86.04
13.64
0.320
1.97e-3
4.95e-6
Cf +
+
+
+
7.354
7.311
7.212
7.057
4.43
5.20
6.76
8.80
85.12
14.46
0.398
3.63e-3
f alpha decay Vs Q values including deforma
7.0 7.2 7.4 7.6 7.8 8.0 8.2 8.4 8.6
4He
2 from
246-256Fm
Q(MeV)
Expt.
Ref10
CYEM
5.8 6.0 6.2 6.4 6.6 6.8 7.0 7. .
2
3
4
5
6
7
8
9
10
114He
2 from
240-256Cf
L
o g T ( s )
Q(MeV)
.
php; ISSN: 2454-5422
ven-even isotopes
i
tion effects.
. . . . . . . 7 .2 7.4
xpt.
ef10
YEM

8/17/2019 ijcsr-volume2-issue3 special issue
http://slidepdf.com/reader/full/ijcsr-volume2-issue3-special-issue 112/164
2016; IJ
Fig.2.Schematic representation
daughter nucleus.
Fig.3. Histogram for Branchin
Conclusions
We have calculated alpha de
computed half-lives are comp
each other. The calculated HF
Factor is between 1 and 4, th
height of the potential barrie
Branching ratio value is foun
transitions while the same dec
That means the alpha transmis
References
[1] G.Gamow, Z.Phys. 51,204
[2] Salomon Rosenblum, C.R.
0+ -> 0+ 0+ -> 2+ 0+ -> 4+ 0+ -> 6+ 0+ -> 8+
-20
0
20
40
60
80
252Cf
B c a l %
- - - - -
-
B c a l %
SR. 2(3): http://www.drbgrpublications.in/ijcsr.
of alpha decay of 254Fm parent nucleus to v
ratio of 244Cm, 252Cf and 254Fm nuclei.
ay half – lives of even-even nuclei using
ared with available data and are found in g
is found to be unity which shows better res
e transition is called a ‘favoured transition’
r gets increased and it increases the half
d to be greater for all 0+→0+ transitions f
eases as we move from ground to other exc
ions to the remaining excited states are stron
(1928)
Acad. Sci.Paris 188 (1929) 1401
0+->0+ 0+->2+ 0+->4+ 0+->6+ 0+->8+
-20
0
20
40
60
80
244Cm
0+->0+ 0+->2+ 0+->4+ -
-20
0
20
40
60
80
254Fm
B c a l %
php; ISSN: 2454-5422
rious levels of 250Cf
CYEM model. The
ood agreement with
ult. If the Hindrance
. Due to this effect,
life value also. The
ollowed by 0+ →2+
ited state transitions.
gly hindered.
- - - 0+->6+
-
l

8/17/2019 ijcsr-volume2-issue3 special issue
http://slidepdf.com/reader/full/ijcsr-volume2-issue3-special-issue 113/164
2016; IJ
[3] G.Shanmugam, G.M.Carm
[4] H.J.Krappe, J.R.Nix,andA.
[5] G. Audi, O.Bersillon, J.
nuclear and decay properties
[6] K.N.Huang, M.Aoyagi, M.
binding energies from relaxed
At.Data Nucl. Data Tables 18
[7] G.A. Pik – Pichak, Yad.Fiz
[8]J.R.Nix,Ann.Phys.(N.Y.)41
[9] P.Moller, J.R.Nix, W.D.
deformations At. Data Nucl. D
[10] V Yu Denisov and A A K
[11]http://www-nds.iaea.org/R
SR. 2(3): http://www.drbgrpublications.in/ijcsr.
lVigilaBai and B.Kamalaharan, Phys. RevC
.Sierk,Phys.Rev.C20, 992 (1979)
lachot and A.H. Wapstra 2003 The NU
ucl. Phys. A7293.
H.Chen, B.Crasemaon and H.Mark 1976 N
-Orbital relativistic Hartree-Fock-Slater calc
43.
.44,1421(1986) Sovt. J. Nucl. Phys. 44,923 (
,52(1962)
Myers and W.J.Swiatecki Nuclear groun
ata Tables 59 185 – 381 (1995)..
hudenko, Phys. Rev.C80(2009)034603.
IPL-2/.
php; ISSN: 2454-5422
51, 2616 (1995)
ASE evaluation of
eutral-atom electron
ulations 2≤ Z ≤ 106
1986).
d-state masses and
8/17/2019 ijcsr-volume2-issue3 special issue
http://slidepdf.com/reader/full/ijcsr-volume2-issue3-special-issue 114/164
2016; IJ
Volume: 2; Iss
Synthesized and Characte
R.
1Department of Physics, Sri.S.Ramas
Research Scholar, Bharathiyar Unive
1*Department of Physics, School of S
2Department of Physics, The MDT
In this work, nanoparticles o
using a microwave oven.
ammonium ceric nitrate. The
solution was adjusted to be at
the microwave oven at a tem
precipitates were thoroughly
as prepared powder. Conventiabout 2 hours. The synthesize
XRD, SEM, and FT-IR studie
Keywords: CeO2, nanoparticle
Introduction
Conventional materials like m
be converted into smart mate
inorganic to organic, crystall
aggregates, powders, nano
Nanomaterials have unique
materials [1]. Cerium oxide(
finds wide applications in ele
materials, in the field of cata
sensors and so on [2-6]. It h
SR. 2(3): http://www.drbgrpublications.in/ijcsr.
ue: 3 [Special Issue]; March-2016; pp 455-4
ization of cerium dioxide (ceria) nanopar
microwave ovennitha1a, E.Kumar1* and D. Muthuraj2
amy Naidu Memorial College, Sattur, India.
rsity, Coimbatore, India.
cience, Tamil Nadu Open University, Chennai, India.
indu College, Tirunelveli, India.
Abstract
f cerium oxide (CeO2) were synthesized
he precursor used to prepare the nanopa
recursor was dissolved in de-ionized water
12 using sodium hydroxide . The prepared
erature of 70 oC for about 30 minutes. Th
ashed with de-ionized water, and dried at
nal thermal treatment of the as prepared pd CeO2 nanoparticles were subjected to var
s .
s,
tals, semiconductors, glass, ceramics, poly
rials in nano-scale dimensions. Nano
ine to amorphous, which can be found
ires, quantum dots, nanofilms, nan
nd interesting properties when compa
eO2), Ceria, is one of the most important
ctrolyte materials of solid oxide fuel cells ,
lysts, Chemical Mechanical Polishing (CM
as a fluorite – like cubic structure in which
php; ISSN: 2454-5422
9. ISSN: 2454-5422
icles by using a
by solution method
ticles of CeO2 was
and pH value of the
solution was kept in
en, the light yellow
5 oC for 8 h to form
wder at 200o
C for ious techniques like
ers, oxides etc can
aterials range from
as single particles,
ofibres, nanotubes.
ed to conventional
rare- earth oxides ,
ultraviolet blocking
P) and oxygen gas
each cerium site is

8/17/2019 ijcsr-volume2-issue3 special issue
http://slidepdf.com/reader/full/ijcsr-volume2-issue3-special-issue 115/164
2016; IJ
surrounded by eight oxygen s
cerium site. Methods based on
method, microemulsion metho
many researchers [7-14]. But
CeO2 nanoparticles.
It is reported that nanopa
microwave oven [15]. This
nanosized inorganic material
heating has an advantage of hi
size distribution. This work
microwave-assisted solution
nitrate and sodium hydroxide.
Experimental
All chemicals were analytica
synthesis of CeO2 nanoparticl
was dissolved in deionized
hydroxide. A chemical reacti
formed. Then the prepared mi
minutes in air in a domestic m
coloured precipitate was form
yellow precipitate was filtered
8h to obtain as-prepared pow
2000C in air for 2 h resulted in
The powder XRD pattern
diffractometer (Model:Ritz-
mA). The particle size (d) of
full – width at half- maximum
) where λ is the X-ray wavel
synthesized nanopowder of c
SR. 2(3): http://www.drbgrpublications.in/ijcsr.
ites in fcc arrangement and each oxygen si
wet chemical routes like co-precipitation, h
etc have been employed to synthesize of C
he above methods seem to be tedious and
ticles can be prepared in an easy manne
method has been successfully applied for
s [16-18]. Compared with conventional
gh efficiency and rapid formation of nanop
reports the studies of ceria nanopartic
ethod from an aqueous solution containi
l grade (AR) and used without further
es, the precursor ammonium Ce(IV) nitrat
water and pH value was adjusted to b
on took place in the solvent and a pale ye
ture solution was kept at a temperature of 7
icrowave oven (900 W, 2450 MHz., Onida,
d in the solution after the microwave heatin
and washed with de-ionized water and it w
der. Conventional thermal treatment of as-
the formation of CeO2 nanoparticles.
of the synthesized sample was taken usi
70 with Nickel filtered CuKα radiations (1
the sample can be estimated from XRD pat
(β) to the Debye-Scherrer’s relation d
ength and θ is the diffraction angle . The
ria was recorded using a Hitachi Scanning E
php; ISSN: 2454-5422
te has a tetrahedron
drothermal, sol- gel
O2 nanoparticles by
expensive to obtain
r using a domestic
the preparation of
heating, microwave
rticles with a nano-
les synthesized by
g ammonium ceric
purification. In the
e ((NH4)2Ce(NO3)6)
e 10 using sodium
llow precipitate was
00C for about for 30
India). Pale yellow-
g. Synthesized pale
as dried at 950C for
prepared powder at
g a powder X-ray
.54056 Å, 35KV,10
tern by applying the
(0.98 λ ) / (β cos θ
SEM image of the
lectron Microscope.

8/17/2019 ijcsr-volume2-issue3 special issue
http://slidepdf.com/reader/full/ijcsr-volume2-issue3-special-issue 116/164
2016; IJ
Results and Dissusion
Figuue 1 shows the XRD pa
located at 2θ = 28.5, 33.1, 47.and (222) planes respectively
structure.
Fig.1: Powder XRD pattern o
For the various reflection pea
Debye-Scherrer’s relation and
around 12 nm. The Scannin
identify the morphology ofnanopaticles is displayed in t
agglomerated. Hence the shape
Fourier Transform Infrared (F
used to identify the functional
materials. When an infrared
intensity of the radiation wou
FITR spectra. The absorption
vibrations. Depending on the
certain frequencies. An FTIR
and wave number of IR radi
number range 400 cm-1 to 400
of the sample and hence the ch
SR. 2(3): http://www.drbgrpublications.in/ijcsr.
ttern of the sample. From this figure, the
, 56.2 and 50.00
are corresponding to (111). These match well with the peaks of cub
ceria nanoparticls& Fig.2: SEM image of
s of the XRD pattern, the particle size was
the average size of nanoparticles of the sam
Electron Microscope(SEM) image of the
the nanoparticles. The SEM image of thhe figure 2. It is observed that that most
of a single nanoparticle is not clear from the
TIR) spectrometer is the sophisticated instr
groups of samples of nanomaterials, crystal
radiation is passed through a sample, c
ld be absorbed by the sample and that will
of IR radiation in the sample is due to str
aterial of the sample, absorption of IR ra
spectrum is recorded between percentages o
tion. By observing the absorption bands o
cm-1 of FTIR spectrum, one can ascertain t
emical formula and the sample can be identif
php; ISSN: 2454-5422
characteristic peaks
, (200), (220), (311) ic flouorite crystal
ceria nanoparticles
estimated using the
les was found to be
sample was used to
e synthesized ceria of the particles are
SEM image.
ment which can be
s and other types of
rtain percentage of
be indicated in the
tching and bending
iation will occur at
transmittance (%T)
peaks in the wave
he functional groups
ied.

8/17/2019 ijcsr-volume2-issue3 special issue
http://slidepdf.com/reader/full/ijcsr-volume2-issue3-special-issue 117/164
2016; IJ
The FTIR pattern of cerium
absorption band located arou
residual water and hydroxyl gr
bending mode of associated w
cm-1 are due to unwanted resi
oxygen bond. The assignmen
the various absorption peaks o
Fig.3: FTIR pattern of c
Table 1 : Assignments for abs
B
Conclusion
Nanocrystalline CeO2 (ceria)
method using ammonium ceri
role in forming nanoparticles
SR. 2(3): http://www.drbgrpublications.in/ijcsr.
dioxide nanoparticles is shown in the f
nd 3400 cm-1 corresponds to the O – H str
oups, while the absorption band at 1630 cm -1
ater. The complex bands observed at about
ues in the sample. The band at 848 cm-1 c
s for the bands/peaks of FTIR pattern were
the spectrum are provided in the table 1.
rium dioxide nanoparticles
rption bands of FTIR spectrum of cerium d
ands (cm-1) Assignments
3400 OH stretching
1630 OH bending
1518 CH2 bond
1350 CH2 bond
1053 -
848 Metal-O bond
articles have been synthesized by microwa
nitrate as the precursor. Sodium hydroxide
of ceria. The average size of nanoparticle
php; ISSN: 2454-5422
igure 3. The broad
tching vibration of
is due to the scissor
1518, 1350 , 1053
rresponds to metal –
the assignment for
ioxide nanoparticles
ve -assisted solution
played an important
of the sample was

8/17/2019 ijcsr-volume2-issue3 special issue
http://slidepdf.com/reader/full/ijcsr-volume2-issue3-special-issue 118/164
2016; IJ
estimated by powder XRD stu
observing the absorption band
FTIR spectrum, one can ascer
formula and the sample can be
References
[1] E.PerryMurray, T.Tsai, S.
[2] R.X.Li, S.Yabe, M.Yamas(2002) 235
[3] M.G. Sanchez, J.L. Gazque
[4] M. Jiang, N.O. Wood. R. K
[5] N. Izu, W. Shin, N. Muray
[6] S. Yabe, T. sato, J. Solid st
[7] P.L. Chen, I.W. Chen, J.A
[8] B. Djuricic, S. Pickering, J
[9] X.D. Zhou, W. Huebner. H
[10] N. C. Wu, E. W. Shi, Y.
[11] M. Hirano, E. Kato, J. Ma
[12] L.P.Li, X.M.Lin, G.S.Li,
[13]T.Masui, K.Fujiwara, K.I.2197
[14] S.Komarneni,R.Rajha,Ma[15] M.Brightson, S.MeenaksConference on emerging adCollege of Engineering, Tamil
[16] X.H.Liao,J.J.Zhu,H.Y.Ch
[17] W.X.Tu,H.F.Liu,J.Mater.
[18] H.Wang,J.Z.Xu,J.J.Zhu,H
SR. 2(3): http://www.drbgrpublications.in/ijcsr.
dies. SEM image revealed the morphology
s or peaks in the wave number range 400 c
tain the functional groups of the sample and
identified.
.Barnett, Nature 400 (1999) 649.
ita, S.Momose, S.Yoshida, S.Yin, T.Sato,
z, J. Catal. 104 (1987) 120
omanduri, Wear 220 (1998) 59
arna, S. Kanzaki, Sensor Actuat. B 87(2002)
te Chem 171(2003) 7
. Ceram. Soc. 76(1993)1577
.Euro. Ceram. Soc.19 (1999)1925
.U.Anderson. Appl.Phys.Lett. 80(2002)3814
. Zheng, W. J. Li, J. Am.Ceram. Soc.85(200
ter. Sci. Lett. 15(1996)1249
.Inomata, J.Mater.Res.16(2001)3207.
Machida, G.Y.Adachi, T.Sakata, H.Mori, C
ter.Chem.Phys.61(1999)50. i Sundar, T.H.Freeda, P.Selvarajan, Procee
aptive systems and technologies(EAST-2Nadu, 25th to 27th, October, 2007.
n,Mater.Sci.Eng.B85(2001)85.
hem.10(2000)2207.
.Y.Chen,J.Cryst.Growth244(2002)88.
php; ISSN: 2454-5422
of nanoparticles. By
m-1 to 4000 cm-1 of
hence the chemical
olidStateIonics. 151
95
2)2462.
hem.Mater. 9(1997)
ings of Second Int.
07), Noorul Islam
8/17/2019 ijcsr-volume2-issue3 special issue
http://slidepdf.com/reader/full/ijcsr-volume2-issue3-special-issue 119/164
2016; IJCSR.
Volume: 2; Issu
Studies on molecular int
1Assistant Professor, Departm
2Associate Professor, Departm
*Coresponding AuthorE-mail:
Molecular interactions c
influence of local order
between permanent dip
correlation factor in dilu
The interactions between
modified form of the cor
interactions. The dielect308,313 and 318K. The
interactions was identifie
Keywords: Dielectric co
Introduction
Dielectric studies are of configurations, particula
ultrasonic and nuclear m
studying intermolecular
about molecular associati
Kirkwood correlation f
association among the as
is used as a solvent, as a
ethylating agent in orga
. 2(3): http://www.drbgrpublications.in/ijcsr.php;
e: 3 [Special Issue]; March-2016; pp 460-47
eractions of Bromoform and Ethyl bromi
at four different temperatures
K. Umamakeshvari1 and U. Sankar2*
nt of Physics, St. Johns College, Palayamkottai, India
ent of Physics, Sri KGS Arts College, Srivaikundam, I
Abstract
an be studied by dielectric measurements
and the overall dipole moment. The shor
les could readily be described by the
te solutions of bromoform and ethyl bromid
the solute species among themselves ma
relation factor gʹ by not taking into account
ic constants of the binary mixtures wereresults were interpreted in light of the the
in both the systems.
stant, Kirkwood correlation factor, H-bond,
great help in the assignment of the molely those of organic compounds. Altho
agnetic resonance (NMR) studies are the
H- bonds, dielectric studies provide very
on and intermolecular rotation. Determinati
actor (g) provides the information ab
sociating molecules (Purohit H D et al., 19
anesthetic in medicine, as a refrigerant, as
nic synthesis. It is possible to reconcile
ISSN: 2454-5422
1. ISSN: 2454-5422
e with Benzene
.
ndia.
by virtue of the
t range interaction
Kirkwood-Frolich
with inert solvent.
y be given by the
of solvent-solvent
measured at 303, ory. The nature of
Multimers
cular structures or gh infrared (IR),
powerful tools for
useful information
on of the modified
ut intermolecular
91). Ethyl bromide
a fumigant. It is a
the data obtained

8/17/2019 ijcsr-volume2-issue3 special issue
http://slidepdf.com/reader/full/ijcsr-volume2-issue3-special-issue 120/164
2016; IJCSR.
from dipole moment stud
al., 2009). They have fou
hydrogen bonding betwe
of literature shows thatreviewed the various
Bromoform was used as
used as a laboratory reag
by density. Some work o
reported (S S Yadava et
benzene, to make other
synthetic fibers. In this co
composition and temper
acetate + benzene and et
acetic acid is due to sel
systems Bromoform in
on Kirkwood-Frohlich m
Materials and Methods
Ethyl Bromide (AR gra
commercially obtained fr
purification. Binary mixt
at 5 different concentrati
concentration was conve
dielectric constant was
The scale of the instr
tetrachloride, benzene, to
The temperature was mai
refractive indices were m
using a 10ml specific gra
measurement of dielectri
±0.0002 and ± 0.0001 gm
Theory
Attractive forces dipole-
. 2(3): http://www.drbgrpublications.in/ijcsr.php;
ies of complexes of alcohols with ethyl br
nd that the enhancement of the dipole mom
en alcohol molecules and benzene with al
very little work on esters (L.Eberson ypes of hydrogen bonding in carboxylic
a solvent, sedative, and flame retardant, b
ent. Its high density makes it useful for sep
ultrasonic studies of bromopropane with be
al., 2004). Benzene is a colorless liquid wi
hemicals which are used to make plastics,
ntext, the variation of linear correlation fact
ature for the binary systems (acetic acid
hyl-methyl ketone+ benzene) carried out t
f-association (Krishnan et al., 1997). The
enzene (I), Ethyl bromide in benzene (II),
del.
e), Bromoform (AR grade) and Benzene
om S D Fine-chem. Limited (India) and us
res of Ethyl bromide, Bromoform and ben
ns by volume fraction. Assuming ideal mi
r ted into the molefraction (Prajapati et
measured at 1 KHz using a Systronix Digit
ument was calibrated using standard li
luene and chlorobenzene.
ntained at 298±1K using Sigma constant te
asured using Abbe’s refractometer. Densiti
vity bottle and a K-Roy microbalance. The
c constants, refractive indices and densiti
/cc respectively.
ipole interactions and other slowly varying
ISSN: 2454-5422
mide (T. Indira et
ent value confirms
cohol. The survey
et al., (1969) has acids and esters.
t now it is mainly
aration of minerals
nzene mixture was
th sweet odor. Use
resins, nylon and
r was studied with
benzene, methyl
e dimeric state of
following binary
ere studied based
(AR grade) were
ed without further
ene were prepared
xing behaviour the
al., 2010). The
al LCR meter 925.
uids like carbon
perature bath. The
s were determined
uncertainties in the
s were ± 0.0001,
interactions play a

8/17/2019 ijcsr-volume2-issue3 special issue
http://slidepdf.com/reader/full/ijcsr-volume2-issue3-special-issue 121/164
2016; IJCSR.
role in the structure of the
intermolecular forces do
associated liquids it is al
continuum approach andmechanical approach of
measured dielectric cons
theory of dielectric polari
(Frohlich., 1958). The
correlations like hydrog
correlation parameter g’.
The interactions between
by a modification of th
interactions between the
correlation factor of
species, one can write (
= [ ( )– ( )](
( ) = ----
= ( )
-------
where ,n and represent
the solution respectively
constant, < > is the sq
weight fractions of the sol
and NA is the Avogadr
concentrations by measuri
solutions.
. 2(3): http://www.drbgrpublications.in/ijcsr.php;
liquids. The modern theories of liquids sho
minate the structure of the denser liquid
most impossible to account for their dielect
one has to recourse to the theories base the dielectric constants. Theoretical inte
tants of associated liquids were enhanced
zation (Kirkwood., 1939) which was later m
Kirkwood-Frohlich treatment takes car
en bonding through the introduction of
the polar solute and the non-polar solvent
Kirkwood correlation factor, which take
solvent molecules among themselves. I
dielectric polarization between the solut
irkwood.,1939).
)-------------------------
-----------------------------------------------------------
-----------------------------------------------------------
the static dielectric constant, refractive index
and the suffix 1 indicates the solvent, k
ared dipole moment of the polar species,
vent and solute, M2 is the molecular weight
number. The value of g’ can be deter
ng the dielectric constant, refractive index
ISSN: 2454-5422
that the repulsive
s. In the case of
ric behavior in the
on the statistical rpretations of the
y the Kirkwood’s
odified by Frohlich
of short range
the dimensionless
may be considered
s into account the
g’ is the linear
and the solvent
---------- 1
--------------- 2
------------- 3
and the density of
is the Boltzmann
1 and w2 are the
of the polar solute
ined for different
and density of the
8/17/2019 ijcsr-volume2-issue3 special issue
http://slidepdf.com/reader/full/ijcsr-volume2-issue3-special-issue 122/164
2016; IJCSR.
Results and Discussion
The variation of density,
correlation factor g’ with
system I and II are given
The variation of g’ with x
the dielectric constant val
with the increase of temp
clusters. On dilution, the
moment larger than the
clusters become very smal
with the volume fraction.
volume fraction (Kroeger
With the increase of tem
various concentrations de
molecules is disturbed.
temperature. Similar concl
to Bottcher et al., 1973).
concentrations. For all the
with increase of concentr
the molecular interaction
orientation of the dipole
orientation of the dipoles.
concentration of 0.2050
formation of -multimers
as proposed by Cole and
The rotation about the hy
dipoles in chain increase
dilution decreases, g de
decrease of dilution, mo
solute molecules. This
. 2(3): http://www.drbgrpublications.in/ijcsr.php;
refractive index, dielectric constant and
concentration of the liquids at different te
in Table 1 and 2. The value of g’ is calcul
2 is graphically represented in Fig 1. From
e increases with concentration of the solute
erature. In pure liquids, the solute molecul
solute molecule exists as clustered species
as phase moment. As more and more sol
ler, until reaches a non-hydrogen bond. Th
Therefore the dielectric constant increases
t al., 1987).
erature the dielectric constant value of all
creases. Due to the thermal agitation, the
o the dielectric constant value decreases
usions were reported by many researchers (
The value of correlation factor g’ decrea
studied systems, for all temperatures, the
tions. The deviation of g’ value from unit
s. The value of g’ greater than unity i
. The value of g’ less than unity implie
In the system I, g’ greater than unity is
t 308K, this implies the parallel orientati
nd γ-multimers. The formation of linear mu
Dannhauser (Cole et al., 1955).
drogen bond is more restricted, the correl
s, leading for this type of molecules to high
creases. This may be explained as f
re solute molecules may be available for t
ay lead to the rupture of the H-bonds b
ISSN: 2454-5422
Kirkwood-Frohlich
mperatures for the
ted using Eqn (1).
he Tables 1 and 2,
and also decreases
es do not exist as
with a little dipole
vent is added, the
cluster sizes vary
ith the increase of
studied systems at
orientation of the
with the rise of
roeger et al., 1987
ses on increase of
g’ value decreases
is the measure of
plies the parallel
s the anti-parallel
obtained up to the
on of the dipoles,
ltimers is favoured
ation between the
er values of g’. As
ollows: with the
he interaction with
etween the solute

8/17/2019 ijcsr-volume2-issue3 special issue
http://slidepdf.com/reader/full/ijcsr-volume2-issue3-special-issue 123/164
2016; IJCSR.
molecules and the solute
through a weak H-bond.
implies the anti-parallel or
dilution, the g’ value decrbonding (Bordewijk et al.,
At high dilution, as temp
due to hindrance of the s
interactions. Increase of t
molecules (linear multim
which may be the reasodeviation of g’ value fro
molecules. The strength
mixture is higher than the
303 and 308K for system I
318K g’ of system I va
association between solut
short-range interaction betmonomeric state. Small d
interaction (long-range) as
There may be a weak π-π
oxygen atom of the este
temperature. Deviation of
range interactions as wellII at 0.0519 concentratio
temperatures. For all othe
indicating antiparallel orie
. 2(3): http://www.drbgrpublications.in/ijcsr.php;
molecules may tend to interact with the
Afterward the value of g’ less than unity
ientation of the dipoles, formation of β- mu
ases due to the self-association of solute m1973).
rature increases, solute-solute interaction m
lvent molecules. This results in favour of
mperature at very high dilutions may incre
ers) favouring parallel orientation of the
for the increase of g’ values with theunity indicates the strong self-association
f the solute-solute interactions in bromof
ethyl bromide-benzene mixture. Hence it m
, parallel orientation among solute molecules
ies about 10 to 17 percent. This indicate
e molecules through H-bonding. This sho
ween the solute molecules. The solute molviation of g’ values from unity may be d
well as π-π interaction between the solute a
interaction between the π electron clouds o
rs. g’ does not vary appreciably with x2
g’ value from unity up to 20% can be tak
as the π-π interactions (Thenappan., Sankarn g’ value is above 1 indicating parallel
r concentration and all temperatures g’ v
tation.
ISSN: 2454-5422
solvent molecules
are obtained. This
ltimers. Increase of
lecules through H-
y be less favoured
more solute-solute
ase the size of the
solute molecules,
emperature. Large among the solute
orm with benzene
ay be concluded at
exists. At 313 and
s there is no self
s the absence of
cules may exist in e to dipole-dipole
d solvent.
f benzene with the
as well as with
en as due to long-
., 2006). In system orientation at all
lue is less than 1

8/17/2019 ijcsr-volume2-issue3 special issue
http://slidepdf.com/reader/full/ijcsr-volume2-issue3-special-issue 124/164
2016; IJCSR.
Fig.1- Variation o
System I-B
System II-
. 2(3): http://www.drbgrpublications.in/ijcsr.php;
f g’ with concentration:
romoform in benzene
thyl bromide in benzene
ISSN: 2454-5422

8/17/2019 ijcsr-volume2-issue3 special issue
http://slidepdf.com/reader/full/ijcsr-volume2-issue3-special-issue 125/164
p er a u re
(K) X2
0.0539
0.1050
3 03 0 .1550
0.2050
0.2595
0.0539
0.1050
3 08 0 .1550
0.2050
0.2595
0.0539
0.1050
3 13 0 .1550
0.2050
0.2595
0.0539
0.1050
3 18 0 .1550
0.2050
0.2595
Table 1 - Variation o
concentratio
binary mixt
Temd g m / c c
1.0491
n
1.5019
1
2.3576
1 .0 787 1 .5 045 2 .4 447
1 .1 785 1 .5 076 2 .5 215
1 .2 777 1 .5 132 2 .6 151
1 .3 911 1 .5 188 2 .7 000
1 .0 379 1 .4 942 2 .3 342
1 .0 675 1 .5 012 2 .4 113
1 .1 673 1 .5 062 2 .4 981
1 .2 665 1 .5 114 2 .5 817
1 .3 799 1 .5 164 2 .6 556
1 .0 283 1 .4 928 2 .3 108
1 .0 579 1 .4 972 2 .3 810
1 .1 578 1 .5 029 2 .4 607
1 .2 569 1 .5 068 2 .5 349
1 .3 704 1 .5 126 2 .6 151
1 .0 180 1 .4 902 2 .2 974
1 .0 478 1 .4 939 2 .3 576
1 .1 479 1 .4 983 2 .4 279
1 .2 472 1 .5 035 2 .4 981
1 .3 608 1 .5 090 2 .5 683
f density, refractive index, dielectric con
n at four different temperature of bromofo
res
g
1.4983
1.1904
1.1160
1.1051
1.0489
1.1922
1.0611
1.0564
1.0369
0.9753
0.9682
0.9571
0.9497
0.9445
0.9181
0.9174
0.8796
0.8796
0.8674
0.8372
stant and g’ with
m (X2) + Benzene

8/17/2019 ijcsr-volume2-issue3 special issue
http://slidepdf.com/reader/full/ijcsr-volume2-issue3-special-issue 126/164
p er a u re
(K) X2
0.0519
0.1002
3 03 0 .151
0.1989
0.2461
0.0519
0.1002
3 08 0 .151
0.1989
0.2461
0.0519
0.1002
3 13 0 .151
0.1989
0.2461
0.0519
0.1002
3 18 0 .151
0.1989
0.2461
Table 2- Variation of d
concentration at four di
(X1)binary mixtures.
Temd g m / c c
0.8954
n
1.4912
1
2.6151
0 .9 208 1 .4 918 2 .8 492
0 .9 445 1 .4 882 3 .1 326
0 .9 694 1 .4 864 3 .2 705
0 .9 904 1 .4 814 3 .4 812
0 .8 842 1 .4 895 2 .5 917
0 .9 096 1 .4 889 2 .8 258
0 .9 333 1 .4 874 3 .0 896
0 .9 582 1 .4 832 3 .2 003
0 .9 792 1 .4 762 3 .3 641
0 .8 745 1 .4 872 2 .5 683
0 .9 1 .4 855 2 .8 024
0 .9 237 1 .4 832 2 .9 896
0 .9 486 1 .4 793 3 .1 003
0 .9 697 1 .4 738 3 .2 641
0 .8 643 1 .4 836 2 .5 449
0 .8 899 1 .4 819 2 .7 556
0 .9 138 1 .4 784 2 .8 96
0 .9 389 1 .4 762 2 .9 662
0 .9 601 1 .4 704 3 .0 833
nsity, refractive index, dielectric constant an
fferent temperatures of Ethyl bromide(X2)+
g
1.2236
0.9873
0.9379
0.808
0.7766
1.2008
0.9925
0.9249
0.7866
0.7399
1.1809
0.998
0.8602
0.7403
0.704
1.1714
0.9656
0.7991
0.6621
0.6167
d g¢ with
enzene

8/17/2019 ijcsr-volume2-issue3 special issue
http://slidepdf.com/reader/full/ijcsr-volume2-issue3-special-issue 127/164
IJCSR; 2(
References
Ajay Chaudhari, Anita Das, G
Narain and Suresh Mehrotra, P
Ajay Chaudhari, Raju, G S., A
J Pure & Appl Phys, 39 (2001)
Bordewijk, P., Kunst, M, and
Bottcher, C J F.,Theory of DielEberson, L. Caeboxylic Acids
Frohlich H,Theory of dielectri
Indira, T., Parthipan, G., AswKirkwood J G, J Chem Phys, 7
Krishnan, S., KanagasabapathKroeger, M K., J Mol. Liquids,
Manda, H., Frood, D G., Habib
3145.
Prajapati A N, Vyas A D, Ran
Purohit H D & Sengwa R J, J
Sengwa, R J., & Purohit, H D.,Thenappan, T., Sankar, U., J
Vir Singh Rangra., & Sharma,Vyas, A D., & Vashisth, V M.,
Yadava, S S., Aniruddh Yadav
3); 2016 http://www.drbgrpublications.in/ijcsr.p
rigipati Raju, Harish Chaudhari, Prakash Kh
roc. Natl. Counc. Roc (A), 25 (2001) 205-21
nita Das., Harish Chaudhari, Narain and Sure
180.
ip, A., J Phys Chem,77 (1973) 548.
ectric Polarization, Vol I, Elsevier , Amsterdaand Ester.Patai, Interscience, 1969.
s, (Clarendon Press, Oxford), 1958.
thaman, H., Thenappan, T, J Mol. Liquids, 1 (1939) 911.
, K, Lett. Asian Chem, 1(1) (1997) 37. 36 (1987) 101-108.
ullah, M., Humeniuk, L., & Walker, S. J Che
V A & Bhatnagar S P, Journal of Mol Liqui
olym Mater ,8 (1991) 317.
Poym. Int ., 29 (1992) 25. ol Liquids.,126 (2006) 23-28.
D R., Indian J Pure & Appl Phys, 41 (2003) J Mol Liquids, 38 (1988) 11-22.
, Indian J Pure & Appl Phys, 42 (2004) 338-
p; ISSN: 2454-5422
irade, Navinkumar
0.
sh Mehrotra, Indian
m (1973),
50 (2009) 22-24.
m Soc, 85 (1989)
ds, 151 (2010) 6.
630-633.
340.

8/17/2019 ijcsr-volume2-issue3 special issue
http://slidepdf.com/reader/full/ijcsr-volume2-issue3-special-issue 128/164
Volume: 2; Issue: 3 [Special Issue]; March-2016; pp 472-477. ISSN: 2454-5422
Z - Scan measurement and impedance analysis of L-alanine alaninium nitrate single
crystals (LAAN)
R. Jothi mani1*, P. Selvarajan2 and C.Parvathiraja1
1
Department of Physics, Sadakathullah Appa College, Tirunelveli, India.2Department of Physics, Aditanar College of Arts and Science, Tiruchendur, India.
*Corresponding Author E-mail: [email protected]
Abstract
L-alanine alaninium nitrate (LAAN) crystal is a semi-organic nonlinear optical material. XRD
analysis confirmed the monoclinic structure of LAAN crystal.SHG efficiency of the sample
show good value. Third order nonlinear optical studies using z-scan technique is done to find
open and closed aperture of LAAN crystal in order to estimate the nonlinear optical parameters.
The impedance analysis was also carried out for the sample to find out various electrical
properties as a function of frequency and temperature.
Keywords: Single crystal; XRD; Impedance; Third-order NLO; SHG
Introduction
Organic crystals with large second-order and third-order nonlinear susceptibilities are of greatinterest because of their potential use in optical parametric amplifier and oscillator in the
infrared region. Among the amino acids the L-alanine is a well-known organic nonlinear optical
material which has been examined by several researchers in the recent past on its crystal growth
and properties. The Z-scan technique is a popular method for the measurement of optical
nonlinearity of the material. It has the advantage of high sensitivity and simplicity and is used to
measure the third order nonlinear optical parameters. Impedance spectroscopy is a powerful
technique for the characterization of electrical behavior of optical material. This techniqueanalyzes the ac response of a system to a sinusoidal perturbation and subsequent calculation of

8/17/2019 ijcsr-volume2-issue3 special issue
http://slidepdf.com/reader/full/ijcsr-volume2-issue3-special-issue 129/164
IJCSR;
the impedance as a function of
in a complex plane, appears i
phenomena due to bulk materi
Nucleation kinetics parametdielectric analysis, etching stu
single crystals grown by slow
Mani, et al. In this work imp
discussed for the first time.
Materials and Method
L-alanine and nitric acid was
amount of reactance was d
homogeneous solution. Crystal
(accuracy + 0.01 oC) by slo
transparent, colourless and it is
Figu
Results and Discussions
Second Harmonic Generatio
The generation of second har
green light of halved wavelen
( 1064 nm) of Nd:YAG la
of grown sample is 2.1 times t
Third Harmonic Generation
Third-order NLO studies were
determining the nonlinear ind
2(3); 2016 http://www.drbgrpublications.in/ijcsr.
frequency of the perturbation. The output re
n the form of a succession of semicircle re
l, grain boundary effect and interfacial phen
rs, solubility, growth, hardness parameties and nonlinear optical analysis of L-alani
ooling technique is already reported for the
edance analysis and Z scan measurements
taken in 2:1 molar ratio to synthesis LAAN
issolved in double distilled water and
lization was allowed to take place in a const
cooling method. It is observed that the
well formed with sharp edges (figure 1).
e 1: Harvested crystals of LAAN
analysis
onics was confirmed as the LAAN crystal
gth (532 nm) when it is irradiated by fund
ser. It is observed from this study that the rel
at of the reference KDP crystal.
analysis
carried out by Z-scan technique. It is a st
x of refraction (n2), nonlinear susceptibilit
php; ISSN: 2454-5422
ponse, when plotted
presenting electrical
omena.
rs, XRD analysis, ne alaninium nitrate
first time by R.Jothi
of LAAN sample is
sample. Calculated
stirred well to get
ant temperature bath
grown crystals are
is found to produce
amental wavelength
ative SHG efficiency
ndard technique for
y (χ (3))and nonlinear

8/17/2019 ijcsr-volume2-issue3 special issue
http://slidepdf.com/reader/full/ijcsr-volume2-issue3-special-issue 130/164
IJCSR;
absorption coefficient (β). This
investigation along a focused
of the normalized transmitta
nonlinear absorption and nonli
This technique is also useful
nonlinear refractive index of t
valley, similarly the positive n
by transmittance peak.
Figure 2 : Op
The formulas for calculating n
The nonlinear absorption (β)
measured in open and close
nonlinear refractive index (n2
nonlinear absorption coeffici
saturation absorption process
10-6 (esu) is due to the π-electr
crystal. Z-scan data of LAAN
property and produces higher e
Impedance Analysis
Impedance spectroscopy is a
of NLO material. The comple
RC circuit with parallel combi
impedance (resistor and capac
-15 -10 -5 0 5
2
3
4
5
6
7
N o r m
a l i s e d
T r a n s m
i t t a n c e
( a r b
. u n i t s )
Z (mm)
O pen a
2(3); 2016 http://www.drbgrpublications.in/ijcsr.
method depends on the position (Z) of the t
aussian laser beam. Measurements of open
ce is made in order to estimate the inte
near refraction process and the curves are sh
o find the sign of nonlinear refractive inde
he sample shows transmittance peak follow
nlinear refractive index shows the transmitt
en and closed aperture mode of LAAN sa
onlinear optical parameters are already expl
and nonlinear refractive index (n2) of t
d aperture curves respectively. The nega
= 6.476 x10⁻¹⁰ cm2 /W) reveals the self-de
nt (β = 10.60 x10⁻⁵ cm/W) value exhi
f sample. And third-order nonlinear suscept
on cloud movement from the donor to the a
shows that the sample has better third or
nergy for optical applications.
owerful technique for the characterization o
impedance of the sample demonstrated as t
nation. Figure: 3 shows the real (Z’) and i
itor behavior) and both are decrease with ri
10 15
LAAN
perture mode
-15 -10 -5 0 5
1
2
3
4
5
6
N o r m
a l i s e d
T r a n s m
i t t a n c e
( a r b
. u n i t s )
Z (mm)
LA
C losed ape
php; ISSN: 2454-5422
in sample under the
and closed aperture
sity dependence of
wn in figure:2
x (n2). The negative
ed by transmittance
nce valley followed
ple
ined in literature[8].
e crystal has been
tive sign values of
focusing nature, the
its the two-photon
ibility (χ (3) = 4.489 x
ceptor of the grown
er nonlinear optical
f electrical behavior
he sum of the single
aginary (Z”) part of
se in frequency and
10
AN
rture mode

8/17/2019 ijcsr-volume2-issue3 special issue
http://slidepdf.com/reader/full/ijcsr-volume2-issue3-special-issue 131/164
IJCSR;
temperature and gives indicati
coincidence of the impedance
possible release of space char
different temperatures shows (
semicircular arcs and spikes h
due to the grain boundary (blo
bulk effect. This bulk effect a
LAAN material. The values
different temperatures have be
axis (table 1).
Figure 3: Variation of real
Figure 4: Nyquist plot an
0 1 2 3
-2
0
2
4
6
8
10
12
14
Z ' ( M Ω )
Log frequency
3
5
7
0 2 4 6 8
0
1
2
3
4
5
Z'(MΩ)
LAAN
- Z " ( M Ω
)
Nyquist Plot
2(3); 2016 http://www.drbgrpublications.in/ijcsr.
n of increasing conduction with temperature
( Z ’) at higher frequencies at all the tem
ge. A Nyquist plot (complex impedance sp
figure: 4) the transport response function. C
ave been observed. The low frequency sem
cking core) whereas the higher frequency s
rises due to the parallel combination of bu
of bulk resistance ( Rb) and grain boundar
en obtained from the intercept of the semicir
nd imaginary part of impedance (Z’ and
variations of Dc conductivity with tempe
sample
4 5
0oC
0oC
0oC
LAAN
0 1 2 3
0
1
2
3
4
5
Log frequency
3
5
7
- Z " ( M Ω )
LAAN
10 12 14
30oC
50oC
70oC
30 40 50
20
40
60
80
100
120
140
D c c o n d u c t i v i t y x 1 0 - 7 Ω m - 1
Temperature (o
LAAN
php; ISSN: 2454-5422
and frequency. The
eratures indicates a
ctrum) of LAAN at
aracteristically, one
icircle is considered
micircle depicts the
lk resistance ( Rb) of
resistance ( Rgb) at
cular arc on the real
”) with frequency
ature for LAAN
4 5
0oC
0oC
0oC
60 70
)

8/17/2019 ijcsr-volume2-issue3 special issue
http://slidepdf.com/reader/full/ijcsr-volume2-issue3-special-issue 132/164
IJCSR;
It is found that the values of Rb
negative temperature coefficie
Table: 1
Temperarure
305070
The dc conductivity values (
increase in conductivity with iin the material has been found
Conclusion
A nonlinear optical LAAN c
SCXRD analysis confirmed t
the sample. Nonlinear optical
measurements. Electrical pro
analyses shows that LAAN sa
Acknowledgement
The authors are grateful to the
India for the financial support
this work. Also the authors ar
Science, Tiruchendur for the
Engg college Tirunelveli, Cre
gratefully acknowledged for th
Reference
S.X. Dou, D. Josse, J. Zyss, J.
Lydia Carolin et al, Materials
Vimalan M., Ramanand A., Sa
Lucia Rose S.J., Selvarajan P.,
2(3); 2016 http://www.drbgrpublications.in/ijcsr.
and Rgb decreases with rise in temperature.
t of resistivity (LAAN) behavior like that of
C Bulk resistance Rb
(ohm)Grain bound
resistance Rgb (5.54 x103.70 x10 6
1.17 x10 6
3.48 x101.91 x10 6
0.58 x10 6
igure: 4) found by the formula DC = d/A
creasing temperature. The electrical relaxatito be temperature dependent
ystal was grown by slow cooling techniqu
e monoclinic structure with non-centrosym
analysis was carried out by Kurtz powder t
erties were determined by Impedance ana
ple is promising NLO material for optoelect
Department of Science and Technology (D
(Major project approval No.SR/S2/LOP-001
e thankful to the management of Aditanar
ncouragement given to us to carry out the
sent Engg College Chennai, SAIF cochin
eir support.
Opt. Soc. Am. B 10, 1708 (1993).
hemistry and Physics 114 (2009) 490.
gayaraj P., Cryst. Res. Tech. 42 (2007) 1091.
Perumal S., Mater. Chem. Phys., 130 (2011)
php; ISSN: 2454-5422
his shows the
insulator.
ary ohm)
R (ohm m)-1 show
on process occurring
e for the first time.
etric space group of
chnique and Z-scan
lysis. All the above
ronic applications.
ST), Government of
8/2010) to carry out
College of Arts and
research work. PSN
nd VIT Vellore are
950.

8/17/2019 ijcsr-volume2-issue3 special issue
http://slidepdf.com/reader/full/ijcsr-volume2-issue3-special-issue 133/164
IJCSR;
Sabari Girisun T.C, Dhanusko
Bharath D., Kalainathan S., Sp
Jothi Mani R., Selvarajan P. et
Jothi Mani R., Selvarajan P. et
Banarji Behera et al, J. Alloys
Arun K.J., Jayalekshmi S., J.
2(3); 2016 http://www.drbgrpublications.in/ijcsr.
i S., Cryst. Res. Technol. 44 (2009) 1297.
ectrochimica Acta Part A: 120 (2014) 32.
all, Int. J. Adv. Sci. Tec.Res., 3 (2013) 2249.
all, Int.J. Sci. Engi. App. Special Issue, (201
and Compounds 436 (2007) 226.
inerals & Materials Charac.Engi. 8 (2009) 6
php; ISSN: 2454-5422
) 83.
35.

8/17/2019 ijcsr-volume2-issue3 special issue
http://slidepdf.com/reader/full/ijcsr-volume2-issue3-special-issue 134/164
Volume: 2; Issue: 3 [Special Issue]; March-2016; pp 478-486. ISSN: 2454-5422
Studies on optical and mechanical properties of dl-malic acid doped ADP single crystals
I.Stella Jeya Christy1, A. Effie Cordelia1 and S. Perumal2
1Department of Physics, Sarah Tucker College (Autonomous), Tirunelveli, India.
2Physics Research Centre, S. T. Hindu College, Nagercoil, India.
Abstract
Nonlinear optical single crystals of DL malic acid doped Ammonium Dihydrogen Phosphate
were grown by slow evaporation solution growth method. The grown crystals were
characterized using X-ray diffraction studies. The possible functional groups present were
identified using Fourier Transform Infrared Spectroscopy. Optical parameters like
transmittance, absorbance, reflectance, optical absorption co-efficient, refractive index,extinction co-efficient, band gap energy, optical conductivity, electrical conductivity, electrical
susceptibility and real and imaginary parts of dielectric constant of the crystal were estimated
from UV-Vis-NIR spectrum. SHG efficiency was checked using Kurtz-Perry powder technique.
Third order nonlinear refractive index, nonlinear absorption co-efficient and third order
susceptibility had been calculated from Z-scan technique. Mechanical parameters such as work
hardening co-efficient, yield strength, elastic stiffness constant, fracture toughness and
brittleness index were obtained using Vicker’s microhardness studies.
Key Words: Solution growth, FTIR, UV-Vis-NIR spectrum, SHG, Z-scan technique, Vicker’s
micro hardness
Introduction
Ammonium Dihydrogen Phosphate, which is an important isomorph of Potassium Dihydrogen
Phosphate crystal, has been widely used for frequency conversion in laser systems, optical
switches and acousto optical devices. This hydrogen bonded compound also exhibits piezo
electric activity and low temperature order-disorder phase transition Below 148 5K ADP is

8/17/2019 ijcsr-volume2-issue3 special issue
http://slidepdf.com/reader/full/ijcsr-volume2-issue3-special-issue 135/164
IJCSR;
ferroelectric and belongs to P
paraelectric having I4/2d sy
applications in the field of pho
optic modulation. DL-malic ac
Because of this attempt, the S
better advantage of using these
Experimental Work
The commercially available A
2mole% of DL-malic acid is
ADP. The solution is put in
mixture and filtered. After le
colourless transparent single
selected and characterized. Th
Figu
Results and Discussion
FTIR SPECTRAL ANALYSI
BRUKER IFS 66V FTIR Spe
crystal. The spectrum was give
table1.
2(3); 2016 http://www.drbgrpublications.in/ijcsr.
212121 space symmetry group while above
metry [1]-[3]. This is also nonlinear opti
tonics for frequency mixing, parametric amp
id is an organic material which is chosen to
HG efficiency of ADP is found to increase
doped crystals in photonics and related field
R grade chemicals ADP and DL-malic acid
issolved in deionized water together with c
agnetic stirrer for about four hours to get
aving it in dust free undisturbed atmosphe
crystals had been harvested. Out of these
photograph of the grown crystal is given in
e 1.Photograph of the grown crystal
ctrometer was used to record the FTIR spe
n in fig.2 and the corresponding assignment
php; ISSN: 2454-5422
this temperature, it
cal material having
lification and electro
be doped with ADP.
so that we arrive at
s.
were purchased and
alculated amount of
highly homogenous
re for three weeks,
, fine crystals were
fig.1
ctrum of the grown
s [4],[5] are given in

8/17/2019 ijcsr-volume2-issue3 special issue
http://slidepdf.com/reader/full/ijcsr-volume2-issue3-special-issue 136/164
IJCSR;
wavenumber
in cm-1
3242
O-H st
vibrati
2410 band d
2294 combin
1634 O-H be
1444 H-H be
1407 bendin1289 CH2 ro
1102 P-O-H
917 P-O-H
549 PO4 vi
414 PO4 vi
2(3); 2016 http://www.drbgrpublications.in/ijcsr.
Fig. 2.FTIR Spectrum
Table 1-FTIR assignments
FTIR assignments
etching, P-O-H stretching , N-H
ns of ammonium
e to hydrogen bond
ation band
nding of water
nding of NH4
vibrations of ammoniumcking vibration
vibrations
vibrations
rations
rations
php; ISSN: 2454-5422

8/17/2019 ijcsr-volume2-issue3 special issue
http://slidepdf.com/reader/full/ijcsr-volume2-issue3-special-issue 137/164
IJCSR;
UV-VIS-NIR SPECTRAL S
Optical transmission spectrumin the wavelength region 400-1
Fig.3.transmittance,
Good transmittance for a wide
fabrication and this is achieved
280 nm. and the band gap ener
the refractive index(n) of the
Fig.4.Optical absorptio
Fig.5.Variation of optical
2(3); 2016 http://www.drbgrpublications.in/ijcsr.
UDIES
of the crystal was recorded using Lambda 35100nm and is shown in fig.3.
absorbance and reflectance as function of
region of wavelength is the required conditi
here. The cut off wavelength in the UV regi
gy from Tauc’s plot in fig.4 is 4.5 e V .[6],[7
rystal with wavelength is plotted in fig.5 .
coefficient and extinction coefficient vers
nd electrical conductivities and electrical s
photon energy
php; ISSN: 2454-5422
spectrophotometer
avelength
on for device
on is found to be
].The variation in
s wavelength
sceptibility with
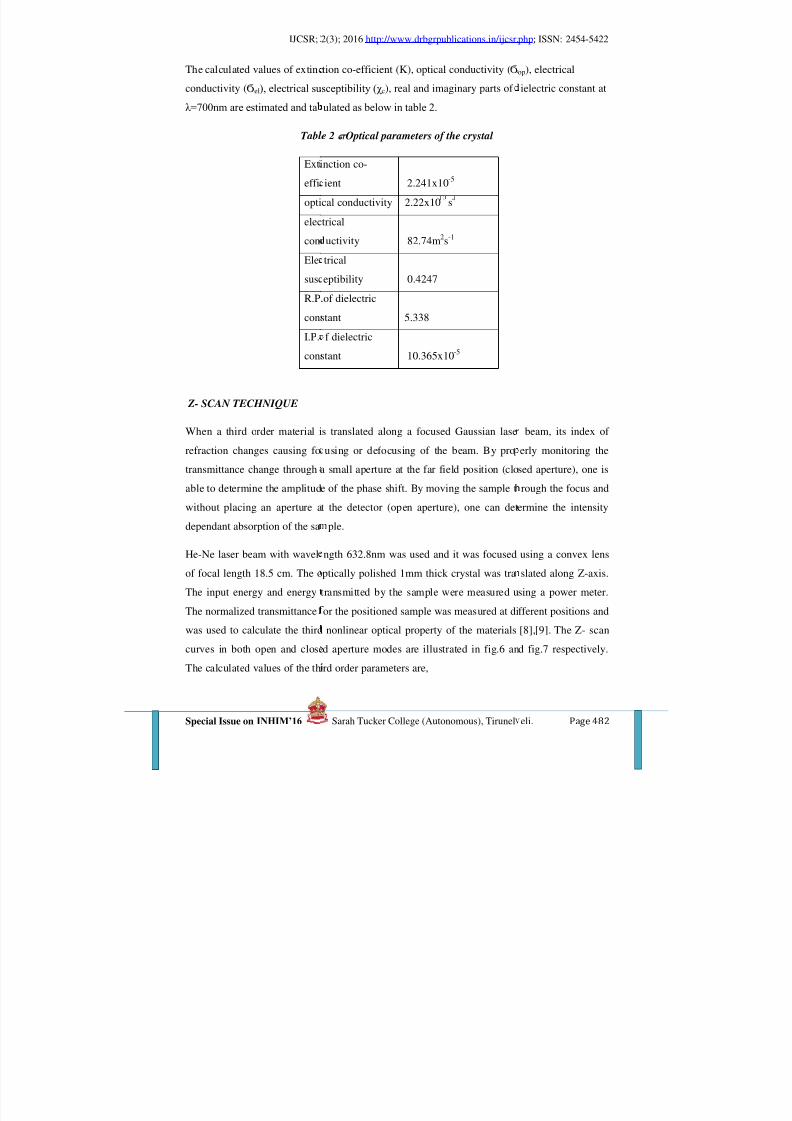
8/17/2019 ijcsr-volume2-issue3 special issue
http://slidepdf.com/reader/full/ijcsr-volume2-issue3-special-issue 138/164
IJCSR;
The calculated values of extinc
conductivity (Ϭel), electrical su
λ=700nm are estimated and ta
Tabl
Z- SCAN TECHNIQUE
When a third order material i
refraction changes causing fo
transmittance change through
able to determine the amplitud
without placing an aperture a
dependant absorption of the sa
He-Ne laser beam with wavel
of focal length 18.5 cm. The o
The input energy and energy
The normalized transmittance
was used to calculate the third
curves in both open and close
The calculated values of the th
Exti
effi
opti
elec
con
Ele
sus
R.P
con
I.P.
con
2(3); 2016 http://www.drbgrpublications.in/ijcsr.
tion co-efficient (K), optical conductivity (Ϭ
sceptibility (χ c), real and imaginary parts of
ulated as below in table 2.
e 2 – Optical parameters of the crystal
s translated along a focused Gaussian lase
using or defocusing of the beam. By pro
a small aperture at the far field position (clo
e of the phase shift. By moving the sample t
t the detector (open aperture), one can det
ple.
ngth 632.8nm was used and it was focused
ptically polished 1mm thick crystal was tra
transmitted by the sample were measured u
or the positioned sample was measured at di
nonlinear optical property of the materials
d aperture modes are illustrated in fig.6 an
ird order parameters are,
nction co-
ient 2.241x10⁻⁵
cal conductivity 2.22x10 s-
trical
uctivity 82.74m2s-1
trical
eptibility 0.4247
.of dielectric
stant 5.338
f dielectric
stant 10.365x10⁻⁵
php; ISSN: 2454-5422
op), electrical
ielectric constant at
beam, its index of
erly monitoring the
sed aperture), one is
rough the focus and
ermine the intensity
using a convex lens
slated along Z-axis.
sing a power meter.
fferent positions and
[8],[9]. The Z- scan
d fig.7 respectively.

8/17/2019 ijcsr-volume2-issue3 special issue
http://slidepdf.com/reader/full/ijcsr-volume2-issue3-special-issue 139/164
IJCSR;
nonlinear refractive index ( n2
nonlinear absorption co-efficie
the real and imaginary parts o
Im χ 3 = 5.193 x 10 -3esu.
Fig.6 . Z-scan – open aperture
3.4. VICKER’S MICROHAR
Mechanical strength of the m
Jianghong Gong el al, during
is converted to a strain energ
impression. The hardness of a
energy, De bye temperature, h
The Vicker’s hardness indenta
varied as 25g, 50g and 100g
was measured using Vicker’s
The indentation time was kept
using the relation
Hv = 1.8544 P/d 2 Kg/mm2
Where HV is Vicker’s microh
length of the indentation in m
2(3); 2016 http://www.drbgrpublications.in/ijcsr.
) = 2.6245x10⁻¹¹cm2 /W,
nt(β) = 7.512x10- 6cm/W,
f the third order susceptibility Re χ 3 = 3.601x
Fig.7. Z-scan- closed aperture
NESS TEST
aterial plays a key role in the device fabri
n indentation process, the external work ap
y component which is proportional to the
material is influenced by various paramete
at of formation and interatomic spacing.
tions were made on the cut and polished sa
nd the corresponding diagonal length of t
diamond indenter and attached to an incide
at 5s for all loads. The Vicker’s hardness nu
ardness number, P is the applied load in
. The variation of Hv with load P is shown i
php; ISSN: 2454-5422
10 -5esu ,
ation. According to
lied by the indenter
volume of resultant
s such as the lattice
mples and load was
he indentation mark
nt light microscope.
mber was calculated
g.,d is the diagonal
n fig.8.

8/17/2019 ijcsr-volume2-issue3 special issue
http://slidepdf.com/reader/full/ijcsr-volume2-issue3-special-issue 140/164
IJCSR;
Fig.8. Dependance of H v wi
Fig.10 . Depend
2(3); 2016 http://www.drbgrpublications.in/ijcsr.
th load Fig.9. Relation betwe
ence of various mechanical parameters wit
php; ISSN: 2454-5422
n log P and log d
load
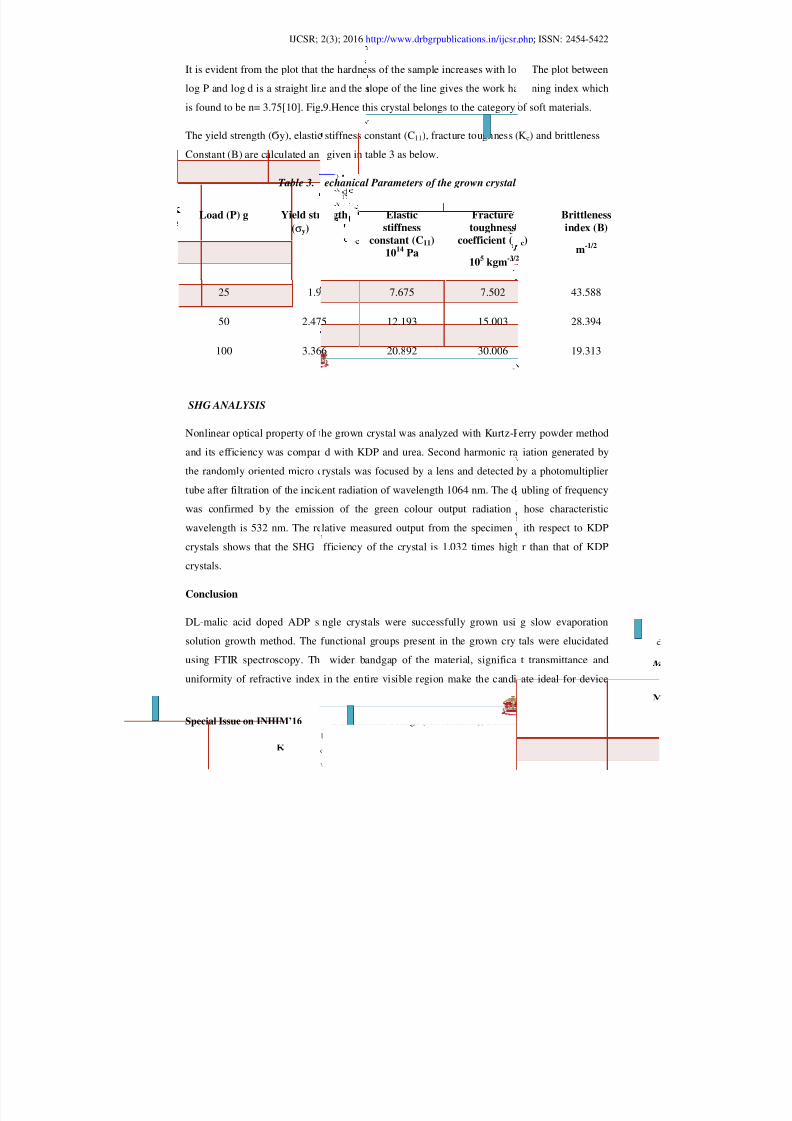
8/17/2019 ijcsr-volume2-issue3 special issue
http://slidepdf.com/reader/full/ijcsr-volume2-issue3-special-issue 141/164
IJCSR;
It is evident from the plot that
log P and log d is a straight lin
is found to be n= 3.75[10]. Fig.
The yield strength (Ϭy), elasticConstant (B) are calculated an
Table 3.
Load (P) g Yield str(σy)
25 1.9
50 2.47
100 3.36
SHG ANALYSIS
Nonlinear optical property of t
and its efficiency was compar
the randomly oriented micro c
tube after filtration of the incid
was confirmed by the emiss
wavelength is 532 nm. The re
crystals shows that the SHGcrystals.
Conclusion
DL-malic acid doped ADP si
solution growth method. The
using FTIR spectroscopy. Th
uniformity of refractive index
2(3); 2016 http://www.drbgrpublications.in/ijcsr.
the hardness of the sample increases with lo
e and the slope of the line gives the work ha
.9.Hence this crystal belongs to the category
stiffness constant (C11), fracture toughness (given in table 3 as below.
echanical Parameters of the grown crystal
ength Pa
Elasticstiffness
constant (C11)1014 Pa
Fracturetoughness
coefficient (
105 kgm-3/2
7.675 7.502
5 12.193 15.003
6 20.892 30.006
he grown crystal was analyzed with Kurtz-P
d with KDP and urea. Second harmonic ra
rystals was focused by a lens and detected
ent radiation of wavelength 1064 nm. The d
ion of the green colour output radiation
lative measured output from the specimen
fficiency of the crystal is 1.032 times high
ngle crystals were successfully grown usi
functional groups present in the grown crys
wider bandgap of the material, significa
in the entire visible region make the candi
php; ISSN: 2454-5422
d. The plot between
rdening index which
of soft materials.
Kc) and brittleness
c)
Brittlenessindex (B)
m-1/2
43.588
28.394
19.313
erry powder method
iation generated by
by a photomultiplier
ubling of frequency
hose characteristic
ith respect to KDP
r than that of KDP
g slow evaporation
tals were elucidated
t transmittance and
ate ideal for device

8/17/2019 ijcsr-volume2-issue3 special issue
http://slidepdf.com/reader/full/ijcsr-volume2-issue3-special-issue 142/164
IJCSR;
fabrication. Moreover, the crys
inferred from Z- scan techniq
withstand the processes involv
Acknowledgement
The authors are grateful to P
IISc, Bangalore for NLO-SH
studies.
Reference
1. M.E. Lines, A.M. Gl
materials, Clarendon P
2. N.G. Parsonage, L.A.K
3. L. Tenzer,B.C. Frazer,
H 2PO4 single crystals,
4. P. Rajesh, P. Ramas
characterization, Jour.
5. Briyan C.Smith, IR sp
New York6. Dhanaraj et al, Effect
properties of ADP crys
7. M. Senthil Pandian et a
and its analysis on
studies,Mat.Lett.62(20
8. R. DeSalvo, N. Sheik-
refraction and absorpti
9. M. Krishnakumar et a
properties of solution
monohydrate crystals,
10. E.M.Onitch, The prese
1950
2(3); 2016 http://www.drbgrpublications.in/ijcsr.
tal has self focusing nature and two photon a
ue. The mechanical strength of the crystal
d in device fabrication.
of. Sastikumar, NIT, Trichy for Z-scan an
G studies and St.Joseph’s College, Trich
ss, Principles and applications of Ferroe
ress,Oxford,1977
. Stavely, Disorder in Crystals, Clarendon P
R. Pepinsky, A neutron structure analysi
cta Crys.11(1958)505
my, Growth of DL-malic acid doped A
rys,Grow.311,(2009)3491-3497
ectral interpretation, A systematic approac
of amino acid additives on crystal gro
tals,Mate.Chem.Phy,112,(2008)490
l, Growth of TGS single crystals by conventi
the basis of mechanical, thermal, o
8)3830
ahae et al, Z-scan measurements of the ani
on in crystals, Optics Letters,Vol.18,no.3,19 l, Studies on the structural and third ord
grown 4-hydroxy-3 methoxy-4’ - N’ -metyls
ptical materials,Vol.36,no.5,988-995,2014
t status of testing hardness of materials, Mi
php; ISSN: 2454-5422
bsorption process as
is also sufficient to
alysis, Dr.P.K.Dhas,
for microhardness
lectrics and related
ress,1978
of tetragonal NH 4
P crystals and its
-CRC Press (1999)
th parameters and
onal and SR method
tical and etching
sotropy of nonlinear
-196 r nonlinear optical
tilbazolium tosylate
croscope, 95, 12-14,

8/17/2019 ijcsr-volume2-issue3 special issue
http://slidepdf.com/reader/full/ijcsr-volume2-issue3-special-issue 143/164
Volume: 2; Issue: 3 [Special Issue]; March-2016; pp 487-496. ISSN: 2454-5422
THERMAL AND DIELECTRIC PROPERTIES OF DL-MALIC ACID DOPED ADP
NLO SINGLE CRYSTALS
A.Roselin1, A. Sumathi1, A. Effie Cordelia1 and S. Perumal2
1Department of Physics, Sarah Tucker College, Tirunelveli, India
2Physics Research Centre, Nagercoil, Tamilnadu, India
Abstract
DL-malic acid doped ADP nonlinear optic single crystals were grown by solution method. The
thermal stability and the dielectric properties of the crystals were studied. Good thermal
stability and low dielectric loss of the crystals enable them as better candidates for opto
electronic device fabrication.
Keywords: Slow evoparation solution growth method, TG-DTA, AC conductivity, activation
energy
Introduction
Ammonium Dihydrogen Phosphate, which is an important isomorph of Potassium Dihydrogen
Phosphate crystal, has been widely used for frequency conversion in laser systems, optical
switches and acousto-optical devices. This hydrogen bonded compound also exhibits
piezoelectric activity and low temperature order-disorder phase transition. Below 148.5 K, ADP
is ferroelectric and belongs to P212121 space symmetry group while above this temperature, it is
paraelectric having I4/2d symmetry. This is also nonlinear optical material having applications
in the field of photonics for frequency mixing, parametric amplification and electro optic
modulation. DL-malic acid is a dicarboxylic acid which is chosen to be doped with ADP.
Because of this attempt, the SHG efficiency of ADP is found to increase so that we arrive at
better advantage of using these doped crystals ADPMA in photonics and related fields. These
l i l l f d d h i i ffi i

8/17/2019 ijcsr-volume2-issue3 special issue
http://slidepdf.com/reader/full/ijcsr-volume2-issue3-special-issue 144/164
IJCSR;
than ADP. To avail the maxi
of these crystals were analyzed
paper.
Method of crystal growth
Analar Reagent (AR) grade
DL-malic acid were purchase
crystal ADPMA , 2 mole % o
dissolved in double distilled
three hours and filtered. Th
transparent colourless nonli
photographs of the crystals are
Results and Discussion
Single crystal X-ray diffractio
The unit cell parameters and c
using BRUKER- NONIUS M
table 1.
Table 1 Cel
Sample System
ADPMA Tetrago
2(3); 2016 http://www.drbgrpublications.in/ijcsr.
um usage of these crystals, the thermal and
by the corresponding characterization tools
hemicals Ammonium Dihydrogen Orthoph
d commercially. To obtain DL-malic acid
f DL-malic acid along with the calculated a
ater The solution was stirred well using a
solution was kept undisturbed in dust
ear optical single crystals ADPMA w
shown in fig 1.
analysis
rystalline system of these three crystals AD
CH3 /CAD4 single crystal X-ray diffractom
l parameter values of ADPMA single crysta
a( ) b( ) c( )
nal 7.525 7.525 7.
Fig.1.Photograph of the grown crystal ADPMA
php; ISSN: 2454-5422
dielectric properties
and presented in this
osphate (ADP) and
doped ADP single
mount of ADP were
magnetic stirrer for
ree atmosphere till
re harvested. The
MA were found out
eter and tabulated in
s
V( )3
573 429

8/17/2019 ijcsr-volume2-issue3 special issue
http://slidepdf.com/reader/full/ijcsr-volume2-issue3-special-issue 145/164
IJCSR;
In ADPMA, the system in whi
The lattice parameters vary a l
cell.
Powder X-ray diffraction anal
The harvested crystals ADP
diffractions were recorded u
diffractometer with CuK (=
80 o at the rate of 2 per minut
from the crystallographic para
From the patterns 2 values wcan be estimated. The d-spac
using Bragg’s law 2dsin = n
n is the order of diffraction a
using the procedures of Lips
crystals ADPMA are plotted i
FTIR spectral analysis
The Fourier Transform Infra
chemical bonding and it provi
compound. The spectrum was
range using KBr pellet techniq
bending, twisting, rotating and
Fig.2.
2(3); 2016 http://www.drbgrpublications.in/ijcsr.
ch the material crystallizes remains the same
ittle and there is a small change noticed in th
ysis
MA were ground into fine powder and
ing X-ray diffractometer using BRUKER
1.5418 Å) radiation . The sample was scann
e. The crystalline phase structure of the sa
eters such as 2, d-spacing, relative intensit
re read directly and the relative intensity ofings corresponding to different peak positi
where d is the interplanar spacing, is the
d is the wavelength of X-rays used. The
on and Steeple. The powder X-ray diffrac
fig. 2 .
red spectral analysis has been carried ou
des useful information regarding the molec
recorded with Perkin Elmer FTIR spectrome
ue. Infrared absorption studies involve exam
vibrational modes of atoms in a molecule an
owder X-ray diffraction pattern of ADPMA
php; ISSN: 2454-5422
which is tetragonal.
e volume of the unit
the powder X-ray
AXS D8 advance
ed over the range 0-
ples was identified
y and hkl values.
the diffraction peaks ons were calculated
angle of diffraction,
peaks were indexed
tion spectra for the
t to understand the
ular structure of the
ter in 400-4000 cm-1
ination of stretching,
d hence to identified

8/17/2019 ijcsr-volume2-issue3 special issue
http://slidepdf.com/reader/full/ijcsr-volume2-issue3-special-issue 146/164
IJCSR;
the functional groups of the
frequencies and thus it is easie
The FTIR Spectra of the crys
assignments are displayed in ta
Tab
Wave number cm-1
3243
2410
2294
1634
14441407
1289
1102
917
549
414
O-H st
band d
combi
O-H b
H-H bbendin
CH2 ro
P-O-H
P-O-H
PO4 vi
PO4 vi
2(3); 2016 http://www.drbgrpublications.in/ijcsr.
samples. FTIR spectrum is interpreted
to characterize the substance.
tals ADPMA are given in fig.3 and the co
ble 2.
e 2 Spectral assignments for ADPMA
ADPMA
Assignments
retching, P-O-H stretching , N-H vibrations of ammo
ue to hydrogen bond
ation band
nding of water
nding of NH4
g vibrations of ammonium
cking vibration
vibrations
vibrations
brations
brations
Fig.3.FTIR spectrum of ADPMA
php; ISSN: 2454-5422
sing known group
rresponding spectral
nium

8/17/2019 ijcsr-volume2-issue3 special issue
http://slidepdf.com/reader/full/ijcsr-volume2-issue3-special-issue 147/164
IJCSR;
Thermal analysis
Studies of thermogravimetric
check the thermal stability and
thermal curves of the grown cr
In ADPMA, the crystal is fou
196.88 oC. No other endother
TGA, there is weight loss of 5
C and 600 C, a weight loss o
Dielectric studies
The dielectric properties of t
Precision LCR meter. The expoC over a frequency range 100
at different temperatures is sh
different temperatures is sho
variation with temperature at
these crystals have similar beh
Fig.4.
2(3); 2016 http://www.drbgrpublications.in/ijcsr.
and differential thermal analysis (TG-DTA)
to identify various endothermic and exothe
ystals ADPMA are given in fig.4.
d to be thermally stable upto 196.88 C an
ic and exothermic peak seen from DTA cu
1.3 % of the sample between 180 C and 23
f 33.3 % is observed.
he crystals ADPMA were determined usi
riment was conducted at various temperatur
Hz to 1 MHz The variation of dielectric con
own in fig. 5. The variation of dielectric lo
n in fig.6. Similarly these two dielectric
ifferent frequencies and these are plotted in
avior in which dielectric constant decreases
G-DTA thermogram for the crystal ADPMA
php; ISSN: 2454-5422
were carried out to
mic transitions. The
the crystal melts at
rve of the crystal. In
C. In between 280
g Agilent (4284A)
s from 40 oC to 140
stant with frequency
s with frequency at
arameters have the
fig. 7 and fig.8. All
with frequency and
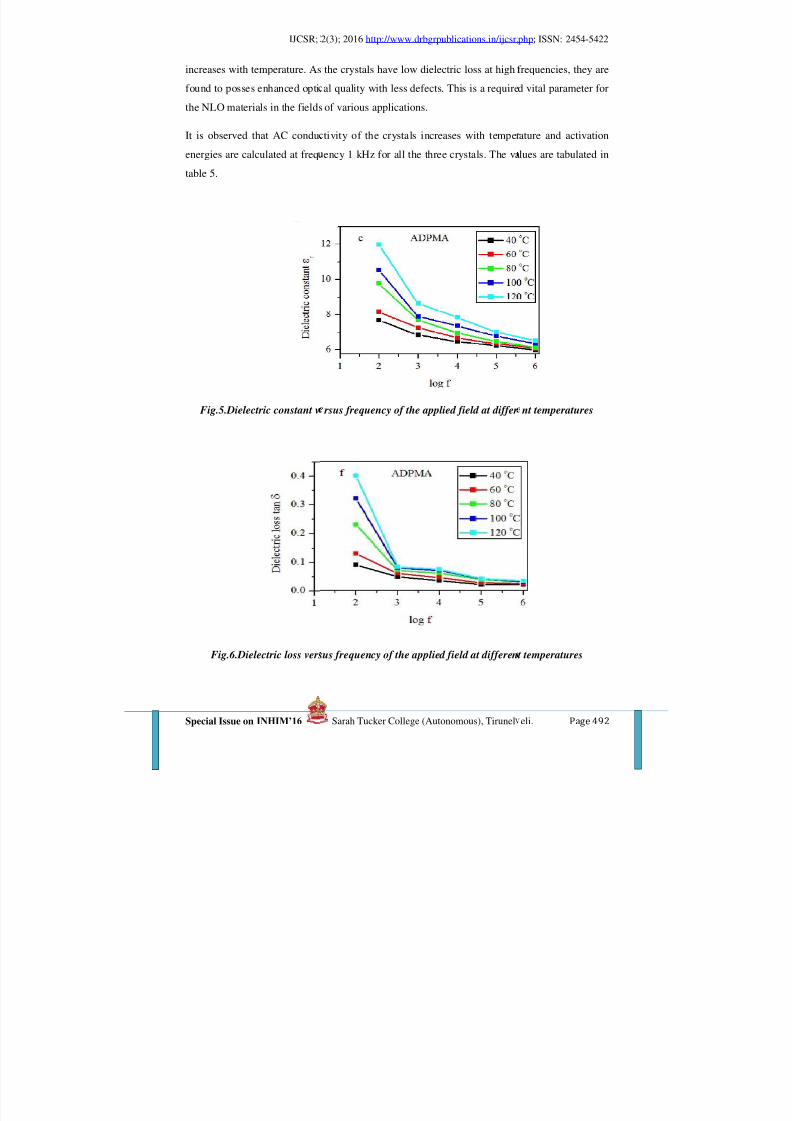
8/17/2019 ijcsr-volume2-issue3 special issue
http://slidepdf.com/reader/full/ijcsr-volume2-issue3-special-issue 148/164
IJCSR;
increases with temperature. As
found to posses enhanced opti
the NLO materials in the fields
It is observed that AC conduenergies are calculated at freq
table 5.
Fig.5.Dielectric constant v
Fig.6.Dielectric loss vers
2(3); 2016 http://www.drbgrpublications.in/ijcsr.
the crystals have low dielectric loss at high
al quality with less defects. This is a require
of various applications.
tivity of the crystals increases with temperency 1 kHz for all the three crystals. The va
rsus frequency of the applied field at differ
us frequency of the applied field at differen
php; ISSN: 2454-5422
frequencies, they are
d vital parameter for
ature and activation lues are tabulated in
nt temperatures
t temperatures

8/17/2019 ijcsr-volume2-issue3 special issue
http://slidepdf.com/reader/full/ijcsr-volume2-issue3-special-issue 149/164
IJCSR;
Fig.7.Dielectric c
Fig.8.Dielectri
2(3); 2016 http://www.drbgrpublications.in/ijcsr.
onstant versus temperature at different freq
loss versus temperature at different freque
php; ISSN: 2454-5422
encies
ncies

8/17/2019 ijcsr-volume2-issue3 special issue
http://slidepdf.com/reader/full/ijcsr-volume2-issue3-special-issue 150/164
IJCSR;
Table 3
Sample Frequency
Hz
40oC 60
ADPMA
102
103
104
105
10
6
7.68
6.83
6.46
6.23
5.97
8.
7.
6.
6.
6.
The values of AC co
frequencies and temperatures
9. Activation energy for the t
and shown in table 5.
Table 4 Variation of ac cond
Sample Frequency(Hz)
ADPMA
102
103
104
105
106
2(3); 2016 http://www.drbgrpublications.in/ijcsr.
Dielectric parameters of ADPMA crystals
Dielectric Constant
εr
Die
C 80 oC 100oC 120oC 40oC 60oC
.16
.25
.66
.34
.06
9.79
7.68
6.95
6.47
6.11
10.53
7.91
7.36
6.77
6.35
11.98
8.62
7.84
6.99
6.51
0.09
0.048
0.034
0.021
0.02
0.13
0.06
0.045
0.027
0.024
ductivity of the crystals ADPMA were ca
nd listed in table 3. The corresponding curv
ree grown crystals at frequency 1 kHz is ca
ctivity of the crystals ADPMA with frequen
σac x
10-6(Ωm)
-1
40o C 60o C 80o C 1000
0.00384
0.0182
0.022
0.727
6.636
0.006
0.024
0.246
0.951
8.083
0.0125
0.03
0.0332
1.366
9.848
0.018
0.035
0.028
1.54
10.94
php; ISSN: 2454-5422
lectric Loss
tanδ
80oC 100oC 120oC
0.23
0.07
0.06
0.038
0.029
0.32
0.08
0.07
0.041
0.031
0.4
0.082
0.074
0.041
0.033
lculated at different
es are plotted in fig.
lculated using fig.10
cy and temperature
1200 C
7
2
6
1
0.027
0.0393
0.0422
1.593
11.94
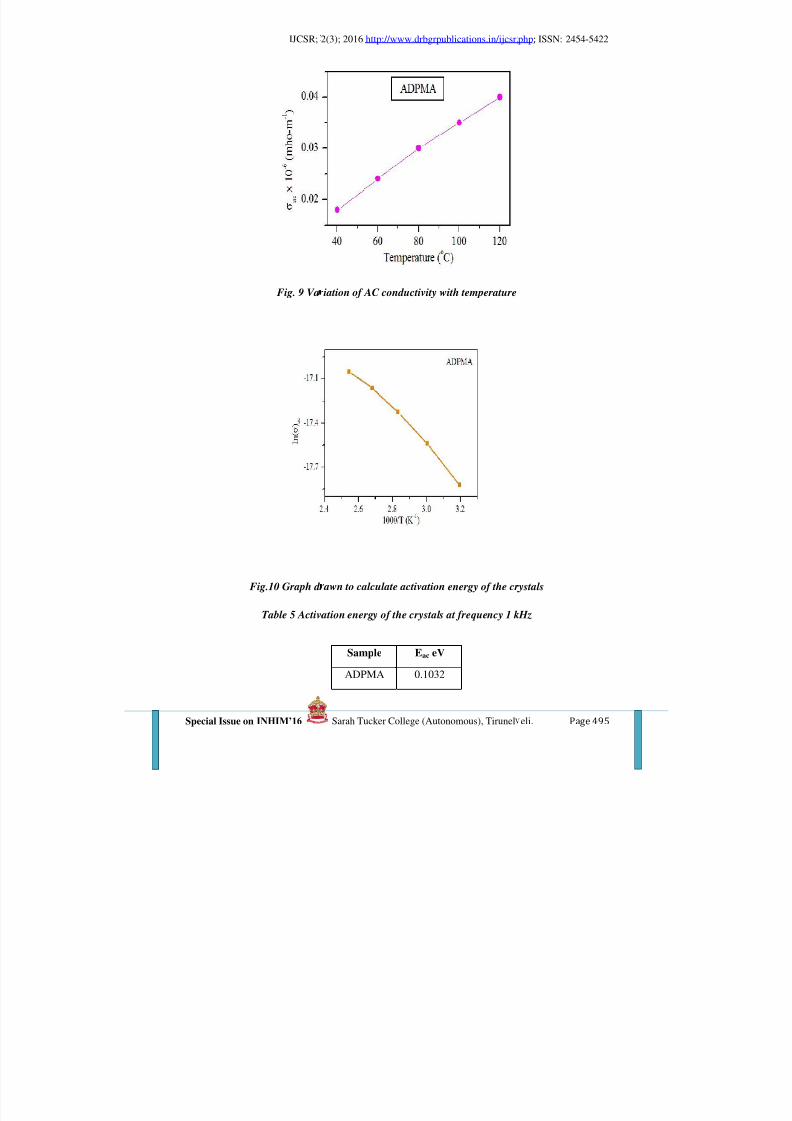
8/17/2019 ijcsr-volume2-issue3 special issue
http://slidepdf.com/reader/full/ijcsr-volume2-issue3-special-issue 151/164
IJCSR;
Fig. 9 Va
Fig.10 Graph d
Table 5 Activ
2(3); 2016 http://www.drbgrpublications.in/ijcsr.
iation of AC conductivity with temperature
awn to calculate activation energy of the cr
ation energy of the crystals at frequency 1 k
Sample Eac eV
ADPMA 0.1032
php; ISSN: 2454-5422
ystals
Hz

8/17/2019 ijcsr-volume2-issue3 special issue
http://slidepdf.com/reader/full/ijcsr-volume2-issue3-special-issue 152/164
IJCSR;
Conclusion
Novel NLO single crystal AD
growth method. The crystalli
crystal XRD analysis. Powdeplanes were indexed. The pos
from FTIR spectra. The hard
Thermal stability of the samp
were calculated and AC condu
dielectric studies.
Reference
1. M.E. Lines, A.M. Gl
materials, Clarendon P
2. N.G. Parsonage, L.A.K
3. L. Tenzer,B.C. Frazer,
H 2PO4 single crystals,
4. P. Rajesh, P. Ramas
characterization, Jour.
5. Briyan C. Smith, IR sp
New York
6. Dhanaraj et al, Effect
properties of ADP crys
7. M. Senthil Pandian et a
and its analysis on t
Mat.Lett. 62 (2008) 38
8. M. Krishnakumar et a
properties of solution
monohydrate crystals,
2(3); 2016 http://www.drbgrpublications.in/ijcsr.
PMA were grown successfully using slow
ne nature and lattice parameters were fou
XRD pattern of the crystals were obtainesible functional groups present in the cryst
ness studies revealed the mechanical stren
le was checked using TG-DTA analysis.
ctivity and activation energy of the crystals
ss, Principles and applications of Ferroe
ress, Oxford, 1977
. Stavely, Disorder in Crystals, Clarendon P
R. Pepinsky, A neutron structure analysi
cta Crys.11 (1958) 505
my, Growth of DL-malic acid doped A
rys. Grow.311, (2009) 3491-3497
ectral interpretation, A systematic approach
of amino acid additives on crystal gro
tals, Mate.Chem.Phy .112, (2008) 490
l, Growth of TGS single crystals by conventi
e basis of mechanical, thermal, optical
0
l, Studies on the structural and third ord
grown 4-hydroxy-3 methoxy-4’ - N’ -metyls
ptical materials, .36(5), 988-995, 2014
php; ISSN: 2454-5422
vaporation solution
nd out using single
d and the reflecting als were determined
gth of the crystals.
ielectric parameters
were estimated from
lectrics and related
ess,1978
of tetragonal NH 4
P crystals and its
- CRC Press (1999)
th parameters and
onal and SR method
nd etching studies,
r nonlinear optical
tilbazolium tosylate

8/17/2019 ijcsr-volume2-issue3 special issue
http://slidepdf.com/reader/full/ijcsr-volume2-issue3-special-issue 153/164
IJCSR;
Special Issue on INHIM’16
,
Volume: 2; Issue:
Solvothermal Synthesis and Ch
A.Suganthi*1, S.John Kennad
S.Karpagavalli5
*1&5Govindammal Adithanar College f
2&4 St. John’s College, Palayamkottai,
3 Principal,S.T.Hindu college,Nagercoil,
Manganese doped Copper oxid
thermal method using Copper ac
oxide nanoparticles. X-ray diff
sample is examined by Scannin
impurities present in the materi
doped copper oxide nanoparticle
Key words: Solvothermal, Nano
Introduction
In recent years, controlled sy
has attracted considerable intere
significant impact on their functi
P-type semiconductor oxide tha
applications. It has potentia
magnetic storage media and l
prepared by several methods r
state reaction to gas phase proc
powerful technique for generati
solvothermal technique provi
2(3); 2016 http://www.drbgrpublications.in/ijcsr.ph
arah Tucker College (Autonomous), Tirunelveli.
3 [Special Issue]; March-2016; pp 497-502. ISS
aracterization of Manganese Doped Copper
Like Nanostructures
y Vethanathan2, S.Perumal3, D.Priscilla
r Women, Tiruchendur, India.
ndia.
India.
Abstract
nanoparticles are synthesized by a microwa
etate as precursor. This gives a large scale pro
action pattern reveals cubic structure. The m
electron microscopy technique. The functiona
al are interpreted by FTIR. The optical prope
s are analyzed by UV-Visible spectroscopy.
particles
thesis of inorganic materials with well defi
st since the morphological diversity of inorgan
onal diversification and potential applications.
t is being widely studied due to its interestin
l applications in solar cells, Catalysis, el
ithium ion batteries. Copper oxide nanopar
nging from thermal reduction, sonochemial
ss. Among those, solvothermal process has be
ng novel materials with interesting propertie
es the alternative approach that allows
p; ISSN: 2454-5422
Page 497
N: 2454-5422
xide Flower
oilpillai4 and
ve assisted solvo
uction of Copper
orphology of the
l group and other
ty of manganese
ed morphologies
ic materials has a
opper oxide is a
g properties and
ctrode material,
icles have been
ethod and solid
en shown to be a
particularly the
the economical

8/17/2019 ijcsr-volume2-issue3 special issue
http://slidepdf.com/reader/full/ijcsr-volume2-issue3-special-issue 154/164
IJCSR;
Special Issue on INHIM’16
synthesis of fundamentally imp
The present work is focused
manganese doped copper oxid
method.
Materials and Methods
Copper (II) acetate monohydrat
hydrate are used as precursors.
dissolved in 100ml ethylene g
ethylene glycol. The solutions a
oven. Microwave irradiation i
completely. Colloidal precipita
distilled water and acetone to
atmospheric air.
Results
XRD analysis
The XRD pattern which is
nanoparticles is shown in fig.1.
Which was confirmed from the
(222) are corresponding to C
corresponding to Mn. No peaks
The average crystallite size was
D = k λ / βcos ,where K – Sch
and β–
Full width half maximum (FWH
2(3); 2016 http://www.drbgrpublications.in/ijcsr.ph
arah Tucker College (Autonomous), Tirunelveli.
rtant cell defined nanometer sized materials a
on the synthesis and characterization of n
e nanoparticle by a simple microwave assis
e, urea, ethylene glycol (solvent), Manganese
opper acetate and urea are taken in the molec
lycol as individually. Manganese acetate is
e mixed together. The solution is kept in a do
s carried out for 20 minutes till the solve
e is obtained. The precipitate is washed se
remove organic impurities. The prepared sa
btained in the present study for Mn dope
ll diffraction peaks can be indexed in the Cu2
CPDS 78-2076. The planes (110), (111), (200)
2O. The planes (002), (100), (101), (004
of impurities are found in XRD pattern.
estimated using Debye Scherrer’s equation ;
rrer constant, λ – Wavelength of the X-ray so
) of a diffraction peak
p; ISSN: 2454-5422
Page 498
mild conditions.
ano meter sized
ted solvothermal
(II) acetate tetra
ular ratio 1:3 and
lso dissolved in
estic microwave
nt is evaporated
veral times with
ple is dried in
d Copper oxide
cubic structure,
(220), (311) and
and (110) are
rce (1.5406 A0)

8/17/2019 ijcsr-volume2-issue3 special issue
http://slidepdf.com/reader/full/ijcsr-volume2-issue3-special-issue 155/164
IJCSR;
Special Issue on INHIM’16
I n
t e n
s i t y
( c o u
n t s )
* 0 0 2
* 0 0
2
* 0 0 2
* 0 0 2
T r a n s m
i t t a n c e
%
800
700
600
500
400
300
200
100
0
10
Fig 1FTIR analysis
The FTIR analysis is performed
3500 cm-1 and 1624cm-1 repr
attributed to C-H tensional .The
O) tremble respectively. The pe
cm-1 reveals the dopant Mn-O tr
150
Cu O: .2
Cu O: .2
100
50
0
4000
Fig 2: F
2(3); 2016 http://www.drbgrpublications.in/ijcsr.ph
arah Tucker College (Autonomous), Tirunelveli.
Cu2O: Mn (0.02)
CuO :Mn (0.06)2
*Mn
1 1 0
1 1 0
* 1 0 0
* 1 0 1
1 1 1
2 0 0
* 0 0
4
* 1 1 0
2 2 0
3 1 1 2 2
2
20 30 40 50 60 70 80
2 (degree)
: XRD spectrum of Mn doped Cu2O nanopa
by SHIMADZU MODEL-IRAFFINITY-1. T
sents (O-H) water tensional tremble. The pea
peak at 1458 cm-1 and 1384 cm-1 represen
ak at 986 cm-1 represents (O-C-O) tensional
emble respectively.
:Mn (0.02):Mn (0.06)
3500 3000 2500 2000 1500 1000 500
wavenumber(cm-1)
IRspectra of Mn doped Cu2O nanoparticles
p; ISSN: 2454-5422
Page 499
ticle
e peak at
at 2362 cm-1 is
ts (N-O) and (C-
tremble and 608
.
.

8/17/2019 ijcsr-volume2-issue3 special issue
http://slidepdf.com/reader/full/ijcsr-volume2-issue3-special-issue 156/164
IJCSR;
Special Issue on INHIM’16
SEM Analysis
In order to obtain insight inform
SEM analyses were performed.
Fig
2(3); 2016 http://www.drbgrpublications.in/ijcsr.ph
arah Tucker College (Autonomous), Tirunelveli.
ation about surface morphology and particle siz
ig.3. SEM image Cu2O: Mn (0.02g)
4 SEM image Cu2o: Mn (0.06g)
p; ISSN: 2454-5422
Page 500
e of the samples,

8/17/2019 ijcsr-volume2-issue3 special issue
http://slidepdf.com/reader/full/ijcsr-volume2-issue3-special-issue 157/164
IJCSR;
Special Issue on INHIM’16
283
294
A
b s o r b a n c e
SEM image reveals that Mn do
structure and the average size of t
UV – Visible analysis
UV-Visible absorption spectro
Mn doped copper oxide nanopa
is shown in Fig.5.It has been ob
around 294nm&283nm respectiv
1.0
0.9
0.8
0.7
0.6
0.5
0.4
0.3
0.2
400
Fig.5.Abs
Discussion
Mn doped Cu2O nanoparti
method. The XRD result gives
average size of Mn (2 wt%&
33nm respectively. The aver
confirmation. FTIR spectrum a
VISIBLE absorbance spectrum
This shift towards lower wavel
nanoparticles.
Acknowledgement
2(3); 2016 http://www.drbgrpublications.in/ijcsr.ph
arah Tucker College (Autonomous), Tirunelveli.
CuO: Mn(0.022
CUO:Mn(0.02
ed Copper oxide nanoparticles exhibit rose fl
he image is found out using Image J software.
scopy has been used to investigate the op
ticles. The absorption spectra of Mn doped C
erved that the samples exhibit an absorption e
ely. The energy band gaps are 4.23ev&4.39ev.
600 800 1000 1200 1400 1600 1800
Wavelength(nm)
orbance spectra of Mn doped Cu2O nanoparticles
les are synthesized by microwave assi
a cubic structure with lattice parameters a=b=
wt %) doped Cu2O nanoparticles are found
ge crystallite size from XRD is very ag
alysis gives the brief investigation of functi
reveals blue shift in case of higher Mn dopi
ngth could be attributed to the quantum conf
p; ISSN: 2454-5422
Page 501
)
)
ower like
ical properties of
2O nanoparticles
ge
ted solvothermal
c=4.267 A0 .The
to be 39nm and
reed with SEM
nal groups. UV-
ng concentration.
inement effect of

8/17/2019 ijcsr-volume2-issue3 special issue
http://slidepdf.com/reader/full/ijcsr-volume2-issue3-special-issue 158/164
IJCSR;
Special Issue on INHIM’16
I state my deep sense of devotio
ideas, outstanding guidance an
thank my family members and fr
References
K. Sanfra, C.K. Sarkar, M.K.
Fernandes, R. Silva, A.A.W.
Mater. Chem. Phys. 115 (2009)
S.C. Ray, Sol. Energy Mater. S
Z. Zhong, V. Ng, J. Luo, S.P. T
M. Arumugam, N. Selvaraj, S.
51.
J.F. Deng, Q. Sun, Y.L. Zhang,
M. Frietsch, F. Zudock, J. Gosc
P. Poizot, S. Laruelle, S. Gruge
D.P. Singh and N. Ali, Sci. Adv
C. B. McAuley, Y. Du, G. G.
(2008)230.
2(3); 2016 http://www.drbgrpublications.in/ijcsr.ph
arah Tucker College (Autonomous), Tirunelveli.
n to my guide Dr.S.John Kennady Vethanatha
constant source of inspiration at every stag
iends who rendered direct and indirect help.
ukherjee, B. Cosh, Thin Solid Films 213 (
echenleitner, E. Radovanovic, M.A.C. Melo
10-115.
l. Cells 68(2001) 307.
h, J. Teo and A. Gedanken, Langmuir 23 (2007
umar, P. Selvam and A. Sambandam, Sci. Ad
S.Y. Chen and D. Wu, Appl. Catal. A 139 (199
nick and M. Bruns, Sensors Actuators B 65 (2
n, L. Supont and J.M. Taracon, Nature 407 (20
. Mater. 2 (2010) 295.
ildgoose and R.G. Compton, Sensors Actuat
p; ISSN: 2454-5422
Page 502
for his precious
of this work. I
1992) 226. D.M.
, E.A.G. Pineda,
) 5971.
. Mater.2 (2010)
) 75.
02) 379.
0) 496.
rs B 135

8/17/2019 ijcsr-volume2-issue3 special issue
http://slidepdf.com/reader/full/ijcsr-volume2-issue3-special-issue 159/164
IJCSR;
Special Issue on INHIM’16
Volume: 2; Is
OPTICAL AND STRUC
MANG
S. Karpagavalli*1, S .John Ken
*1Govindammal Adithanar College for
2&4 St. John’s College, Palayamkottai,
3Principal, S.T.Hindu College, Nagercoi
5Govindammal Adithanar College for
*Corresponding Author Email Id: karthi
ABSTRACT Cobalt doped
solvothermal route. The structu
particle size was calculated fro
Scanning electron microscope (S
spherical geometry. The optical
spectroscopy. UV-Vis spectra illu
blue shift from the bulk value
interpreted by Fourier transform i
have many applications in theproperties. Manganese oxide is e
performance, it is a good electrod
Keywords: Cobalt doped MnO2 n
2(3); 2016 http://www.drbgrpublications.in/ijcsr.ph
arah Tucker College (Autonomous), Tirunelveli.
ue: 3 [Special Issue]; March-2016; pp 503-509.
URAL CHARACTERIZATION OF COBA
ANESE OXIDE NANOPARTICLES
nady Vethanathan2, S.Perumal3, D. Priscilla K
and A. Suganthi5
omen, Tiruchendur, India.
ndia.
l, India.
omen, Tiruchendur, India.
anganese oxide nano particles have been
al properties were analyzed by X-ray diffra
XRD data by using Scherrer equation and
M) analysis. The SEM image shows that the n
roperties were analyzed by Ultraviolet – Visi
strates that Cobalt doped Manganese oxide nan
(2.5 eV). The functional groups present in
nfrared (FTIR) spectral analysis. Manganese o
near future by virtue of its magnetic propenvironmental friendly in nature. Due to good
material for super capacitors and batteries.
noparticles, Solvothermal route, XRD, SEM a
p; ISSN: 2454-5422
Page 503
ISSN: 2454-5422
T DOPED
ilpillai4
synthesized by
tion (XRD). The
is confirmed by
noclusters having
le (UV-Vis)
o particles acquire
he material were
ide nano particles
ties and catalytic lectro mechanical
d UV-Vis

8/17/2019 ijcsr-volume2-issue3 special issue
http://slidepdf.com/reader/full/ijcsr-volume2-issue3-special-issue 160/164
IJCSR;
Special Issue on INHIM’16
Introduction: A nano structured
one dimension in the nanomete
nanowires and nano rods are mad
for their mechanical, magnetic,
catalyst.Compared to bulk activ
higher capacities, larger surfac
relatively new and interesting tec
have been synthesized in rem
techniques eliminate the use of hi
for fast, reproducible synthesis of
In the present investigation we re
by microwave-assisted solvothe
morphology is examined by S
impurities present in the material
and the optical properties were an
Materials and Methods: AR gra
NH2CONH2 (catalyst) andCobalt
materials. The calculated amount
molecular ratio 1:3 and dissolv
hydrate(2wt% and 6wt %) were t
the completely dissolved solutio
carried out till solvent evaporate
with double distilled water and
samples were dried in atmospheri
Results:
X-Ray diffraction analysis:The
byBruker AXS D8 Advance mo
Cobalt doped MnO2nano syste
diffraction peaks are well indexed
2(3); 2016 http://www.drbgrpublications.in/ijcsr.ph
arah Tucker College (Autonomous), Tirunelveli.
material is defined as a solid material charac
range. The inorganic nano materials such a
e from metals, semiconductors or oxides are of
optical, chemical and other properties.It i
electrode materials, the corresponding nan
area, and lower current densities.Solvothe
nique for the synthesis of oxide materials. Vari
arkably short time under microwave irradi
gh temperature calcination for extended periods
crystalline metal oxide nano particles.
ort the synthesis of Cobalt doped Manganese o
rmal methodand characterized by powder
anning electron microscope, the functional
were interpreted by Fourier transform infrare
alyzed by ultraviolet - visible spectroscopy.
de Manganese II acetate tetra hydrate (CH3CO
II acetate tetra hydrate (CH3COO)2Co.4H2Owe
of Manganese II acetate tetra hydrate and ure
d in 100ml ethylene glycol separately.Coba
aken along with the precursors.The solution w
was kept in a microwave oven.The microwa
d completely.The prepared samples were was
then with acetone (to remove organic impu
air and were used for characterization studies.
crystal structure and phase purity of the sa
el diffractometer. Fig 1 shows the X-ray dif
with different dopant concentration (2%
to the orthorhombic structure with lattice const
p; ISSN: 2454-5422
Page 504
erized by at least
s quantunm dots,
particular interest
widely used as
materials possess
rmal synthesis is
ous nanomaterials
tion. Microwave
of time and allow
xide nanoparticles
-ray diffraction,
groups and other
spectral analysis
)2Mn.4H2O, Urea
re used as starting
were taken in the
lt II acetate tetra
s stirred well and
ve irradiation was
hed several times
ities) the washed
ples are analyzed
raction pattern of
and 6%).All the
ants of

8/17/2019 ijcsr-volume2-issue3 special issue
http://slidepdf.com/reader/full/ijcsr-volume2-issue3-special-issue 161/164
IJCSR;
Special Issue on INHIM’16
a = 9.3720A0, b=2.8508 A
0,c=4.4
The crystallite size was estimated
Where, K – Shape factor ≈0.9, λ
half maximum (FWHM) of adiffrtable1.
-200
0
200
400
600
800
1000
1200
1400
1600
1800
2000
I n t e n s i t y ( c o u n t s )
Fig1: XRD pattern of MnO2:Co n
Table1: Lattice parameters of Mn
Sample
MnO2:Co(0.02)
MnO2:Co(0.06)
Scanning electron microscope
examined by JEOL Model JSM
Cobalt doped MnO2nanosystem
Fig 2a and Fig 2b.
2(3); 2016 http://www.drbgrpublications.in/ijcsr.ph
arah Tucker College (Autonomous), Tirunelveli.
06 A0
and α = β = γ = 900.
using Debye Scherrer’s equation; D = kλ / βcos
Wavelength of the X-ray source (1.5406 A0)
actionpeak.The crystallite size and lattice para
10 20 30 40 50 60 70 80
0 0 2
0 0 2
0 0 1
0 0 1
0 0 1
* 1 1 0
* 1 1 0
* 1 0 2
* 1 0 2
* 0 0 2
* 0 0 2
* 1 0 0
* 1 0 0
2 1 2
2 1 2
2 1 1
2 1 1
1 1 1
1 1 1
2 0 1
2 0 1
1 0 1
1 0 1
2θ (degree)
MnO2: Co (0.02)
MnO2 : Co (0.06)
anosystem
O2: Co (0.02 & 0.06)nano particles
Crystallite size
(nm)
Lattice parameter (A0)
a b c
40.0007
9.3720 2.8508 4.470634.2709
analysis: The morphology of the as-prep
- 6390LV Scanning electron microscope. Th
ith different dopant concentrations (2% and
p; ISSN: 2454-5422
Page 505
θ(m)
nd β – Full width
eters are given in
ared sample was
SEM images of
6%) are shown in

8/17/2019 ijcsr-volume2-issue3 special issue
http://slidepdf.com/reader/full/ijcsr-volume2-issue3-special-issue 162/164
IJCSR;
Special Issue on INHIM’16
Fig: 2a SEM image MnO2: Co (0.
Fourier transforminfrared spec
in the material were interpreted
Cobalt doped MnO2nano system
4000
20
40
60
80
100
120
140
160
T r a n s m i t t a n c e ( a . u . )
Fig: 3 FTIR spectra of Cobalt dop
UV-Vis spectroscopy: The op
Ultraviolet – Visible spectrometer.
doped MnO2nano system with
Visible absorption shows peak at
2(3); 2016 http://www.drbgrpublications.in/ijcsr.ph
arah Tucker College (Autonomous), Tirunelveli.
02) Fig:2bSEM image MnO2:
tral analysis: The functional groups and other
y SHIMADZU MODEL – IR AFFINITY -1.
ith dopant concentration (2% and 6%) is prese
3500 3000 2500 2000 1500 1000 500
3 3 9 4
3 3 9 4
4 8 6 . 0
6
6 1 7 . 2
2
6 7 1 . 2
3
7 6 3 . 8
1
9 3 3 . 5
5
1 0 2 6 . 1
3
1 3 4 2 . 4
6
1 4 1 1 . 8
9
1 5 6 6 . 2 5
3 2 . 3
5
6 1 7 . 2
2
6 7 1 . 2
3
7 6 3 . 8
1 9 3 3 . 5
5
1 0 2 6 . 1
3
1 3
4 2 . 4
6
1 4 1 1 . 8 9
1 5 6 6 . 2
Wave number (cm-1)
MnO2:Co (0.02)
MnO2:Co (0.06)
ed MnO2nano particle
ical properties were analyzed by Model V
.Fig 4 shows theUltraviolet – Visible absorbanc
ifferent dopant concentration (2% and 6%).
273nm due to Cobalt doped MnO2nano particle
p; ISSN: 2454-5422
Page 506
: Co (0.06)
impurities present
TIR spectrum for
nted in Fig3.
arian, Cary 5000
spectra of Cobalt
he Ultraviolet –
.

8/17/2019 ijcsr-volume2-issue3 special issue
http://slidepdf.com/reader/full/ijcsr-volume2-issue3-special-issue 163/164
IJCSR;
Special Issue on INHIM’16
Fig: 4 UV-Vis spectrum of Cobal
Discussions:
The particle size reduces with in
(201), (111), (211), (212), (001)
and(100), (002), (102), (110) pl
30nm to 40nm is very agreed wi
shows that the nanoclusters havi
variety of pores due to the evolu
synthesis. Highly porous nature
adsorption characteristics. The
vibrations of hydrogen bonde
671.23cm-1, 617.22cm-1represent
located at 532.35 cm-1& 401.19c
spectra illustrates that Cobalt do
bulk of MnO2nano particles (ie)
to the effect of quantum confinem
Acknowledgement
I would like to express my
KennadyVethanathanwhogave m
2(3); 2016 http://www.drbgrpublications.in/ijcsr.ph
arah Tucker College (Autonomous), Tirunelveli.
400 600 800 1000 1200 1400 1600
0.0
0.1
0.2
0.3
0.4
0.5
0.6
0.7
0.8 273
A b
s o r b a n c e ( a . u . )
Wavelength (nm)
MnO2:Co (0.02)
MnO2:Co (0.06)
doped MnO2nano particles
rease of dopant concentration. The Bragg refle
and (002) planes which corresponds to MnO
nes represents to Cobalt (JCPDS 05-0727). T
h the SEM by Image J software. The SEM im
ng spherical geometry. It consists of irregula
tion large amount of gases that are formed as
of cobalt doped manganese oxide nano parti
broad band at 3394.72 cm-1is associated w
surface water molecules and hydroxyl g
s MnO2 stretching, bending and wagging vib
-1 can be ascribed to the Co-O stretching and
ed Manganese oxide nano particles acquire b
.5 eV. Energy band gap increases with Cobalt
ent.
special thanks of gratitude to my g
the golden opportunity to do this wonderful w
p; ISSN: 2454-5422
Page 507
ctions from (101),
(JCPDS 44-0142)
he crystallite size
age confirmed the
r particles with a
by product during
cles enhances the
ith the stretching
roups.763.81cm-1,
rations. The band
wagging. UV-Vis
lue shift from the
concentration due
ide Dr.S John
rk on the topic

8/17/2019 ijcsr-volume2-issue3 special issue
http://slidepdf.com/reader/full/ijcsr-volume2-issue3-special-issue 164/164
IJCSR;
Optical and Structural characteriz
helped me in doing a lot of resear
helped me a lot in finalizing this
References:
Toupin M, Brousse T, Belanger
electro chemical capacitor. Chem
Belanger D, Brousse T, Long J
chemical capacitors. Electro che
SONG Rui, WANG Hong-jun a
particles and Effect of Temperat
2012, 28(4), 577-580
Huachunzeng supplementary mat
BM Pradeepkumar, SriramKarik
BM N bh h “S h i
2(3); 2016 http://www.drbgrpublications.in/ijcsr.ph
ation ofCobalt doped Manganese oxide nanop
h.I would also like to thank my family membe
aper within the limited time frame.
. charge storage mechanism of MnO2 electrod
Mater 2004, 16: 3184-3190
. Manganese oxides Battery materials make
Soc Interface 2008, Spring: 49-52
nd FENG Shou-hua “Solvothermal Preparatio
re on Particle Size” CHEM.RES.CHINES
rial (ESI) for journals of Materials chemistry (
at, R Hari Krishna , TH Udayashankara , K
d Ch i i f N M O
p; ISSN: 2454-5422
rticles which also
s and friends who
e used in aqueous
he leap to electro
n of Mn3O4 Nano
E UNIVERSITIES
010)
Shivaprasad and
d i d i