ijesmr i e s management r -...
TRANSCRIPT

[Parmar *, 4(12): December, 2017] ISSN 2349-6193
Impact Factor: 2.805
IJESMR International Journal OF Engineering Sciences &Management Research
http: // © International Journal of Engineering Sciences & Management Research
[12]
DETECTION OF WEEK ZONE IN EXISTING RCC STRUCTURE SUBJECTED
LOAD IN THE FORM OF AN ADDITIONAL STOREY AND CONSIDERATION OF
SEISMIC FORCES Siddharth Parmar
*1 & Vinay Dhakad
2
*1PG Student, Civil Engineering Department, BMCT, Indore
2Asst professor, Civil Engineering Department, BMCT, Indore
Keywords: Concrete; Steel; Jacketing; Strengthening.
ABSTRACT All over the world there are plenty of buildings which are vulnerable to damage or damaged by earthquake.
There are many buildings which are either designed without consideration of seismic forces or need to be
designed with consideration of revised code of earthquake. There are many buildings with the passage of time
they realize that their demands have increased and there is a need for the addition/alteration of the current
structure. This demand can be fulfilled by constructing a new storey or modification of structure. However,
provision for additional load due to the new construction over existing structure was not made in the structural
design of the old structure. All such buildings are needed to be retrofitted for additional forces developed due to
consideration of new storey and earthquake loads. It represents an opportunity to improve the overall
performance of an existing building. The present study investigates the structural performance of G+3
Commercial building under the additional load in the form of new storey and seismic forces. The structure is
analyzed for two load cases. In first case structure is analyzed for only gravity forces and no seismic force is
considered in this analysis while in second case structure is analyzed with consideration of seismic forces along with gravity forces of G+4 building. The analysis is performed by using structural analysis software i.e. STAAD
Pro. The analysis results of structure for gravity load cases STR-GR and seismic load cases STR-EQ are
compared to evaluate the effect of seismic forces on the structure. The results point out that the significant
increase is found in the shear force and bending moment in most of the beams. This increase of forces is more
considerable in plinth beams compared to roof beams. Similarly seismic forces causes increase in bending
moment mainly in the columns. The weak and deficient members are identified and strengthened for the
additional forces and moments. The strengthening of beams is done by connecting steel plates in the beams with
shear connectors and the columns are strengthened by steel angles section and battens.
INTRODUCTION Retrofitting of building is the technique of modifying something in structure after building was built.
Retrofitting of building includes maintenance, Rehabilitation and strengthening of building. It is improving the
performance of the building. Retrofitting are needed for building whose serviceability or strength cannot meet
the requirement of structural codes or buildings which are designed for earthquake forces but later on due to
change in earthquake code or regulation, irregular maintenance, aging of materials or have additional stories
built.
Evaluating of the retrofitting for the structure is an important, interesting, and challenging aspect of civil
engineering. It is a dynamic process However; they are a major concern when those week zones would have an
effect on the safety of people and property. Concerns with retrofitting have driven some of the most important
advances in our understanding of the complex behavior of structure. Extensive engineering and research studies
performed over the past 50 years provide a sound set of mechanical principles with which to attack practical
problems of strengthen of building.
Modern software such as STAAD-Pro is making it possible to handle ever-increasing Complexity in the
analysis. It is now possible to deal with complex stratigraphy, earthquake pressure conditions, additional story
loads and wind load. While modern software is making it possible to analyze ever-increasingly complex
problems, the same tools are also making it possible to better understand the performance of structure.
Computer-assisted graphical viewing of data used in the calculations makes it possible to look beyond the factor of safety.

[Parmar *, 4(12): December, 2017] ISSN 2349-6193
Impact Factor: 2.805
IJESMR International Journal OF Engineering Sciences &Management Research
http: // © International Journal of Engineering Sciences & Management Research
[13]
Literature Review
Vulnerability of structure related issues in natural as well as artificial is common challenges to both Researchers
and professionals. In construction areas, instability may result due to increase in wind load, earth quick, changes
in geometry, external forces, loss of strength in materials and change in loading conditions.
The engineering solutions to vulnerability problems require good understanding of analytical methods,
investigative tools and strengthening measures. A quantitative assessment of the safety is important when
decisions are made. The primary aim of structure analyses is to contribute to the safe and economic design.
Design of building should be done in such a way that they fulfils the guidelines given by IS codes and should be
stable in worst condition.
Several studies have been carried out to understand the influence of additional forces on the existing structure. These forces may be due to consideration of seismic force, wind load or due to any alteration in the building.
Various experimental and analytical investigations have been carried out to understand the behavior of the
retrofitted structure and also to know the amount of retrofitting requires.
Gomes A. and Julio A. J. (1997) studied on strengthening of RCC beams by jointly of steel plates according to
him, the members which are good quality of concrete and very less reinforcement can be retrofit with providing
external reinforcement. High strength steel bolts are used at the anchorage zone, near the end of plate it is
convenient .The efficiency is mostly depend on the connection behavior. Plates enhance inertia and the stiffness.
Surface preparation is very essential for concrete and steel bonding. Pneumatic needle hammer used for surface
preparation to increase the roughness. Extra roughness is also not suitable because it leads to increase thickness
of resin which decreases the bond capacity. Additional steel can be connected to beams or columns by inject epoxy resin. If provided resins only for the connections a steel plate should be of 5mm thick and 200mm wide
is used. Increases the thickness of resin leads to lower capacity of bond. At the time of retrofitting the live load
must be removed.
Sakino K. and Yuping S. Y. (2000) studied on Steel jacketing of column for upgrading strength and ductility,
On the basis of experiment results author and other Japanese researcher’s gave some design formulae’s for
square reinforced concrete columns retrofitted by the steel jacket. Using the ultimate strain, ε cm and the stress
block parameters, α and β, ultimate bending strength of the retrofitted RCC column sections can be precisely
evaluated. The formulae to find out values of the ε cm, α and β have been calculated on the basis of the
proposed stress-strain curve of concrete confined by the steel jackets. By the Arakawa’s equation shear strength
of the retrofitted RCC columns can be evaluated in a slightly conservative manner, on the basis of experiment
results he gave an empirical equation and it was widely used for the practical design of the ordinary RCC column in Japan. Evaluating the limit rotation angle, predicted the experimental deformation capacity he also
derives the design formula for of the retrofitted RCC columns with a reasonable accuracy.
Arlekar J. N. and Murty C. V. R. (2006) studied on Shear moment interaction for analysis and design of steel
beam to column connections that The design of beam-to-column connections for steel Moment Resisting
Frames he not consider the V-M interaction; the connections is designed for maximum probable moment and
corresponding shear which is expected to be developed in the beam. This paper, examines the shear-moment
interaction for AISC W-sections to analyze its effects on the connections of beam-to-column. For beams having
small L/d ratios, this design procedures for beam-to-column connections will result in an over design for
moment resistance and an under design for shear resistance. This can be unsafe, mostly in cases where the beam
shear is very higher, i.e. in short span beams. Design procedure to calculate the shear- moment interaction in the estimation of the connection, design forces needs to be developed.
Kothandaraman S. and Vasudevan G. (2009) has experimental study on Flexural retrofitting of RCC beams
using exterior bars at soffit level keeping the reinforcement externally at soffit level is found to be viable and the
moment carrying capacity of beams increased considerably. In case of under reinforced section the capacity can
be augmented up to 70%. By doing this the moment carrying capacity can be enlarged than that of the section in
which the entire reinforcement is embedded. This technique is very simple to implement and it can be used for
all types of beams. This technique doesn’t require any costly machineries, extra accessory or skilled labour. This
proposed method for strengthening of RCC beam is found to be very effective and advantageous taking into
consideration of the ductile behavior, load carrying capacity, crack control, reduction of deflection and its cost-
effective aspect.

[Parmar *, 4(12): December, 2017] ISSN 2349-6193
Impact Factor: 2.805
IJESMR International Journal OF Engineering Sciences &Management Research
http: // © International Journal of Engineering Sciences & Management Research
[14]
Obaidat Y. T. (2011) studied on use of FRP for structural retrofitting of concrete beam. By his experiments and
simulations he shows that retrofitting by FRP can increase load capacity and stiffness. The effect of retrofitting
in flexure is more effective than in shear. On the other hand, these simulations showed that an increase in the
amount of CFRP will in some cases decrease the maximum load capacity. This means that it is very important to
understand the behaviour of a retrofitted structure since an unsuitable arrangement of CFRP can make the
situation very dangerous.
Ruano G. et al (2012) has studied on Shear retrofitting of RCC beam with fibre reinforced made of steel. The
reinforce technique used with self compacting concrete with steel fibre reinforced in feasible to apply at
building elements. It is very appropriate to reduce the thickness of the steel jacketing, plastering can be optional
in this case it provides a good surface finish. So it reduce the plaster weight or can say it reimburse the weight.
FRC improves the structural properties of building.Beams strengthed by jacketing prevent the debonding, maintain the integrity of the beam. It not only increase the durability but it is also important with structural point
of view because if reinforcement gets debond its contribution gets vanished.
PROPOSED WORK The present study examine the structural behaviour of an RC frame (G+3Commercial building) under the
additional load in the form of seismic forces and new story. The structure is analyzed for two load cases. In first
case (Gravity load case) structure is analyzed for only gravity forces (G+3building) and no seismic force and
additional store forces is considered in this analysis while in second case (Seismic load case) structure is
analyzed with consideration of seismic forces along with gravity forces of (G+4 building). The analysis is performed by using software i.e. STAAD Pro. The analysis results of structure for gravity and seismic load
cases are compared to assess the effect of seismic forces on the RC structure. Weak zones of building are
detected by comparing the results and retrofitting technique is suggested for the weak zone. Two cases for the
compare of structure are
Case 1:- Structure with gravity loads only G+3(STR-GR)
Case 2:- Structure with earthquake loads of Zone III in addition to gravity loads G+4 (STR-EQ)
Modelling
Modelling is done for the structure, the details of which is illustrated in table
Table 1 Details of structure for modelling
Structure type RCC commercial
building
Storeys G + 3
Height of each storey 3.0m
Building plan size 20m x 20m
Building height 15.0m
Depth of foundation 2.0m below GL
Type of supports Fixed
Slab thickness each 150mm
Column size each 400mm x 400mm
Beam size 200mm x 450mm
Live load on each floor 4 KN m2
Live load on terrace 2.5 KN m2
Seismic zone Zone III
Live load with seismic force 50% (IS 1893:2002)
Steel grade Fe 415
Characteristic strength of concrete
(fck ) 25 N mm2
Damp 0.05
Poisson ratio 0.17

[Parmar *, 4(12): December, 2017] ISSN 2349-6193
Impact Factor: 2.805
IJESMR International Journal OF Engineering Sciences &Management Research
http: // © International Journal of Engineering Sciences & Management Research
[15]
Fig 1 Isometric view of proposed structure with Node Numbering
Fig 2 Isometric view of proposed structure with beam column numbering

[Parmar *, 4(12): December, 2017] ISSN 2349-6193
Impact Factor: 2.805
IJESMR International Journal OF Engineering Sciences &Management Research
http: // © International Journal of Engineering Sciences & Management Research
[16]
Fig 3 Region from which Beams and columns are considered for comparison
Fig 4 Region from which Beams are considered for comparison
Fig 5 Section A-A in frount of node 1 showing beam and column numbering

[Parmar *, 4(12): December, 2017] ISSN 2349-6193
Impact Factor: 2.805
IJESMR International Journal OF Engineering Sciences &Management Research
http: // © International Journal of Engineering Sciences & Management Research
[17]
Fig 6 Section B-B in frount of node 36 showing beam and column numbering
Fig 7 Section C-C in frount of node 71 showing beam and column numbering
Fig 8 Sectional plan in ground floor where beams are considered

[Parmar *, 4(12): December, 2017] ISSN 2349-6193
Impact Factor: 2.805
IJESMR International Journal OF Engineering Sciences &Management Research
http: // © International Journal of Engineering Sciences & Management Research
[18]
Fig 9 Sectional plan in 1st floor
Fig 10 Sectional plan in 2nd floor
Fig 11 Sectional plan in 3rd floor

[Parmar *, 4(12): December, 2017] ISSN 2349-6193
Impact Factor: 2.805
IJESMR International Journal OF Engineering Sciences &Management Research
http: // © International Journal of Engineering Sciences & Management Research
[19]
Fig 12 Sectional plan in 4th floor where beams are considered
Methodology
1 Modelling of G+ 3 structure in staad-pro software.
2 Analyze this structure for the gravity forces only and noted down forces in all the structural members.
3 An Additional one Storey introduces and modified the Forces in the Form of seismic force of Zone III and
additional dead and live load at the same structure noted down forces in all the structural members.
4 Identify the weak zones in beams and columns. Retrofitting the structural members for the additional forces
and moments on the structural members.
Load cases and combinations
According to IS 1893-2002
Load cases for analysis in staad-pro
Basic loads
EQ X = EQ in +X direction
EQ-X = EQ in -X direction
EQ Z = EQ in +Z direction
EQ-Z = EQ in-Z direction
DL = Dead load
LL = Live load
Combination of loads according to IS 1893:2002
1) 1.5 DL + 1.5 LL
2) 1.2 DL + 1.2 LL + 1.2 EQ X
3) 1.2 DL + 1.2 LL + 1.2 EQ-X
4) 1.2 DL + 1.2 LL + 1.2 EQ Z
5) 1.2 DL + 1.2 LL + 1.2 EQ-Z
6) 1.5 DL + 1.5 EQ X
7) 1.5 DL + 1.5 EQ-X
8) 1.5 DL + 1.5 EQ Z
9) 1.5 DL + 1.5 EQ-Z
RESULTS AND DISCUSSION The effects of the additional storey and earthquake forces on structure are studied in addition to gravity forces.
The comparison of shear forces, axial forces and bending moments are tabulated for two cases i.e. for STR-GR
and STR-EQ and their algebraic differences are tabulated for the calculation of strengthening requirement. Floor
wise results are discussed for different beams and columns. Subsequently the retrofitting method is used to
strengthen the weak member.

[Parmar *, 4(12): December, 2017] ISSN 2349-6193
Impact Factor: 2.805
IJESMR International Journal OF Engineering Sciences &Management Research
http: // © International Journal of Engineering Sciences & Management Research
[20]
STR-GR indicates the results of structure analyzed with gravity forces only and STR-EQ indicates the results of
structure analyzed with additional storey load and earthquake force in addition to gravity forces.
Effects on beam in term of shear force
The shear force and bending moment in beams and columns of different storeys are obtain and compared for
STR-GR and STR-EQ cases.
Effect on shear force in beam
The shear force in both the cases as for STR-GR and STR-EQ are compared for beams at each floor. Increase in
shear force with percentage are tabulated for each floor.
a) Plinth beams The shear force in plinth beams for STR-GR and STR-EQ cases are discussed. The increase in shear forces due
to application of STR-EQ cases in addition to gravity forces are shown in table 2.
Table 2 Comparison of Shear force Fy (kN) in plinth beams between STR-GR and STR-EQ case
Beam No
Shear force
Fy Increase
in
Shear force
% increase
in
shear force STR-GR STR-EQ
1 2 (2)-(1) % increase
1001 44.276 61.332 17.056 38.52%
1002 43.535 58.912 15.377 35.32%
1003 43.484 58.961 15.477 35.59%
1006 60.589 69.13 8.541 14.10%
1007 89.981 89.981 0 0.00%
1008 89.984 90.561 0.577 0.64%
1012 63.571 77.595 14.024 22.06%
1013 62.673 74.81 12.137 19.37%
1014 62.607 74.864 12.257 19.58%
1017 59.21 66.728 7.518 12.70%
1018 87.93 87.93 0 0.00%
1019 87.93 87.93 0 0.00%
1023 63.581 79.201 15.62 24.57%
1024 62.674 76.287 13.613 21.72%
1025 62.607 76.345 13.738 21.94%
From the above comparison it is revealed that there is an increase in shear force Fy in all the beams. The
maximum increase in shear force is found to be 17.056 kN in beam no 1001 with percentage increase of
38.52%.
b) First floor beams
The shear force in first floor beams for STR-GR and STR-EQ cases are discussed. The increase in shear forces
due to application of STR-EQ cases in addition to gravity forces are shown in table 3.

[Parmar *, 4(12): December, 2017] ISSN 2349-6193
Impact Factor: 2.805
IJESMR International Journal OF Engineering Sciences &Management Research
http: // © International Journal of Engineering Sciences & Management Research
[21]
Table 3 Comparison of Shear force (kN) in first floor beams between STR-GR and STR-EQ case
Beam No
Shear force
Fy Increase
In
Shear force
% increase
in
shear force
STR-GR STR-EQ
2001 43.741 70.1 26.359 60.26%
2002 43.559 66.959 23.4 53.72%
2003 43.484 67.012 23.528 54.11%
2006 59.912 76.34 16.428 27.42%
2007 88.887 97.211 8.324 9.36%
2008 88.881 98.937 10.056 11.31%
2012 63.427 88.617 25.19 39.71%
2013 62.751 84.547 21.796 34.73%
2014 62.607 84.583 21.976 35.10%
2017 59.147 73.845 14.698 24.85%
2018 87.85 94.4 6.55 7.46%
2019 87.852 96.006 8.154 9.28%
2023 63.414 90.784 27.37 43.16%
2024 62.751 86.54 23.789 37.91%
2025 62.607 86.58 23.973 38.29%
From the above comparison it is revealed that there is an increase in shear force Fy in all the beams. The maximum increase in shear force is found to be 27.37 kN in beam no 2023 and The maximum increase in shear
force is found in percentage increase is 60.26% in beam no.2001.
c) Second floor beam
The shear force in second floor beams for STR-GR and STR-EQ cases are discussed. The increase in shear
forces due to application of STR-EQ cases in addition to gravity forces are shown in table 4
Table 4 Comparison of Shear force (kN) in second floor beams between gravity and seismic load case
Beam No
Shear force
Fy
Increase
in
Shear force
% increase
in
shear force
STR-GR STR-EQ
3001 44.522 69.228 24.706 55.49%
3002 43.613 66.083 22.47 51.52%
3003 43.484 65.963 22.479 51.69%
3006 59.433 75.135 15.702 26.42%
3007 88.101 96.246 8.145 9.25%
3008 88.086 97.968 9.882 11.22%
3012 64.779 88.355 23.576 36.39%
3013 62.825 83.96 21.135 33.64%
3014 62.607 83.773 21.166 33.81%
3017 59.177 73.311 14.134 23.88%
3018 87.882 94.111 6.229 7.09%
3019 87.883 95.703 7.82 8.90%
3023 64.765 90.406 25.641 39.59%
3024 62.825 85.882 23.057 36.70%
3025 62.607 85.695 23.088 36.88%

[Parmar *, 4(12): December, 2017] ISSN 2349-6193
Impact Factor: 2.805
IJESMR International Journal OF Engineering Sciences &Management Research
http: // © International Journal of Engineering Sciences & Management Research
[22]
From the above comparison it is revealed that there is an increase in shear force Fy in all the beams. The
maximum increase in shear force is found to be 25.64 kN in beam no 3023. The maximum increase in shear
force is found in percentage increase is 55.49% in beam no.3001.
d) Third floor beam
The shear force in third floor beams for STR-GR and STR-EQ cases are discussed. The increase in shear forces
due to application of STR-EQ cases in addition to gravity forces are shown in table 5
Table 5 Comparison of Shear force (kN) in third floor beams between gravity and seismic load case
Beam No
Shear force
Fy
Increase
in
Shear force
% increase
in
shear force
STR-GR STR-EQ
4001 44.987 64.584 19.597 43.56%
4002 43.745 61.541 17.796 40.68%
4003 43.484 61.381 17.897 41.16%
4006 59.146 71.256 12.11 20.47%
4007 88.166 92.416 4.25 4.82%
4008 88.195 93.902 5.707 6.47%
4012 65.734 83.555 17.821 27.11%
4013 63.077 79.027 15.95 25.29%
4014 62.607 78.796 16.189 25.86%
4017 59.294 69.472 10.178 17.17%
4018 88.112 90.161 2.049 2.33%
4019 88.119 91.531 3.412 3.87%
4023 65.723 85.259 19.536 29.72%
4024 63.081 80.642 17.561 27.84%
4025 62.607 80.411 17.804 28.44%
From the above comparison it is revealed that there is an increase in shear force Fy in all the beams. The
maximum increase in shear force is found to be 19.59 kN in beam no 4001 with percentage increase of 43.56%.
e) Roof beam
The shear force in roof beams for STR-GR and STR-EQ cases are discussed. The increase in shear forces due to
application of STR-EQ cases in addition to gravity forces are shown in table 6

[Parmar *, 4(12): December, 2017] ISSN 2349-6193
Impact Factor: 2.805
IJESMR International Journal OF Engineering Sciences &Management Research
http: // © International Journal of Engineering Sciences & Management Research
[23]
Table 6 Comparison of Shear force (kN) in roof beams between STR-GR and STR-EQ case
Beam No
Shear force
Fy
Increase
in
Shear force
% increase
in
shear force
STR-GR STR-EQ
5001 26.067 56.733 30.666 117.64%
5002 25.885 54.437 28.552 110.30%
5003 25.484 53.993 28.509 111.87%
5006 37.622 64.824 27.202 72.30%
5007 67.454 90.148 22.694 33.64%
5008 67.489 90.219 22.73 33.68%
5012 45.436 74.592 29.156 64.17%
5013 45.253 70.785 25.532 56.42%
5014 44.607 70.175 25.568 57.32%
5017 36.771 63.516 26.745 72.73%
5018 65.477 88.293 22.816 34.85%
5019 65.477 88.302 22.825 34.86%
5023 45.383 75.744 30.361 66.90%
5024 45.252 71.928 26.676 58.95%
5025 44.607 71.309 26.702 59.86%
From the above comparison it is revealed that there is an increase in shear force Fy in all the beams. The
maximum increase in shear force is found to be 30.67 kN in beam no 5001 with percentage increase of 117.64%.
Effect on bending moment in beam
Sagging moment and hogging moment both are compared for the both cases as for STR-GR and STR-EQ.
Maximum of two hogging moments from both ends are taken for the comparison,
a) Plinth level beams
Table 7 Comparison of Sagging and hogging moment for STR-GR and STR-EQ in beams at plinth level.
Beam
no
STR-GR STR-EQ (Zone III) Increase in % increase
Max.
hogging
moment
Max.
Sagging
moment
Max.
hogging
moment
Max.
Sagging
moment
Hogging
moment
Sagging
moment
Hogging
moment
Sagging
moment
1 2 3 4 (3-1=5) (4-2=6) (5÷1=7) (6÷2=8)
1001 32.389 19.052 75.055 31.572 42.666 12.52 131.73% 65.71%
1002 32.33 17.629 71.562 25.844 39.232 8.215 121.35% 46.60%
1003 32.196 17.662 71.722 25.831 39.526 8.169 122.77% 46.25%
1006 56.72 31.986 93.175 35.664 36.455 3.678 64.27% 11.50%
1007 87.127 50.359 116.991 50.356 29.864 -0.003 34.28% -0.01%
1008 87.124 50.37 119.995 50.367 32.871 -0.003 37.73% -0.01%
1012 48.018 29.266 93.6 37.322 45.582 8.056 94.93% 27.53%
1013 48.322 27.165 89.627 30.958 41.305 3.793 85.48% 13.96%

[Parmar *, 4(12): December, 2017] ISSN 2349-6193
Impact Factor: 2.805
IJESMR International Journal OF Engineering Sciences &Management Research
http: // © International Journal of Engineering Sciences & Management Research
[24]
1014 48.156 27.2 89.627 30.958 41.471 3.758 86.12% 13.82%
1017 48.322 27.165 90.164 30.659 41.842 3.494 86.59% 12.86%
1018 85.068 47.29 113.46 47.303 28.392 0.013 33.38% 0.03%
1019 85.07 47.289 116.347 47.303 31.277 0.014 36.77% 0.03%
1023 48.032 29.271 96.915 39.048 48.883 9.777 101.77% 33.40%
1024 48.324 27.164 92.577 32.44 44.253 5.276 91.58% 19.42%
1025 48.156 27.2 92.775 32.414 44.619 5.214 92.66% 19.17%
Table 7 shows the bending moment for STR-GR and STR-EQ load cases in plinth beams. Here the increase in hogging moment is maximum for beam no 1023 as the value of the hogging moment is increased by 48.88 kNm.
Maximum increase in sagging moment is in beam no 1001 with the value is increased by 12.52 kNm The
maximum increase in percentage of hogging moment at this level beams is 131.73% in beam no 1001 and
maximum increase in sagging moment is in the same beam with the value is increased in percentage by 65.71%.
b) First floor beams
Table 8 Comparison of Sagging and hogging moment for STR-GR and STR-EQ.in beams at first floor
Beam
no
STR-GR STR-EQ (Zone III) Increase in % increase
Max.
hogging
moment
Max.
Sagging
moment
Max.
hogging
moment
Max.
Sagging
moment
Hogging
moment
Sagging
moment
Hogging
moment
Sagging
moment
1 2 3 4 (3-1=5) (4-2=6) (5÷1=7) (6÷2=8)
2001 31.332 19.041 95.699 44.184 64.367 25.143 205.44% 132.05%
2002 32.263 17.745 87.745 36.67 55.482 18.925 171.97% 106.65%
2003 32.209 17.649 87.837 36.743 55.628 19.094 172.71% 108.19%
2006 55.065 31.949 113.29 44.295 58.225 12.346 105.74% 38.64%
2007 84.452 50.299 138.738 52.806 54.286 2.507 64.28% 4.98%
2008 84.427 50.309 143.262 54.4 58.835 4.091 69.69% 8.13%
2012 47.743 29.251 119.124 49.323 71.381 20.072 149.51% 68.62%
2013 48.28 27.364 109.164 41.688 60.884 14.324 126.11% 52.35%
2014 48.176 27.18 109.164 41.688 60.988 14.508 126.59% 53.38%
2017 48.279 27.363 108.076 37.329 59.797 9.966 123.86% 36.42%
2018 84.754 47.405 133.581 47.44 48.827 0.035 57.61% 0.07%
2019 84.757 47.406 137.604 47.442 52.847 0.036 62.35% 0.08%
2023 47.713 29.256 123.63 52.582 75.917 23.326 159.11% 79.73%
2024 48.28 27.364 113.148 44.349 64.868 16.985 134.36% 62.07%
2025 48.176 27.179 113.253 44.355 65.077 17.176 135.08% 63.20%
Table 8 shows the bending moment for STR-GR and STR-EQ load cases for first floor beams. Here the increase
in hogging moment is maximum for beam no 2023 as the value of the hogging moment is increased by 75.91
kNm. Maximum increase in sagging moment is in beam no 2001 with the value is increased by 25.14 kNm The
maximum increase in percentage of hogging moment at this level beams is 205.44% in beam no 2001 and
maximum increase in sagging moment is in the same beam with the value is increased in percentage by
132.05%.
[Parmar *, 4(12): December, 2017] ISSN 2349-6193
Impact Factor: 2.805
IJESMR International Journal OF Engineering Sciences &Management Research
http: // © International Journal of Engineering Sciences & Management Research
[25]
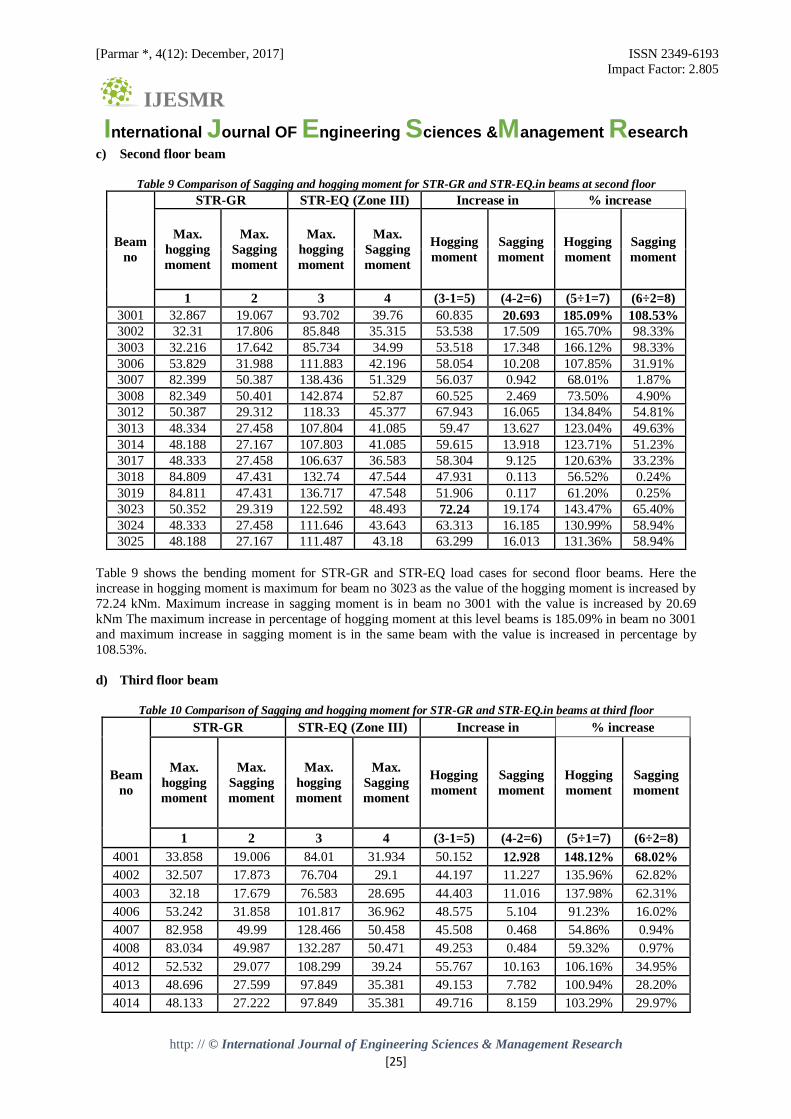
c) Second floor beam
Table 9 Comparison of Sagging and hogging moment for STR-GR and STR-EQ.in beams at second floor
Beam
no
STR-GR STR-EQ (Zone III) Increase in % increase
Max.
hogging
moment
Max.
Sagging
moment
Max.
hogging
moment
Max.
Sagging
moment
Hogging
moment
Sagging
moment
Hogging
moment
Sagging
moment
1 2 3 4 (3-1=5) (4-2=6) (5÷1=7) (6÷2=8)
3001 32.867 19.067 93.702 39.76 60.835 20.693 185.09% 108.53%
3002 32.31 17.806 85.848 35.315 53.538 17.509 165.70% 98.33%
3003 32.216 17.642 85.734 34.99 53.518 17.348 166.12% 98.33%
3006 53.829 31.988 111.883 42.196 58.054 10.208 107.85% 31.91%
3007 82.399 50.387 138.436 51.329 56.037 0.942 68.01% 1.87%
3008 82.349 50.401 142.874 52.87 60.525 2.469 73.50% 4.90%
3012 50.387 29.312 118.33 45.377 67.943 16.065 134.84% 54.81%
3013 48.334 27.458 107.804 41.085 59.47 13.627 123.04% 49.63%
3014 48.188 27.167 107.803 41.085 59.615 13.918 123.71% 51.23%
3017 48.333 27.458 106.637 36.583 58.304 9.125 120.63% 33.23%
3018 84.809 47.431 132.74 47.544 47.931 0.113 56.52% 0.24%
3019 84.811 47.431 136.717 47.548 51.906 0.117 61.20% 0.25%
3023 50.352 29.319 122.592 48.493 72.24 19.174 143.47% 65.40%
3024 48.333 27.458 111.646 43.643 63.313 16.185 130.99% 58.94%
3025 48.188 27.167 111.487 43.18 63.299 16.013 131.36% 58.94%
Table 9 shows the bending moment for STR-GR and STR-EQ load cases for second floor beams. Here the
increase in hogging moment is maximum for beam no 3023 as the value of the hogging moment is increased by
72.24 kNm. Maximum increase in sagging moment is in beam no 3001 with the value is increased by 20.69
kNm The maximum increase in percentage of hogging moment at this level beams is 185.09% in beam no 3001
and maximum increase in sagging moment is in the same beam with the value is increased in percentage by
108.53%.
d) Third floor beam
Table 10 Comparison of Sagging and hogging moment for STR-GR and STR-EQ.in beams at third floor
Beam
no
STR-GR STR-EQ (Zone III) Increase in % increase
Max.
hogging
moment
Max.
Sagging
moment
Max.
hogging
moment
Max.
Sagging
moment
Hogging
moment
Sagging
moment
Hogging
moment
Sagging
moment
1 2 3 4 (3-1=5) (4-2=6) (5÷1=7) (6÷2=8)
4001 33.858 19.006 84.01 31.934 50.152 12.928 148.12% 68.02%
4002 32.507 17.873 76.704 29.1 44.197 11.227 135.96% 62.82%
4003 32.18 17.679 76.583 28.695 44.403 11.016 137.98% 62.31%
4006 53.242 31.858 101.817 36.962 48.575 5.104 91.23% 16.02%
4007 82.958 49.99 128.466 50.458 45.508 0.468 54.86% 0.94%
4008 83.034 49.987 132.287 50.471 49.253 0.484 59.32% 0.97%
4012 52.532 29.077 108.299 39.24 55.767 10.163 106.16% 34.95%
4013 48.696 27.599 97.849 35.381 49.153 7.782 100.94% 28.20%
4014 48.133 27.222 97.849 35.381 49.716 8.159 103.29% 29.97%

[Parmar *, 4(12): December, 2017] ISSN 2349-6193
Impact Factor: 2.805
IJESMR International Journal OF Engineering Sciences &Management Research
http: // © International Journal of Engineering Sciences & Management Research
[26]
4017 48.696 27.599 97.033 32.943 48.337 5.344 99.26% 19.36%
4018 85.189 47.626 122.851 47.538 37.662 -0.088 44.21% -0.18%
4019 85.201 47.632 126.273 47.543 41.072 -0.089 48.21% -0.19%
4023 52.512 29.076 111.843 41.371 59.331 12.295 112.99% 42.29%
4024 48.701 27.601 101.084 37 52.383 9.399 107.56% 34.05%
4025 48.133 27.222 100.932 36.452 52.799 9.23 109.69% 33.91%
Table 10 shows the bending moment for STR-GR and STR-EQ load cases for third floor beams. Here the
increase in hogging moment is maximum for beam no 4023 as the value of the hogging moment is increased by
59.33 kNm. Maximum increase in sagging moment is in beam no 4001 with the value is increased by 12.93
kNm The maximum increase in percentage of hogging moment at this level beams is 148.12% in beam no 4001
and maximum increase in sagging moment is in the same beam with the value is increased in percentage by
68.02%.
e) Roof beam
Table 11 Comparison of Sagging and hogging moment for STR-GR and STR-EQ.in beams at roof floo
Beam
no
STR-GR STR-EQ (Zone III) Increase in % increase
Max.
hogging
moment
Max.
Sagging
moment
Max.
hogging
moment
Max.
Sagging
moment
Hogging
moment
Sagging
moment
Hogging
moment
Sagging
moment
1 2 3 4 (3-1=5) (4-2=6) (5÷1=7) (6÷2=8)
5001 19.44 13.584 67.853 23.02 48.413 9.436 249.04% 69.46%
5002 20.651 12.01 62.312 21.669 41.661 9.659 201.74% 80.42%
5003 20.215 11.643 61.77 20.906 41.555 9.263 205.57% 79.56%
5006 35.928 23.488 85.506 31.472 49.578 7.984 137.99% 33.99%
5007 66.086 43.208 111.142 49.606 45.056 6.398 68.18% 14.81%
5008 66.108 43.275 113.876 49.602 47.768 6.327 72.26% 14.62%
5012 34.288 24.726 89.881 30.046 55.593 5.32 162.14% 21.52%
5013 36.883 21.764 81.129 28.346 44.246 6.582 119.96% 30.24%
5014 36.169 21.186 81.128 28.346 44.959 7.16 124.30% 33.80%
5017 36.519 20.769 81.927 30.327 45.408 9.558 124.34% 46.02%
5018 66.219 38.132 106.428 47.827 40.209 9.695 60.72% 25.42%
5019 66.22 38.131 108.894 47.836 42.674 9.705 64.44% 25.45%
5023 34.148 24.759 92.283 31.107 58.135 6.348 170.24% 25.64%
5024 36.884 21.761 83.406 29.115 46.522 7.354 126.13% 33.79%
5025 36.168 21.187 82.68 28.187 46.512 7 128.60% 33.04%
Table 11 shows the bending moment for STR-GR and STR-EQ load cases for roof floor beams. Here the increase
in hogging moment is maximum for beam no 5023 as the value of the hogging moment is increased by 58.13 kNm. Maximum increase in sagging moment is in beam no 5019 with the value is increased by 9.70 kNm The
maximum increase in percentage of hogging moment at this level beams is 249.04% in beam no 5001 and
maximum increase in sagging moment in beam no 5002 by 80.42%
Strengthening of beams
Beams are failed in shear and flexure due to STR-EQ. Strengthening of beams is done for the flexure and shear,
to reach the strength of the structural member up to the require strength.
Strengthening of beams for flexure
Strengthening of beams is done by adding steel plate of equivalent area of reinforced bars. Plate is designed for
the additional area of steel required for STR-EQ case.

[Parmar *, 4(12): December, 2017] ISSN 2349-6193
Impact Factor: 2.805
IJESMR International Journal OF Engineering Sciences &Management Research
http: // © International Journal of Engineering Sciences & Management Research
[27]
Equivalent mild steel area:-
The additional area of reinforcement bars are found by the comparison of analysis of STR-GR and STR-EQ
cases, the obtained additional required steel is of tor steel. But for the retrofitting mild steel plate is available in
market, the area of equivalent mild steel plate can be found by force equilibrium.
For tor steel (Fe 415 N mm2 ) area for 1200 mm2
Ast 1= 1200 mm2, fy1
= 415 N mm2
fy2 = 250 N mm2 , Ast 2
= Area of Mild steel
So Ast 2= (
415
250) × 1200 = 664 mm2
Similarly equivalent area of mild steel, as given in table below
Design of steel plate for required additional reinforcement
Select different range from the tables for additional Ast (mm2) of fy = 250 N mm2
Table 12 Plate sizes showing for different range of equivalent mild steel area
Serial
Number
Additional reinforcement area
required (Fe 415)
Corresponding mild steel area
required
(Fe 250)
Plate size used
1 Up to 400 664 120 x 8
2 400-600 996 120 x 10
3 600 -800 1328 120 x 12
4 800 -1000 1660 120 x 14
5 1000 -1200 1992 150 x 14
Design of shear connector for flexure
Shear connector has to be design for every beam column joints for the maximum moment in that beam. Shear connector will transfer the additional force coming at existing reinforcement level to the outer plate which is
designed for different beams. So the force which is to be transfer to the outer plate is to be calculated. These
connectors are used for either top plate for hogging moment or bottom plate for sagging moment. As every
beam will have different additional moment, the force for which shear connector will design will be different.
Here shear connector is designed for the maximum moment developed among all the beams of the structure.
So for this, we have
Force = moment
Lever arm ………………………….……….eqn 1
Here lever arm L.A. = (d-0.42xu) ………………….eqn 2
But for xu ,
M = 0.36 fck x b xu x (d-0.42xu) …………….…….eqn 3
Maximum additional moment = 75.91 kNm
Calculation of force for this maximum additional moment is given below,
Finding xu for max of sagging and hogging moment by eqn 3
Max hogging moment = -75.91 kNm
Therefore we have,
75.91 x 106 = 0.36 x 25 x 200 xu x (367 – 0.42xu)
75.91 x 106 = 660600xu-756 xu2
xu = 136.11mm
Put this xu in eqn 2
L.A. = 367 – 0.42 x 136.11mm
L.A. = 309.83 mm
Now additional force which is to be carried by stud
F = M
L.A. =
75.91 x 10⁶
309.83

[Parmar *, 4(12): December, 2017] ISSN 2349-6193
Impact Factor: 2.805
IJESMR International Journal OF Engineering Sciences &Management Research
http: // © International Journal of Engineering Sciences & Management Research
[28]
F = 245005.32 N= 245.00 kN
Now designing the shear connector for the above force using IS 11384:1985 code
From table 1, we have
For 22 mm diameter of stud, 100 mm height and for M25 concrete
Strength of Shear connector F = 77.5 kN
Provide 4 shear connectors to resist the design shear force.
Strengthening of beams for shear
Steel plates are used at side face of the beams for resist additional shear force. Side face steel plates used one
side or both side of beams.
The maximum force is taken among from all the floors and all the beams as 30.67 kN.
Take mild steel plate as Fe 250 for practical purpose. Permissible stress for mild steel plate in shear is 140
N mm2 So for this,
Area of steel plate = Force
Permissible stress in plate
So As = 30670
140 = 219.07 mm2
Assume depth of the plate is 200 mm
So thickness of plate will be 235.79
200 = 1.09 mm≈ 2 mm
But for the practical purpose take plate of size 200mm x 4mm.
Design of shear connector for shear
To transfer the shear stresses from existing shear reinforcement to outer plate, Shear connectors are used
according to IS: 11384-1985.
As the maximum additional shear force among all the floors and all the beams is 30.67 kN. So for this,
By table 1 of IS: 11384-1985 gives the Design strength of shear connectors for different concrete strengths.
Strength of shear connector for 12mm dia. and 62mm height used in M25 is 25.50 kN. So, two shear connectors
are needed to resist shear force of 30.67 kN.
Effects of additional seismic forces on beams
The results point out that the significant increase found in the shear force and bending moment in most of the
beams. The comparison of critical value of shear force, hogging moments and sagging moments at each floor
level is depicted in table 13
Table 13 Effects of Seismic load case on beams
Comparison of maximum shear force (kN) in
beam
Floor
Max shear force
STR-GR STR-EQ %
increase
Plinth beam
44.276 ( LC
STR-GR 101)
61.332(LC
STR-EQ 108)
38.52%
First floor
beam
43.741 (LC
STR-GR
101)
70.1(LC
STR-EQ
109)
60.26%
Second
floor
beam
44.522 (LC
STR-GR
101)
69.228(LC
STR-EQ
109)
55.49%

[Parmar *, 4(12): December, 2017] ISSN 2349-6193
Impact Factor: 2.805
IJESMR International Journal OF Engineering Sciences &Management Research
http: // © International Journal of Engineering Sciences & Management Research
[29]
Third floor
beam
44.987 (LC STR-GR
101)
64.584(LC STR-EQ
109)
43.56%
Fourth
floor
beam
26.067 (LC
STR-GR
101)
56.733(LC
STR-EQ
109)
117.64%
Comparison of maximum hogging moment (kNm)
beam
Floor
Max hogging Moment
STR-GR STR-EQ %
increase
Plinth
beam
32.39 (LC
STR-GR
101)
75.05 (LC
STR-EQ
109)
131.73
First floor
beam
31.33 (LC
STR-GR
101)
95.69 (LC
STR-EQ
109)
44.18
Second
floor beam
32.87 LC
STR-GR 101
93.70 (LC
STR-EQ 109)
39.76
Third floor
beam
33.86 (LC
STR-GR
101
84.01 (LC
STR-EQ
109)
31.93
Fourth
floor beam
19.44 LC
STR-GR
101
67.85(LC
STR-EQ
109)
249.04
Comparison of maximum sagging moment (kNm)
in beam
Floor
Max sagging moment
STR-GR STR-EQ %
increase
Plinth
beam
19.05 (LC
STR-GR
101)
31.57(LC
STR-EQ
108)
65.71
First floor
beam
19.04 (LC
STR-GR
101)
205.44(LC
STR-EQ
108)
132.05
Second floor beam
19.07 (LC STR-GR
101)
185.09(LC STR-EQ
108)
108.53
Third floor
beam
19.01 (LC
STR-GR
101)
148.12(LC
STR-EQ
109)
68.02
Fourth
floor beam
12.01 (LC
STR-GR
101)
21.669(LC
STR-EQ
108)
80.42
CONCLUSION The analysis conclusions of a G+3Commercial building under constrained site conditions are as follows.
1) If G+3Commercial building has design only for Gravity load and effect of earthquake analysis on same building, structure is unstable for such type of loading. Hence earthquake load analysis is plays an
important role in stability of structure.
2) If G+3Commercial building has design only for Gravity load and effect of additional story analysis on
same building, structure is unstable for such type of loading. Hence additional story load analysis also
plays an important role in stability of structure.
[Parmar *, 4(12): December, 2017] ISSN 2349-6193
Impact Factor: 2.805
IJESMR International Journal OF Engineering Sciences &Management Research
http: // © International Journal of Engineering Sciences & Management Research
[30]
3) From table 13 it is concluded that as load increases, percentage of shear force and bending moment
also increases in all beam. From increasing the load STR-GR to STR-EQ shear force & bending
moment increases mainly due to earth quick. Hence evaluation of earthquake load is very important for
retrofitting.
4) If the fund availability is limited then provision of retrofitting is a better option as compared to
providing a new construction.
SCOPE FOR FUTURE WORK The effect of earthquake and additional load only analysis in this thesis, wind load, snow load, hydrostatic
pressure from water, effect of tropical cyclones, tornadoes etc. also needs to be studied in details for finding
optimum option of retrofitting.
In this thesis it is assumed that all the column supports are fixed. Further the structure can be analyzed
considering the effect of soil-structure interaction.
The structure can be analyzed for different seismic zones and different type of foundation.
REFERENCES 1. Belal M.F., Mohamed H.M. and Morad S.A. (2014), “Behaviour of reinforced concrete columns
strengthened by steel jacket” in HBRC journal. 2. Singh V., bansal P. P., Kumar M. and Kaushik S.S (2014), “Experimental studies on strength and
ductility of CFRP jacketed reinforced concrete-beam joint” in construction and building materials
volume 55, page no. 194 – 201.
3. Ruano G., Facundo I, Pedraza R. I., Sfer D. and Luccioni B. (2013), “Shear retrofitting of reinforced
concrete beams with steel fibre reinforced concrete” in construction and building materials volume 54,
page no. 646 – 658.
4. Su R. and lingzhi L.I. (2013), “Strengthening of Reinforced Concrete Structures by Bolting of Steel
Plates” in Hong Kong Concrete Institute.
5. S. Kothandaraman and G. Vasudevan (2010), “Flexural retrofitting of RC beams using external bars
at soffit level- An experimental study” in construction and building materials volume 24, page no.
2208–2216. 6. Obaidat Y. T. (2011), “structural retrofitting of concrete beams using frp - Debonding Issues” in
department of construction science structural mechanics, ISSN 0281-6679.
7. Obaidat Y.T., Heyden S., Dahlblom O., Abu-Farsakh G. and Yahia A.J. (2011), “Retrofitting of
Reinforced Concrete Beams Using Composite Laminates”, in Construction & Building Materials,
volume 25, page no. 591-597.
8. Sabu D.J., Pajgade P.S.(2012),“Seismic Evaluation of Existing Reinforced Concrete Building” in
International Journal of Scientific & Engineering Research Volume 3, ISSN 2229-5518.
9. Obaidat Y. T., Dahlblom O., Heyden S. (2010), “Nonlinear FE Modelling of Shear Behaviour in RC
Beam Retrofitted with CFRP”, in proceedings of Computational Modelling of Concrete Structures
(EURO-C), ISBN 978-0-415-5879-1.
10. Vijayakumar A. and Venkatesh B. (2011), “A survey of methods and techniques used for Seismic
retrofitting of RC buildings” in international journal of civil and structural engineering, ISSN 0976 – 4399, volume 2, page no. 56-66.
11. Duggal S.K. (2010) “Limit state Design of steel structures” in Tata McGraw hill education private
limited New Delhi, ISBN no. 978-0-07-070023-9.
12. Bhavikatti S.S. (2010) “Design of steel structures” in I.K. International Publishing House Pvt. Limited,
ISBN no 938057813X, 9789380578132.
13. Shrestha H.D. and Krishna S., Pribadi (2009), “Retrofitting of existing vulnerable school buildings –
assessment to retrofitting” in construction Quality &
14. Technical Assistance (CQTA) Center for Disaster Mitigation - Institute of Technology Bandung (CDM
–ITB).
15. Williams R.J., Gardoni P. and Bracci J. M. (2009), “Decision analysis for seismic retrofit of
structures” in Zachry Department of Civil Engineering, Texas A&M University, College Station, USA volume 31, page no. 188-196.
16. Shrestha H. And Dixit A.M. (2008) “Identifying seismic retrofitting measures for common reinforced
concrete frame buildings in Nepal” in The 14th World Conference on Earthquake Engineering,
Beijing, China.

[Parmar *, 4(12): December, 2017] ISSN 2349-6193
Impact Factor: 2.805
IJESMR International Journal OF Engineering Sciences &Management Research
http: // © International Journal of Engineering Sciences & Management Research
[31]
17. Agarwal P. and Shrikhande M. (2006) “Earthquake resistant design of structure” in prentice hall, of
India private limited, New Delhi, ISBN no. 81-203-2892-2.
18. Arlekar J.N. and Murty C. V. R. (2004), “Shear moment interaction for design of steel beam-to-column
connections” in 13th World Conference on Earthquake Engineering Vancouver, B.C., Canada, Page
no. 635.
19. Richard D., Sheikh S.A. and Bayrak O. (2003) “Retrofit of Square Concrete Columns with Carbon
Fibre-Reinforced Polymer for Seismic Resistance” in ACI structural journal, title no. 100-S81.
20. Riyadh A.A. and Riyadh A.M. (2006), “Coupled flexural – shear interaction of RC beams using CFRP
straps” in 13th International Conference of Composite Structures, Melbourne, Australia volume 75,
page no. 457 – 464.
21. Lakshmanan N. (2006), “Seismic evaluation and retrofitting of buildings and structures” in ISET
Journal of Earthquake Technology, Volume 43, Paper No. 469. 22. Sakino K. and Sun Y. (2000), “Steel jacketing for improvement of column strength and ductility” in
12th world Conferences on Earthquake Engineering (WCEE).
23. Geng Z.J., Chajes M.J., Chou T.W. and Pan D.Y.C. (1998), “The retrofitting of reinforced concrete” in
composite sciences and technology, volume 58, page no. 1298-1305.
24. Gomes A. and Appleton J. (1997), “Strengthening design of Concrete beam by addition of steel plates”
Department of civil engineering, IST, Technical university of Lisbon, Portugal.
25. Parretti R. and Nanni A. (2000), “Axial testing of concrete columns confined with carbon FRP” effect
of fibre orientation