ijser - citefactor
TRANSCRIPT
International Journal of Scientific & Engineering Research, Volume 6, Issue 6, June-2015 48 ISSN 2229-5518
IJSER © 2015 http://www.ijser.org
Water Resources Management: Case Study of El Minia Governorate, Egypt
ELDeeb, H. a,c ∗, El Rawy, M. b,d and Habib, E.c
Abstract: Ministry of water resources and irrigation in Egypt is currently implementing projects that expand new cultivated area, as a consequence the supplies of Nile River to the existing lands will be affected. Because Egypt is an arid country with hardly any rainfall, water shortage is a major problem facing any development in Egypt, so water management is of paramount importance. The present paper aims to investigate the various options for the water resources management in El Minia governorate, one of the major provinces in Egypt. A complete map of the water resources has been prepared including irrigation and drainage processes. In addition, the political needs for distribution, management and control of the water resources have been taken into consideration. The main features of one of the famous commercially available unsteady simulation software package, the Operational Planning Distribution Model (OPDM), has been described and used to simulate water distribution system and crop yield. It has been also implemented to the selected case study to develop appropriate water plan. As the weather condition is an important factor that affects crops consumptive use of water, the monthly rate of sunlight hours, rainfall, wind speed, evaporation and relative humidity have been considered during the study period. Furthermore, the impact for allocation of the irrigation water has been investigated. Moreover, the different options have been compared from technical and economical points of view. Finally, effect of variation in both surface and groundwater quantities and qualities on the gross revenue has been presented.
Keywords: Water Resources Management, El Minia governorate, Egypt, OPDM, Modelling.
—————————— ——————————
1 INTRODUCTION
ater is the most important natural resource that can be utilized by man to develop his prosperity as well as his essential needs. Water resources management, water
pollution control and environmental protection are the main issues to safeguard this resource. The challenges of managing water resources for a multiplicity of uses and threats must be set within the much broader contexts of changes in the eco-nomic, social and political landscapes.
Egypt is located in the arid zone of North Africa where the fresh water resources are limited to the fixed share from the Nile and groundwater systems. Growing population, agricul-tural expansion, and urbanization has placed a heavy demand on water resources, Ahmed A. and Ali M. (2009).
The overpopulation problem in Egypt is the mother of all others. This problem has two aspects first the high rate of in-crease, second is the unique way of distribution where 98% of the people live on 5% of the state (that is the area of the Nile delta and its narrow valley), whereas 2% occupy the vast de-sert which represents 95% of Egypt. Accordingly the re-distribution of the population over the state area is a must. If we accept that the existing population will continue to occupy
5% of our land so we must move 33 millions to other regions during the next 30 years which means the movement of more than one million per year, El Atfy et al. (2004). So we must return back and try to widen the narrow valley and try to re-distribute ourselves. To relieve the pressure on the Nile Valley and Delta, the government has embarked on ambitious pro-gram to increase the inhabited area in Egypt by means of hori-zontal expansion projects in agriculture and the creation of new industrial areas and cities in the desert. All these devel-opments need water.
Nile River is considered the main water source in Egypt, while the second water source is groundwater especially in desert areas. It is estimated that the Nile provides 95% of the country's fresh renewable water supply, NWRP 2003. Agricul-ture is almost totally dependent on the Nile. The rapid in pop-ulation growth, agricultural extension, and urbanization are big challenges to the country in relation to water scarcity.
2 LITERATURE REVIEW A search of the literature reveals a wide range and number
of published reports regarding river basin models of which a few studies represent basin wide integrated modeling. These studies are presented under broad categories as (Water Re-sources Analysis and Mathematical Evaluation, Physical and Mathematical Simulation Models, Mathematical Optimization Models and GIS-Based Decision Support Systems).
The measures to make better use of existing resources aim at improving the efficiency of the water resources system. They include a careful evaluation of planned horizontal ex-
W
———————————————— ∗ Corresponding Author. Tel: +201226644747. E-mail address: [email protected] P
aP Water and Water Structure Engineering Dept., Faculty of Engineering, Zagazig Uni-versity, Zagazig, Egypt. P
bP Civil Engineering Dept., Faculty of Engineering, Minia University, Minia, Egypt.
P
c PCivil Engineering Dept., Collage of Engineering, The University of Louisiana at Lafa-
yette, LA, USA. P
dP Water Research Center, Sultan Qaboos University, Muscat, Oman.
IJSER
International Journal of Scientific & Engineering Research, Volume 6, Issue 6, June-2015 49 ISSN 2229-5518
IJSER © 2015 http://www.ijser.org
pansion projects and a scheduled implementation of the pro-jects in relation to the availability of required water. Previous investigations on water resources management in Egypt are numerous, e.g. Abdel-Aziz (2002), presented a brief study for the cost recovery in water systems. Also El Atfy et al. (2004), introduced a study about water valuing and presented a tool for demand management in Egypt. In addition, there are many researches in the field of water policy integration in Egypt, e.g. NWRP (2003).
Over the last twenty years, digital representations of the Water Resources Management (WRM) have become increas-ingly available in the form of digital models (DMs). Using computers and extracting data from digital models is faster, and provides more reproducible measurements than tradi-tional manual techniques. Mohan Zade et al. (2005), made an attempt to quantify the runoff potential for all basins of India using remote sensing data. Anandan and Venkatesh (2005), implemented GIS as a tool to estimate the surface water poten-tial. Two other management dimensions that deserve special mention are the regional hydro-politics in the Nile Basin, driv-en by ever stronger claims on the part of upstream countries for a higher share of the river runoff, and the increasing budg-etary pressures on the water agencies, Luzi (2010). Cecilia et al. (2008), draw on the policy network perspective on govern-ance to shed light on the strengths and weaknesses of water-shed-based processes of collaboration and integration for wa-ter quality protection in agricultural areas. El Bedawy (2014), establishes a well coordinated information system to support decision makers for making an effective water resources man-agement on an environmentally sound basis.
The present paper analyzes studied region's water policy planning and proposes to highlight the characteristics of this planning effort. The Operational Planning Distribution Model (OPDM) was used to simulate water distribution system and crop yield through the studied region. Moreover, the software package is used to assess the impact of allocation of the irriga-tion water. Finally, the gross revenue of all crops is correlated to surface and ground water quantities and qualities.
3 MODEL DESCRIPTION The Operational Planning Distribution Model, OPDM, is
one of the most improved software developed for performing simulation of water distribution and crop yield response for irrigation and other uses in complex canal and drainage net-works. The OPDM is mainly used to calculate the crop water requirements based on the specified cropping patterns and weather information. The simulated flows are then routed through a system of a main supply source, groundwater aqui-fers, downstream sources, and open drains.
4 THEORETICAL APPROACH Different model parameters are calculated theoretically in
the model as wind speed adjustment, the leaching fraction, the deficit yield reduction equation, salinity yield effect during crop growth stage and evpotranspiration using Penman-Monteith equation.
2 4.852 ln ( 0.08 0.015)zU U z= − )1(
Where: UR2R is the equivalent wind speed at 2.0m height (m/s); and URzR is the measured speed at a height of z above the ground surface (m). The denominator in Eq. (1) involves a natural logarithm term (base e). When z is equal to 2.0 the value of UR2R will be equal to URzR.
iw dw dw iwLF EC EC D D= = (2)
Where: LF is the leaching fraction (from 0 to 1.0); ECRiwR is the electrical conductivity of the irrigation water (dS/m); ECRdwR is the electrical conductivity of the drainage, or deep percola-tion, water (dS/m); DRdwR is the depth of drainage water (m); and DRiwR is the depth of infiltrated water from the soil surface (m).
( )1
100 in
rel a p ii
Y ET ETl
=
= ∏ (3)
Where: YRrelR is the relative yield (%); ETRaR is actual transpira-tion (mm/day); ETRpR is the maximum potential transpiration; l is a fitted exponent (a calibrated value); and the subscript i refers to the growth stage (the OPDM uses three growth stag-es, so, n = 3).
( )100rel s e sY B EC A= − − (4)
Where: YRrelR is the relative yield (%); ARsR is the threshold sa-linity (dS/m); BRsR is the rate at which relative crop yield de-clines with increasing salinity, beyond ARsR (% per dS/m); and ECReR is the salinity of the soil water extract (dS/m). The various forms of the Penman equation belong to the com-bination method. The combination method produces some of the most complex ETRoR equations. The following form of the Penman equation, called Penman-Monteith:
( ) ( )
( )
2
2
8900.408
2731 0.339
a dn
o
U e eR G
TETU
γ
γ
−∆ − +
+=∆ + +
(5)
Where ETRoR in mm/day for a grass reference crop; ∆ is the slope of the saturation vapor pressure function (kPa/ C); γ is a psychrometric constant (kPa/ C); RRnR is the net solar radiation (MJ/mP
2P/day); UR2R is the wind speed (m/s) at 2.0m height; T is
the mean daily air temperature (°C); eRa R–R ReRdR represents the sat-uration vapor pressure deficit of air (kPa); and G is the soil heat flux density (MJ/mP
2P/day).
5 CASE STUDY 5.1 Project Area
The irrigation project area located at El Minia Governorate, one of the major provinces in Egypt, is taken as the case study. The area is irrigated through a network of irrigation canals and some water is pumped from an aquifer and used for irri-gation along with the surface water. The basic data of the pro-
IJSER
International Journal of Scientific & Engineering Research, Volume 6, Issue 6, June-2015 50 ISSN 2229-5518
IJSER © 2015 http://www.ijser.org
ject area and the base case that is taken as the control case for comparison is displayed in the following.
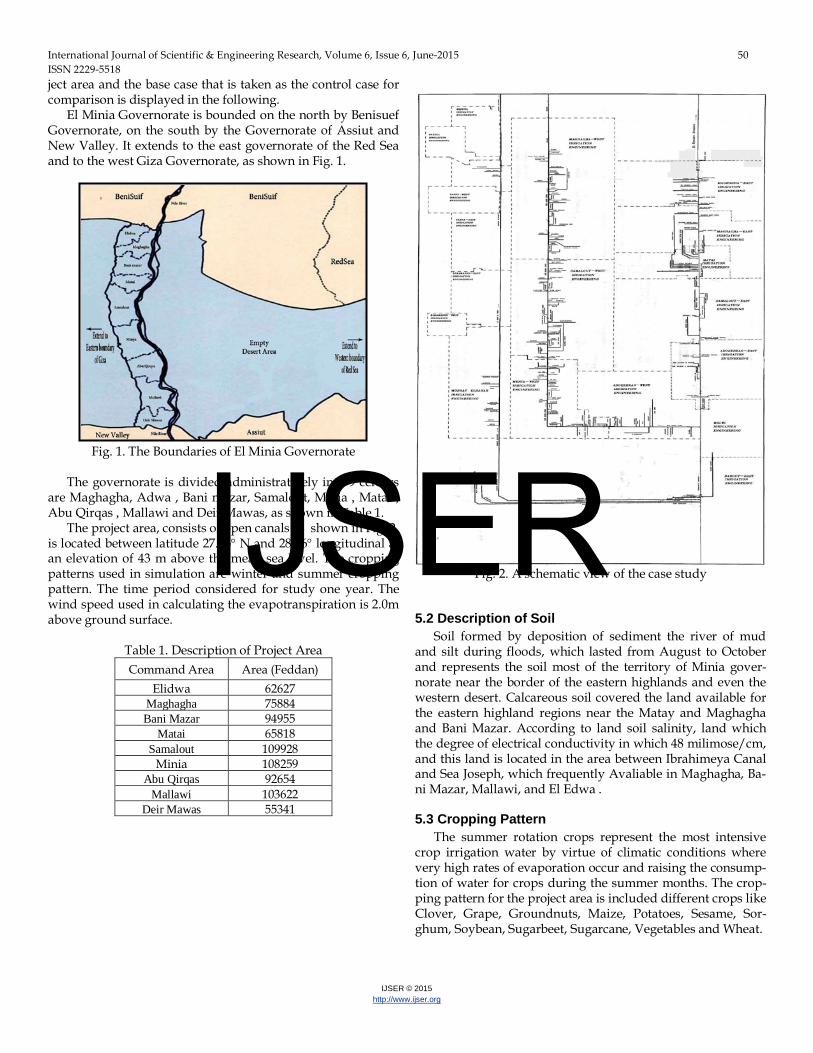
El Minia Governorate is bounded on the north by Benisuef Governorate, on the south by the Governorate of Assiut and New Valley. It extends to the east governorate of the Red Sea and to the west Giza Governorate, as shown in Fig. 1.
Fig. 1. The Boundaries of El Minia Governorate
The governorate is divided administratively into 9 centers are Maghagha, Adwa , Bani mazar, Samalout, Minia , Matai , Abu Qirqas , Mallawi and Deir Mawas, as shown in Table 1.
The project area, consists of open canals as shown in Fig. 2, is located between latitude 27.35° N and 28.46° longitudinal at an elevation of 43 m above the mean sea level. The cropping patterns used in simulation are winter and summer cropping pattern. The time period considered for study one year. The wind speed used in calculating the evapotranspiration is 2.0m above ground surface.
Table 1. Description of Project Area Command Area Area (Feddan)
Elidwa 62627 5TMaghagha 75884
5TBani Mazar 94955 5TMatai 65818
5TSamalout 109928 Minia 108259
5TAbu Qirqas 92654 5TMallawi 103622
5TDeir5T 5TMawas 55341
Fig. 2. A schematic view of the case study 5.2 Description of Soil
Soil formed by deposition of sediment the river of mud and silt during floods, which lasted from August to October and represents the soil most of the territory of Minia gover-norate near the border of the eastern highlands and even the western desert. Calcareous soil covered the land available for the eastern highland regions near the Matay and Maghagha and Bani Mazar. According to land soil salinity, land which the degree of electrical conductivity in which 48 milimose/cm, and this land is located in the area between Ibrahimeya Canal and Sea Joseph, which frequently Avaliable in Maghagha, Ba-ni Mazar, Mallawi, and El Edwa .
5.3 Cropping Pattern
The summer rotation crops represent the most intensive crop irrigation water by virtue of climatic conditions where very high rates of evaporation occur and raising the consump-tion of water for crops during the summer months. The crop-ping pattern for the project area is included different crops like Clover, Grape, Groundnuts, Maize, Potatoes, Sesame, Sor-ghum, Soybean, Sugarbeet, Sugarcane, Vegetables and Wheat.
IJSER
International Journal of Scientific & Engineering Research, Volume 6, Issue 6, June-2015 51 ISSN 2229-5518
IJSER © 2015 http://www.ijser.org
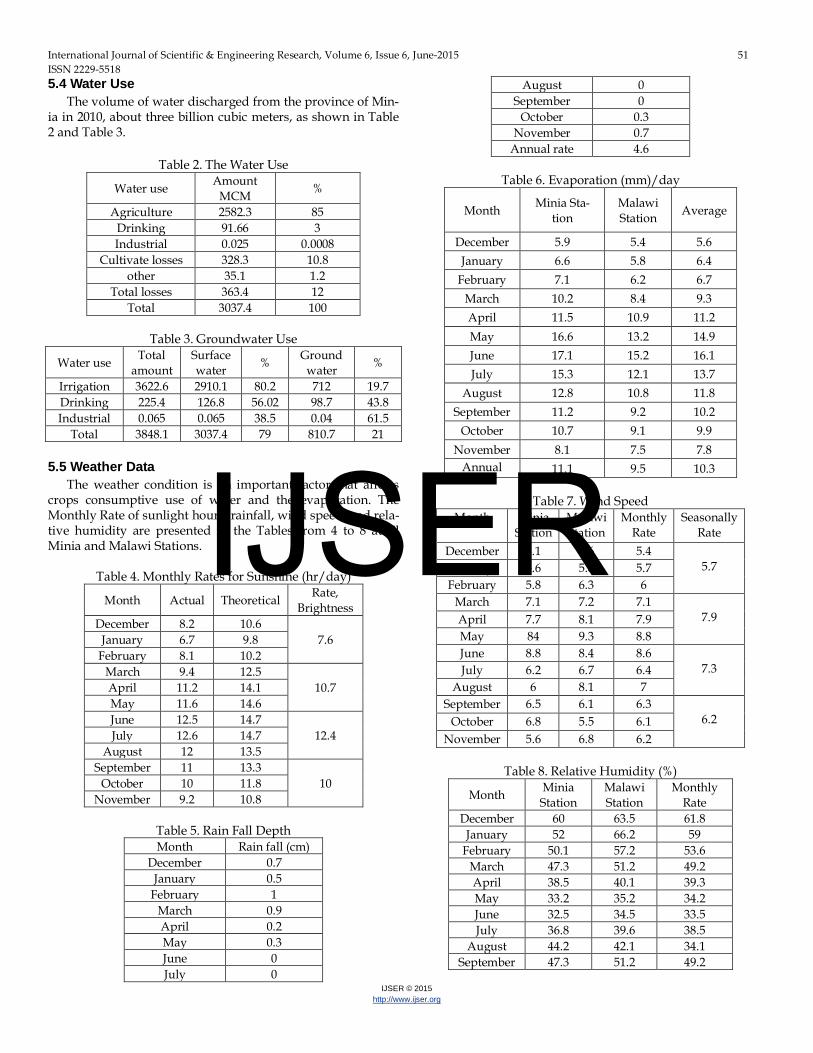
5.4 Water Use The volume of water discharged from the province of Min-
ia in 2010, about three billion cubic meters, as shown in Table 2 and Table 3.
Table 2. The Water Use
% Amount MCM Water use
85 2582.3 Agriculture 3 91.66 Drinking
0.0008 0.025 Industrial 10.8 328.3 Cultivate losses 1.2 35.1 other 12 363.4 Total losses 100 3037.4 Total
Table 3. Groundwater Use
% Ground water % Surface
water Total
amount Water use
19.7 712 80.2 2910.1 3622.6 Irrigation 43.8 98.7 56.02 126.8 225.4 Drinking 61.5 0.04 38.5 0.065 0.065 Industrial 21 810.7 79 3037.4 3848.1 Total
5.5 Weather Data
The weather condition is an important factor that affects crops consumptive use of water and the evaporation. The Monthly Rate of sunlight hours, rainfall, wind speed, and rela-tive humidity are presented in the Tables from 4 to 8 at El Minia and Malawi Stations.
Table 4. Monthly Rates for Sunshine (hr/day) 5TRate,
Brightness 5TTheoretical 5TActual Month
7.6 10.6 8.2 December 9.8 6.7 5TJanuary 10.2 8.1 5TFebruary
10.7 12.5 9.4 5TMarch 14.1 11.2 5TApril 14.6 11.6 5TMay
12.4 14.7 12.5 5TJune 14.7 12.6 5TJuly 13.5 12 5TAugust
10 13.3 11 5TSeptember 11.8 10 5TOctober 10.8 9.2 5TNovember
Table 5. Rain Fall Depth
Rain fall (cm) Month 0.7 December 0.5 January 1 February
0.9 March 0.2 April 0.3 May 0 June 0 July
0 August 0 September
0.3 October 0.7 November 4.6 Annual rate
Table 6. Evaporation (mm)/day
Month Minia Sta-tion
Malawi Station Average
December 5.9 5.4 5.6 January 6.6 5.8 6.4
February 7.1 6.2 6.7 March 10.2 8.4 9.3 April 11.5 10.9 11.2 May 16.6 13.2 14.9 June 17.1 15.2 16.1 July 15.3 12.1 13.7
August 12.8 10.8 11.8 September 11.2 9.2 10.2
October 10.7 9.1 9.9 November 8.1 7.5 7.8
Annual
11.1 9.5 10.3
Table 7. Wind Speed Month Minia
Station Malawi Station
Monthly Rate
Seasonally Rate
December 4.1 6.6 5.4 5.7 January 5.6 5.8 5.7
February 5.8 6.3 6 March 7.1 7.2 7.1
7.9 April 7.7 8.1 7.9 May 84 9.3 8.8 June 8.8 8.4 8.6
7.3 July 6.2 6.7 6.4 August 6 8.1 7
September 6.5 6.1 6.3 6.2 October 6.8 5.5 6.1
November 5.6 6.8 6.2
Table 8. Relative Humidity (%)
Month Minia Station
Malawi Station
Monthly Rate
December 60 63.5 61.8 January 52 66.2 59
February 50.1 57.2 53.6 March 47.3 51.2 49.2 April 38.5 40.1 39.3 May 33.2 35.2 34.2 June 32.5 34.5 33.5 July 36.8 39.6 38.5
August 44.2 42.1 34.1 September 47.3 51.2 49.2
IJSER
International Journal of Scientific & Engineering Research, Volume 6, Issue 6, June-2015 52 ISSN 2229-5518
IJSER © 2015 http://www.ijser.org
October 45.1 53.2 49.2 November 55.6 60.1 57.8
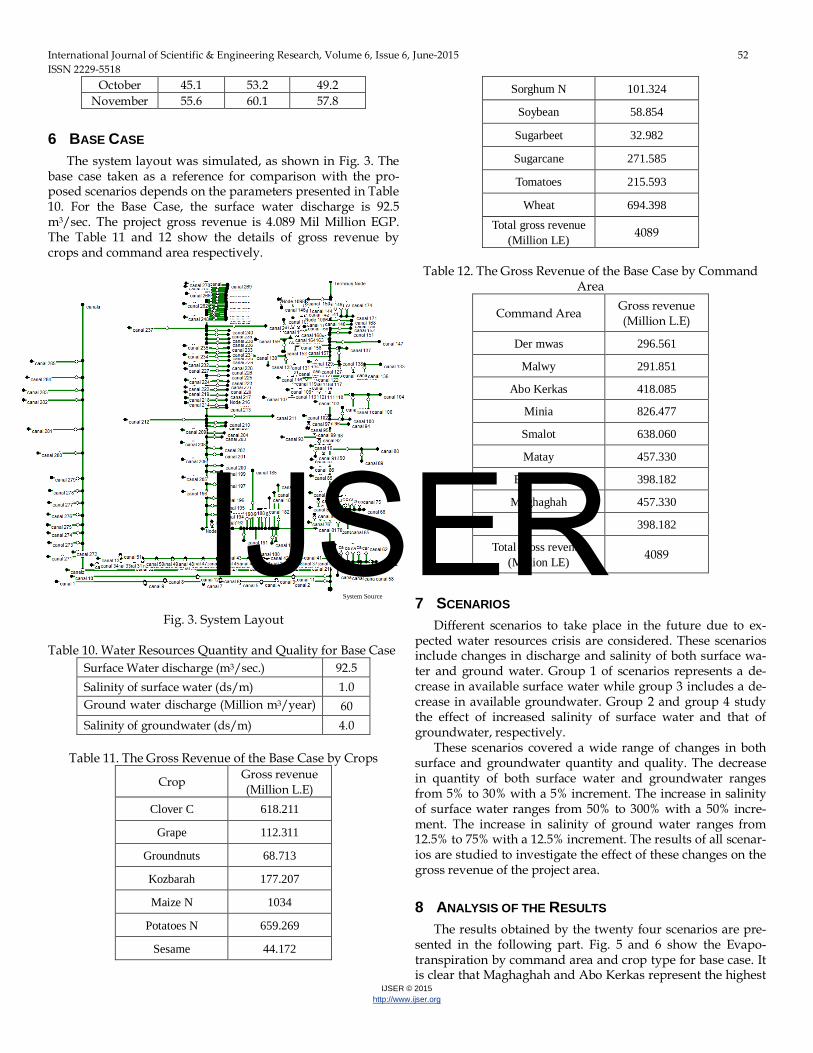
6 BASE CASE The system layout was simulated, as shown in Fig. 3. The
base case taken as a reference for comparison with the pro-posed scenarios depends on the parameters presented in Table 10. For the Base Case, the surface water discharge is 92.5 mP
3P/sec. The project gross revenue is 4.089 Mil Million EGP.
The Table 11 and 12 show the details of gross revenue by crops and command area respectively.
Fig. 3. System Layout
Table 10. Water Resources Quantity and Quality for Base Case Surface Water discharge (mP
3P/sec.) 92.5
Salinity of surface water (ds/m) 1.0 Ground water discharge (Million mP
3P/year)
( / h) 60
Salinity of groundwater (ds/m) 4.0
Table 11. The Gross Revenue of the Base Case by Crops
Crop Gross revenue (Million L.E)
5TClover C 5T618.211
5TGrape 5T112.311
5TGroundnuts 5T68.713
5TKozbarah 5T177.207
5TMaize N 5T1034
5TPotatoes N 5T659.269
5TSesame 5T44.172
5TSorghum N 5T101.324
5TSoybean 5T58.854
5TSugarbeet 5T32.982
5TSugarcane 5T271.585
5TTomatoes 5T215.593
5TWheat 5T694.398 5TTotal gross revenue
(Million LE) 4089
Table 12. The Gross Revenue of the Base Case by Command
Area
Command Area Gross revenue (Million L.E)
5TDer mwas 5T296.561
5TMalwy 5T291.851
5TAbo Kerkas 5T418.085
5TMinia 5T826.477
5TSmalot 5T638.060
5TMatay 5T457.330
5TBni mazar 5T398.182
5TMaghaghah 5T457.330
5TEdwah 5T398.182
5TTotal gross revenue 5T(Million LE) 4089
7 SCENARIOS Different scenarios to take place in the future due to ex-
pected water resources crisis are considered. These scenarios include changes in discharge and salinity of both surface wa-ter and ground water. Group 1 of scenarios represents a de-crease in available surface water while group 3 includes a de-crease in available groundwater. Group 2 and group 4 study the effect of increased salinity of surface water and that of groundwater, respectively.
These scenarios covered a wide range of changes in both surface and groundwater quantity and quality. The decrease in quantity of both surface water and groundwater ranges from 5% to 30% with a 5% increment. The increase in salinity of surface water ranges from 50% to 300% with a 50% incre-ment. The increase in salinity of ground water ranges from 12.5% to 75% with a 12.5% increment. The results of all scenar-ios are studied to investigate the effect of these changes on the gross revenue of the project area.
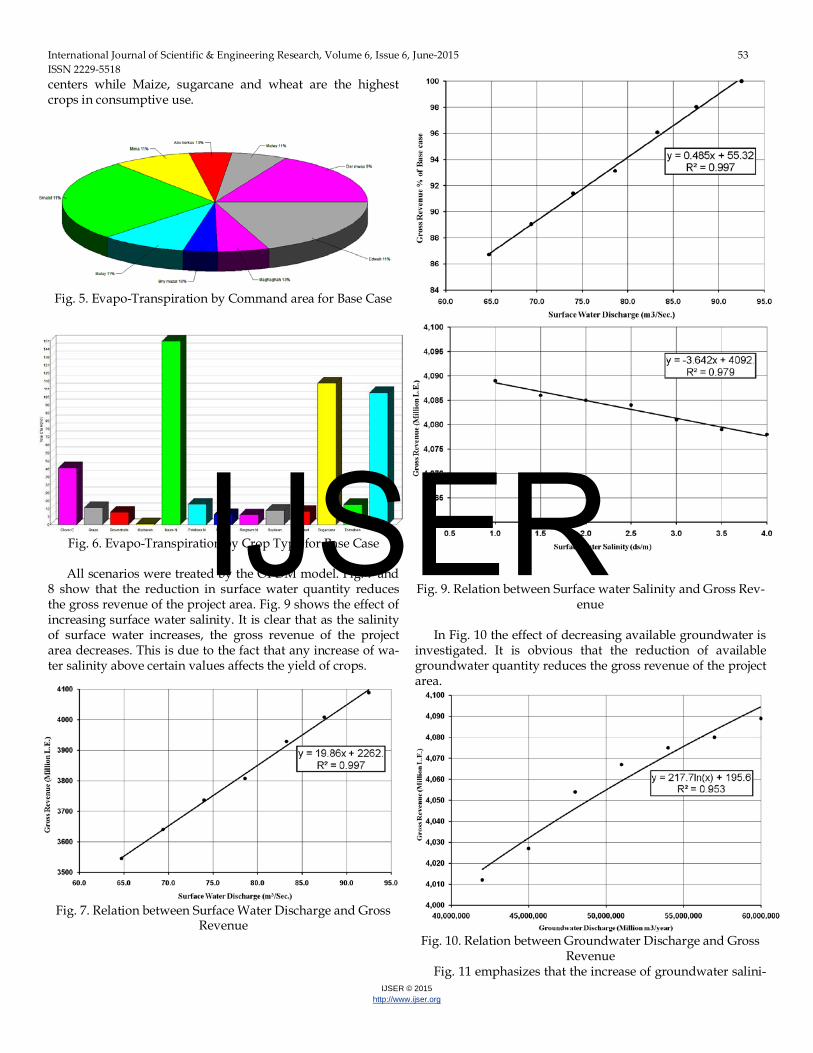
8 ANALYSIS OF THE RESULTS The results obtained by the twenty four scenarios are pre-
sented in the following part. Fig. 5 and 6 show the Evapo-transpiration by command area and crop type for base case. It is clear that Maghaghah and Abo Kerkas represent the highest
System Source
IJSER
International Journal of Scientific & Engineering Research, Volume 6, Issue 6, June-2015 53 ISSN 2229-5518
IJSER © 2015 http://www.ijser.org
centers while Maize, sugarcane and wheat are the highest crops in consumptive use.
Fig. 5. Evapo-Transpiration by Command area for Base Case
Fig. 6. Evapo-Transpiration by Crop Type for Base Case
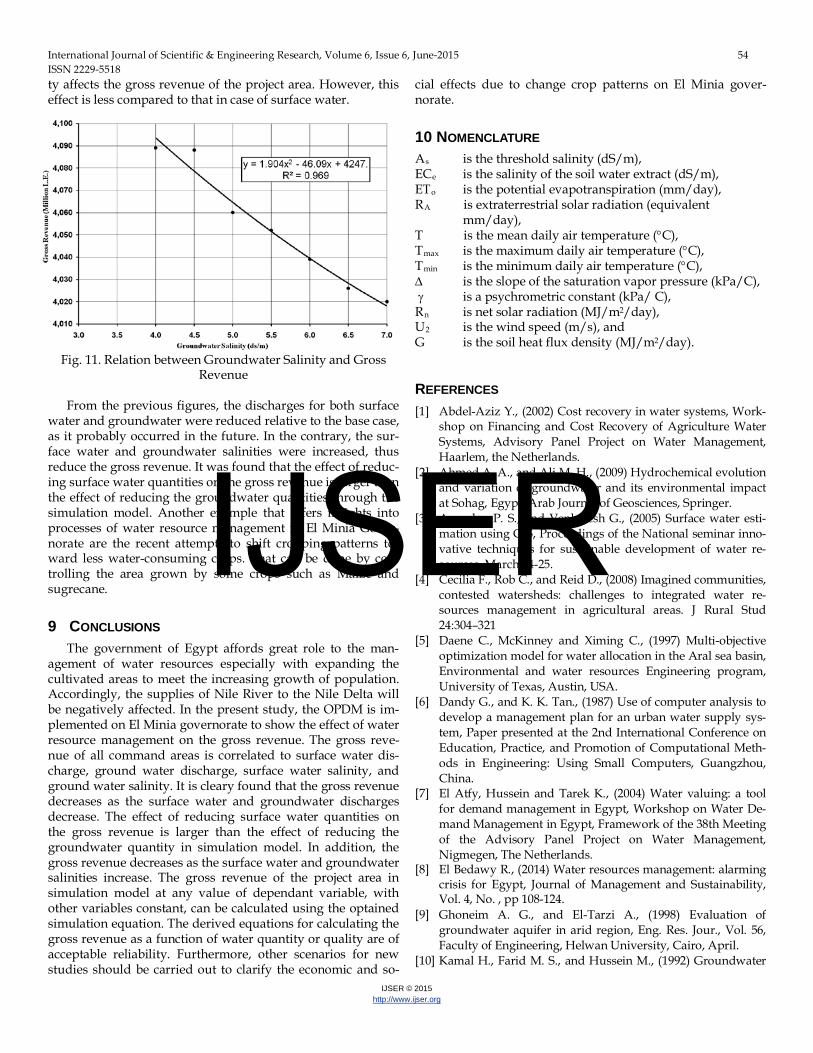
All scenarios were treated by the OPDM model. Fig. 7 and
8 show that the reduction in surface water quantity reduces the gross revenue of the project area. Fig. 9 shows the effect of increasing surface water salinity. It is clear that as the salinity of surface water increases, the gross revenue of the project area decreases. This is due to the fact that any increase of wa-ter salinity above certain values affects the yield of crops.
Fig. 7. Relation between Surface Water Discharge and Gross Revenue
Fig. 8. Relation between Surface Water Discharge and Gross
Revenue Percentage of Base case
Fig. 9. Relation between Surface water Salinity and Gross Rev-enue
In Fig. 10 the effect of decreasing available groundwater is
investigated. It is obvious that the reduction of available groundwater quantity reduces the gross revenue of the project area.
Fig. 10. Relation between Groundwater Discharge and Gross
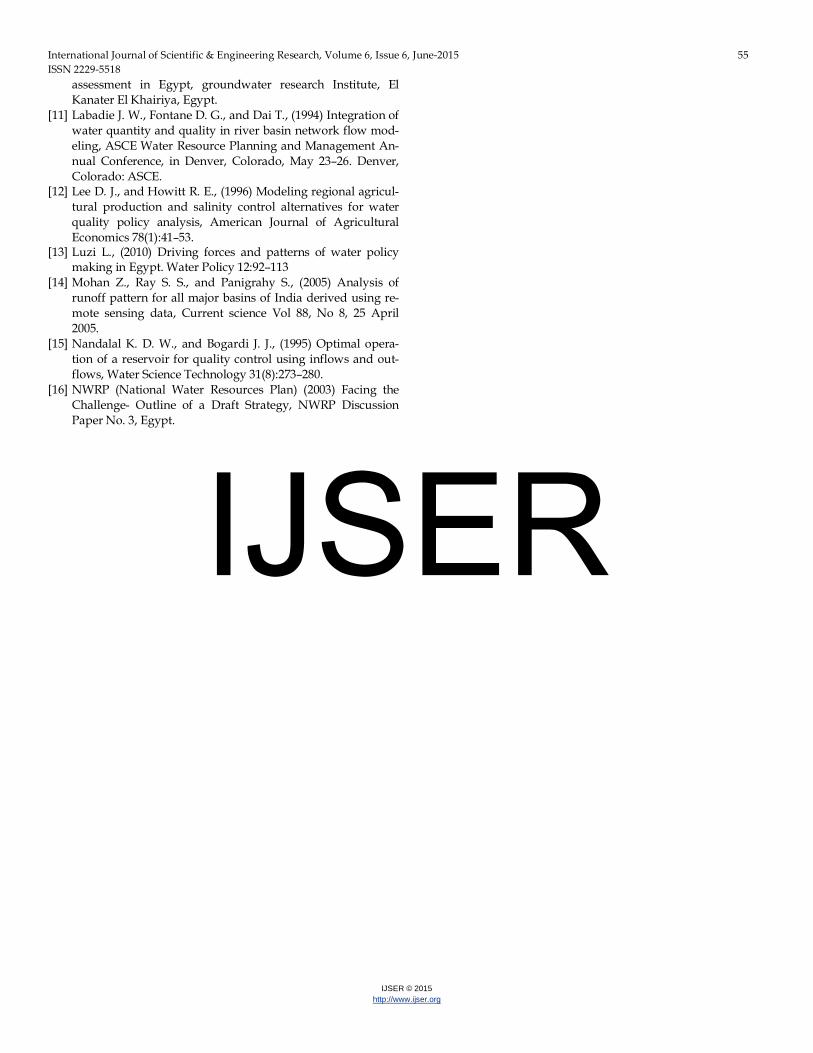
Revenue Fig. 11 emphasizes that the increase of groundwater salini-
IJSER
International Journal of Scientific & Engineering Research, Volume 6, Issue 6, June-2015 54 ISSN 2229-5518
IJSER © 2015 http://www.ijser.org
ty affects the gross revenue of the project area. However, this effect is less compared to that in case of surface water.
Fig. 11. Relation between Groundwater Salinity and Gross Revenue
From the previous figures, the discharges for both surface
water and groundwater were reduced relative to the base case, as it probably occurred in the future. In the contrary, the sur-face water and groundwater salinities were increased, thus reduce the gross revenue. It was found that the effect of reduc-ing surface water quantities on the gross revenue is larger than the effect of reducing the groundwater quantities through the simulation model. Another example that offers insights into processes of water resource management in El Minia Gover-norate are the recent attempts to shift cropping patterns to-ward less water-consuming crops. That can be done by con-trolling the area grown by some crops such as Maize and sugrecane.
9 CONCLUSIONS The government of Egypt affords great role to the man-
agement of water resources especially with expanding the cultivated areas to meet the increasing growth of population. Accordingly, the supplies of Nile River to the Nile Delta will be negatively affected. In the present study, the OPDM is im-plemented on El Minia governorate to show the effect of water resource management on the gross revenue. The gross reve-nue of all command areas is correlated to surface water dis-charge, ground water discharge, surface water salinity, and ground water salinity. It is cleary found that the gross revenue decreases as the surface water and groundwater discharges decrease. The effect of reducing surface water quantities on the gross revenue is larger than the effect of reducing the groundwater quantity in simulation model. In addition, the gross revenue decreases as the surface water and groundwater salinities increase. The gross revenue of the project area in simulation model at any value of dependant variable, with other variables constant, can be calculated using the optained simulation equation. The derived equations for calculating the gross revenue as a function of water quantity or quality are of acceptable reliability. Furthermore, other scenarios for new studies should be carried out to clarify the economic and so-
cial effects due to change crop patterns on El Minia gover-norate.
10 NOMENCLATURE As is the threshold salinity (dS/m), ECe is the salinity of the soil water extract (dS/m), ETo is the potential evapotranspiration (mm/day), RA is extraterrestrial solar radiation (equivalent
mm/day), T is the mean daily air temperature (°C), Tmax is the maximum daily air temperature (°C), Tmin is the minimum daily air temperature (°C), ∆ is the slope of the saturation vapor pressure (kPa/C), γ is a psychrometric constant (kPa/ C), Rn is net solar radiation (MJ/m2/day), U2 is the wind speed (m/s), and G is the soil heat flux density (MJ/m2/day).
REFERENCES [1] Abdel-Aziz Y., (2002) Cost recovery in water systems, Work-
shop on Financing and Cost Recovery of Agriculture Water Systems, Advisory Panel Project on Water Management, Haarlem, the Netherlands.
[2] Ahmed A. A., and Ali M. H., (2009) Hydrochemical evolution and variation of groundwater and its environmental impact at Sohag, Egypt, Arab Journal of Geosciences, Springer.
[3] Anandan P. S., and Venkatesh G., (2005) Surface water esti-mation using GIS, Proceedings of the National seminar inno-vative techniques for sustainable development of water re-sources, March 24-25.
[4] Cecilia F., Rob C., and Reid D., (2008) Imagined communities, contested watersheds: challenges to integrated water re-sources management in agricultural areas. J Rural Stud 24:304–321
[5] Daene C., McKinney and Ximing C., (1997) Multi-objective optimization model for water allocation in the Aral sea basin, Environmental and water resources Engineering program, University of Texas, Austin, USA.
[6] Dandy G., and K. K. Tan., (1987) Use of computer analysis to develop a management plan for an urban water supply sys-tem, Paper presented at the 2nd International Conference on Education, Practice, and Promotion of Computational Meth-ods in Engineering: Using Small Computers, Guangzhou, China.
[7] El Atfy, Hussein and Tarek K., (2004) Water valuing: a tool for demand management in Egypt, Workshop on Water De-mand Management in Egypt, Framework of the 38th Meeting of the Advisory Panel Project on Water Management, Nigmegen, The Netherlands.
[8] El Bedawy R., (2014) Water resources management: alarming crisis for Egypt, Journal of Management and Sustainability, Vol. 4, No. , pp 108-124.
[9] Ghoneim A. G., and El-Tarzi A., (1998) Evaluation of groundwater aquifer in arid region, Eng. Res. Jour., Vol. 56, Faculty of Engineering, Helwan University, Cairo, April.
[10] Kamal H., Farid M. S., and Hussein M., (1992) Groundwater
IJSER
International Journal of Scientific & Engineering Research, Volume 6, Issue 6, June-2015 55 ISSN 2229-5518
IJSER © 2015 http://www.ijser.org
assessment in Egypt, groundwater research Institute, El Kanater El Khairiya, Egypt.
[11] Labadie J. W., Fontane D. G., and Dai T., (1994) Integration of water quantity and quality in river basin network flow mod-eling, ASCE Water Resource Planning and Management An-nual Conference, in Denver, Colorado, May 23–26. Denver, Colorado: ASCE.
[12] Lee D. J., and Howitt R. E., (1996) Modeling regional agricul-tural production and salinity control alternatives for water quality policy analysis, American Journal of Agricultural Economics 78(1):41–53.
[13] Luzi L., (2010) Driving forces and patterns of water policy making in Egypt. Water Policy 12:92–113
[14] Mohan Z., Ray S. S., and Panigrahy S., (2005) Analysis of runoff pattern for all major basins of India derived using re-mote sensing data, Current science Vol 88, No 8, 25 April 2005.
[15] Nandalal K. D. W., and Bogardi J. J., (1995) Optimal opera-tion of a reservoir for quality control using inflows and out-flows, Water Science Technology 31(8):273–280.
[16] NWRP (National Water Resources Plan) (2003) Facing the Challenge- Outline of a Draft Strategy, NWRP Discussion Paper No. 3, Egypt.
IJSER