ilearnnyc / d2l analytics portal: i. navigating reports
TRANSCRIPT

iLearnNYC / D2L Analytics Portal:I. Navigating Reports

To access reports in the iLearnNYC platform, select Analytics Portalfrom the Progress menu item at the top of the screen.
CLICK

Explore the list of available reports and their detailed descriptions here.

Note that there may be more than one page of report options available to you.You can also control how many reports you want to see per page.

The list of reports may be sorted by Display Name, Category, or Description by clicking on the appropriate column heading. Clicking on a column heading repeatedly toggles between
ascending and descending order.
CLICK
CLICK
CLICK

Reports may be searched using a string of text. In this example, a search is being conducted on reports that may have the text string “quiz” in its name, category, or description.
Click on the magnifying glass icon to initiate the search.
CLICK
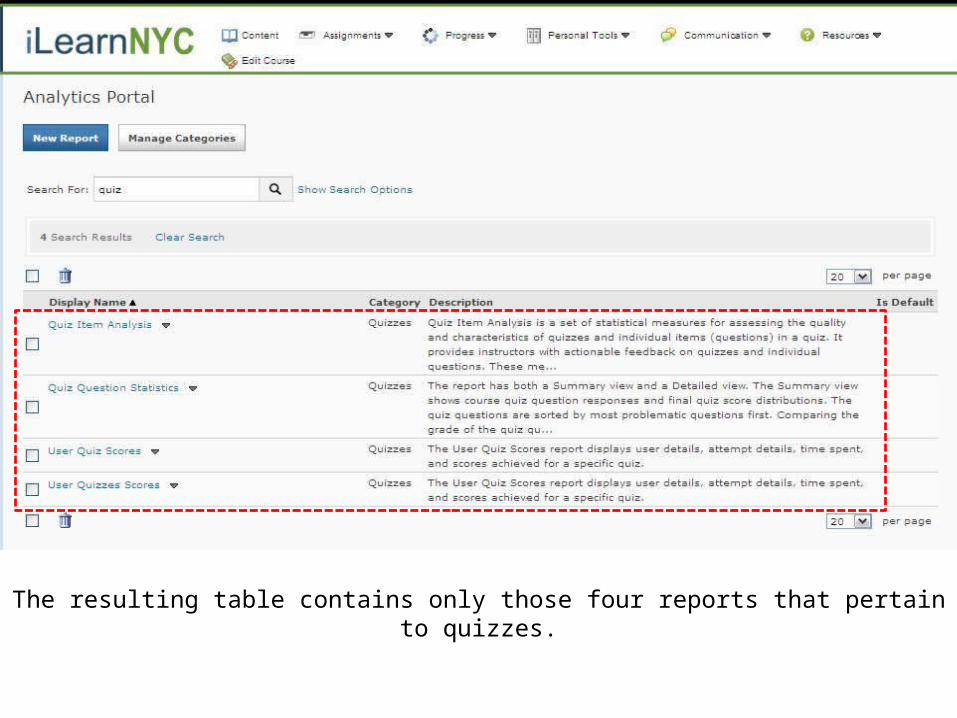
The resulting table contains only those four reports that pertain to quizzes.

To clear the search results and return to the complete list of reports, click on Clear Search.
CLICK

iLearnNYC / D2L Analytics Portal:II. Generating Reports

To view a report, click on the downward facing arrow beside thereport name to reveal the context menu. Select View Report.
CLICK

Alternatively, you can view a report simply by clicking on the report name itself.
CLICK
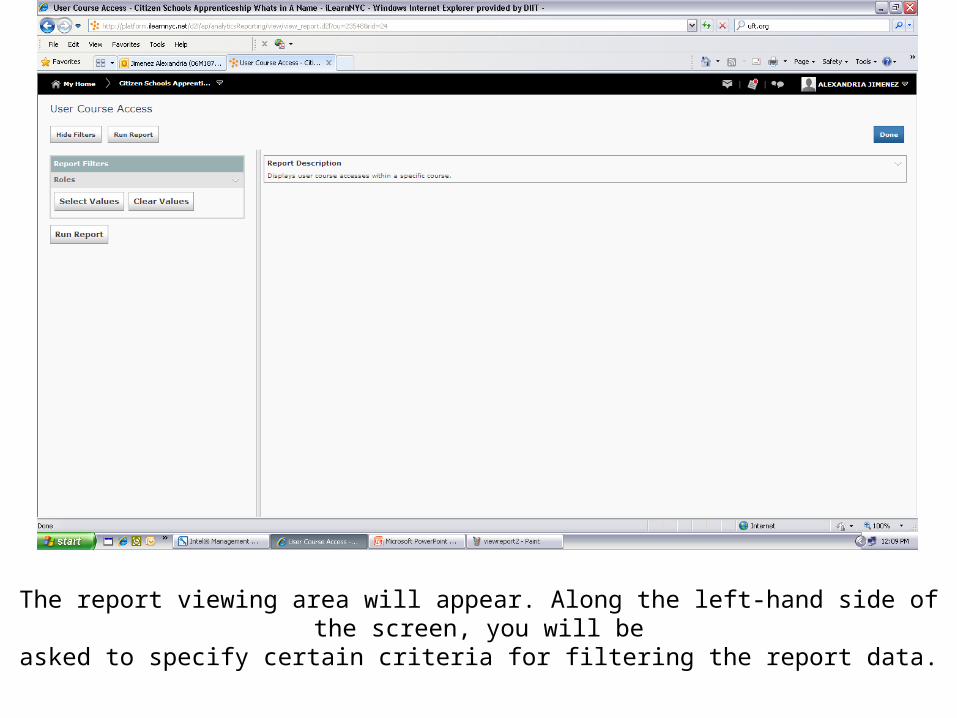
The report viewing area will appear. Along the left-hand side of the screen, you will beasked to specify certain criteria for filtering the report data.
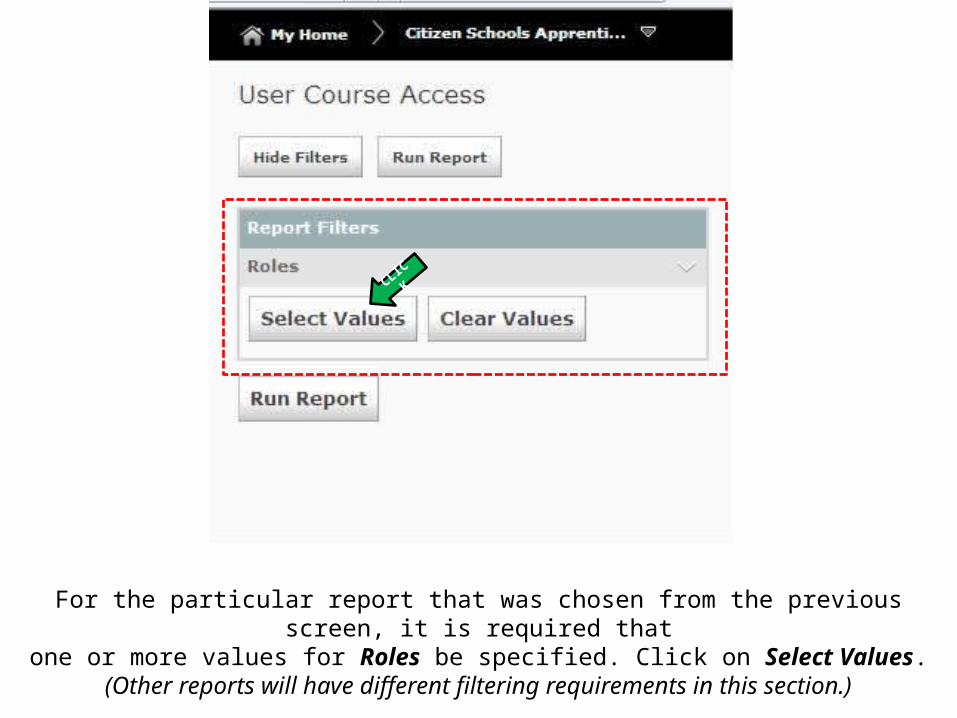
For the particular report that was chosen from the previous screen, it is required thatone or more values for Roles be specified. Click on Select Values.
(Other reports will have different filtering requirements in this section.)
CLICK

A pop-up window containing the list of possible values for Role will appear.

In this example, the User Access Report is being requested for users in the Student role only. Click on Add Selected to complete the selection of this report filter criterion.
(Notice that there are other options for running this same report for the Implementation Manager (IM) role, the Teacher role, or any combination of roles thereof.)
CLICK

The role of Student now appears in the Report Filters area.(If desired, this value can be cleared by clicking on Clear Values to start over.)
CLICK

Once all desired report filter criteria have been selected, click on Run Report.
CLICK

If there is actual data available in the system to satisfy the reporting requirements, the resulting report will appear in the report viewing area on the right-hand side of the screen.
*Note: School, Teacher, and Student names have been blocked out for confidentiality purposes.

There are several options available for downloading your report for further use.These options are seen in the upper left-hand corner of the report viewing area.
*Note: School, Teacher, and Student names have been blocked out for confidentiality purposes.

Click on the Adobe Acrobat icon to save your report as a PDF file.
CLICK

Click on the Microsoft Excel icon to download your data into a spreadsheet.This option allows you to perform further analyses on the data using
versions of MS-Excel prior to 2007.
CLICK

To export the report data into a database, click on the CSV iconwhich will extract the data in the commonly used comma-separated value format
most databases accept.
CLICK
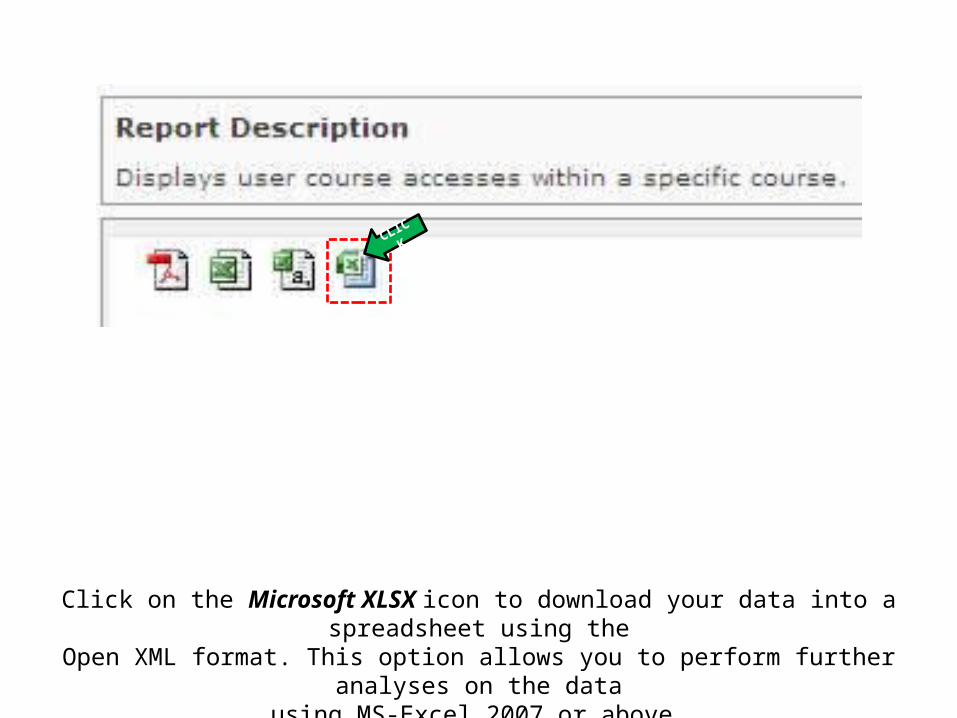
Click on the Microsoft XLSX icon to download your data into a spreadsheet using theOpen XML format. This option allows you to perform further analyses on the data
using MS-Excel 2007 or above.
CLICK

To exit and return to the complete list of reports,click on Done in the upper right-hand corner of the screen.
*Note: School, Teacher, and Student names have been blocked out for confidentiality purposes.
CLICK

iLearnNYC / D2L Analytics Portal:III. Types of Reports
Types of Reports in D2LAttendance Reports display
user course accesses within a specific course.

Types of Reports in D2LCompetency Reports provide a
comprehensive analysis of the structure of competencies and achievement rates over time.
Types of Reports in D2LContent Reports provide an
overview of the course content and access times in minutes.

Types of Reports in D2LCurriculum Mapping /Learning
Outcome Alignment Reports display the relationship between courses and curriculum standards.

Types of Reports in D2LQuiz Reports provides
information on how a class and individual students performed on a specific quiz.

Types of Reports in D2LRisk Analysis Reports display
charts corresponding to the overall distribution of at-risk versus not at-risk students, the grades for at-risk students, and the course average grade.

Types of Reports in D2LStudent Progress and Activity
Reports provide information on student progress on grades, rubrics, assignments.

Types of Reports in D2LUsage and Tool Access
Reports provide information on course access, tool usage and grades, including heat maps.
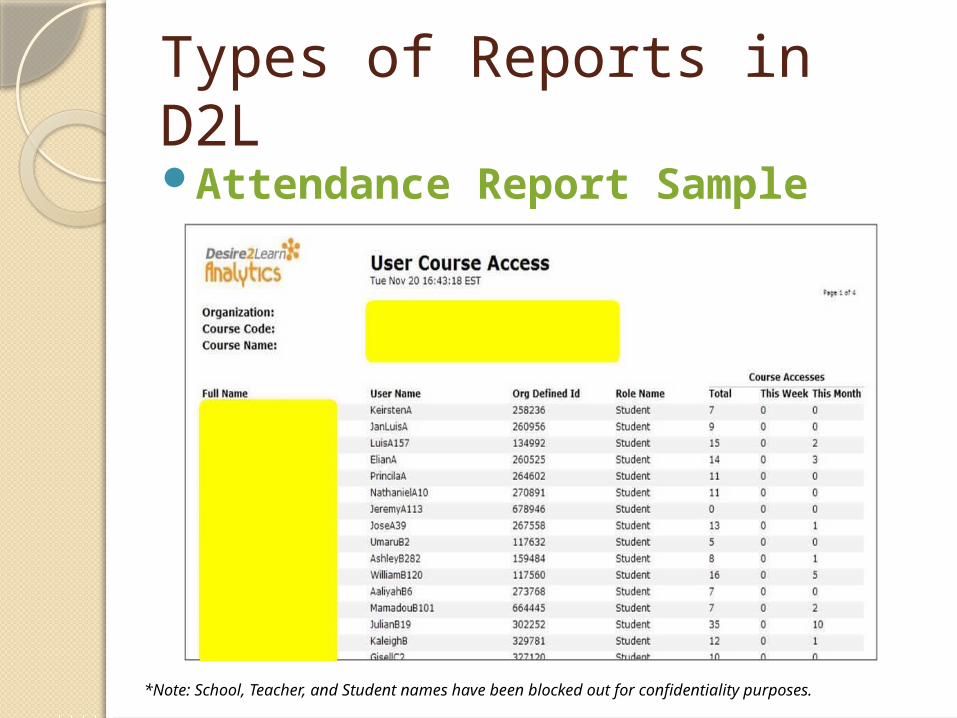
Types of Reports in D2LAttendance Report Sample
*Note: School, Teacher, and Student names have been blocked out for confidentiality purposes.

Types of Reports in D2LQuiz Report Sample #1
*Note: School, Teacher, and Student names have been blocked out for confidentiality purposes.

Types of Reports in D2LQuiz Report Sample #2
*Note: School, Teacher, and Student names have been blocked out for confidentiality purposes.