ill maryland birdlife i!!·~; nnoiiiiiiiiiiiiijii1-2)1994.pdf · will tress, 203 gittings ave.,...
TRANSCRIPT
ISSN 0147-9725
1111111; 'Ill
MARYLAND BIRDLIFE I!!·~; nnoiiiiiiiiiiiiiJII
DARK- EYED JUNCO
297.0
47.0
26.0
12.0
1.0
0.1
MARCH-DECEMBER 1994 VOLUME 50
NUMBER 1-4

MARYLAND ORNITHOLOGICAL SOCIETY, INC. Cylburn Mansion, 5015 Greenspring Ave., Baltimore, Maryland 21209
STATE OFFICERS FOR JUNE 1994 TO JUNE 1995 EXECUTIVE COUNCIL
President: V.President: Treasurer: Secretary: Exec. Secy.: Past Pres.:
Allegany:
Allan Haury, 1183 Southview Dr., Annapolis MD 21401 Robert Rineer, 8326 Philadelphia Rd., Balto MD 21237 Larry Fry, 1202 Ridge Rd, Pylesville MD 21132 Sibyl Williams, 2000 Balto.Rd,#133,Rockville MD 20851 Will Tress, 203 Gittings Ave., Baltimore MD 21212 William Newman, 11194 Douglas Ave., Marriottsville MD
STATE DIRECTORS *Gwen Brewer Howard: Teresa Simons Mark Weatherholt
410-757-3523 410-391-8509 410-452-8539 301-762-0560 410-433-1058 410-442-5639
Anne Arundel: *Pete Hanan Gerald Cotton
*Dave Harvey Jane H. Farrell Carol Newman Donald Waugh Helen Zeichner
Baltimore:
Sue Ricciardi Jug Bay:
*Sukon Kanchanaraksa Brent Byers Kent: Karen Morley Terrence Ross
*Michael Callahan Wally Stephens
*Pat Wilson Margaret Duncan
Gene Scarpulla Montgomery: *LouDeMouy Margaret Donnald Bill Kulp
Caroline:
Carroll:
Cecil:
Peter A. Webb
*Wilbur Rittenhouse Oliver Smith
*Robert Ringler Patuxent: Sue Yingling
*Gary Griffith Talbot: Eugene K. Hess Scott Powers
John Malcolm Gary Nelson
*Pamela H. Stephen Chandler S. Robbins
*William Novak Frank Lawlor Donald Meritt
Frederick: *Bob Johnson Washington: *Elizabeth Wolfe Ann Mitchell
Harford:
Marilyn Yost
*Jean Fry Thomas Congersky Mark S. Johnson Randy Robertson
Active Membership (adults) Household Sustaining Life Junior (under 18 years)
Wicomico: *Susan Potts Shirley Taylor
*Denotes Chapter President
$10.00 plus local chapter dues 15.00 plus local chapter dues 25.00 plus local chapter dues
400.00 (4 annual installments) 5.00 plus local chapter dues
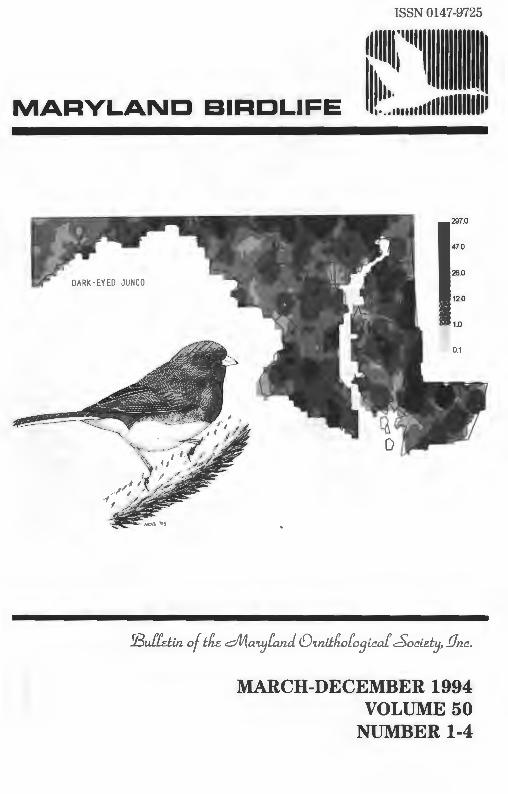
Cover: Distribution of Dark-eyed Junco. Drawing by Michael O'Brien.
MARYLAND BIRDLIFE
VOLUME 50 MARCH-DECEMBER 1994 NUMBER1-4
DISTRIBUTION AND ABUNDANCE OF BIRDS WINTERING IN MARYLAND,
1988-1993
JEFFS. IIATFIELD1, SUE A. RICCIARDP, GREG A. GOUGH1,
DANNY BYSTRAK3, SAM DROEGE\ AND CHANDLERS. ROBBINS1
Wational Biological Service, Patuxent Wildlife Research Center, Laurel, Maryland 20708
21132 Ferber Avenue, Arnold, Maryland 21012 36400 MaUard Lane, Lothian, Maryland 20711
Abstract
A winter bird survey was conducted throughout Maryland, primarily by volunteers, during the 6 winters of 1988 to 1993 between the dates 10 Jan and 10 Feb. The state of Maryland is covered by 1231 blocks (9.5 sq. miles each), each comprising onesixth of the standard U.S.G.S. 7.5 minute topographic quadrangle, and 548 of these blocks ( 44.5%) were surveyed for winter birds. Blocks were chosen in a systematic pattern with eventually almost every other block in the state having been surveyed as of Feb, 1993. Volunteers conducted each 4-hour survey by walking a 4-6 mile route chosen by the volunteer to sample habitats in proportion to their availability in the block. Surveys began around sunrise (-7:30a.m.) and all birds seen or heard during the· 4 hours were recorded on data sheets. The data were then used to create maps representing the distribution and relative abundance of each species of wintering bird found in at least 10 blocks in the state.
Introduction
The current Maryland winter bird survey had its origin in the early 1970s when Chandler S. Robbins and Danny Bystrak coordinated a small-scale project in central Maryland (Robbins 1970, 1971 ). The survey was designed as a monitoring program for winter resident birds, but proved to be valuable as an inventorying method, producing fme-scale relative abundance maps (Bystrak and Robbins 1972). Additionally, Bystrak and Robbins (1972) found interesting year-to-year variation in abundance of species not commonly thought to be irruptive. The project was intended only as a pilot study and was discontinued after 5 years.
4 MARYLAND BIRDUFE Vol. 50, No. 1-4
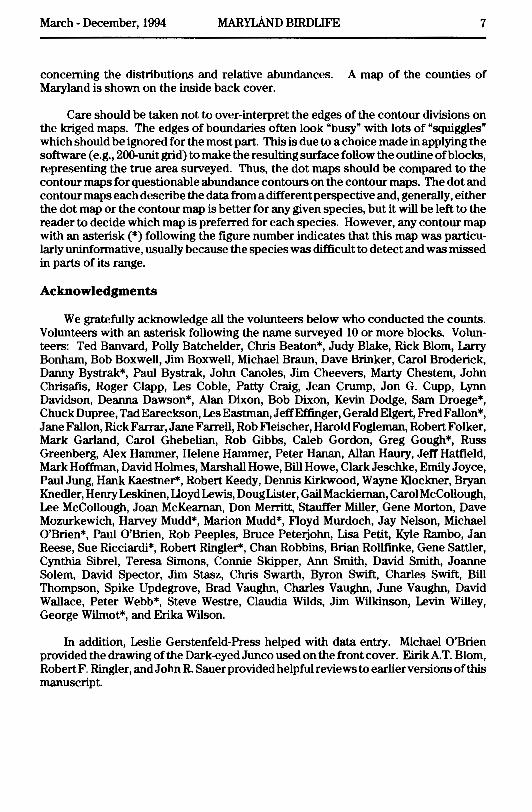
Wanting to see the concept tried on a larger scale and to compare results to the Audubon Christmas Bird Count data, Bystrak, Sam Droege, Robert F. Ringler, and Eirik A~ T. Blom designed the current winter bird survey. The plan was to devote 6 years to a survey similar to the earlier, more limited one, but to survey 3 blocks per quadrangle, if possible, instead of just 1 block over the 6 years. To minimize the impact of annual variability in abundances, target blocks were designated each year in a pattern extending from south to north in each quadrangle. The blocks in the bottom third of each quadrangle were targeted in the first and fourth years, the middle third in the second and fifth years, and the top third in the third and sixth years. The resulting coverage was a systematic sample of blocks in a checkerboard pattern with the annual mean geographic locations approximately the same. Ultimately, the numbers ofblocks surveyed each year were 96, 89, 94, 73, 72, and 124 for the 6 years, respectively, totaling 548 blocks. Fig. 1a shows the blocks sampled along with the standard physiographic regions of Maryland, following Stewart and Robbins ( 1958).
Sue A. Ricciardi served as the coordinator, in charge of organizing volunteers each year to run the targeted blocks. Volunteers were screened for ability to identify winter birds and were sent materials for conducting the survey. The standard guidelines and forms used by the volunteers are included in an Appendix. Once a block was assigned, it was the volunteer's responsibility to set up the 4-6 mile walking route such that it would sample habitats in proportion to their availability, if possible, within the block. Surveys were conducted between 10 Jan and 10 Feb, from approximately 7:30 to 11:30 a.m. Birds were recorded on each survey in 8 30-minute periods to give a measure of frequency as well as abundance. Volunteers used standard field and summary forms and returned the completed forms, along with a sketch of the route, to the coordinator. Then the data were subjected to rigorous quality control and entered into a computer data me for analyses.
Data Analyses
Summary statistics were tabulated for each species. These included the percent of blocks in which each species was detected, the mean abundance in blocks where each species was detected (i.e., occupied blocks), and the mean abundance over all548 blocks, including blocks where the species was not detected (counted as 0 in the overall means). Species found in 10 or more blocks were ranked using each of these 3 statistics for comparison of the relative abundance among species. Rarer species were not ranked because of imprecision in rankings of such species.
Due to the survey design, it was not possible to statistically control for differences in the volunteers' abilities (e.g., some people are probably better birders than others) and thus all maps and summary statistics are conditional upon assuming no observer effects. Other sources of bias in this survey also exist. For example, some habitats may not have been sampled well because they were less accessible by road (e.g., marshes with poor road access) and this may have caused some species to have lower detectability or spotty distributions (e.g., Swamp Sparrow). Weather also may have affected the results (e.g., open bodies of water on a given block may have been icecovered during the actual count). Furthermore, all results apply only to the 6 years of this survey and no attempt is made in this paper to account for yearly differences in abundances of species.
Another publication (Hatfield et al., In Prep.) will investigate yearly variability in abundance of each species, compare the winter bird survey to Audubon Christmas Bird Count data collected near sampled blocks around the same period, and evaluate the
March - December, 1994 MARYLAND BIRDLIFE 5
winter bird survey by comparing within-block versus between-block variability in counts of each species on a subset of 22 blocks sampled repeatedly during 2 winters ( 1992, 1993). Only 1 survey, chosen at random from each repeated block, was included in the analyses for the current study.
Maps
Two maps were produced for each species found in at least 10 blocks during the 6 years of the survey. The first map (designated "a") for each species, the dot map, has a black dot in each surveyed block where it was found, with the area of the dot proportional to the size of the count obtained during the 4-hour survey. The areas of the dots on each map were scaled between the smallest and largest count and a small "o" was placed in each surveyed block where a count of 0 was obtained (i.e., block was sampled but no birds of that species were found on that survey). Therefore, the dot maps present the actual data with no statistical smoothing between blocks. Map Viewer Software Version 1.1 (Golden Software, Golden, Colorado) was used to create these dot maps.
The second map (designated "b") of each pair of species' maps is the contour map. These maps were produced using Surfer Software Version 5.01 (Golden Software, Golden, Colorado) with a statistical procedure called kriging (lsaaks and Srivastava 1989) and thus represent a statistically smoothed version of the data. In kriging, a grid is superimposed on the state and a linear model is calculated that estimates the count at any grid point as a weighted average of nearby points where data were collected. The counts from (at most) the 9 closest blocks within about 2 block-widths around each grid point were used in the calculations. This was necessary due to the irregular shape of Maryland, especially the narrow part of the panhandle between Allegany and Washington counties, but sometimes resulted in a blotchy effect for the contour maps of less abundant species. For contour maps that appear particularly blotchy, the dot map may be easier to interpret.
For the reader interested in more technical detail, kriging was used because it is a smoothing procedure that incorporates the autocorrelation structure among the blocks. The kriging was performed over a200-unit grid assuming a Gaussian variogram estimated separately for each species. The weights were a function of distance, estimated using the variogram, which measures the spatial association among blocks as a function of the distance between them (lsaaks and Srivastava 1989).
Contour intervals for each species were chosen such that the largest contour was the maximum count over all the 4-hour surveys. The next three contours for most species were the 75th, 50th (median), and 25th percentiles of the nonzero counts of these species. To illustrate, see the contour scale for Turkey Vulture (Fig. 19b ). Seventy-five percent of the surveys of blocks where Turkey Vultures were detected resulted in counts ranging from 1 to 12 birds and 25% found from 12 to 157 birds. The median count was 6 birds and the count of 3 was the 25th percentile. For some species, however, some of the percentiles were the same and therefore these species have fewer than 4 contour intervals. The 0.1 contour interval subdivision present on some maps was chosen arbitrarily to represent a very low density of birds (i.e., 1 bird detected in 10 4-hour surveys).

6 MARYLAND BIRDUFE Vol. 50, No. 1-4
Description of Maryland
For the purpose of interpreting the maps, a brief discussion of the geography of the state and its physiographic regions (see Fig. 1a) follows. Maryland contains parts of3 physiographic provinces (Frese 1994): Coastal Plain, Piedmont, and Appalachian. Elevations increase from sea level to 3360 feet, generally in an east-west progression. The Coastal Plain, part of the Atlantic Coastal Plain, is further divided on the map into the Upper Chesapeake, Eastern Shore, and Western Shore sections bordering the Chesapeake Bay. Elevations there are mostly less than 100 feet, with the topography low and flat except for the hilly country of the lower Western Shore. Major rivers are the Patuxent, Potomac, Chester, Choptank, Nanticoke, and Pocomoke, all of which drain into the Chesapeake Bay. Agriculture predominates, with much of the land cleared for soybeans, com, wheat, hay, and on the lower Western Shore, tobacco.
The Piedmont province is sandwiched between the fall line for streams and the eastern beginnings of the Catoctin mountains. The land is rolling and hilly, ranging in elevation from about 100 to 800 feet, and is drained mostly by the Potomac, Monocacy, Patapsco, Gunpowder, and Susquehanna rivers. Straddling the boundary between Coastal Plain and Piedmont are the heavily urbanized areas of Baltimore, Maryland, and Washington, D.C., both of which are surrounded by extensive suburban development that reaches far into both provinces.
The Appalachian Province is composed of the Ridge and Valley and the Allegheny Mountain sections. The former section is characterized by ridges and steep mountains running northeast to southwest separated by mostly narrow valleys, with elevations in the 500 to 2000 feet range. The heavily forested Allegheny Mountain section is part of the Allegheny Plateau and contains the state's highest elevations, mostly in the range of 2000 to 3000 feet.
Less than half of the land surface in the state is forested, with oak and hickory predominating, although Loblolly Pine prevails on the Eastern Shore. Mean annual snowfall accumulations range from about 100 inches in extreme western Maryland to 10 inches on the Eastern Shore. January is the coldest month, and mean temperatures for January and February range between the upper 20's and upper 30's degrees Fahrenheit.
Results and Discussion
A total of 147 species was detected in the 548 blocks during the survey, with 98 species found in 10 or more blocks. Fig. 1a shows the blocks that were sampled during the survey along with the physiographic regions of Maryland. Fig. 1b shows a contOur map for the total number of species detected per block along with sununary statistics. Table 1 presents the summary statistics for the 49 species found on fewer than 10 blocks. The order of the species in Table 1, as well as the order of the maps, is by taxonomic sequence (AOU 1983). This publication was used to determine the standard common name of each species and should also be consulted for scientific names.
Figs. 2a-102a are the dot maps for the 98 species found on 10 or more blocks, plus 3 maps of species groups of gulls and crows. Summary statistics also are shown on the dot maps. The units for the scales on all maps, and for the mean relative abundances, are the number of birds counted during a 4-hour walking survey. Figs. 2b-102b are the contour maps for each species or species group, and their captions provide comments
March - December, 1994 MARYLAND BIRDIJFE 7
concerning the distributions and relative abundances. A map of the counties of Maryland is shown on the inside back cover.
Care should be taken not to over-interpret the edges of the contour divisions on the kriged maps. The edges of boundaries often look "busy" with lots of "squiggles" which should be ignored for the most part. This is due to a choice made in applying the software (e.g., 200-unit grid) to make the resulting surface follow the outline of blocks, representing the true area surveyed. Thus, the dot maps should be compared to the contour maps for questionable abundance contours on the contour maps. The dot and contour maps each describe the data from a different perspective and, generally, either the dot map or the contour map is better for any given species, but it will be left to the reader to decide which map is preferred for each species. However, any contour map with an asterisk (*) following the figure number indicates that this map was particularly uninformative, usually because the species was difficult to detect and was missed in parts of its range.
Acknowledgments
We gratefully acknowledge all the volunteers below who conducted the counts. Volunteers with an asterisk following the name surveyed 10 or more blocks. Volunteers: Ted Banvard, Polly Batchelder, Chris Beaton*, Judy Blake, Rick Blom, Larry Bonham, Bob Boxwell, Jim Boxwell, Michael Braun, Dave Brinker, Carol Broderick, Danny Bystrak*, Paul Bystrak, John Canoles, Jim Cheevers, Marty Chestem, John ChrisafiS, Roger Clapp, Les Coble, Patty Craig, Jean Crump, Jon G. Cupp, Lynn Davidson, Deanna Dawson*, Alan Dixon, Bob Dixon, Kevin Dodge, Sam Droege*, Chuck Dupree, Tad Eareckson, Les Eastman, Jeff Effinger, Gerald Elgert, Fred Fallon*, Jane Fallon, Rick Farrar, Jane Farrell, Rob Fleischer, Harold Fogleman, Robert Folker, Mark Garland, Carol Ghebelian, Rob Gibbs, Caleb Gordon, Greg Gough*, Russ Greenberg, Alex Hammer, Helene Hammer, Peter Hanan, Allan Haury, Jeff Hatfield, Mark Hoffman, David Holmes, Marshall Howe, Bill Howe, Clark Jeschke, Emily Joyce, Paul Jung, Hank Kaestner*, Robert Keedy, Dennis Kirkwood, Wayne Klockner, Bryan Knedler, Henry Leskinen, Uoyd Lewis, Doug Lister, GailMackiernan, Carol McCollough, Lee McCollough, Joan McKearnan, Don Merritt, Stauffer Miller, Gene Morton, Dave Mozurkewich, Harvey Mudd*, Marion Mudd*, Floyd Murdoch, Jay Nelson, Michael O'Brien*, Paul O'Brien, Rob Peeples, Bruce Peterjohn, Lisa Petit, Kyle Rambo, Jan Reese, Sue Ricciardi*, Robert Ringler*, Chan Robbins, Brian Rollfinke, Gene Sattler, Cynthia Sibrel, Teresa Simons, Connie Skipper, Ann Smith, David Smith, Joanne Solem, David Spector, Jim Stasz, Chris Swarth, Byron Swift, Charles Swift, Bill Thompson, Spike Updegrove, Brad Vaughn, Charles Vaughn, June Vaughn, David Wallace, Peter Webb*, Steve Westre, Claudia Wilds, Jim Wilkinson, Levin Willey, George Wilmot*, and Erika Wilson.
In addition, Leslie Gerstenfeld-Press helped with data entry. Michael O'Brien provided the drawing of the Dark-eyed Junco used on the front cover. Eirik A. T. Blom, Robert F. Ringler, and John R. Sauer provided helpful reviews to earlier versions of this manuscript.
8
. . . . . . . . . . . . . . . . . . . • . . . ~ ~ .
ALLEGHENY MOUNTAIN
Fig. 1a.
MARYLAND BIRDUFE
. .. . . . . . . . . . RIDGE AND VALLEY
:e • • • • • • • • • • • - . ,_ . . . . . . . . . . . . . . . . . . . . . . . . . . . . . . . .. . . . . . . . . . . . . ~ . . • •• - "i-•••••
• • • -1-i. • • • •
• • • • . . . . • • • •• . . . . . . . . . . ..
• •• PIEDMONT . .
Physiographic regions of Maryland (from Stewart and Robbins 1958). Blocks sampled during the winter bird survey (10 Jan-10 Feb, 1988- 1993) are marked with a dot.
WESTERN
. . . • •
• . • •
• •
Vol. 50, Nos. 1-4
UPPER CHESAPEAKE
EASTERN SHORE
• • • • • • •• . . . • • • • •
Q 0
. . . . . . . . • • ..
March-December, 1994 MARYLAND BIRDUFE
TOTAL SPECIES PER BLOCK
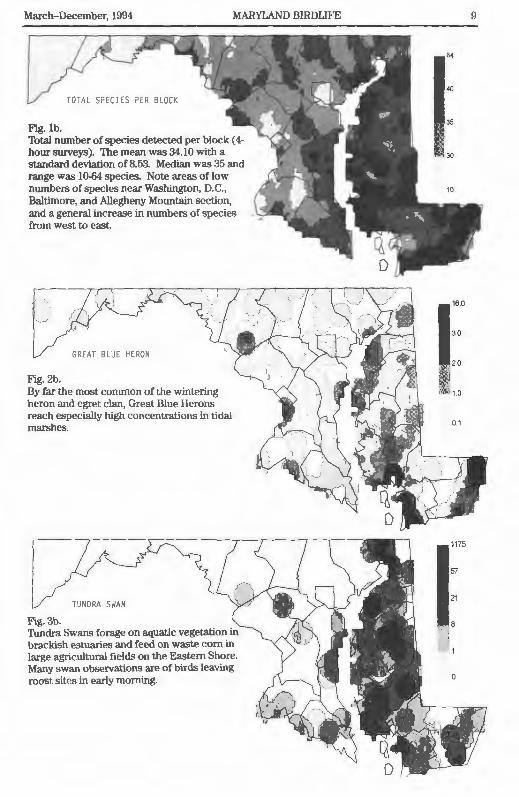
Fig. lb. Total number of species detected per block ( 4-hour surveys). The mean was 34.10 with a standard deviation of 8.53. Median was 35 and range was 10-64 species. Note areas of low numbers of species near Washington, D.C., Baltimore, and Allegheny Mountain section, and a general increase in numbers of species from west to east.
GREAT BLUE HERON
Fig. 2b. By far the most common of the wintering heron and egret clan, Great Blue Herons reach especially high concentrations in tidal marshes.
TUNDRA SWAN
F\g. 3b. Tundra Swans forage on aquatic vegetation in brackish estuaries and feed on waste com in large agricultural fields on the Eastern Shore. Many swan observations are of birds leaving roost sites in early morning.
9
64
40
35
3D
16.0
3.0
2.0
1.0
0.1
1175
21
8
10 MARYLAND BffiDUFE
····~···· ........ . }' . .. 0 •••
0 • • 0
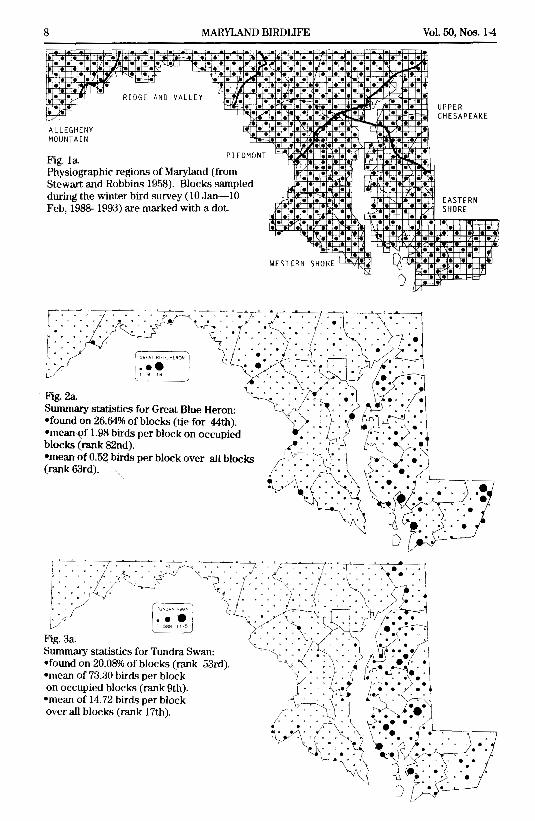
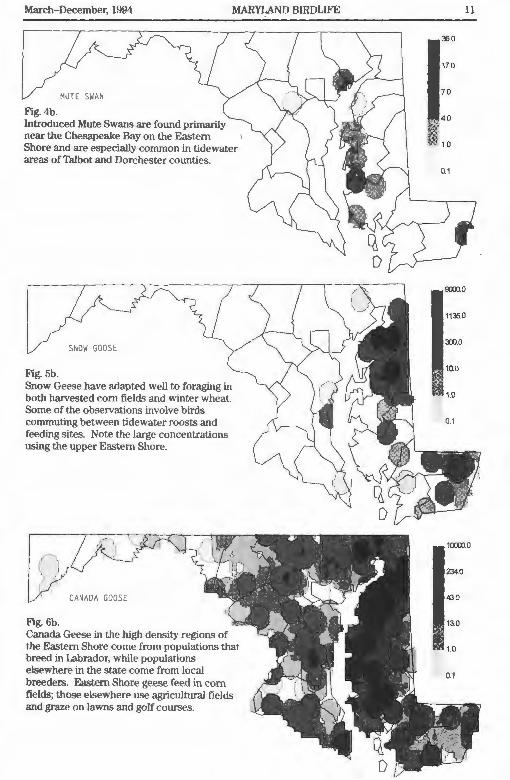
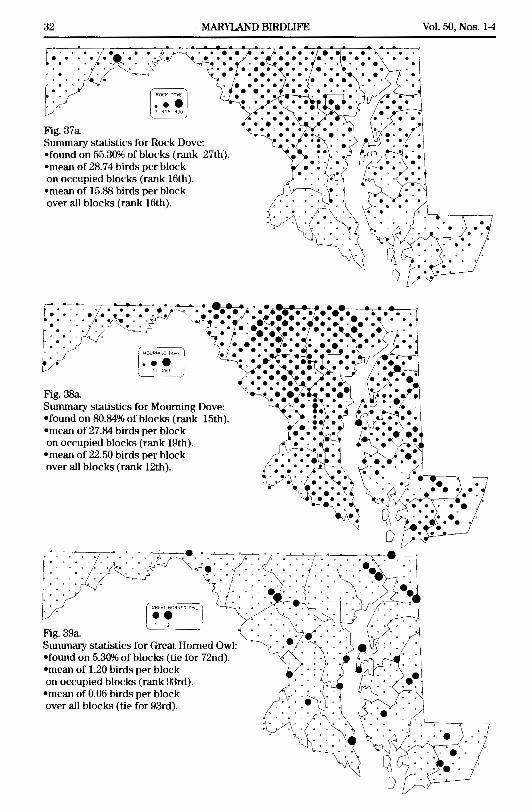
~J Fig. 4a. Summary statistics for Mute Swan: •found on 1.82% of blocks (tie for 96th). •mean of 10.50 birds per block on occupied blocks (rank 35th). •mean of 0.20 birds per block over all blocks (rank Slst).
·./ Fig. 5a. Summary statistics for Snow Goose: •found on 7.84% of blocks (rank 67th). •mean of 997.30 birds per block on occupied blocks (rank 1st). •mean of 78.26 birds per block over all blocks (rank 6th).
Fig. 6a. Summary statistics for Canada Goose: •found on 50.36% of blocks (rank 29th). •mean of 275.30 birds per block on occupied blocks (rank 4th). •mean of 138.66 birds per block over all blocks (rank 4th).
Vol. 50, Nos. 1-4
March-December, 1994 MARYLAND BIRDLIFE
MUTE SWAN
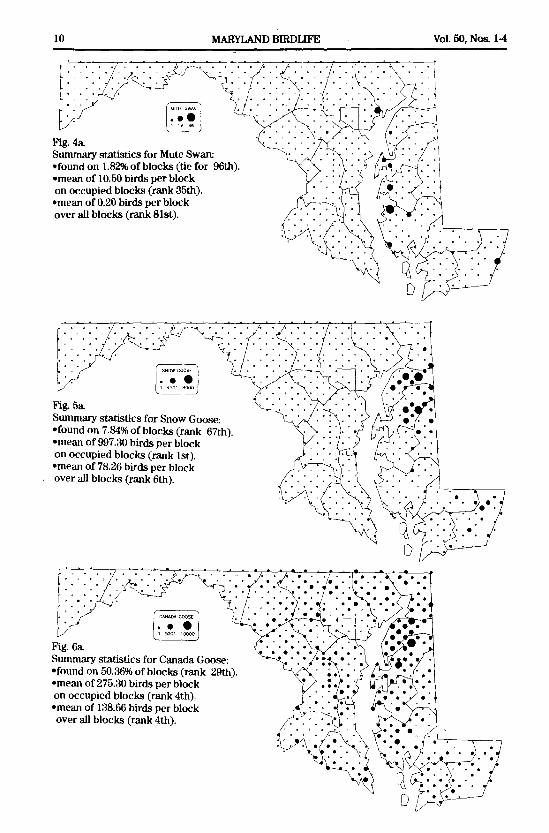
Fig. 4b. Introduced Mute Swans are found primarily near the Chesapeake Bay on the Eastern Shore and are especially conunon in tidewater areas of Talbot and Dorchester counties.
SNOW GOOSE
Fig. 5b. Snow Geese have adapted well to foraging in both harvested com fields and winter wheat. Some of the obseiVations involve birds commuting between tidewater roosts and feeding sites. Note the large concentrations using the upper Eastern Shore.
CANADA GOOSE
Fig. 6b. Canada Geese in the high density regions of the Eastern Shore come from populations that breed in Labrador, while populations elsewhere in the state come from local breeders. Eastern Shore geese feed in com fields; those elsewhere use agricultural fields and graze on lawns and golf courses.
11
36.0
17.0
70
40
1.0
0.1
0000.0
1135.0
300.0
10.0
1.0
0.1
10000.0
234.0
43.0
13.0
1.0
0.1
12 MARYLAND BIRD LIFE
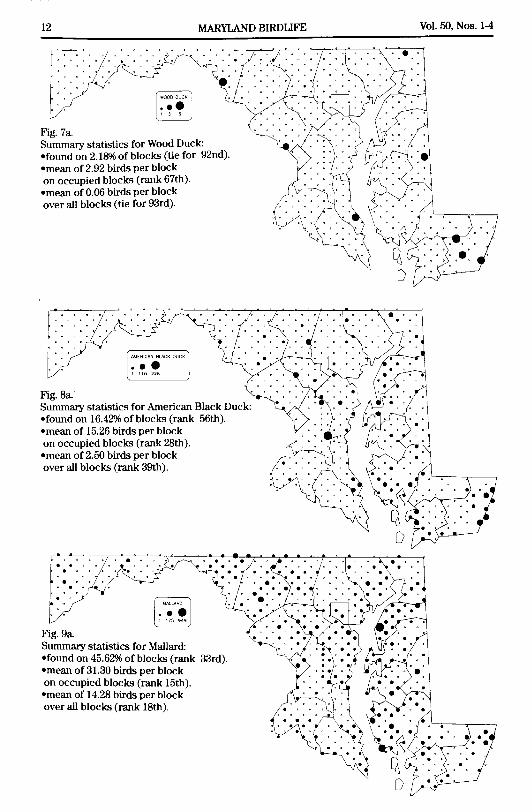
Fig. 7a. Summary statistics for Wood Duck: •found on 2.18% of blocks (tie for 92nd). •mean of 2.92 birds per block on occupied blocks (rank 67th). •mean of 0.06 birds per block over all blocks (tie for 93rd).
Fig. Sa. Summary statistics for American Black Duck: •found on 16.42% of blocks (rank 56th). •mean of 15.26 birds per block on occupied blocks (rank 28th). •mean of 2.50 birds per block over all blocks (rank 39th).
Fig. 9a. Summary statistics for Mallard: •found on 45.62% of blocks (rank 33rd). •mean of 31.30 birds per block on occupied blocks (rank 15th). •mean of 14.28 birds per block over all blocks (rank 18th).
Vol. 50, Nos.l-4
March-December, 1994
WOOD DUCK
Fig. 7b*
MARYLAND BIRDLIFE
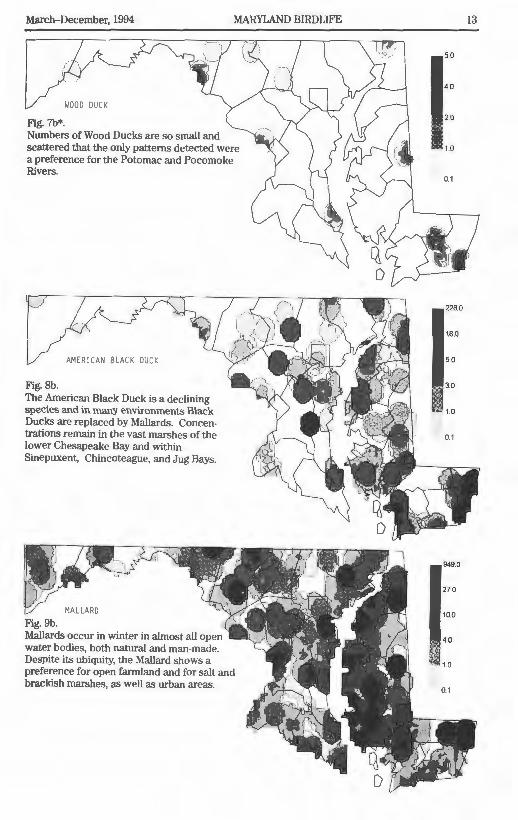
Numbers of Wood Ducks are so small and scattered that the only patterns detected were a preference for the Potomac and Pocomoke Rivers.
AME RICAN 8LACK DUCK
Fig. 8b. The American Black Duck is a declining species and in many envrronrnents Black Ducks are replaced by Mallards. Concentrations remain in the vast marshes of the lower Chesapeake Bay and within Sinepuxent, Chincoteague, and Jug Bays.
MALLARD Fig. 9b. Mallards occur in winter in almost all open water bodies, both natural and man-made. Despite its ubiqui ty, lhe Mallard shows a preference for open farmland and for salt and brackish marshes, as well as urban areas.
13
5.0
4.0
2.0
1.0
0.1
228.0
18.0
5.0
3.0
1.0
0.1
949.0
27.0
10.0
4.0
1.0
0.1
14 MARYLAND BIRD LIFE
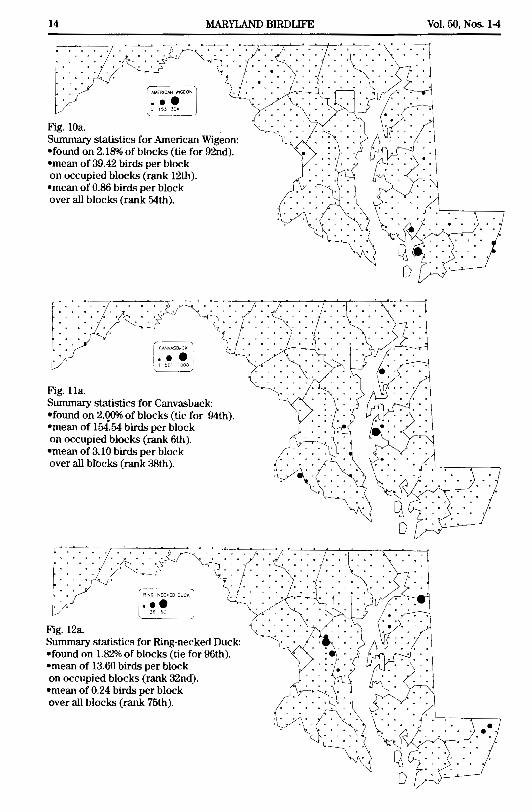
Fig. lla. Summary statistics for Canvasback: •found on 2.00% of blocks (tie for 94th). •mean of 1M. 54 birds per block on occupied blocks (rank 6th). •mean of 3.10 birds per block over all bfocks (rank 38th).
Fig. 12a Summary statistics for Ring-necked Duck: •found on 1.82% of blocks (tie for 96th). •mean of 13.60 birds per block on occupied blocks (rank 32nd). •mean of 0.24 birds per block over all blocks (rank 75th).
Vol. 50, Nos. 1-4
March-December, 1994
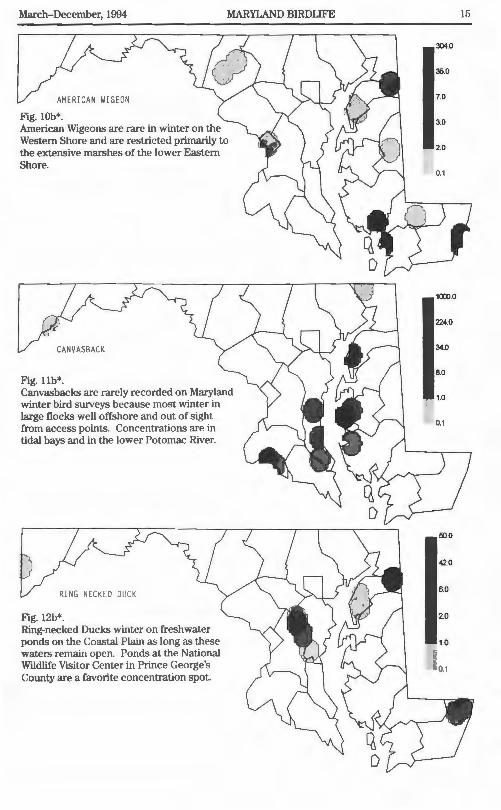
AMERI CAN WI GEON
Fig. lOb*.
MARYLAND BIRDLIFE
American Wigeons are rare in winter on the Western Shore and are restricted primarily to the extensive marshes of the lower Eastern Shore.
CANVASBACK
Fig. llb*. Canvasbacks are rarely recorded on Maryland winter bird surveys because most winter in large flocks well offshore and out of sight from access points. Concentrations are in tidal bays and in the lower Potomac River.
RIN G- NE CKED DUCK
Fig. 12b* Ring-necked Ducks winter on freshwater ponds on the Coastal Plain as long as these waters remain open. Ponds at the National Wildlife Visitor Center in Prince George's County are a favorite concentration spot.
15
304.0
35.0
7.0
3.0
2.0
0.1
1000.0
224.0
34.0
8.0
1.0
0.1
fO.O
42.0
6.0
2.0
1.0
0.1
16 MARYLAND BIRDUFE
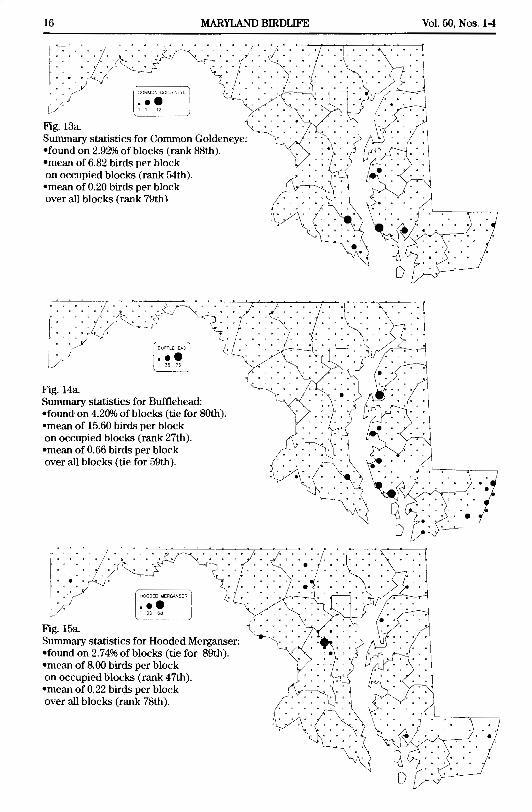
Fig. 13a. Summary statistics for Common Goldeneye: •found on 2.92% of blocks (rank 88th). •mean of 6.82 birds per block on occupied blocks (rank 54th). •mean of 0.20 birds per block over all blocks (rank 79th)
(
1
6t..IFF"l0i[AD
••• Fig. 14a Summary statistics for Bufflehead: •found on 4.20% of blocks (tie for 80th). •mean of 15.60 birds per block on occupied blocks (rank 27th). •mean of 0.66 birds per block over all blocks (tie for 59th).
Fig. 15a Summary statistics for Hooded Merganser: •found on 2.74% of blocks (tie for 89th). •mean of 8.00 birds per block on occupied blocks (rank 47th). •mean of 0.22 birds per block over all blocks (rank 78th).
Vol. 50, Nos. 1-4

March-December, 1994
COMMON GOLDENEYE
Fig. 13b* Common Goldeneyes congregate in tidal bays, especially in the lower Chesapeake Bay and in the lower Patuxent River.
BU FF LEHEAD
Fig. 14b*. A bird of large bodies of water, Buflleheads occur_ primarily in bays and larger tributaries, espectally along the Eastern Shore and in coastal bays.
HOODED MERGANSER
Fig. 15b*. Hooded Mergansers winter on freshwater ponds, reservoirs, and strean1s in the Coastal Plain and Piedmont regions. The largest count was at the Patuxent Wildlife Research Center.
MARYLAND BIRDLJFE 17
320
110
2.0
1.0
0.1
75.0
26.0
70
3.0
1.0
0.1
68.0
6.0
4.0
2.0
1.0
0.1
18 MARYLAND BIRDLIFE
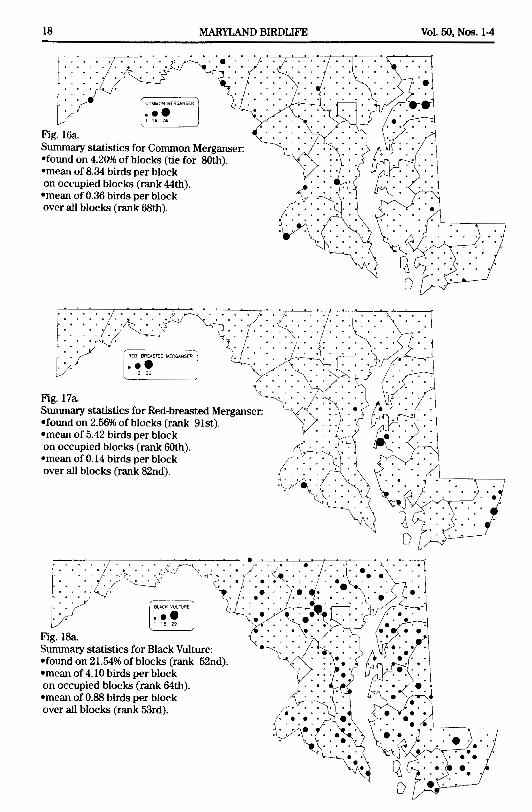
Fig. l6a. Swruuary statistics for Common Merganser: •found on 4.20% of blocks (tie for 80th). •mean of 8.34 birds per block on occupied blocks (rank 44th). •mean of 0.36 birds per block over all blocks (rank 68th).
(··.·.·.·.· Fig. 17a. · ~~ · · · · · · · · Swruuary statistics for Red-breasted Merganser: · •found on 2.56% of blocks (rank 9lst). •mean of 5.42 birds per block on occupied blocks (rank 60th). •mean of 0.14 birds per block over all blocks (rank 82nd).
Vol. 50, Nos. 14
March-December, 1994
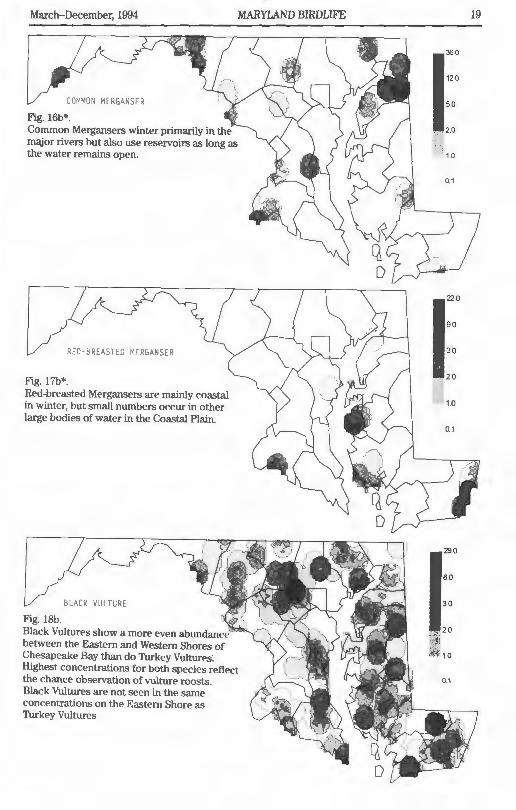
COMMON MERGANSER
Fig. 16b* Common Mergansers winter primarily in the major rivers but also use reservoirs as long as the water remains open.
RED-BREASTED MERGANSER
Fig. l 7b*. Red-breasted Mergansers are mainly coastal in winter, but small numbers occur in other large bodies of water in the Coastal Plain.
BLACK VULTURE
Fig. l8b.
MARYLAND BIRDUFE
Black Vultures show a more even :th.unrl:tnro>~""v between the Eastern and Western Shores of Chesapeake Bay than do Turkey Vultures. Highest concentrations for both species reflect the chance observation of vulture roosts. Black Vultures are not seen in the same concentrations on the Eastern Shore as Turkey Vultures
19
360
120
50
2.0
10
01
22.0
90
30
2.0
10
01
290
60
30
20
10
01
20 MARYLAND BIRDLIFE
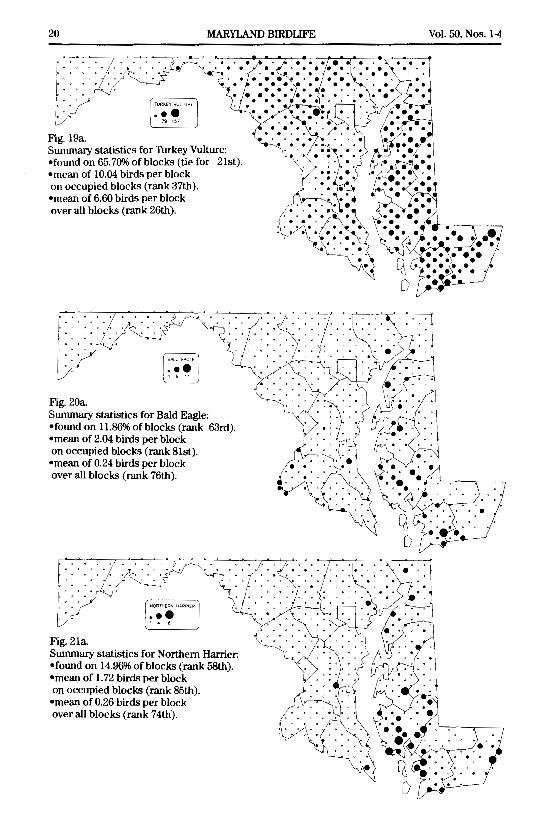
Fig. 19a. Summary statistics for Turkey Vulture: •found on 65.70% of blocks (tie for 21st). •mean of 10.04 birds per block on occupied blocks (rank 37th). •mean of 6.60 birds per block over all blocks (rank 26th).
'--' _'_''___
Fig. 20a. Summary statistics for Bald Eagle: •found on 11.86% of blocks (rank 63rd). •mean of 2.04 birds per block on occupied blocks (rank Slst). •mean of 0.24 birds per block over all blocks (rank 76th).
Fig. 21a. Summary statistics for Northern Harrier: •found on 14.96% of blocks (rank 58th). •mean of 1. 72 birds per block on occupied blocks (rank 85th). •mean of 0.26 birds per block over all blocks (rank 74th).
Vol. 50, Nos. 1-4
March-December, 1994 MARYLAND BIRDLIFE
TURKEY VULTURE
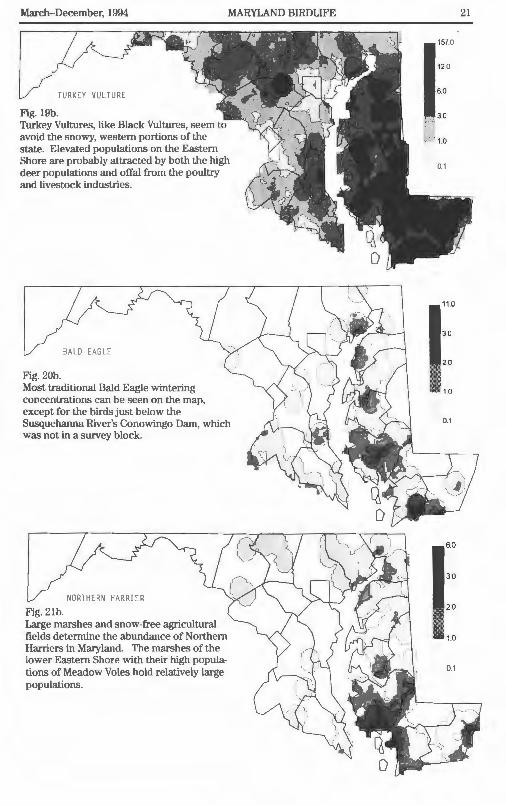
Fig. 19b. Turkey Vultures, Like Black Vultures, seem to avoid the snowy, western portions of the state. Elevated populations on the Eastern Shore are probably attracted by both the high deer populations and offal from the poultry and livestock industries.
BALD EASLE
Fig. 20b. Most traditional Bald Eagle wintering concentrations can be seen on the map, except for the birds just below the Susquehanna River's Conowingo Dam, which was not in a survey block.
NORTHERN HARRIER
Fig. 2lb. Large marshes and snow-free agricultural fields detemline the abundance of Northern Harriers in Maryland. The marshes of the lower Eastern Shore with their high populations of Meadow Voles hold relatively large populations.
21
1570
12.0
6.0
3.0
10
01
110
30
20
10
0.1
6.0
3.0
2.0
10
0.1
22 MARYLAND BIRD LIFE
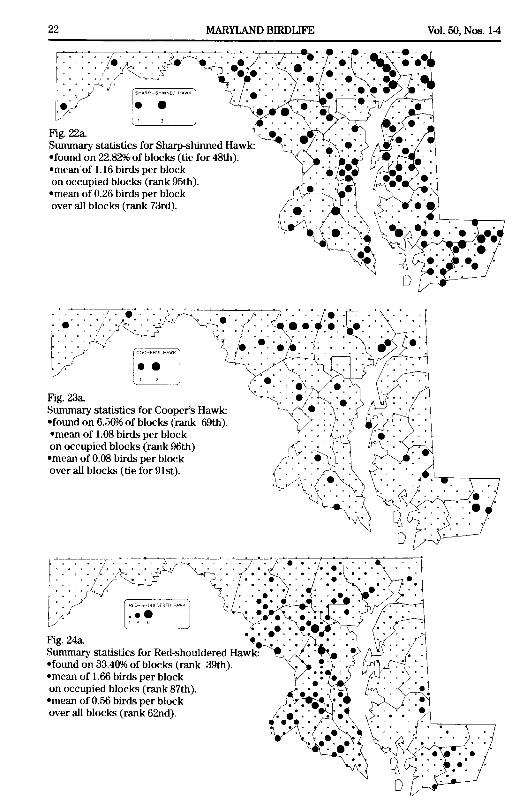
Fig. 22a Summary statistics for Sharp-shinned Hawk: •found on 22.82% of blocks (tie for 48th). •mean'of 1.16 birds per block on occupied blocks (rank 95th). •mean of 0.26 birds per block over all blocks (rank 73rd).
Fig. 23a Summary statistics for Cooper's Hawk: •found on 6.56% of blocks (rank 69th). •mean of 1.08 birds per block on occupied blocks (rank 96th) •mean of 0.08 birds per block over all blocks (tie for 9lst).
Vol. 50, Nos. 14
March-December, 1994 MARYLAND BIRDUFE
SHARP-SHINNED HAW ~
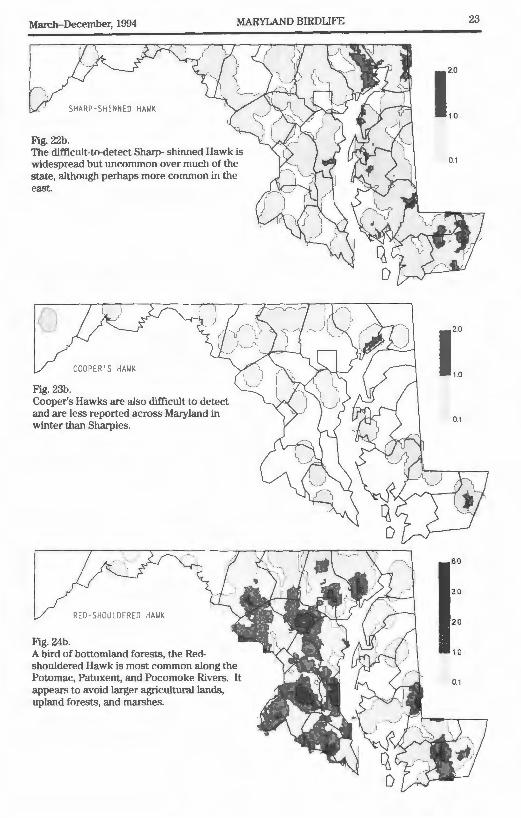
Fig. 22b. The difficult-to-detect Sharp- shjnned Hawk is widespread but uncommon over much of the state, although perhaps more common in the east.
0 COOPER ' S HAWK
Fig. 23b. Cooper's Hawks are also difficult to detect and are less reported across Maryland in winter than Sharpies.
RED-SHOULDERED HAWK
Fig. 24b. A bird of bottomland forests, the Redshouldered Hawk is most common along the Potomac, Patuxent, and Pocomoke Rivers. It appears to avoid larger agricultural lands, upland forests, and marshes.
23
12.0
10
0.1
I'" 1.0
0.1
6.0
3.0
2.0
10
0.1
24 MARYLAND BIRDUFE
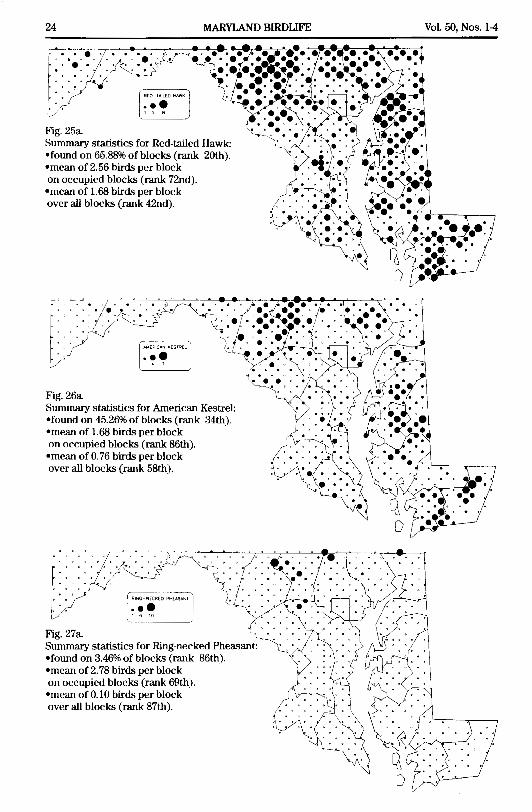
Fig. 25a. Summary statistics for Red-tailed Hawk: •found on 65.88% of blocks (rank 20th). •mean of 2.56 birds per block on occupied blocks (rank 72nd). •mean of 1.68 birds per block over all blocks (rank 42nd).
Fig. 26a Summary statistics for American Kestrel: •found on 45.26% of blocks (rank 34th). •mean of 1.68 birds per block on occupied blocks (rank 86th). •mean of 0. 76 birds per block over all blocks (rank 58th).
Vol. 50, Nos. 14
March- December, 1994 MARYLAND BIRDLIFE
RED · TAILED HM/K
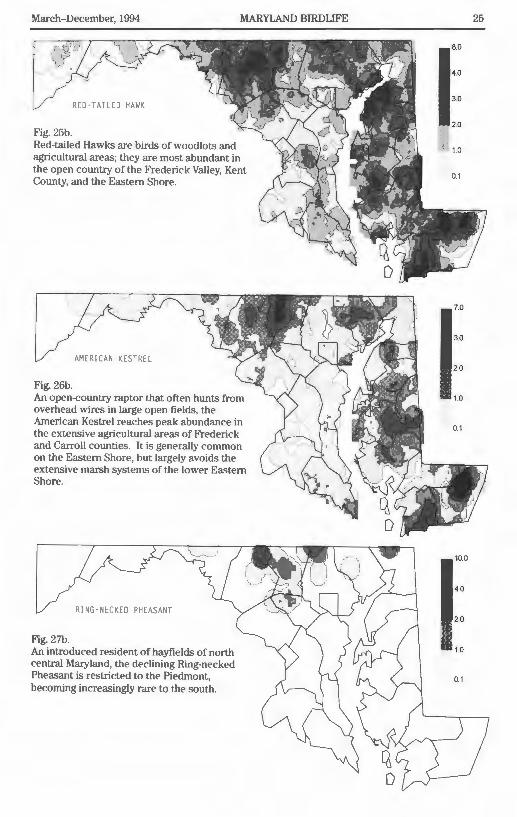
Fig. 25b. Red-tailed Hawks are birds of woodlots and agricultural areas; they are most abundant in the open country of the Frederick Valley, Kent County, and the Eastern Shore.
AMERICAN KESTREL
Fig. 26b. An open-country raptor that often hunts from overhead wires in large open fi elds, the An1erican Kestrel reaches peak abundance in the extensive agricultural areas of Frederick and Carroll counties. It is generally common on U1e Eastem Shorc, but largely avoids the extensive marsh systems of the lower Eastem Shore.
RJNG·NECKED PHEASANT
Fig. 27b. An introduced resident of hayfields of north central Maryland, the declining Ring-necked Pheasant is restricted to the Piedmont, becoming increasingly rare to the soutl1.
25
8.0
4.0
3.0
2.0
1.0
0 1
7.0
3.0
2.0
1.0
01
10.0
4 0
2.0
1 0
01
26 MARYLAND BIRDUFE
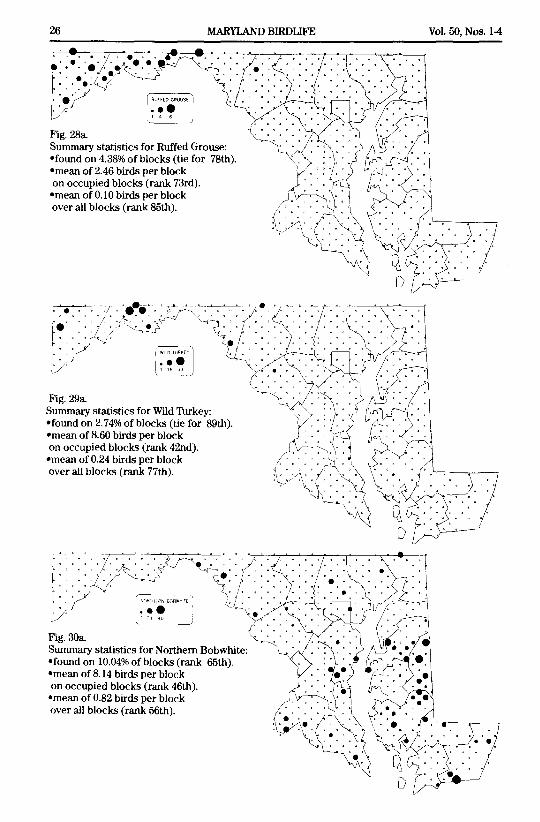
Fig. 28a. Summary statistics for Ruffed Grouse: •found on 4.38% of blocks (tie for 78th). •mean of 2.46 birds per block on occupied blocks (rank 73rd). •mean of 0.10 birds per block over all blocks (rank 85th).
Fig. 29a Summary statistics for Wild Turkey: •found on 2. 74% of blocks (tie for 89th). •mean of 8.60 birds per block on occupied blocks (rank 42nd). •mean of 0.24 birds per block over all blocks (rank 77th).
Vol. 50, Nos. 1-4
March-December, 1994
RUFFEO GROUSE
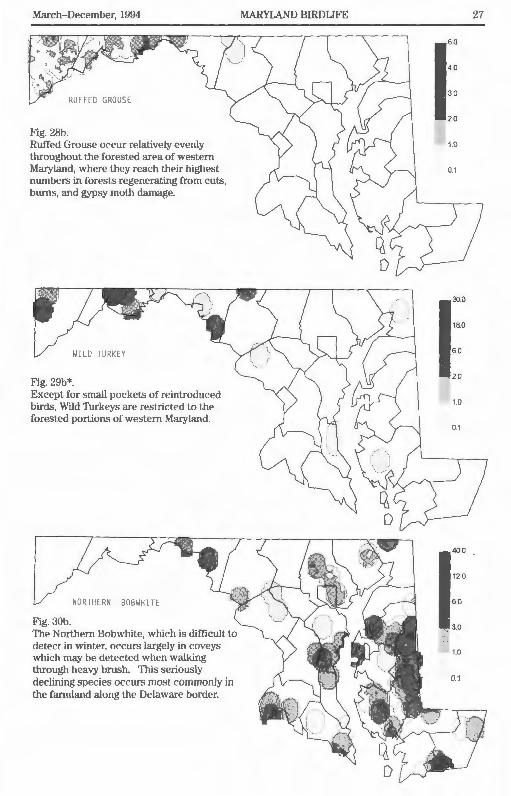
Fig. 28b. Ruffed Grouse occur relatively evenly throughout the forested area of westem Maryland, where they reach their highest numbers in forests regenerating from cuts , bums, and gypsy moth dan1age.
WILD TURKEY
Fig. 29b*. Except for small pockets of reintroduced birds, Wild Turkeys ru·e restricted to the forested portions of westem Maryland.
NORTHERN BOBWHITE
Fig. 30b. The orthem Bobwhite, which is difficult to detect in winter, occurs largely in coveys which may be detected when walking through heavy brush. This seriously declining species occurs most commonly in the fru111land along the Delawru·e border.
MARYLAND BIRDLJFE 27
60
40
30
2.0
10
01
300
18.0
60
2.0
10
01
400
120
60
30
1 0
01
28 MARYLAND BIRD LIFE
KILLD(ER J ••• 1 51 tOO
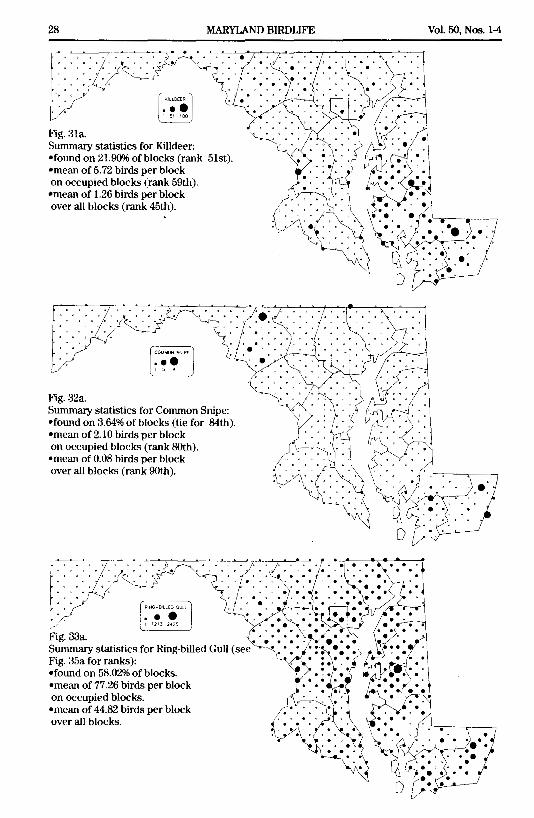
Fig. 3la. Summary statistics for Killdeer: •found on 21.90% of blocks (rank 51st). •mean of 5. 72 birds per block on occupied blocks (rank 59th). •mean of 1.26 birds per block over all blocks (rank 45th).
Fig. 32a. Summary statistics for Common Snipe: •found on 3.64% of blocks (tie for 84th). •mean of 2.10 birds per block on occupied blocks (rank 80th). •mean of 0.08 birds per block over all blocks (rank 90th).
Fig. 33a Summary statistics for Ring-billed Gull (see Fig. 35a for ranks): •found on 58.02% of blocks. •mean of 77.26 birds per block on occupied blocks. •mean of 44.82 birds per block over all blocks.
Vol. 50, Nos. 1-4
March-December, 1994 MARYLAND BIRDLIFE
KILLDEER
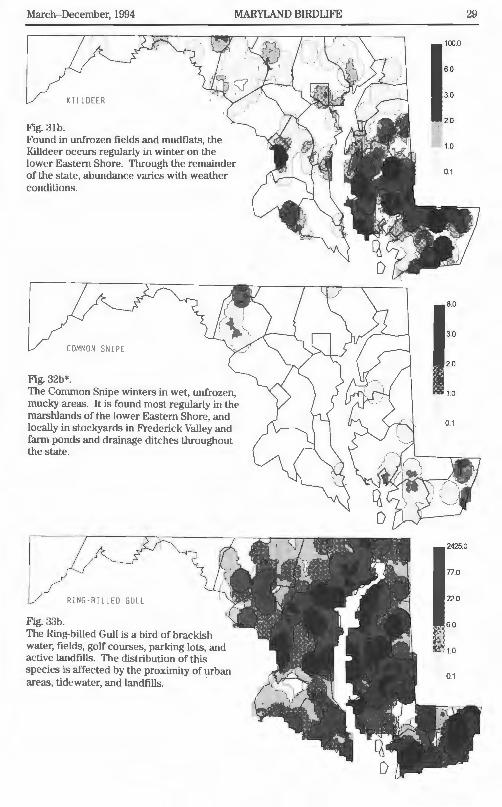
F'ig. 3 lb. Found in unfrozen fields and mudflats, the Killdeer occurs regularly 1n winter on U1e lower Eastern Shore. Through the remainder of the state, abundance varies with weather conditions.
COMMON SNIPE
F'ig. 32b*. The Common Snipe winters in wet, unfrozen, mucky areas. I t is found most regularly in the marshlands of the lower Eastern Shore, and locally in stockyards in Frederick Valley and fam1 ponds and drainage ditches throughout the state.
RING BILLED GULL
Fig. 33b. The Ring-billed Gull is a bird of brackish water, fi elds, golf courses, parking lots, and active landfills. The distribution of this species is affected by the proximity of urban areas, tidewater, and landfills. ·
29
1000
60
3.0
2.0
1.0
01
8.0
30
20
10
01
2425.0
77.0
22.0
60
1.0
0.1
30
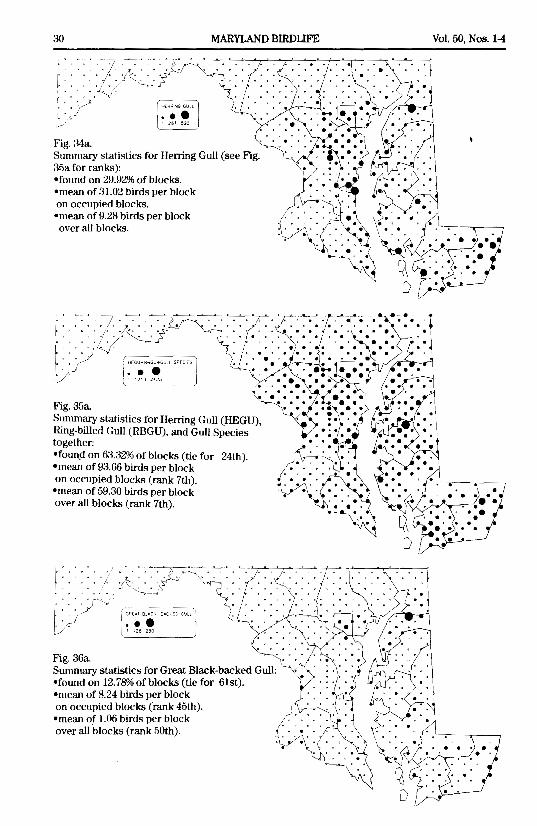
:3na for ranks): •found on 29.92% of blocks. •mean of :31.02 birds per block on occupied blocks. •mean of 9.28 birds per block over all blocks.
(~R[AT BL"'CK-8AC..;[D GULl
••• 1 \26 ]50
Fig. 36a.
MARYLAND BIRDUFE
Summary statistics for Great Black-backed Gull: •found on 12.7SOA> of blocks (tie for 6lst). •mean of 8.24 birds per block on occupied blocks (rank 45th). •mean of 1.06 birds per block over all blocks (rank 50th).
Vol. 50, Nos. 1-4
March-December, 1994 MARYLAND BIRD LIFE
HERRING GULL
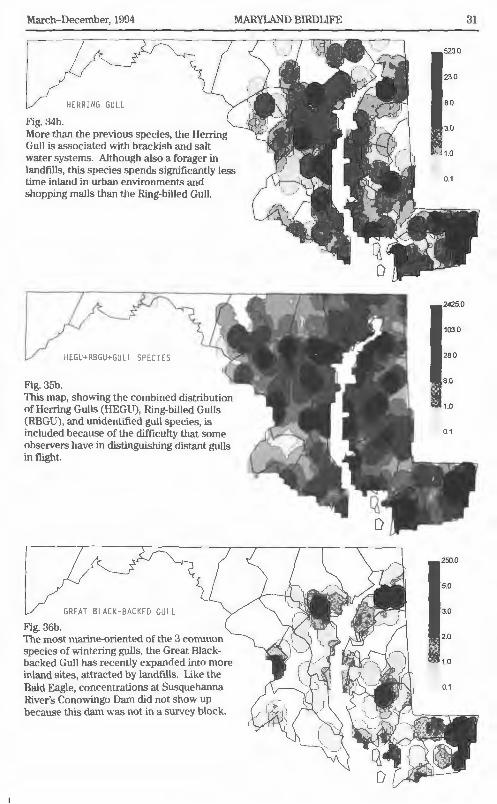
Fig. 34b. More than the previous species, the Herring Gull is associated with brackish and salt water systems. Although also a forager in landfills, this species spends significantly less time inland in urban environments and shopping malls than the Ring-billed Gull.
HEGU+RBGU+ ULL SPECIES
Fig. 35b. This map, showing the combined distribution of Herring Gulls (HEGU), Ring-billed Gulls (RBGU) , and unidentified gull species, is included because of the difficulty that some observers have in distinguishing distant gulls in flight.
GREAT BLACK·BACKED GULL
Fig. 36b. The most marine-oriented of the 3 common species of wintering gulls, the Great Blackbacked Gull has recently expanded into more inland sites, attracted by landfills. Like the Bald Eagle, concentrations at Susquehanna River's Conowingo Dam did not show up because this dam was not in a survey block.
31
5200
23.0
8.0
3.0
1.0
0.1
2425.0
103.0
28.0
8 .0
1.0
0.1
250.0
5.0
3.0
2.0
1.0
0.1
32 MARYLAND BIRDUFE
f
:. ;· '!}:: .; • ·~ • ·~;~ .s:· . . . . . . . . . . . • 0 • • •••
• • 0 '
• 0 0 0 . . . •· . . :J ROCKDOV(
/. . ..
I 416 830
Fig. 37a. Summary statistics for Rock Dove: •found on 55.3096 of blocks (rank 27th). •mean of 28.7 4 birds per block on occupied blocks (rank 16th). •mean of 15.88 birds per block over all blocks (rank 16th).
Fig. 38a. Summary statistics for Mourning Dove: •found on 80.84% of blocks (rank 15th). •mean of 27.84 birds per block on occupied blocks (rank 19th). •mean of 22.50 birds per block over all blocks (rank 12th).
. . :: .. < •
{ .· . . . .
-~'\-:
Vol. 50, Nos. 1-4
March-December, 1994
ROCK OC VE
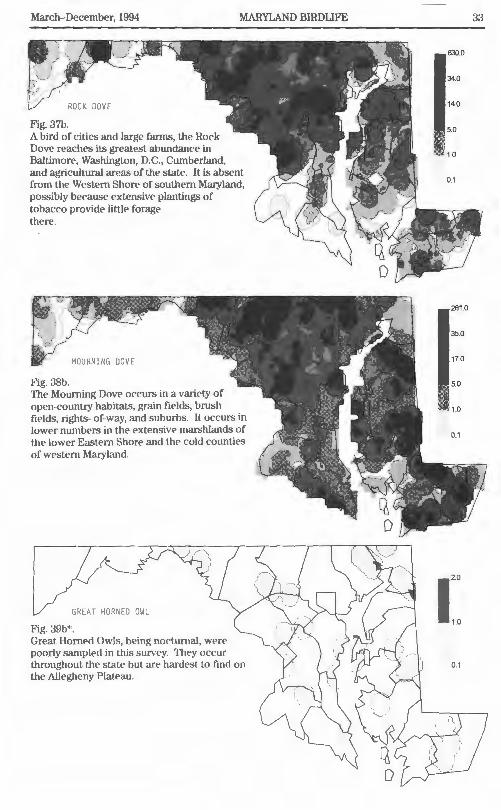
Fig. 37b. A bird of cities and large farms, the Rock Dove reaches its greatest abundance in Baltimore, Washington, D.C., Cumberland,
MARYLAND BIRD LIFE
and agricultural areas of the state. It is absent from the Western Shore of southern Maryland, possibly because extensive plantings of tobacco provide little forage there.
MOUR NING OlVE
Fig. :38b. The Mourning Dove• occurs in a variety of open-country habitats, grain fields, brush fi elds, 1ights- of-way, aud suburbs. It occurs in lower numbers in the extensive marshlands of the lower Eastern Shore <md the cold counties of western Maryland.
uREA' HORNED CWL
Fig. 39b* Great Horned Owls, being noct umal, wert' poorly samp lpd in this survey. They occur throughout the st.<lle but are hardest to find on the Al legheny PlaH·au.
33
8300
34.0
14.0
5.0
1.0
0.1
281 .0
35.0
17.0
50
10
0.1
I'" 1.0
0.1
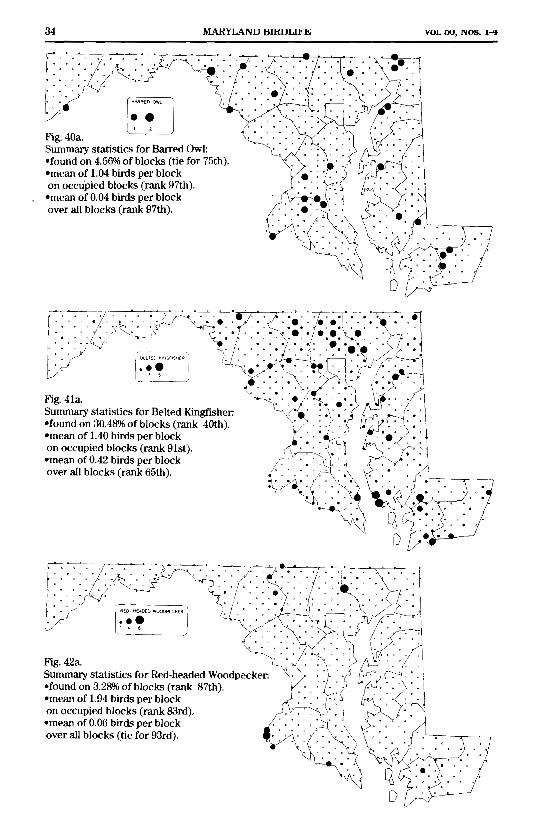
40 B edOwl: Fig. :ry statistics for :Ctie for 75th). Sumrn 56% of bloc •found on 4. 4 birds per block •mean of 1.0 ks (rank 97th). · · d bloc k on occupte 4 birds per bloc •mean of 0.0 k (rank 97th). over all bloc s
VOl. OU, NOS. 1-'1
March-December, 1994
BARRED OWL
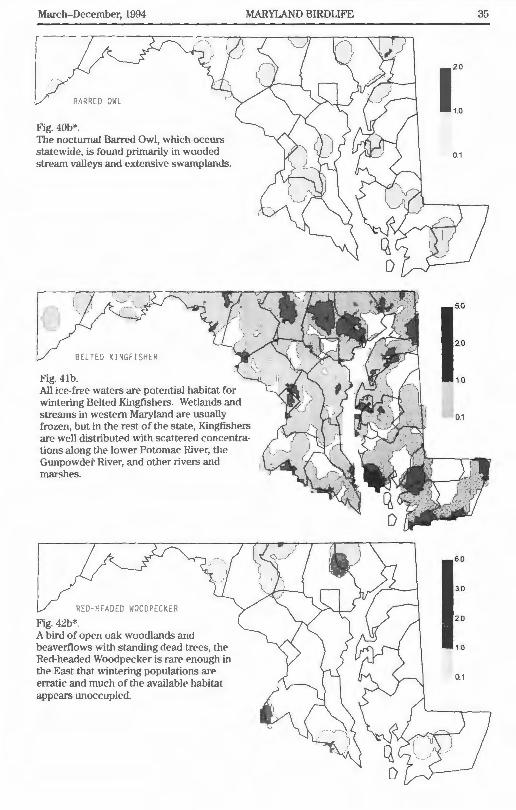
Fig. 40b* The nocturnal Barred Owl, which occurs statewide, is found primarily in wooded stream valleys and extensive swamplands.
0 BELTED KINGFISHER
Fig. 4lb.
MARYLAND BIRDLIFE
All ice-free waters are potential habitat for wintering Belted Kingfishers. Wetlands and strean1s in western Maryland are usually frozen, but in the rest of the state, Kingfishers are well distributed with scattered concentrations along the lower Potomac River, the Gunpowder River, and other rivers and marshes.
RED HEADED WOODPECKER
Fig. -1:2b* A bird of open oak woodlands and beaverilows with standing dead trees, the Red-headed Woodpecker is rare enough in the East that wintering populations are erratic and much of the available habitat appears unoccupied.
35
r 1.0
0.1
5.0
20
10
0.1
6.0
30
2.0
1.0
0.1
36 MARYLAND BIRDLIFE
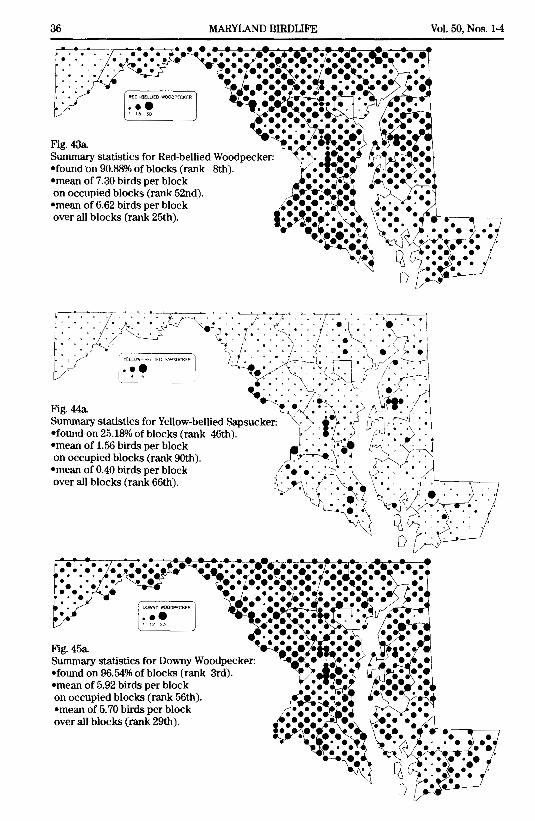
Fig. 43a. Summary statistics for Red-bellied Woodpecker: •found on 90.88% of blocks (rank 8th). •mean of 7.30 birds per block on occupied blocks (rank 52nd). •mean of 6.62 birds per block over all blocks (rank 25th).
Fig. 45a. Summary statistics for Downy Woodpecker: •found on 96.54% of blocks (rank 3rd). •mean of 5.92 birds per block on occupied blocks (rank 56th). •mean of 5. 70 birds per block over all blocks (rank 29th).
Vol. 50, Nos. 1-4

March- December, 1994 MARYLAND BIRDUFE
RED-BELLIED WOODPECKER
Fig. 43b. Red-bellied Woodpeckers are most abundant in extensive deciduous forests along rivers, especially along the Potomac, Patuxent, Susqueharma, Monocacy, and Gunpowder drainages, and the swamps along the Delaware border. Populations are less abundant in the higher elevations of western Maryland and in the marshes and pine woods of the lower Eastern Shore.
YELLC W BELLIED SAPSUCKER
Fig. 44b. Wintering Yellow-bellied Sapsuckers, although less common than the Red-bellies, have the same affinity for bottomland deciduous forests.
DOWNY WOODPECKER
Fig. 45b. A resident woodpecker with the broadest habitat niche, the Downy Woodpecker follow the same general pattem as most other woodpeckers. Abundance follows the distribution of forests, with smaller populations in westem Maryland and in the marshes and extensive open areas of the lower Eastern Shore.
37
30.0
10.0
7.0
4.0
1.0
0.1
6.0
2.0
1.0
0.1
23.0
8.0
6.0
4.0
1.0
0.1
38 MARYLAND BIRDilFE
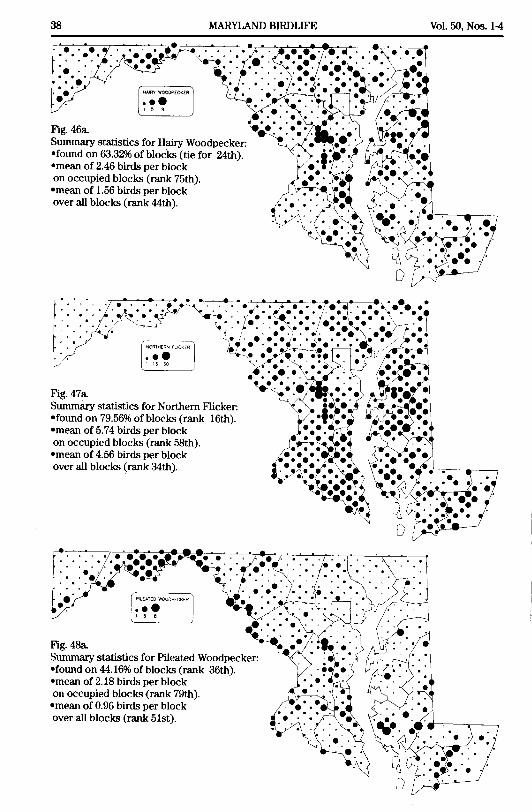
Fig. 46a. Summary statistics for Hairy Woodpecker: •found on 63.32%ofblocks (tie for 24th). •mean of 2.46 birds per block on occupied blocks (rank 75th). •mean of 1.56 birds per block over all blocks (rank 44th).
Fig. 47a. Summary statistics for Northern Flicker: •found on 79.56% of blocks (rank 16th). •mean of 5. 7 4 birds per block on occupied blocks (rank 58th). •mean of 4.56 birds per block over all blocks (rank 34th).
Fig. 48a. Summary statistics for Pileated Woodpecker: •found on 44.16% of blocks (rank 36th). •mean of 2.18 birds per block on occupied blocks{rank 79th). •mean of 0.96 birds per block over all blocks (rank 51st).
Vol. 50, Nos. 1-4
March-December, 1994
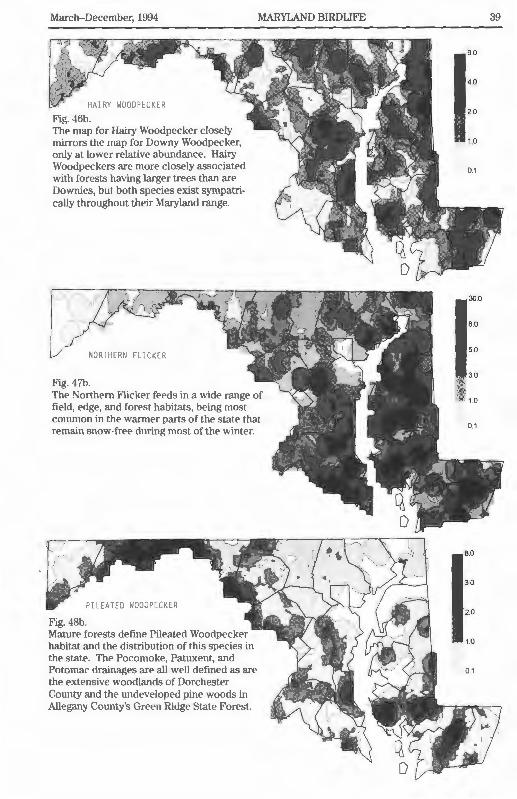
HAIRY WOODPECKER Fig. 46b. The map for Hairy Woodpecker closely mirrors the map for Downy Woodpecker, only at lower relative abundance. Hairy Woodpeckers are more closely associated with forests having larger trees than are Downies, but both species exist sympatrically throughout their Maryland range.
NORTHERN FLifKER
Fig . .J7b.
MARYLAND BIRDUFE
The Northern Flicker feeds in a wide range of field , edge, and forest habitats. being most common in the wru111er parts of the state that remain snow-free during most of the winter.
PILEATED WOODPECKER
Fig . .J8b. Mature forests define Pileatpd Woodpecker habitat ru1d the distribution of this species in the state. The Pocomoke, Patuxent., a11d Potomac drainages are all well defined as are the extensive woodlands of Dorchester County and the undeveloped pine woods in Allegany County's Green Ridge State Forest.
39
9.0
4.0
2.0
1.0
01
30.0
8.0
5.0
30
10
0.1
8.0
3.0
2.0
1.0
0.1
40 MARYLAND BIRD LIFE
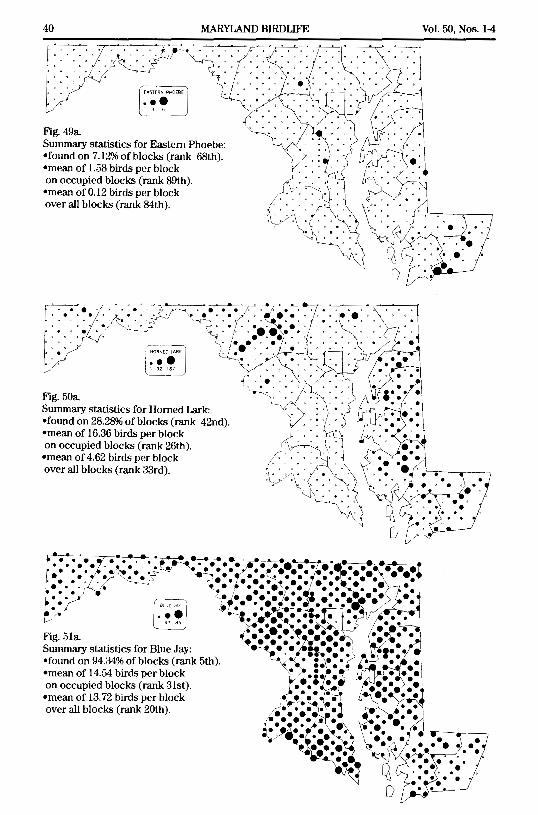
Fig. 49a. Summary statistics for Eastern Phoebe: •found on 7.12% of blocks (rank 68th). •mean of 1.58 birds per block on occupied blocks (rank 89th). •mean of 0.12 birds per block over all blocks (rank 84th).
Fig. 50a. Summary statistics for Homed Lark: •found on 28.28% of blocks (rank 42nd). •mean of 16.36 birds per block on occupied blocks (rank 26th). •mean of 4.62 birds per block over all blocks (rank 33rd).
Fig. 51a.
,_.--~ i 8L'J[JAY
1
.
I: It tt I ~
Summary statistics for Blue Jay: •found on 94.34% of blocks (rank 5th). •mean of 14.54 birds per block on occupied blocks (rank 31st). •mean of 13.72 birds per block over all blocks (rank 20th).
Vol. 50, Nos. 1-4