illegal immigration and agribusiness: the effect on the agriculture
TRANSCRIPT


illegal immigration and
Agribusiness:the effect on the agriculture industry of
converting to a legal workforce
A Report by Eric A. Ruark, Director of Research
research and content provided by aniqa moinuddin
april 2011

Executive Summary
Over the past several decades, the farming sector has grown increasingly dependent on a steady supply of workerswho have entered the country illegally, despite the unlimited availability of visas for foreign agricultural guestworkers. is has created a situation where presently half of all crop farm workers are unauthorized and haveannual incomes that are $5,600 less than that of authorized workers working in the same sector.
e agribusiness sector has consistently opposed an immigration policy that would result in a legal workforce.eir position is that current hiring practices are crucial for the survival of the industry, as Americans are notwilling to do agricultural work and increasing wages to attract native-born workers would result in significantlyhigher food prices or a decline in American food production. Agribusiness lobbyist Sharon Hughes says, “Weare either going to have our food produced by foreign workers here in the United States, or the farming processwill move to foreign countries.”
Since 5.7 percent of U.S. farms account for 75 percent of total farm sales, it is clear that the food supply chainof the country is almost entirely dependent on large-scale agribusinesses. Hence, their economic interests are, toan extent, linked to national interests and cannot be trivialized when considering immigration issues. But iswhat they are saying true?
Between 1997 and 2007, the agriculture industry enjoyed a nearly 80 percent average annual increase in corporateprofits, which is higher than all other major industries surveyed. Over the same period, the average real wage ofa farm worker remained stagnant and was only half that of a non-farm worker of comparable skill level. In sucha situation, it would be logical to question whether increasing farm wages to attract legal workers would reallyhave a debilitating effect on the industry.
Prior studies have focused on the impact on food prices as a result of passing on the full increase of labor coststo consumers. In this study, we explore the impact on profits of commercial farms if all the increased labor costsare absorbed by the producers and the consequent effect on overall farm business. Both these scenarios must beassessed in order to obtain a conclusion about the industry’s ability to absorb higher labor costs.
is study reveals the following findings:
• Authorized workers are observed to be willing to accept wages that are 18 percent higher than unauthorizedworkers in the fruits, nuts, and vegetable sector and 22 percent higher in field crops and grains.
• American citizen and legal resident farm workers work significantly longer hours compared with those whoare unauthorized.

• If unauthorized workers were replaced by authorized workers at the higher average wage rate authorizedworkers currently earn, farms in the fruits, nuts, and vegetable sector would experience a total labor cost in-crease of 10 percent, and the increase for the field crops and grains sector would be 6 percent.
• Major crops like corn, soybean, and other cash grains would experience, on average, a 1–2 percent decreasein net farm income as a result of a 6–10 percent average wage increase.
• e fruits, nuts, and vegetables sector would be impacted the most as the average net farm income woulddecrease by 12 percent, yet, the average commercial farm in this sector would still have earned an averagenet farm income higher than that of any other average commodity farm studied (without passing on anycosts to customers).
• All commodity farms including those that are impacted heavily, namely “other field crops” and “fruits, nuts,and vegetables,” would still have performed profitably given higher labor costs, according to their profitmargin ratio from 1996–2008.*
• Small commercial farms, which are likely to have lower profit margins than the “typical commercial” farmsstudied in this report, do not generally produce fruits, nuts, and vegetables and are less likely to employunauthorized workers and would be less affected by the labor cost increase associated with these crops.
• Rural residence farms would experience a lesser decline in net farm income (NFI) compared to commercialfarms of the same category for all commodities studied due to their low labor requirements.
2 federation for american immigration reform
*“Other field crops” is a category used by Agriculture Resource Management Survey that combines data for all field crops other than
the major categories of corn; soybeans; fruits, nuts and vegetables; and cash grains.

Introduction
e crop farm sector is highly labor-intensive and contains the highest concentration of illegal workers comparedto other occupations within the agriculture industry.1 is sector is thus most relevant to the issue of assessingthe costs of immigration reform as it is likely to be most affected by implementation and enforcement of immi-gration laws which require the retrenchment of illegal workers. Large agribusinesses that directly own farms orcontract them out to independent operators or simply buy the produce for further processing contend that alow-wage, foreign-born workforce is vital to the survival of farming in the United States. ey further assert thatthe current methods of bringing in foreign workers legally is cost-prohibitive, and so a workforce of illegal aliensis presently the only resort.
e argument of agribusiness lobbyists that increased labor costs would push food prices to unacceptably highlevels is completely misleading because it is based on greatly exaggerated estimates of the extent of price increases.2
What the agribusiness industry neglects to acknowledge is that they could choose to absorb the entire incrementalcost (i.e. without raising food prices at all) of a legal workforce earning higher wages and still realize considerableprofits. is study examines the projected cost structure and profitability of commercial farms under a scenariowhere they absorb the full cost of a 20 percent wage increase of the workers who are at the bottom rung of thewage ladder (a category which is, presently, almost entirely comprised of unauthorized workers).*
• Unauthorized Labor in Agriculture examines the role of illegal migrant labor in agriculture and the claimsof a possible nationwide shortage of native labor in this industry, given existing wage levels. pp. 4–6
• U.S. Farm Economy distinguishes between commercial farms and small family farms, highlights the linesthat separate them and explains our reasons for focusing on commercial farms. pp. 6–9
• Assessing the Impact of Higher Labor Costs on Farms illustrates the effect of higher wages on commercialfarms if food prices are not raised. e higher labor costs of a legal work force are imputed to calculate re-duced farm incomes and operating profit margin. pp. 9–16
• Scope and Alternatives explores alternatives that are available to the industry for dealing with the shift toa legal workforce. pp. 16–18
• Conclusion highlights issues in the debate regarding unauthorized labor in agriculture in the light of thefindings from the study. pp. 18-19
3illegal immigration and agribusiness: the effect on the agriculture industry of converting to a legal workforce
*This report uses the terms illegal, unauthorized, and undocumented interchangeably. The National Agricultural Workers Survey
identifies as “Unauthorized” all farm workers who are unable to provide documents proving work authorization in the U.S.“Authorized” worker includes American citizens, green card holders and workers with other legal status not including H2-A visa guestworker authorization.

Unauthorized Labor in Agriculture
Structure and Supply of the Labor ForceUnauthorized migrant workers have consistently accounted for roughly half of all jobs in farming since 2000and their wages have been lower than that of the legal workforce for all tasks surveyed and across all farm types.3
erefore, the replacement of illegal labor with higher paid legal workers will provide a worst-case scenario forthe entire agriculture sector. A report by the Congressional Research Service found that there is no evidence ofa strained labor market for agricultural workers nationwide.4 During 1994–2008, the unemployment rate forfarm workers was consistently higher than the unemployment rate for all other occupations.5 Furthermore, overthe same time period, the average hourly wages of field workers was half that of nonfarm workers of comparableskill levels.6 e persistent trend of low wages and the high unemployment rate, relative to other sectors of theeconomy, suggests that the supply of farm workers has continued to exceed demand, with the possible exceptionof area or temporal spot shortages.
Availability of Native WorkersA study by the Center for Immigration Studies (CIS) shows that high levels of unemployment of native workersexist in industries with the highest concentration of migrant workers (tAblE A).7 In 2007, the farming, fishing

and forestry8 occupations had both the highest proportion of migrant workers (36 percent of the workforce)and at the same time the highest unemployment rate (10 percent) for native workers which was more thandouble the national average at the time of 4.6 percent.9 It was closely followed by Meat/Poultry/Fish processingoperations where 33.9 percent of workers employed were immigrants while there was a 7.9 percent native un-employment rate. ere is a strong correlation (0.87) between immigrant composition of labor force and nativeunemployment rate. While a causal relationship cannot be established by this simple correlation, we can assertthat, on a nationwide level, a reduced supply of migrant workers is not likely to cause a labor shortage, as thereare sufficient native workers to fill the void.
Future ProjectionsWhile the statistics cited in the previous sections are snapshots of the recent past, it is important to refer tocurrent projections of the labor market as they tend to reflect overall trends by incorporating the most recentand relevant factors. In 2009, there was a dramatic reduction in employment and the USDA reported that “theconsensus of the Blue Chip Economic Indicators (a monthly survey of private-sector forecasters) has U.S. un-employment rates remaining above 6 percent until 2015.”10 erefore, given that unemployment for farm work-ers has consistently been higher than that of other major occupations (tAblE A), it is safe to assume that thefarm unemployment rate will remain above 6 percent in the foreseeable future. At the time this report was pre-pared (January 2011) the unemployment rate for those in agricultural occupations was 16 percent.
5illegal immigration and agribusiness: the effect on the agriculture industry of converting to a legal workforce
Table A
Native and Immigrant Unemployment Rates — 2007 (THOUSANdS)
Native Unemployment
Rate
Occupation Comprised of
Immigrants
Number ofNatives
Employed
Number ofNatives
Unemployed
Farming Fishing and Forestry 10.9% 36.3% 580 71
Building Cleaning and Maintenance 10.8% 29.6% 3,276 396
Construction 10.7% 22.5% 6,383 764
Food Service and Preparation 7.9% 17.8% 6,067 518
Transportation and Mowing 7.4% 21.6% 7,058 566
Production 6.1% 33.9% 7,394 484
Sales 4.6% 12.0% 14,661 699
Personal Care and Services 4.3% 18.6% 3,811 172
Source: Center for Immigration Studies, Steven A. Camarota, Immigrants in the United States, 2007

Labor Supply Responsiveness to WagesWhile there is no evidence of a nationwide labor shortage, businesses intending to replace their illegal immigrantwork force may have to offer wages that are at least equal to what legal workers receive. is is likely to augmentthe pool of available native workers and prevent the labor crisis predicted by industry spokesmen. In a report toCongress, Levine concludes that an increase in the supply of foreign labor depresses agricultural wages.11 Shefurther cites a study by Wise which found that a 1 percent increase in wages for melon farming resulted in a 2.7
percent increase in the domestic supply of labor,while the same increase in wages in strawberryproduction caused a 3.4 percent increase in thedomestic labor supply.12 e plentiful supplyof illegal workers can, to a great extent, beblamed for the stagnation of farm wages overthe past decades and ending this supply is likelyto stimulate wages and consequently, as perstandard economic theory, lead to an increasedsupply of domestic labor in agriculture. RaúlHinojosa-Ojeda of the Center for AmericanProgress estimated that unskilled workers wouldmake about $400 more per year if one-third ofillegal immigrant labor were replaced by legalworkers.13 According to 2006 figures, the differ-ence in the mean annual incomes of authorizedand unauthorized farm workers was $5,617(figuRE 1).14
U.S. Farm Economy
Commercial and Rural Residence Farmse farming sector consists of farms that are extremely diverse in nature (in size, profitability and operationalpriorities) making it impossible to present a single representative picture. is study focuses on the impact ofhigher wage costs on large-scale commercial farms as they produce 84 percent of the total agricultural outputand operate for profit.15 Non-commercial farms cannot be appraised by the same yardstick since profit maxi-mization is often not their primary objective and so business decisions, particularly whether or not to remain inthe industry are, to a great extent, determined by factors independent of the farm economy.16 ey overwhelm-ingly consist of residential-lifestyle and retirement farms (70%) where operators report a non-farm occupationas their major source of income and consider farming as a lifestyle choice. e operating profit of these farms
6 federation for american immigration reform
Figure 1
Mean Income of Farmworkers by Legal Status—2006
Source: National Agricultural Workers Survey

has been consistently negative and decreasing but nonetheless the number of very small farms has increased overtime.17 is supports the conclusion that decisions regarding these farm operations do not rely significantly onconditions prevailing in the farm sector. is study does calculate the extent of increased cost for non-commercialfarms but does not assess the impact on them in terms of operational decisions.
Profitse agriculture industry has reported an80 percent average annual increase in cor-porate profits before taxes between 1998and 2008, thus making it the most prof-itable sector in the U.S. economy duringthis period (figuRE 2).18 We can there-fore expect that the component farm sec-tors have also registered robust growth inprofits and will thus be able to absorb theadditional costs of replacing their unau-thorized workforce.
FAIR analysis of U.S. Bureau of Economic Analysis, Survey of Current BusinessAugust 2008
Figure 2
Average Annual Increase in Corporate Earnings1998–2008

Family Farms and Small Farmse term “family farm” reflects the cherished ideals of the traditional family life of America’s pioneer past. Dueto its appeal, this concept is used as an astute marketing strategy by many agribusiness firms which have no re-semblance whatsoever to traditional farms. Given that family farms have little or no commercial returns fromfarming operations, small family farms have neither the money nor the motivation to engage in commercial ad-vertising and are not behind the heartwarming advertisements put forward in their name. According to the U.S.Department of Agriculture, “e definition of a family farm, since 2005, based on the Agricultural ResourceManagement Survey is one in which the majority of the business is owned by the operator and individuals relatedto the operator by blood, marriage, or adoption, including relatives that do not live in the operator household.”is definition is broad enough to include any large scale farming operation whose ownership structure is iden-tical to that of a large private limited company where the majority of the shareholders are family members. us,there is nothing to prevent a large-scale agribusiness unit from being registered as a family farm and marketingproducts using the “face of a family farm.” As a result, public perception has tended to associate any hardshiprelated to the farm industry with hardships for the families on small farms.19
While there are operators of family farms who are struggling to make ends meet, and to continue farming itwould be incorrect to assume that farm households that engage in unprofitable farming operations are strugglingto make ends meet. e median net worth of farm households regardless of farm size and incomes is higherthan the U.S. median household net worth. is is because many operators of small farming operations relyheavily on off-farm income.20
8 federation for american immigration reform
“The folks where it’s a family business, in my
limited experience, won’t knowingly hire
‘illegals’ ... I know my dad’s hiring practices
are morality based, but a possible reason
that smaller ranches and farms would avoid
‘illegals’ is because the fines are a much
bigger deal.”
—farm girl from Okanogan County, Washington

Small Farms and Illegal WorkersFarms (generating annual sales of $100,000 or less) are not likely to be employing illegal aliens. According tothe Agricultural Census, these farms hire, on average, two workers over the entire year. Many do not hire anylabor at all because at the very small scale on which they operate it is realistically possible for family members todirectly provide the labor needed for the day-to-day running of the farm. Another reason is that they focus onoperations that do not require full-time hired labor, like raising cattle and poultry and growing hay.21 Over thepast two decades, small farms have consistently incurred losses and had to depend on non-farm incomes andgovernment subsidies to sustain their operations. Profit is clearly not the motive for these farms and often noteven a possibility in an industry that is dominated by large, powerful corporations. In fact, some believe that thecommercial farm’s practice of employing illegal immigrants “has robbed such [small] farms of their one compet-itive advantage.”22
Assessing the Impact of Higher Labor Costs on Farms
In this section, a study is designed using the data from the Agriculture Resource Management Survey (ARMS)and the National Agricultural Worker Survey (NAWS) to examine the impact of higher labor costs on profitabilityof commercial farms engaged in crop farming. e degree of impact of higher labor costs on net farm incomes(NFI) for both commercial and rural-residence farms is examined. We develop a Replacement Cost Model usingthe difference in wages and annual working hours of authorized and unauthorized workers. is model estimatesthe labor cost rise under a scenario where all illegal workers are replaced by legal workers employed at the higherwage earned by legal workers.
Methodologyfarms by production specialty and farm typology — We examined farms producing (i)corn; (ii) soybeans; (iii) fruits, nuts, and vegetables; (iv) general cash grains; and (v) other field crops in theFarm Business and Household Survey, a component of ARMS. Within each category, we have examinedboth rural residence farms and commercial farms. e time period considered is from 1996-2008 and allconclusions are based on the farm business performance over this period.
data collection — e first part of the study consisted of extracting data (from NAWS) regardingthe comparative numerical strengths, working hours and wage rates of both categories of farm workers —authorized and unauthorized. e results reveal that there are pronounced differences in all these areas (Ap-pendix 1) and that these differences vary according to crop type. ese values were then used to develop theReplacement Cost Model (Appendix II). e second part of the study utilized data of weighted averages ofhired labor expense, interest, gross farm income, and net farm income to calculate first the higher labor costsfor (a) the Replacement Cost Model; (b) 20 percent general wage/labor cost increase; (c) 30 percent generalwage/labor cost increase; and then the respective percentage decline in NFI for all farms (Appendix IV out-
9illegal immigration and agribusiness: the effect on the agriculture industry of converting to a legal workforce

lines a sample calculation). Commercial farms have been subjected to an additional treatment whereby theiroperating profit margins are calculated to allow us to assess their business viability.
selecting time period — e agriculture sector is subject to yearly fluctuations in price and similarlyfarm performances vary drastically from year to year. us, the year at which the increase in cost is computedis crucial. In order to obtain a holistic picture, we have considered every year between 1996 and 2008 inorder to subject the treatment to a range of business climates. e data for the best and worst years alongwith the average trend is displayed.
selecting indicators —e percentage decline in net cash farm income from what is originally ob-served is calculated in order to isolate the effect due to the rise in labor cost. is is not likely to vary withthe external business climate between each year, but can be expected to vary across farm type. e operatingprofit margin is calculated for commercial farms based on the new lower net cash income in order to makeit possible to evaluate financial performance and profitability.23
National Agricultural Worker Survey Results24
Data extracted for this report from the survey pertains to the (a) proportion of workforce that consists of au-thorized and unauthorized workers (b) mean hourly wage rates and (c) mean annual working hours for “fruits,nuts, and vegetables” and “field crop and grains” for 1989-2006. Summarized below are major findings and therelevant data for the second part of the study. Appendix I displays in detail the long term trend for each of thesefactors and the most recent (2006) values which are likely to be most representative of the present scenario giventhe consistent trend in these relationships.
Major Findings(a)Unauthorized workers have consistently accounted for half of all hired farm workers. However, this proportionvaries between types of commodity farms. For the period surveyed, on average 55 percent of all workers in fruits,
nuts, and vegetables farming were illegal and the ratio(legal/illegal) has displayed a gradual decreasing
trend over the years. Field crop worker com-position displays a contrasting pattern
where the average proportion of unau-thorized workers has declined sharplyfrom 60 percent in 1996 to around 20percent in 2006.
(b)For all commodity farms and skilllevels surveyed, authorized workers con-
sistently earned significantly higher wages
10 federation for american immigration reform
Source: National Agricultural Workers Survey
Figure 3
Legal Status of Farmworkers—2006
51%
27%
21%
1%

than unauthorized workers and, on average, this dif-ference has increased. In 2006, the mean hourlywage rate of legal workers in field crop farming was22 percent higher than that of illegal workers. edifference was slightly less (18 percent) in fruits,nuts, and vegetable farming (figuRE 4).26
(c) Total hours of farm work reported by crop farmlaborers have seen a gradual increase. e averageauthorized farm worker worked 700 hours more in2006 than he did in 1990, and authorized workershave consistently worked more hours annually thantheir unauthorized counterparts, although this ratiohas declined over the years (figuRE 5).
Source: National Agricultural Workers Survey
Figure 4
Mean Hourly Wage Rate by Legal Status—2006
American Citizens Work Longer Hours on FarmsThe median work hours for American workers engaged in crop farming was 1,963 hours in 2006 while
it was 1,892 hours for undocumented workers. This trend is quite consistent over the entire 1996–2006
period during which median work hours for American workers increased by 825 hours. On fruit, nut, and
vegetable farms, the difference in working hours of native and unauthorized workers is even more
pronounced as illustrated in Figure 5.25
FAIR Analysis of National Agricultural Workers Survey data, 1996–2006

12
Labor Cost Estimatesreplacement cost model — Appendix II outlines in detail how the ratios (authorized workers/unau-thorized workers) of the number of workers, hours worked, and wages are used to estimate the increase inthe labor cost. e model assumes a scenario where unauthorized workers in different farm classificationsare replaced by legal workers. e newly employed workers are then paid the mean wage rate of the legalworkers which is 22 percent higher than the wages that were hitherto being paid to the unauthorized workers.e new workers are assumed to be working the same number of hours as the illegal workers they had re-placed. e rationale behind the underlying assumptions of this model is that since the existing legal laborforce is content to work at the higher (legal) wage rate, this rate should be enough to attract legal workersfrom the existing unemployed pool. Since production is assumed to be unchanged, the labor hours require-ments remain the same. e labor cost estimate derived using this method will be referred to as the Replace-ment Cost Estimate (RCE).
Due to the different categories used by the NAWS and ARMS, data has been consolidated and the summaryis provided below. e most recent data (2006) is likely to be most representative of the present scenariogiven the consistent trend in these relationships rather than a long term average.
general labor cost increase — While the main focus of the study was on the impact of theRCE, we have also estimated the reduced profit margins under a 20 percent and a 30 percent general increasein wages for all categories of workers, regardless of legal status. It is observed that the 20 percent increase re-sults in doubling (for fruits, nuts, and vegetables category) and tripling (for field crops and grains category)the incremental labor cost under the RCM while the corresponding increases would be two-fold and five-
Source: National Agricultural Workers Survey
Figure 5
Annual Farm Work Hours of Authorized and Unauthorized Workers
federation for american immigration reform

fold for the 30 percent increase. Hence, these general wage increases provide us with a “stress test” to ascertainhow the farm sector will bear up when subjected to labor increases which are several times higher than theRCE.
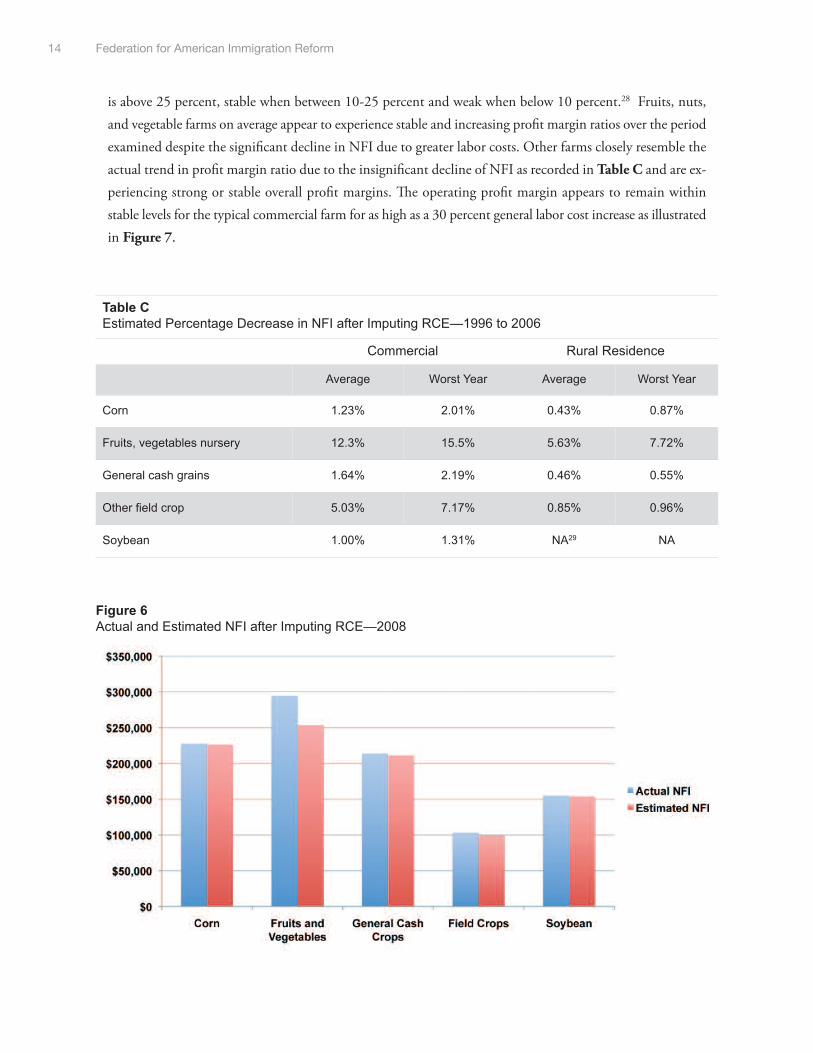
Expected Net Farm Incomes and Profit Marginsdecrease in net farm incomes (nfi) — e decrease in NFI provides us with an indicator thatisolates the impact on various farms due solely to the applicable increase in labor cost across different farmsfor each year studied. Imputing the relevant labor cost increase allows us to calculate the expected NFI forrural residence farms and commercial farms within the ARMS commodity categories. Table C summarizesthese results from 1996-2006. It is observed that the fruits, nuts, and vegetables farms will be most heavilyimpacted. Over the period examined, there is an average decrease in NFI of 12 percent and under the busi-ness climate of 2008, this could be quantified at $50,000 (figuRE 6). is decline still leaves this categorywith the highest average income out of all the commodities studied. All field crop categories experience in-significant decline in net farm incomes. Within field crops, corn is impacted the least while the category ofother field crops is impacted the most. Rural residence farms experience a smaller decline compared to com-mercial farms across all commodity farms and over all the years studied. is is due to the lower use of hiredlabor in these farms compared to commercial farms.
operating profit margins of commercial farms — Profit margin ratios can be used as anindicator of business performance as it will vary due to this rise in labor cost and under the different marketconditions over the period examined. Operating profit margin is a measure of the profit to operations, afterdeducting for unpaid operator labor and management fees and adding interest, as a proportion of gross farmincome (GFI).27 Values after the rise in costs are graphed (figuRE 6) over the period examined for all com-mercial farms for the five commodities. In general, farm performance is considered strong when this ratio
13illegal immigration and agribusiness: the effect on the agriculture industry of converting to a legal workforce
Table B
Rise in Labor Cost Under Replacement Cost Model—2006
NAWS Category ARMS CategoryRatio
Illegal / LegalWorkers
Ratio ofHours
Worked
Ratio ofWage Rate
Increase inLabor Costs
(RCE)
Increase inIncome ofReplaced Workers
Fruits, Nuts andVegetables
fruits, nuts and vegetables
0.567 1.251 1.182 9.91% 18%
Field Cropscorn, general cash
crops, soybean,other field crops
1.778 1.219 1.219 6.01% 22%
14 federation for american immigration reform
is above 25 percent, stable when between 10-25 percent and weak when below 10 percent.28 Fruits, nuts,and vegetable farms on average appear to experience stable and increasing profit margin ratios over the periodexamined despite the significant decline in NFI due to greater labor costs. Other farms closely resemble theactual trend in profit margin ratio due to the insignificant decline of NFI as recorded in Table C and are ex-periencing strong or stable overall profit margins. e operating profit margin appears to remain withinstable levels for the typical commercial farm for as high as a 30 percent general labor cost increase as illustratedin Figure 7.
Table C
Estimated Percentage decrease in NFI after Imputing RCE—1996 to 2006
Commercial Rural Residence
Average Worst Year Average Worst Year
Corn 1.23% 2.01% 0.43% 0.87%
Fruits, vegetables nursery 12.3% 15.5% 5.63% 7.72%
General cash grains 1.64% 2.19% 0.46% 0.55%
Other field crop 5.03% 7.17% 0.85% 0.96%
Soybean 1.00% 1.31% NA29 NA
Figure 6
Actual and Estimated NFI after Imputing RCE—2008

AnalysisTo assess farm financial situations, the Economic Research Service of the USDA examines both profitability andsolvency of farms in a sector. Depending on their net income and debt-to-asset ratio, farms are categorized as fa-vorable, marginal income, marginal solvency, and vulnerable.30 e increase in expenses examined in this study
Figure 7
Estimated Operating Profit Margin of Commercial Farms (after increase in labor cost using RCE)
Table D
Average Profit Margins for Commercial Farms—1996 to 2008
CornFruits, nuts and
vegetablesGeneral cash
grainsOther field
cropsSoybeans
Actual/Observed(no cost increase)
21.2% 18.3% 19.4% 16.0% 20.0%
Replacement Cost Model(see Table B)
20.9% 15.7% 19.0% 15.0% 19.6%
20% Labor Cost Increase 20.4% 12.9% 18.4% 13.2% 19.0%
30% Labor Cost Increase 20.0% 10.2% 17.9% 11.8% 18.6%
15illegal immigration and agribusiness: the effect on the agriculture industry of converting to a legal workforce

16 federation for american immigration reform
will affect net income and profitability. However, it is clear that none of the groups face an increase in cost suffi-cient to cause them to earn negative incomes. So the change is unlikely to relegate any of the groups to the “vul-nerable” category. In 2008, 3.6 percent of farms were considered “vulnerable” and these overwhelmingly consistedof rural residence farms.31 As Table C shows, rural residence farms are least impacted by this rise in labor cost.Harris observes that a 7 percent decrease in NFI from the previous year did not significantly alter the numberof “vulnerable” farms, highlighting that asset holdings and extent of debt also play an important role in deter-mining the financial position of a farm.32 is makes it improbable that the decline in NFI noted for rural res-idence farms will push them down to the “vulnerable” category. e operating profit margin ratio decreasessharply for smaller commercial farms and, from the results obtained, it is possible that small commercial farmswhich engage in fruit, nuts, and vegetable farming could become vulnerable. However a USDA study of com-mercial farms found that there is a distinct difference in the product mix of small and large commercial farms.Small commercial farms tend not to produce fruits, nuts, and vegetables which are defined as high value cropsdue to the high degree of full time labor requirements.33 To be exact, small commercial farms produce less that1 percent of the total output of these crops, making it unlikely that changes specific to these crops will have anysignificant impact on them.
Scope and Alternatives
LimitationsFirstly, the labor cost increases calculated do not take into account non-monetary benefits to workers. However,since farm workers generally do not receive significant non-monetary benefits, this should not alter our modelto a great extent. Secondly, possible transition costs like administrative fees of hiring new workers and costs ofpossible loss of productivity resulting from training interruptions have not been included. However, this changewill not occur overnight and will, realistically, be implemented in phases. Also, the skill level necessary for thistype of agricultural work does not require significant training. us, possible transition costs are not likely to besignificant. If these costs are incurred, they can be incorporated under the alternate labor cost estimates outlinedin Table D to obtain the estimated impact on profit margins. Compliance with existing laws cannot be estimatedas an operating cost unless one assumes that choosing to break the law is a legitimate way to reduce labor costs.
Higher PricesAccording to general economic theory, a profit maximizing firm will react to a cost increase by passing it on, atleast partially, to their customers. While this study has estimated the effect on profits if farms absorbed the fullburden of the wage increase, it would be misleading to assert that this would actually be the case. e assumptionhere is that commercial farms could absorb substantial labor cost increases, not that they would. A study con-ducted by Philip Martin, Professor of Agriculture in University of California-Davis, examined the impact of a40 percent increase in wages if all costs were passed on as higher prices.34 Farm workers presently receive only 5to 6 cents of every dollar spent on agricultural produce and after the 40 percent wage increase, this will increase

17illegal immigration and agribusiness: the effect on the agriculture industry of converting to a legal workforce
to 7 to 9 cents. As a result, households would experience an annual increase of $9 (2005 dollars) in their expen-diture on food. A realistic assessment of the impact of any increase in wages must assume that farms will pass ona part of this cost as higher prices and absorb the remainder as reduced profits. e relative share of the burdenof higher cost that is borne by consumers and producers is determined by the price elasticity of demand of thecommodity. It has been amply demonstrated that the impact of higher labor costs on net farm incomes is quitesmall and, when shared between consumer and producer, becomes almost negligible. However, for a farm workerthis change could result in a substantial escalation of annual wages (from $14,000 to $19,600, 2006 dollars).
H-2A VisasIn a market economy, most producers will not willingly offer higher wages if cheap labor is available. As illustratedby our findings from the NAWS, the number of illegal workers has been increasing over the years. Stagnantwages in the agricultural sector over a long period of time have made it difficult to assess whether there is in facta shortage of legal workers. e H-2A program provides for issuance of temporary visas to an unlimited numberof foreign workers for legal employment in the agriculture sector on a temporary basis. Workers hired underthis program must be paid wages equal to that of native workers, and have access to affordable housing, food,and transport. ese requirements make the H-2A visa program a less attractive prospect for potential employerswho have access to an extensive pool of illegal workers willing to work for low wages. is fact, perhaps, explainsthe low utilization of the H-2A program. In 2007, only 5 percent of farm workers had a H2-A visa whereasaround 50 percent were undocumented. In order to design a viable guest worker program, it is important toidentify and locate any actual labor shortage and the prevailing wage by making sure that only authorized workersparticipate in the labor market. e underground supply of labor distorts both these market signals making itimpossible to judge the feasibility of the guest worker program under the existing circumstances.
ose farm operators who are using the highest number of unauthorized workers are also enjoying the highestprofit margins, while opposing increased enforcement that would tighten the labor market and increase wagesfor agricultural workers. ey argue that if laws against hiring unauthorized workers were enforced, an acutelabor shortage would arise resulting in crops rotting in the field. Academics point to stagnant wages and the in-creasing reliance on labor intensive operations as evidence that there is, at present, no shortage of farm laborersit the United States.35 is debate cannot be resolved unless the unabated flow of illegal labor is ended. emarket economy ensures that jobs are designed for people instead of the other way around and so, if the argumentis that the market should decide, then we should allow the market to deal with the necessary structural changesthat will occur in the agriculture industry as a result of the implementation of laws that have long been on thebooks.

18 federation for american immigration reform
Conclusion
e basic purpose of this study was to gauge the economic impact of replacing the unauthorized labor forcewith authorized workers in a sector which has grown increasingly dependent on cheap migrant labor. However,it is clear from the findings of this study that the impact will be insignificant. e impact would be greatest forfruits, nuts, and vegetables farms, but all commercial farms would remain profitable.
Any policy that can realistically be expected to deal with the situation would require policy makers to fully ac-knowledge both the existing dependency of the American agriculture industry on illegal labor and at the sametime their sufficient capacity to pay higher wages for legal workers. Several studies make the unreasonable as-sumption that all unauthorized workers will disappear overnight and then use a computer model to calculatethe subsequent impact on the economy the next morning and draw even the more absurd conclusion that allthese “jobs will be lost” (meaning positions being vacated not people losing jobs).36 An implementable policywould essentially be one that paves the way for a shift to a legal workforce giving the market sufficient time toadjust.
At the end of the day, higher costs are hardly a justification for continuing a practice that is illegal and exploitative.Federal authorities have long turned a blind eye to the rampant use of illegal workers on commercial farms. Cer-tain groups among the general public also display passive acceptance of a problem that has been created andnurtured through a policy of non-enforcement, and some even go so far as to defend this practice while ignoringits deleterious effect on native workers. e “Take Our Jobs” campaign, for instance, is an attempt by the UnitedFarm Workers Union to prove that illegal alien workers are essential for the farm sector. It calls upon Americancitizens to volunteer to take up agricultural jobs and highlights the lack of response so far as evidence that few,if any, Americans are willing to do farm work. However, if it is acknowledged that existing wages in this sectorare insufficient to maintain basic living standards, and that working conditions make it one of the most dangerousoccupations listed by the BLS, it would be unrealistic to expect persons with other alternatives to willingly subjectthemselves to such circumstances.
More importantly, the argument that Americans will not do farm work entirely ignores the point that low wagesand long, difficult workdays are presently the norm due to the fact that for the past several decades there hasbeen an inexhaustible supply of workers without any legal rights or bargaining power. It is not an “Americanvalue” to have an ingrained disdain for farm work. If this was the case, it would be difficult to explain why onein every five farm worker is American, or, more importantly, why 95 percent of farm operators are American.Furthermore, why has the average American farm worker over the past decade continued to work more hoursthan his illegal co-worker?
“AgJobs” bills that are periodically introduced into Congress propose that unauthorized farm workers be grantedlegal status. A mass amnesty for agricultural workers illegally in the United States was tried in 1986 and proved

19illegal immigration and agribusiness: the effect on the agriculture industry of converting to a legal workforce
to be a failure. e result was massive fraud and a quadrupling of the illegal alien population in the Unites States.True immigration reform calls for a sustainable solution that is morally and legally defensible and, at the sametime, economically viable. Any ad hoc fix that perpetuates the existing conditions without eliminating the rootcause of this flawed system will be detrimental, not only to the interest of this sector, but to those of the nationas well.

21illegal immigration and agribusiness: the effect on the agriculture industry of converting to a legal workforce
1 Jeffrey S. Passel, “Size and Characteristics of the Unauthorized Migrant Population in the U.S,” The
Pew Hispanic Center, March 7, 2006 (http://pewhispanic.org/files/reports/61.pdf); Steven A. Camarota
and Karen Jensenius, “Jobs Americans Won’t do? A detailed Look at Immigrant Employment by
Occupation,” Memorandum, Center for Immigration Studies, August 2009
(http://www.cis.org/articles/2009/occupations.pdf). 2 See the above comment by lobbyist Sharon Hughes quoted in S. Loewenberg, “Immigration laws dry
up farming work force,” Politico, October 24, 2007 (http://www.politico.com/news/stories/1007/6531.html).3 National Agriculture Workers Survey (NAWS), U.S. department of Labor,
http://www.doleta.gov/agworker/naws.cfm, accessed October 25, 2010. See Appendix I. This number is
much higher than the 24 percent reported by the Current Population Survey (Passel and Cohn 2009).4 Linda Levine, “Farm Labor Shortages and Immigration Policy,” Congressional Research Service,
RL30395, November 9, 2009 (http://www.nationalaglawcenter.org/assets/crs/RL30395.pdf). 5 Levine, “Farm Labor Shortages and Immigration Policy,” op. cit., Table 3.6 Ibid, p. 11.7 Steven A. Camarota, “Immigrants in the United States, 2007: A profile of America's Foreign-Born
Population,” Backgrounder, Table 2A, Center for Immigration Studies
(http://www.cis.org/immigrants_profile_2007). The difference in figures of Current Population Survey and
National Agricultural Workers Survey may be attributed to the difference in classification of occupations.
NAWS does not encompass poultry farming, fishing and forestry. However, since these occupations have
similar wage levels, a high degree of mobility between these occupations may be expected.8 In crop farming especially, 78% of the workforce is non US-citizens (NAWS).9 Steven A. Camarota and Karen Jensenius, “Trends in Immigrant and Native Employment,”
Backgrounder, May 2009, p. 16 (http://www.cis.org/articles/2009/back509.pdf). 4.6% unemployment was
the average rate of U.S. unemployment reported by the Bureau of Labor Statistics in 2007. 10 “USdA Agricultural Projections to 2019,” Interagency Agricultural Projections Committee, USdA,
February 2010, p. 9 (http://www.ers.usda.gov/Publications/OCE101/OCE101.pdf).11 Linda Levine, “The Effects on U.S. Farm Workers of an Agricultural Guest Worker Program,”
Congressional Research Service, 95-712, december 28, 2009
(http://www.nationalaglawcenter.org/assets/crs/95-712.pdf). 12 donald E. Wise, “The Effect of the Bracero on Agricultural Production in California,” Economic Inquiry,
vol. 12, no. 4 (december 1974):pp. 547-558. 13 Raul Hinojosa-Ojeda, “Raising the Floor for American Workers: The Economic Benefits of
Comprehensive Immigration Reform” (Washington, d.C.: Center for American Progress, American
Immigration Council, January 2010), Appendix 2
(http://www.americanprogress.org/issues/2010/01/pdf/immigrationeconreport.pdf). 14 According to the NAWS results of 2006, mean annual incomes are significantly different for legal and
illegal workforce in farming (unpaired one-tailed t-test, df=1175, p<0.001). The mean difference is $6,830-
$4405 (99% confidence interval).15 Robert A Hoppe, david E Banker, “Structure and Finance of Small Farms,” Economic Information
Bulletin, US department of Agriculture, 2010 (http://www.ers.usda.gov/Publications/EIB66/EIB66.pdf).16 Robert A. Hoppe, et. al., "Small Farms in the United States: Persistence Under Pressure 2010,"
Economic Information Bulletin, U.S. department of Agriculture (USdA), no. 63 (February 2010),
http://www.ers.usda.gov/Publications/EIB63/EIB63.pdf, accessed October 25, 2010.17 Nigel Key and Michael J. Roberts, “Measures of Trends in Farm Size Tell differing Stories.” 18 “National Economic Accounts,” Bureau of Economic Analysis, Figure 3A,
http://www.bea.gov/national/xls/technote_tax_acts.xls, accessed June 21, 2010). Corporate profits as
reported before tax and change in profits is calculated from inflation adjusted figures.
Endnotes

22 federation for american immigration reform
19 Janet Perry and Jim Johnson, “Farm and Rural Community,” Factsheet, ERS, USdA, 1999.20 Hoppe, “Small Farms in the United States.” 21 Ibid.22 Chad dechow, “Family dairy Farms and Immigration Reform,” American Thinker, April 18, 2010,
http://www.americanthinker.com/2010/04/family_dairy_farms_and_immigra.html, accessed June 2010.23 Operating profit margin: (NFI+Interest-Unpaid operator labor)/GFI.24 NAWS. The data displayed in this section is obtained from analysis of the dataset of NAWS
responses. NAWS is conducted by contractors of the department of Labor and all information is obtained
from face-to-face interviews. It is the most comprehensive random survey of the U.S. crop labor force. H-
2A workers are not included in the NAWS survey. Those who are classified as “other authorized” are
persons who have work authorization while their immigration status is pending, such as refugees and
those with temporary protective status. Even though there is no limit on the number of H-2A workers who
can enter the U.S. for work, they make up a small percentage (<5%) of farm workers. 25 The differences illustrated are statistically significant, meaning that observed differences are not due
to sampling variability. P-value of t test for means is less than 0.0001.26 Standard error bars do not overlap suggesting that differences in means are not likely to be due to
sampling variability.27 Not available due to high relative standard error in survey numbers or insufficient observations. 28 Unpaid operator labor is valued at prevailing farm wages multiplied by the average hours spent by
operators engaged in farm work (Profile of Hired Farmworkers n.d.) and is distinct from returns to
operator. The management fee is valued at 5% of GFI. 29 “Farm Financial Ratios and Benchmarks Calculations and Implications,” University of Wisconsin,
Cooperative Extension, March 2009,
http://www.uwex.edu/ces/ag/documents/FarmFinancialRatiosandBenchmarks3192009.pdf, accessed July
20, 2010.30 Marginal income: negative net income and debt to asset ratio lower than 40%. Marginal solvency:
positive net income and debt to asset ratio. Vulnerable: debt-to-asset ratio greater than 40% and
negative income. 31 J. M. Harris, et al., Agricultural Income and Finance Outlook, U.S. department of Agriculture,
Economic Research Service, AIS-88 december 2009.32 Ibid.33 Hoppe, Small Farms in the United States.34 Philip Martin, “How We Eat: 2004,” Rural Migration News," Vol. 12, no. 1 (January 2006),
http://migration.ucdavis.edu/rmn/more.php?id=1092_0_5_0, accessed July 2010.35 Philip Martin, “Farm Labor Shortages: How Real? What Response,” Teleconference Transcript,
Center for Immigration Studies, November 2007 (http://www.cis.org/node/637). 36 The most far-fetched scenario that is commonly cited is the so-called “Perryman Report,” “An
Essential Resource: An Analysis of the Economic Impact of Undocumented Workers on Business Activity
in the US with Estimated Effects by State and by Industry” (Waco, Texas: The Perryman Group, April
2008),
http://americansforimmigrationreform.com/files/Impact_of_the_Undocumented_Workforce.pdf#page=48.
The Perryman findings are based on an economic model that bears no relation to actual economic or
political conditions in the U.S. Raul Hinojosa-Ojeda, “Raising the Floor for American Workers,” takes
another approach. He simply ignores all evidence that contradicts his conclusions.

Appendices

Numbers Surveyed by Status ALL FARMS FIELd CROPS FRUITS, NUTS ANd VEGETABLES
LEGAL ILLEGALRATIO OF
LEGAL/ILLEGALLEGAL ILLEGAL
RATIO OF
LEGAL/ILLEGALLEGAL ILLEGAL
RATIO OF
LEGAL/ILLEGAL
2006 1.03 3.77 0.67
2005 1117 1104 1.01 255 79 3.23 453 695 0.65
2004 1592 1448 1.10 409 164 2.49 637 868 0.73
2003 1783 1774 1.01 496 204 2.43 773 1191 0.65
2002 1629 1709 0.95 343 203 1.69 808 1081 0.75
2001 1489 1583 0.94 321 168 1.91 811 1013 0.80
2000 1629 1709 0.95 343 203 1.69 808 1081 0.75
1999 1718 1823 1.06 372 231 1.61 945 1194 0.79
1998 1085 989 1.10 60 182 0.33 750 630 1.19
1997 1105 978 1.13 104 171 0.61 735 609 1.21
1996 1060 976 1.09 101 155 0.65 681 658 1.03
Wages by Status ALL FARMS FIELd CROPS FRUITS, NUTS ANd VEGETABLES
LEGAL ILLEGALRATIO OF
LEGAL/ILLEGALLEGAL ILLEGAL
RATIO OF
LEGAL/ILLEGALLEGAL ILLEGAL
RATIO OF
LEGAL/ILLEGAL
2006 $9.35 $7.70 1.21 $8.86 $7.27 1.22 $9.28 $7.85 1.18
2005 $8.51 $7.56 1.13 $8.18 $7.23 1.13 $8.24 $7.65 1.08
2004 $8.41 $7.13 1.18 $8.65 $6.55 1.32 $8.31 $7.23 1.15
2003 $8.24 $7.09 1.16 $8.27 $6.76 1.22 $8.04 $7.17 1.12
2002 $8.09 $6.86 1.18 $8.44 $6.75 1.25 $7.68 $6.92 1.11
2001 $7.81 $6.91 1.13 $7.82 $7.00 1.12 $7.65 $6.96 1.10
2000 $8.09 $6.86 1.18 $8.44 $6.75 1.25 $7.68 $6.92 1.11
1999 $6.83 $6.21 1.10 $6.44 $6.15 1.05 $6.89 $6.26 1.10
1998 $6.59 $5.88 1.12 $6.00 $5.40 1.11 $6.50 $6.03 1.08
1997 $6.12 $5.52 1.11 $5.67 $5.08 1.12 $6.06 $5.67 1.07
1996 $5.92 $5.45 1.09 $5.73 $5.22 1.10 $5.76 $5.57 1.03
Annual Farm Work Hours by Status
ALL FARMS FIELd CROPS FRUITS, NUTS ANd VEGETABLES
LEGAL ILLEGALRATIO OF
LEGAL/ILLEGALLEGAL ILLEGAL
RATIO OF
LEGAL/ILLEGALLEGAL ILLEGAL
RATIO OF
LEGAL/ILLEGAL
2006 1923 1707 1.13 2118 2269 0.93 1927 1540 1.25
2005 1841 1693 1.09 2029 1883 1.08 1710 1613 1.06
2004 1863 1671 1.11 43 36 1.19 41 38 1.07
2003 1639 1447 1.13 2060 1691 1.22 1588 1406
2002 1821 1566 1.16 2434 1650 1.48 1691 1482 1.14
2001 1770 1519 1.17 2149 1560 1.38 1632 1441 1.13
2000 1821 1566 1.16 2434 1650 1.48 1691 1482 1.14
1999 1619 1375 0.85 1860 1387 1.34 1482 1291 1.15
1998 1321 1117 1.18 1440 983 1.47 1280 1106 1.16
1997 1404 1208 1.16 1556 912 1.71 1352 1231 1.10
Values displayed are mean values of survey responses. Ratios are calculated from values of preceding columns.
Appendix INational Agricultural Workers Survey: Summary of Data

Appendix IIReplacement Cost Model: Estimating Rise in Labor Expense
The survey data reveals that depending on commodity type, contribution of labor and their wages
can differ by legal status. Over the period examined there have been certain changes in these
factors that follow a trend and so it is likely that the most recent data (2006) is more representative
of the present situation compared to an 11 year average. The ratio of numbers, annual working
hours and wages of legal and illegal workforce for 2006 is calculated to give an estimate of the
rate of increase in compensation that may have to be offered if the entire illegal labor force is to
be replaced by legal workers.
Total original labor cost (L) =payment to legal workers + payment to illegal workers
=(NL*HL*WL) +(Ni*Hi*Wi)
Where NL/i=Number of legal/illegal workers
HL/i=Annual farm work hours by legal/illegal workers
WL/i=Mean wage rate legal/illegal workers
Let x=NL/Ni: ratio of number of legal workers to number of illegal workers
w=WL/Wi: ratio of wages (legal/illegal)
z=HL/Hi: ratio of annual hours per worker
L =WL*HL*NL + WiHiNi
=xwz(WiHiNi)+WiHiNi
=(xwz+1) WiHiNi—total labor cost at different wage rates
Now, if the labor hours that were previously paid at the lower wage rate are now paid at the higher
wage rate accepted by legal workers then, Wi=WL
New labor cost (L’) = WL*HL*NL + WLHiNi
=xwz (WiHiNi) + wWiHiNi
=(xwz+w) WiHiNi
Therefore L’/L=(xwz+w)/ (xwz+1)
Commodity
Ratio ofnumber
(x)
Ratio of wage rate
(w)
Ratio of hours worked
(z)(xwz+w) /
(xwz+1)
Percentageincrease inlabor cost
Increase inincome ofreplacedworkers
Fruits, nuts andvegetables
0.567 1.182 1.251 1.991 0.0991 0.18
Field crops 1.778 1.219 1.219 1.0601 0.0601 0.22

Appendix IIINet Farm Incomes and Operating Profit Margins after Replacement Cost Estimate
Operating Profit Margin
CORNFRUIT, NUTS, VEGETABLES
GENERAL CASHGRAINS
OTHER FIELd CROPS SOYBEANS
1996 0.3008 0.1387 0.2599 0.2244 0.27381997 0.2017 0.1773 0.2262 0.2090 0.24151998 0.1542 0.1798 0.1024 0.1154 0.07721999 0.1579 0.1263 0.1674 0.1349 0.18542000 0.1440 0.1161 0.1594 0.1149 0.14782001 0.1479 0.1248 0.1317 0.1168 0.19352002 0.1637 0.1357 0.1442 0.0969 0.15362003 0.1595 0.1691 0.2140 0.1822 0.22532004 0.2236 0.1728 0.1610 0.0844 0.14622005 0.1485 0.1810 0.1525 0.1366 0.21842006 0.2723 0.1712 0.2136 0.1154 0.17262007 0.3725 0.2169 0.3106 0.2591 0.28722008 0.2691 0.1283 0.2275 0.1564 0.2290
decline in Net Farm Income
CORNFRUIT, NUTS, VEGETABLES
GENERAL CASHGRAINS
OTHER FIELd CROPS SOYBEANS
1996 0.0090 0.1365 0.0134 0.0289 0.01211997 0.0124 0.1164 0.0142 0.0548 0.01211998 0.0159 0.1046 0.0253 0.0716 0.02231999 0.0191 0.1528 0.0194 0.0674 0.01792000 0.0149 0.1554 0.0158 0.0717 0.01212001 0.0201 0.1504 0.0219 0.0456 0.01132002 0.0145 0.1375 0.0216 0.0682 0.01682003 0.0134 0.1097 0.0125 0.0409 0.01672004 0.0088 0.1031 0.0159 0.0529 0.02062005 0.0129 0.1036 0.0180 0.0414 0.01232006 0.0077 0.1045 0.0142 0.0425 0.01292007 0.0053 0.0881 0.0095 0.0254 0.01152008 0.0060 0.1396 0.0109 0.0399 0.0077
decline in Net Farm Income of Rural Residence Farms
CORNFRUIT, NUTS, VEGETABLES
GENERAL CASHGRAINS
OTHER FIELd CROPS SOYBEANS
2008 0.0028 0.0700 0.0055 0.0077 *2007 0.0019 * 0.0055 0.0096 *2006 0.0037 0.0456 0.0041 0.0082 *2005 0.0036 0.0489 0.0054 0.0076 *2004 0.0042 * 0.0024 * *2003 0.0030 * * 0.0055 *2002 0.0087 0.0772 * 0.0101 *2001 0.0047 0.0465 * 0.0064 *2000 * * * * *1999 * 0.0576 * 0.0239 *1998 * * * 0.0043 *1997 0.0072 0.0483 * 0.0058 *1996 0.0031 * * 0.0045 *
Values required for calculations unavailable due to high relative standard errors of values obtained in the survey
Calculation made using data from Agricultural Resource Management Survey 1996-2008. Refer to Appendix IV for sample calculation.

Appendix IVSample Calculation Using Data from 2006 for Commercial Fruits, Nuts and Vegetable Farms
INCOME ITEM SOURCE / dERIVEd FROM
Gross cash income
Agriculture Resource Management Survey
Customized Data Summary
1300030
Labor 329969
Interest 32657
Depreciation 55731
Net farm income 310715
Unpaid operator labor 2500 hours* average wage rate 23375
Actual Operating profit margin(NFI+Interest-Unpaid Operator labor-
5%GFI)/GFI19.6%
replACemenT CosT esTimATe
ratio of hour (x)
National Agriculture Workers Survey
1.251
ratio of number (y) 0.567
ratio of wage (z) 1.181
Labor cost (RCE)Actual labor cost* (xyz+z)/(xyz+1)
See Appendix II307798
New net farm incomeActual NFI-Labor cost (RCE)
Actual labor cost223846
Percentage decrease in NFI 11.0%
Operating profit margin 16.9%
20% lABor CosT inCreAse
Labor cost (2) Actual labor cost* 1.2 362445
New net farm income (2) 278239
Percentage decrease in NFI (2) 10.5%
Operating profit margin (2) 17.1%
30% lABor CosT inCreAse
Labor cost (3) Actual labor cost* 1.3 428960
New net farm income (3) 211724
Percentage decrease in NFI (3) 31.9%
Operating profit margin (3) 12.0%
These calculations has been duplicated for ARMS data for all types of crop farms and for every year between 1996-2006.Summary of data provided in Appendix III

I would like to receive:
the Immigration Report (online edition) only
the Legislative Updates only
both the Immigration Report (online edition) and the Legislative Updates
information on how to make a Planned Gift to FAIR
Email address
____________________________________________
$25 $50 $100 $250 $500 $1,000 Other $______________
All contributions are tax-deductible.
I am making my donation by check payable to FAIR,or credit card (check one)
_____________________________________________ Cardholder’s Name
______________________________________________ Card Number
____________ _______________________________Expiration Date Signature
I have included $25 for a Gift Membership to:
Gift recipient’s name and address
___________________________________________________
___________________________________________________
___________________________________________________
___________________________________________________
Stay Informed. Get Involved.
Make a Difference!
FAIR is a member of the Better Business Bureau’s Wise GivingAlliance and is one of a select few non-profit organizationsthat meet their high standards of operation, spending,truthfulness, and disclosure.
ABOUT FAIRThe Federation for American Immigration Reform
(FAIR) is a national, nonprofit, public-interest,
membership organization of concerned citizens who
share a common belief that our nation’s immigration
policies must be reformed to serve the national
interest.
FAIR seeks to improve border security, to stop illegal
immigration, and to promote immigration levels
consistent with the national interest — more
traditional rates of about 300,000 a year.
With more than 250,000 members and supporters
nationwide, FAIR is a non-partisan group whose
membership runs the gamut from liberal to
conservative. Our grassroots networks help
concerned citizens use their voices to speak up for
effective, sensible immigration policies that work for
America’s best interests.
FAIR’s publications and research are used by
academics and government officials in preparing
new legislation. National and international media
regularly turn to us to understand the latest
immigration developments and to shed light on this
complex subject. FAIR has been called to testify on
immigration bills before Congress more than any
organization in America.
___________________________________
Your support is crucial to our ability to improve
border security, stop illegal immigration, and
promote immigration levels consistent with the
national interest. You may join or donate online at
www.fairus.org, toll-free by phone at (877) 627-
3247, or complete the adjacent form and mail to:
FAIR / Development Department
25 Massachusetts Ave., NW, Suite 330
Washington, D.C. 20001

duke austin dino drudi donald mann
hon. louis barletta paul egan henry mayer, m.d.
gwat bhattacharjie bonnie erbe k.c. mcalpin
gerda bikales don feder Joel mccleary
hon. brian bilbray robert gillespie scott mcconnell
edith blodgett otis w. graham, Jr., ph.d. James g. mcdonald, esq.
J. bayard boyle, Jr. Joseph r. guzzardi helen milliken
hugh brien robert e. hannay nita norman
John brock lawrence e. harrison peter nuñez
torrey brown, m.d. edward h. harte robert d. park
frances burke, ph.d. bonnie hawley fred pinkham, ph.d.
cleveland chandler, ph.d. marilyn hempell bruce s. reid
william w. chip, esq. hon. walter d. huddleston teela roche
william collard, esq. diana hull, ph.d. colonel albert f. rodriguez, ret.
donald collins hon. fred c. iklé charles t. roth
clifford colwell, m.d. glenn Jackson david m. schippers, esq.
thomas connolly mrs. t. n. Jordan max thelen, Jr.
Jane s. delung carol Joyal hon. curtin winsor, Jr.
James dorcy hon. richard lamm robert Zaitlin, m.d.
alfred p. doyle, m.d. yeh ling ling
nancy s. anthony pat choate roy c. porter, chairman
sharon barnes donald a. collins, Jr. stephen b. swensrud
henry m. buhl, vice president sarah g. epstein, secretary John tanton, m.d.
douglas e. caton, treasurer frank morris, ph.d. alan weeden
BOARD OF DIRECTORS
BOARD OF ADVISORS

FEdERATION FOR AMERICAN IMMIGRATION REFORM
25 MASSACHUSETTS AVENUE, NW • SUITE 330 • WASHINGTON, dC 20001 • WWW.FAIRUS.ORG
© COPYRIGHT FAIR HORIzON PRESSTM APRIL 2011. ALL RIGHTS RESERVEd.