illinois autism/pdd training and technical assistance project illinois’s work toward a data-driven...
TRANSCRIPT

Illinois Autism/PDD Training and
Technical Assistance Project
Illinois’s Work Toward a Data-Driven System of Support for Students with Autism Spectrum Disorders
PBIS Forum for ChangeOctober 11, 2007
Kathy Gould, IATTAP Project DirectorBarbara Sims, Illinois State Board of Education

Project Design History
Illinois Illinois Autism/PDD Autism/PDD Training and Training and
Technical Technical Assistance ProjectAssistance Project
Parents as informed & educated consumers
Wide array of effective intervention models
“Trainer of trainers” team model
Began in 1998 as a three year Statewide Project funded through ISBE

Current Project Design
Illinois Autism/PDD Training and Technical Assistance Project
IS-TAC ISBE TA Initiatives – Barbara Sims
On-line Courses - Illinois State University
Family Support – FFSASD
District/School Teams
State Leadership Team
Web- based Evaluation System

Experiential Team TrainingsExperiential Team Trainings
Week long guided practice
Apply a variety of teaching strategies
Include typical peers, Illinois learning standards
*self-assessments/action planning
*team monthly coaching

SCHOOL-WIDE SYSTEMSCurrent Status: Level
ofImplementation
Feature Need for Improvement
In Place
Partial in
Place
Not in
Place
School-wide is defined as involving all students, all staff and all settings.
High Med Low
10 6 5 8) Schools implement policies regarding school-wide supports and strategies for students with ASD.
5 8 4
15 8 7 9) School-based problem solving teams are in place and have necessary skills to develop/implement effective interventions for students with ASD.
6 10 4
5 14 6 10) School-based teams use data-based decision making to ensure progress of students with ASD.
11 5 2
Self-Assessment Surveys used with IEPA Teams

Current Status: Self-Assessment and Support of Illinois Educational Programs for Autism
Comparison across Systems SAMPLE Jan 2007
10
55
35
20
59
20.5
43
3027
69
21
10
41
49
10
0
10
20
30
40
50
60
70
80
90
100
In Place Partially in Place Not in Place
per
cen
tag
e o
f re
spo
nse
s
District Systems
School-Wide Systems
Non-Classroom Systems
Classroom Systems
Individual Systems

Priority for Improvement: Self-Assessment of Implementation and Support of Illinois Educational Programs for Autism
Comparison across Systems SAMPLE Jan 2007
55
35
20
51
28
21
3033
37
17
48
35
27
50
23
0
10
20
30
40
50
60
70
80
90
100
High Med Low
per
cen
tag
e o
f to
tal
resp
on
ses
District Systems
School-Wide Systems
Non- Classroom Systems
Classroom Systems
Individual Systems

Team Action PlanningSelf Assessment Summary
For each System Area, follow steps below
Overall Perception
District School-Wide Non-Classroom Classroom Individual
1. Use the EIS Survey summary to rate overall perception of implementation – circle High, Med or Low
HighMedLow
HighMedLow
HighMedLow
HighMedLow
HighMedLow
2. Using the Survey, list three major strengths
a.b.c.
a.b.c.
a.b.c.
a.b.c.
a.b.c.
3. Using the Survey, list three major areas in need of development.4. For each system, circle one priority area for focusing development activities.
a.b.c.
a.b.c.
a.b.c.
a.b.c.
a.b.c.
5. Define activities for this/next year’s focus to support area selected for development.
6. Specify system(s) to sustain(S) & develop(D)

What about the child and family?

FY2005 School Consultation Model
15 School/Parent Teams participated in intensive consultation and trainingwith three consultants
7 Chicago Suburban area4 Central Illinois4 Southern Illinois

SystematicInformationManagementfor EducationOutcomes
School Consultation Model Piloted with

FY2005
14 students/team data entered
7 students with multiple data points
Multi-disciplinary Team/ IATTAP facilitator
Tracked on a variety of information and risk factors/ 3 month intervals

Is Student's Placement At-Risk?
1.27
1 1
1.55
1.2
11
1.25
1.5
1.75
2
Baseline Quarterly Discharge
Home Risk School Risk Community Risk
FY 2005 SIMEO

Autism Related Behaviors Demonstrating the Greatest Improvement
1.8
1.451.61.8
0.70.6
0.60.45
0.730.80.9
1.2
0
0.5
1
1.5
2
Baseline Time 1 Time 2
Aggression Anxiety Agitation Self-Injury
FY 2005 SIMEO

From School Consultation to
Focus Family Support

Attended FFPBS training at West Virginia Autism Training Center
3 days training on the family-focused model
Completed our own PATH
Brought back FFPBS information
Worked with Illinois State Board of Education on grant priorities
The Changing Focus of IATTAP

The Changing Focus of IATTAP
From School Consultation
– School entry point – School agreements for consultation– School observation– Some home/community observation– Report with recommendations, training
and follow-up

To FFSASD
– Home entry point– Use of Community Partners and
Education Facilitators– Family Frames– Team development– PATH– Action plans– Continued support
The Changing Focus of IATTAP

Focus Family Support 06-07
70 families began the FFSASD Process
59 entered into SIMEO
11 FFSASD families - launched

Evaluation Tools
Assessment Schedule
Data Collection Methodology
Data Storage and Graph Retrieval
SIMEO 07

FY 2007 SIMEO Demographics • 85% Male
• 85% have diagnosis of “Autism”
• Median age 10.5 years
• 93% Caucasian
• 56% Living with single mother
• 52% at-risk for failing home, school and/or community placement

10
5
7
9 9
6
1
6
12
3
0
2
4
6
8
10
12
14
FY 2005 FY 2006 FY 2007
Baseline Time 2 Time 3 Time 4 or more
9 students10 students
27 students
SIMEO Autism Evaluation Capacity Increases
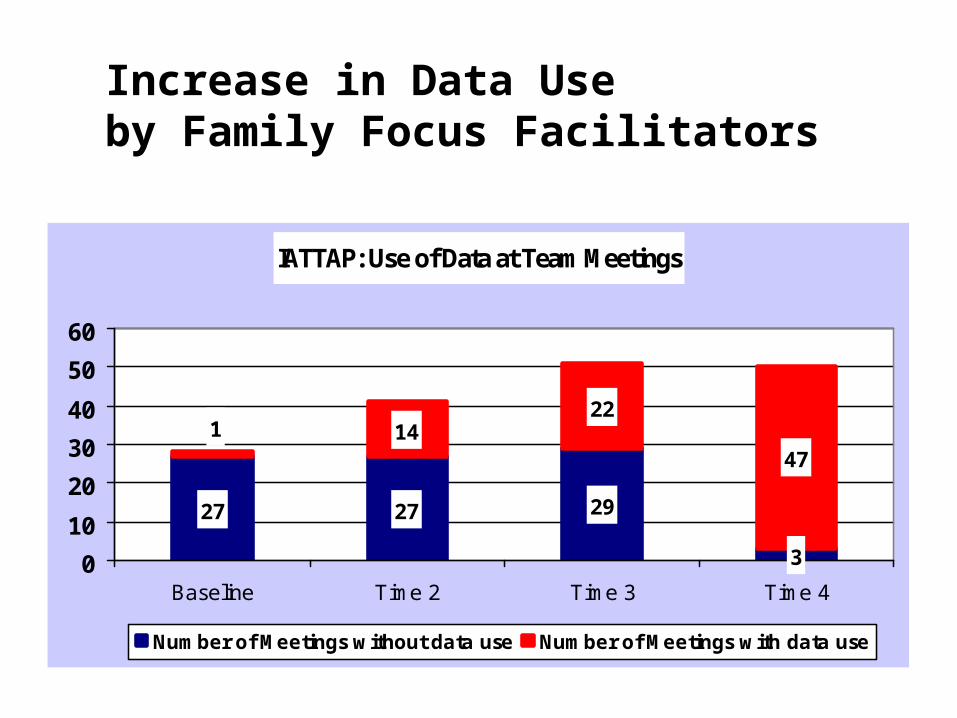
Increase in Data Useby Family Focus Facilitators
IATTAP: Use of Data at Team Meetings
27 27 29
3
1422
47
1
0
10
20
30
40
50
60
Baseline Time 2 Time 3 Time 4
Number of Meetings without data use Number of Meetings with data use

IATTAP Data Summary CohortClassroom Behavior Functioning
IATTAP Classroom Behavioral Functioning (N=27)
2.58
1.812.13
2.65 2.9
2.33
1.31
1.95
1
2
3
4
Baseline Time 2
Completes Assignments on Time* Pays Attention**
Participates in Activites** Appropriate Behav Unsupervised**
*=Approaching statistically significant change**=Statistically significant change
AlwaysAppropriate
SometimesAppropriate
SeldomAppropriate
NeverAppropriate

IATTAP Data Summary CohortSchool/Classroom Inclusion
IATTAP School/Classroom Inclusion (N=27)
2.332.45
3.07
3.31
2.77
2.04
2.44
2.22
1
2
3
4
Baseline Time 2
Daily Schedule Visable** System for Communicating Peers/Teachers**
Completes w ork independently** Transitions Independently**
**=Statistically significant change
Always
Sometimes
Seldom
Never

IATTAP Data Summary CohortStudent Placement Risk: Home, School and Community
IATTAP Student Placement Risk
1.48
2.92
1
2
3
4
Baseline Time 2
Placement Risk (N=27*)
*=P<.000
High Risk
ModerateRisk
Low Risk
No Risk

Assessment of Training Strengths and Needs by Environment
2.4
2.162.3
2.1
2.7
2.4
1
1.5
2
2.5
3
3.5
4
Baseline Time 21=
Hig
h N
ee
d
4
=H
igh
Str
en
gth
Home Community School
FY 2007 Training Need Decreases in Home, School and Community

IATTAP Data Summary CohortFamily Stressor by Type
N=27 (*Categories Not Mutually Exclusive)
IATTAP Family Stressors by Type
14
711
23
11
4 5
14
47
05
1015202530
Pe
rce
nt
of
To
tal
Percentage of Overall Identified Stressors
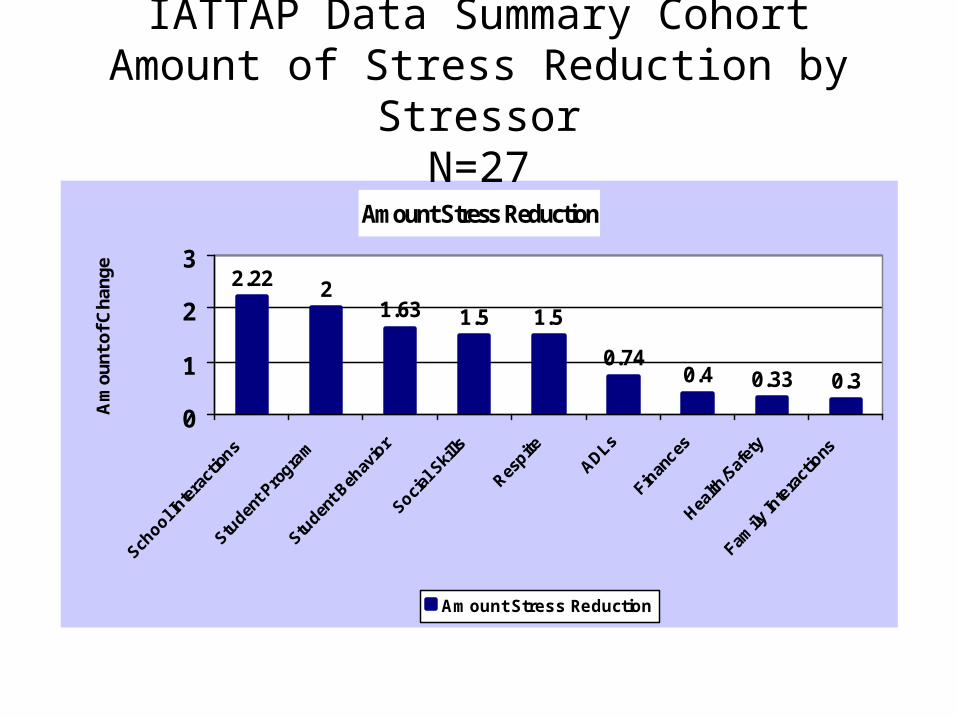
Amount Stress Reduction
2.22 21.63 1.5 1.5
0.740.4 0.33 0.3
0
1
2
3
Am
ount
of C
hang
e
Amount Stress Reduction
IATTAP Data Summary CohortAmount of Stress Reduction by Stressor
N=27

IATTP Family Post Program Quality of Life: Quality of Life Subscale: Highest ratings
4.45
4.63 4.54 4.45
1
2
3
4
5
Need forAssistance
Overall Qualityof Life
Current EDPlacement
EmotionalStability
Aggregate Family Rating
Quality of Life
N=11
Much Better
Slightly Better
No Change
Slightly Worse
Much Worse

IATTAP Family Post Program Quality of Life: Team Strategies and Process Subscale: Highest ratings
3.9
4 3.9 3.9
1
2
3
4
Comfortable withstrategies
Strategies AddressFamily Needs
Team CollectivelyProblem Solves
Team FacilitationEffective
Aggregate Family Rating
Quality of Life: Team Strategies and Team Process
Sub-Section-Areas of Highest Rating
N=11
Strongly agree
Somewhat agree
Somewhat disagree
Strongly disagree
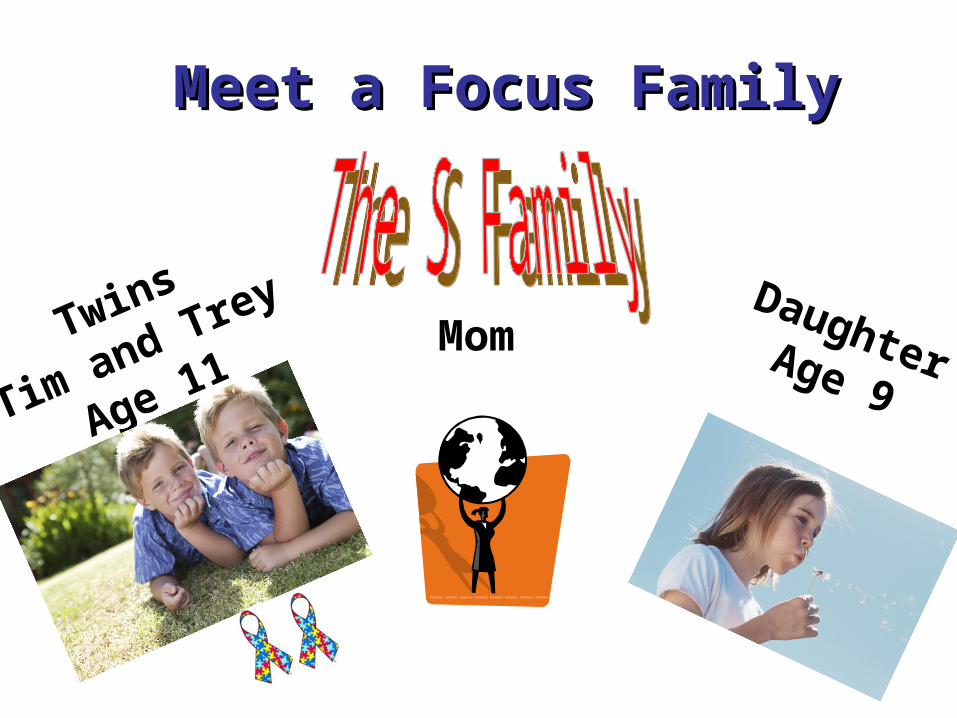
Twins
Tim and Trey
Age 11
DaughterAge 9Mom
Meet a Focus FamilyMeet a Focus Family

Team helped Mom to access Personal Assistant for A. He will receive 250 hours until the end of the fiscal year.PA gets Tim involved in social / community events.School team got Tim involved in Special Olympics for the 1st time.
SIMEO 2007-Home, School, Community Tool
Data used in work with Student A

Goal: A will communicate effectively.SLP began using a loaner AAC Device with A.Mom completed paperwork for purchase of AAC device.School team members are using AAC device within the classroom.
SIMEO 2007- Educational Information ToolQuestion: Has a Communication System with Peers & Adults

Goal: A will finish school at XYZ District.Team called for meeting to develop a BIP for ATeam watched video on addressing sensory needs.Team implemented MORE visuals at school and home. Communication system in place.
Progress toward PATH Goals
SIMEO 2007-Referral Disposition Tool
Question: Risk of Student Placement from School
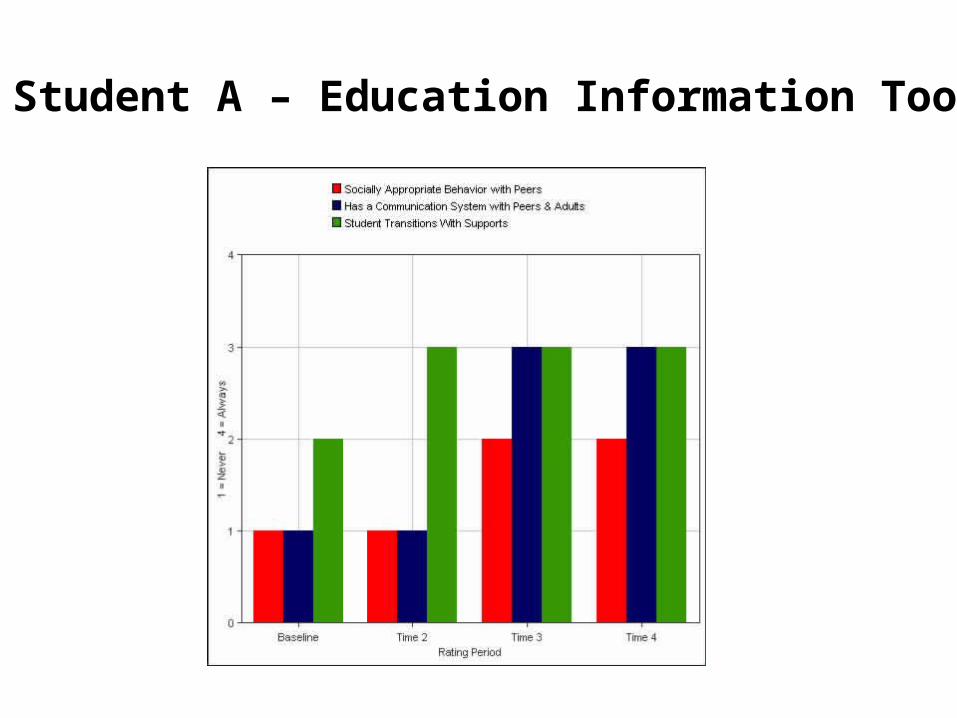
Student A – Education Information Tool

Student B – Big Behavior Tool

IATTAP Data Summary CohortStudent A-Decreases in Family Stress
High Stress
Moderate Stress
Low to Moderate Stress
Low to No Stress 1
2
3
4
5
Baseline Time 2 Time 3 Time 4 Time 5
Stress Related to School Issues
Stress Related to Student's Aggressive Behavior
Stress Related to Student's Limited Communication Abilities
Moderate to High Stress

IATTAP Data Summary CohortStudent B-Decreases in Family Stress
High Stress
Moderate Stress
Low to Moderate Stress
Low to No Stress 1
2
3
4
5
Baseline Time 2 Time 3 Time 4 Time 5
Stress Related to Student's Inappropriate Display of Emotions
Stress Related to Student's Aggressive Behavior
Stress Related to Student Becoming Over Excited
Moderate to High Stress

Project FutureProject Future
Coordinated TA with other initiatives
“Coaching Network” members of problem-solving teams
District assessment and support, external observation
Expanded on-line courses
Coordinated on-line evaluation data system
Increase ability to access and use data to make decisions across initiatives