illinois county cancer statistics review incidence,...
TRANSCRIPT

Illinois County Cancer Statistics Review Incidence, 2012-2016
Epidemiologic Report Series 20:03 July 2019
State of Illinois Illinois Department of Public Health

Illinois County Cancer Statistics Review
Incidence, 2012-2016
A publication of the
Illinois Department of Public Health
Division of Epidemiologic Studies
Illinois State Cancer Registry
Springfield, Illinois 62761
July 2019

Prepared by
Kyle Garner, M.P.H.
Cancer Epidemiologist
Tiefu Shen, M.D., Ph.D.
Division Chief
Acknowledgements
This report would not have been possible without the diligent work of the Illinois State
Cancer Registry staff, the personnel at the reporting facilities that diagnose or treat
cancer patients throughout Illinois, and the staff members at other state central cancer
registries with data exchange agreements.
This publication was supported by Cooperative Agreement Number NU58DP003883-05
from the U.S. Centers for Disease Control and Prevention (CDC) National Cancer
Prevention and Control Program. The contents are solely the responsibility of the
authors and do not necessarily represent the official views of CDC.
Suggested citation
Garner K, Shen T. Illinois County Cancer Statistics Review Incidence, 2012-2016.
Epidemiologic Report Series 20:03. Springfield, Ill.: Illinois Department of Public Health,
July 2019.
Copyright information
All material in this report is in the public domain and may be reproduced or copied
without permission; citation as to source, however, is appreciated.
The Illinois Department of Public Health, Illinois State Cancer Registry (ISCR), makes the
cancer incidence data available as a public service. Use of these data does not constitute
an endorsement of the user’s opinion or conclusions by the Department and none
should be inferred.

i
ILLINOIS COUNTY CANCER STATISTICS REVIEW
INCIDENCE, 2012 – 2016
TABLE OF CONTENTS
Overview and Technical Notes 1
SECTION I
Cancer Incidence Rates for Selected Sites by County and Race…………………………… I-1
All Sites Combined……………………………………………………………………..…………………………………………….………………………………..I-2
Oral Cavity and Pharynx……………………………………………………………………..…………………………………………….………………………………..I-6
Colon and Rectum……………………………………………………………………..…………………………………………….………………………………..I-10
Lung and Bronchus……………………………………………………………………..…………………………………………….………………………………..I-14
Melanoma of the Skin……………………………………………………………………..…………………………………………….………………………………..I-18
Female Breast (invasive)……………………………………………………………………..…………………………………………….………………………………..I-22
Cervix……………………………………………………………………..…………………………………………….………………………………..I-25
Female Breast (in situ)……………………………………………………………………..…………………………………………….………………………………..I-28
Prostate……………………………………………………………………..…………………………………………….………………………………..I-31
SECTION II
Percent Distribution of Stage at Diagnosis by County…………………………………………… II-1
Oral Cavity and Pharynx……………………………………………………………………..…………………………………………….………………………………..II-2
Colon and Rectum……………………………………………………………………..…………………………………………….………………………………..II-5
Melanoma of the Skin……………………………………………………………………..…………………………………………….………………………………..II-8
Female Breast……………………………………………………………………..…………………………………………….………………………………..II-11
Cervix……………………………………………………………………..…………………………………………….………………………………..II-14
Prostate……………………………………………………………………..…………………………………………….………………………………..II-17
SECTION III
County-specific Cancer Incidence Rates, All Races……………………………………………… III-1
Illinois……………………………………………………………………..…………………………………………….………………………………..III-2
Adams County……………………………………………………………………..…………………………………………….………………………………..III-3

ii
Alexander County……………………………………………………………………..…………………………………………….………………………………..III-4
Bond County……………………………………………………………………..…………………………………………….………………………………..III-5
Boone County……………………………………………………………………..…………………………………………….………………………………..III-6
Brown County……………………………………………………………………..…………………………………………….………………………………..III-7
Bureau County……………………………………………………………………..…………………………………………….………………………………..III-8
Calhoun County……………………………………………………………………..…………………………………………….………………………………..III-9
Carroll County……………………………………………………………………..…………………………………………….………………………………..III-10
Cass County……………………………………………………………………..…………………………………………….………………………………..III-11
Champaign County……………………………………………………………………..…………………………………………….………………………………..III-12
Christian County……………………………………………………………………..…………………………………………….………………………………..III-13
Clark County……………………………………………………………………..…………………………………………….………………………………..III-14
Clay County……………………………………………………………………..…………………………………………….………………………………..III-15
Clinton County……………………………………………………………………..…………………………………………….………………………………..III-16
Coles County……………………………………………………………………..…………………………………………….………………………………..III-17
Cook County……………………………………………………………………..…………………………………………….………………………………..III-18
Crawford County……………………………………………………………………..…………………………………………….………………………………..III-19
Cumberland County……………………………………………………………………..…………………………………………….………………………………..III-20
DeKalb County……………………………………………………………………..…………………………………………….………………………………..III-21
DeWitt County……………………………………………………………………..…………………………………………….………………………………..III-22
Douglas County……………………………………………………………………..…………………………………………….………………………………..III-23
DuPage County……………………………………………………………………..…………………………………………….………………………………..III-24
Edgar County……………………………………………………………………..…………………………………………….………………………………..III-25
Edwards County……………………………………………………………………..…………………………………………….………………………………..III-26
Effingham County……………………………………………………………………..…………………………………………….………………………………..III-27
Fayette County……………………………………………………………………..…………………………………………….………………………………..III-28
Ford County……………………………………………………………………..…………………………………………….………………………………..III-29
Franklin County……………………………………………………………………..…………………………………………….………………………………..III-30
Fulton County……………………………………………………………………..…………………………………………….………………………………..III-31
Gallatin County……………………………………………………………………..…………………………………………….………………………………..III-32
Greene County……………………………………………………………………..…………………………………………….………………………………..III-33
Grundy County……………………………………………………………………..…………………………………………….………………………………..III-34
Hamilton County……………………………………………………………………..…………………………………………….………………………………..III-35
Hancock County……………………………………………………………………..…………………………………………….………………………………..III-36
Hardin County……………………………………………………………………..…………………………………………….………………………………..III-37
Henderson County……………………………………………………………………..…………………………………………….………………………………..III-38
Henry County……………………………………………………………………..…………………………………………….………………………………..III-39
Iroquois County……………………………………………………………………..…………………………………………….………………………………..III-40
Jackson County……………………………………………………………………..…………………………………………….………………………………..III-41
Jasper County……………………………………………………………………..…………………………………………….………………………………..III-42
Jefferson County……………………………………………………………………..…………………………………………….………………………………..III-43
Jersey County……………………………………………………………………..…………………………………………….………………………………..III-44
Jo Daviess County……………………………………………………………………..…………………………………………….………………………………..III-45

iii
Johnson County……………………………………………………………………..…………………………………………….………………………………..III-46
Kane County……………………………………………………………………..…………………………………………….………………………………..III-47
Kankakee County……………………………………………………………………..…………………………………………….………………………………..III-48
Kendall County……………………………………………………………………..…………………………………………….………………………………..III-49
Knox County……………………………………………………………………..…………………………………………….………………………………..III-50
Lake County……………………………………………………………………..…………………………………………….………………………………..III-51
LaSalle County……………………………………………………………………..…………………………………………….………………………………..III-52
Lawrence County……………………………………………………………………..…………………………………………….………………………………..III-53
Lee County……………………………………………………………………..…………………………………………….………………………………..III-54
Livingston County……………………………………………………………………..…………………………………………….………………………………..III-55
Logan County……………………………………………………………………..…………………………………………….………………………………..III-56
McDonough County……………………………………………………………………..…………………………………………….………………………………..III-57
McHenry County……………………………………………………………………..…………………………………………….………………………………..III-58
McLean County……………………………………………………………………..…………………………………………….………………………………..III-59
Macon County……………………………………………………………………..…………………………………………….………………………………..III-60
Macoupin County……………………………………………………………………..…………………………………………….………………………………..III-61
Madison County……………………………………………………………………..…………………………………………….………………………………..III-62
Marion County……………………………………………………………………..…………………………………………….………………………………..III-63
Marshall County……………………………………………………………………..…………………………………………….………………………………..III-64
Mason County……………………………………………………………………..…………………………………………….………………………………..III-65
Massac County……………………………………………………………………..…………………………………………….………………………………..III-66
Menard County……………………………………………………………………..…………………………………………….………………………………..III-67
Mercer County……………………………………………………………………..…………………………………………….………………………………..III-68
Monroe County……………………………………………………………………..…………………………………………….………………………………..III-69
Montgomery County……………………………………………………………………..…………………………………………….………………………………..III-70
Morgan County……………………………………………………………………..…………………………………………….………………………………..III-71
Moultrie County……………………………………………………………………..…………………………………………….………………………………..III-72
Ogle County……………………………………………………………………..…………………………………………….………………………………..III-73
Peoria County……………………………………………………………………..…………………………………………….………………………………..III-74
Perry County……………………………………………………………………..…………………………………………….………………………………..III-75
Piatt County……………………………………………………………………..…………………………………………….………………………………..III-76
Pike County……………………………………………………………………..…………………………………………….………………………………..III-77
Pope County……………………………………………………………………..…………………………………………….………………………………..III-78
Pulaski County……………………………………………………………………..…………………………………………….………………………………..III-79
Putnam County……………………………………………………………………..…………………………………………….………………………………..III-80
Randolph County……………………………………………………………………..…………………………………………….………………………………..III-81
Richland County……………………………………………………………………..…………………………………………….………………………………..III-82
Rock Island County……………………………………………………………………..…………………………………………….………………………………..III-83
St. Clair County……………………………………………………………………..…………………………………………….………………………………..III-84
Saline County……………………………………………………………………..…………………………………………….………………………………..III-85
Sangamon County……………………………………………………………………..…………………………………………….………………………………..III-86
Schuyler County……………………………………………………………………..…………………………………………….………………………………..III-87

iv
Scott County……………………………………………………………………..…………………………………………….………………………………..III-88
Shelby County……………………………………………………………………..…………………………………………….………………………………..III-89
Stark County……………………………………………………………………..…………………………………………….………………………………..III-90
Stephenson County……………………………………………………………………..…………………………………………….………………………………..III-91
Tazewell County……………………………………………………………………..…………………………………………….………………………………..III-92
Union County……………………………………………………………………..…………………………………………….………………………………..III-93
Vermilion County……………………………………………………………………..…………………………………………….………………………………..III-94
Wabash County……………………………………………………………………..…………………………………………….………………………………..III-95
Warren County……………………………………………………………………..…………………………………………….………………………………..III-96
Washington County……………………………………………………………………..…………………………………………….………………………………..III-97
Wayne County……………………………………………………………………..…………………………………………….………………………………..III-98
White County……………………………………………………………………..…………………………………………….………………………………..III-99
Whiteside County……………………………………………………………………..…………………………………………….………………………………..III-100
Will County……………………………………………………………………..…………………………………………….………………………………..III-101
Williamson County……………………………………………………………………..…………………………………………….………………………………..III-102
Winnebago County……………………………………………………………………..…………………………………………….………………………………..III-103
Woodford County……………………………………………………………………..…………………………………………….………………………………..III-104
SECTION IV
County-specific Cancer Incidence Rates by Race.………………………………………………… IV-1
Whites
Illinois……………………………………………………………………..…………………………………………….………………………………..IV-2
Champaign County……………………………………………………………………..…………………………………………….………………………………..IV-3
Cook County……………………………………………………………………..…………………………………………….………………………………..IV-4
DuPage County……………………………………………………………………..…………………………………………….………………………………..IV-5
Kane County……………………………………………………………………..…………………………………………….………………………………..IV-6
Kankakee County……………………………………………………………………..…………………………………………….………………………………..IV-7
Lake County……………………………………………………………………..…………………………………………….………………………………..IV-8
Macon County……………………………………………………………………..…………………………………………….………………………………..IV-9
Madison County……………………………………………………………………..…………………………………………….………………………………..IV-10
Peoria County……………………………………………………………………..…………………………………………….………………………………..IV-11
Rock Island County……………………………………………………………………..…………………………………………….………………………………..IV-12
St. Clair County……………………………………………………………………..…………………………………………….………………………………..IV-13
Sangamon County……………………………………………………………………..…………………………………………….………………………………..IV-14
Vermilion County……………………………………………………………………..…………………………………………….………………………………..IV-15
Will County……………………………………………………………………..…………………………………………….………………………………..IV-16
Winnebago County……………………………………………………………………..…………………………………………….………………………………..IV-17
Blacks
Illinois……………………………………………………………………..…………………………………………….………………………………..IV-18
Champaign County……………………………………………………………………..…………………………………………….………………………………..IV-19

v
Cook County……………………………………………………………………..…………………………………………….………………………………..IV-20
DuPage County……………………………………………………………………..…………………………………………….………………………………..IV-21
Kane County……………………………………………………………………..…………………………………………….………………………………..IV-22
Kankakee County……………………………………………………………………..…………………………………………….………………………………..IV-23
Lake County……………………………………………………………………..…………………………………………….………………………………..IV-24
Macon County……………………………………………………………………..…………………………………………….………………………………..IV-25
Madison County……………………………………………………………………..…………………………………………….………………………………..IV-26
Peoria County……………………………………………………………………..…………………………………………….………………………………..IV-27
Rock Island County……………………………………………………………………..…………………………………………….………………………………..IV-28
St. Clair County……………………………………………………………………..…………………………………………….………………………………..IV-29
Sangamon County……………………………………………………………………..…………………………………………….………………………………..IV-30
Vermilion County……………………………………………………………………..…………………………………………….………………………………..IV-31
Will County……………………………………………………………………..…………………………………………….………………………………..IV-32
Winnebago County……………………………………………………………………..…………………………………………….………………………………..IV-33
SECTION V
County-specific Cancer Incidence Rates by Hispanic Ethnicity……………………………………… V-1
Non-Hispanics
Illinois……………………………………………………………………..…………………………………………….………………………………..V-2
Cook County……………………………………………………………………..…………………………………………….………………………………..V-3
DuPage County……………………………………………………………………..…………………………………………….………………………………..V-4
Kane County……………………………………………………………………..…………………………………………….………………………………..V-5
Lake County……………………………………………………………………..…………………………………………….………………………………..V-6
Will County……………………………………………………………………..…………………………………………….………………………………..V-7
Hispanics
Illinois……………………………………………………………………..…………………………………………….………………………………..V-8
Cook County……………………………………………………………………..…………………………………………….………………………………..V-9
DuPage County……………………………………………………………………..…………………………………………….………………………………..V-10
Kane County……………………………………………………………………..…………………………………………….………………………………..V-11
Lake County……………………………………………………………………..…………………………………………….………………………………..V-12
Will County……………………………………………………………………..…………………………………………….………………………………..V-13
APPENDIX A: Illinois County Population Totals, 2012-2016…………………………………………… A-1
APPENDIX B: ISCR County Cancer Site Groups……………………………………………………………… B-1
APPENDIX C: Formulas for Rates……………………………………………………………………..…………………………………………….………………………………..C-1

OVERVIEW AND TECHNICAL NOTES

1
ILLINOIS COUNTY CANCER STATISTICS REVIEW INCIDENCE, 2012 – 2016
OVERVIEW
This report presents cancer incidence in Illinois’ 102 counties for 2012 through 2016. The first two sections of the report include tables designed to facilitate county comparisons. County‐specific tables with expanded cancer sites are included in Section III for all races. Cancer incidence data for whites and blacks are included in Section IV for 15 counties, including Champaign, Cook, DuPage, Kane, Kankakee, Lake, Macon, Madison, Peoria, Rock Island, Sangamon, St. Clair, Vermilion, Will and Winnebago; these counties have sufficiently large black populations to allow meaningful statistics for the race group. Cancer incidence for Hispanics (of any race) and non‐Hispanics (of any race) are included in Section V for five counties (Cook, DuPage, Kane, Lake and Will) that have sufficiently large Hispanic populations to allow meaningful statistics for the ethnicity group. Details for each section follow.
Section I. Tables containing five‐year aggregate incidence counts, average annual age‐
adjusted rates and lower and upper 95 percent confidence intervals are presented for all sites combined; oral cavity and pharynx; colon and rectum; lung and bronchus; melanoma of the skin by sex, race, and Hispanic ethnicity (selected counties); and for female breast invasive and in situ, cervix and prostate by race and Hispanic ethnicity (selected counties). These sites were chosen based on two considerations: 1) the need to facilitate evaluation of various cancer prevention and control programs, and 2) the sufficient number of cases to allow meaningful presentation of rates.
Section II. Stage at diagnosis of cancer for counties is expressed as percentage localized,
regional, distant and unstaged for cancers of the oral cavity and pharynx (both sexes); colon and rectum (both sexes); melanoma and the skin (both sexes); and for invasive cervix and prostate. Female breast cancer incidence data are displayed with in situ stage in addition to localized, regional, distant and unstaged stage categories. Data by race and Hispanic ethnicity are available for the selected counties.
Section III. In separate tables for each of the state’s counties, cancer incidence data are
presented for all sites combined, the sites in Sections I‐II, as well as additional cancer sites included in the county‐level public data set for 2012 – 2016. Since the incidence for female breast cancer in situ is highly correlated with mammography screening usage, it also is reported in the section. All tables in the section contain five‐year aggregate incidence counts, average annual age‐adjusted rates and lower and upper 95 percent confidence intervals for each cancer site by sex category for all races.
Section IV. For the 15 above‐mentioned counties with sufficiently large black
populations, tables in the same format as Section III are presented for whites and blacks.

2
Section V. For the five above‐mentioned counties with sufficiently large Hispanic populations, tables in the same format as Section III are presented for Hispanics (of any race) and non‐Hispanics (of any race). TECHNICAL NOTES Data Sources Cancer Incidence Cancer incidence data are from the Illinois Department of Public Health, Illinois State Cancer Registry (ISCR), the only source of population‐based cancer incidence data for the state. Identification of cancer cases in the ISCR is dependent upon reporting by hospitals, free‐standing clinics, radiation treatment facilities, laboratories and physician offices, as mandated by state law. All newly diagnosed cancer cases among Illinois residents are reported to ISCR by these reporting sources. In addition, ISCR has agreements with other central registries to send back Illinois cancer data that are identified outside of the state. These registries include Arkansas, California, Florida, Indiana, Iowa, Kentucky, Michigan, Mississippi (through August of 2004), Missouri, North Carolina, Washington, Wisconsin, Wyoming (through February 2008), and the Mayo Clinic in Minnesota (through October 2005).
Completeness of out‐of‐state reporting depends upon the years of operation of these
other central registries, the extent of their identification of out‐of‐state residents and their standards of quality.1 For data used in this publication, 6.9 percent of ISCR cases were reported from out‐of‐state agencies and organizations.
A death certificate clearance process has been employed since August 1993. The
process involves follow back of cancer deaths in an effort to identify the cases not reported to ISCR. Between 2012 and 2016, 1.6 percent of reported cases were identified from death certificate clearance.
The preparation and release of data used for this report is dependent on the completion
of annual reporting by Illinois facilities. Although case reporting is mandated within six months of diagnosis, it has been the ISCR policy to keep database files open for late reporting of cases and to allow for the two‐ to four‐year lag in case identification of Illinois residents from other state central cancer registries. This practice is consistent with data published nationally. For this report, the database files reflect the status of ISCR as November 2018.
Data Use Agreement
By using these data contained in this report, you signify your agreement to comply with the following statutorily based requirements.

3
The Illinois Health and Hazardous Substances Registry Act (410 ILCS 525/12) provides data collected by the Illinois State Cancer Registry be made available to the public; however, the identification or contact of individuals is prohibited.
In an effort to exclude identifying information on individual patients, the data (e.g., age, race, Hispanic ethnicity, year of diagnosis and type of cancer) have been reported in aggregate categories, the number of which depends on the size of the geographic area.
These data are provided as a public service for the purpose of statistical reporting and analysis only. There should be no attempt to learn the identity of any person included in these data. If the identity of any person is discovered inadvertently, no disclosure or other use of the identity will be made.
Uses of these data do not constitute an endorsement of the user's opinion or conclusions by the Department and none should be inferred.
Population Estimates
Age‐, sex‐, and race/ethnicity‐specific population counts for Illinois and Illinois counties for each year were obtained from the Vintage 2017 bridged‐race postcensal population estimates files. Population estimates by age, sex, race and Hispanic origin were produced by the United States Bureau of Census Population Estimates Program (http://www.census.gov/programs‐surveys/popest.html), in collaboration with the National Center for Health Statistics. The population estimates used in this report incorporate Vintage 2017 bridged single‐race estimates (for 2012‐2016) are derived from the original multiple race categories in the 2010 Census (as specified in the 1997 Office of Management and Budget standards for the collection of data on race and ethnicity). The bridged single‐race estimates and a description of the methodology used to develop them appear on the National Center for Health Statistics website (http://www.cdc.gov/nchs/nvss/bridged_race.htm).
Population estimates utilized prior to the availability of the 2010 census data were
prone to increased error as the time from the actual 2000 census increased. At the national level, estimates using both the 2000 census and the 2010 census are not very different from the previous estimates. However, there are more significant differences at the state and county levels that may result in changes to cancer incidence rates when one compares this report to earlier versions. In addition, differences in incidence rates may not solely be the result of changes in population estimates. Changes in rates also could be attributable to the addition of cases reported late. Definitions

4
Cancer Incidence Sites All cases diagnosed during 2012 through 2016 were reported with The International
Classification of Diseases for Oncology version 3 (ICD‐O‐3) codes.3 Cancer sites in this report were grouped according to site group definitions established by the Surveillance Epidemiology and End Results (SEER) program of NCI4 and also are used by the North American Association of Central Cancer Registries (NAACCR). These standardized classification schemes allow direct comparisons of Illinois data with international, national and state publications.4‐6 The ISCR cancer site groups used in the county tables are listed in Appendix B.
Beginning with the 1998‐2002 report and continuing through this year’s report, both Kaposi sarcoma and mesothelioma were classified as separate site groups. Compared to using the previous site grouping method, this change has a slight impact on cancer incidence rates for a few specific cancers. However, due to small numbers of cases at the county level, these two sites are not shown in this report.
When comparing this report to the ones published before the 2001‐2005 county report,
it should be noted that several cancers that previously were not coded as malignant in ICD‐O‐2 (used in diagnoses prior to 2001) are coded as malignant in ICD‐O‐3 (beginning with 2001 diagnoses). For example, myeolodysplastic syndrome (MDS) and chronic myeloproliferative disease (CMPD) are considered malignant cancer in ICD‐O‐3, so are papillary ependymomas and papillary meningiomas which, according to ICD‐O‐3, are included in the “brain and other nervous system” and “all sites” categories. Some endometrial tumors also are classified as malignant in ICD‐O‐3. Conversely, some low malignant potential tumors of the ovary and pilocytic astrocytomas are no longer coded as malignant in ICD‐O‐3. Because of the way cancers are grouped in this report, these changes would have a slight or small impact on incidence of a specific cancer site; however, it might result in a noticeable increase in cancer incidence rates for “all sites” or for “all other sites.”
The ICD‐O‐3 recode with adjustment for WHO 2008 hematopoietic histologies was first
used in the 2006‐2010 report and continues to be used in subsequent reports. SEER‐NCI recommends this site recode scheme (Site Recode ICD‐O‐3/WHO 2008) be used for any data containing cases diagnosed in 2010 or later years. In the interests of comparability to other national, state and registry specific data subsequent versions of this report containing cases diagnosed in 2010 or later will indeed use the SEER Site Recode ICD‐O‐3/WHO 2008.
Counts and rates were calculated only for invasive cancers with the exception of
carcinoma in situ occurring in the urinary bladder. Counts and rates for carcinoma in situ of the breast are displayed separately in tables, but were not included in the calculation of counts or incidence rates for all sites combined.

5
Incidence Rates Rates are expressed per 100,000 population and are age‐adjusted by the direct method
to the 2000 U.S. standard million population. The SEER*Stat® software package, developed by Information Management Services Inc. for the NCI, was used to calculate average annual age‐adjusted cancer incidence rates for 2012 – 2016.7 Rates are rounded to the nearest 10th and very small rates (e.g., 0.04) are shown as 0.0. Rates are presented with the lower and upper confidence intervals computed at the 95 percent level using Tiwari method.8 The formulas for rate calculations are displayed in Appendix C. Race Categories
The race‐specific categories in this report are all races for Illinois and all 102 counties. Data for whites and blacks are presented for Illinois and 15 counties (Champaign, Cook, DuPage, Kane, Kankakee, Lake, Macon, Madison, Peoria, Rock Island, St. Clair, Sangamon, Vermilion, Will and Winnebago) with sufficient black population estimates and annual cancer incidence for blacks to allow for stable statistics. Cases reported as “other” or “unknown” race are included in the “all races” category.
To improve the identification and surveillance of American Indians and Alaska Natives
diagnosed with cancer and to be consistent with the national data, cancer incidence data since 1995 were linked to the Indian Health Service (IHS), which provides medical services to an estimated 55 percent of the American Indian/Alaska Native population.9 If a race code in the ISCR database is white, black, other or unknown and the IHS link is positive, then the race code is re‐categorized to American Indian/Alaskan Native, otherwise the race code stays unchanged. This practice has minimal impact on the incidence rates for whites or blacks due to the small number of cases affected. Hispanic Ethnicity Categories
Through the use of the NAACCR Hispanic identification algorithm (NHIA) improvements have been made in classifying cases as Hispanic or Latino for diagnosis years 1990 through 2016.10 NHIA is a generally reliable method to enhance the ethnic identification of the Latino population in the United States.11 Cases that meet certain criteria around race and birthplace, and who are also identified as non‐Hispanic, Hispanic not otherwise specified, Spanish surname only, and unknown ethnicity are examined. Through the use of race, birthplace, last name, first name and maiden name, NHIA assigns a more specific and sometimes different ethnicity to these cases.
The Hispanic ethnicity‐specific categories are presented in this report for Illinois and five
counties (Cook, DuPage, Kane, Lake and Will) with sufficient Hispanic population estimates and annual cancer incidence for Hispanics to allow meaningful statistics. To be consistent with national data, cases reported as “unknown” ethnicity are included in the non‐Hispanic category.4‐6

6
Quality Control Ongoing quality control procedures are integral components of ISCR operations that
assure high quality cancer incidence data.12 In 1997, NAACCR developed a certification process that reviews registry data for completeness, accuracy and timeliness of reporting (starting with cases diagnosed in 1995). ISCR has submitted data each year to the NAACCR for registry certification. Based on the certification criteria shown in the following table, ISCR has been awarded gold certification for diagnosis years 1996‐2015. The table below shows the criteria used for silver and gold certification. Completeness
(NAACCR Method)
Pass EDITS DCO Timeliness
Unresolved Duplicate
Missing Data Fields Certification
Status Sex Age County Race
90% 97% 5% Within 23 months 2/1000 3% 3% 3% 5% SILVER
95% 100% 3% Within 23 months 1/1000 2% 2% 2% 3% GOLD
Constantly updating registry data is a standard operation in ISCR. As of November 2018,
ISCR quality control data for the diagnosis years considered in this report (2012 – 2016) are as follows:
Year Completeness
(NAACCR Method‐ As of 11‐18) Pass EDITS DCO
Unresolved Duplicate Per 1,000
Missing Data Fields
Sex Age County Race
2012 100% 100% 0.9% 0.2 0.0% 0.0% 0.0% 1.2%
2013 100% 100% 1.0% 0.2 0.0% 0.0% 0.0% 1.0%
2014 100% 100% 2.1% 0.2 0.0% 0.0% 0.0% 1.4%
2015 100% 100% 2.2% 0.9 0.0% 0.0% 0.0% 1.3%
2016 100% 100% 2.2% 0.9 0.0% 0.0% 0.0% 1.1%
Data Interpretation
Observed differences in cancer incidence among counties may be real, reflecting differences in risk factor modifications or consequences of screening and early detection programs within the county. However, county cancer incidence differences also could be the result of other factors. Any conclusions should be made only after carefully considering the following factors that influence the average annual age‐adjusted cancer incidence rates:
Aggregate cancer case counts for 2012 – 2016 produce more stable age‐adjusted cancer incidence rates than those calculated for an individual year. Counties with smaller populations and smaller numbers of cancer incidence cases will still have less stable age‐adjusted rates than larger counties or the entire state. Where the number of cases is less than or equal to 16, the relative standard error for the rate in these instances is equal to or exceeds 25 percent. At this level, interpretation of the rate is limited by excessive uncertainty and these rates should be evaluated cautiously.

7
The 95 percent confidence intervals are included with reported rates to help put the rate in perspective and to facilitate county comparisons. Observed differences may not be statistically significant. The range between the lower confidence interval and the upper confidence interval defines with 95 percent probability where the “true” rate for the county or the state may fall. The comparison of two sets of confidence intervals is approximately equivalent to statistical significance tests for differences between two county rates and is more conservative than the standard significance test when the null hypothesis is true.13
Population estimates used for denominators may be inaccurate. These data are estimates based on demographic characteristics of the population rather than actual counts. Incidence rates produced using these population estimates would be expected to exhibit more error than those calculated using 2010 census population counts. Also, please keep in mind when comparing this report to earlier versions, the methods for developing the population estimates have changed and denominator data will lack comparability. Ensuring the same estimate methods (e.g., revised intercensal estimates and Vintage 2017) are used across the time period being examined accounts for this issue.

8
REFERENCES
1. Lehnherr M, Havener LA. Assessment of interstate exchange of cancer data, 1986 –
1998. ISCR Quality Control Series 02:1. Springfield, Ill.: Illinois Department of Public Health, January 2002.
2. The Population Estimates Program, U.S. Census Bureau. Release notes Vintage 2017. U.S. Census Bureau . https://www2.census.gov/programs‐surveys/popest/technical‐documentation/methodology/2010‐2017/2017‐est‐relnotes.pdf Accessed June 28, 2019.
3. Fritz A, Percy C, Jack A, Shanmugaratnam K, Sobin L, Parkin DM, Whelan S (eds). International Classification of Diseases for Oncology. 3rd edition. Geneva: World Health Organization, 2000.
4. Howlander N, Noone AM, Krapcho M, et al (eds). SEER Cancer Statistics Review, 1975‐2016, National Cancer Institute. Bethesda, Md., https://seer.cancer.gov/csr/1975_2016/, based on November 2018 SEER data submission, posted to the SEER website, April 2019.
5. Sherman R, Firth R, De P, et al (eds). Cancer in North America: 2012‐2016. Volume One: Combined Cancer Incidence for the United States,Canada, and North America. Springfield, Ill.: North American Association of Central Cancer Registries, Inc. May 2019.
6. Sherman R, Firth R, De P, et al (eds). Cancer in North America: 2012‐2016. Volume Two: Registry‐specific Cancer Incidence in the United States and Canada. Springfield, Ill.: North American Association of Central Cancer Registries, Inc. May 2019.
7. Surveillance Research Program, National Cancer Institute SEER*Stat software (seer.cancer.gov/seerstat) version 8.352, March 5, 2018.
8. Tiwari RC, Clegg LX, Zou Z. Efficient interval estimation for age‐adjusted cancer rates. Stat Methods Med Res 2006;15(6):547‐569.
9. Espey DK, Wiggins CL, Jim MA, Miller BA, Johnson CJ, Becker TM. Methods for improving cancer surveillance data in American Indian and Alaska Native populations. Cancer 2008; 113(5 Suppl):1120‐1130.
10. NAACCR Expert Panel in Hispanic Identification. Report of the Expert Panel on Hispanic Identification 2003. Springfield, Ill: North American Association of Central Cancer Registries, October 2003.

9
11. Howe HL. Evaluation of NHIA Submission for 1997‐2001. Springfield, Ill: North American Association of Central Cancer Registries, October 2004.
12. Hofferkamp, J (Ed). Standards for Cancer Registries Volume III: Standards for
Completeness, Quality, Analysis, Management, Security and Confidentiality of Data. Springfield Ill.: North American Association of Central Cancer Registries, August 2008.
13. Schenke N, Gentleman JF. On judging the significance of differences by examining the
overlap between confidence intervals. The American Statistician 2001;55:182‐1.

SECTION I
Cancer Incidence Rates for Selected Sites by County and Race
Illinois, 2012-2016
I - 1
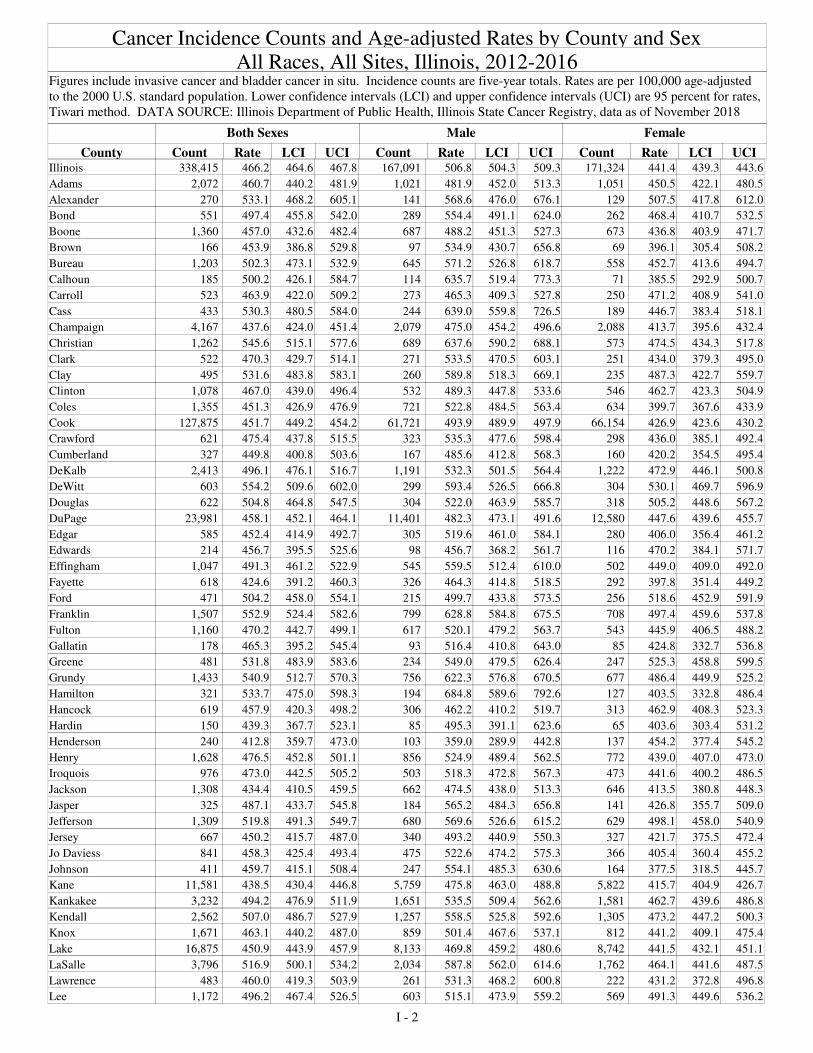
All Races, All Sites, Illinois, 2012-2016Figures include invasive cancer and bladder cancer in situ. Incidence counts are five-year totals. Rates are per 100,000 age-adjusted
to the 2000 U.S. standard population. Lower confidence intervals (LCI) and upper confidence intervals (UCI) are 95 percent for rates,
Tiwari method. DATA SOURCE: Illinois Department of Public Health, Illinois State Cancer Registry, data as of November 2018
County Count Rate LCI UCI Count Rate LCI UCI Count Rate LCI UCI
Both Sexes Male Female
Cancer Incidence Counts and Age-adjusted Rates by County and Sex
Illinois 338,415 466.2 464.6 467.8 167,091 506.8 504.3 509.3 171,324 441.4 439.3 443.6
Adams 2,072 460.7 440.2 481.9 1,021 481.9 452.0 513.3 1,051 450.5 422.1 480.5
Alexander 270 533.1 468.2 605.1 141 568.6 476.0 676.1 129 507.5 417.8 612.0
Bond 551 497.4 455.8 542.0 289 554.4 491.1 624.0 262 468.4 410.7 532.5
Boone 1,360 457.0 432.6 482.4 687 488.2 451.3 527.3 673 436.8 403.9 471.7
Brown 166 453.9 386.8 529.8 97 534.9 430.7 656.8 69 396.1 305.4 508.2
Bureau 1,203 502.3 473.1 532.9 645 571.2 526.8 618.7 558 452.7 413.6 494.7
Calhoun 185 500.2 426.1 584.7 114 635.7 519.4 773.3 71 385.5 292.9 500.7
Carroll 523 463.9 422.0 509.2 273 465.3 409.3 527.8 250 471.2 408.9 541.0
Cass 433 530.3 480.5 584.0 244 639.0 559.8 726.5 189 446.7 383.4 518.1
Champaign 4,167 437.6 424.0 451.4 2,079 475.0 454.2 496.6 2,088 413.7 395.6 432.4
Christian 1,262 545.6 515.1 577.6 689 637.6 590.2 688.1 573 474.5 434.3 517.8
Clark 522 470.3 429.7 514.1 271 533.5 470.5 603.1 251 434.0 379.3 495.0
Clay 495 531.6 483.8 583.1 260 589.8 518.3 669.1 235 487.3 422.7 559.7
Clinton 1,078 467.0 439.0 496.4 532 489.3 447.8 533.6 546 462.7 423.3 504.9
Coles 1,355 451.3 426.9 476.9 721 522.8 484.5 563.4 634 399.7 367.6 433.9
Cook 127,875 451.7 449.2 454.2 61,721 493.9 489.9 497.9 66,154 426.9 423.6 430.2
Crawford 621 475.4 437.8 515.5 323 535.3 477.6 598.4 298 436.0 385.1 492.4
Cumberland 327 449.8 400.8 503.6 167 485.6 412.8 568.3 160 420.2 354.5 495.4
DeKalb 2,413 496.1 476.1 516.7 1,191 532.3 501.5 564.4 1,222 472.9 446.1 500.8
DeWitt 603 554.2 509.6 602.0 299 593.4 526.5 666.8 304 530.1 469.7 596.9
Douglas 622 504.8 464.8 547.5 304 522.0 463.9 585.7 318 505.2 448.6 567.2
DuPage 23,981 458.1 452.1 464.1 11,401 482.3 473.1 491.6 12,580 447.6 439.6 455.7
Edgar 585 452.4 414.9 492.7 305 519.6 461.0 584.1 280 406.0 356.4 461.2
Edwards 214 456.7 395.5 525.6 98 456.7 368.2 561.7 116 470.2 384.1 571.7
Effingham 1,047 491.3 461.2 522.9 545 559.5 512.4 610.0 502 449.0 409.0 492.0
Fayette 618 424.6 391.2 460.3 326 464.3 414.8 518.5 292 397.8 351.4 449.2
Ford 471 504.2 458.0 554.1 215 499.7 433.8 573.5 256 518.6 452.9 591.9
Franklin 1,507 552.9 524.4 582.6 799 628.8 584.8 675.5 708 497.4 459.6 537.8
Fulton 1,160 470.2 442.7 499.1 617 520.1 479.2 563.7 543 445.9 406.5 488.2
Gallatin 178 465.3 395.2 545.4 93 516.4 410.8 643.0 85 424.8 332.7 536.8
Greene 481 531.8 483.9 583.6 234 549.0 479.5 626.4 247 525.3 458.8 599.5
Grundy 1,433 540.9 512.7 570.3 756 622.3 576.8 670.5 677 486.4 449.9 525.2
Hamilton 321 533.7 475.0 598.3 194 684.8 589.6 792.6 127 403.5 332.8 486.4
Hancock 619 457.9 420.3 498.2 306 462.2 410.2 519.7 313 462.9 408.3 523.3
Hardin 150 439.3 367.7 523.1 85 495.3 391.1 623.6 65 403.6 303.4 531.2
Henderson 240 412.8 359.7 473.0 103 359.0 289.9 442.8 137 454.2 377.4 545.2
Henry 1,628 476.5 452.8 501.1 856 524.9 489.4 562.5 772 439.0 407.0 473.0
Iroquois 976 473.0 442.5 505.2 503 518.3 472.8 567.3 473 441.6 400.2 486.5
Jackson 1,308 434.4 410.5 459.5 662 474.5 438.0 513.3 646 413.5 380.8 448.3
Jasper 325 487.1 433.7 545.8 184 565.2 484.3 656.8 141 426.8 355.7 509.0
Jefferson 1,309 519.8 491.3 549.7 680 569.6 526.6 615.2 629 498.1 458.0 540.9
Jersey 667 450.2 415.7 487.0 340 493.2 440.9 550.3 327 421.7 375.5 472.4
Jo Daviess 841 458.3 425.4 493.4 475 522.6 474.2 575.3 366 405.4 360.4 455.2
Johnson 411 459.7 415.1 508.4 247 554.1 485.3 630.6 164 377.5 318.5 445.7
Kane 11,581 438.5 430.4 446.8 5,759 475.8 463.0 488.8 5,822 415.7 404.9 426.7
Kankakee 3,232 494.2 476.9 511.9 1,651 535.5 509.4 562.6 1,581 462.7 439.6 486.8
Kendall 2,562 507.0 486.7 527.9 1,257 558.5 525.8 592.6 1,305 473.2 447.2 500.3
Knox 1,671 463.1 440.2 487.0 859 501.4 467.6 537.1 812 441.2 409.1 475.4
Lake 16,875 450.9 443.9 457.9 8,133 469.8 459.2 480.6 8,742 441.5 432.1 451.1
LaSalle 3,796 516.9 500.1 534.2 2,034 587.8 562.0 614.6 1,762 464.1 441.6 487.5
Lawrence 483 460.0 419.3 503.9 261 531.3 468.2 600.8 222 431.2 372.8 496.8
Lee 1,172 496.2 467.4 526.5 603 515.1 473.9 559.2 569 491.3 449.6 536.2
I - 2

All Races, All Sites, Illinois, 2012-2016Figures include invasive cancer and bladder cancer in situ. Incidence counts are five-year totals. Rates are per 100,000 age-adjusted
to the 2000 U.S. standard population. Lower confidence intervals (LCI) and upper confidence intervals (UCI) are 95 percent for rates,
Tiwari method. DATA SOURCE: Illinois Department of Public Health, Illinois State Cancer Registry, data as of November 2018
County Count Rate LCI UCI Count Rate LCI UCI Count Rate LCI UCI
Both Sexes Male Female
Cancer Incidence Counts and Age-adjusted Rates by County and Sex
Livingston 1,263 521.6 492.4 552.2 651 570.1 526.2 616.8 612 488.3 448.6 530.7
Logan 1,081 565.5 531.5 601.1 548 632.8 580.1 689.1 533 520.7 475.5 569.3
Macon 3,928 547.9 530.2 566.0 1,991 604.7 577.7 632.7 1,937 509.7 486.0 534.4
Macoupin 1,588 497.4 472.4 523.5 863 574.8 536.1 615.7 725 438.9 405.9 474.2
Madison 7,963 487.3 476.4 498.4 3,821 516.2 499.6 533.3 4,142 474.4 459.6 489.6
Marion 1,383 532.6 503.8 562.6 752 614.2 570.0 661.1 631 471.3 433.1 512.1
Marshall 460 500.6 453.8 551.4 247 564.0 493.7 642.7 213 453.6 390.8 524.8
Mason 498 485.2 441.7 532.3 258 517.0 454.2 587.0 240 469.2 408.0 537.8
Massac 476 464.1 421.9 509.9 248 512.8 449.5 583.2 228 428.9 372.0 492.7
McDonough 869 487.8 454.4 523.2 409 498.7 450.0 551.5 460 491.1 444.0 542.0
McHenry 7,561 456.0 445.4 466.8 3,671 478.7 462.4 495.3 3,890 444.5 430.3 459.1
McLean 3,878 463.3 448.5 478.5 1,924 502.4 479.5 526.1 1,954 439.2 419.4 459.6
Menard 444 521.9 472.5 575.4 231 595.0 517.6 681.3 213 467.6 404.1 539.2
Mercer 545 477.6 436.6 521.7 281 498.6 440.2 563.4 264 466.7 408.9 531.1
Monroe 939 443.5 414.8 473.7 479 471.8 429.2 517.7 460 424.3 385.1 466.7
Montgomery 995 497.0 465.7 530.0 535 566.2 518.6 617.4 460 449.9 407.0 496.4
Morgan 1,233 537.6 507.0 569.8 650 607.7 560.8 657.7 583 493.8 452.0 538.6
Moultrie 448 480.9 435.8 529.6 232 534.3 466.2 610.0 216 440.1 380.4 507.0
Ogle 1,547 465.1 441.6 489.6 765 474.8 440.9 510.7 782 463.5 430.5 498.6
Peoria 5,412 494.3 480.9 508.0 2,742 546.5 525.8 567.9 2,670 458.3 440.4 476.7
Perry 662 478.2 441.7 517.2 337 504.0 450.8 562.1 325 474.4 421.1 533.1
Piatt 553 494.9 453.2 539.7 286 532.4 470.9 600.3 267 466.7 409.9 529.8
Pike 563 504.2 461.7 550.0 288 543.2 480.8 612.0 275 486.1 426.0 552.9
Pope 172 504.6 424.1 598.1 102 603.5 478.5 754.7 70 402.1 307.1 524.5
Pulaski 219 530.1 458.7 610.6 120 625.8 513.6 757.4 99 455.6 365.2 563.8
Putnam 202 438.9 377.8 508.5 122 561.7 461.9 679.4 80 343.1 268.0 436.4
Randolph 1,068 489.6 460.0 520.8 565 538.5 494.1 586.0 503 476.0 432.4 523.1
Richland 545 496.1 453.8 541.5 276 523.1 462.2 590.5 269 483.9 424.5 549.8
Rock Island 4,284 452.5 438.6 466.7 2,166 488.7 467.9 510.3 2,118 431.0 411.9 450.8
Saline 840 501.3 466.8 537.9 428 558.9 505.7 616.4 412 460.8 415.1 510.4
Sangamon 6,439 528.7 515.5 542.1 3,182 583.7 563.0 605.0 3,257 492.3 474.9 510.2
Schuyler 264 497.0 437.0 563.8 156 577.4 488.2 680.2 108 424.3 343.9 519.8
Scott 202 547.5 472.8 632.0 97 560.7 453.0 689.1 105 553.7 448.3 678.9
Shelby 765 475.1 440.6 512.0 403 513.6 463.4 568.2 362 449.8 401.5 502.8
St Clair 7,195 475.5 464.3 486.8 3,488 514.1 496.6 532.0 3,707 450.7 436.0 465.9
Stark 190 473.7 405.2 551.4 103 530.8 429.4 651.2 87 434.9 341.5 547.6
Stephenson 1,411 421.7 398.8 445.6 669 425.5 392.9 460.4 742 425.4 393.0 460.0
Tazewell 4,308 500.8 485.6 516.4 2,134 531.7 508.9 555.3 2,174 483.7 462.8 505.4
Union 647 517.9 477.3 561.4 336 551.9 492.7 616.9 311 491.4 435.4 553.1
Vermilion 2,668 512.1 492.3 532.6 1,384 565.9 535.8 597.3 1,284 476.5 449.5 504.8
Wabash 381 462.3 415.3 513.7 202 533.5 460.5 615.7 179 400.2 340.4 468.7
Warren 533 483.0 441.1 527.9 277 517.3 456.5 584.4 256 471.0 411.1 537.3
Washington 481 487.6 443.8 535.0 265 556.9 490.1 631.0 216 426.7 369.5 491.0
Wayne 568 473.3 433.8 515.8 301 525.0 466.1 589.9 267 438.3 384.2 498.4
White 543 507.2 463.7 554.2 282 562.0 496.8 634.4 261 470.9 411.8 537.0
Whiteside 1,866 474.2 452.2 497.2 987 534.1 500.4 569.5 879 427.5 398.2 458.5
Will 16,675 491.9 484.3 499.7 8,352 540.7 528.6 553.1 8,323 458.8 448.9 469.0
Williamson 2,274 519.5 497.8 541.8 1,169 568.8 536.0 603.2 1,105 485.0 455.7 515.7
Winnebago 8,339 475.9 465.5 486.5 4,060 499.0 483.4 515.1 4,279 464.8 450.5 479.5
Woodford 1,102 451.9 424.8 480.3 607 521.1 479.3 565.7 495 395.3 359.8 433.5
I - 3

White, All Sites, Illinois, 2012-2016Figures include invasive cancer and bladder cancer in situ. Incidence counts are five-year totals. Rates are per 100,000 age-adjusted
to the 2000 U.S. standard population. Lower confidence intervals (LCI) and upper confidence intervals (UCI) are 95 percent for rates,
Tiwari method. DATA SOURCE: Illinois Department of Public Health, Illinois State Cancer Registry, data as of November 2018
County Count Rate LCI UCI Count Rate LCI UCI Count Rate LCI UCI
Both Sexes Male Female
Cancer Incidence Counts and Age-adjusted Rates by County and Sex
Illinois 279,239 468.3 466.5 470.0 138,308 503.8 501.1 506.5 140,931 447.9 445.5 450.3
Champaign 3,553 439.5 424.8 454.7 1,786 476.0 453.5 499.2 1,767 417.1 397.1 437.9
Cook 86,213 446.0 442.9 449.0 41,928 479.7 475.0 484.5 44,285 428.5 424.4 432.6
DuPage 21,468 474.8 468.3 481.4 10,187 498.3 488.3 508.5 11,281 466.6 457.7 475.6
Kane 10,681 444.5 435.9 453.2 5,304 480.7 467.3 494.3 5,377 423.5 412.1 435.2
Kankakee 2,752 485.2 466.8 504.2 1,398 521.0 493.4 549.7 1,354 459.5 434.6 485.6
Lake 14,988 457.3 449.8 464.9 7,213 472.1 460.8 483.6 7,775 451.8 441.5 462.3
Macon 3,391 546.5 527.3 566.3 1,692 585.4 557.0 615.1 1,699 524.0 497.5 551.6
Madison 7,410 485.6 474.3 497.1 3,568 513.2 496.1 530.8 3,842 474.6 459.1 490.5
Peoria 4,559 489.5 474.9 504.5 2,306 536.0 513.8 558.9 2,253 458.7 438.9 479.1
Rock Island 3,918 451.7 437.1 466.8 1,949 480.3 458.6 502.8 1,969 436.6 416.4 457.6
Sangamon 5,840 528.3 514.4 542.5 2,898 582.5 560.8 604.8 2,942 492.6 474.1 511.6
St Clair 5,293 478.0 464.9 491.5 2,601 511.6 491.6 532.2 2,692 458.0 440.2 476.4
Vermilion 2,428 515.0 493.9 536.8 1,239 555.7 524.4 588.5 1,189 490.1 461.0 520.8
Will 14,359 497.4 489.1 505.8 7,118 538.5 525.5 551.8 7,241 471.5 460.5 482.7
Winnebago 7,446 479.0 467.8 490.3 3,611 496.6 480.1 513.5 3,835 473.3 457.8 489.2
Black, All Sites, Illinois, 2012-2016Figures include invasive cancer and bladder cancer in situ. Incidence counts are five-year totals. Rates are per 100,000 age-adjusted
to the 2000 U.S. standard population. Lower confidence intervals (LCI) and upper confidence intervals (UCI) are 95 percent for rates,
Tiwari method. DATA SOURCE: Illinois Department of Public Health, Illinois State Cancer Registry, data as of November 2018
County Count Rate LCI UCI Count Rate LCI UCI Count Rate LCI UCI
Both Sexes Male Female
Cancer Incidence Counts and Age-adjusted Rates by County and Sex
Illinois 45,715 487.9 483.3 492.5 22,211 566.9 559.1 574.8 23,504 437.9 432.2 443.7
Champaign 442 471.4 425.9 520.2 210 502.6 430.7 582.4 232 447.3 389.2 511.2
Cook 34,209 491.7 486.4 497.1 16,263 571.6 562.6 580.8 17,946 442.4 435.9 449.1
DuPage 747 444.1 408.2 482.1 345 482.3 423.9 546.1 402 411.6 367.3 459.5
Kane 530 424.9 386.8 465.5 283 507.1 443.1 577.2 247 361.9 316.0 412.3
Kankakee 439 567.0 513.2 624.7 230 641.6 556.9 735.2 209 502.4 434.9 577.2
Lake 980 453.0 423.3 484.1 503 523.1 473.1 576.7 477 402.1 365.5 441.2
Macon 470 555.1 504.0 609.8 264 747.1 650.9 852.6 206 426.9 369.2 490.9
Madison 469 526.9 478.1 579.1 213 557.6 480.1 643.3 256 504.4 442.2 572.5
Peoria 711 533.2 492.5 576.2 367 632.8 564.7 706.4 344 460.7 411.1 514.4
Rock Island 251 405.1 354.6 460.4 142 472.8 393.6 562.4 109 345.4 281.6 418.6
Sangamon 525 571.6 520.4 626.0 252 650.4 561.3 748.6 273 530.4 466.5 600.2
St Clair 1,782 468.4 446.3 491.4 839 517.4 481.1 555.6 943 436.0 408.0 465.4
Vermilion 197 483.5 415.6 558.9 122 682.1 558.0 823.6 75 344.0 268.5 433.4
Will 1,632 495.8 469.5 523.0 892 629.9 582.4 679.9 740 401.3 370.9 433.5
Winnebago 762 508.3 471.1 547.5 382 587.0 524.4 654.7 380 455.1 409.1 504.6
I - 4

Hispanic, All Sites, Illinois, 2012-2016Figures include invasive cancer and bladder cancer in situ. Incidence counts are five-year totals. Rates are per 100,000 age-adjusted
to the 2000 U.S. standard population. Lower confidence intervals (LCI) and upper confidence intervals (UCI) are 95 percent for rates,
Tiwari method. DATA SOURCE: Illinois Department of Public Health, Illinois State Cancer Registry, data as of November 2018
County Count Rate LCI UCI Count Rate LCI UCI Count Rate LCI UCI
Both Sexes Male Female
Cancer Incidence Counts and Age-adjusted Rates by County and Sex
Illinois 21,780 344.5 339.5 349.6 10,353 362.5 354.6 370.6 11,427 336.6 330.0 343.3
Cook 14,391 344.9 338.8 351.1 6,911 364.6 355.0 374.3 7,480 334.8 326.9 342.9
DuPage 1,295 376.6 353.4 400.8 562 376.7 340.5 415.4 733 386.8 356.2 419.2
Kane 1,304 318.2 298.2 339.0 620 343.4 311.4 377.5 684 303.4 278.0 330.3
Lake 1,193 318.9 297.7 341.0 550 336.9 303.0 373.0 643 310.2 283.1 338.9
Will 1,164 399.8 373.8 426.9 530 420.3 378.9 464.4 634 394.1 360.6 429.6
Non-Hispanic, All Sites, Illinois, 2012-2016Figures include invasive cancer and bladder cancer in situ. Incidence counts are five-year totals. Rates are per 100,000 age-adjusted
to the 2000 U.S. standard population. Lower confidence intervals (LCI) and upper confidence intervals (UCI) are 95 percent for rates,
Tiwari method. DATA SOURCE: Illinois Department of Public Health, Illinois State Cancer Registry, data as of November 2018
County Count Rate LCI UCI Count Rate LCI UCI Count Rate LCI UCI
Both Sexes Male Female
Cancer Incidence Counts and Age-adjusted Rates by County and Sex
Illinois 316,635 478.4 476.7 480.1 156,738 520.7 518.1 523.4 159,897 451.9 449.6 454.2
Cook 113,484 470.0 467.2 472.8 54,810 516.3 511.9 520.7 58,674 442.2 438.5 445.9
DuPage 22,686 464.9 458.7 471.2 10,839 490.5 481.0 500.2 11,847 453.0 444.6 461.5
Kane 10,277 464.8 455.6 474.2 5,139 502.7 488.5 517.2 5,138 441.3 428.9 454.0
Lake 15,682 465.2 457.7 472.8 7,583 483.9 472.6 495.4 8,099 455.7 445.5 466.1
Will 15,511 500.0 491.9 508.1 7,822 551.6 538.9 564.6 7,689 463.9 453.4 474.6
I - 5

All Races, Oral Cavity and Pharynx, Illinois, 2012-2016Figures include invasive cancer and bladder cancer in situ. Incidence counts are five-year totals. Rates are per 100,000 age-adjusted
to the 2000 U.S. standard population. Lower confidence intervals (LCI) and upper confidence intervals (UCI) are 95 percent for rates,
Tiwari method. DATA SOURCE: Illinois Department of Public Health, Illinois State Cancer Registry, data as of November 2018
County Count Rate LCI UCI Count Rate LCI UCI Count Rate LCI UCI
Both Sexes Male Female
Cancer Incidence Counts and Age-adjusted Rates by County and Sex
Illinois 8,977 12.1 11.8 12.3 6,339 18.3 17.9 18.8 2,638 6.7 6.4 7.0
Adams 48 10.5 7.6 14.2 34 15.5 10.6 22.1 14 6.2 3.2 10.9
Alexander 8 13.7 5.9 29.4 5 17.1 5.5 46.1 3 10.3 2.1 35.9
Bond 14 11.5 6.2 20.0 12 20.7 10.6 37.4 2 3.0 0.4 13.6
Boone 38 12.4 8.7 17.1 31 21.3 14.2 30.7 7 4.8 1.9 10.1
Brown 5 13.1 4.3 32.0 3 19.3 3.8 56.1 2 10.1 1.2 46.0
Bureau 28 11.1 7.2 16.5 20 16.7 10.1 26.6 8 6.7 2.7 14.2
Calhoun 4 10.0 2.6 30.2 3 15.8 3.2 54.9 1 3.2 0.1 36.5
Carroll 16 15.2 8.4 25.9 9 16.0 7.1 33.0 7 14.2 5.3 31.9
Cass 14 16.7 9.0 28.8 13 31.8 16.7 55.8 1 1.4 0.0 13.1
Champaign 98 10.4 8.4 12.7 69 15.9 12.3 20.2 29 5.6 3.7 8.2
Christian 33 13.6 9.3 19.5 24 20.6 13.0 31.4 9 6.2 2.8 12.9
Clark 16 14.3 7.9 24.3 10 21.7 10.0 41.3 6 8.1 2.9 20.3
Clay 19 21.7 12.8 34.8 13 31.3 16.4 55.1 6 13.0 4.4 30.7
Clinton 31 13.6 9.2 19.6 19 17.6 10.5 27.8 12 10.0 5.0 18.2
Coles 42 13.7 9.8 18.8 36 25.6 17.7 35.9 6 3.4 1.2 8.0
Cook 3,232 11.2 10.8 11.6 2,243 17.2 16.5 18.0 989 6.3 5.9 6.7
Crawford 13 9.3 4.9 16.5 9 13.3 6.1 26.4 4 4.8 1.3 14.9
Cumberland 13 17.8 9.1 31.7 8 23.3 9.6 48.4 5 12.1 3.8 31.5
DeKalb 56 10.5 7.9 13.7 34 13.2 9.0 18.6 22 8.0 5.0 12.3
DeWitt 15 13.3 7.3 22.8 7 14.1 5.6 30.4 8 12.8 5.5 27.2
Douglas 12 10.2 5.1 18.4 9 15.5 6.9 30.4 3 5.9 1.1 17.7
DuPage 619 11.4 10.5 12.4 433 17.2 15.5 18.9 186 6.6 5.6 7.6
Edgar 17 15.3 8.6 25.5 9 15.2 6.7 30.7 8 16.0 6.3 33.2
Edwards 4 8.9 2.3 25.2 3 13.3 2.5 44.2 1 3.5 0.1 27.8
Effingham 28 12.7 8.3 18.7 21 20.1 12.2 31.5 7 5.6 2.2 12.3
Fayette 29 18.8 12.6 27.5 24 32.0 20.4 48.4 5 6.3 2.0 16.2
Ford 13 12.4 6.5 22.3 9 20.9 9.4 41.2 4 5.4 1.3 18.5
Franklin 45 15.9 11.5 21.6 28 20.3 13.4 29.9 17 11.5 6.6 19.3
Fulton 35 14.5 10.0 20.5 29 24.6 16.4 35.8 6 5.6 1.9 13.0
Gallatin 4 11.0 2.6 31.7 4 22.5 5.5 64.6 0
Greene 15 14.9 8.3 25.6 8 15.8 6.8 33.3 7 13.6 5.2 30.9
Grundy 37 13.5 9.4 18.7 31 24.0 16.0 34.5 6 4.1 1.5 9.3
Hamilton 11 16.7 8.3 31.7 7 23.2 9.2 51.5 4 11.0 3.0 33.5
Hancock 21 15.8 9.5 25.3 10 15.8 7.3 30.7 11 15.6 7.1 30.6
Hardin 3 8.2 1.5 31.4 3 16.9 3.1 62.5 0
Henderson 7 10.8 4.3 26.0 6 18.7 6.7 48.6 1 2.0 0.1 26.2
Henry 60 17.5 13.2 22.8 48 29.1 21.3 39.2 12 6.6 3.3 12.3
Iroquois 30 15.5 10.2 22.8 17 18.0 10.1 30.1 13 13.1 6.6 23.7
Jackson 38 12.6 8.8 17.4 28 19.6 12.8 28.7 10 6.6 3.1 12.4
Jasper 11 16.6 8.0 31.3 8 25.7 10.8 53.1 3 10.4 1.8 33.4
Jefferson 36 14.1 9.8 19.8 26 20.9 13.5 31.2 10 6.4 3.0 12.7
Jersey 24 15.6 9.9 23.8 19 26.9 15.9 43.2 5 5.2 1.7 13.9
Jo Daviess 26 14.4 9.0 22.5 18 19.5 11.1 33.1 8 9.3 3.5 21.2
Johnson 10 11.1 5.2 21.7 6 13.9 4.8 32.3 4 11.1 2.7 31.7
Kane 292 10.4 9.2 11.7 219 16.1 14.0 18.5 73 5.1 4.0 6.5
Kankakee 80 12.2 9.6 15.4 57 18.3 13.7 23.9 23 6.5 4.1 10.0
Kendall 73 13.2 10.2 16.7 53 19.5 14.4 25.8 20 7.2 4.4 11.3
Knox 48 12.6 9.2 17.0 29 16.1 10.7 23.6 19 9.9 5.8 16.1
Lake 436 11.0 9.9 12.1 281 14.7 13.0 16.6 155 7.6 6.4 8.9
LaSalle 109 14.6 11.9 17.8 86 23.9 19.0 29.7 23 6.3 3.8 9.8
Lawrence 9 9.0 4.1 17.6 6 12.8 4.6 28.4 3 5.3 1.1 18.1
Lee 34 14.8 10.1 21.1 27 24.4 15.9 36.0 7 5.8 2.2 13.0
I - 6

All Races, Oral Cavity and Pharynx, Illinois, 2012-2016Figures include invasive cancer and bladder cancer in situ. Incidence counts are five-year totals. Rates are per 100,000 age-adjusted
to the 2000 U.S. standard population. Lower confidence intervals (LCI) and upper confidence intervals (UCI) are 95 percent for rates,
Tiwari method. DATA SOURCE: Illinois Department of Public Health, Illinois State Cancer Registry, data as of November 2018
County Count Rate LCI UCI Count Rate LCI UCI Count Rate LCI UCI
Both Sexes Male Female
Cancer Incidence Counts and Age-adjusted Rates by County and Sex
Livingston 35 13.7 9.5 19.4 26 21.2 13.7 31.6 9 6.3 2.8 13.0
Logan 28 15.5 10.2 22.7 22 26.8 16.7 40.9 6 5.6 1.9 13.4
Macon 130 17.7 14.7 21.2 85 25.0 19.8 31.3 45 11.3 8.1 15.4
Macoupin 45 14.3 10.3 19.4 38 25.7 18.0 35.8 7 3.9 1.5 8.8
Madison 215 12.7 11.0 14.6 145 18.1 15.2 21.4 70 8.2 6.3 10.4
Marion 28 10.4 6.9 15.3 22 17.4 10.8 26.9 6 4.2 1.5 9.9
Marshall 16 19.0 10.4 32.5 12 29.3 14.7 53.8 4 10.6 2.3 30.8
Mason 16 18.0 9.8 30.7 11 25.7 12.4 47.9 5 11.4 2.9 30.0
Massac 14 13.5 7.2 23.5 11 22.6 11.1 42.1 3 5.3 1.1 17.8
McDonough 25 15.1 9.5 22.8 19 24.9 14.6 39.8 6 6.7 2.2 15.8
McHenry 204 11.3 9.8 13.1 150 17.3 14.5 20.5 54 5.9 4.4 7.8
McLean 110 13.2 10.8 16.0 67 17.0 13.1 21.7 43 10.1 7.2 13.6
Menard 14 18.1 9.5 31.6 12 33.1 16.3 60.3 2 4.3 0.5 18.7
Mercer 17 14.1 8.1 23.5 14 23.4 12.6 41.3 3 5.0 0.9 17.4
Monroe 46 20.8 15.1 28.2 35 33.0 22.7 46.7 11 9.7 4.7 18.2
Montgomery 40 20.0 14.2 27.6 31 32.4 21.9 46.6 9 7.9 3.3 16.6
Morgan 40 18.4 13.0 25.5 23 23.2 14.5 35.2 17 14.5 8.1 24.2
Moultrie 13 14.9 7.7 26.1 13 31.0 16.1 54.3 0
Ogle 47 14.0 10.2 18.8 31 18.4 12.4 26.6 16 10.4 5.8 17.2
Peoria 133 12.2 10.2 14.6 93 18.6 14.9 23.0 40 6.8 4.8 9.4
Perry 21 15.5 9.5 24.1 17 24.9 14.4 40.6 4 6.7 1.7 18.4
Piatt 13 11.1 5.8 19.8 5 8.1 2.6 21.0 8 13.1 5.5 27.8
Pike 14 14.4 7.5 25.1 10 20.7 9.8 39.1 4 9.5 2.1 26.4
Pope 9 25.8 11.2 55.9 7 41.0 15.5 96.6 2 9.1 1.1 57.3
Pulaski 6 12.2 4.5 30.1 5 24.0 7.6 62.5 1 3.5 0.1 31.0
Putnam 7 14.6 5.8 33.8 7 29.1 11.4 67.2 0
Randolph 34 15.4 10.6 22.0 25 22.8 14.6 34.3 9 8.1 3.3 17.0
Richland 11 11.0 5.3 20.6 9 19.2 8.4 37.7 2 3.8 0.5 15.4
Rock Island 114 11.7 9.6 14.2 75 16.3 12.8 20.7 39 7.8 5.5 10.9
Saline 24 15.9 10.0 24.2 18 25.7 14.9 41.4 6 7.1 2.5 16.6
Sangamon 194 15.6 13.4 18.1 142 24.7 20.7 29.3 52 7.7 5.7 10.3
Schuyler 5 8.2 2.7 22.0 4 13.3 3.6 39.7 1 3.1 0.1 27.1
Scott 3 7.6 1.5 25.9 3 15.0 3.1 52.1 0
Shelby 16 9.7 5.3 16.6 13 16.8 8.6 30.2 3 2.9 0.6 10.9
St Clair 222 14.6 12.7 16.7 156 22.3 18.8 26.2 66 8.2 6.3 10.6
Stark 7 17.0 6.1 39.0 7 38.5 14.4 85.4 0
Stephenson 32 10.0 6.7 14.6 22 15.3 9.3 24.0 10 4.8 2.2 9.7
Tazewell 143 16.6 14.0 19.7 109 26.4 21.6 32.1 34 7.6 5.1 10.8
Union 13 11.4 5.8 20.4 10 16.7 7.7 32.4 3 6.7 1.3 20.3
Vermilion 70 13.5 10.5 17.2 44 17.9 12.9 24.3 26 9.6 6.1 14.5
Wabash 8 8.8 3.7 18.7 8 19.0 8.1 39.9 0
Warren 15 13.1 7.1 22.3 10 17.2 8.1 33.2 5 8.6 2.5 21.9
Washington 21 23.2 14.0 36.4 15 32.1 17.4 55.1 6 14.2 4.9 32.5
Wayne 14 11.4 6.2 19.9 10 16.8 8.0 32.5 4 6.7 1.8 19.0
White 13 13.1 6.7 23.5 11 23.2 11.2 43.5 2 3.1 0.4 14.9
Whiteside 51 11.8 8.8 15.7 40 19.7 14.0 27.2 11 4.8 2.4 9.2
Will 408 11.6 10.5 12.9 296 17.6 15.5 19.8 112 6.3 5.1 7.6
Williamson 59 13.2 10.0 17.2 42 20.1 14.4 27.6 17 6.8 3.9 11.3
Winnebago 213 11.6 10.1 13.4 162 18.6 15.8 21.9 51 5.3 3.9 7.1
Woodford 42 17.1 12.2 23.4 33 29.2 19.9 41.4 9 6.7 2.9 13.5
I - 7

White, Oral Cavity and Pharynx, Illinois, 2012-2016Figures include invasive cancer and bladder cancer in situ. Incidence counts are five-year totals. Rates are per 100,000 age-adjusted
to the 2000 U.S. standard population. Lower confidence intervals (LCI) and upper confidence intervals (UCI) are 95 percent for rates,
Tiwari method. DATA SOURCE: Illinois Department of Public Health, Illinois State Cancer Registry, data as of November 2018
County Count Rate LCI UCI Count Rate LCI UCI Count Rate LCI UCI
Both Sexes Male Female
Cancer Incidence Counts and Age-adjusted Rates by County and Sex
Illinois 7,490 12.3 12.0 12.6 5,314 18.4 17.9 18.9 2,176 6.8 6.5 7.1
Champaign 89 11.1 8.9 13.8 64 17.3 13.2 22.2 25 5.8 3.7 8.7
Cook 2,191 11.2 10.7 11.6 1,523 16.7 15.9 17.6 668 6.4 5.9 6.9
DuPage 553 11.8 10.8 12.9 384 17.7 15.9 19.6 169 6.9 5.9 8.1
Kane 269 10.5 9.3 11.9 201 16.1 13.9 18.6 68 5.2 4.0 6.7
Kankakee 71 12.9 10.0 16.4 53 20.0 14.8 26.4 18 6.1 3.5 9.9
Lake 387 11.1 10.0 12.3 249 14.8 12.9 16.8 138 7.8 6.5 9.2
Macon 114 17.9 14.7 21.8 74 25.1 19.5 32.0 40 11.4 8.0 15.9
Madison 202 12.8 11.1 14.8 141 18.8 15.7 22.2 61 7.7 5.8 10.1
Peoria 114 12.4 10.2 15.1 80 18.8 14.8 23.7 34 6.9 4.7 9.9
Rock Island 101 11.3 9.1 13.9 67 15.9 12.2 20.4 34 7.4 5.0 10.6
Sangamon 180 16.1 13.7 18.7 133 25.6 21.3 30.6 47 7.7 5.6 10.4
St Clair 167 14.8 12.6 17.3 117 21.7 17.9 26.2 50 8.7 6.4 11.6
Vermilion 64 13.6 10.3 17.6 41 18.2 13.0 25.1 23 9.3 5.7 14.6
Will 365 12.2 10.9 13.5 265 18.3 16.1 20.7 100 6.5 5.3 8.0
Winnebago 199 12.3 10.6 14.2 150 19.4 16.4 22.9 49 5.8 4.2 7.8
Black, Oral Cavity and Pharynx, Illinois, 2012-2016Figures include invasive cancer and bladder cancer in situ. Incidence counts are five-year totals. Rates are per 100,000 age-adjusted
to the 2000 U.S. standard population. Lower confidence intervals (LCI) and upper confidence intervals (UCI) are 95 percent for rates,
Tiwari method. DATA SOURCE: Illinois Department of Public Health, Illinois State Cancer Registry, data as of November 2018
County Count Rate LCI UCI Count Rate LCI UCI Count Rate LCI UCI
Both Sexes Male Female
Cancer Incidence Counts and Age-adjusted Rates by County and Sex
Illinois 1,082 11.2 10.5 11.9 743 18.1 16.8 19.5 339 6.2 5.5 6.9
Champaign 8 7.2 3.1 14.4 4 8.3 2.2 22.4 4 6.3 1.7 16.6
Cook 819 11.5 10.7 12.3 566 19.2 17.6 20.9 253 6.1 5.4 6.9
DuPage 11 6.3 2.8 12.0 11 15.0 6.7 29.1 0
Kane 18 14.3 8.1 23.2 13 23.3 11.3 41.8 5 7.2 2.3 17.1
Kankakee 9 8.6 3.9 16.9 4 7.8 2.1 22.1 5 9.1 3.0 22.4
Lake 19 8.5 4.9 13.5 10 8.0 3.8 15.3 9 7.8 3.5 15.0
Macon 15 19.0 10.2 31.9 11 34.1 15.4 63.5 4 9.0 2.3 22.8
Madison 9 9.1 4.1 17.4 2 4.0 0.5 16.0 7 13.1 5.2 27.0
Peoria 14 10.4 5.4 17.9 12 19.9 9.5 36.3 2 3.2 0.3 11.3
Rock Island 7 12.4 4.7 25.8 6 20.8 7.0 46.3 1 4.8 0.1 22.0
Sangamon 11 10.7 5.1 19.5 8 20.7 7.3 44.2 3 4.8 1.0 14.4
St Clair 49 12.9 9.5 17.2 33 20.5 13.9 29.1 16 7.4 4.2 12.1
Vermilion 5 12.0 3.6 28.5 2 13.6 1.3 47.0 3 12.1 2.3 36.4
Will 27 9.1 5.6 13.7 17 15.0 7.9 25.2 10 5.2 2.4 9.9
Winnebago 12 6.9 3.5 12.4 10 13.7 6.2 26.1 2 1.6 0.2 6.7
I - 8

Hispanic, Oral Cavity and Pharynx, Illinois, 2012-2016Figures include invasive cancer and bladder cancer in situ. Incidence counts are five-year totals. Rates are per 100,000 age-adjusted
to the 2000 U.S. standard population. Lower confidence intervals (LCI) and upper confidence intervals (UCI) are 95 percent for rates,
Tiwari method. DATA SOURCE: Illinois Department of Public Health, Illinois State Cancer Registry, data as of November 2018
County Count Rate LCI UCI Count Rate LCI UCI Count Rate LCI UCI
Both Sexes Male Female
Cancer Incidence Counts and Age-adjusted Rates by County and Sex
Illinois 399 6.4 5.7 7.1 269 8.9 7.7 10.2 130 4.1 3.4 5.0
Cook 276 6.8 5.9 7.7 183 9.5 8.1 11.2 93 4.4 3.5 5.4
DuPage 20 5.3 3.0 8.6 12 7.5 3.4 14.0 8 3.8 1.4 7.9
Kane 17 3.7 2.0 6.3 12 5.0 2.1 9.8 5 2.6 0.8 6.0
Lake 22 4.7 2.8 7.5 16 6.8 3.6 11.8 6 2.6 0.8 6.2
Will 22 7.9 4.7 12.2 18 12.9 7.2 21.1 4 2.9 0.7 7.6
Non-Hispanic, Oral Cavity and Pharynx, Illinois, 2012-2016Figures include invasive cancer and bladder cancer in situ. Incidence counts are five-year totals. Rates are per 100,000 age-adjusted
to the 2000 U.S. standard population. Lower confidence intervals (LCI) and upper confidence intervals (UCI) are 95 percent for rates,
Tiwari method. DATA SOURCE: Illinois Department of Public Health, Illinois State Cancer Registry, data as of November 2018
County Count Rate LCI UCI Count Rate LCI UCI Count Rate LCI UCI
Both Sexes Male Female
Cancer Incidence Counts and Age-adjusted Rates by County and Sex
Illinois 8,578 12.7 12.5 13.0 6,070 19.4 18.9 19.9 2,508 7.0 6.7 7.3
Cook 2,956 12.2 11.7 12.6 2,060 18.9 18.0 19.7 896 6.7 6.3 7.2
DuPage 599 11.9 11.0 13.0 421 18.0 16.3 19.9 178 6.8 5.8 7.9
Kane 275 11.8 10.4 13.3 207 18.5 16.0 21.4 68 5.6 4.3 7.2
Lake 414 11.6 10.5 12.8 265 15.6 13.7 17.7 149 8.0 6.7 9.4
Will 386 12.1 10.9 13.4 278 18.2 16.0 20.6 108 6.6 5.4 8.0
I - 9

All Races, Colon and Rectum, Illinois, 2012-2016Figures include invasive cancer and bladder cancer in situ. Incidence counts are five-year totals. Rates are per 100,000 age-adjusted
to the 2000 U.S. standard population. Lower confidence intervals (LCI) and upper confidence intervals (UCI) are 95 percent for rates,
Tiwari method. DATA SOURCE: Illinois Department of Public Health, Illinois State Cancer Registry, data as of November 2018
County Count Rate LCI UCI Count Rate LCI UCI Count Rate LCI UCI
Both Sexes Male Female
Cancer Incidence Counts and Age-adjusted Rates by County and Sex
Illinois 31,268 43.1 42.6 43.6 16,392 50.4 49.7 51.2 14,876 37.2 36.6 37.8
Adams 194 41.7 35.8 48.4 91 43.5 34.8 53.8 103 41.0 33.0 50.5
Alexander 30 62.4 41.4 91.2 13 59.2 31.2 104.5 17 63.2 35.7 106.1
Bond 56 50.3 37.7 66.0 32 62.5 42.4 89.3 24 43.6 27.1 67.1
Boone 115 39.9 32.8 48.0 56 41.8 31.2 54.7 59 38.6 29.3 50.1
Brown 18 50.2 29.6 80.2 12 66.8 33.9 118.6 6 32.6 11.0 79.4
Bureau 114 45.9 37.5 55.9 54 49.9 37.2 65.9 60 41.5 30.9 54.9
Calhoun 30 81.9 53.6 121.5 15 88.1 47.2 153.4 15 75.9 40.4 134.7
Carroll 53 44.1 32.5 59.2 27 48.0 31.1 72.3 26 39.2 24.5 61.3
Cass 45 55.3 40.0 74.7 23 59.9 37.5 91.3 22 51.0 31.4 79.1
Champaign 329 34.6 30.9 38.6 184 42.1 36.1 48.8 145 28.1 23.6 33.3
Christian 129 55.1 45.7 65.9 79 74.3 58.6 93.3 50 37.0 27.0 49.9
Clark 46 41.5 30.0 56.3 20 36.7 22.2 58.1 26 43.8 27.5 67.0
Clay 47 47.3 34.5 63.9 23 49.5 31.0 76.1 24 44.0 27.4 68.3
Clinton 94 39.8 32.0 49.1 53 47.7 35.6 62.9 41 32.6 23.1 45.1
Coles 143 46.6 39.1 55.2 71 54.0 42.0 68.5 72 41.3 31.9 52.8
Cook 12,324 43.5 42.8 44.3 6,353 51.6 50.3 52.9 5,971 37.6 36.6 38.6
Crawford 49 36.1 26.5 48.4 23 39.7 25.0 60.3 26 32.7 20.8 50.2
Cumberland 44 61.3 44.0 83.6 26 79.9 51.5 119.0 18 45.7 26.4 75.3
DeKalb 197 41.0 35.3 47.2 92 41.2 32.9 50.8 105 40.5 33.0 49.3
DeWitt 69 63.1 48.8 80.7 39 77.7 54.9 107.5 30 49.5 33.0 72.6
Douglas 46 37.1 26.9 50.0 28 48.5 32.1 70.9 18 29.3 16.7 47.9
DuPage 2,015 38.6 36.8 40.3 1,038 43.9 41.2 46.8 977 33.9 31.7 36.2
Edgar 67 52.1 40.0 67.2 38 70.0 49.0 97.6 29 36.7 24.1 55.0
Edwards 30 63.2 42.2 92.3 15 73.6 40.6 124.6 15 59.6 32.3 103.6
Effingham 121 56.0 46.3 67.3 59 62.0 46.9 80.6 62 52.6 40.0 68.2
Fayette 57 38.4 29.0 50.2 31 43.7 29.6 62.7 26 33.2 21.3 50.1
Ford 45 44.5 32.1 60.7 19 41.0 24.4 65.8 26 48.7 30.9 74.3
Franklin 128 48.6 40.3 58.3 74 61.7 48.1 78.2 54 36.7 27.2 48.8
Fulton 134 52.2 43.6 62.3 71 61.1 47.6 77.6 63 45.7 34.7 59.6
Gallatin 18 41.0 24.1 67.8 13 62.0 32.8 112.4 5 20.4 6.6 56.3
Greene 38 42.7 29.9 59.7 25 62.0 39.6 93.0 13 24.3 12.9 44.0
Grundy 124 46.5 38.6 55.7 67 57.0 43.6 73.1 57 39.6 29.8 51.6
Hamilton 31 54.5 36.3 79.3 13 51.8 26.5 92.1 18 55.8 32.6 91.9
Hancock 58 40.3 30.1 53.3 30 45.3 29.9 66.7 28 35.5 22.9 53.8
Hardin 12 33.7 17.3 63.7 8 49.6 20.9 106.9 4 22.1 6.0 71.0
Henderson 24 40.2 25.6 62.6 7 25.1 9.9 58.2 17 55.5 31.9 95.0
Henry 144 41.1 34.5 48.7 77 48.3 37.9 60.8 67 34.9 26.8 44.9
Iroquois 106 51.6 41.9 63.1 46 46.6 33.8 63.1 60 54.7 41.0 72.1
Jackson 124 40.2 33.2 48.2 69 48.0 37.0 61.2 55 34.1 25.3 45.1
Jasper 41 61.5 43.6 84.8 21 68.3 41.5 107.1 20 56.4 34.1 90.1
Jefferson 136 53.8 45.0 64.0 67 55.8 43.0 71.4 69 52.5 40.3 67.5
Jersey 44 31.0 22.3 42.3 24 35.2 22.3 53.4 20 27.5 16.3 43.8
Jo Daviess 70 36.8 28.3 47.6 43 48.6 34.6 67.4 27 27.1 17.4 41.6
Johnson 47 54.0 39.4 72.9 33 79.1 53.8 112.7 14 29.0 15.7 52.1
Kane 962 37.1 34.8 39.6 531 44.9 41.0 49.0 431 30.7 27.8 33.8
Kankakee 313 46.6 41.5 52.2 167 53.5 45.5 62.6 146 39.9 33.6 47.3
Kendall 214 43.8 37.9 50.4 124 51.5 42.3 62.1 90 35.9 28.7 44.4
Knox 176 48.0 40.9 56.0 100 57.5 46.6 70.5 76 39.3 30.4 50.3
Lake 1,398 37.6 35.6 39.7 743 43.3 40.1 46.6 655 32.9 30.4 35.6
LaSalle 350 46.2 41.3 51.5 186 54.2 46.5 62.8 164 38.7 32.8 45.5
Lawrence 43 40.0 28.8 54.4 25 50.9 32.8 75.8 18 31.0 18.1 51.1
Lee 106 44.6 36.4 54.4 49 41.8 30.7 55.9 57 45.8 34.2 60.5
I - 10

All Races, Colon and Rectum, Illinois, 2012-2016Figures include invasive cancer and bladder cancer in situ. Incidence counts are five-year totals. Rates are per 100,000 age-adjusted
to the 2000 U.S. standard population. Lower confidence intervals (LCI) and upper confidence intervals (UCI) are 95 percent for rates,
Tiwari method. DATA SOURCE: Illinois Department of Public Health, Illinois State Cancer Registry, data as of November 2018
County Count Rate LCI UCI Count Rate LCI UCI Count Rate LCI UCI
Both Sexes Male Female
Cancer Incidence Counts and Age-adjusted Rates by County and Sex
Livingston 124 50.8 42.0 61.0 65 56.2 43.2 72.2 59 47.1 35.2 62.0
Logan 112 58.6 48.1 71.0 54 62.7 46.8 82.4 58 55.2 41.5 72.6
Macon 386 53.9 48.5 59.9 213 66.1 57.3 76.0 173 44.9 38.1 52.7
Macoupin 165 53.4 45.3 62.6 86 61.2 48.7 76.1 79 47.9 37.5 60.6
Madison 665 39.9 36.9 43.2 339 46.1 41.2 51.4 326 35.5 31.7 39.8
Marion 143 55.4 46.4 65.8 70 59.5 46.0 75.9 73 50.2 38.8 64.3
Marshall 51 55.4 40.7 74.3 25 59.3 37.8 89.9 26 52.6 33.5 80.7
Mason 58 54.6 40.9 72.0 33 64.9 44.2 93.2 25 46.6 29.0 72.1
Massac 49 48.3 35.3 64.9 25 54.6 34.7 82.5 24 41.1 25.8 63.4
McDonough 96 52.4 42.1 64.6 44 52.7 37.9 71.8 52 49.8 36.6 66.7
McHenry 664 40.8 37.6 44.1 353 47.2 42.1 52.7 311 35.4 31.5 39.6
McLean 351 42.6 38.2 47.4 184 49.9 42.8 57.9 167 36.9 31.3 43.1
Menard 39 47.3 33.1 65.8 21 60.5 36.8 94.2 18 36.8 21.3 61.0
Mercer 44 36.9 26.5 50.7 28 48.6 32.0 71.9 16 26.7 14.5 46.0
Monroe 83 37.9 30.0 47.4 49 47.9 35.2 64.1 34 29.9 20.5 42.7
Montgomery 117 57.2 47.0 69.1 63 68.0 52.0 87.7 54 47.0 34.7 63.0
Morgan 110 46.0 37.6 55.9 65 62.2 47.7 79.9 45 32.0 23.2 43.8
Moultrie 45 43.6 31.5 59.2 23 50.3 31.7 76.7 22 40.0 24.4 62.9
Ogle 138 41.0 34.3 48.7 77 49.0 38.4 61.7 61 33.9 25.7 44.2
Peoria 497 45.0 41.0 49.2 273 55.0 48.5 62.1 224 36.4 31.7 41.8
Perry 76 54.0 42.3 68.1 38 59.6 42.0 82.5 38 49.3 34.2 69.6
Piatt 47 43.2 31.4 58.3 29 54.8 36.2 80.2 18 31.9 18.4 52.5
Pike 54 48.8 35.8 65.2 32 63.6 42.7 91.6 22 34.4 19.9 56.1
Pope 12 34.8 15.9 69.5 6 43.1 12.6 108.4 6 28.5 10.3 81.0
Pulaski 16 36.7 20.3 62.7 10 56.8 26.0 110.1 6 22.3 8.1 55.9
Putnam 21 45.9 27.9 73.4 14 65.2 34.7 115.6 7 26.3 10.3 63.5
Randolph 108 48.8 39.9 59.4 53 51.9 38.6 68.4 55 42.8 31.7 57.2
Richland 66 62.1 47.4 80.3 34 66.3 45.6 93.9 32 60.7 40.2 88.3
Rock Island 354 37.4 33.5 41.7 199 46.1 39.8 53.2 155 30.3 25.5 35.8
Saline 84 51.8 41.0 64.7 48 65.0 47.5 87.2 36 39.3 27.1 55.8
Sangamon 535 44.0 40.2 48.0 274 52.5 46.3 59.3 261 37.3 32.8 42.3
Schuyler 21 40.9 25.0 64.4 13 50.0 26.3 88.9 8 32.8 13.5 70.0
Scott 22 61.4 37.8 95.8 12 76.0 38.4 137.4 10 49.5 22.5 98.8
Shelby 94 53.2 42.8 65.9 48 60.1 44.1 80.9 46 47.1 34.1 64.6
St Clair 644 42.9 39.6 46.5 324 48.6 43.3 54.4 320 37.7 33.6 42.2
Stark 31 82.6 54.4 121.1 16 90.7 49.9 153.5 15 78.3 40.9 137.3
Stephenson 140 38.6 32.3 46.0 72 45.6 35.5 57.9 68 33.3 25.5 43.2
Tazewell 405 47.0 42.4 51.9 216 55.4 48.2 63.5 189 40.8 35.0 47.4
Union 67 51.6 39.7 66.5 34 56.9 38.9 81.2 33 45.6 31.0 66.0
Vermilion 285 56.3 49.8 63.6 157 67.0 56.7 78.6 128 47.1 38.9 56.6
Wabash 55 65.3 48.7 86.2 29 74.3 49.3 108.7 26 57.6 36.7 87.7
Warren 61 53.0 40.2 68.9 36 70.9 49.2 99.4 25 42.3 26.5 64.6
Washington 54 53.7 40.0 71.0 28 56.9 37.3 84.2 26 48.9 31.5 73.8
Wayne 50 40.0 29.5 53.6 26 42.4 27.6 63.5 24 38.1 23.9 58.6
White 49 42.8 31.4 57.7 24 46.4 29.6 70.6 25 42.2 26.6 65.2
Whiteside 171 43.2 36.8 50.5 100 54.8 44.4 67.1 71 32.6 25.2 41.9
Will 1,440 43.8 41.5 46.2 789 53.1 49.3 57.2 651 36.3 33.5 39.3
Williamson 243 54.9 48.1 62.5 124 60.2 49.9 72.1 119 49.4 40.7 59.5
Winnebago 674 38.5 35.6 41.6 331 40.9 36.5 45.7 343 36.6 32.7 40.9
Woodford 104 43.3 35.1 52.9 59 53.2 40.1 69.2 45 35.0 25.1 47.8
I - 11

White, Colon and Rectum, Illinois, 2012-2016Figures include invasive cancer and bladder cancer in situ. Incidence counts are five-year totals. Rates are per 100,000 age-adjusted
to the 2000 U.S. standard population. Lower confidence intervals (LCI) and upper confidence intervals (UCI) are 95 percent for rates,
Tiwari method. DATA SOURCE: Illinois Department of Public Health, Illinois State Cancer Registry, data as of November 2018
County Count Rate LCI UCI Count Rate LCI UCI Count Rate LCI UCI
Both Sexes Male Female
Cancer Incidence Counts and Age-adjusted Rates by County and Sex
Illinois 25,135 41.9 41.4 42.4 13,264 48.9 48.1 49.8 11,871 36.1 35.4 36.8
Champaign 277 33.9 29.9 38.3 161 43.1 36.5 50.6 116 25.9 21.2 31.3
Cook 7,932 40.7 39.8 41.6 4,195 48.3 46.8 49.8 3,737 34.7 33.5 35.8
DuPage 1,772 38.9 37.1 40.9 897 43.9 41.0 47.0 875 34.6 32.3 37.1
Kane 879 37.2 34.7 39.8 481 44.6 40.6 49.0 398 31.1 28.0 34.3
Kankakee 251 42.7 37.5 48.5 136 50.3 42.1 59.9 115 35.4 29.1 42.8
Lake 1,196 36.5 34.4 38.6 626 41.1 37.9 44.6 570 32.4 29.8 35.3
Macon 329 52.9 47.1 59.4 181 63.9 54.6 74.5 148 44.6 37.1 53.3
Madison 621 39.7 36.6 43.0 314 45.2 40.2 50.6 307 35.8 31.8 40.3
Peoria 416 43.9 39.7 48.5 230 54.1 47.2 61.9 186 34.9 29.8 40.7
Rock Island 322 37.2 33.1 41.7 177 45.2 38.6 52.7 145 30.9 25.8 36.8
Sangamon 474 42.5 38.6 46.6 242 50.6 44.3 57.6 232 36.0 31.3 41.2
St Clair 440 40.2 36.4 44.3 218 44.7 38.8 51.2 222 35.6 30.8 40.8
Vermilion 251 54.9 48.0 62.5 135 63.5 52.9 75.6 116 47.3 38.6 57.7
Will 1,225 43.6 41.2 46.2 672 52.4 48.4 56.8 553 36.3 33.3 39.5
Winnebago 575 36.9 33.8 40.1 279 38.5 34.0 43.4 296 35.7 31.6 40.3
Black, Colon and Rectum, Illinois, 2012-2016Figures include invasive cancer and bladder cancer in situ. Incidence counts are five-year totals. Rates are per 100,000 age-adjusted
to the 2000 U.S. standard population. Lower confidence intervals (LCI) and upper confidence intervals (UCI) are 95 percent for rates,
Tiwari method. DATA SOURCE: Illinois Department of Public Health, Illinois State Cancer Registry, data as of November 2018
County Count Rate LCI UCI Count Rate LCI UCI Count Rate LCI UCI
Both Sexes Male Female
Cancer Incidence Counts and Age-adjusted Rates by County and Sex
Illinois 4,820 52.6 51.1 54.2 2,393 63.7 61.1 66.5 2,427 45.4 43.6 47.3
Champaign 37 40.7 28.0 56.7 17 40.2 22.2 66.6 20 40.2 24.1 62.4
Cook 3,599 52.5 50.8 54.3 1,736 63.3 60.3 66.5 1,863 45.6 43.5 47.8
DuPage 86 50.6 39.1 64.2 39 53.5 35.8 76.6 47 47.0 33.2 64.3
Kane 51 41.8 30.3 55.8 32 63.3 41.1 92.2 19 26.1 15.3 41.4
Kankakee 55 70.2 52.2 92.1 26 69.4 44.3 103.3 29 68.0 45.1 98.4
Lake 97 48.4 38.6 59.6 57 69.0 50.2 91.9 40 35.6 25.1 48.8
Macon 50 65.2 47.7 86.6 28 97.0 61.4 143.8 22 48.6 30.1 73.9
Madison 42 47.3 33.5 64.5 24 67.4 41.7 101.9 18 32.8 19.2 52.3
Peoria 63 49.3 37.3 63.9 34 64.1 43.0 91.3 29 38.7 25.4 56.3
Rock Island 25 40.3 25.6 59.9 17 52.1 29.6 84.8 8 25.2 10.6 49.7
Sangamon 54 58.4 43.0 77.2 29 80.9 50.4 121.3 25 46.4 29.5 69.0
St Clair 199 52.9 45.6 61.0 104 63.7 51.4 77.9 95 45.1 36.3 55.4
Vermilion 27 73.4 47.5 107.3 17 98.9 55.0 161.1 10 50.8 24.0 92.7
Will 167 52.8 44.3 62.4 87 70.0 53.7 89.2 80 42.2 32.9 53.2
Winnebago 91 62.1 49.4 76.9 47 74.0 52.6 100.5 44 54.1 38.8 73.0
I - 12

Hispanic, Colon and Rectum, Illinois, 2012-2016Figures include invasive cancer and bladder cancer in situ. Incidence counts are five-year totals. Rates are per 100,000 age-adjusted
to the 2000 U.S. standard population. Lower confidence intervals (LCI) and upper confidence intervals (UCI) are 95 percent for rates,
Tiwari method. DATA SOURCE: Illinois Department of Public Health, Illinois State Cancer Registry, data as of November 2018
County Count Rate LCI UCI Count Rate LCI UCI Count Rate LCI UCI
Both Sexes Male Female
Cancer Incidence Counts and Age-adjusted Rates by County and Sex
Illinois 1,943 32.6 31.0 34.2 1,055 37.5 35.0 40.2 888 28.5 26.5 30.6
Cook 1,282 32.3 30.4 34.2 690 37.1 34.1 40.3 592 28.3 26.0 30.8
DuPage 106 35.3 28.1 43.7 55 38.9 27.5 52.9 51 32.7 23.6 43.9
Kane 97 24.6 19.2 30.9 61 34.7 24.9 46.5 36 16.0 10.6 22.8
Lake 121 34.1 27.3 41.9 60 34.4 24.8 46.1 61 33.1 24.1 44.0
Will 108 45.0 35.9 55.4 56 55.1 39.6 73.9 52 38.1 27.6 51.0
Non-Hispanic, Colon and Rectum, Illinois, 2012-2016Figures include invasive cancer and bladder cancer in situ. Incidence counts are five-year totals. Rates are per 100,000 age-adjusted
to the 2000 U.S. standard population. Lower confidence intervals (LCI) and upper confidence intervals (UCI) are 95 percent for rates,
Tiwari method. DATA SOURCE: Illinois Department of Public Health, Illinois State Cancer Registry, data as of November 2018
County Count Rate LCI UCI Count Rate LCI UCI Count Rate LCI UCI
Both Sexes Male Female
Cancer Incidence Counts and Age-adjusted Rates by County and Sex
Illinois 29,325 44.1 43.6 44.6 15,337 51.8 50.9 52.6 13,988 37.9 37.3 38.6
Cook 11,042 45.4 44.5 46.3 5,663 54.1 52.7 55.6 5,379 38.9 37.9 40.0
DuPage 1,909 39.1 37.3 40.9 983 44.6 41.7 47.6 926 34.3 32.0 36.6
Kane 865 39.0 36.4 41.8 470 46.9 42.6 51.5 395 32.6 29.3 36.0
Lake 1,277 38.0 35.9 40.3 683 44.4 41.0 48.0 594 32.8 30.1 35.6
Will 1,332 44.0 41.6 46.5 733 53.4 49.4 57.6 599 36.2 33.3 39.3
I - 13

All Races, Lung and Bronchus, Illinois, 2012-2016Figures include invasive cancer and bladder cancer in situ. Incidence counts are five-year totals. Rates are per 100,000 age-adjusted
to the 2000 U.S. standard population. Lower confidence intervals (LCI) and upper confidence intervals (UCI) are 95 percent for rates,
Tiwari method. DATA SOURCE: Illinois Department of Public Health, Illinois State Cancer Registry, data as of November 2018
County Count Rate LCI UCI Count Rate LCI UCI Count Rate LCI UCI
Both Sexes Male Female
Cancer Incidence Counts and Age-adjusted Rates by County and Sex
Illinois 47,130 64.7 64.1 65.3 24,225 75.3 74.4 76.3 22,905 57.0 56.2 57.7
Adams 333 70.1 62.6 78.3 179 81.9 70.1 95.2 154 60.6 51.1 71.6
Alexander 49 89.3 65.7 119.9 28 112.3 74.0 166.1 21 75.3 46.0 119.4
Bond 77 68.0 53.5 85.6 43 84.8 61.0 115.1 34 56.7 39.0 80.7
Boone 204 67.9 58.8 78.1 113 81.7 66.9 98.9 91 57.3 46.0 70.6
Brown 36 99.6 69.6 138.8 23 125.4 78.6 190.3 13 72.2 38.4 128.5
Bureau 188 74.3 63.9 86.1 97 83.1 67.2 102.0 91 69.5 55.7 86.2
Calhoun 22 56.9 34.5 90.6 14 80.7 42.3 143.2 8 38.7 16.2 85.2
Carroll 73 56.4 44.0 72.1 39 60.3 42.7 84.6 34 52.9 36.2 76.5
Cass 76 93.7 73.7 117.9 55 148.5 111.5 194.2 21 51.0 31.4 79.2
Champaign 499 52.8 48.2 57.8 236 56.2 49.1 64.1 263 50.6 44.5 57.3
Christian 226 93.5 81.5 106.9 127 115.6 96.2 138.1 99 76.0 61.4 93.6
Clark 88 77.6 62.1 96.4 41 80.8 57.6 110.8 47 76.7 56.0 103.6
Clay 89 88.3 70.7 109.6 51 110.9 82.1 147.5 38 70.8 49.7 99.2
Clinton 152 64.9 54.9 76.4 87 81.0 64.7 100.4 65 52.3 40.0 67.4
Coles 226 73.6 64.2 84.2 114 82.3 67.6 99.3 112 68.0 55.7 82.3
Cook 16,642 59.3 58.3 60.2 8,344 69.5 67.9 71.0 8,298 52.1 51.0 53.3
Crawford 100 73.2 59.4 89.6 52 85.2 63.4 112.7 48 65.2 47.8 87.9
Cumberland 62 79.6 60.8 103.1 31 88.9 60.1 127.9 31 73.2 49.3 106.5
DeKalb 314 67.1 59.8 75.1 158 75.2 63.6 88.2 156 60.8 51.5 71.3
DeWitt 110 96.3 78.9 116.8 59 116.7 88.3 151.9 51 80.1 59.3 106.9
Douglas 91 70.8 56.8 87.4 47 78.4 57.3 105.1 44 64.5 46.5 87.8
DuPage 2,643 51.8 49.7 53.8 1,303 58.4 55.1 61.8 1,340 47.4 44.9 50.1
Edgar 103 75.9 61.7 93.0 51 82.0 60.7 109.2 52 73.4 54.0 98.5
Edwards 37 73.1 51.0 102.8 16 71.2 40.2 119.5 21 75.4 46.2 120.0
Effingham 139 64.0 53.6 75.9 74 74.9 58.5 94.7 65 54.3 41.7 69.8
Fayette 84 56.6 45.0 70.5 57 80.3 60.7 104.7 27 36.5 23.7 54.5
Ford 70 71.4 55.4 91.3 33 76.5 52.2 109.1 37 67.6 47.0 95.5
Franklin 312 108.8 96.9 122.0 169 130.7 111.4 152.7 143 91.5 76.7 108.6
Fulton 189 73.7 63.4 85.4 101 83.8 68.1 102.4 88 65.5 52.1 81.9
Gallatin 38 88.4 61.7 124.7 19 104.2 60.7 170.1 19 82.9 48.6 137.1
Greene 84 88.7 70.4 110.8 39 90.2 63.8 124.8 45 89.7 64.7 122.5
Grundy 212 78.9 68.4 90.6 113 94.6 77.2 114.6 99 67.5 54.7 82.5
Hamilton 54 80.8 60.6 106.9 36 117.0 81.6 165.1 18 49.0 28.8 81.6
Hancock 97 65.5 52.8 80.8 57 80.5 60.8 105.7 40 54.2 37.9 76.2
Hardin 40 114.6 80.6 161.1 22 121.1 74.6 193.0 18 115.9 66.4 194.3
Henderson 42 68.1 48.6 95.0 25 79.1 50.9 122.5 17 55.7 31.3 96.2
Henry 254 70.8 62.2 80.4 150 89.7 75.6 105.8 104 54.6 44.4 66.8
Iroquois 171 78.2 66.8 91.4 98 98.3 79.5 120.6 73 62.1 48.3 79.3
Jackson 218 70.8 61.5 81.2 115 84.1 69.0 101.4 103 61.8 50.0 75.5
Jasper 51 73.7 54.3 98.6 27 79.6 51.6 118.8 24 68.4 42.8 105.5
Jefferson 195 75.4 65.0 87.1 103 85.5 69.5 104.3 92 68.9 55.2 85.3
Jersey 107 68.5 56.1 83.3 59 84.5 64.1 109.9 48 56.2 41.2 75.5
Jo Daviess 127 63.4 52.7 76.2 80 84.3 66.7 106.4 47 46.5 33.8 63.7
Johnson 89 93.5 74.8 116.1 60 129.3 98.0 168.4 29 60.2 39.9 89.8
Kane 1,298 51.2 48.4 54.1 669 59.7 55.0 64.6 629 45.1 41.6 48.9
Kankakee 516 77.4 70.7 84.5 267 87.0 76.6 98.4 249 69.5 61.0 79.0
Kendall 273 60.8 53.5 68.7 145 73.0 60.9 86.7 128 51.7 42.9 61.7
Knox 267 71.0 62.5 80.3 146 85.0 71.6 100.5 121 59.1 48.8 71.4
Lake 2,031 56.5 54.0 59.1 974 60.0 56.1 64.0 1,057 54.2 50.9 57.7
LaSalle 616 80.5 74.2 87.3 313 89.3 79.5 100.1 303 74.1 65.9 83.3
Lawrence 87 81.9 65.4 101.6 50 101.0 74.7 133.8 37 64.8 44.9 91.9
Lee 160 64.1 54.4 75.1 83 68.9 54.6 86.1 77 60.4 47.5 76.4
I - 14

All Races, Lung and Bronchus, Illinois, 2012-2016Figures include invasive cancer and bladder cancer in situ. Incidence counts are five-year totals. Rates are per 100,000 age-adjusted
to the 2000 U.S. standard population. Lower confidence intervals (LCI) and upper confidence intervals (UCI) are 95 percent for rates,
Tiwari method. DATA SOURCE: Illinois Department of Public Health, Illinois State Cancer Registry, data as of November 2018
County Count Rate LCI UCI Count Rate LCI UCI Count Rate LCI UCI
Both Sexes Male Female
Cancer Incidence Counts and Age-adjusted Rates by County and Sex
Livingston 222 90.5 78.8 103.7 114 101.8 83.7 122.9 108 85.5 69.8 104.0
Logan 205 104.2 90.2 119.9 112 129.4 106.3 156.3 93 85.6 68.7 106.0
Macon 701 93.4 86.4 100.8 366 108.8 97.7 120.8 335 82.5 73.6 92.2
Macoupin 299 89.2 79.2 100.3 180 118.5 101.5 137.8 119 67.1 55.3 81.0
Madison 1,365 81.6 77.3 86.2 679 92.7 85.7 100.1 686 74.1 68.6 80.0
Marion 227 81.8 71.3 93.6 129 101.0 84.1 120.6 98 67.4 54.3 83.0
Marshall 74 73.6 57.6 93.4 43 93.7 67.6 128.3 31 57.6 39.0 84.5
Mason 111 103.6 84.9 125.8 55 108.6 81.3 143.4 56 102.1 76.7 134.7
Massac 105 95.3 77.6 116.4 56 108.1 81.3 142.0 49 84.8 61.9 114.4
McDonough 143 74.2 62.3 88.0 63 76.9 58.8 99.1 80 73.7 57.8 93.2
McHenry 959 60.4 56.5 64.5 450 63.1 57.1 69.6 509 59.3 54.1 64.9
McLean 486 59.9 54.5 65.6 253 69.4 60.9 78.8 233 52.0 45.4 59.3
Menard 76 87.1 68.1 110.2 42 110.6 78.7 151.9 34 69.9 48.1 99.9
Mercer 99 80.1 64.8 98.4 47 79.9 58.2 108.1 52 80.1 59.5 107.0
Monroe 117 52.9 43.6 63.8 61 60.5 45.9 78.5 56 47.5 35.6 62.5
Montgomery 193 94.8 81.7 109.7 102 107.2 87.2 130.8 91 85.2 67.9 106.2
Morgan 209 87.5 75.8 100.7 108 99.6 81.3 120.9 101 80.2 64.8 98.5
Moultrie 65 68.4 52.6 87.8 32 73.4 50.0 104.6 33 64.5 44.0 92.2
Ogle 238 68.6 60.0 78.1 134 83.8 70.0 99.7 104 57.0 46.4 69.5
Peoria 934 83.1 77.7 88.7 497 98.4 89.8 107.7 437 71.3 64.7 78.6
Perry 101 71.3 57.9 87.2 55 82.3 61.7 107.9 46 62.4 45.1 85.1
Piatt 83 72.3 57.3 90.5 46 86.7 63.0 117.1 37 60.4 42.0 85.1
Pike 88 72.7 58.1 90.3 53 98.1 73.3 129.5 35 54.5 37.6 77.9
Pope 32 80.5 54.3 119.6 17 81.5 47.2 141.7 15 80.6 43.3 148.8
Pulaski 51 117.3 86.4 157.3 31 156.4 104.7 227.7 20 87.6 52.5 141.1
Putnam 42 87.6 62.8 121.2 28 128.3 83.9 191.5 14 56.8 30.7 102.6
Randolph 174 78.3 66.9 91.2 100 96.2 77.9 117.7 74 67.6 52.5 86.3
Richland 105 93.0 75.7 113.5 56 103.6 78.0 135.7 49 83.2 60.5 112.4
Rock Island 634 64.1 59.1 69.4 340 75.4 67.4 84.0 294 55.2 49.0 62.2
Saline 151 84.4 71.3 99.5 77 96.9 76.1 122.0 74 76.3 59.7 96.7
Sangamon 1,008 80.9 75.9 86.2 516 95.5 87.2 104.4 492 70.8 64.5 77.5
Schuyler 53 95.0 70.6 126.5 31 114.1 76.8 165.7 22 75.4 47.0 119.1
Scott 33 84.7 58.3 121.1 20 111.6 67.9 177.0 13 63.0 33.5 113.4
Shelby 135 78.9 66.0 94.1 82 104.1 82.5 130.4 53 58.1 43.3 77.4
St Clair 1,189 77.9 73.5 82.6 601 90.0 82.8 97.8 588 69.1 63.5 75.1
Stark 26 58.1 37.6 87.8 13 64.0 33.9 114.3 13 54.6 28.1 100.7
Stephenson 186 52.4 45.0 60.9 100 61.9 50.1 75.9 86 45.7 36.2 57.3
Tazewell 735 82.4 76.5 88.8 382 93.6 84.3 103.7 353 74.1 66.4 82.5
Union 127 94.5 78.5 113.2 83 130.6 103.5 163.5 44 61.2 44.2 83.8
Vermilion 493 90.7 82.7 99.3 261 104.5 92.0 118.3 232 80.2 70.0 91.7
Wabash 56 66.1 49.6 86.9 31 78.9 53.3 113.8 25 56.3 35.8 86.0
Warren 79 63.6 50.3 79.9 51 93.4 69.1 124.0 28 41.2 27.2 61.0
Washington 67 64.8 50.1 83.1 34 70.4 48.4 99.8 33 60.2 41.3 86.3
Wayne 94 73.2 59.1 90.3 59 100.6 76.4 131.0 35 52.0 36.0 74.1
White 99 88.8 71.8 109.3 62 123.8 94.3 160.7 37 60.6 42.3 85.8
Whiteside 256 61.6 54.2 69.9 152 81.1 68.6 95.6 104 46.4 37.7 56.7
Will 2,119 65.9 63.1 68.9 1,077 75.4 70.8 80.3 1,042 59.2 55.6 63.0
Williamson 431 94.3 85.5 103.9 245 118.3 103.7 134.5 186 75.3 64.7 87.3
Winnebago 1,259 69.5 65.6 73.5 641 78.4 72.3 84.9 618 63.3 58.3 68.7
Woodford 135 54.8 45.7 65.2 66 57.2 44.0 73.4 69 53.0 40.8 67.8
I - 15

White, Lung and Bronchus, Illinois, 2012-2016Figures include invasive cancer and bladder cancer in situ. Incidence counts are five-year totals. Rates are per 100,000 age-adjusted
to the 2000 U.S. standard population. Lower confidence intervals (LCI) and upper confidence intervals (UCI) are 95 percent for rates,
Tiwari method. DATA SOURCE: Illinois Department of Public Health, Illinois State Cancer Registry, data as of November 2018
County Count Rate LCI UCI Count Rate LCI UCI Count Rate LCI UCI
Both Sexes Male Female
Cancer Incidence Counts and Age-adjusted Rates by County and Sex
Illinois 39,130 64.8 64.1 65.4 20,083 74.4 73.4 75.5 19,047 57.8 57.0 58.6
Champaign 437 53.1 48.2 58.5 211 57.5 49.9 66.1 226 50.3 43.8 57.5
Cook 10,729 55.8 54.8 56.9 5,314 63.4 61.6 65.1 5,415 50.6 49.2 52.0
DuPage 2,458 55.0 52.8 57.3 1,193 61.2 57.7 64.9 1,265 51.2 48.4 54.2
Kane 1,221 52.4 49.4 55.5 628 61.0 56.1 66.2 593 46.3 42.5 50.2
Kankakee 449 76.9 69.8 84.6 230 84.9 74.1 97.0 219 70.4 61.1 80.7
Lake 1,822 57.3 54.6 60.0 867 59.9 55.9 64.2 955 55.6 52.0 59.3
Macon 612 92.6 85.3 100.5 317 105.6 94.2 118.3 295 83.7 74.0 94.5
Madison 1,275 81.0 76.5 85.6 648 93.4 86.2 101.0 627 72.2 66.5 78.3
Peoria 790 81.2 75.6 87.3 419 95.1 86.1 105.0 371 70.5 63.4 78.4
Rock Island 577 62.6 57.5 68.1 310 74.2 66.0 83.2 267 53.7 47.3 60.8
Sangamon 910 79.7 74.5 85.2 462 93.0 84.5 102.2 448 70.7 64.1 77.8
St Clair 873 76.9 71.8 82.3 439 86.8 78.7 95.6 434 69.6 63.1 76.7
Vermilion 451 90.6 82.2 99.6 237 103.2 90.2 117.6 214 81.2 70.4 93.4
Will 1,869 67.4 64.3 70.6 940 76.4 71.4 81.7 929 61.2 57.3 65.4
Winnebago 1,133 69.3 65.2 73.5 573 77.3 71.0 84.1 560 63.9 58.6 69.5
Black, Lung and Bronchus, Illinois, 2012-2016Figures include invasive cancer and bladder cancer in situ. Incidence counts are five-year totals. Rates are per 100,000 age-adjusted
to the 2000 U.S. standard population. Lower confidence intervals (LCI) and upper confidence intervals (UCI) are 95 percent for rates,
Tiwari method. DATA SOURCE: Illinois Department of Public Health, Illinois State Cancer Registry, data as of November 2018
County Count Rate LCI UCI Count Rate LCI UCI Count Rate LCI UCI
Both Sexes Male Female
Cancer Incidence Counts and Age-adjusted Rates by County and Sex
Illinois 6,939 75.7 73.8 77.5 3,522 95.0 91.7 98.4 3,417 63.1 61.0 65.3
Champaign 59 71.6 53.5 93.4 24 61.8 37.9 94.3 35 77.5 53.0 108.4
Cook 5,236 75.4 73.3 77.5 2,620 95.5 91.7 99.3 2,616 62.8 60.3 65.3
DuPage 62 45.4 33.4 59.9 31 64.9 40.9 96.1 31 33.9 21.8 49.8
Kane 56 50.5 37.2 66.7 30 60.3 38.1 89.7 26 43.7 27.8 64.7
Kankakee 65 88.1 67.2 113.0 37 114.5 78.7 160.0 28 67.7 44.4 98.6
Lake 147 74.4 62.2 88.2 75 88.3 67.7 112.8 72 63.8 49.3 80.9
Macon 85 98.9 78.2 123.3 48 134.4 95.3 183.1 37 75.7 52.7 105.1
Madison 83 104.3 82.1 130.2 30 96.9 63.6 139.9 53 112.2 82.9 147.9
Peoria 133 104.4 86.3 124.8 74 139.9 107.5 178.3 59 78.6 58.9 102.5
Rock Island 49 81.9 59.8 109.0 25 81.9 51.6 122.9 24 80.7 50.9 120.7
Sangamon 92 107.8 85.5 133.7 50 138.1 97.8 188.0 42 87.6 62.0 119.3
St Clair 309 83.0 73.7 93.1 160 103.1 86.9 121.4 149 69.6 58.6 82.0
Vermilion 40 98.5 69.1 135.3 24 149.1 91.8 225.4 16 67.4 37.8 110.6
Will 197 67.7 57.6 78.9 109 87.2 69.3 107.9 88 53.4 42.1 66.7
Winnebago 110 79.4 64.6 96.4 59 103.5 76.4 136.4 51 65.0 48.0 85.8
I - 16

Hispanic, Lung and Bronchus, Illinois, 2012-2016Figures include invasive cancer and bladder cancer in situ. Incidence counts are five-year totals. Rates are per 100,000 age-adjusted
to the 2000 U.S. standard population. Lower confidence intervals (LCI) and upper confidence intervals (UCI) are 95 percent for rates,
Tiwari method. DATA SOURCE: Illinois Department of Public Health, Illinois State Cancer Registry, data as of November 2018
County Count Rate LCI UCI Count Rate LCI UCI Count Rate LCI UCI
Both Sexes Male Female
Cancer Incidence Counts and Age-adjusted Rates by County and Sex
Illinois 1,373 27.2 25.7 28.8 729 32.7 30.2 35.4 644 23.1 21.3 25.1
Cook 925 27.0 25.2 28.9 509 33.5 30.4 36.7 416 22.0 19.9 24.3
DuPage 58 23.6 17.4 30.9 26 24.6 15.2 36.9 32 23.1 15.3 33.0
Kane 78 26.1 20.0 33.2 41 32.9 22.5 45.7 37 21.1 14.3 29.7
Lake 59 23.6 17.4 31.0 30 27.7 17.5 40.7 29 20.7 13.3 30.2
Will 74 33.3 25.5 42.4 45 43.9 30.5 60.4 29 24.5 16.0 35.6
Non-Hispanic, Lung and Bronchus, Illinois, 2012-2016Figures include invasive cancer and bladder cancer in situ. Incidence counts are five-year totals. Rates are per 100,000 age-adjusted
to the 2000 U.S. standard population. Lower confidence intervals (LCI) and upper confidence intervals (UCI) are 95 percent for rates,
Tiwari method. DATA SOURCE: Illinois Department of Public Health, Illinois State Cancer Registry, data as of November 2018
County Count Rate LCI UCI Count Rate LCI UCI Count Rate LCI UCI
Both Sexes Male Female
Cancer Incidence Counts and Age-adjusted Rates by County and Sex
Illinois 45,757 67.7 67.0 68.3 23,496 78.8 77.8 79.9 22,261 59.6 58.8 60.4
Cook 15,717 64.0 62.9 65.0 7,835 75.0 73.4 76.8 7,882 56.3 55.0 57.6
DuPage 2,585 53.3 51.2 55.4 1,277 60.2 56.9 63.8 1,308 48.7 46.0 51.5
Kane 1,220 54.7 51.6 58.0 628 63.8 58.7 69.2 592 48.2 44.3 52.3
Lake 1,972 59.1 56.5 61.9 944 62.6 58.5 66.9 1,028 56.8 53.3 60.4
Will 2,045 68.2 65.2 71.3 1,032 77.6 72.7 82.7 1,013 61.6 57.8 65.6
I - 17

All Races, Melanoma of the Skin, Illinois, 2012-2016Figures include invasive cancer and bladder cancer in situ. Incidence counts are five-year totals. Rates are per 100,000 age-adjusted
to the 2000 U.S. standard population. Lower confidence intervals (LCI) and upper confidence intervals (UCI) are 95 percent for rates,
Tiwari method. DATA SOURCE: Illinois Department of Public Health, Illinois State Cancer Registry, data as of November 2018
County Count Rate LCI UCI Count Rate LCI UCI Count Rate LCI UCI
Both Sexes Male Female
Cancer Incidence Counts and Age-adjusted Rates by County and Sex
Illinois 13,931 19.7 19.3 20.0 7,827 24.3 23.7 24.8 6,104 16.6 16.2 17.1
Adams 138 34.0 28.3 40.6 74 36.7 28.5 46.5 64 32.7 24.6 42.5
Alexander 4 12.3 2.9 32.2 2 8.7 1.0 36.1 2 16.5 2.0 54.1
Bond 22 21.0 13.0 32.5 13 26.1 13.7 45.5 9 16.9 7.6 33.6
Boone 63 21.5 16.4 27.6 45 32.0 23.1 43.3 18 12.3 7.2 19.7
Brown 6 17.1 6.2 38.1 4 25.8 6.8 65.9 2 10.4 1.2 46.6
Bureau 70 30.1 23.1 38.6 43 41.5 29.7 56.7 27 21.6 13.8 32.7
Calhoun 5 18.2 5.1 45.8 3 14.4 2.9 52.2 2 23.4 2.8 77.8
Carroll 28 26.1 16.8 39.2 16 25.0 14.2 43.2 12 27.6 13.4 50.7
Cass 20 24.7 14.9 38.9 10 26.1 12.2 49.2 10 24.6 11.4 46.9
Champaign 280 29.6 26.1 33.4 156 36.0 30.4 42.3 124 25.2 20.8 30.2
Christian 46 21.3 15.5 28.9 26 25.4 16.5 37.6 20 17.9 10.5 28.9
Clark 24 22.3 14.0 34.1 18 36.7 21.3 59.5 6 10.5 3.6 24.8
Clay 19 24.7 14.3 39.6 10 23.4 11.0 44.7 9 28.8 12.6 55.4
Clinton 59 26.9 20.3 34.9 24 22.9 14.5 34.4 35 32.8 22.4 46.4
Coles 83 27.5 21.7 34.4 52 37.9 28.1 50.2 31 19.7 13.1 28.6
Cook 3,885 13.9 13.4 14.3 2,235 18.3 17.5 19.1 1,650 11.0 10.5 11.6
Crawford 28 20.3 13.4 30.0 20 33.4 20.3 52.5 8 11.8 4.9 25.0
Cumberland 18 24.2 14.1 39.4 10 29.2 13.8 55.6 8 19.0 7.7 41.2
DeKalb 91 18.6 14.9 22.9 45 20.8 15.0 28.0 46 17.8 12.9 23.9
DeWitt 32 32.8 22.0 47.2 19 41.5 24.6 66.0 13 25.7 13.0 46.0
Douglas 33 28.2 19.2 40.1 12 21.4 10.9 38.1 21 36.3 22.0 56.6
DuPage 1,025 19.9 18.6 21.1 590 24.7 22.7 26.9 435 16.5 14.9 18.1
Edgar 32 27.2 18.1 39.5 17 32.3 18.5 53.1 15 25.3 13.4 44.1
Edwards 6 13.6 4.6 31.9 3 15.2 3.0 47.8 3 15.0 2.5 48.6
Effingham 46 23.4 16.9 31.6 25 28.1 18.0 41.8 21 22.0 13.2 34.3
Fayette 24 18.3 11.6 27.6 10 16.1 7.6 29.9 14 20.4 10.8 35.6
Ford 36 42.0 28.8 59.4 19 40.5 24.2 64.9 17 43.6 24.1 72.5
Franklin 74 28.8 22.4 36.6 44 36.6 26.3 49.7 30 23.3 15.3 34.2
Fulton 46 20.4 14.8 27.7 22 19.0 11.8 29.2 24 24.1 14.9 36.9
Gallatin 4 16.8 4.3 43.2 3 24.8 4.8 73.2 1 9.6 0.2 48.8
Greene 19 23.1 13.6 37.0 8 20.4 8.6 41.5 11 26.4 12.6 49.5
Grundy 58 21.9 16.5 28.5 29 21.3 14.0 31.1 29 22.3 14.9 32.2
Hamilton 22 39.2 24.1 61.1 16 58.4 32.9 97.8 6 23.0 7.6 54.1
Hancock 36 30.4 20.6 43.4 16 25.3 14.1 42.8 20 36.5 21.1 58.9
Hardin 6 16.5 5.8 42.2 2 10.3 1.2 52.5 4 21.0 5.3 69.7
Henderson 12 18.3 9.4 35.2 4 12.3 3.3 40.3 8 22.2 9.5 51.9
Henry 82 25.2 19.8 31.7 41 24.1 17.1 33.2 41 27.3 19.1 37.8
Iroquois 49 24.4 17.8 33.0 34 37.3 25.5 53.1 15 14.2 7.6 24.8
Jackson 66 21.5 16.5 27.7 37 26.3 18.3 36.7 29 18.9 12.4 27.7
Jasper 16 27.8 15.2 46.8 9 31.2 13.5 61.9 7 26.2 9.7 56.7
Jefferson 70 29.7 22.9 37.9 39 32.8 23.1 45.4 31 29.6 19.5 43.0
Jersey 33 24.3 16.4 34.8 14 21.8 11.5 38.0 19 26.5 15.6 42.7
Jo Daviess 43 27.7 19.2 39.0 24 27.8 17.1 43.7 19 28.6 15.8 47.7
Johnson 12 15.2 7.7 27.4 5 11.9 3.8 29.4 7 22.7 8.3 49.7
Kane 569 21.7 19.9 23.6 308 26.0 23.1 29.2 261 18.8 16.5 21.2
Kankakee 126 20.0 16.6 23.9 74 24.6 19.2 31.1 52 16.3 12.1 21.6
Kendall 105 19.2 15.6 23.3 48 19.6 14.2 26.5 57 19.4 14.6 25.3
Knox 75 22.1 17.1 28.2 45 26.7 19.2 36.4 30 18.7 12.2 27.6
Lake 853 22.9 21.3 24.5 466 27.0 24.5 29.7 387 20.1 18.1 22.3
LaSalle 176 25.9 22.1 30.3 103 31.7 25.7 38.7 73 21.5 16.6 27.5
Lawrence 17 15.8 9.1 26.0 7 14.4 5.8 30.4 10 20.5 9.3 39.9
Lee 70 31.7 24.4 40.5 37 32.3 22.5 45.2 33 33.5 22.4 48.4
I - 18

All Races, Melanoma of the Skin, Illinois, 2012-2016Figures include invasive cancer and bladder cancer in situ. Incidence counts are five-year totals. Rates are per 100,000 age-adjusted
to the 2000 U.S. standard population. Lower confidence intervals (LCI) and upper confidence intervals (UCI) are 95 percent for rates,
Tiwari method. DATA SOURCE: Illinois Department of Public Health, Illinois State Cancer Registry, data as of November 2018
County Count Rate LCI UCI Count Rate LCI UCI Count Rate LCI UCI
Both Sexes Male Female
Cancer Incidence Counts and Age-adjusted Rates by County and Sex
Livingston 65 28.5 21.8 36.8 35 31.7 21.8 44.7 30 26.3 17.2 38.6
Logan 37 20.3 14.1 28.3 23 25.4 15.9 38.7 14 15.5 8.2 27.0
Macon 189 28.4 24.3 33.0 105 32.6 26.5 39.7 84 26.1 20.5 32.8
Macoupin 62 20.2 15.3 26.3 38 25.4 17.8 35.4 24 16.6 10.3 25.5
Madison 362 23.4 21.0 26.0 199 27.3 23.5 31.5 163 21.5 18.2 25.3
Marion 71 31.0 23.8 39.7 42 37.8 26.8 51.8 29 26.5 17.2 38.9
Marshall 17 21.1 11.6 35.8 5 10.2 3.3 27.2 12 32.0 15.0 59.9
Mason 19 20.0 11.7 32.4 13 28.3 14.8 50.3 6 12.3 4.0 29.9
Massac 18 18.8 10.8 30.7 11 23.3 11.3 43.6 7 14.2 5.3 31.4
McDonough 46 26.1 18.7 35.6 28 35.2 23.0 51.8 18 18.7 10.3 31.4
McHenry 373 23.1 20.7 25.6 208 27.5 23.7 31.7 165 19.9 16.9 23.4
McLean 278 33.5 29.6 37.7 146 39.6 33.2 46.8 132 29.7 24.7 35.3
Menard 22 30.0 18.2 46.8 12 34.5 16.9 62.6 10 26.4 12.1 50.8
Mercer 35 32.9 22.5 46.9 20 35.9 21.7 57.1 15 31.4 16.9 53.7
Monroe 55 27.8 20.7 36.6 34 35.4 24.2 50.1 21 21.3 12.9 33.3
Montgomery 40 20.6 14.5 28.7 24 25.3 16.1 38.3 16 19.4 10.4 32.9
Morgan 63 27.2 20.7 35.4 47 42.7 31.2 57.5 16 16.6 9.0 28.0
Moultrie 25 28.3 17.9 42.7 15 34.5 18.7 58.8 10 22.4 10.3 42.8
Ogle 89 28.7 22.8 35.6 42 27.4 19.5 37.5 47 30.6 22.1 41.3
Peoria 272 25.4 22.4 28.7 171 35.8 30.5 41.7 101 17.9 14.5 21.9
Perry 33 26.4 17.9 37.5 19 31.2 18.6 49.3 14 24.0 12.4 42.0
Piatt 47 47.9 34.5 64.9 27 54.0 34.8 80.4 20 44.4 26.2 70.6
Pike 34 35.5 24.0 50.7 11 21.1 10.4 39.0 23 51.6 31.1 80.1
Pope 8 28.3 10.3 63.8 6 44.1 12.8 110.5 2 11.5 1.3 62.0
Pulaski 9 19.7 8.9 40.4 6 28.2 10.2 67.8 3 11.9 2.4 42.9
Putnam 12 26.8 12.8 51.2 7 25.9 10.2 61.7 5 27.3 7.4 72.3
Randolph 41 19.1 13.6 26.4 23 20.9 13.1 31.9 18 17.9 10.0 29.7
Richland 24 22.4 14.1 34.0 13 24.3 12.9 42.7 11 21.8 10.4 40.6
Rock Island 228 25.6 22.3 29.3 123 29.0 24.0 34.8 105 24.5 19.8 30.0
Saline 38 25.1 17.3 35.3 18 25.3 14.4 41.2 20 24.9 14.5 40.1
Sangamon 307 26.4 23.5 29.7 148 27.8 23.4 32.9 159 26.8 22.6 31.5
Schuyler 10 18.9 8.9 36.9 7 28.2 11.2 61.5 3 10.2 2.1 37.0
Scott 9 25.3 11.0 51.2 3 15.7 3.2 53.4 6 34.2 11.2 81.9
Shelby 35 24.3 16.4 34.7 16 19.6 11.0 33.2 19 29.3 16.8 47.7
St Clair 287 20.1 17.8 22.7 170 27.0 23.0 31.5 117 15.6 12.9 18.9
Stark 7 14.4 5.7 33.2 4 20.3 5.4 58.0 3 13.2 2.7 46.2
Stephenson 64 21.4 16.1 28.0 35 25.2 17.0 36.0 29 18.8 12.2 28.0
Tazewell 211 26.5 22.9 30.5 105 27.7 22.5 33.6 106 26.6 21.5 32.4
Union 30 27.0 17.7 39.5 21 39.0 23.6 61.1 9 17.5 7.4 35.2
Vermilion 133 26.1 21.7 31.1 83 33.5 26.6 41.9 50 20.9 15.2 28.0
Wabash 6 6.5 2.4 15.7 5 12.0 3.9 30.5 1 2.5 0.1 17.2
Warren 29 28.3 18.5 41.5 18 36.9 21.3 59.6 11 23.2 10.9 43.2
Washington 18 19.0 10.8 31.3 11 24.2 11.5 45.5 7 14.7 5.5 32.5
Wayne 26 21.4 13.9 32.2 17 30.5 17.6 50.3 9 14.6 6.6 29.4
White 20 20.7 12.3 33.1 11 26.5 12.7 49.2 9 15.4 7.0 31.6
Whiteside 93 25.0 19.9 30.9 50 29.5 21.7 39.3 43 21.2 14.9 29.3
Will 664 19.3 17.8 20.8 371 23.7 21.3 26.4 293 16.1 14.3 18.1
Williamson 122 29.7 24.5 35.8 73 36.2 28.2 46.0 49 24.5 17.8 32.8
Winnebago 414 24.9 22.5 27.6 226 29.2 25.4 33.4 188 22.3 19.1 25.9
Woodford 72 30.6 23.7 38.9 46 40.3 29.3 54.4 26 22.5 14.4 33.8
I - 19

White, Melanoma of the Skin, Illinois, 2012-2016Figures include invasive cancer and bladder cancer in situ. Incidence counts are five-year totals. Rates are per 100,000 age-adjusted
to the 2000 U.S. standard population. Lower confidence intervals (LCI) and upper confidence intervals (UCI) are 95 percent for rates,
Tiwari method. DATA SOURCE: Illinois Department of Public Health, Illinois State Cancer Registry, data as of November 2018
County Count Rate LCI UCI Count Rate LCI UCI Count Rate LCI UCI
Both Sexes Male Female
Cancer Incidence Counts and Age-adjusted Rates by County and Sex
Illinois 13,232 22.9 22.5 23.3 7,484 27.8 27.2 28.5 5,748 19.7 19.1 20.2
Champaign 234 29.6 25.8 33.8 136 36.9 30.8 43.9 98 24.3 19.5 30.0
Cook 3,610 18.9 18.3 19.5 2,092 24.3 23.2 25.3 1,518 15.3 14.5 16.1
DuPage 997 22.7 21.2 24.2 581 28.2 25.9 30.7 416 18.8 17.0 20.8
Kane 555 23.3 21.4 25.4 303 28.0 24.8 31.4 252 20.1 17.7 22.8
Kankakee 122 22.5 18.6 27.0 73 27.9 21.7 35.3 49 18.1 13.2 24.2
Lake 806 24.8 23.1 26.6 444 29.0 26.3 32.0 362 22.0 19.8 24.5
Macon 177 31.0 26.3 36.3 99 34.7 28.0 42.7 78 29.3 22.6 37.3
Madison 348 24.4 21.8 27.2 189 27.7 23.8 32.0 159 23.3 19.7 27.5
Peoria 257 28.4 24.9 32.3 164 39.9 33.9 46.7 93 20.0 16.0 24.8
Rock Island 224 27.8 24.1 32.0 121 31.3 25.8 37.7 103 26.6 21.4 32.8
Sangamon 304 29.5 26.1 33.1 148 30.5 25.6 36.0 156 30.3 25.5 35.8
St Clair 266 25.7 22.7 29.1 159 33.0 27.9 38.7 107 21.2 17.2 25.8
Vermilion 114 25.0 20.4 30.4 72 32.3 25.0 41.1 42 19.8 13.9 27.5
Will 639 21.9 20.2 23.7 358 26.7 23.8 29.7 281 18.5 16.4 20.9
Winnebago 403 27.7 25.0 30.7 224 32.4 28.2 37.1 179 24.9 21.2 29.1
Black, Melanoma of the Skin, Illinois, 2012-2016Figures include invasive cancer and bladder cancer in situ. Incidence counts are five-year totals. Rates are per 100,000 age-adjusted
to the 2000 U.S. standard population. Lower confidence intervals (LCI) and upper confidence intervals (UCI) are 95 percent for rates,
Tiwari method. DATA SOURCE: Illinois Department of Public Health, Illinois State Cancer Registry, data as of November 2018
County Count Rate LCI UCI Count Rate LCI UCI Count Rate LCI UCI
Both Sexes Male Female
Cancer Incidence Counts and Age-adjusted Rates by County and Sex
Illinois 65 0.7 0.6 0.9 27 0.7 0.5 1.1 38 0.7 0.5 1.0
Champaign 1 1.8 0.0 8.0 0 1 2.4 0.1 11.8
Cook 46 0.7 0.5 0.9 20 0.7 0.4 1.2 26 0.7 0.4 1.0
DuPage 1 0.9 0.0 4.4 0 1 1.6 0.0 7.7
Kane 1 0.7 0.0 4.2 1 1.4 0.0 9.6 0
Kankakee 0 0 0
Lake 3 1.8 0.3 5.2 0 3 2.9 0.5 8.4
Macon 1 0.9 0.0 5.7 1 1.8 0.0 13.6 0
Madison 0 0 0
Peoria 1 0.5 0.0 3.5 0 1 1.0 0.0 6.3
Rock Island 0 0 0
Sangamon 1 1.0 0.0 5.6 0 1 1.7 0.0 9.8
St Clair 3 0.8 0.1 2.4 2 1.4 0.1 5.1 1 0.3 0.0 2.2
Vermilion 0 0 0
Will 0 0 0
Winnebago 4 3.2 0.8 7.9 0 4 5.3 1.4 13.3
I - 20

Hispanic, Melanoma of the Skin, Illinois, 2012-2016Figures include invasive cancer and bladder cancer in situ. Incidence counts are five-year totals. Rates are per 100,000 age-adjusted
to the 2000 U.S. standard population. Lower confidence intervals (LCI) and upper confidence intervals (UCI) are 95 percent for rates,
Tiwari method. DATA SOURCE: Illinois Department of Public Health, Illinois State Cancer Registry, data as of November 2018
County Count Rate LCI UCI Count Rate LCI UCI Count Rate LCI UCI
Both Sexes Male Female
Cancer Incidence Counts and Age-adjusted Rates by County and Sex
Illinois 280 4.5 3.9 5.1 129 4.8 3.9 5.8 151 4.4 3.6 5.2
Cook 156 3.8 3.2 4.5 78 4.3 3.3 5.5 78 3.4 2.7 4.3
DuPage 19 5.6 3.0 9.2 9 7.0 2.6 14.1 10 4.7 2.0 9.3
Kane 19 4.3 2.3 7.1 6 2.9 0.8 7.3 13 5.6 2.7 10.2
Lake 17 4.7 2.5 8.0 11 8.0 3.5 15.1 6 2.0 0.7 4.9
Will 18 7.0 3.8 11.7 6 5.1 1.4 12.2 12 8.7 4.1 15.7
Non-Hispanic, Melanoma of the Skin, Illinois, 2012-2016Figures include invasive cancer and bladder cancer in situ. Incidence counts are five-year totals. Rates are per 100,000 age-adjusted
to the 2000 U.S. standard population. Lower confidence intervals (LCI) and upper confidence intervals (UCI) are 95 percent for rates,
Tiwari method. DATA SOURCE: Illinois Department of Public Health, Illinois State Cancer Registry, data as of November 2018
County Count Rate LCI UCI Count Rate LCI UCI Count Rate LCI UCI
Both Sexes Male Female
Cancer Incidence Counts and Age-adjusted Rates by County and Sex
Illinois 13,651 21.5 21.2 21.9 7,698 26.3 25.7 27.0 5,953 18.4 17.9 18.9
Cook 3,729 16.0 15.4 16.5 2,157 20.9 20.0 21.9 1,572 12.7 12.1 13.4
DuPage 1,006 21.2 19.9 22.6 581 26.2 24.0 28.5 425 17.8 16.1 19.6
Kane 550 25.6 23.5 27.9 302 30.4 27.0 34.2 248 22.3 19.5 25.4
Lake 836 25.5 23.7 27.3 455 29.3 26.5 32.2 381 23.1 20.7 25.6
Will 646 20.7 19.1 22.4 365 25.6 22.9 28.5 281 17.3 15.3 19.5
I - 21

Female Breast (invasive), Illinois, 2012-2016Figures include invasive cancer and bladder cancer in situ. Incidence counts are five-year totals. Rates are per 100,000 age-adjusted
to the 2000 U.S. standard population. Lower confidence intervals (LCI) and upper confidence intervals (UCI) are 95 percent for rates,
Tiwari method. DATA SOURCE: Illinois Department of Public Health, Illinois State Cancer Registry, data as of November 2018
County Count Rate LCI UCI Count Rate LCI UCI Count Rate LCI UCI
All Races White Black
Cancer Incidence Counts and Age-adjusted Rates by County
Illinois 50,495 131.9 130.8 133.1 41,119 133.1 131.8 134.4 7,171 133.5 130.4 136.7
Adams 303 134.9 119.3 152.0
Alexander 31 120.8 79.9 177.0
Bond 84 155.9 122.5 196.1
Boone 178 114.4 98.0 132.8
Brown 19 120.5 71.0 193.7
Bureau 144 120.3 100.3 143.3
Calhoun 19 95.8 54.8 159.9
Carroll 65 137.5 102.9 180.4
Cass 50 121.1 89.1 161.6
Champaign 646 129.9 119.8 140.7 548 131.3 120.1 143.3 76 142.4 111.3 179.2
Christian 151 130.2 109.3 154.3
Clark 56 98.3 73.3 129.9
Clay 63 126.4 95.0 165.7
Clinton 162 139.5 118.2 163.8
Coles 157 107.9 90.7 127.4
Cook 19,834 130.1 128.2 131.9 13,053 129.5 127.2 131.8 5,495 136.5 132.9 140.3
Crawford 59 92.3 68.7 121.9
Cumberland 28 79.0 51.2 117.2
DeKalb 330 126.7 113.1 141.5
DeWitt 83 151.0 119.1 189.6
Douglas 86 145.0 114.5 181.3
DuPage 4,077 144.8 140.3 149.5 3,612 150.1 145.1 155.3 134 131.0 107.2 158.2
Edgar 62 87.0 65.5 114.2
Edwards 29 120.7 79.3 178.4
Effingham 132 118.8 98.5 142.3
Fayette 78 111.0 86.6 140.5
Ford 78 159.6 124.5 202.4
Franklin 187 134.8 115.2 157.1
Fulton 153 133.7 112.0 158.5
Gallatin 25 129.0 80.2 199.2
Greene 75 158.7 123.4 202.0
Grundy 203 148.2 128.2 170.5
Hamilton 30 94.5 62.4 139.4
Hancock 85 120.6 94.5 152.3
Hardin 12 68.8 33.2 134.3
Henderson 40 142.2 99.3 200.5
Henry 213 125.1 108.0 144.3
Iroquois 119 109.4 89.3 133.0
Jackson 195 126.9 109.0 147.0
Jasper 39 117.6 82.0 164.7
Jefferson 179 142.0 121.1 165.8
Jersey 98 130.7 105.2 161.0
Jo Daviess 114 131.7 106.0 162.4
Johnson 52 119.1 87.3 160.4
Kane 1,752 123.8 118.0 129.9 1,596 124.9 118.7 131.3 94 130.1 104.4 160.2
Kankakee 441 133.5 121.0 147.0 381 134.0 120.4 148.7 56 137.3 103.0 179.1
Kendall 400 137.8 124.4 152.4
Knox 237 132.1 114.4 151.9
Lake 2,842 141.3 136.0 146.7 2,520 144.6 138.8 150.5 152 125.1 105.3 147.4
LaSalle 442 119.7 108.2 132.1
Lawrence 49 96.0 69.5 130.1
I - 22

Female Breast (invasive), Illinois, 2012-2016Figures include invasive cancer and bladder cancer in situ. Incidence counts are five-year totals. Rates are per 100,000 age-adjusted
to the 2000 U.S. standard population. Lower confidence intervals (LCI) and upper confidence intervals (UCI) are 95 percent for rates,
Tiwari method. DATA SOURCE: Illinois Department of Public Health, Illinois State Cancer Registry, data as of November 2018
County Count Rate LCI UCI Count Rate LCI UCI Count Rate LCI UCI
All Races White Black
Cancer Incidence Counts and Age-adjusted Rates by County
Lee 142 125.5 104.8 149.4
Livingston 173 139.3 118.4 163.0
Logan 138 133.6 111.4 159.4
Macon 468 125.4 113.7 138.1 419 131.3 118.2 145.7 48 94.5 69.2 126.0
Macoupin 198 121.7 104.5 141.1
Madison 1,153 134.7 126.8 143.1 1,068 135.0 126.7 143.7 72 138.3 107.2 175.3
Marion 182 143.1 121.9 167.1
Marshall 46 104.0 74.1 143.1
Mason 49 103.9 75.1 140.8
Massac 62 115.0 87.0 150.1
McDonough 114 134.7 109.6 163.8
McHenry 1,233 137.2 129.4 145.3
McLean 626 142.0 130.8 153.9
Menard 61 134.6 101.6 176.0
Mercer 68 119.2 91.3 153.9
Monroe 143 132.5 111.1 157.2
Montgomery 111 104.7 85.4 127.7
Morgan 163 143.8 121.2 169.6
Moultrie 52 109.0 79.8 145.7
Ogle 198 116.8 100.6 135.0
Peoria 774 137.8 127.9 148.2 646 136.8 125.9 148.4 109 151.2 123.1 183.6
Perry 82 123.8 96.8 156.4
Piatt 64 111.1 84.6 144.1
Pike 69 122.9 94.1 158.5
Pope 13 73.8 38.9 139.7
Pulaski 21 97.1 57.9 155.4
Putnam 26 115.4 73.7 176.6
Randolph 119 121.6 99.3 147.7
Richland 73 131.2 101.6 167.4
Rock Island 595 122.5 112.4 133.3 558 125.2 114.4 136.8 31 95.8 64.3 136.7
Saline 98 110.3 88.5 136.3
Sangamon 947 145.5 136.0 155.5 866 147.7 137.5 158.4 69 133.1 102.4 169.6
Schuyler 29 108.9 71.4 162.1
Scott 40 213.1 149.9 296.8
Shelby 117 158.8 129.5 193.2
St Clair 1,087 134.2 126.1 142.6 791 138.1 128.3 148.5 279 126.6 111.9 142.7
Stark 22 106.7 64.1 169.5
Stephenson 221 132.9 114.7 153.3
Tazewell 666 151.1 139.5 163.6
Union 95 153.1 122.1 190.1
Vermilion 275 104.2 91.7 118.2 257 108.6 94.9 123.8 14 63.2 33.9 106.7
Wabash 44 104.9 74.4 144.8
Warren 86 169.7 133.5 212.7
Washington 53 107.1 79.5 142.1
Wayne 75 125.5 97.2 160.1
White 66 124.2 94.0 161.8
Whiteside 261 137.1 120.1 156.0
Will 2,521 135.8 130.5 141.3 2,163 138.5 132.7 144.6 239 124.3 108.1 142.3
Williamson 254 113.6 99.5 129.3
Winnebago 1,186 130.8 123.3 138.8 1,061 132.6 124.4 141.2 112 130.4 106.8 157.4
Woodford 150 122.9 103.4 145.2
I - 23

Female Breast (invasive), Illinois, 2012-2016Figures include invasive cancer and bladder cancer in situ. Incidence counts are five-year totals.
Rates are per 100,000 age-adjusted to the 2000 U.S. standard population. Lower confidence
intervals (LCI) and upper confidence intervals (UCI) are 95 percent for rates, Tiwari method.
DATA SOURCE: Illinois Department of Public Health, Illinois State Cancer Registry, data as of
November 2018
County Count Rate LCI UCI Count Rate LCI UCI
Non-Hispanic Hispanic
Cancer Incidence Counts and Age-adjusted Rates by County
Illinois 47,206 136.1 134.9 137.4 3,289 93.0 89.6 96.4
Cook 17,697 137.2 135.2 139.4 2,137 92.0 88.0 96.2
DuPage 3,862 147.7 142.9 152.7 215 103.3 88.6 119.7
Kane 1,557 132.8 126.1 139.8 195 81.4 69.3 95.0
Lake 2,656 148.5 142.7 154.5 186 89.1 75.3 104.6
Will 2,326 137.7 132.0 143.5 195 108.3 92.2 126.2
I - 24

Cervix, Illinois, 2012-2016Figures include invasive cancer and bladder cancer in situ. Incidence counts are five-year totals. Rates are per 100,000 age-adjusted
to the 2000 U.S. standard population. Lower confidence intervals (LCI) and upper confidence intervals (UCI) are 95 percent for rates,
Tiwari method. DATA SOURCE: Illinois Department of Public Health, Illinois State Cancer Registry, data as of November 2018
County Count Rate LCI UCI Count Rate LCI UCI Count Rate LCI UCI
All Races White Black
Cancer Incidence Counts and Age-adjusted Rates by County
Illinois 2,629 7.7 7.4 8.0 1,973 7.4 7.0 7.7 532 10.3 9.4 11.2
Adams 12 6.8 3.4 12.2
Alexander 2 10.1 1.0 39.2
Bond 7 17.0 6.6 35.8
Boone 17 12.7 7.3 20.5
Brown 1 5.7 0.1 40.5
Bureau 9 10.1 4.3 20.0
Calhoun 2 8.6 1.0 44.0
Carroll 2 9.1 1.1 29.4
Cass 2 6.3 0.6 23.1
Champaign 23 5.1 3.2 7.8 18 5.5 3.2 8.7 3 4.7 0.9 14.2
Christian 11 12.0 5.8 22.1
Clark 4 10.7 2.6 27.8
Clay 4 11.4 2.9 30.2
Clinton 7 7.3 2.8 15.4
Coles 7 5.2 2.0 10.9
Cook 1,167 8.2 7.7 8.7 684 7.3 6.8 7.9 410 11.0 9.9 12.1
Crawford 2 4.0 0.4 15.1
Cumberland 2 7.5 0.7 28.3
DeKalb 16 7.0 3.9 11.5
DeWitt 5 11.2 3.4 27.3
Douglas 2 4.7 0.6 16.1
DuPage 144 5.5 4.6 6.5 124 5.8 4.8 7.0 7 5.1 2.0 11.2
Edgar 4 9.7 2.5 24.8
Edwards 2 7.2 0.9 33.1
Effingham 9 11.2 4.9 21.7
Fayette 6 12.9 4.5 28.4
Ford 2 5.0 0.5 19.9
Franklin 9 10.0 4.4 19.1
Fulton 6 6.9 2.3 15.6
Gallatin 1 9.7 0.2 49.0
Greene 1 4.2 0.1 20.6
Grundy 10 7.8 3.7 14.4
Hamilton 2 7.2 0.8 29.8
Hancock 6 17.7 6.2 37.9
Hardin 2 20.0 1.8 78.6
Henderson 0
Henry 14 9.3 4.7 16.3
Iroquois 3 4.1 0.7 12.5
Jackson 8 5.6 2.3 11.2
Jasper 2 9.6 1.1 33.6
Jefferson 14 12.0 6.3 20.9
Jersey 3 3.5 0.7 11.9
Jo Daviess 2 3.7 0.3 14.6
Johnson 2 7.8 0.7 29.3
Kane 91 6.8 5.5 8.4 78 6.6 5.2 8.3 8 10.2 4.4 20.4
Kankakee 21 7.8 4.7 11.9 20 8.9 5.4 14.0 0
Kendall 10 3.2 1.5 6.0
Knox 8 7.2 2.9 14.4
Lake 97 5.1 4.1 6.3 79 5.1 4.0 6.4 14 10.3 5.6 17.6
LaSalle 29 9.2 6.0 13.6
Lawrence 2 3.3 0.4 15.2
I - 25

Cervix, Illinois, 2012-2016Figures include invasive cancer and bladder cancer in situ. Incidence counts are five-year totals. Rates are per 100,000 age-adjusted
to the 2000 U.S. standard population. Lower confidence intervals (LCI) and upper confidence intervals (UCI) are 95 percent for rates,
Tiwari method. DATA SOURCE: Illinois Department of Public Health, Illinois State Cancer Registry, data as of November 2018
County Count Rate LCI UCI Count Rate LCI UCI Count Rate LCI UCI
All Races White Black
Cancer Incidence Counts and Age-adjusted Rates by County
Lee 12 12.9 6.4 23.3
Livingston 13 13.5 7.0 23.4
Logan 10 15.1 7.2 27.8
Macon 35 12.9 8.8 18.2 30 13.4 8.8 19.6 5 11.6 3.7 26.7
Macoupin 14 11.9 6.3 20.3
Madison 63 8.6 6.5 11.1 54 8.4 6.2 11.0 8 15.8 6.5 31.5
Marion 5 5.2 1.6 12.4
Marshall 2 5.5 0.5 22.5
Mason 5 14.0 4.2 34.0
Massac 2 7.0 0.8 23.5
McDonough 8 13.5 5.6 26.7
McHenry 41 4.9 3.5 6.8
McLean 27 6.5 4.2 9.5
Menard 2 5.8 0.5 22.8
Mercer 2 5.2 0.5 19.5
Monroe 4 4.7 1.2 12.5
Montgomery 8 9.8 3.9 20.2
Morgan 5 5.4 1.7 13.0
Moultrie 4 13.4 3.5 33.6
Ogle 11 7.9 3.8 14.5
Peoria 43 8.8 6.3 12.0 34 9.1 6.1 12.9 8 9.4 3.9 18.9
Perry 8 15.9 6.4 32.2
Piatt 4 7.3 1.9 20.5
Pike 4 10.4 2.4 28.0
Pope 2 28.3 3.4 98.4
Pulaski 1 9.7 0.2 47.1
Putnam 1 3.5 0.1 33.7
Randolph 3 4.2 0.8 12.4
Richland 4 8.7 2.3 23.3
Rock Island 38 10.9 7.6 15.2 33 10.5 7.0 15.0 2 7.1 0.9 24.4
Saline 7 12.2 4.7 25.5
Sangamon 44 8.1 5.8 11.1 34 7.4 5.0 10.5 7 11.6 4.6 24.3
Schuyler 1 6.6 0.2 35.8
Scott 2 8.8 1.1 42.0
Shelby 5 8.4 2.5 20.4
St Clair 67 9.5 7.3 12.1 38 8.3 5.8 11.4 28 12.6 8.3 18.4
Stark 5 37.6 12.1 87.6
Stephenson 12 10.6 5.1 19.1
Tazewell 31 9.0 6.0 12.9
Union 3 8.4 1.7 23.7
Vermilion 25 12.0 7.5 18.0 24 13.1 8.1 20.1 1 4.5 0.1 24.6
Wabash 2 9.8 1.2 32.3
Warren 4 13.1 3.6 31.7
Washington 2 5.3 0.6 19.8
Wayne 5 9.9 2.9 24.7
White 2 3.9 0.4 16.6
Whiteside 14 7.8 4.0 13.7
Will 113 6.3 5.2 7.6 95 6.4 5.1 7.8 12 5.6 2.9 10.0
Williamson 19 10.4 6.1 16.6
Winnebago 66 8.8 6.7 11.3 59 9.4 7.1 12.3 6 7.0 2.5 15.3
Woodford 5 5.6 1.7 13.1
I - 26

Cervix, Illinois, 2012-2016Figures include invasive cancer and bladder cancer in situ. Incidence counts are five-year totals.
Rates are per 100,000 age-adjusted to the 2000 U.S. standard population. Lower confidence
intervals (LCI) and upper confidence intervals (UCI) are 95 percent for rates, Tiwari method.
DATA SOURCE: Illinois Department of Public Health, Illinois State Cancer Registry, data as of
November 2018
County Count Rate LCI UCI Count Rate LCI UCI
Non-Hispanic Hispanic
Cancer Incidence Counts and Age-adjusted Rates by County
Illinois 2,255 7.5 7.2 7.9 374 9.3 8.3 10.4
Cook 907 7.8 7.3 8.3 260 10.1 8.9 11.5
DuPage 129 5.4 4.5 6.5 15 6.5 3.3 11.4
Kane 71 7.1 5.5 9.0 20 7.4 4.3 11.9
Lake 74 4.6 3.6 5.8 23 8.1 5.0 12.4
Will 96 6.0 4.8 7.4 17 7.0 4.0 11.7
I - 27

Female Breast (in situ), Illinois, 2012-2016Figures include invasive cancer and bladder cancer in situ. Incidence counts are five-year totals. Rates are per 100,000 age-adjusted
to the 2000 U.S. standard population. Lower confidence intervals (LCI) and upper confidence intervals (UCI) are 95 percent for rates,
Tiwari method. DATA SOURCE: Illinois Department of Public Health, Illinois State Cancer Registry, data as of November 2018
County Count Rate LCI UCI Count Rate LCI UCI Count Rate LCI UCI
All Races White Black
Cancer Incidence Counts and Age-adjusted Rates by County
Illinois 12,507 33.4 32.8 34.0 9,872 33.1 32.4 33.7 1,960 36.1 34.5 37.7
Adams 65 30.5 23.2 39.5
Alexander 5 18.5 5.9 47.7
Bond 16 27.7 15.6 46.7
Boone 44 28.2 20.4 38.1
Brown 0
Bureau 34 29.5 20.0 42.3
Calhoun 3 14.4 2.9 52.4
Carroll 12 20.6 9.7 40.0
Cass 11 28.8 14.1 52.8
Champaign 139 27.8 23.2 32.9 114 27.3 22.4 33.1 18 33.3 19.2 53.4
Christian 25 24.6 15.5 37.4
Clark 9 15.6 6.9 31.5
Clay 12 24.6 12.3 45.2
Clinton 33 28.6 19.4 41.0
Coles 19 14.0 8.2 22.3
Cook 5,021 33.8 32.8 34.7 3,229 33.5 32.4 34.8 1,457 35.8 33.9 37.7
Crawford 5 8.2 2.6 20.7
Cumberland 2 7.3 0.7 27.7
DeKalb 70 28.4 22.0 36.0
DeWitt 14 23.3 12.6 40.7
Douglas 13 22.9 11.8 40.1
DuPage 1,257 45.0 42.5 47.6 1,070 45.2 42.4 48.1 52 45.2 33.0 60.4
Edgar 19 31.6 18.3 51.5
Edwards 6 21.0 7.7 51.5
Effingham 26 25.2 16.1 37.7
Fayette 15 23.2 12.4 39.9
Ford 15 32.8 17.7 56.5
Franklin 29 21.2 13.9 31.2
Fulton 33 28.2 19.1 40.5
Gallatin 2 8.1 1.0 39.9
Greene 9 16.7 7.6 34.2
Grundy 29 21.1 14.0 30.5
Hamilton 3 12.8 2.2 40.5
Hancock 18 22.5 13.2 37.4
Hardin 2 11.8 1.4 58.1
Henderson 6 17.3 6.3 46.0
Henry 52 31.2 23.0 41.7
Iroquois 24 21.9 13.9 33.5
Jackson 41 30.4 21.5 41.7
Jasper 8 22.6 9.6 47.5
Jefferson 34 32.9 22.3 46.8
Jersey 18 24.3 14.1 39.6
Jo Daviess 26 30.1 19.0 46.3
Johnson 7 15.4 6.0 35.4
Kane 442 30.9 28.1 34.0 409 31.6 28.6 34.9 19 28.2 16.6 44.7
Kankakee 60 18.1 13.8 23.5 46 16.2 11.8 21.9 14 34.6 18.6 58.4
Kendall 129 45.3 37.6 54.0
Knox 55 33.5 24.7 44.5
Lake 787 38.7 36.0 41.6 682 39.2 36.3 42.4 38 31.1 21.7 43.0
LaSalle 86 24.6 19.4 30.7
I - 28

Female Breast (in situ), Illinois, 2012-2016Figures include invasive cancer and bladder cancer in situ. Incidence counts are five-year totals. Rates are per 100,000 age-adjusted
to the 2000 U.S. standard population. Lower confidence intervals (LCI) and upper confidence intervals (UCI) are 95 percent for rates,
Tiwari method. DATA SOURCE: Illinois Department of Public Health, Illinois State Cancer Registry, data as of November 2018
County Count Rate LCI UCI Count Rate LCI UCI Count Rate LCI UCI
All Races White Black
Cancer Incidence Counts and Age-adjusted Rates by County
Lawrence 8 16.3 6.6 34.4
Lee 22 18.8 11.5 29.5
Livingston 37 31.8 22.0 44.6
Logan 26 26.2 16.9 39.3
Macon 135 37.2 30.9 44.5 114 36.9 30.0 45.0 20 41.1 24.8 63.9
Macoupin 45 30.3 21.7 41.4
Madison 263 32.6 28.6 37.0 239 32.2 28.1 36.8 21 38.2 23.3 58.8
Marion 33 24.0 16.2 34.5
Marshall 15 37.7 20.1 65.6
Mason 10 21.5 9.8 42.0
Massac 12 21.2 10.8 38.7
McDonough 29 33.4 21.7 49.4
McHenry 285 31.2 27.6 35.2
McLean 119 27.9 23.0 33.5
Menard 13 32.2 16.4 57.6
Mercer 10 16.7 7.8 32.8
Monroe 39 37.5 26.3 52.0
Montgomery 15 17.1 9.2 29.3
Morgan 37 34.9 23.9 49.4
Moultrie 15 27.8 15.1 47.9
Ogle 34 20.6 14.1 29.2
Peoria 189 33.2 28.5 38.5 158 32.6 27.5 38.5 24 33.3 20.9 50.0
Perry 14 19.5 10.4 34.3
Piatt 16 31.4 17.4 52.6
Pike 11 19.0 9.1 36.0
Pope 4 26.7 7.2 82.7
Pulaski 1 4.7 0.1 33.6
Putnam 9 33.5 15.1 72.4
Randolph 28 26.6 17.3 39.6
Richland 11 20.5 9.8 38.5
Rock Island 126 26.9 22.2 32.4 120 27.9 22.8 33.8 6 20.1 7.3 43.2
Saline 13 15.4 7.8 27.8
Sangamon 252 40.6 35.5 46.2 213 38.6 33.4 44.5 34 61.6 42.1 86.8
Schuyler 9 36.7 15.9 75.1
Scott 6 35.5 12.2 83.1
Shelby 25 30.2 19.3 45.9
St Clair 300 37.4 33.2 42.1 201 35.8 30.8 41.3 89 40.3 32.2 49.8
Stark 1 4.4 0.1 34.0
Stephenson 39 24.9 17.2 35.0
Tazewell 143 33.5 28.0 39.8
Union 17 28.2 15.8 47.3
Vermilion 70 29.6 22.7 37.9 61 29.5 22.1 38.7 9 45.6 20.5 85.8
Wabash 9 23.1 10.2 46.3
Warren 14 24.9 13.1 43.5
Washington 15 30.0 16.4 51.4
Wayne 12 24.4 11.9 44.4
White 3 6.7 1.2 21.6
Whiteside 43 23.4 16.6 32.1
Will 758 39.8 36.9 42.7 610 38.4 35.4 41.7 92 44.1 35.2 54.7
Williamson 49 21.7 15.9 29.0
Winnebago 280 31.6 27.9 35.7 254 32.8 28.7 37.3 19 21.6 12.8 34.0
Woodford 48 43.5 31.6 58.3
I - 29

Female Breast (in situ), Illinois, 2012-2016Figures include invasive cancer and bladder cancer in situ. Incidence counts are five-year totals.
Rates are per 100,000 age-adjusted to the 2000 U.S. standard population. Lower confidence
intervals (LCI) and upper confidence intervals (UCI) are 95 percent for rates, Tiwari method.
DATA SOURCE: Illinois Department of Public Health, Illinois State Cancer Registry, data as of
November 2018
County Count Rate LCI UCI Count Rate LCI UCI
Non-Hispanic Hispanic
Cancer Incidence Counts and Age-adjusted Rates by County
Illinois 11,635 34.6 33.9 35.2 872 24.1 22.5 25.9
Cook 4,470 36.0 34.9 37.1 551 23.6 21.6 25.7
DuPage 1,186 46.0 43.4 48.8 71 31.2 23.9 39.9
Kane 392 33.4 30.1 37.0 50 19.5 14.0 26.3
Lake 722 40.4 37.4 43.6 65 27.3 20.6 35.4
Will 715 41.4 38.4 44.6 43 22.6 15.9 31.1
I - 30

Prostate, Illinois, 2012-2016Figures include invasive cancer and bladder cancer in situ. Incidence counts are five-year totals. Rates are per 100,000 age-adjusted
to the 2000 U.S. standard population. Lower confidence intervals (LCI) and upper confidence intervals (UCI) are 95 percent for rates,
Tiwari method. DATA SOURCE: Illinois Department of Public Health, Illinois State Cancer Registry, data as of November 2018
County Count Rate LCI UCI Count Rate LCI UCI Count Rate LCI UCI
All Races White Black
Cancer Incidence Counts and Age-adjusted Rates by County
Illinois 38,543 109.5 108.4 110.6 29,709 101.1 99.9 102.3 7,091 171.4 167.2 175.6
Adams 207 93.4 81.0 107.4
Alexander 34 128.6 88.4 183.8
Bond 60 109.1 82.8 141.6
Boone 133 87.2 72.6 103.9
Brown 16 84.9 47.9 140.1
Bureau 156 127.1 107.7 149.4
Calhoun 28 137.2 90.9 204.3
Carroll 61 99.1 75.2 129.8
Cass 32 79.3 53.9 113.1
Champaign 509 111.0 101.2 121.3 423 106.7 96.5 117.8 72 171.2 130.8 219.6
Christian 129 113.6 94.7 135.5
Clark 52 94.1 70.1 124.8
Clay 54 115.9 86.5 153.1
Clinton 127 113.1 93.9 135.1
Coles 108 72.7 59.4 88.3
Cook 15,172 114.6 112.7 116.5 9,175 99.2 97.1 101.3 5,165 172.0 167.2 177.0
Crawford 65 101.2 77.7 130.2
Cumberland 25 70.2 45.1 105.5
DeKalb 280 118.7 104.8 133.9
DeWitt 70 130.2 101.0 166.0
Douglas 78 130.0 102.3 163.4
DuPage 2,813 108.7 104.5 113.0 2,433 108.7 104.3 113.3 136 170.0 139.0 205.9
Edgar 60 95.2 72.1 124.2
Edwards 22 90.3 55.8 141.3
Effingham 155 149.0 126.0 175.2
Fayette 77 106.2 83.6 133.4
Ford 42 96.2 68.8 131.8
Franklin 151 111.5 94.2 131.4
Fulton 106 83.2 68.0 101.2
Gallatin 16 75.8 42.4 130.2
Greene 50 109.6 81.1 145.9
Grundy 179 136.7 116.6 159.3
Hamilton 35 116.8 80.9 165.4
Hancock 61 83.0 63.3 108.1
Hardin 17 88.6 50.8 151.9
Henderson 17 55.2 32.0 94.5
Henry 172 95.2 81.3 111.1
Iroquois 88 84.7 67.8 105.2
Jackson 124 86.0 71.1 103.1
Jasper 50 147.6 108.9 197.1
Jefferson 175 137.8 117.8 160.5
Jersey 86 116.4 92.7 144.9
Jo Daviess 109 109.4 89.3 133.7
Johnson 43 86.3 62.1 118.1
Kane 1,390 104.8 99.1 110.7 1,224 101.1 95.3 107.1 111 183.5 148.6 224.0
Kankakee 336 102.8 91.9 114.7 253 89.0 78.2 101.0 78 211.1 164.6 266.2
Kendall 301 130.1 114.9 146.7
Knox 153 84.0 71.0 99.0
Lake 1,856 97.2 92.7 102.0 1,598 94.7 89.9 99.7 161 149.0 125.1 176.2
LaSalle 487 134.1 122.2 146.9
I - 31

Prostate, Illinois, 2012-2016Figures include invasive cancer and bladder cancer in situ. Incidence counts are five-year totals. Rates are per 100,000 age-adjusted
to the 2000 U.S. standard population. Lower confidence intervals (LCI) and upper confidence intervals (UCI) are 95 percent for rates,
Tiwari method. DATA SOURCE: Illinois Department of Public Health, Illinois State Cancer Registry, data as of November 2018
County Count Rate LCI UCI Count Rate LCI UCI Count Rate LCI UCI
All Races White Black
Cancer Incidence Counts and Age-adjusted Rates by County
Lawrence 59 119.2 90.5 154.5
Lee 122 97.2 80.4 116.8
Livingston 140 113.5 95.1 134.6
Logan 103 113.3 92.2 138.1
Macon 420 121.0 109.4 133.5 325 106.5 95.0 119.2 87 218.7 172.4 273.5
Macoupin 168 106.4 90.7 124.3
Madison 702 87.8 81.3 94.7 635 84.7 78.1 91.8 56 128.3 95.4 168.8
Marion 182 137.7 118.2 159.8
Marshall 54 118.1 88.0 156.8
Mason 43 80.0 57.4 109.9
Massac 49 98.8 72.8 132.1
McDonough 86 97.0 77.2 120.8
McHenry 869 101.8 94.8 109.2
McLean 467 112.2 102.0 123.3
Menard 49 108.1 79.2 145.6
Mercer 46 77.4 56.2 105.3
Monroe 115 105.5 86.5 127.7
Montgomery 87 89.8 71.7 111.5
Morgan 142 124.9 104.8 148.0
Moultrie 36 77.6 54.0 108.8
Ogle 135 76.9 64.3 91.6
Peoria 619 114.4 105.3 124.0 484 103.3 94.1 113.2 112 175.1 142.3 213.1
Perry 75 105.6 82.8 133.3
Piatt 66 114.6 88.2 147.4
Pike 56 95.6 71.8 125.8
Pope 25 118.4 75.9 185.7
Pulaski 24 113.9 71.9 175.4
Putnam 26 102.7 66.4 156.7
Randolph 91 80.7 64.6 99.9
Richland 55 97.8 73.6 128.5
Rock Island 470 98.1 89.3 107.6 403 91.1 82.2 100.7 40 139.5 97.6 192.4
Saline 90 108.1 86.6 133.8
Sangamon 713 122.8 113.7 132.5 643 120.8 111.4 130.9 61 147.7 109.2 194.6
Schuyler 39 136.6 96.5 190.6
Scott 23 130.7 82.3 200.8
Shelby 85 101.0 80.5 126.0
St Clair 715 97.5 90.3 105.2 475 85.1 77.4 93.3 230 137.9 119.7 157.9
Stark 22 98.6 61.1 155.2
Stephenson 157 91.7 77.7 107.7
Tazewell 433 100.7 91.3 110.9
Union 68 102.3 79.2 131.1
Vermilion 295 114.6 101.7 128.8 252 107.0 94.0 121.6 40 213.5 149.2 294.7
Wabash 36 86.9 60.6 122.3
Warren 48 77.4 56.8 104.0
Washington 73 149.1 116.2 189.3
Wayne 77 129.0 101.4 162.7
White 62 119.7 91.3 155.4
Whiteside 193 95.8 82.6 110.9
Will 2,089 123.8 118.3 129.5 1,619 112.1 106.4 117.9 360 223.8 198.6 251.3
Williamson 204 93.7 81.1 107.9
Winnebago 831 95.4 88.9 102.3 705 90.2 83.6 97.3 115 165.8 135.0 201.3
Woodford 142 110.0 92.3 130.4
I - 32

Prostate, Illinois, 2012-2016Figures include invasive cancer and bladder cancer in situ. Incidence counts are five-year totals.
Rates are per 100,000 age-adjusted to the 2000 U.S. standard population. Lower confidence
intervals (LCI) and upper confidence intervals (UCI) are 95 percent for rates, Tiwari method.
DATA SOURCE: Illinois Department of Public Health, Illinois State Cancer Registry, data as of
November 2018
County Count Rate LCI UCI Count Rate LCI UCI
Non-Hispanic Hispanic
Cancer Incidence Counts and Age-adjusted Rates by County
Illinois 36,113 111.5 110.4 112.7 2,430 90.1 86.2 94.1
Cook 13,542 119.4 117.3 121.5 1,630 89.6 84.9 94.4
DuPage 2,669 109.4 105.1 113.8 144 104.5 86.3 125.1
Kane 1,244 108.9 102.7 115.4 146 86.6 71.2 104.0
Lake 1,731 99.0 94.2 104.0 125 82.5 66.4 101.0
Will 1,965 125.7 120.0 131.6 124 105.0 85.3 127.4
I - 33

SECTION II
Percent Distribution of Stage at Diagnosis by County
Illinois, 2012-2016
II - 1
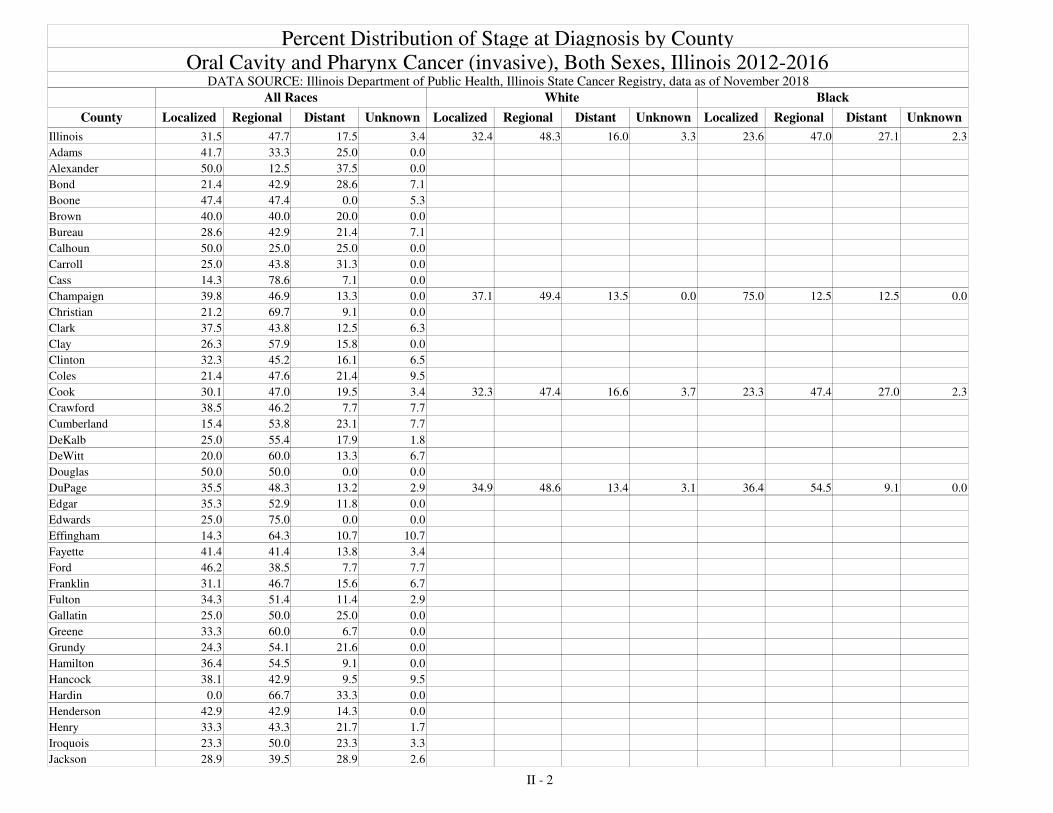
Oral Cavity and Pharynx Cancer (invasive), Both Sexes, Illinois 2012-2016DATA SOURCE: Illinois Department of Public Health, Illinois State Cancer Registry, data as of November 2018
County Localized Regional Distant Unknown
All Races White Black
Percent Distribution of Stage at Diagnosis by County
Localized Regional Distant Unknown Localized Regional Distant Unknown
Illinois 31.5 47.7 17.5 3.4 32.4 48.3 16.0 3.3 23.6 47.0 27.1 2.3
Adams 41.7 33.3 25.0 0.0
Alexander 50.0 12.5 37.5 0.0
Bond 21.4 42.9 28.6 7.1
Boone 47.4 47.4 0.0 5.3
Brown 40.0 40.0 20.0 0.0
Bureau 28.6 42.9 21.4 7.1
Calhoun 50.0 25.0 25.0 0.0
Carroll 25.0 43.8 31.3 0.0
Cass 14.3 78.6 7.1 0.0
Champaign 39.8 46.9 13.3 0.0 37.1 49.4 13.5 0.0 75.0 12.5 12.5 0.0
Christian 21.2 69.7 9.1 0.0
Clark 37.5 43.8 12.5 6.3
Clay 26.3 57.9 15.8 0.0
Clinton 32.3 45.2 16.1 6.5
Coles 21.4 47.6 21.4 9.5
Cook 30.1 47.0 19.5 3.4 32.3 47.4 16.6 3.7 23.3 47.4 27.0 2.3
Crawford 38.5 46.2 7.7 7.7
Cumberland 15.4 53.8 23.1 7.7
DeKalb 25.0 55.4 17.9 1.8
DeWitt 20.0 60.0 13.3 6.7
Douglas 50.0 50.0 0.0 0.0
DuPage 35.5 48.3 13.2 2.9 34.9 48.6 13.4 3.1 36.4 54.5 9.1 0.0
Edgar 35.3 52.9 11.8 0.0
Edwards 25.0 75.0 0.0 0.0
Effingham 14.3 64.3 10.7 10.7
Fayette 41.4 41.4 13.8 3.4
Ford 46.2 38.5 7.7 7.7
Franklin 31.1 46.7 15.6 6.7
Fulton 34.3 51.4 11.4 2.9
Gallatin 25.0 50.0 25.0 0.0
Greene 33.3 60.0 6.7 0.0
Grundy 24.3 54.1 21.6 0.0
Hamilton 36.4 54.5 9.1 0.0
Hancock 38.1 42.9 9.5 9.5
Hardin 0.0 66.7 33.3 0.0
Henderson 42.9 42.9 14.3 0.0
Henry 33.3 43.3 21.7 1.7
Iroquois 23.3 50.0 23.3 3.3
Jackson 28.9 39.5 28.9 2.6
II - 2
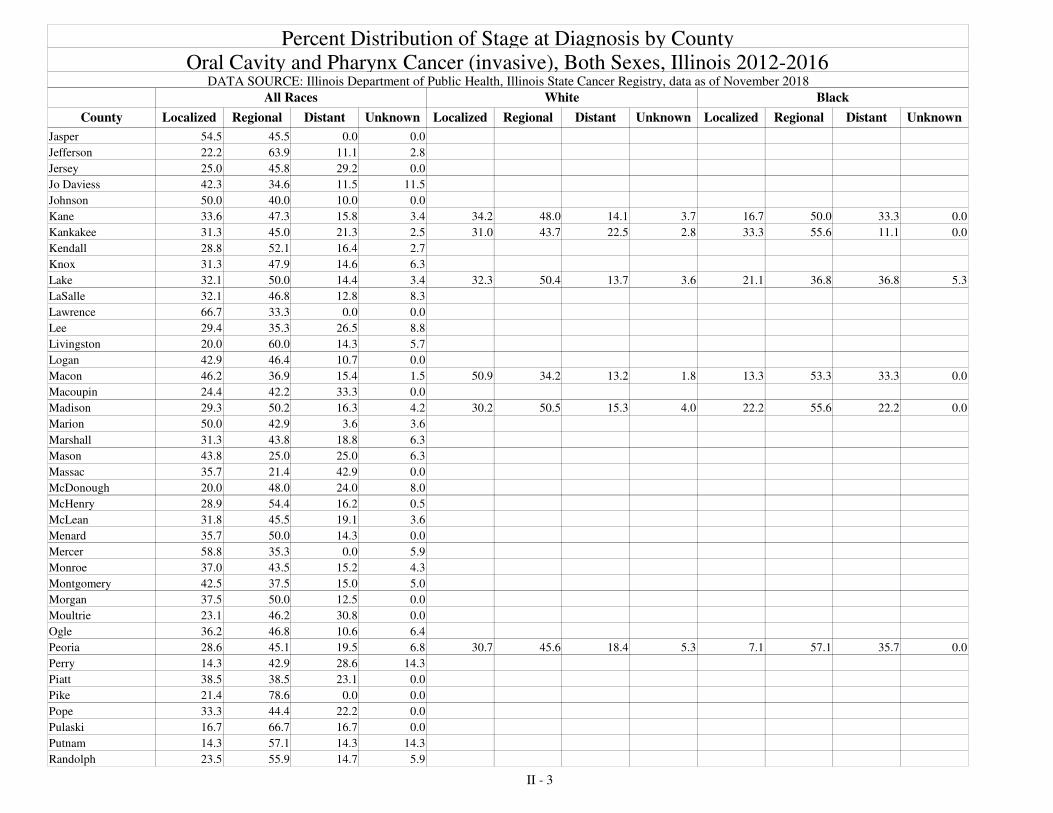
Oral Cavity and Pharynx Cancer (invasive), Both Sexes, Illinois 2012-2016DATA SOURCE: Illinois Department of Public Health, Illinois State Cancer Registry, data as of November 2018
County Localized Regional Distant Unknown
All Races White Black
Percent Distribution of Stage at Diagnosis by County
Localized Regional Distant Unknown Localized Regional Distant Unknown
Jasper 54.5 45.5 0.0 0.0
Jefferson 22.2 63.9 11.1 2.8
Jersey 25.0 45.8 29.2 0.0
Jo Daviess 42.3 34.6 11.5 11.5
Johnson 50.0 40.0 10.0 0.0
Kane 33.6 47.3 15.8 3.4 34.2 48.0 14.1 3.7 16.7 50.0 33.3 0.0
Kankakee 31.3 45.0 21.3 2.5 31.0 43.7 22.5 2.8 33.3 55.6 11.1 0.0
Kendall 28.8 52.1 16.4 2.7
Knox 31.3 47.9 14.6 6.3
Lake 32.1 50.0 14.4 3.4 32.3 50.4 13.7 3.6 21.1 36.8 36.8 5.3
LaSalle 32.1 46.8 12.8 8.3
Lawrence 66.7 33.3 0.0 0.0
Lee 29.4 35.3 26.5 8.8
Livingston 20.0 60.0 14.3 5.7
Logan 42.9 46.4 10.7 0.0
Macon 46.2 36.9 15.4 1.5 50.9 34.2 13.2 1.8 13.3 53.3 33.3 0.0
Macoupin 24.4 42.2 33.3 0.0
Madison 29.3 50.2 16.3 4.2 30.2 50.5 15.3 4.0 22.2 55.6 22.2 0.0
Marion 50.0 42.9 3.6 3.6
Marshall 31.3 43.8 18.8 6.3
Mason 43.8 25.0 25.0 6.3
Massac 35.7 21.4 42.9 0.0
McDonough 20.0 48.0 24.0 8.0
McHenry 28.9 54.4 16.2 0.5
McLean 31.8 45.5 19.1 3.6
Menard 35.7 50.0 14.3 0.0
Mercer 58.8 35.3 0.0 5.9
Monroe 37.0 43.5 15.2 4.3
Montgomery 42.5 37.5 15.0 5.0
Morgan 37.5 50.0 12.5 0.0
Moultrie 23.1 46.2 30.8 0.0
Ogle 36.2 46.8 10.6 6.4
Peoria 28.6 45.1 19.5 6.8 30.7 45.6 18.4 5.3 7.1 57.1 35.7 0.0
Perry 14.3 42.9 28.6 14.3
Piatt 38.5 38.5 23.1 0.0
Pike 21.4 78.6 0.0 0.0
Pope 33.3 44.4 22.2 0.0
Pulaski 16.7 66.7 16.7 0.0
Putnam 14.3 57.1 14.3 14.3
Randolph 23.5 55.9 14.7 5.9
II - 3

Oral Cavity and Pharynx Cancer (invasive), Both Sexes, Illinois 2012-2016DATA SOURCE: Illinois Department of Public Health, Illinois State Cancer Registry, data as of November 2018
County Localized Regional Distant Unknown
All Races White Black
Percent Distribution of Stage at Diagnosis by County
Localized Regional Distant Unknown Localized Regional Distant Unknown
Richland 36.4 18.2 45.5 0.0
Rock Island 36.8 41.2 20.2 1.8 37.6 40.6 19.8 2.0 0.0 57.1 42.9 0.0
Saline 37.5 45.8 12.5 4.2
Sangamon 29.9 53.1 15.5 1.5 30.6 53.9 15.0 0.6 27.3 54.5 18.2 0.0
Schuyler 20.0 80.0 0.0 0.0
Scott 33.3 33.3 33.3 0.0
Shelby 56.3 31.3 12.5 0.0
St Clair 29.3 45.9 22.5 2.3 29.9 45.5 21.6 3.0 26.5 46.9 26.5 0.0
Stark 57.1 14.3 14.3 14.3
Stephenson 31.3 43.8 21.9 3.1
Tazewell 28.0 49.7 17.5 4.9
Union 23.1 61.5 15.4 0.0
Vermilion 30.0 51.4 12.9 5.7 29.7 54.7 10.9 4.7 20.0 20.0 40.0 20.0
Wabash 50.0 25.0 25.0 0.0
Warren 33.3 53.3 6.7 6.7
Washington 47.6 38.1 14.3 0.0
Wayne 14.3 42.9 42.9 0.0
White 46.2 46.2 7.7 0.0
Whiteside 41.2 43.1 5.9 9.8
Will 28.2 50.2 18.4 3.2 27.4 52.3 17.0 3.3 33.3 37.0 25.9 3.7
Williamson 27.1 52.5 15.3 5.1
Winnebago 29.6 52.6 16.4 1.4 29.6 53.8 15.1 1.5 25.0 33.3 41.7 0.0
Woodford 38.1 42.9 14.3 4.8
Oral Cavity and Pharynx Cancer (invasive), Both Sexes, Illinois 2012-2016DATA SOURCE: Illinois Department of Public Health, Illinois State Cancer Registry, data as of November 2018
County Localized Regional Distant Unknown
Hispanic Non-Hispanic
Percent Distribution of Stage of Disease at Diagnosis by Ethnicity and County
Localized Regional Distant Unknown
Illinois 33.8 46.4 16.0 3.8 31.4 47.7 17.6 3.4
Cook 33.3 46.0 16.3 4.3 29.8 47.1 19.8 3.3
DuPage 25.0 65.0 10.0 0.0 35.9 47.7 13.4 3.0
Kane 41.2 47.1 11.8 0.0 33.1 47.3 16.0 3.6
Lake 31.8 63.6 4.5 0.0 32.1 49.3 15.0 3.6
Will 13.6 50.0 27.3 9.1 29.0 50.3 17.9 2.8
II - 4

Colon and Rectal Cancer (invasive), Both Sexes, Illinois 2012-2016DATA SOURCE: Illinois Department of Public Health, Illinois State Cancer Registry, data as of November 2018
County Localized Regional Distant Unknown
All Races White Black
Percent Distribution of Stage at Diagnosis by County
Localized Regional Distant Unknown Localized Regional Distant Unknown
Illinois 38.2 34.9 20.8 6.1 38.5 35.4 20.3 5.8 35.9 32.2 24.6 7.3
Adams 27.8 46.4 20.1 5.7
Alexander 43.3 23.3 23.3 10.0
Bond 46.4 25.0 10.7 17.9
Boone 40.0 33.0 20.0 7.0
Brown 27.8 61.1 11.1 0.0
Bureau 42.1 32.5 21.9 3.5
Calhoun 36.7 40.0 10.0 13.3
Carroll 54.7 30.2 11.3 3.8
Cass 33.3 42.2 20.0 4.4
Champaign 38.6 33.4 19.5 8.5 36.8 34.3 19.9 9.0 48.6 27.0 21.6 2.7
Christian 38.8 36.4 20.2 4.7
Clark 21.7 45.7 21.7 10.9
Clay 40.4 38.3 14.9 6.4
Clinton 33.0 30.9 29.8 6.4
Coles 33.6 32.2 21.7 12.6
Cook 38.8 34.3 21.2 5.8 39.9 35.0 20.0 5.1 35.6 32.2 24.7 7.5
Crawford 32.7 44.9 16.3 6.1
Cumberland 40.9 29.5 15.9 13.6
DeKalb 39.1 33.5 20.8 6.6
DeWitt 33.3 42.0 14.5 10.1
Douglas 45.7 28.3 19.6 6.5
DuPage 36.7 37.7 21.1 4.5 35.9 37.8 21.6 4.7 38.4 37.2 19.8 4.7
Edgar 29.9 46.3 20.9 3.0
Edwards 30.0 56.7 10.0 3.3
Effingham 39.7 32.2 18.2 9.9
Fayette 40.4 31.6 22.8 5.3
Ford 46.7 33.3 8.9 11.1
Franklin 31.3 39.8 21.1 7.8
Fulton 32.1 42.5 15.7 9.7
Gallatin 22.2 61.1 5.6 11.1
Greene 34.2 31.6 23.7 10.5
Grundy 42.7 28.2 19.4 9.7
Hamilton 32.3 51.6 16.1 0.0
Hancock 22.4 36.2 36.2 5.2
Hardin 25.0 58.3 8.3 8.3
Henderson 33.3 41.7 16.7 8.3
Henry 45.8 34.7 14.6 4.9
Iroquois 37.7 34.0 21.7 6.6
Jackson 40.3 40.3 10.5 8.9
II - 5

Colon and Rectal Cancer (invasive), Both Sexes, Illinois 2012-2016DATA SOURCE: Illinois Department of Public Health, Illinois State Cancer Registry, data as of November 2018
County Localized Regional Distant Unknown
All Races White Black
Percent Distribution of Stage at Diagnosis by County
Localized Regional Distant Unknown Localized Regional Distant Unknown
Jasper 31.7 39.0 19.5 9.8
Jefferson 40.4 37.5 19.1 2.9
Jersey 31.8 29.5 31.8 6.8
Jo Daviess 37.1 30.0 14.3 18.6
Johnson 40.4 23.4 29.8 6.4
Kane 40.1 32.2 21.9 5.7 40.4 32.2 21.5 5.9 43.1 27.5 27.5 2.0
Kankakee 40.9 29.7 22.4 7.0 40.6 30.3 23.1 6.0 43.6 25.5 18.2 12.7
Kendall 36.9 39.7 18.7 4.7
Knox 41.5 33.0 23.3 2.3
Lake 36.5 37.6 19.2 6.7 37.0 38.2 19.0 5.9 35.1 29.9 27.8 7.2
LaSalle 32.0 34.9 25.1 8.0
Lawrence 34.9 48.8 11.6 4.7
Lee 26.4 34.9 32.1 6.6
Livingston 27.4 50.8 16.9 4.8
Logan 41.1 34.8 20.5 3.6
Macon 38.1 34.7 22.5 4.7 38.3 34.3 22.5 4.9 36.0 38.0 22.0 4.0
Macoupin 37.6 38.2 21.8 2.4
Madison 38.8 32.2 22.3 6.8 39.0 32.5 21.9 6.6 35.7 28.6 26.2 9.5
Marion 30.8 42.0 21.0 6.3
Marshall 37.3 23.5 29.4 9.8
Mason 39.7 27.6 24.1 8.6
Massac 44.9 30.6 16.3 8.2
McDonough 43.8 37.5 10.4 8.3
McHenry 37.8 35.2 22.4 4.5
McLean 43.9 31.6 19.7 4.8
Menard 43.6 35.9 17.9 2.6
Mercer 36.4 27.3 29.5 6.8
Monroe 28.9 42.2 21.7 7.2
Montgomery 35.9 37.6 19.7 6.8
Morgan 40.9 35.5 18.2 5.5
Moultrie 44.4 31.1 17.8 6.7
Ogle 39.9 38.4 16.7 5.1
Peoria 36.2 37.2 20.3 6.2 34.9 38.7 20.7 5.8 38.1 31.7 22.2 7.9
Perry 43.4 31.6 17.1 7.9
Piatt 44.7 21.3 21.3 12.8
Pike 38.9 37.0 20.4 3.7
Pope 33.3 50.0 16.7 0.0
Pulaski 25.0 31.3 37.5 6.3
Putnam 47.6 14.3 28.6 9.5
Randolph 34.3 38.9 19.4 7.4
II - 6

Colon and Rectal Cancer (invasive), Both Sexes, Illinois 2012-2016DATA SOURCE: Illinois Department of Public Health, Illinois State Cancer Registry, data as of November 2018
County Localized Regional Distant Unknown
All Races White Black
Percent Distribution of Stage at Diagnosis by County
Localized Regional Distant Unknown Localized Regional Distant Unknown
Richland 33.3 40.9 22.7 3.0
Rock Island 37.6 35.6 19.5 7.3 37.6 35.4 19.3 7.8 32.0 44.0 20.0 4.0
Saline 44.0 33.3 13.1 9.5
Sangamon 39.4 35.1 21.7 3.7 38.6 35.4 21.7 4.2 44.4 35.2 20.4 0.0
Schuyler 28.6 47.6 9.5 14.3
Scott 63.6 9.1 13.6 13.6
Shelby 36.2 31.9 21.3 10.6
St Clair 37.7 33.1 22.5 6.7 39.5 35.7 19.1 5.7 34.2 28.1 29.1 8.5
Stark 12.9 48.4 29.0 9.7
Stephenson 47.1 27.9 13.6 11.4
Tazewell 35.6 36.0 21.2 7.2
Union 35.8 34.3 25.4 4.5
Vermilion 39.3 38.2 16.8 5.6 39.4 38.2 16.7 5.6 37.0 44.4 18.5 0.0
Wabash 27.3 40.0 18.2 14.5
Warren 41.0 42.6 13.1 3.3
Washington 24.1 51.9 11.1 13.0
Wayne 40.0 36.0 18.0 6.0
White 44.9 34.7 16.3 4.1
Whiteside 49.7 23.4 18.7 8.2
Will 39.7 33.1 21.5 5.8 39.5 33.8 21.2 5.5 42.5 25.7 26.3 5.4
Williamson 40.7 31.3 17.7 10.3
Winnebago 38.3 33.2 20.9 7.6 39.8 32.9 20.2 7.1 28.6 34.1 26.4 11.0
Woodford 29.8 36.5 26.0 7.7
Colon and Rectal Cancer (invasive), Both Sexes, Illinois 2012-2016DATA SOURCE: Illinois Department of Public Health, Illinois State Cancer Registry, data as of November 2018
County Localized Regional Distant Unknown
Hispanic Non-Hispanic
Percent Distribution of Stage of Disease at Diagnosis by Ethnicity and County
Localized Regional Distant Unknown
Illinois 37.8 36.1 21.4 4.7 38.2 34.8 20.7 6.2
Cook 38.8 35.8 21.5 3.9 38.8 34.1 21.1 6.0
DuPage 40.6 31.1 25.5 2.8 36.5 38.1 20.8 4.6
Kane 35.1 35.1 23.7 6.2 40.7 31.9 21.7 5.7
Lake 33.1 38.8 20.7 7.4 36.8 37.5 19.1 6.6
Will 36.1 37.0 21.3 5.6 40.0 32.7 21.5 5.8
II - 7

Melanoma of the Skin (invasive), Both Sexes, Illinois 2012-2016DATA SOURCE: Illinois Department of Public Health, Illinois State Cancer Registry, data as of November 2018
County Localized Regional Distant Unknown
All Races White Black
Percent Distribution of Stage at Diagnosis by County
Localized Regional Distant Unknown Localized Regional Distant Unknown
Illinois 81.5 8.8 5.2 4.6 81.4 9.1 5.3 4.3 58.5 16.9 20.0 4.6
Adams 89.1 5.1 5.1 0.7
Alexander 100.0 0.0 0.0 0.0
Bond 68.2 9.1 4.5 18.2
Boone 85.7 9.5 3.2 1.6
Brown 33.3 33.3 33.3 0.0
Bureau 78.6 10.0 8.6 2.9
Calhoun 60.0 40.0 0.0 0.0
Carroll 67.9 14.3 7.1 10.7
Cass 95.0 5.0 0.0 0.0
Champaign 85.0 7.9 2.9 4.3 82.1 9.4 3.4 5.1 100.0 0.0 0.0 0.0
Christian 84.8 10.9 0.0 4.3
Clark 70.8 25.0 4.2 0.0
Clay 78.9 10.5 0.0 10.5
Clinton 79.7 8.5 6.8 5.1
Coles 65.1 12.0 6.0 16.9
Cook 80.8 9.1 5.8 4.3 81.3 9.3 5.8 3.6 47.8 23.9 23.9 4.3
Crawford 89.3 3.6 7.1 0.0
Cumberland 66.7 11.1 5.6 16.7
DeKalb 78.0 8.8 8.8 4.4
DeWitt 81.3 3.1 3.1 12.5
Douglas 90.9 3.0 0.0 6.1
DuPage 85.0 7.6 5.0 2.4 84.9 7.8 4.9 2.4 100.0 0.0 0.0 0.0
Edgar 81.3 3.1 3.1 12.5
Edwards 100.0 0.0 0.0 0.0
Effingham 76.1 13.0 2.2 8.7
Fayette 95.8 4.2 0.0 0.0
Ford 83.3 5.6 5.6 5.6
Franklin 85.1 8.1 1.4 5.4
Fulton 97.8 2.2 0.0 0.0
Gallatin 100.0 0.0 0.0 0.0
Greene 89.5 5.3 5.3 0.0
Grundy 84.5 8.6 3.4 3.4
Hamilton 81.8 13.6 4.5 0.0
Hancock 83.3 5.6 5.6 5.6
Hardin 83.3 16.7 0.0 0.0
Henderson 100.0 0.0 0.0 0.0
Henry 78.0 8.5 7.3 6.1
Iroquois 71.4 14.3 4.1 10.2
Jackson 83.3 10.6 3.0 3.0
II - 8

Melanoma of the Skin (invasive), Both Sexes, Illinois 2012-2016DATA SOURCE: Illinois Department of Public Health, Illinois State Cancer Registry, data as of November 2018
County Localized Regional Distant Unknown
All Races White Black
Percent Distribution of Stage at Diagnosis by County
Localized Regional Distant Unknown Localized Regional Distant Unknown
Jasper 93.8 6.3 0.0 0.0
Jefferson 67.1 14.3 8.6 10.0
Jersey 75.8 9.1 6.1 9.1
Jo Daviess 74.4 9.3 0.0 16.3
Johnson 91.7 8.3 0.0 0.0
Kane 82.6 7.2 5.1 5.1 82.7 7.2 5.2 4.9 100.0 0.0 0.0 0.0
Kankakee 81.7 6.3 8.7 3.2 81.1 6.6 9.0 3.3
Kendall 82.9 10.5 3.8 2.9
Knox 78.7 10.7 8.0 2.7
Lake 79.5 8.1 5.3 7.2 80.5 8.2 5.6 5.7 100.0 0.0 0.0 0.0
LaSalle 71.6 13.6 3.4 11.4
Lawrence 76.5 0.0 17.6 5.9
Lee 81.4 4.3 5.7 8.6
Livingston 76.9 12.3 4.6 6.2
Logan 73.0 13.5 10.8 2.7
Macon 83.6 7.9 4.8 3.7 83.1 8.5 5.1 3.4 100.0 0.0 0.0 0.0
Macoupin 87.1 9.7 1.6 1.6
Madison 84.8 8.8 4.4 1.9 84.2 9.2 4.6 2.0
Marion 78.9 7.0 4.2 9.9
Marshall 94.1 0.0 5.9 0.0
Mason 94.7 5.3 0.0 0.0
Massac 66.7 11.1 11.1 11.1
McDonough 65.2 17.4 2.2 15.2
McHenry 84.5 7.0 5.9 2.7
McLean 81.3 7.6 1.4 9.7
Menard 77.3 13.6 4.5 4.5
Mercer 88.6 5.7 5.7 0.0
Monroe 85.5 5.5 3.6 5.5
Montgomery 72.5 22.5 2.5 2.5
Morgan 79.4 17.5 3.2 0.0
Moultrie 68.0 16.0 12.0 4.0
Ogle 75.3 15.7 4.5 4.5
Peoria 83.5 9.2 5.5 1.8 82.5 9.7 5.8 1.9 100.0 0.0 0.0 0.0
Perry 72.7 9.1 12.1 6.1
Piatt 93.6 2.1 2.1 2.1
Pike 82.4 5.9 5.9 5.9
Pope 87.5 12.5 0.0 0.0
Pulaski 55.6 22.2 0.0 22.2
Putnam 66.7 16.7 16.7 0.0
Randolph 90.2 7.3 2.4 0.0
II - 9
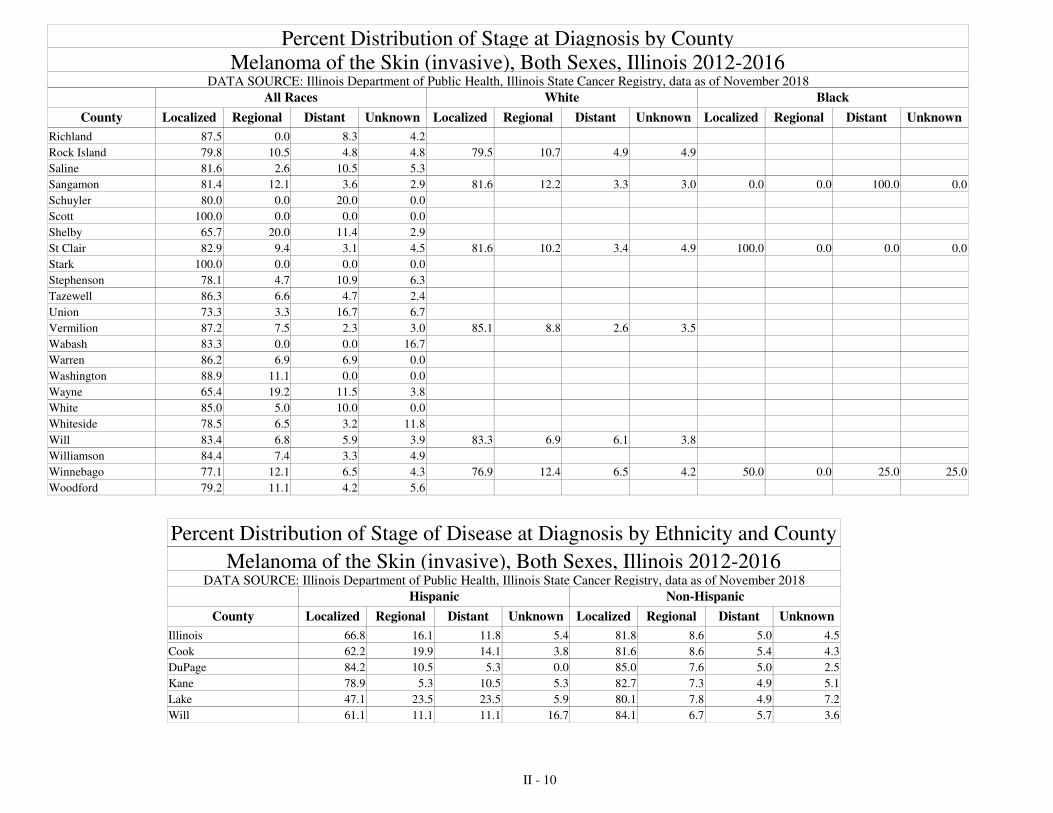
Melanoma of the Skin (invasive), Both Sexes, Illinois 2012-2016DATA SOURCE: Illinois Department of Public Health, Illinois State Cancer Registry, data as of November 2018
County Localized Regional Distant Unknown
All Races White Black
Percent Distribution of Stage at Diagnosis by County
Localized Regional Distant Unknown Localized Regional Distant Unknown
Richland 87.5 0.0 8.3 4.2
Rock Island 79.8 10.5 4.8 4.8 79.5 10.7 4.9 4.9
Saline 81.6 2.6 10.5 5.3
Sangamon 81.4 12.1 3.6 2.9 81.6 12.2 3.3 3.0 0.0 0.0 100.0 0.0
Schuyler 80.0 0.0 20.0 0.0
Scott 100.0 0.0 0.0 0.0
Shelby 65.7 20.0 11.4 2.9
St Clair 82.9 9.4 3.1 4.5 81.6 10.2 3.4 4.9 100.0 0.0 0.0 0.0
Stark 100.0 0.0 0.0 0.0
Stephenson 78.1 4.7 10.9 6.3
Tazewell 86.3 6.6 4.7 2.4
Union 73.3 3.3 16.7 6.7
Vermilion 87.2 7.5 2.3 3.0 85.1 8.8 2.6 3.5
Wabash 83.3 0.0 0.0 16.7
Warren 86.2 6.9 6.9 0.0
Washington 88.9 11.1 0.0 0.0
Wayne 65.4 19.2 11.5 3.8
White 85.0 5.0 10.0 0.0
Whiteside 78.5 6.5 3.2 11.8
Will 83.4 6.8 5.9 3.9 83.3 6.9 6.1 3.8
Williamson 84.4 7.4 3.3 4.9
Winnebago 77.1 12.1 6.5 4.3 76.9 12.4 6.5 4.2 50.0 0.0 25.0 25.0
Woodford 79.2 11.1 4.2 5.6
Melanoma of the Skin (invasive), Both Sexes, Illinois 2012-2016DATA SOURCE: Illinois Department of Public Health, Illinois State Cancer Registry, data as of November 2018
County Localized Regional Distant Unknown
Hispanic Non-Hispanic
Percent Distribution of Stage of Disease at Diagnosis by Ethnicity and County
Localized Regional Distant Unknown
Illinois 66.8 16.1 11.8 5.4 81.8 8.6 5.0 4.5
Cook 62.2 19.9 14.1 3.8 81.6 8.6 5.4 4.3
DuPage 84.2 10.5 5.3 0.0 85.0 7.6 5.0 2.5
Kane 78.9 5.3 10.5 5.3 82.7 7.3 4.9 5.1
Lake 47.1 23.5 23.5 5.9 80.1 7.8 4.9 7.2
Will 61.1 11.1 11.1 16.7 84.1 6.7 5.7 3.6
II - 10

Female Breast, Illinois 2012-2016DATA SOURCE: Illinois Department of Public Health, Illinois State Cancer Registry, data as of November 2018
County Localized Regional Distant Unknown
All Races White Black
Percent Distribution of Stage at Diagnosis by County
Localized Regional Distant Unknown Localized Regional Distant Unknownin situ in situ in situ
Illinois 51.6 22.3 5.1 1.1 53.0 21.8 4.8 1.1 45.0 25.3 6.9 1.319.9 19.4 21.5
Adams 54.6 21.2 4.9 1.617.7
Alexander 58.3 22.2 5.6 0.013.9
Bond 47.0 21.0 8.0 8.016.0
Boone 54.1 20.3 5.0 0.919.8
Brown 63.2 31.6 5.3 0.00.0
Bureau 51.7 24.2 3.4 1.719.1
Calhoun 36.4 45.5 4.5 0.013.6
Carroll 46.8 26.0 11.7 0.015.6
Cass 50.8 26.2 4.9 0.018.0
Champaign 53.0 22.4 5.1 1.8 54.1 21.9 5.0 1.8 44.7 29.8 4.3 2.117.7 17.2 19.1
Christian 51.1 27.8 6.3 0.614.2
Clark 49.2 26.2 6.2 4.613.8
Clay 50.7 21.3 10.7 1.316.0
Clinton 51.8 27.7 2.6 1.016.9
Coles 53.4 27.3 5.1 3.410.8
Cook 50.3 22.7 5.7 1.1 52.4 21.6 5.1 1.1 45.3 25.2 7.2 1.320.2 19.8 21.0
Crawford 54.7 31.3 4.7 1.67.8
Cumberland 50.0 40.0 3.3 0.06.7
DeKalb 49.0 25.5 7.0 1.017.5
DeWitt 44.3 27.8 9.3 4.114.4
Douglas 55.6 23.2 7.1 1.013.1
DuPage 51.9 19.8 3.7 1.0 52.8 19.6 3.8 0.9 40.9 25.8 4.3 1.123.6 22.9 28.0
Edgar 50.6 17.3 7.4 1.223.5
Edwards 60.0 17.1 2.9 2.917.1
Effingham 53.8 22.2 5.1 2.516.5
Fayette 54.8 19.4 9.7 0.016.1
Ford 52.7 20.4 5.4 5.416.1
Franklin 55.6 24.5 5.1 1.413.4
Fulton 55.9 20.4 5.4 0.517.7
Gallatin 59.3 25.9 7.4 0.07.4
Greene 60.7 25.0 2.4 1.210.7
Grundy 56.5 23.3 6.0 1.712.5
Hamilton 60.6 18.2 9.1 3.09.1
Hancock 51.5 26.2 2.9 1.917.5
Hardin 21.4 50.0 14.3 0.014.3
Henderson 63.0 19.6 2.2 2.213.0
Henry 54.0 17.4 6.0 3.019.6
Iroquois 52.4 21.0 4.9 4.916.8
Jackson 55.9 21.6 4.7 0.417.4
II - 11

Female Breast, Illinois 2012-2016DATA SOURCE: Illinois Department of Public Health, Illinois State Cancer Registry, data as of November 2018
County Localized Regional Distant Unknown
All Races White Black
Percent Distribution of Stage at Diagnosis by County
Localized Regional Distant Unknown Localized Regional Distant Unknownin situ in situ in situ
Jasper 55.3 17.0 6.4 4.317.0
Jefferson 59.2 21.6 2.8 0.516.0
Jersey 58.6 20.7 4.3 0.915.5
Jo Daviess 51.4 17.9 5.0 7.118.6
Johnson 57.6 23.7 5.1 1.711.9
Kane 52.2 23.4 3.6 0.7 52.9 22.7 3.4 0.6 47.8 27.4 8.0 0.020.1 20.4 16.8
Kankakee 53.7 28.5 5.0 0.8 55.5 28.3 4.9 0.5 41.4 30.0 5.7 2.912.0 10.8 20.0
Kendall 48.8 22.3 3.8 0.824.4
Knox 55.5 21.6 3.1 1.018.8
Lake 52.0 21.7 3.6 1.0 52.7 21.5 3.5 1.0 46.3 28.4 4.2 1.121.7 21.3 20.0
LaSalle 51.3 23.9 6.6 1.916.3
Lawrence 61.4 21.1 3.5 0.014.0
Lee 48.8 28.7 9.1 0.013.4
Livingston 61.0 18.1 2.9 0.517.6
Logan 56.7 23.2 2.4 1.815.9
Macon 47.4 23.2 6.1 0.8 49.2 22.5 6.0 0.9 33.8 29.4 7.4 0.022.4 21.4 29.4
Macoupin 51.0 25.1 3.7 1.618.5
Madison 54.6 20.8 4.4 1.6 55.5 20.4 4.3 1.5 38.7 28.0 6.5 4.318.6 18.3 22.6
Marion 56.7 23.7 4.2 0.015.3
Marshall 49.2 23.0 3.3 0.024.6
Mason 49.2 23.7 6.8 3.416.9
Massac 50.0 29.7 2.7 1.416.2
McDonough 51.0 17.5 9.1 2.120.3
McHenry 52.2 22.8 5.3 0.918.8
McLean 56.5 23.4 3.8 0.416.0
Menard 50.0 23.0 8.1 1.417.6
Mercer 60.3 24.4 2.6 0.012.8
Monroe 46.7 24.7 6.0 1.121.4
Montgomery 68.3 13.5 5.6 0.811.9
Morgan 57.0 22.0 1.5 1.018.5
Moultrie 49.3 19.4 6.0 3.022.4
Ogle 56.0 23.7 4.7 0.914.7
Peoria 51.8 20.8 6.5 1.2 54.5 18.5 6.2 1.1 39.1 33.1 8.3 1.519.6 19.7 18.0
Perry 58.3 19.8 4.2 3.114.6
Piatt 48.8 25.0 6.3 0.020.0
Pike 58.8 21.3 5.0 1.313.8
Pope 47.1 5.9 11.8 11.823.5
Pulaski 45.5 31.8 13.6 4.54.5
Putnam 54.3 8.6 8.6 2.925.7
Randolph 44.9 27.9 4.8 3.419.0
II - 12

Female Breast, Illinois 2012-2016DATA SOURCE: Illinois Department of Public Health, Illinois State Cancer Registry, data as of November 2018
County Localized Regional Distant Unknown
All Races White Black
Percent Distribution of Stage at Diagnosis by County
Localized Regional Distant Unknown Localized Regional Distant Unknownin situ in situ in situ
Richland 53.6 26.2 6.0 1.213.1
Rock Island 55.2 22.6 4.0 0.7 55.5 22.6 3.5 0.7 48.6 21.6 13.5 0.017.5 17.7 16.2
Saline 58.6 22.5 5.4 1.811.7
Sangamon 53.8 20.9 3.8 0.4 55.0 21.2 3.6 0.5 43.7 17.5 5.8 0.021.0 19.7 33.0
Schuyler 50.0 18.4 7.9 0.023.7
Scott 52.2 34.8 0.0 0.013.0
Shelby 54.2 21.8 5.6 0.717.6
St Clair 49.8 22.8 4.4 1.4 51.2 22.9 4.3 1.3 45.9 23.6 4.6 1.621.6 20.3 24.2
Stark 56.5 34.8 4.3 0.04.3
Stephenson 54.2 26.5 3.8 0.415.0
Tazewell 57.2 18.8 5.4 0.917.7
Union 55.4 24.1 3.6 1.815.2
Vermilion 51.0 20.6 6.7 1.4 50.6 22.0 6.6 1.6 47.8 4.3 8.7 0.020.3 19.2 39.1
Wabash 49.1 24.5 5.7 3.817.0
Warren 57.0 28.0 1.0 0.014.0
Washington 48.5 25.0 2.9 1.522.1
Wayne 49.4 27.6 8.0 1.113.8
White 55.1 33.3 7.2 0.04.3
Whiteside 54.3 23.4 6.3 2.014.1
Will 48.5 22.5 5.2 0.7 49.9 22.2 5.2 0.7 41.4 23.0 6.6 1.223.1 22.0 27.8
Williamson 59.4 15.8 6.9 1.716.2
Winnebago 52.6 21.8 5.4 1.2 53.2 21.2 5.1 1.2 51.1 26.0 7.6 0.819.1 19.3 14.5
Woodford 57.1 15.7 2.0 1.024.2
Female Breast, Illinois 2012-2016DATA SOURCE: Illinois Department of Public Health, Illinois State Cancer Registry, data as of November 2018
County Localized Regional Distant Unknown
Hispanic Non-Hispanic
Percent Distribution of Stage of Disease at Diagnosis by Ethnicity and County
Localized Regional Distant Unknownin Situ in situ
Illinois 46.3 27.0 4.6 1.1 52.0 22.0 5.1 1.221.0 19.8
Cook 46.3 26.9 5.2 1.1 50.8 22.2 5.7 1.220.5 20.2
DuPage 46.9 23.4 4.2 0.7 52.2 19.6 3.7 1.024.8 23.5
Kane 45.3 30.6 2.9 0.8 53.1 22.5 3.6 0.720.4 20.1
Lake 45.0 23.9 3.6 1.6 52.5 21.5 3.6 1.025.9 21.4
Will 44.1 34.0 3.4 0.4 48.8 21.6 5.3 0.818.1 23.5
II - 13

Cervical Cancer (invasive), Illinois 2012-2016DATA SOURCE: Illinois Department of Public Health, Illinois State Cancer Registry, data as of November 2018
County Localized Regional Distant Unknown
All Races White Black
Percent Distribution of Stage at Diagnosis by County
Localized Regional Distant Unknown Localized Regional Distant Unknown
Illinois 44.0 34.8 17.3 3.9 45.2 33.8 17.4 3.7 41.5 35.3 19.5 3.6
Adams 41.7 25.0 33.3 0.0
Alexander 100.0 0.0 0.0 0.0
Bond 57.1 14.3 28.6 0.0
Boone 17.6 64.7 17.6 0.0
Brown 0.0 100.0 0.0 0.0
Bureau 66.7 11.1 11.1 11.1
Calhoun 50.0 50.0 0.0 0.0
Carroll 100.0 0.0 0.0 0.0
Cass 50.0 0.0 50.0 0.0
Champaign 56.5 30.4 8.7 4.3 61.1 33.3 0.0 5.6 33.3 0.0 66.7 0.0
Christian 54.5 18.2 27.3 0.0
Clark 25.0 75.0 0.0 0.0
Clay 25.0 75.0 0.0 0.0
Clinton 71.4 14.3 14.3 0.0
Coles 57.1 28.6 14.3 0.0
Cook 42.5 36.1 17.0 4.5 45.0 34.1 16.5 4.4 40.2 36.3 19.3 4.1
Crawford 100.0 0.0 0.0 0.0
Cumberland 50.0 50.0 0.0 0.0
DeKalb 62.5 18.8 12.5 6.3
DeWitt 0.0 40.0 40.0 20.0
Douglas 50.0 0.0 50.0 0.0
DuPage 37.5 34.7 22.2 5.6 40.3 30.6 23.4 5.6 42.9 28.6 28.6 0.0
Edgar 50.0 50.0 0.0 0.0
Edwards 50.0 50.0 0.0 0.0
Effingham 66.7 11.1 22.2 0.0
Fayette 50.0 16.7 33.3 0.0
Ford 50.0 50.0 0.0 0.0
Franklin 22.2 44.4 33.3 0.0
Fulton 50.0 50.0 0.0 0.0
Gallatin 0.0 100.0 0.0 0.0
Greene 100.0 0.0 0.0 0.0
Grundy 50.0 20.0 30.0 0.0
Hamilton 50.0 50.0 0.0 0.0
Hancock 50.0 16.7 33.3 0.0
Hardin 50.0 0.0 0.0 50.0
Henderson
Henry 28.6 42.9 14.3 14.3
Iroquois 33.3 66.7 0.0 0.0
Jackson 50.0 37.5 12.5 0.0
II - 14

Cervical Cancer (invasive), Illinois 2012-2016DATA SOURCE: Illinois Department of Public Health, Illinois State Cancer Registry, data as of November 2018
County Localized Regional Distant Unknown
All Races White Black
Percent Distribution of Stage at Diagnosis by County
Localized Regional Distant Unknown Localized Regional Distant Unknown
Jasper 100.0 0.0 0.0 0.0
Jefferson 50.0 28.6 21.4 0.0
Jersey 33.3 66.7 0.0 0.0
Jo Daviess 50.0 0.0 50.0 0.0
Johnson 0.0 0.0 50.0 50.0
Kane 40.7 38.5 20.9 0.0 43.6 34.6 21.8 0.0 25.0 50.0 25.0 0.0
Kankakee 42.9 23.8 33.3 0.0 40.0 25.0 35.0 0.0
Kendall 60.0 30.0 10.0 0.0
Knox 62.5 37.5 0.0 0.0
Lake 50.5 30.9 15.5 3.1 49.4 35.4 13.9 1.3 50.0 14.3 28.6 7.1
LaSalle 34.5 27.6 31.0 6.9
Lawrence 50.0 0.0 50.0 0.0
Lee 41.7 33.3 25.0 0.0
Livingston 53.8 23.1 23.1 0.0
Logan 60.0 40.0 0.0 0.0
Macon 51.4 31.4 14.3 2.9 56.7 26.7 13.3 3.3 20.0 60.0 20.0 0.0
Macoupin 42.9 42.9 14.3 0.0
Madison 42.9 33.3 17.5 6.3 40.7 35.2 16.7 7.4 62.5 12.5 25.0 0.0
Marion 40.0 0.0 40.0 20.0
Marshall 100.0 0.0 0.0 0.0
Mason 80.0 20.0 0.0 0.0
Massac 0.0 100.0 0.0 0.0
McDonough 37.5 50.0 0.0 12.5
McHenry 41.5 36.6 19.5 2.4
McLean 44.4 37.0 14.8 3.7
Menard 50.0 50.0 0.0 0.0
Mercer 50.0 0.0 50.0 0.0
Monroe 0.0 50.0 50.0 0.0
Montgomery 37.5 50.0 12.5 0.0
Morgan 20.0 40.0 20.0 20.0
Moultrie 75.0 25.0 0.0 0.0
Ogle 27.3 54.5 18.2 0.0
Peoria 32.6 34.9 23.3 9.3 41.2 35.3 17.6 5.9 0.0 37.5 50.0 12.5
Perry 37.5 50.0 12.5 0.0
Piatt 0.0 75.0 25.0 0.0
Pike 25.0 50.0 25.0 0.0
Pope 50.0 0.0 50.0 0.0
Pulaski 100.0 0.0 0.0 0.0
Putnam 0.0 100.0 0.0 0.0
Randolph 0.0 66.7 33.3 0.0
II - 15

Cervical Cancer (invasive), Illinois 2012-2016DATA SOURCE: Illinois Department of Public Health, Illinois State Cancer Registry, data as of November 2018
County Localized Regional Distant Unknown
All Races White Black
Percent Distribution of Stage at Diagnosis by County
Localized Regional Distant Unknown Localized Regional Distant Unknown
Richland 25.0 25.0 50.0 0.0
Rock Island 57.9 34.2 7.9 0.0 54.5 36.4 9.1 0.0 50.0 50.0 0.0 0.0
Saline 71.4 0.0 14.3 14.3
Sangamon 56.8 31.8 9.1 2.3 55.9 35.3 8.8 0.0 57.1 28.6 14.3 0.0
Schuyler 0.0 0.0 100.0 0.0
Scott 50.0 50.0 0.0 0.0
Shelby 0.0 60.0 40.0 0.0
St Clair 49.3 35.8 13.4 1.5 52.6 31.6 13.2 2.6 42.9 42.9 14.3 0.0
Stark 40.0 40.0 20.0 0.0
Stephenson 41.7 41.7 8.3 8.3
Tazewell 58.1 12.9 22.6 6.5
Union 66.7 33.3 0.0 0.0
Vermilion 40.0 24.0 24.0 12.0 37.5 25.0 25.0 12.5 100.0 0.0 0.0 0.0
Wabash 100.0 0.0 0.0 0.0
Warren 25.0 75.0 0.0 0.0
Washington 50.0 0.0 50.0 0.0
Wayne 0.0 40.0 60.0 0.0
White 50.0 50.0 0.0 0.0
Whiteside 14.3 42.9 35.7 7.1
Will 46.9 38.9 10.6 3.5 43.2 41.1 11.6 4.2 83.3 8.3 8.3 0.0
Williamson 52.6 26.3 15.8 5.3
Winnebago 53.0 31.8 13.6 1.5 52.5 30.5 15.3 1.7 50.0 50.0 0.0 0.0
Woodford 40.0 60.0 0.0 0.0
Cervical Cancer (invasive), Illinois 2012-2016DATA SOURCE: Illinois Department of Public Health, Illinois State Cancer Registry, data as of November 2018
County Localized Regional Distant Unknown
Hispanic Non-Hispanic
Percent Distribution of Stage of Disease at Diagnosis by Ethnicity and County
Localized Regional Distant Unknown
Illinois 48.1 35.0 14.2 2.7 43.3 34.8 17.8 4.1
Cook 46.2 36.2 14.6 3.1 41.5 36.1 17.6 4.9
DuPage 33.3 40.0 26.7 0.0 38.0 34.1 21.7 6.2
Kane 30.0 45.0 25.0 0.0 43.7 36.6 19.7 0.0
Lake 69.6 26.1 4.3 0.0 44.6 32.4 18.9 4.1
Will 58.8 17.6 11.8 11.8 44.8 42.7 10.4 2.1
II - 16

Prostate Cancer (invasive), Illinois 2012-2016DATA SOURCE: Illinois Department of Public Health, Illinois State Cancer Registry, data as of November 2018
County Localized Regional Distant Unknown
All Races White Black
Percent Distribution of Stage at Diagnosis by County
Localized Regional Distant Unknown Localized Regional Distant Unknown
Illinois 75.1 13.7 7.1 4.1 75.5 14.5 6.7 3.3 75.1 11.3 9.3 4.4
Adams 70.0 13.0 12.1 4.8
Alexander 61.8 14.7 14.7 8.8
Bond 78.3 5.0 6.7 10.0
Boone 70.7 19.5 6.8 3.0
Brown 68.8 18.8 12.5 0.0
Bureau 77.6 10.9 6.4 5.1
Calhoun 82.1 10.7 7.1 0.0
Carroll 80.3 3.3 13.1 3.3
Cass 81.3 6.3 3.1 9.4
Champaign 76.0 14.5 8.3 1.2 77.1 14.9 6.9 1.2 73.6 12.5 12.5 1.4
Christian 80.6 10.1 7.8 1.6
Clark 59.6 25.0 7.7 7.7
Clay 64.8 18.5 5.6 11.1
Clinton 77.2 10.2 6.3 6.3
Coles 58.3 22.2 10.2 9.3
Cook 73.6 13.8 7.8 4.8 73.8 15.5 7.0 3.7 74.2 11.2 9.4 5.2
Crawford 80.0 4.6 9.2 6.2
Cumberland 64.0 16.0 8.0 12.0
DeKalb 73.2 17.1 8.9 0.7
DeWitt 82.9 8.6 4.3 4.3
Douglas 74.4 14.1 6.4 5.1
DuPage 78.5 12.5 7.0 1.9 78.8 12.4 7.1 1.8 85.3 11.8 2.2 0.7
Edgar 68.3 18.3 8.3 5.0
Edwards 77.3 9.1 4.5 9.1
Effingham 67.7 14.8 4.5 12.9
Fayette 75.3 7.8 1.3 15.6
Ford 69.0 21.4 9.5 0.0
Franklin 78.8 9.9 6.6 4.6
Fulton 83.0 6.6 8.5 1.9
Gallatin 81.3 6.3 6.3 6.3
Greene 72.0 18.0 10.0 0.0
Grundy 73.2 15.1 7.3 4.5
Hamilton 88.6 2.9 5.7 2.9
Hancock 72.1 13.1 11.5 3.3
Hardin 76.5 11.8 0.0 11.8
Henderson 70.6 17.6 5.9 5.9
Henry 74.4 12.2 7.6 5.8
Iroquois 77.3 10.2 8.0 4.5
Jackson 74.2 10.5 10.5 4.8
II - 17

Prostate Cancer (invasive), Illinois 2012-2016DATA SOURCE: Illinois Department of Public Health, Illinois State Cancer Registry, data as of November 2018
County Localized Regional Distant Unknown
All Races White Black
Percent Distribution of Stage at Diagnosis by County
Localized Regional Distant Unknown Localized Regional Distant Unknown
Jasper 70.0 16.0 4.0 10.0
Jefferson 78.9 10.3 8.6 2.3
Jersey 73.3 12.8 10.5 3.5
Jo Daviess 74.3 11.0 5.5 9.2
Johnson 74.4 25.6 0.0 0.0
Kane 76.8 14.5 6.4 2.3 76.9 15.4 6.3 1.4 77.5 9.0 9.9 3.6
Kankakee 73.2 14.3 8.3 4.2 73.1 14.2 8.3 4.3 73.1 15.4 9.0 2.6
Kendall 77.7 13.3 6.6 2.3
Knox 66.7 14.4 9.8 9.2
Lake 71.8 19.2 5.7 3.3 71.7 19.5 5.6 3.2 72.0 16.8 8.7 2.5
LaSalle 77.6 13.3 7.0 2.1
Lawrence 84.7 5.1 5.1 5.1
Lee 71.3 16.4 4.9 7.4
Livingston 74.3 15.0 6.4 4.3
Logan 81.6 12.6 2.9 2.9
Macon 78.6 12.9 6.4 2.1 78.8 13.5 6.2 1.5 79.3 11.5 8.0 1.1
Macoupin 78.0 12.5 6.5 3.0
Madison 73.5 16.0 5.8 4.7 73.7 16.5 5.7 4.1 76.8 10.7 8.9 3.6
Marion 79.7 9.9 3.3 7.1
Marshall 87.0 9.3 0.0 3.7
Mason 79.1 9.3 11.6 0.0
Massac 81.6 8.2 4.1 6.1
McDonough 80.2 11.6 5.8 2.3
McHenry 69.2 21.5 5.6 3.7
McLean 78.8 13.5 5.8 1.9
Menard 91.8 4.1 4.1 0.0
Mercer 69.6 13.0 4.3 13.0
Monroe 70.4 22.6 4.3 2.6
Montgomery 78.2 9.2 6.9 5.7
Morgan 84.5 9.9 3.5 2.1
Moultrie 63.9 19.4 8.3 8.3
Ogle 74.1 17.0 6.7 2.2
Peoria 80.5 5.7 7.3 6.6 81.8 5.2 6.4 6.6 75.9 8.0 12.5 3.6
Perry 78.7 14.7 2.7 4.0
Piatt 78.8 10.6 6.1 4.5
Pike 83.9 5.4 8.9 1.8
Pope 72.0 12.0 4.0 12.0
Pulaski 66.7 12.5 12.5 8.3
Putnam 69.2 15.4 3.8 11.5
Randolph 65.9 22.0 5.5 6.6
II - 18

Prostate Cancer (invasive), Illinois 2012-2016DATA SOURCE: Illinois Department of Public Health, Illinois State Cancer Registry, data as of November 2018
County Localized Regional Distant Unknown
All Races White Black
Percent Distribution of Stage at Diagnosis by County
Localized Regional Distant Unknown Localized Regional Distant Unknown
Richland 74.5 18.2 1.8 5.5
Rock Island 76.2 10.6 4.9 8.3 80.1 10.4 4.7 4.7 67.5 20.0 10.0 2.5
Saline 76.7 10.0 3.3 10.0
Sangamon 79.2 13.3 6.2 1.3 79.2 13.7 6.1 1.1 82.0 8.2 8.2 1.6
Schuyler 74.4 7.7 12.8 5.1
Scott 78.3 13.0 4.3 4.3
Shelby 69.4 17.6 7.1 5.9
St Clair 71.0 15.1 9.1 4.8 70.5 17.5 7.8 4.2 72.6 10.0 11.7 5.7
Stark 77.3 4.5 0.0 18.2
Stephenson 77.1 12.1 7.6 3.2
Tazewell 85.0 4.8 5.1 5.1
Union 69.1 13.2 11.8 5.9
Vermilion 74.9 16.6 8.1 0.3 74.2 16.7 8.7 0.4 82.5 12.5 5.0 0.0
Wabash 80.6 11.1 5.6 2.8
Warren 87.5 8.3 0.0 4.2
Washington 79.5 12.3 8.2 0.0
Wayne 83.1 7.8 5.2 3.9
White 79.0 6.5 9.7 4.8
Whiteside 77.7 6.2 7.8 8.3
Will 80.8 11.4 6.0 1.7 80.9 12.1 5.8 1.2 81.9 9.4 8.1 0.6
Williamson 74.5 11.3 8.8 5.4
Winnebago 68.4 19.1 8.8 3.7 67.9 19.3 8.5 4.3 71.3 17.4 10.4 0.9
Woodford 80.3 12.7 0.7 6.3
Prostate Cancer (invasive), Illinois 2012-2016DATA SOURCE: Illinois Department of Public Health, Illinois State Cancer Registry, data as of November 2018
County Localized Regional Distant Unknown
Hispanic Non-Hispanic
Percent Distribution of Stage of Disease at Diagnosis by Ethnicity and County
Localized Regional Distant Unknown
Illinois 75.6 13.8 6.4 4.2 75.0 13.7 7.2 4.1
Cook 75.9 13.6 6.1 4.4 73.3 13.8 8.0 4.8
DuPage 74.3 13.9 8.3 3.5 78.7 12.5 7.0 1.8
Kane 74.7 16.4 4.8 4.1 77.0 14.3 6.6 2.1
Lake 70.4 18.4 7.2 4.0 71.9 19.2 5.6 3.3
Will 76.6 8.9 10.5 4.0 81.1 11.6 5.8 1.6
II - 19

SECTION III
County-specific Cancer Incidence Rates
All Races, Illinois, 2012-2016
III - 1

All Sites Combined and Selected Sites, All Races, 2012-2016Figures include invasive cancer with the exception of urinary bladder (includes in situ) and breast cancer in situ as a separate category. Incidence counts are five-year totals.
Rates are per 100,000 age-adjustd to the 2000 U.S. standard million population. Lower confidence intervals (LCI) and upper confidence intervals (UCI) are 95 percent for rates,
Tiwari method.
Site Rate LCI UCI
Both Sexes Males Females
Cancer Incidence Counts and Five-year Age-adjusted Rates by Sex
Rate LCI UCI Rate LCI UCICount Count Count
Illinois
All Sites 466.2 464.6 467.8 506.8 504.3 509.3 441.4 439.3 443.6338,415 167,091 171,324
Oral Cavity and Pharynx 12.1 11.8 12.3 18.3 17.9 18.8 6.7 6.4 7.08,977 6,339 2,638
Esophagus 4.9 4.8 5.1 8.6 8.3 9.0 1.9 1.8 2.03,678 2,896 782
Stomach 7.2 7.0 7.4 9.9 9.6 10.3 5.0 4.8 5.25,177 3,196 1,981
Colon and Rectum 43.1 42.6 43.6 50.4 49.7 51.2 37.2 36.6 37.831,268 16,392 14,876
Liver 6.3 6.1 6.5 10.0 9.7 10.4 3.1 3.0 3.34,825 3,555 1,270
Pancreas 13.3 13.0 13.6 15.4 14.9 15.8 11.6 11.3 12.09,750 4,984 4,766
Lung and Bronchus 64.7 64.1 65.3 75.3 74.4 76.3 57.0 56.2 57.747,130 24,225 22,905
Bones and Joints 0.9 0.8 1.0 1.1 0.9 1.2 0.7 0.7 0.8598 342 256
Melanoma of the Skin 19.7 19.3 20.0 24.3 23.7 24.8 16.6 16.2 17.113,931 7,827 6,104
Breast (invasive) 71.0 70.3 71.6 1.3 1.2 1.5 131.9 130.8 133.150,931 436 50,495
Cervix 7.7 7.4 8.02,629
Corpus and Uterus, NOS 29.6 29.1 30.111,920
Ovary 11.2 10.9 11.54,322
Prostate 109.5 108.4 110.638,543
Testis 6.1 5.9 6.41,909
Urinary Bladder (includes in situ) 21.2 20.9 21.6 37.0 36.3 37.7 9.4 9.1 9.715,379 11,514 3,865
Kidney and Renal Pelvis 18.0 17.7 18.3 24.6 24.1 25.2 12.3 12.0 12.713,053 8,251 4,802
Brain and Nervous System 6.3 6.1 6.5 7.4 7.1 7.7 5.4 5.2 5.64,367 2,411 1,956
Hodgkin Lymphoma 2.7 2.6 2.9 3.2 3.0 3.4 2.4 2.2 2.51,791 1,017 774
Non-Hodgkin Lymphoma 19.5 19.1 19.8 23.5 22.9 24.0 16.3 15.9 16.713,877 7,475 6,402
Myeloma 6.5 6.3 6.7 8.0 7.7 8.3 5.3 5.1 5.64,763 2,606 2,157
Leukemia 13.4 13.2 13.7 17.3 16.8 17.8 10.5 10.2 10.89,441 5,423 4,018
All Other Sites 56.8 56.3 57.4 55.5 54.7 56.3 59.5 58.7 60.440,156 17,750 22,406
DATA SOURCE: Illinois Department of Public Health, Illinois State Cancer Registry, data as of November 2018
Breast in Situ (not in total) 33.4 32.8 34.0 12,507
III - 2

All Sites Combined and Selected Sites, All Races, 2012-2016Figures include invasive cancer with the exception of urinary bladder (includes in situ) and breast cancer in situ as a separate category. Incidence counts are five-year totals.
Rates are per 100,000 age-adjustd to the 2000 U.S. standard million population. Lower confidence intervals (LCI) and upper confidence intervals (UCI) are 95 percent for rates,
Tiwari method.
Site Rate LCI UCI
Both Sexes Males Females
Cancer Incidence Counts and Five-year Age-adjusted Rates by Sex
Rate LCI UCI Rate LCI UCICount Count Count
Adams
All Sites 460.7 440.2 481.9 481.9 452.0 513.3 450.5 422.1 480.52,072 1,021 1,051
Oral Cavity and Pharynx 10.5 7.6 14.2 15.5 10.6 22.1 6.2 3.2 10.948 34 14
Esophagus 6.7 4.5 9.8 12.9 8.3 19.2 1.7 0.4 4.830 26 4
Stomach 2.7 1.4 4.8 3.8 1.7 7.6 1.8 0.4 5.213 9 4
Colon and Rectum 41.7 35.8 48.4 43.5 34.8 53.8 41.0 33.0 50.5194 91 103
Liver 6.5 4.3 9.4 8.9 5.3 14.2 4.3 2.1 8.031 19 12
Pancreas 10.6 7.9 14.1 10.2 6.3 15.7 10.9 7.4 15.954 22 32
Lung and Bronchus 70.1 62.6 78.3 81.9 70.1 95.2 60.6 51.1 71.6333 179 154
Bones and Joints 1.9 0.8 4.1 2.6 0.7 6.5 1.2 0.2 4.17 4 3
Melanoma of the Skin 34.0 28.3 40.6 36.7 28.5 46.5 32.7 24.6 42.5138 74 64
Breast (invasive) 72.0 63.8 80.9 2.3 0.9 5.5 134.9 119.3 152.0309 6 303
Cervix 6.8 3.4 12.212
Corpus and Uterus, NOS 26.6 20.3 34.564
Ovary 13.4 8.8 19.631
Prostate 93.4 81.0 107.4207
Testis 7.0 3.4 12.711
Urinary Bladder (includes in situ) 22.4 18.3 27.2 36.8 29.0 46.2 10.8 7.2 15.8110 79 31
Kidney and Renal Pelvis 19.5 15.3 24.5 27.3 20.2 36.1 12.5 8.1 18.682 54 28
Brain and Nervous System 6.3 4.0 9.5 10.0 5.8 16.1 2.6 1.0 5.925 18 7
Hodgkin Lymphoma 1.7 0.6 3.9 1.2 0.1 4.5 2.2 0.6 5.96 2 4
Non-Hodgkin Lymphoma 15.4 11.9 19.5 18.3 13.0 25.3 13.3 9.1 19.174 40 34
Myeloma 5.6 3.6 8.5 6.3 3.2 11.2 4.9 2.5 8.924 12 12
Leukemia 9.0 6.4 12.4 13.0 8.4 19.3 5.4 3.1 9.344 27 17
All Other Sites 52.8 45.8 60.7 50.3 40.9 61.4 56.8 46.3 68.9225 107 118
DATA SOURCE: Illinois Department of Public Health, Illinois State Cancer Registry, data as of November 2018
Breast in Situ (not in total) 30.5 23.2 39.5 65
III - 3

All Sites Combined and Selected Sites, All Races, 2012-2016Figures include invasive cancer with the exception of urinary bladder (includes in situ) and breast cancer in situ as a separate category. Incidence counts are five-year totals.
Rates are per 100,000 age-adjustd to the 2000 U.S. standard million population. Lower confidence intervals (LCI) and upper confidence intervals (UCI) are 95 percent for rates,
Tiwari method.
Site Rate LCI UCI
Both Sexes Males Females
Cancer Incidence Counts and Five-year Age-adjusted Rates by Sex
Rate LCI UCI Rate LCI UCICount Count Count
Alexander
All Sites 533.1 468.2 605.1 568.6 476.0 676.1 507.5 417.8 612.0270 141 129
Oral Cavity and Pharynx 13.7 5.9 29.4 17.1 5.5 46.1 10.3 2.1 35.98 5 3
Esophagus 5.6 1.1 19.0 13.3 2.7 43.13 3 0
Stomach 1.5 0.0 12.9 2.9 0.1 25.01 0 1
Colon and Rectum 62.4 41.4 91.2 59.2 31.2 104.5 63.2 35.7 106.130 13 17
Liver 5.8 1.2 19.4 3.5 0.1 27.8 7.5 0.9 32.33 1 2
Pancreas 19.0 9.5 36.4 19.4 6.2 50.4 18.4 6.7 45.811 5 6
Lung and Bronchus 89.3 65.7 119.9 112.3 74.0 166.1 75.3 46.0 119.449 28 21
Bones and Joints 1.7 0.0 13.4 4.8 0.1 30.71 1 0
Melanoma of the Skin 12.3 2.9 32.2 8.7 1.0 36.1 16.5 2.0 54.14 2 2
Breast (invasive) 63.7 42.1 93.3 120.8 79.9 177.031 0 31
Cervix 10.1 1.0 39.22
Corpus and Uterus, NOS 32.6 14.2 67.09
Ovary 6.7 0.8 30.62
Prostate 128.6 88.4 183.834
Testis 0
Urinary Bladder (includes in situ) 15.5 7.0 31.8 21.6 7.8 52.8 9.1 1.9 33.59 6 3
Kidney and Renal Pelvis 27.5 12.0 53.0 24.9 8.7 59.2 28.4 6.9 72.310 6 4
Brain and Nervous System 5.9 1.2 19.6 8.5 1.0 35.9 3.2 0.1 25.73 2 1
Hodgkin Lymphoma 0 0 0
Non-Hodgkin Lymphoma 28.0 13.7 51.2 43.4 17.0 90.2 14.5 3.9 42.012 8 4
Myeloma 8.4 2.7 22.5 11.7 2.3 39.9 5.6 0.7 28.55 3 2
Leukemia 18.4 8.7 36.1 23.2 8.3 55.7 14.8 3.7 43.110 6 4
All Other Sites 68.5 45.9 99.2 68.5 40.3 112.6 67.5 35.8 116.233 18 15
DATA SOURCE: Illinois Department of Public Health, Illinois State Cancer Registry, data as of November 2018
Breast in Situ (not in total) 18.5 5.9 47.7 5
III - 4

All Sites Combined and Selected Sites, All Races, 2012-2016Figures include invasive cancer with the exception of urinary bladder (includes in situ) and breast cancer in situ as a separate category. Incidence counts are five-year totals.
Rates are per 100,000 age-adjustd to the 2000 U.S. standard million population. Lower confidence intervals (LCI) and upper confidence intervals (UCI) are 95 percent for rates,
Tiwari method.
Site Rate LCI UCI
Both Sexes Males Females
Cancer Incidence Counts and Five-year Age-adjusted Rates by Sex
Rate LCI UCI Rate LCI UCICount Count Count
Bond
All Sites 497.4 455.8 542.0 554.4 491.1 624.0 468.4 410.7 532.5551 289 262
Oral Cavity and Pharynx 11.5 6.2 20.0 20.7 10.6 37.4 3.0 0.4 13.614 12 2
Esophagus 7.9 3.5 15.9 14.5 6.1 30.0 1.0 0.0 10.79 8 1
Stomach 4.8 1.8 11.3 3.6 0.4 14.5 5.8 1.5 17.66 2 4
Colon and Rectum 50.3 37.7 66.0 62.5 42.4 89.3 43.6 27.1 67.156 32 24
Liver 7.0 3.0 14.5 8.6 2.8 21.6 4.9 1.0 16.68 5 3
Pancreas 11.9 6.5 20.7 11.2 4.0 25.7 13.0 5.5 27.714 6 8
Lung and Bronchus 68.0 53.5 85.6 84.8 61.0 115.1 56.7 39.0 80.777 43 34
Bones and Joints 1.0 0.0 6.1 1.8 0.0 11.81 1 0
Melanoma of the Skin 21.0 13.0 32.5 26.1 13.7 45.5 16.9 7.6 33.622 13 9
Breast (invasive) 78.0 61.8 97.5 155.9 122.5 196.184 0 84
Cervix 17.0 6.6 35.87
Corpus and Uterus, NOS 31.2 17.6 51.917
Ovary 9.5 2.8 24.05
Prostate 109.1 82.8 141.660
Testis 9.5 2.6 24.24
Urinary Bladder (includes in situ) 37.6 27.1 51.2 58.9 39.4 85.2 19.8 10.5 35.843 30 13
Kidney and Renal Pelvis 16.8 9.9 27.1 27.2 14.9 46.3 7.7 1.8 21.719 15 4
Brain and Nervous System 10.1 4.7 19.2 14.5 5.6 30.8 6.3 1.1 20.010 7 3
Hodgkin Lymphoma 3.1 0.6 9.6 3.7 0.4 14.7 3.2 0.1 16.33 2 1
Non-Hodgkin Lymphoma 22.8 14.7 34.3 27.9 14.8 48.3 20.9 10.5 38.625 13 12
Myeloma 4.5 1.6 10.7 5.8 1.1 18.1 3.8 0.8 14.46 3 3
Leukemia 11.0 5.6 19.8 15.1 6.4 30.9 7.1 1.8 20.312 8 4
All Other Sites 44.9 32.9 60.1 48.8 31.2 73.1 41.0 25.9 62.949 25 24
DATA SOURCE: Illinois Department of Public Health, Illinois State Cancer Registry, data as of November 2018
Breast in Situ (not in total) 27.7 15.6 46.7 16
III - 5

All Sites Combined and Selected Sites, All Races, 2012-2016Figures include invasive cancer with the exception of urinary bladder (includes in situ) and breast cancer in situ as a separate category. Incidence counts are five-year totals.
Rates are per 100,000 age-adjustd to the 2000 U.S. standard million population. Lower confidence intervals (LCI) and upper confidence intervals (UCI) are 95 percent for rates,
Tiwari method.
Site Rate LCI UCI
Both Sexes Males Females
Cancer Incidence Counts and Five-year Age-adjusted Rates by Sex
Rate LCI UCI Rate LCI UCICount Count Count
Boone
All Sites 457.0 432.6 482.4 488.2 451.3 527.3 436.8 403.9 471.71,360 687 673
Oral Cavity and Pharynx 12.4 8.7 17.1 21.3 14.2 30.7 4.8 1.9 10.138 31 7
Esophagus 2.8 1.3 5.5 4.2 1.7 9.0 1.3 0.2 5.19 7 2
Stomach 6.6 3.9 10.5 9.8 5.0 17.3 3.8 1.4 8.518 12 6
Colon and Rectum 39.9 32.8 48.0 41.8 31.2 54.7 38.6 29.3 50.1115 56 59
Liver 5.0 2.8 8.4 6.9 3.2 13.0 3.3 1.0 7.915 10 5
Pancreas 11.5 8.0 16.2 13.4 8.0 21.1 9.4 5.2 15.835 20 15
Lung and Bronchus 67.9 58.8 78.1 81.7 66.9 98.9 57.3 46.0 70.6204 113 91
Bones and Joints 0.8 0.1 2.7 0.7 0.0 4.1 0.8 0.0 4.42 1 1
Melanoma of the Skin 21.5 16.4 27.6 32.0 23.1 43.3 12.3 7.2 19.763 45 18
Breast (invasive) 59.5 51.0 69.0 1.6 0.2 5.8 114.4 98.0 132.8180 2 178
Cervix 12.7 7.3 20.517
Corpus and Uterus, NOS 31.9 23.7 42.152
Ovary 12.9 7.8 20.320
Prostate 87.2 72.6 103.9133
Testis 6.6 2.8 13.18
Urinary Bladder (includes in situ) 22.3 17.2 28.6 37.2 27.3 49.4 9.4 5.3 15.566 50 16
Kidney and Renal Pelvis 16.7 12.3 22.2 18.1 11.7 26.9 15.2 9.6 23.149 26 23
Brain and Nervous System 7.0 4.2 11.0 8.9 4.5 15.7 4.9 1.9 10.419 12 7
Hodgkin Lymphoma 3.9 1.9 7.0 3.0 1.0 7.5 4.5 1.6 10.011 5 6
Non-Hodgkin Lymphoma 20.9 16.0 27.0 24.4 16.9 34.3 17.2 11.3 25.362 35 27
Myeloma 8.4 5.5 12.5 10.8 5.9 18.1 6.6 3.3 12.126 15 11
Leukemia 19.0 14.2 24.9 22.2 14.8 32.1 15.6 9.9 23.554 30 24
All Other Sites 57.0 48.4 66.6 56.4 44.1 71.0 59.9 47.8 74.1164 76 88
DATA SOURCE: Illinois Department of Public Health, Illinois State Cancer Registry, data as of November 2018
Breast in Situ (not in total) 28.2 20.4 38.1 44
III - 6

All Sites Combined and Selected Sites, All Races, 2012-2016Figures include invasive cancer with the exception of urinary bladder (includes in situ) and breast cancer in situ as a separate category. Incidence counts are five-year totals.
Rates are per 100,000 age-adjustd to the 2000 U.S. standard million population. Lower confidence intervals (LCI) and upper confidence intervals (UCI) are 95 percent for rates,
Tiwari method.
Site Rate LCI UCI
Both Sexes Males Females
Cancer Incidence Counts and Five-year Age-adjusted Rates by Sex
Rate LCI UCI Rate LCI UCICount Count Count
Brown
All Sites 453.9 386.8 529.8 534.9 430.7 656.8 396.1 305.4 508.2166 97 69
Oral Cavity and Pharynx 13.1 4.3 32.0 19.3 3.8 56.1 10.1 1.2 46.05 3 2
Esophagus 3.0 0.1 17.7 6.6 0.2 35.61 1 0
Stomach 5.3 0.6 21.0 4.4 0.1 29.8 5.7 0.1 40.52 1 1
Colon and Rectum 50.2 29.6 80.2 66.8 33.9 118.6 32.6 11.0 79.418 12 6
Liver 10.5 2.8 28.5 20.0 5.2 54.24 4 0
Pancreas 11.8 3.2 31.0 17.9 3.6 53.1 10.9 0.3 54.64 3 1
Lung and Bronchus 99.6 69.6 138.8 125.4 78.6 190.3 72.2 38.4 128.536 23 13
Bones and Joints 2.0 0.1 15.3 2.6 0.1 26.11 1 0
Melanoma of the Skin 17.1 6.2 38.1 25.8 6.8 65.9 10.4 1.2 46.66 4 2
Breast (invasive) 51.2 30.7 81.0 120.5 71.0 193.719 0 19
Cervix 5.7 0.1 40.51
Corpus and Uterus, NOS 16.1 3.3 54.93
Ovary 0
Prostate 84.9 47.9 140.116
Testis 0
Urinary Bladder (includes in situ) 22.1 9.5 44.6 49.7 21.2 98.28 8 0
Kidney and Renal Pelvis 6.9 1.4 22.7 10.8 2.2 38.13 3 0
Brain and Nervous System 10.2 1.9 30.2 18.6 3.2 56.23 3 0
Hodgkin Lymphoma 0 0 0
Non-Hodgkin Lymphoma 31.5 16.2 56.2 24.7 6.2 64.5 44.7 19.1 93.912 4 8
Myeloma 8.7 1.8 26.3 4.4 0.1 29.9 10.8 1.3 47.53 1 2
Leukemia 13.0 4.2 31.8 10.7 1.3 40.9 16.2 3.3 55.15 2 3
All Other Sites 44.0 24.7 73.0 42.3 17.2 86.9 40.3 16.2 88.316 8 8
DATA SOURCE: Illinois Department of Public Health, Illinois State Cancer Registry, data as of November 2018
Breast in Situ (not in total) 0
III - 7

All Sites Combined and Selected Sites, All Races, 2012-2016Figures include invasive cancer with the exception of urinary bladder (includes in situ) and breast cancer in situ as a separate category. Incidence counts are five-year totals.
Rates are per 100,000 age-adjustd to the 2000 U.S. standard million population. Lower confidence intervals (LCI) and upper confidence intervals (UCI) are 95 percent for rates,
Tiwari method.
Site Rate LCI UCI
Both Sexes Males Females
Cancer Incidence Counts and Five-year Age-adjusted Rates by Sex
Rate LCI UCI Rate LCI UCICount Count Count
Bureau
All Sites 502.3 473.1 532.9 571.2 526.8 618.7 452.7 413.6 494.71,203 645 558
Oral Cavity and Pharynx 11.1 7.2 16.5 16.7 10.1 26.6 6.7 2.7 14.228 20 8
Esophagus 7.7 4.7 12.2 16.0 9.7 25.5 0.7 0.0 5.521 20 1
Stomach 5.7 3.1 9.8 8.2 3.9 16.0 3.7 1.1 10.015 10 5
Colon and Rectum 45.9 37.5 55.9 49.9 37.2 65.9 41.5 30.9 54.9114 54 60
Liver 4.0 2.0 7.7 7.6 3.4 15.2 1.3 0.2 6.411 9 2
Pancreas 11.9 8.0 17.4 17.7 10.7 28.0 6.5 3.1 13.031 20 11
Lung and Bronchus 74.3 63.9 86.1 83.1 67.2 102.0 69.5 55.7 86.2188 97 91
Bones and Joints 1.6 0.3 5.0 1.7 0.2 7.2 1.6 0.0 7.83 2 1
Melanoma of the Skin 30.1 23.1 38.6 41.5 29.7 56.7 21.6 13.8 32.770 43 27
Breast (invasive) 62.7 52.4 74.6 120.3 100.3 143.3144 0 144
Cervix 10.1 4.3 20.09
Corpus and Uterus, NOS 20.8 13.4 31.327
Ovary 4.3 1.4 10.85
Prostate 127.1 107.7 149.4156
Testis 7.0 2.2 16.25
Urinary Bladder (includes in situ) 26.4 20.3 34.0 44.3 32.9 58.9 12.9 7.0 22.268 52 16
Kidney and Renal Pelvis 21.1 15.5 28.2 32.4 22.6 45.6 10.7 5.7 19.050 36 14
Brain and Nervous System 5.7 2.8 10.3 6.2 2.2 14.2 4.8 1.6 11.612 6 6
Hodgkin Lymphoma 6.5 3.0 12.0 9.6 3.8 19.8 3.3 0.6 10.010 7 3
Non-Hodgkin Lymphoma 24.8 18.4 32.7 27.2 17.8 40.1 23.4 15.1 35.056 29 27
Myeloma 4.9 2.6 8.9 4.1 1.3 10.4 5.6 2.4 12.213 5 8
Leukemia 16.5 11.0 23.9 17.3 9.8 28.4 16.1 8.5 27.632 17 15
All Other Sites 59.7 49.6 71.5 53.5 40.0 70.4 67.4 52.4 85.6135 57 78
DATA SOURCE: Illinois Department of Public Health, Illinois State Cancer Registry, data as of November 2018
Breast in Situ (not in total) 29.5 20.0 42.3 34
III - 8

All Sites Combined and Selected Sites, All Races, 2012-2016Figures include invasive cancer with the exception of urinary bladder (includes in situ) and breast cancer in situ as a separate category. Incidence counts are five-year totals.
Rates are per 100,000 age-adjustd to the 2000 U.S. standard million population. Lower confidence intervals (LCI) and upper confidence intervals (UCI) are 95 percent for rates,
Tiwari method.
Site Rate LCI UCI
Both Sexes Males Females
Cancer Incidence Counts and Five-year Age-adjusted Rates by Sex
Rate LCI UCI Rate LCI UCICount Count Count
Calhoun
All Sites 500.2 426.1 584.7 635.7 519.4 773.3 385.5 292.9 500.7185 114 71
Oral Cavity and Pharynx 10.0 2.6 30.2 15.8 3.2 54.9 3.2 0.1 36.54 3 1
Esophagus 5.6 0.6 24.5 10.6 1.2 47.92 2 0
Stomach 2.2 0.1 19.1 4.3 0.1 38.01 1 0
Colon and Rectum 81.9 53.6 121.5 88.1 47.2 153.4 75.9 40.4 134.730 15 15
Liver 2.1 0.1 18.9 6.4 0.2 42.61 1 0
Pancreas 9.0 1.7 29.9 13.4 1.4 54.4 5.4 0.1 40.73 2 1
Lung and Bronchus 56.9 34.5 90.6 80.7 42.3 143.2 38.7 16.2 85.222 14 8
Bones and Joints 0 0 0
Melanoma of the Skin 18.2 5.1 45.8 14.4 2.9 52.2 23.4 2.8 77.85 3 2
Breast (invasive) 50.1 29.0 82.6 95.8 54.8 159.919 0 19
Cervix 8.6 1.0 44.02
Corpus and Uterus, NOS 32.1 11.6 77.66
Ovary 0
Prostate 137.2 90.9 204.328
Testis 21.8 2.6 73.82
Urinary Bladder (includes in situ) 28.0 12.5 55.8 41.0 15.2 92.4 15.4 2.6 55.810 7 3
Kidney and Renal Pelvis 26.9 11.8 54.5 41.4 17.7 88.9 17.2 1.4 66.410 8 2
Brain and Nervous System 10.0 1.7 32.6 16.2 1.7 61.1 4.5 0.1 38.83 2 1
Hodgkin Lymphoma 2.5 0.1 19.7 4.7 0.1 38.81 1 0
Non-Hodgkin Lymphoma 16.3 5.8 39.3 19.8 5.4 59.6 13.5 1.5 54.56 4 2
Myeloma 9.2 2.5 28.4 11.1 1.3 48.8 7.3 0.9 41.74 2 2
Leukemia 22.8 8.2 51.1 37.1 13.0 87.2 13.0 0.3 61.87 6 1
All Other Sites 51.0 29.5 84.0 71.7 37.3 129.5 31.5 9.4 80.519 13 6
DATA SOURCE: Illinois Department of Public Health, Illinois State Cancer Registry, data as of November 2018
Breast in Situ (not in total) 14.4 2.9 52.4 3
III - 9

All Sites Combined and Selected Sites, All Races, 2012-2016Figures include invasive cancer with the exception of urinary bladder (includes in situ) and breast cancer in situ as a separate category. Incidence counts are five-year totals.
Rates are per 100,000 age-adjustd to the 2000 U.S. standard million population. Lower confidence intervals (LCI) and upper confidence intervals (UCI) are 95 percent for rates,
Tiwari method.
Site Rate LCI UCI
Both Sexes Males Females
Cancer Incidence Counts and Five-year Age-adjusted Rates by Sex
Rate LCI UCI Rate LCI UCICount Count Count
Carroll
All Sites 463.9 422.0 509.2 465.3 409.3 527.8 471.2 408.9 541.0523 273 250
Oral Cavity and Pharynx 15.2 8.4 25.9 16.0 7.1 33.0 14.2 5.3 31.916 9 7
Esophagus 5.6 2.2 13.0 9.6 3.4 24.0 1.4 0.0 13.07 6 1
Stomach 3.4 0.5 11.4 7.0 1.1 22.93 3 0
Colon and Rectum 44.1 32.5 59.2 48.0 31.1 72.3 39.2 24.5 61.353 27 26
Liver 3.5 1.1 10.0 5.8 1.6 18.6 1.0 0.0 12.25 4 1
Pancreas 6.3 2.3 14.5 6.5 1.1 21.5 6.5 1.7 20.07 3 4
Lung and Bronchus 56.4 44.0 72.1 60.3 42.7 84.6 52.9 36.2 76.573 39 34
Bones and Joints 0.7 0.0 6.3 1.3 0.0 12.51 1 0
Melanoma of the Skin 26.1 16.8 39.2 25.0 14.2 43.2 27.6 13.4 50.728 16 12
Breast (invasive) 69.9 52.5 91.4 1.3 0.0 12.4 137.5 102.9 180.466 1 65
Cervix 9.1 1.1 29.42
Corpus and Uterus, NOS 32.4 18.7 54.018
Ovary 11.1 3.6 27.66
Prostate 99.1 75.2 129.861
Testis 19.5 7.8 40.58
Urinary Bladder (includes in situ) 23.6 15.2 35.7 38.1 23.3 60.3 10.9 3.6 27.129 23 6
Kidney and Renal Pelvis 15.7 9.2 25.9 16.4 7.8 32.8 16.8 7.3 34.620 10 10
Brain and Nervous System 7.0 2.5 16.0 11.9 3.7 29.2 2.3 0.1 14.96 5 1
Hodgkin Lymphoma 3.7 0.9 11.2 7.4 1.7 22.14 4 0
Non-Hodgkin Lymphoma 23.2 14.4 35.9 34.6 19.8 57.3 14.3 5.3 32.125 18 7
Myeloma 7.1 2.9 15.4 6.8 1.8 20.3 7.4 1.7 22.38 4 4
Leukemia 13.5 7.2 23.9 12.3 5.2 27.1 15.2 5.4 34.115 8 7
All Other Sites 54.9 41.1 72.4 38.4 23.9 60.1 71.6 48.7 102.362 23 39
DATA SOURCE: Illinois Department of Public Health, Illinois State Cancer Registry, data as of November 2018
Breast in Situ (not in total) 20.6 9.7 40.0 12
III - 10

All Sites Combined and Selected Sites, All Races, 2012-2016Figures include invasive cancer with the exception of urinary bladder (includes in situ) and breast cancer in situ as a separate category. Incidence counts are five-year totals.
Rates are per 100,000 age-adjustd to the 2000 U.S. standard million population. Lower confidence intervals (LCI) and upper confidence intervals (UCI) are 95 percent for rates,
Tiwari method.
Site Rate LCI UCI
Both Sexes Males Females
Cancer Incidence Counts and Five-year Age-adjusted Rates by Sex
Rate LCI UCI Rate LCI UCICount Count Count
Cass
All Sites 530.3 480.5 584.0 639.0 559.8 726.5 446.7 383.4 518.1433 244 189
Oral Cavity and Pharynx 16.7 9.0 28.8 31.8 16.7 55.8 1.4 0.0 13.114 13 1
Esophagus 5.9 1.9 14.5 10.1 2.6 27.2 2.4 0.1 15.55 4 1
Stomach 3.4 0.7 11.0 1.9 0.0 14.1 4.5 0.5 18.43 1 2
Colon and Rectum 55.3 40.0 74.7 59.9 37.5 91.3 51.0 31.4 79.145 23 22
Liver 5.7 1.8 14.1 6.6 1.3 21.5 4.5 0.5 18.45 3 2
Pancreas 16.9 9.4 28.6 24.0 10.8 46.5 11.9 4.3 28.315 9 6
Lung and Bronchus 93.7 73.7 117.9 148.5 111.5 194.2 51.0 31.4 79.276 55 21
Bones and Joints 1.3 0.0 8.0 2.6 0.1 15.81 1 0
Melanoma of the Skin 24.7 14.9 38.9 26.1 12.2 49.2 24.6 11.4 46.920 10 10
Breast (invasive) 62.6 46.1 83.3 121.1 89.1 161.650 0 50
Cervix 6.3 0.6 23.12
Corpus and Uterus, NOS 28.9 15.0 51.513
Ovary 13.0 4.1 31.55
Prostate 79.3 53.9 113.132
Testis 12.1 3.2 31.34
Urinary Bladder (includes in situ) 33.2 22.1 48.3 55.7 34.2 86.1 16.6 6.9 35.129 21 8
Kidney and Renal Pelvis 42.8 29.1 60.9 59.4 36.6 91.3 27.7 13.5 51.033 22 11
Brain and Nervous System 3.4 0.7 10.9 4.5 0.5 18.5 2.1 0.1 14.73 2 1
Hodgkin Lymphoma 10.9 4.2 22.7 11.5 2.9 30.4 10.2 2.0 29.47 4 3
Non-Hodgkin Lymphoma 19.7 11.4 32.2 22.5 10.1 43.9 17.7 7.5 36.817 9 8
Myeloma 3.0 0.6 10.1 7.3 1.4 23.03 3 0
Leukemia 14.4 7.2 26.0 22.4 9.4 45.1 7.1 1.9 21.512 8 4
All Other Sites 48.0 33.8 66.4 52.9 32.0 82.9 44.6 26.1 71.839 20 19
DATA SOURCE: Illinois Department of Public Health, Illinois State Cancer Registry, data as of November 2018
Breast in Situ (not in total) 28.8 14.1 52.8 11
III - 11

All Sites Combined and Selected Sites, All Races, 2012-2016Figures include invasive cancer with the exception of urinary bladder (includes in situ) and breast cancer in situ as a separate category. Incidence counts are five-year totals.
Rates are per 100,000 age-adjustd to the 2000 U.S. standard million population. Lower confidence intervals (LCI) and upper confidence intervals (UCI) are 95 percent for rates,
Tiwari method.
Site Rate LCI UCI
Both Sexes Males Females
Cancer Incidence Counts and Five-year Age-adjusted Rates by Sex
Rate LCI UCI Rate LCI UCICount Count Count
Champaign
All Sites 437.6 424.0 451.4 475.0 454.2 496.6 413.7 395.6 432.44,167 2,079 2,088
Oral Cavity and Pharynx 10.4 8.4 12.7 15.9 12.3 20.2 5.6 3.7 8.298 69 29
Esophagus 4.7 3.4 6.3 8.1 5.6 11.3 1.9 0.9 3.647 37 10
Stomach 7.1 5.4 9.1 9.5 6.7 13.1 5.1 3.3 7.566 40 26
Colon and Rectum 34.6 30.9 38.6 42.1 36.1 48.8 28.1 23.6 33.3329 184 145
Liver 5.8 4.4 7.5 9.4 6.8 12.7 2.6 1.4 4.559 45 14
Pancreas 11.1 9.0 13.4 14.1 10.7 18.3 8.5 6.2 11.4105 59 46
Lung and Bronchus 52.8 48.2 57.8 56.2 49.1 64.1 50.6 44.5 57.3499 236 263
Bones and Joints 0.6 0.2 1.4 0.8 0.1 2.2 0.5 0.0 1.65 3 2
Melanoma of the Skin 29.6 26.1 33.4 36.0 30.4 42.3 25.2 20.8 30.2280 156 124
Breast (invasive) 70.2 64.7 75.9 1.7 0.7 3.6 129.9 119.8 140.7653 7 646
Cervix 5.1 3.2 7.823
Corpus and Uterus, NOS 23.9 19.8 28.6126
Ovary 13.9 10.8 17.870
Prostate 111.0 101.2 121.3509
Testis 4.7 3.0 7.227
Urinary Bladder (includes in situ) 15.1 12.7 17.8 26.3 21.5 31.9 7.1 4.9 9.9145 108 37
Kidney and Renal Pelvis 15.7 13.2 18.5 24.0 19.4 29.3 8.7 6.3 11.8145 101 44
Brain and Nervous System 6.4 4.9 8.3 9.1 6.4 12.6 4.3 2.6 6.660 38 22
Hodgkin Lymphoma 1.9 1.2 3.1 2.7 1.4 4.8 1.3 0.5 2.721 14 7
Non-Hodgkin Lymphoma 18.5 15.8 21.5 24.2 19.7 29.4 14.1 10.9 17.8180 108 72
Myeloma 7.0 5.4 9.0 10.0 7.2 13.6 4.6 2.9 7.066 43 23
Leukemia 11.8 9.7 14.3 15.3 11.8 19.5 9.1 6.6 12.2116 68 48
All Other Sites 58.1 53.2 63.4 54.0 47.0 61.7 63.6 56.5 71.4538 227 311
DATA SOURCE: Illinois Department of Public Health, Illinois State Cancer Registry, data as of November 2018
Breast in Situ (not in total) 27.8 23.2 32.9 139
III - 12

All Sites Combined and Selected Sites, All Races, 2012-2016Figures include invasive cancer with the exception of urinary bladder (includes in situ) and breast cancer in situ as a separate category. Incidence counts are five-year totals.
Rates are per 100,000 age-adjustd to the 2000 U.S. standard million population. Lower confidence intervals (LCI) and upper confidence intervals (UCI) are 95 percent for rates,
Tiwari method.
Site Rate LCI UCI
Both Sexes Males Females
Cancer Incidence Counts and Five-year Age-adjusted Rates by Sex
Rate LCI UCI Rate LCI UCICount Count Count
Christian
All Sites 545.6 515.1 577.6 637.6 590.2 688.1 474.5 434.3 517.81,262 689 573
Oral Cavity and Pharynx 13.6 9.3 19.5 20.6 13.0 31.4 6.2 2.8 12.933 24 9
Esophagus 5.8 3.1 10.0 11.4 6.0 20.0 0.7 0.0 5.614 13 1
Stomach 6.1 3.4 10.4 6.0 2.4 13.1 5.6 2.4 12.215 7 8
Colon and Rectum 55.1 45.7 65.9 74.3 58.6 93.3 37.0 27.0 49.9129 79 50
Liver 8.7 5.2 13.8 10.1 4.7 19.0 7.3 3.4 14.520 10 10
Pancreas 12.2 8.2 17.8 18.3 11.1 28.8 6.5 3.1 13.330 20 10
Lung and Bronchus 93.5 81.5 106.9 115.6 96.2 138.1 76.0 61.4 93.6226 127 99
Bones and Joints 0 0 0
Melanoma of the Skin 21.3 15.5 28.9 25.4 16.5 37.6 17.9 10.5 28.946 26 20
Breast (invasive) 67.3 56.7 79.4 1.0 0.0 6.0 130.2 109.3 154.3152 1 151
Cervix 12.0 5.8 22.111
Corpus and Uterus, NOS 19.3 12.2 29.724
Ovary 11.1 5.5 20.412
Prostate 113.6 94.7 135.5129
Testis 6.5 2.1 15.15
Urinary Bladder (includes in situ) 23.8 17.9 31.1 43.9 32.2 58.9 7.7 3.8 14.958 47 11
Kidney and Renal Pelvis 32.2 24.9 41.2 44.5 32.5 59.8 21.1 12.9 32.971 47 24
Brain and Nervous System 9.0 5.3 14.4 6.9 2.7 14.7 11.4 5.5 21.119 7 12
Hodgkin Lymphoma 3.9 1.4 8.5 6.2 2.0 14.6 1.3 0.0 7.26 5 1
Non-Hodgkin Lymphoma 23.5 17.7 30.9 28.3 19.1 40.7 19.1 12.3 29.156 31 25
Myeloma 6.2 3.5 10.4 10.8 5.6 19.5 2.7 0.7 8.316 12 4
Leukemia 13.0 8.6 19.1 17.6 10.3 28.4 8.8 4.1 16.929 18 11
All Other Sites 72.3 61.2 85.0 76.5 60.5 95.6 72.6 56.4 92.2161 81 80
DATA SOURCE: Illinois Department of Public Health, Illinois State Cancer Registry, data as of November 2018
Breast in Situ (not in total) 24.6 15.5 37.4 25
III - 13

All Sites Combined and Selected Sites, All Races, 2012-2016Figures include invasive cancer with the exception of urinary bladder (includes in situ) and breast cancer in situ as a separate category. Incidence counts are five-year totals.
Rates are per 100,000 age-adjustd to the 2000 U.S. standard million population. Lower confidence intervals (LCI) and upper confidence intervals (UCI) are 95 percent for rates,
Tiwari method.
Site Rate LCI UCI
Both Sexes Males Females
Cancer Incidence Counts and Five-year Age-adjusted Rates by Sex
Rate LCI UCI Rate LCI UCICount Count Count
Clark
All Sites 470.3 429.7 514.1 533.5 470.5 603.1 434.0 379.3 495.0522 271 251
Oral Cavity and Pharynx 14.3 7.9 24.3 21.7 10.0 41.3 8.1 2.9 20.316 10 6
Esophagus 5.5 2.0 12.7 12.2 4.4 27.76 6 0
Stomach 4.3 1.4 11.0 3.6 0.4 15.2 4.6 0.9 15.95 2 3
Colon and Rectum 41.5 30.0 56.3 36.7 22.2 58.1 43.8 27.5 67.046 20 26
Liver 5.2 1.9 12.2 9.2 2.5 24.3 2.6 0.3 13.06 4 2
Pancreas 21.3 13.7 32.1 26.6 14.4 46.1 18.1 8.8 34.325 14 11
Lung and Bronchus 77.6 62.1 96.4 80.8 57.6 110.8 76.7 56.0 103.688 41 47
Bones and Joints 0.7 0.0 5.6 2.4 0.1 13.81 1 0
Melanoma of the Skin 22.3 14.0 34.1 36.7 21.3 59.5 10.5 3.6 24.824 18 6
Breast (invasive) 52.2 39.1 68.7 98.3 73.3 129.956 0 56
Cervix 10.7 2.6 27.84
Corpus and Uterus, NOS 32.7 19.1 53.119
Ovary 7.7 2.5 20.25
Prostate 94.1 70.1 124.852
Testis 10.3 2.7 26.64
Urinary Bladder (includes in situ) 26.1 17.7 37.7 44.4 27.9 67.8 12.8 5.4 27.431 23 8
Kidney and Renal Pelvis 21.5 13.3 33.2 28.6 15.3 49.3 17.4 7.5 34.923 14 9
Brain and Nervous System 5.9 2.1 13.4 6.4 1.2 20.0 4.9 0.9 16.86 3 3
Hodgkin Lymphoma 5.0 1.0 13.7 3.7 0.1 17.6 6.3 0.8 21.53 1 2
Non-Hodgkin Lymphoma 20.2 12.9 30.7 17.8 8.5 34.3 20.9 11.4 37.024 10 14
Myeloma 6.0 2.4 13.2 10.0 3.2 24.6 3.4 0.4 14.57 5 2
Leukemia 8.9 4.2 17.2 15.2 6.4 31.5 4.3 0.4 16.810 8 2
All Other Sites 56.7 42.8 73.9 73.2 50.5 103.0 50.1 31.6 76.061 35 26
DATA SOURCE: Illinois Department of Public Health, Illinois State Cancer Registry, data as of November 2018
Breast in Situ (not in total) 15.6 6.9 31.5 9
III - 14

All Sites Combined and Selected Sites, All Races, 2012-2016Figures include invasive cancer with the exception of urinary bladder (includes in situ) and breast cancer in situ as a separate category. Incidence counts are five-year totals.
Rates are per 100,000 age-adjustd to the 2000 U.S. standard million population. Lower confidence intervals (LCI) and upper confidence intervals (UCI) are 95 percent for rates,
Tiwari method.
Site Rate LCI UCI
Both Sexes Males Females
Cancer Incidence Counts and Five-year Age-adjusted Rates by Sex
Rate LCI UCI Rate LCI UCICount Count Count
Clay
All Sites 531.6 483.8 583.1 589.8 518.3 669.1 487.3 422.7 559.7495 260 235
Oral Cavity and Pharynx 21.7 12.8 34.8 31.3 16.4 55.1 13.0 4.4 30.719 13 6
Esophagus 11.1 5.4 21.1 21.4 9.9 41.5 2.1 0.1 14.611 10 1
Stomach 7.2 3.1 15.6 8.4 2.3 23.8 5.7 1.4 18.88 4 4
Colon and Rectum 47.3 34.5 63.9 49.5 31.0 76.1 44.0 27.4 68.347 23 24
Liver 6.0 2.2 14.3 13.2 4.7 30.76 6 0
Pancreas 7.7 3.3 16.4 11.4 3.6 28.4 4.0 0.8 16.38 5 3
Lung and Bronchus 88.3 70.7 109.6 110.9 82.1 147.5 70.8 49.7 99.289 51 38
Bones and Joints 0 0 0
Melanoma of the Skin 24.7 14.3 39.6 23.4 11.0 44.7 28.8 12.6 55.419 10 9
Breast (invasive) 67.7 51.2 88.1 126.4 95.0 165.763 0 63
Cervix 11.4 2.9 30.24
Corpus and Uterus, NOS 20.5 9.5 40.110
Ovary 18.7 7.8 38.49
Prostate 115.9 86.5 153.154
Testis 7.1 0.9 24.52
Urinary Bladder (includes in situ) 28.8 19.4 42.1 49.0 30.9 75.3 12.6 5.0 28.630 23 7
Kidney and Renal Pelvis 30.6 19.2 46.6 38.9 21.0 66.2 23.2 10.4 45.225 15 10
Brain and Nervous System 4.7 1.2 13.1 5.8 1.2 19.8 3.8 0.1 19.04 3 1
Hodgkin Lymphoma 1.8 0.0 9.3 3.5 0.1 18.31 1 0
Non-Hodgkin Lymphoma 21.9 13.0 35.1 21.8 10.0 42.4 21.3 9.7 41.620 10 10
Myeloma 3.8 1.0 11.0 4.5 0.5 18.6 3.4 0.4 15.94 2 2
Leukemia 23.2 14.0 36.6 36.1 19.4 61.9 12.7 4.7 29.421 14 7
All Other Sites 51.2 36.0 70.8 37.8 20.1 64.7 65.1 41.3 97.941 14 27
DATA SOURCE: Illinois Department of Public Health, Illinois State Cancer Registry, data as of November 2018
Breast in Situ (not in total) 24.6 12.3 45.2 12
III - 15

All Sites Combined and Selected Sites, All Races, 2012-2016Figures include invasive cancer with the exception of urinary bladder (includes in situ) and breast cancer in situ as a separate category. Incidence counts are five-year totals.
Rates are per 100,000 age-adjustd to the 2000 U.S. standard million population. Lower confidence intervals (LCI) and upper confidence intervals (UCI) are 95 percent for rates,
Tiwari method.
Site Rate LCI UCI
Both Sexes Males Females
Cancer Incidence Counts and Five-year Age-adjusted Rates by Sex
Rate LCI UCI Rate LCI UCICount Count Count
Clinton
All Sites 467.0 439.0 496.4 489.3 447.8 533.6 462.7 423.3 504.91,078 532 546
Oral Cavity and Pharynx 13.6 9.2 19.6 17.6 10.5 27.8 10.0 5.0 18.231 19 12
Esophagus 4.1 1.9 7.9 5.7 2.2 12.3 2.2 0.4 7.410 7 3
Stomach 7.1 4.1 11.6 10.5 5.4 18.7 3.9 1.2 9.817 12 5
Colon and Rectum 39.8 32.0 49.1 47.7 35.6 62.9 32.6 23.1 45.194 53 41
Liver 4.5 2.1 8.5 5.8 2.1 13.0 3.1 0.8 8.910 6 4
Pancreas 12.7 8.5 18.3 17.0 10.0 27.2 9.6 4.9 17.430 18 12
Lung and Bronchus 64.9 54.9 76.4 81.0 64.7 100.4 52.3 40.0 67.4152 87 65
Bones and Joints 1.7 0.3 5.1 1.2 0.0 6.3 2.3 0.2 8.53 1 2
Melanoma of the Skin 26.9 20.3 34.9 22.9 14.5 34.4 32.8 22.4 46.459 24 35
Breast (invasive) 71.2 60.4 83.3 1.3 0.0 6.5 139.5 118.2 163.8163 1 162
Cervix 7.3 2.8 15.47
Corpus and Uterus, NOS 36.3 26.1 49.544
Ovary 14.9 8.3 24.717
Prostate 113.1 93.9 135.1127
Testis 8.6 3.9 16.69
Urinary Bladder (includes in situ) 19.3 14.1 25.8 28.9 19.8 41.1 11.1 6.2 19.048 33 15
Kidney and Renal Pelvis 21.2 15.6 28.4 27.4 18.4 39.5 14.5 8.5 23.649 31 18
Brain and Nervous System 10.2 6.1 15.9 16.2 9.0 26.8 4.4 1.4 10.920 15 5
Hodgkin Lymphoma 1.9 0.5 5.1 1.7 0.2 6.7 2.8 0.3 9.44 2 2
Non-Hodgkin Lymphoma 16.1 11.3 22.5 19.2 11.6 29.9 12.8 7.3 21.337 20 17
Myeloma 4.3 2.1 8.2 8.8 4.0 16.9 0.9 0.0 5.610 9 1
Leukemia 10.6 6.7 16.1 14.1 7.7 23.8 8.2 3.7 15.924 14 10
All Other Sites 49.6 40.7 60.0 40.4 29.3 54.6 61.2 47.1 78.4113 44 69
DATA SOURCE: Illinois Department of Public Health, Illinois State Cancer Registry, data as of November 2018
Breast in Situ (not in total) 28.6 19.4 41.0 33
III - 16

All Sites Combined and Selected Sites, All Races, 2012-2016Figures include invasive cancer with the exception of urinary bladder (includes in situ) and breast cancer in situ as a separate category. Incidence counts are five-year totals.
Rates are per 100,000 age-adjustd to the 2000 U.S. standard million population. Lower confidence intervals (LCI) and upper confidence intervals (UCI) are 95 percent for rates,
Tiwari method.
Site Rate LCI UCI
Both Sexes Males Females
Cancer Incidence Counts and Five-year Age-adjusted Rates by Sex
Rate LCI UCI Rate LCI UCICount Count Count
Coles
All Sites 451.3 426.9 476.9 522.8 484.5 563.4 399.7 367.6 433.91,355 721 634
Oral Cavity and Pharynx 13.7 9.8 18.8 25.6 17.7 35.9 3.4 1.2 8.042 36 6
Esophagus 5.0 2.8 8.5 7.5 3.5 14.2 2.9 1.0 7.415 10 5
Stomach 4.2 2.3 7.3 4.9 1.9 10.4 3.4 1.3 7.914 7 7
Colon and Rectum 46.6 39.1 55.2 54.0 42.0 68.5 41.3 31.9 52.8143 71 72
Liver 8.2 5.3 12.3 14.9 9.2 23.1 2.2 0.6 6.326 22 4
Pancreas 9.0 5.9 13.2 9.6 5.2 16.5 8.5 4.5 14.928 14 14
Lung and Bronchus 73.6 64.2 84.2 82.3 67.6 99.3 68.0 55.7 82.3226 114 112
Bones and Joints 1.5 0.3 4.2 2.9 0.6 8.33 3 0
Melanoma of the Skin 27.5 21.7 34.4 37.9 28.1 50.2 19.7 13.1 28.683 52 31
Breast (invasive) 58.1 49.1 68.3 2.2 0.4 6.8 107.9 90.7 127.4160 3 157
Cervix 5.2 2.0 10.97
Corpus and Uterus, NOS 23.0 15.6 32.935
Ovary 12.2 7.0 19.818
Prostate 72.7 59.4 88.3108
Testis 7.1 2.9 14.18
Urinary Bladder (includes in situ) 25.8 20.3 32.4 49.7 38.4 63.5 6.6 3.0 12.778 68 10
Kidney and Renal Pelvis 23.6 18.2 30.2 33.6 24.3 45.4 15.2 9.4 23.269 45 24
Brain and Nervous System 7.2 4.4 11.2 10.1 5.4 17.3 4.5 1.7 9.921 14 7
Hodgkin Lymphoma 1.6 0.4 4.1 2.6 0.5 7.6 0.5 0.0 3.94 3 1
Non-Hodgkin Lymphoma 17.2 12.7 22.9 23.0 15.2 33.3 12.5 7.8 19.352 29 23
Myeloma 8.1 5.2 12.0 11.0 6.2 18.2 5.6 2.6 10.926 16 10
Leukemia 13.4 9.6 18.4 18.0 11.6 27.0 9.7 5.4 16.341 25 16
All Other Sites 49.3 41.4 58.2 53.1 41.4 67.2 47.4 36.8 60.3148 73 75
DATA SOURCE: Illinois Department of Public Health, Illinois State Cancer Registry, data as of November 2018
Breast in Situ (not in total) 14.0 8.2 22.3 19
III - 17

All Sites Combined and Selected Sites, All Races, 2012-2016Figures include invasive cancer with the exception of urinary bladder (includes in situ) and breast cancer in situ as a separate category. Incidence counts are five-year totals.
Rates are per 100,000 age-adjustd to the 2000 U.S. standard million population. Lower confidence intervals (LCI) and upper confidence intervals (UCI) are 95 percent for rates,
Tiwari method.
Site Rate LCI UCI
Both Sexes Males Females
Cancer Incidence Counts and Five-year Age-adjusted Rates by Sex
Rate LCI UCI Rate LCI UCICount Count Count
Cook
All Sites 451.7 449.2 454.2 493.9 489.9 497.9 426.9 423.6 430.2127,875 61,721 66,154
Oral Cavity and Pharynx 11.2 10.8 11.6 17.2 16.5 18.0 6.3 5.9 6.73,232 2,243 989
Esophagus 4.4 4.1 4.6 7.5 7.0 8.0 2.0 1.7 2.21,264 942 322
Stomach 9.1 8.7 9.4 12.4 11.8 13.1 6.6 6.2 7.02,545 1,499 1,046
Colon and Rectum 43.5 42.8 44.3 51.6 50.3 52.9 37.6 36.6 38.612,324 6,353 5,971
Liver 7.4 7.1 7.7 11.9 11.3 12.6 3.7 3.4 4.02,178 1,583 595
Pancreas 13.9 13.4 14.3 16.1 15.3 16.8 12.2 11.7 12.83,936 1,956 1,980
Lung and Bronchus 59.3 58.3 60.2 69.5 67.9 71.0 52.1 51.0 53.316,642 8,344 8,298
Bones and Joints 0.9 0.8 1.0 1.0 0.8 1.2 0.7 0.6 0.9232 127 105
Melanoma of the Skin 13.9 13.4 14.3 18.3 17.5 19.1 11.0 10.5 11.63,885 2,235 1,650
Breast (invasive) 71.3 70.3 72.3 1.4 1.2 1.6 130.1 128.2 131.920,004 170 19,834
Cervix 8.2 7.7 8.71,167
Corpus and Uterus, NOS 30.9 30.0 31.84,920
Ovary 11.3 10.8 11.91,741
Prostate 114.6 112.7 116.515,172
Testis 5.6 5.2 6.0750
Urinary Bladder (includes in situ) 19.1 18.6 19.6 33.3 32.2 34.3 9.1 8.7 9.65,334 3,862 1,472
Kidney and Renal Pelvis 16.1 15.6 16.5 22.3 21.5 23.2 10.9 10.4 11.54,564 2,853 1,711
Brain and Nervous System 5.6 5.3 5.9 6.4 6.0 6.9 4.8 4.5 5.21,535 821 714
Hodgkin Lymphoma 2.9 2.7 3.1 3.5 3.1 3.8 2.4 2.2 2.7781 445 336
Non-Hodgkin Lymphoma 18.9 18.4 19.4 22.7 21.9 23.6 16.0 15.3 16.65,236 2,747 2,489
Myeloma 7.4 7.1 7.7 8.8 8.3 9.4 6.3 5.9 6.72,081 1,080 1,001
Leukemia 12.7 12.3 13.1 16.6 15.8 17.3 9.8 9.3 10.33,479 1,984 1,495
All Other Sites 53.4 52.6 54.3 53.4 52.1 54.8 54.8 53.6 56.014,873 6,555 8,318
DATA SOURCE: Illinois Department of Public Health, Illinois State Cancer Registry, data as of November 2018
Breast in Situ (not in total) 33.8 32.8 34.7 5,021
III - 18

All Sites Combined and Selected Sites, All Races, 2012-2016Figures include invasive cancer with the exception of urinary bladder (includes in situ) and breast cancer in situ as a separate category. Incidence counts are five-year totals.
Rates are per 100,000 age-adjustd to the 2000 U.S. standard million population. Lower confidence intervals (LCI) and upper confidence intervals (UCI) are 95 percent for rates,
Tiwari method.
Site Rate LCI UCI
Both Sexes Males Females
Cancer Incidence Counts and Five-year Age-adjusted Rates by Sex
Rate LCI UCI Rate LCI UCICount Count Count
Crawford
All Sites 475.4 437.8 515.5 535.3 477.6 598.4 436.0 385.1 492.4621 323 298
Oral Cavity and Pharynx 9.3 4.9 16.5 13.3 6.1 26.4 4.8 1.3 14.913 9 4
Esophagus 1.3 0.2 5.8 1.3 0.0 9.6 1.3 0.0 10.02 1 1
Stomach 10.9 5.8 19.2 20.7 10.7 36.9 1.4 0.0 10.313 12 1
Colon and Rectum 36.1 26.5 48.4 39.7 25.0 60.3 32.7 20.8 50.249 23 26
Liver 2.9 0.8 8.1 3.2 0.4 12.9 2.6 0.3 12.04 2 2
Pancreas 15.4 9.5 24.2 14.9 6.4 29.8 17.8 9.2 32.321 8 13
Lung and Bronchus 73.2 59.4 89.6 85.2 63.4 112.7 65.2 47.8 87.9100 52 48
Bones and Joints 1.7 0.2 6.8 1.2 0.0 9.5 2.6 0.1 13.52 1 1
Melanoma of the Skin 20.3 13.4 30.0 33.4 20.3 52.5 11.8 4.9 25.028 20 8
Breast (invasive) 47.3 35.7 61.7 1.4 0.0 9.8 92.3 68.7 121.960 1 59
Cervix 4.0 0.4 15.12
Corpus and Uterus, NOS 29.2 18.1 46.022
Ovary 12.4 4.9 26.58
Prostate 101.2 77.7 130.265
Testis 4.3 0.5 15.52
Urinary Bladder (includes in situ) 26.7 18.6 37.5 44.5 29.2 65.6 11.3 5.0 23.636 27 9
Kidney and Renal Pelvis 23.2 15.1 34.1 20.7 10.9 36.5 25.8 13.6 44.628 13 15
Brain and Nervous System 8.1 3.8 15.4 11.7 4.6 25.1 4.4 0.9 14.810 7 3
Hodgkin Lymphoma 1.1 0.0 6.0 1.9 0.0 11.21 1 0
Non-Hodgkin Lymphoma 22.6 15.0 33.1 26.3 14.6 44.1 17.5 9.5 31.229 15 14
Myeloma 7.2 3.4 13.9 9.9 3.6 22.5 5.2 1.4 15.410 6 4
Leukemia 22.9 15.1 33.5 24.6 13.5 41.6 21.7 11.5 38.129 15 14
All Other Sites 72.0 57.2 89.7 75.7 54.5 102.8 71.9 50.8 99.287 43 44
DATA SOURCE: Illinois Department of Public Health, Illinois State Cancer Registry, data as of November 2018
Breast in Situ (not in total) 8.2 2.6 20.7 5
III - 19

All Sites Combined and Selected Sites, All Races, 2012-2016Figures include invasive cancer with the exception of urinary bladder (includes in situ) and breast cancer in situ as a separate category. Incidence counts are five-year totals.
Rates are per 100,000 age-adjustd to the 2000 U.S. standard million population. Lower confidence intervals (LCI) and upper confidence intervals (UCI) are 95 percent for rates,
Tiwari method.
Site Rate LCI UCI
Both Sexes Males Females
Cancer Incidence Counts and Five-year Age-adjusted Rates by Sex
Rate LCI UCI Rate LCI UCICount Count Count
Cumberland
All Sites 449.8 400.8 503.6 485.6 412.8 568.3 420.2 354.5 495.4327 167 160
Oral Cavity and Pharynx 17.8 9.1 31.7 23.3 9.6 48.4 12.1 3.8 31.513 8 5
Esophagus 7.3 2.6 17.2 12.4 4.0 31.8 2.2 0.1 17.26 5 1
Stomach 0 0 0
Colon and Rectum 61.3 44.0 83.6 79.9 51.5 119.0 45.7 26.4 75.344 26 18
Liver 1.1 0.0 8.6 2.2 0.1 17.21 1 0
Pancreas 14.3 6.8 27.3 25.3 10.8 51.2 5.3 0.6 22.210 8 2
Lung and Bronchus 79.6 60.8 103.1 88.9 60.1 127.9 73.2 49.3 106.562 31 31
Bones and Joints 1.1 0.0 8.6 2.2 0.1 17.21 1 0
Melanoma of the Skin 24.2 14.1 39.4 29.2 13.8 55.6 19.0 7.7 41.218 10 8
Breast (invasive) 40.7 26.5 60.2 79.0 51.2 117.228 0 28
Cervix 7.5 0.7 28.32
Corpus and Uterus, NOS 29.0 14.9 53.212
Ovary 23.2 9.6 48.18
Prostate 70.2 45.1 105.525
Testis 4.5 0.1 23.01
Urinary Bladder (includes in situ) 16.5 8.7 29.3 25.3 12.0 49.0 7.8 1.6 25.713 10 3
Kidney and Renal Pelvis 14.2 6.9 26.8 22.2 9.2 46.2 7.2 1.5 24.411 8 3
Brain and Nervous System 4.0 0.4 14.3 4.9 0.1 24.3 2.6 0.1 18.12 1 1
Hodgkin Lymphoma 7.6 1.9 19.9 15.2 3.8 39.64 4 0
Non-Hodgkin Lymphoma 20.9 11.6 35.4 30.9 15.1 57.3 11.4 3.1 31.315 11 4
Myeloma 4.0 0.8 13.1 7.0 1.4 24.23 0 3
Leukemia 11.1 4.6 23.1 7.2 0.9 26.5 13.2 4.3 33.48 2 6
All Other Sites 57.8 40.4 80.4 41.6 22.7 71.2 74.5 46.4 113.740 15 25
DATA SOURCE: Illinois Department of Public Health, Illinois State Cancer Registry, data as of November 2018
Breast in Situ (not in total) 7.3 0.7 27.7 2
III - 20

All Sites Combined and Selected Sites, All Races, 2012-2016Figures include invasive cancer with the exception of urinary bladder (includes in situ) and breast cancer in situ as a separate category. Incidence counts are five-year totals.
Rates are per 100,000 age-adjustd to the 2000 U.S. standard million population. Lower confidence intervals (LCI) and upper confidence intervals (UCI) are 95 percent for rates,
Tiwari method.
Site Rate LCI UCI
Both Sexes Males Females
Cancer Incidence Counts and Five-year Age-adjusted Rates by Sex
Rate LCI UCI Rate LCI UCICount Count Count
DeKalb
All Sites 496.1 476.1 516.7 532.3 501.5 564.4 472.9 446.1 500.82,413 1,191 1,222
Oral Cavity and Pharynx 10.5 7.9 13.7 13.2 9.0 18.6 8.0 5.0 12.356 34 22
Esophagus 5.0 3.1 7.4 8.6 5.1 13.5 1.9 0.6 4.624 19 5
Stomach 5.2 3.4 7.7 9.1 5.5 14.2 2.1 0.8 4.826 20 6
Colon and Rectum 41.0 35.3 47.2 41.2 32.9 50.8 40.5 33.0 49.3197 92 105
Liver 5.9 3.9 8.4 10.1 6.5 15.1 2.0 0.6 4.830 25 5
Pancreas 16.4 12.9 20.5 18.5 13.1 25.3 15.1 10.6 20.780 41 39
Lung and Bronchus 67.1 59.8 75.1 75.2 63.6 88.2 60.8 51.5 71.3314 158 156
Bones and Joints 0.6 0.1 1.9 0.9 0.1 3.2 0.3 0.0 2.03 2 1
Melanoma of the Skin 18.6 14.9 22.9 20.8 15.0 28.0 17.8 12.9 23.991 45 46
Breast (invasive) 68.1 60.9 76.0 1.6 0.4 4.3 126.7 113.1 141.5334 4 330
Cervix 7.0 3.9 11.516
Corpus and Uterus, NOS 27.7 21.5 35.171
Ovary 13.2 9.0 18.634
Prostate 118.7 104.8 133.9280
Testis 5.9 3.1 10.213
Urinary Bladder (includes in situ) 25.4 21.0 30.4 42.5 34.0 52.5 12.1 8.3 17.1124 90 34
Kidney and Renal Pelvis 22.3 18.2 27.0 34.8 27.2 43.8 11.6 7.8 16.7106 76 30
Brain and Nervous System 4.8 3.0 7.2 7.4 4.2 12.0 2.7 1.0 5.624 17 7
Hodgkin Lymphoma 1.9 0.9 3.6 2.8 1.1 5.9 1.3 0.3 3.911 8 3
Non-Hodgkin Lymphoma 21.3 17.3 26.0 23.8 17.6 31.4 19.0 13.9 25.2101 52 49
Myeloma 5.0 3.2 7.4 7.8 4.6 12.3 2.5 1.0 5.226 19 7
Leukemia 19.2 15.5 23.7 25.4 19.1 33.0 13.8 9.6 19.394 58 36
All Other Sites 74.9 67.1 83.2 64.1 53.6 76.1 86.7 75.4 99.3358 138 220
DATA SOURCE: Illinois Department of Public Health, Illinois State Cancer Registry, data as of November 2018
Breast in Situ (not in total) 28.4 22.0 36.0 70
III - 21

All Sites Combined and Selected Sites, All Races, 2012-2016Figures include invasive cancer with the exception of urinary bladder (includes in situ) and breast cancer in situ as a separate category. Incidence counts are five-year totals.
Rates are per 100,000 age-adjustd to the 2000 U.S. standard million population. Lower confidence intervals (LCI) and upper confidence intervals (UCI) are 95 percent for rates,
Tiwari method.
Site Rate LCI UCI
Both Sexes Males Females
Cancer Incidence Counts and Five-year Age-adjusted Rates by Sex
Rate LCI UCI Rate LCI UCICount Count Count
DeWitt
All Sites 554.2 509.6 602.0 593.4 526.5 666.8 530.1 469.7 596.9603 299 304
Oral Cavity and Pharynx 13.3 7.3 22.8 14.1 5.6 30.4 12.8 5.5 27.215 7 8
Esophagus 5.3 1.9 12.4 9.7 3.1 24.2 1.6 0.0 11.86 5 1
Stomach 8.1 3.7 16.2 3.4 0.4 14.6 12.3 4.8 27.19 2 7
Colon and Rectum 63.1 48.8 80.7 77.7 54.9 107.5 49.5 33.0 72.669 39 30
Liver 7.3 2.8 15.8 10.1 3.2 24.8 5.1 0.5 18.87 5 2
Pancreas 11.1 5.9 19.8 7.8 2.1 21.4 13.7 6.2 28.013 4 9
Lung and Bronchus 96.3 78.9 116.8 116.7 88.3 151.9 80.1 59.3 106.9110 59 51
Bones and Joints 0.8 0.0 5.8 1.5 0.0 11.51 0 1
Melanoma of the Skin 32.8 22.0 47.2 41.5 24.6 66.0 25.7 13.0 46.032 19 13
Breast (invasive) 78.2 61.8 97.9 151.0 119.1 189.683 0 83
Cervix 11.2 3.4 27.35
Corpus and Uterus, NOS 24.4 12.8 43.014
Ovary 10.3 3.7 24.26
Prostate 130.2 101.0 166.070
Testis 2.8 0.1 15.01
Urinary Bladder (includes in situ) 19.6 12.2 30.3 25.8 13.6 45.2 14.7 6.6 29.722 13 9
Kidney and Renal Pelvis 17.3 10.0 28.3 25.7 13.3 45.4 9.8 2.9 24.718 13 5
Brain and Nervous System 1.8 0.2 7.4 2.3 0.1 13.5 1.5 0.0 11.52 1 1
Hodgkin Lymphoma 1.6 0.0 7.9 3.0 0.1 15.51 1 0
Non-Hodgkin Lymphoma 24.5 15.7 36.7 28.4 14.9 49.4 21.4 10.9 39.026 13 13
Myeloma 4.5 1.5 11.4 7.7 2.1 21.1 1.8 0.0 12.35 4 1
Leukemia 11.8 6.1 21.0 16.4 6.9 33.7 7.4 2.4 19.613 8 5
All Other Sites 70.5 54.8 89.4 69.9 48.2 98.5 74.3 51.9 103.775 35 40
DATA SOURCE: Illinois Department of Public Health, Illinois State Cancer Registry, data as of November 2018
Breast in Situ (not in total) 23.3 12.6 40.7 14
III - 22

All Sites Combined and Selected Sites, All Races, 2012-2016Figures include invasive cancer with the exception of urinary bladder (includes in situ) and breast cancer in situ as a separate category. Incidence counts are five-year totals.
Rates are per 100,000 age-adjustd to the 2000 U.S. standard million population. Lower confidence intervals (LCI) and upper confidence intervals (UCI) are 95 percent for rates,
Tiwari method.
Site Rate LCI UCI
Both Sexes Males Females
Cancer Incidence Counts and Five-year Age-adjusted Rates by Sex
Rate LCI UCI Rate LCI UCICount Count Count
Douglas
All Sites 504.8 464.8 547.5 522.0 463.9 585.7 505.2 448.6 567.2622 304 318
Oral Cavity and Pharynx 10.2 5.1 18.4 15.5 6.9 30.4 5.9 1.1 17.712 9 3
Esophagus 11.5 6.2 19.8 19.1 9.4 35.0 5.4 1.0 16.514 11 3
Stomach 6.5 2.8 13.3 6.5 1.7 17.7 6.5 1.7 17.68 4 4
Colon and Rectum 37.1 26.9 50.0 48.5 32.1 70.9 29.3 16.7 47.946 28 18
Liver 5.7 2.5 11.9 8.7 3.2 20.3 2.4 0.3 10.88 6 2
Pancreas 18.5 11.7 28.0 17.0 8.0 32.3 18.3 9.9 32.024 10 14
Lung and Bronchus 70.8 56.8 87.4 78.4 57.3 105.1 64.5 46.5 87.891 47 44
Bones and Joints 0.6 0.0 4.7 0.9 0.0 8.61 0 1
Melanoma of the Skin 28.2 19.2 40.1 21.4 10.9 38.1 36.3 22.0 56.633 12 21
Breast (invasive) 76.6 60.8 95.3 3.3 0.4 13.0 145.0 114.5 181.388 2 86
Cervix 4.7 0.6 16.12
Corpus and Uterus, NOS 24.0 13.8 39.517
Ovary 12.7 4.8 27.27
Prostate 130.0 102.3 163.478
Testis 5.8 1.1 17.53
Urinary Bladder (includes in situ) 21.3 14.1 31.2 34.7 21.1 54.4 11.6 4.9 24.128 20 8
Kidney and Renal Pelvis 16.6 10.3 25.7 21.3 11.1 37.5 12.2 5.4 24.622 13 9
Brain and Nervous System 11.1 5.8 19.5 12.0 4.7 25.7 9.4 3.1 22.113 7 6
Hodgkin Lymphoma 1.5 0.0 6.9 2.9 0.1 14.01 1 0
Non-Hodgkin Lymphoma 22.2 14.0 33.4 22.4 11.3 39.9 21.6 10.8 38.624 12 12
Myeloma 4.7 1.6 10.8 9.2 2.9 22.0 1.4 0.0 9.56 5 1
Leukemia 11.0 5.9 18.9 8.2 2.6 20.1 13.5 6.0 26.814 5 9
All Other Sites 66.2 52.2 83.0 56.8 38.3 81.4 79.6 58.2 106.582 31 51
DATA SOURCE: Illinois Department of Public Health, Illinois State Cancer Registry, data as of November 2018
Breast in Situ (not in total) 22.9 11.8 40.1 13
III - 23

All Sites Combined and Selected Sites, All Races, 2012-2016Figures include invasive cancer with the exception of urinary bladder (includes in situ) and breast cancer in situ as a separate category. Incidence counts are five-year totals.
Rates are per 100,000 age-adjustd to the 2000 U.S. standard million population. Lower confidence intervals (LCI) and upper confidence intervals (UCI) are 95 percent for rates,
Tiwari method.
Site Rate LCI UCI
Both Sexes Males Females
Cancer Incidence Counts and Five-year Age-adjusted Rates by Sex
Rate LCI UCI Rate LCI UCICount Count Count
DuPage
All Sites 458.1 452.1 464.1 482.3 473.1 491.6 447.6 439.6 455.723,981 11,401 12,580
Oral Cavity and Pharynx 11.4 10.5 12.4 17.2 15.5 18.9 6.6 5.6 7.6619 433 186
Esophagus 4.6 4.1 5.3 8.0 6.8 9.3 2.0 1.5 2.6247 189 58
Stomach 6.6 5.9 7.4 9.6 8.3 11.0 4.2 3.5 5.1344 222 122
Colon and Rectum 38.6 36.8 40.3 43.9 41.2 46.8 33.9 31.7 36.22,015 1,038 977
Liver 4.8 4.2 5.5 7.6 6.5 8.9 2.5 2.0 3.2260 188 72
Pancreas 11.7 10.7 12.6 13.3 11.8 15.0 10.4 9.2 11.7617 306 311
Lung and Bronchus 51.8 49.7 53.8 58.4 55.1 61.8 47.4 44.9 50.12,643 1,303 1,340
Bones and Joints 1.2 0.9 1.6 1.6 1.1 2.2 0.8 0.5 1.356 35 21
Melanoma of the Skin 19.9 18.6 21.1 24.7 22.7 26.9 16.5 14.9 18.11,025 590 435
Breast (invasive) 78.0 75.5 80.5 1.4 0.9 2.0 144.8 140.3 149.54,108 31 4,077
Cervix 5.5 4.6 6.5144
Corpus and Uterus, NOS 30.4 28.4 32.5917
Ovary 12.3 11.0 13.7347
Prostate 108.7 104.5 113.02,813
Testis 6.9 5.8 8.1150
Urinary Bladder (includes in situ) 21.6 20.3 22.9 37.8 35.1 40.5 9.4 8.3 10.61,092 823 269
Kidney and Renal Pelvis 16.2 15.1 17.4 23.3 21.3 25.4 10.3 9.1 11.6861 569 292
Brain and Nervous System 6.6 5.9 7.4 7.6 6.5 8.8 5.9 5.0 6.9341 184 157
Hodgkin Lymphoma 2.6 2.1 3.1 3.0 2.3 3.8 2.2 1.6 2.9121 68 53
Non-Hodgkin Lymphoma 21.0 19.7 22.3 25.6 23.4 27.8 17.4 15.9 19.11,073 580 493
Myeloma 6.5 5.8 7.2 8.6 7.3 9.9 4.9 4.1 5.8332 192 140
Leukemia 15.1 14.1 16.3 19.9 18.0 21.9 11.6 10.4 13.1749 435 314
All Other Sites 61.3 59.1 63.6 55.4 52.3 58.7 68.6 65.4 71.93,107 1,252 1,855
DATA SOURCE: Illinois Department of Public Health, Illinois State Cancer Registry, data as of November 2018
Breast in Situ (not in total) 45.0 42.5 47.6 1,257
III - 24

All Sites Combined and Selected Sites, All Races, 2012-2016Figures include invasive cancer with the exception of urinary bladder (includes in situ) and breast cancer in situ as a separate category. Incidence counts are five-year totals.
Rates are per 100,000 age-adjustd to the 2000 U.S. standard million population. Lower confidence intervals (LCI) and upper confidence intervals (UCI) are 95 percent for rates,
Tiwari method.
Site Rate LCI UCI
Both Sexes Males Females
Cancer Incidence Counts and Five-year Age-adjusted Rates by Sex
Rate LCI UCI Rate LCI UCICount Count Count
Edgar
All Sites 452.4 414.9 492.7 519.6 461.0 584.1 406.0 356.4 461.2585 305 280
Oral Cavity and Pharynx 15.3 8.6 25.5 15.2 6.7 30.7 16.0 6.3 33.217 9 8
Esophagus 7.3 3.6 14.0 14.4 6.8 28.5 1.4 0.0 10.711 10 1
Stomach 4.2 1.5 10.3 4.7 0.9 16.0 3.9 0.7 14.36 3 3
Colon and Rectum 52.1 40.0 67.2 70.0 49.0 97.6 36.7 24.1 55.067 38 29
Liver 4.3 1.6 10.4 10.1 3.6 23.56 6 0
Pancreas 13.6 8.1 22.0 13.5 5.7 28.1 13.6 6.6 26.619 8 11
Lung and Bronchus 75.9 61.7 93.0 82.0 60.7 109.2 73.4 54.0 98.5103 51 52
Bones and Joints 0.7 0.0 5.5 1.6 0.0 11.31 1 0
Melanoma of the Skin 27.2 18.1 39.5 32.3 18.5 53.1 25.3 13.4 44.132 17 15
Breast (invasive) 46.3 35.0 60.4 87.0 65.5 114.262 0 62
Cervix 9.7 2.5 24.84
Corpus and Uterus, NOS 37.0 21.9 58.822
Ovary 6.7 2.2 17.95
Prostate 95.2 72.1 124.260
Testis 18.2 7.1 37.77
Urinary Bladder (includes in situ) 17.9 11.1 27.8 33.9 19.8 54.8 6.1 1.9 16.923 18 5
Kidney and Renal Pelvis 10.0 5.4 17.6 17.6 8.6 33.1 3.4 0.7 13.214 11 3
Brain and Nervous System 6.5 2.4 14.1 10.3 3.1 25.3 2.6 0.3 12.37 5 2
Hodgkin Lymphoma 2.8 0.5 8.9 1.3 0.0 10.8 4.1 0.4 16.03 1 2
Non-Hodgkin Lymphoma 17.1 11.0 26.1 24.9 14.0 42.1 11.6 5.2 24.325 16 9
Myeloma 4.2 1.5 10.2 4.1 0.8 14.5 4.2 0.9 14.66 3 3
Leukemia 13.8 7.5 23.5 16.4 7.2 32.8 10.8 3.8 24.916 9 7
All Other Sites 53.4 41.0 68.8 53.9 36.3 77.9 52.6 35.8 75.469 32 37
DATA SOURCE: Illinois Department of Public Health, Illinois State Cancer Registry, data as of November 2018
Breast in Situ (not in total) 31.6 18.3 51.5 19
III - 25

All Sites Combined and Selected Sites, All Races, 2012-2016Figures include invasive cancer with the exception of urinary bladder (includes in situ) and breast cancer in situ as a separate category. Incidence counts are five-year totals.
Rates are per 100,000 age-adjustd to the 2000 U.S. standard million population. Lower confidence intervals (LCI) and upper confidence intervals (UCI) are 95 percent for rates,
Tiwari method.
Site Rate LCI UCI
Both Sexes Males Females
Cancer Incidence Counts and Five-year Age-adjusted Rates by Sex
Rate LCI UCI Rate LCI UCICount Count Count
Edwards
All Sites 456.7 395.5 525.6 456.7 368.2 561.7 470.2 384.1 571.7214 98 116
Oral Cavity and Pharynx 8.9 2.3 25.2 13.3 2.5 44.2 3.5 0.1 27.84 3 1
Esophagus 1.7 0.0 13.9 3.4 0.1 27.71 0 1
Stomach 7.4 2.0 21.8 11.6 2.3 40.2 3.3 0.1 27.54 3 1
Colon and Rectum 63.2 42.2 92.3 73.6 40.6 124.6 59.6 32.3 103.630 15 15
Liver 10.1 3.2 26.0 3.8 0.1 28.9 13.8 3.6 42.05 1 4
Pancreas 7.2 1.5 22.6 15.7 3.2 48.53 3 0
Lung and Bronchus 73.1 51.0 102.8 71.2 40.2 119.5 75.4 46.2 120.037 16 21
Bones and Joints 0 0 0
Melanoma of the Skin 13.6 4.6 31.9 15.2 3.0 47.8 15.0 2.5 48.66 3 3
Breast (invasive) 63.1 41.7 92.7 120.7 79.3 178.429 0 29
Cervix 7.2 0.9 33.12
Corpus and Uterus, NOS 11.0 2.2 38.33
Ovary 0
Prostate 90.3 55.8 141.322
Testis 7.4 0.2 38.31
Urinary Bladder (includes in situ) 14.8 5.9 32.7 9.3 1.1 38.0 18.4 5.7 49.07 2 5
Kidney and Renal Pelvis 15.6 6.7 33.2 16.2 4.2 47.2 16.4 4.4 47.08 4 4
Brain and Nervous System 0 0 0
Hodgkin Lymphoma 1.5 0.0 13.5 2.3 0.1 25.61 0 1
Non-Hodgkin Lymphoma 21.6 9.8 42.4 27.6 8.2 67.8 16.6 5.3 45.410 5 5
Myeloma 6.7 1.4 21.6 17.7 3.6 52.63 3 0
Leukemia 13.4 4.6 31.7 25.0 7.6 62.3 3.3 0.1 27.56 5 1
All Other Sites 78.9 52.9 113.8 58.8 30.0 105.9 100.2 58.5 160.532 12 20
DATA SOURCE: Illinois Department of Public Health, Illinois State Cancer Registry, data as of November 2018
Breast in Situ (not in total) 21.0 7.7 51.5 6
III - 26

All Sites Combined and Selected Sites, All Races, 2012-2016Figures include invasive cancer with the exception of urinary bladder (includes in situ) and breast cancer in situ as a separate category. Incidence counts are five-year totals.
Rates are per 100,000 age-adjustd to the 2000 U.S. standard million population. Lower confidence intervals (LCI) and upper confidence intervals (UCI) are 95 percent for rates,
Tiwari method.
Site Rate LCI UCI
Both Sexes Males Females
Cancer Incidence Counts and Five-year Age-adjusted Rates by Sex
Rate LCI UCI Rate LCI UCICount Count Count
Effingham
All Sites 491.3 461.2 522.9 559.5 512.4 610.0 449.0 409.0 492.01,047 545 502
Oral Cavity and Pharynx 12.7 8.3 18.7 20.1 12.2 31.5 5.6 2.2 12.328 21 7
Esophagus 3.3 1.4 6.8 5.8 2.3 12.8 0.8 0.0 5.68 7 1
Stomach 4.8 2.4 8.8 10.3 4.7 19.7 1.8 0.2 7.211 9 2
Colon and Rectum 56.0 46.3 67.3 62.0 46.9 80.6 52.6 40.0 68.2121 59 62
Liver 4.9 2.4 9.1 5.2 1.9 12.1 4.7 1.5 11.511 6 5
Pancreas 10.5 6.6 16.0 9.9 4.5 19.1 11.0 6.0 19.323 9 14
Lung and Bronchus 64.0 53.6 75.9 74.9 58.5 94.7 54.3 41.7 69.8139 74 65
Bones and Joints 1.6 0.3 4.8 2.2 0.3 8.2 1.0 0.0 6.03 2 1
Melanoma of the Skin 23.4 16.9 31.6 28.1 18.0 41.8 22.0 13.2 34.346 25 21
Breast (invasive) 63.3 52.6 75.5 118.8 98.5 142.3132 0 132
Cervix 11.2 4.9 21.79
Corpus and Uterus, NOS 31.6 21.8 44.635
Ovary 13.2 7.1 22.615
Prostate 149.0 126.0 175.2155
Testis 6.4 2.0 14.95
Urinary Bladder (includes in situ) 27.0 20.3 35.3 48.9 35.3 66.1 11.7 5.9 21.057 44 13
Kidney and Renal Pelvis 19.9 14.2 27.3 21.8 13.6 33.5 17.9 10.5 28.742 23 19
Brain and Nervous System 7.6 4.2 12.9 10.6 4.8 20.4 4.3 1.5 10.415 9 6
Hodgkin Lymphoma 0 0 0
Non-Hodgkin Lymphoma 15.4 10.6 22.0 18.5 10.6 30.0 13.2 7.5 22.133 17 16
Myeloma 4.5 2.1 8.6 8.1 3.1 17.0 2.0 0.4 7.210 7 3
Leukemia 14.0 9.2 20.5 18.5 10.4 30.3 11.4 5.7 20.728 16 12
All Other Sites 57.8 47.7 69.5 59.0 44.4 77.1 60.0 45.6 77.5121 57 64
DATA SOURCE: Illinois Department of Public Health, Illinois State Cancer Registry, data as of November 2018
Breast in Situ (not in total) 25.2 16.1 37.7 26
III - 27

All Sites Combined and Selected Sites, All Races, 2012-2016Figures include invasive cancer with the exception of urinary bladder (includes in situ) and breast cancer in situ as a separate category. Incidence counts are five-year totals.
Rates are per 100,000 age-adjustd to the 2000 U.S. standard million population. Lower confidence intervals (LCI) and upper confidence intervals (UCI) are 95 percent for rates,
Tiwari method.
Site Rate LCI UCI
Both Sexes Males Females
Cancer Incidence Counts and Five-year Age-adjusted Rates by Sex
Rate LCI UCI Rate LCI UCICount Count Count
Fayette
All Sites 424.6 391.2 460.3 464.3 414.8 518.5 397.8 351.4 449.2618 326 292
Oral Cavity and Pharynx 18.8 12.6 27.5 32.0 20.4 48.4 6.3 2.0 16.229 24 5
Esophagus 5.5 2.4 11.3 12.1 5.2 24.38 8 0
Stomach 5.7 2.5 11.6 12.2 5.3 24.58 8 0
Colon and Rectum 38.4 29.0 50.2 43.7 29.6 62.7 33.2 21.3 50.157 31 26
Liver 5.1 2.2 10.6 3.8 0.8 12.3 5.4 1.7 14.78 3 5
Pancreas 15.8 10.2 23.8 17.5 9.2 30.6 14.1 7.2 26.325 13 12
Lung and Bronchus 56.6 45.0 70.5 80.3 60.7 104.7 36.5 23.7 54.584 57 27
Bones and Joints 2.4 0.5 7.4 4.8 0.9 15.13 0 3
Melanoma of the Skin 18.3 11.6 27.6 16.1 7.6 29.9 20.4 10.8 35.624 10 14
Breast (invasive) 56.4 44.4 70.8 1.2 0.0 8.4 111.0 86.6 140.579 1 78
Cervix 12.9 4.5 28.46
Corpus and Uterus, NOS 26.7 16.6 41.722
Ovary 4.7 1.3 13.94
Prostate 106.2 83.6 133.477
Testis 1.2 0.0 8.31
Urinary Bladder (includes in situ) 14.3 8.9 22.0 22.4 12.7 37.0 6.7 2.4 16.522 16 6
Kidney and Renal Pelvis 19.6 12.7 29.1 19.5 10.2 33.9 20.0 10.3 35.527 13 14
Brain and Nervous System 1.4 0.2 5.5 1.2 0.0 8.4 1.3 0.0 9.42 1 1
Hodgkin Lymphoma 1.1 0.0 5.7 2.2 0.1 11.11 1 0
Non-Hodgkin Lymphoma 16.4 10.6 24.6 16.1 8.0 29.3 17.2 9.3 30.225 11 14
Myeloma 4.0 1.5 9.3 4.2 0.9 13.1 4.1 0.8 13.46 3 3
Leukemia 10.0 5.4 17.2 10.7 4.3 22.4 10.6 4.1 23.014 7 7
All Other Sites 61.4 48.8 76.4 61.7 44.1 84.2 61.9 44.2 84.986 41 45
DATA SOURCE: Illinois Department of Public Health, Illinois State Cancer Registry, data as of November 2018
Breast in Situ (not in total) 23.2 12.4 39.9 15
III - 28

All Sites Combined and Selected Sites, All Races, 2012-2016Figures include invasive cancer with the exception of urinary bladder (includes in situ) and breast cancer in situ as a separate category. Incidence counts are five-year totals.
Rates are per 100,000 age-adjustd to the 2000 U.S. standard million population. Lower confidence intervals (LCI) and upper confidence intervals (UCI) are 95 percent for rates,
Tiwari method.
Site Rate LCI UCI
Both Sexes Males Females
Cancer Incidence Counts and Five-year Age-adjusted Rates by Sex
Rate LCI UCI Rate LCI UCICount Count Count
Ford
All Sites 504.2 458.0 554.1 499.7 433.8 573.5 518.6 452.9 591.9471 215 256
Oral Cavity and Pharynx 12.4 6.5 22.3 20.9 9.4 41.2 5.4 1.3 18.513 9 4
Esophagus 4.2 1.1 11.9 7.8 1.6 23.9 2.1 0.1 14.64 3 1
Stomach 7.2 2.5 16.7 12.9 3.9 31.7 2.0 0.1 14.36 5 1
Colon and Rectum 44.5 32.1 60.7 41.0 24.4 65.8 48.7 30.9 74.345 19 26
Liver 2.6 0.5 9.2 4.0 0.8 16.53 0 3
Pancreas 12.0 5.8 22.6 11.5 3.0 30.2 11.8 4.6 27.511 4 7
Lung and Bronchus 71.4 55.4 91.3 76.5 52.2 109.1 67.6 47.0 95.570 33 37
Bones and Joints 3.2 0.6 10.8 6.0 0.9 21.23 0 3
Melanoma of the Skin 42.0 28.8 59.4 40.5 24.2 64.9 43.6 24.1 72.536 19 17
Breast (invasive) 84.7 66.3 107.0 159.6 124.5 202.478 0 78
Cervix 5.0 0.5 19.92
Corpus and Uterus, NOS 27.8 14.6 49.414
Ovary 19.2 8.3 39.09
Prostate 96.2 68.8 131.842
Testis 0
Urinary Bladder (includes in situ) 20.7 12.7 32.6 41.7 24.5 67.3 5.7 1.2 19.621 18 3
Kidney and Renal Pelvis 15.1 8.2 26.2 19.8 8.9 39.4 10.7 3.4 26.814 9 5
Brain and Nervous System 6.7 2.1 16.1 10.1 2.7 27.2 3.9 0.1 19.55 4 1
Hodgkin Lymphoma 2.8 0.3 10.4 5.6 0.6 21.22 0 2
Non-Hodgkin Lymphoma 16.4 9.2 27.7 21.7 9.7 42.8 12.4 4.7 28.816 9 7
Myeloma 6.1 2.2 14.4 9.9 2.7 26.6 3.3 0.4 15.96 4 2
Leukemia 32.5 21.1 48.0 48.9 29.1 77.5 19.1 8.2 38.828 19 9
All Other Sites 47.8 33.8 65.9 40.3 23.6 65.5 55.0 33.4 85.643 18 25
DATA SOURCE: Illinois Department of Public Health, Illinois State Cancer Registry, data as of November 2018
Breast in Situ (not in total) 32.8 17.7 56.5 15
III - 29

All Sites Combined and Selected Sites, All Races, 2012-2016Figures include invasive cancer with the exception of urinary bladder (includes in situ) and breast cancer in situ as a separate category. Incidence counts are five-year totals.
Rates are per 100,000 age-adjustd to the 2000 U.S. standard million population. Lower confidence intervals (LCI) and upper confidence intervals (UCI) are 95 percent for rates,
Tiwari method.
Site Rate LCI UCI
Both Sexes Males Females
Cancer Incidence Counts and Five-year Age-adjusted Rates by Sex
Rate LCI UCI Rate LCI UCICount Count Count
Franklin
All Sites 552.9 524.4 582.6 628.8 584.8 675.5 497.4 459.6 537.81,507 799 708
Oral Cavity and Pharynx 15.9 11.5 21.6 20.3 13.4 29.9 11.5 6.6 19.345 28 17
Esophagus 7.2 4.3 11.4 13.0 7.3 21.6 2.7 0.7 7.820 16 4
Stomach 4.9 2.6 8.5 6.6 3.0 13.2 3.5 1.1 9.014 9 5
Colon and Rectum 48.6 40.3 58.3 61.7 48.1 78.2 36.7 27.2 48.8128 74 54
Liver 4.6 2.5 8.1 6.4 3.1 12.6 2.9 0.7 8.214 10 4
Pancreas 15.1 10.9 20.7 22.7 15.2 33.0 7.8 4.1 14.243 30 13
Lung and Bronchus 108.8 96.9 122.0 130.7 111.4 152.7 91.5 76.7 108.6312 169 143
Bones and Joints 0 0 0
Melanoma of the Skin 28.8 22.4 36.6 36.6 26.3 49.7 23.3 15.3 34.274 44 30
Breast (invasive) 72.1 61.8 83.7 2.2 0.4 7.1 134.8 115.2 157.1190 3 187
Cervix 10.0 4.4 19.19
Corpus and Uterus, NOS 32.3 23.3 43.946
Ovary 12.2 6.6 20.815
Prostate 111.5 94.2 131.4151
Testis 4.3 1.1 11.24
Urinary Bladder (includes in situ) 27.3 21.4 34.5 49.2 37.4 63.8 8.9 5.0 15.377 61 16
Kidney and Renal Pelvis 22.0 16.6 28.8 25.4 17.3 36.3 18.9 12.1 28.560 34 26
Brain and Nervous System 10.6 6.5 16.4 16.1 8.9 26.6 5.8 2.2 12.722 15 7
Hodgkin Lymphoma 3.4 1.2 7.4 3.8 0.8 10.6 3.0 0.6 9.06 3 3
Non-Hodgkin Lymphoma 20.0 15.0 26.3 22.8 15.2 33.2 17.7 11.4 26.657 30 27
Myeloma 3.5 1.7 6.8 3.6 1.2 9.2 3.6 1.1 9.210 5 5
Leukemia 16.5 11.8 22.7 22.1 14.3 33.0 11.8 6.5 19.942 26 16
All Other Sites 62.5 53.0 73.2 69.8 55.5 86.8 58.7 45.9 74.3168 87 81
DATA SOURCE: Illinois Department of Public Health, Illinois State Cancer Registry, data as of November 2018
Breast in Situ (not in total) 21.2 13.9 31.2 29
III - 30

All Sites Combined and Selected Sites, All Races, 2012-2016Figures include invasive cancer with the exception of urinary bladder (includes in situ) and breast cancer in situ as a separate category. Incidence counts are five-year totals.
Rates are per 100,000 age-adjustd to the 2000 U.S. standard million population. Lower confidence intervals (LCI) and upper confidence intervals (UCI) are 95 percent for rates,
Tiwari method.
Site Rate LCI UCI
Both Sexes Males Females
Cancer Incidence Counts and Five-year Age-adjusted Rates by Sex
Rate LCI UCI Rate LCI UCICount Count Count
Fulton
All Sites 470.2 442.7 499.1 520.1 479.2 563.7 445.9 406.5 488.21,160 617 543
Oral Cavity and Pharynx 14.5 10.0 20.5 24.6 16.4 35.8 5.6 1.9 13.035 29 6
Esophagus 5.2 2.7 9.3 9.7 4.9 17.5 0.6 0.0 5.413 12 1
Stomach 6.1 3.2 10.7 5.5 2.0 12.4 6.9 2.6 15.114 6 8
Colon and Rectum 52.2 43.6 62.3 61.1 47.6 77.6 45.7 34.7 59.6134 71 63
Liver 6.3 3.5 10.5 11.4 6.2 19.7 1.3 0.2 6.316 14 2
Pancreas 12.3 8.4 17.6 12.7 7.1 21.4 11.5 6.6 19.433 15 18
Lung and Bronchus 73.7 63.4 85.4 83.8 68.1 102.4 65.5 52.1 81.9189 101 88
Bones and Joints 1.7 0.4 4.9 3.0 0.5 9.1 0.4 0.0 5.04 3 1
Melanoma of the Skin 20.4 14.8 27.7 19.0 11.8 29.2 24.1 14.9 36.946 22 24
Breast (invasive) 66.7 56.2 78.7 0.9 0.0 5.6 133.7 112.0 158.5154 1 153
Cervix 6.9 2.3 15.66
Corpus and Uterus, NOS 22.7 14.6 34.128
Ovary 11.8 6.1 21.014
Prostate 83.2 68.0 101.2106
Testis 6.1 2.2 13.66
Urinary Bladder (includes in situ) 26.1 20.1 33.5 48.8 37.0 63.6 8.9 3.9 17.867 58 9
Kidney and Renal Pelvis 25.0 18.9 32.5 34.0 24.2 46.6 17.3 10.1 27.961 41 20
Brain and Nervous System 4.5 2.1 8.6 8.6 3.8 16.7 0.6 0.0 5.410 9 1
Hodgkin Lymphoma 2.7 0.8 6.4 4.0 1.1 10.6 1.4 0.0 7.45 4 1
Non-Hodgkin Lymphoma 20.6 15.1 27.5 27.6 18.5 39.8 14.4 8.6 23.250 30 20
Myeloma 6.8 4.0 11.2 7.9 3.6 15.4 6.6 2.9 13.718 9 9
Leukemia 12.7 8.5 18.5 17.0 10.1 27.1 7.6 3.8 14.631 19 12
All Other Sites 49.6 40.8 59.9 51.3 39.0 66.5 52.3 38.7 69.2120 61 59
DATA SOURCE: Illinois Department of Public Health, Illinois State Cancer Registry, data as of November 2018
Breast in Situ (not in total) 28.2 19.1 40.5 33
III - 31

All Sites Combined and Selected Sites, All Races, 2012-2016Figures include invasive cancer with the exception of urinary bladder (includes in situ) and breast cancer in situ as a separate category. Incidence counts are five-year totals.
Rates are per 100,000 age-adjustd to the 2000 U.S. standard million population. Lower confidence intervals (LCI) and upper confidence intervals (UCI) are 95 percent for rates,
Tiwari method.
Site Rate LCI UCI
Both Sexes Males Females
Cancer Incidence Counts and Five-year Age-adjusted Rates by Sex
Rate LCI UCI Rate LCI UCICount Count Count
Gallatin
All Sites 465.3 395.2 545.4 516.4 410.8 643.0 424.8 332.7 536.8178 93 85
Oral Cavity and Pharynx 11.0 2.6 31.7 22.5 5.5 64.64 4 0
Esophagus 3.6 0.4 19.2 7.4 0.9 39.52 2 0
Stomach 2.1 0.1 17.5 4.4 0.1 36.31 1 0
Colon and Rectum 41.0 24.1 67.8 62.0 32.8 112.4 20.4 6.6 56.318 13 5
Liver 2.6 0.1 18.7 5.4 0.1 38.51 1 0
Pancreas 4.6 0.5 21.2 6.1 0.2 40.0 3.8 0.1 34.12 1 1
Lung and Bronchus 88.4 61.7 124.7 104.2 60.7 170.1 82.9 48.6 137.138 19 19
Bones and Joints 0 0 0
Melanoma of the Skin 16.8 4.3 43.2 24.8 4.8 73.2 9.6 0.2 48.84 3 1
Breast (invasive) 68.9 43.2 105.6 129.0 80.2 199.225 0 25
Cervix 9.7 0.2 49.01
Corpus and Uterus, NOS 8.4 1.0 40.52
Ovary 23.2 4.2 69.93
Prostate 75.8 42.4 130.216
Testis 0
Urinary Bladder (includes in situ) 16.0 6.4 36.7 24.3 7.8 64.0 8.0 0.9 39.87 5 2
Kidney and Renal Pelvis 35.6 18.1 64.3 42.9 15.9 94.9 26.6 9.5 65.513 7 6
Brain and Nervous System 15.4 3.8 40.7 10.9 1.2 46.9 19.9 2.4 67.04 2 2
Hodgkin Lymphoma 5.3 0.1 25.9 10.8 0.3 53.11 1 0
Non-Hodgkin Lymphoma 16.6 5.5 39.8 26.7 6.5 73.4 8.5 1.0 41.06 4 2
Myeloma 6.0 1.2 22.6 8.3 1.0 41.3 4.0 0.1 34.43 2 1
Leukemia 10.2 3.3 28.2 8.3 1.0 41.3 11.7 2.4 44.45 2 3
All Other Sites 65.8 39.7 103.2 71.7 32.6 136.7 59.1 28.8 111.022 10 12
DATA SOURCE: Illinois Department of Public Health, Illinois State Cancer Registry, data as of November 2018
Breast in Situ (not in total) 8.1 1.0 39.9 2
III - 32

All Sites Combined and Selected Sites, All Races, 2012-2016Figures include invasive cancer with the exception of urinary bladder (includes in situ) and breast cancer in situ as a separate category. Incidence counts are five-year totals.
Rates are per 100,000 age-adjustd to the 2000 U.S. standard million population. Lower confidence intervals (LCI) and upper confidence intervals (UCI) are 95 percent for rates,
Tiwari method.
Site Rate LCI UCI
Both Sexes Males Females
Cancer Incidence Counts and Five-year Age-adjusted Rates by Sex
Rate LCI UCI Rate LCI UCICount Count Count
Greene
All Sites 531.8 483.9 583.6 549.0 479.5 626.4 525.3 458.8 599.5481 234 247
Oral Cavity and Pharynx 14.9 8.3 25.6 15.8 6.8 33.3 13.6 5.2 30.915 8 7
Esophagus 4.2 1.1 11.8 7.4 1.5 23.0 1.8 0.0 14.14 3 1
Stomach 5.8 2.1 13.7 2.3 0.1 15.0 8.7 2.8 23.56 1 5
Colon and Rectum 42.7 29.9 59.7 62.0 39.6 93.0 24.3 12.9 44.038 25 13
Liver 10.8 5.3 20.3 14.4 5.7 31.9 6.9 1.9 21.111 7 4
Pancreas 9.9 4.4 19.6 4.7 0.6 18.8 14.5 5.5 32.49 2 7
Lung and Bronchus 88.7 70.4 110.8 90.2 63.8 124.8 89.7 64.7 122.584 39 45
Bones and Joints 1.8 0.0 9.4 3.3 0.1 17.71 1 0
Melanoma of the Skin 23.1 13.6 37.0 20.4 8.6 41.5 26.4 12.6 49.519 8 11
Breast (invasive) 82.8 64.6 104.9 158.7 123.4 202.075 0 75
Cervix 4.2 0.1 20.61
Corpus and Uterus, NOS 27.6 14.1 49.813
Ovary 23.2 11.4 43.611
Prostate 109.6 81.1 145.950
Testis 3.3 0.1 17.71
Urinary Bladder (includes in situ) 23.5 14.6 36.5 40.4 23.5 65.7 12.2 3.6 30.722 17 5
Kidney and Renal Pelvis 41.3 27.7 59.3 44.6 25.5 72.6 37.9 20.4 64.832 17 15
Brain and Nervous System 5.7 1.8 14.3 7.9 1.6 24.0 3.6 0.4 16.65 3 2
Hodgkin Lymphoma 3.6 0.6 11.6 6.9 1.2 22.43 3 0
Non-Hodgkin Lymphoma 14.9 8.1 25.8 21.3 9.7 41.6 10.4 3.4 26.614 9 5
Myeloma 5.3 1.7 13.4 9.4 2.5 25.7 2.1 0.1 15.05 4 1
Leukemia 24.1 13.9 39.0 28.0 13.6 51.4 21.8 8.4 45.618 11 7
All Other Sites 47.8 34.3 65.4 57.0 36.3 86.1 37.6 22.0 61.544 25 19
DATA SOURCE: Illinois Department of Public Health, Illinois State Cancer Registry, data as of November 2018
Breast in Situ (not in total) 16.7 7.6 34.2 9
III - 33

All Sites Combined and Selected Sites, All Races, 2012-2016Figures include invasive cancer with the exception of urinary bladder (includes in situ) and breast cancer in situ as a separate category. Incidence counts are five-year totals.
Rates are per 100,000 age-adjustd to the 2000 U.S. standard million population. Lower confidence intervals (LCI) and upper confidence intervals (UCI) are 95 percent for rates,
Tiwari method.
Site Rate LCI UCI
Both Sexes Males Females
Cancer Incidence Counts and Five-year Age-adjusted Rates by Sex
Rate LCI UCI Rate LCI UCICount Count Count
Grundy
All Sites 540.9 512.7 570.3 622.3 576.8 670.5 486.4 449.9 525.21,433 756 677
Oral Cavity and Pharynx 13.5 9.4 18.7 24.0 16.0 34.5 4.1 1.5 9.337 31 6
Esophagus 8.5 5.3 13.0 16.0 9.2 25.7 2.8 0.7 7.422 18 4
Stomach 7.7 4.7 12.0 12.5 6.9 20.8 3.4 1.1 8.221 16 5
Colon and Rectum 46.5 38.6 55.7 57.0 43.6 73.1 39.6 29.8 51.6124 67 57
Liver 6.1 3.6 9.9 12.1 6.8 19.8 0.7 0.0 4.218 17 1
Pancreas 16.2 11.6 21.9 17.2 10.5 26.8 15.3 9.5 23.443 21 22
Lung and Bronchus 78.9 68.4 90.6 94.6 77.2 114.6 67.5 54.7 82.5212 113 99
Bones and Joints 0.4 0.0 2.2 0.8 0.0 4.41 0 1
Melanoma of the Skin 21.9 16.5 28.5 21.3 14.0 31.1 22.3 14.9 32.258 29 29
Breast (invasive) 78.2 67.6 89.9 148.2 128.2 170.5203 0 203
Cervix 7.8 3.7 14.410
Corpus and Uterus, NOS 24.3 16.8 34.035
Ovary 9.0 4.6 15.812
Prostate 136.7 116.6 159.3179
Testis 9.8 5.2 17.113
Urinary Bladder (includes in situ) 23.7 18.1 30.5 40.7 29.3 54.9 10.6 6.0 17.562 46 16
Kidney and Renal Pelvis 24.5 18.8 31.4 33.7 24.0 45.9 16.2 10.2 24.565 42 23
Brain and Nervous System 7.6 4.5 11.9 7.0 2.9 13.9 8.7 4.3 15.619 8 11
Hodgkin Lymphoma 2.2 0.8 5.0 2.7 0.7 7.4 1.8 0.2 6.26 4 2
Non-Hodgkin Lymphoma 17.7 12.8 23.7 26.8 17.8 38.6 11.5 6.4 19.246 31 15
Myeloma 3.8 1.8 7.0 3.8 1.2 9.3 3.3 1.0 8.110 5 5
Leukemia 16.4 11.7 22.3 24.3 15.4 36.2 11.9 6.7 19.641 25 16
All Other Sites 77.2 66.6 89.0 82.1 65.4 101.5 76.8 62.6 93.3196 91 105
DATA SOURCE: Illinois Department of Public Health, Illinois State Cancer Registry, data as of November 2018
Breast in Situ (not in total) 21.1 14.0 30.5 29
III - 34

All Sites Combined and Selected Sites, All Races, 2012-2016Figures include invasive cancer with the exception of urinary bladder (includes in situ) and breast cancer in situ as a separate category. Incidence counts are five-year totals.
Rates are per 100,000 age-adjustd to the 2000 U.S. standard million population. Lower confidence intervals (LCI) and upper confidence intervals (UCI) are 95 percent for rates,
Tiwari method.
Site Rate LCI UCI
Both Sexes Males Females
Cancer Incidence Counts and Five-year Age-adjusted Rates by Sex
Rate LCI UCI Rate LCI UCICount Count Count
Hamilton
All Sites 533.7 475.0 598.3 684.8 589.6 792.6 403.5 332.8 486.4321 194 127
Oral Cavity and Pharynx 16.7 8.3 31.7 23.2 9.2 51.5 11.0 3.0 33.511 7 4
Esophagus 8.2 3.0 20.3 18.2 6.6 44.06 6 0
Stomach 3.2 0.4 13.9 3.3 0.1 23.9 2.6 0.1 22.12 1 1
Colon and Rectum 54.5 36.3 79.3 51.8 26.5 92.1 55.8 32.6 91.931 13 18
Liver 3.5 0.4 14.8 4.2 0.1 26.0 2.7 0.1 22.32 1 1
Pancreas 9.0 3.3 21.7 16.1 5.1 41.7 2.7 0.1 22.36 5 1
Lung and Bronchus 80.8 60.6 106.9 117.0 81.6 165.1 49.0 28.8 81.654 36 18
Bones and Joints 4.5 0.5 17.2 8.7 0.9 33.72 2 0
Melanoma of the Skin 39.2 24.1 61.1 58.4 32.9 97.8 23.0 7.6 54.122 16 6
Breast (invasive) 50.1 33.2 73.3 94.5 62.4 139.430 0 30
Cervix 7.2 0.8 29.82
Corpus and Uterus, NOS 37.0 17.6 70.611
Ovary 5.7 0.7 26.52
Prostate 116.8 80.9 165.435
Testis 5.8 0.1 30.51
Urinary Bladder (includes in situ) 23.9 12.7 41.9 43.0 21.0 79.7 7.0 1.4 27.614 11 3
Kidney and Renal Pelvis 37.1 22.8 58.1 52.0 28.9 88.8 23.4 8.3 53.622 15 7
Brain and Nervous System 5.4 1.0 17.8 2.8 0.1 22.7 8.3 0.9 32.83 1 2
Hodgkin Lymphoma 1.7 0.0 11.9 4.1 0.1 25.61 1 0
Non-Hodgkin Lymphoma 25.4 13.4 44.4 27.3 10.7 59.0 24.1 8.9 54.314 7 7
Myeloma 5.9 1.6 17.5 12.9 3.4 37.54 4 0
Leukemia 12.8 5.5 27.1 19.8 7.2 47.0 5.7 0.7 26.68 6 2
All Other Sites 68.8 48.0 96.4 99.5 64.1 148.9 43.7 21.4 80.538 26 12
DATA SOURCE: Illinois Department of Public Health, Illinois State Cancer Registry, data as of November 2018
Breast in Situ (not in total) 12.8 2.2 40.5 3
III - 35

All Sites Combined and Selected Sites, All Races, 2012-2016Figures include invasive cancer with the exception of urinary bladder (includes in situ) and breast cancer in situ as a separate category. Incidence counts are five-year totals.
Rates are per 100,000 age-adjustd to the 2000 U.S. standard million population. Lower confidence intervals (LCI) and upper confidence intervals (UCI) are 95 percent for rates,
Tiwari method.
Site Rate LCI UCI
Both Sexes Males Females
Cancer Incidence Counts and Five-year Age-adjusted Rates by Sex
Rate LCI UCI Rate LCI UCICount Count Count
Hancock
All Sites 457.9 420.3 498.2 462.2 410.2 519.7 462.9 408.3 523.3619 306 313
Oral Cavity and Pharynx 15.8 9.5 25.3 15.8 7.3 30.7 15.6 7.1 30.621 10 11
Esophagus 2.8 0.7 8.3 5.8 1.5 16.94 4 0
Stomach 4.5 1.5 10.9 4.9 0.8 16.5 3.7 0.8 13.76 3 3
Colon and Rectum 40.3 30.1 53.3 45.3 29.9 66.7 35.5 22.9 53.858 30 28
Liver 4.7 1.6 11.3 7.0 1.8 19.4 2.2 0.2 11.56 4 2
Pancreas 11.8 6.9 19.5 12.6 5.7 25.6 11.2 5.0 23.718 9 9
Lung and Bronchus 65.5 52.8 80.8 80.5 60.8 105.7 54.2 37.9 76.297 57 40
Bones and Joints 0 0 0
Melanoma of the Skin 30.4 20.6 43.4 25.3 14.1 42.8 36.5 21.1 58.936 16 20
Breast (invasive) 64.3 50.8 80.7 3.4 0.4 13.7 120.6 94.5 152.387 2 85
Cervix 17.7 6.2 37.96
Corpus and Uterus, NOS 29.0 17.0 47.220
Ovary 9.4 3.0 22.87
Prostate 83.0 63.3 108.161
Testis 2.7 0.1 14.01
Urinary Bladder (includes in situ) 18.2 12.2 27.0 30.3 18.7 47.7 8.2 3.5 19.029 21 8
Kidney and Renal Pelvis 24.4 16.0 35.9 42.0 26.4 64.0 8.7 3.0 21.231 25 6
Brain and Nervous System 8.7 3.6 17.5 12.0 4.2 27.0 6.0 0.7 20.08 6 2
Hodgkin Lymphoma 3.8 0.7 11.0 1.8 0.0 11.5 5.9 0.7 20.03 1 2
Non-Hodgkin Lymphoma 15.2 9.1 24.2 19.9 9.9 36.5 10.2 4.6 21.821 12 9
Myeloma 1.3 0.2 6.0 2.7 0.3 12.42 2 0
Leukemia 13.4 7.6 22.3 12.2 5.3 25.4 16.3 7.0 32.718 8 10
All Other Sites 63.4 49.3 80.5 55.0 37.4 78.8 72.2 51.0 99.879 34 45
DATA SOURCE: Illinois Department of Public Health, Illinois State Cancer Registry, data as of November 2018
Breast in Situ (not in total) 22.5 13.2 37.4 18
III - 36

All Sites Combined and Selected Sites, All Races, 2012-2016Figures include invasive cancer with the exception of urinary bladder (includes in situ) and breast cancer in situ as a separate category. Incidence counts are five-year totals.
Rates are per 100,000 age-adjustd to the 2000 U.S. standard million population. Lower confidence intervals (LCI) and upper confidence intervals (UCI) are 95 percent for rates,
Tiwari method.
Site Rate LCI UCI
Both Sexes Males Females
Cancer Incidence Counts and Five-year Age-adjusted Rates by Sex
Rate LCI UCI Rate LCI UCICount Count Count
Hardin
All Sites 439.3 367.7 523.1 495.3 391.1 623.6 403.6 303.4 531.2150 85 65
Oral Cavity and Pharynx 8.2 1.5 31.4 16.9 3.1 62.53 3 0
Esophagus 2.4 0.1 23.1 4.5 0.1 44.21 1 0
Stomach 0 0 0
Colon and Rectum 33.7 17.3 63.7 49.6 20.9 106.9 22.1 6.0 71.012 8 4
Liver 2.1 0.1 22.5 4.3 0.1 47.31 0 1
Pancreas 4.9 0.6 26.2 4.5 0.1 44.2 5.4 0.1 49.22 1 1
Lung and Bronchus 114.6 80.6 161.1 121.1 74.6 193.0 115.9 66.4 194.340 22 18
Bones and Joints 6.9 0.2 34.4 12.5 0.3 64.11 1 0
Melanoma of the Skin 16.5 5.8 42.2 10.3 1.2 52.5 21.0 5.3 69.76 2 4
Breast (invasive) 34.5 16.9 66.4 68.8 33.2 134.312 0 12
Cervix 20.0 1.8 78.62
Corpus and Uterus, NOS 17.0 3.5 64.63
Ovary 0
Prostate 88.6 50.8 151.917
Testis 0
Urinary Bladder (includes in situ) 29.7 14.7 58.4 59.8 28.0 119.4 4.0 0.1 46.811 10 1
Kidney and Renal Pelvis 34.5 15.9 68.0 35.8 10.6 92.8 33.1 10.8 87.511 5 6
Brain and Nervous System 2.2 0.1 22.7 4.0 0.1 46.81 0 1
Hodgkin Lymphoma 0 0 0
Non-Hodgkin Lymphoma 15.2 5.5 39.6 25.6 8.1 72.6 4.3 0.1 47.36 5 1
Myeloma 2.4 0.1 23.1 5.4 0.1 49.21 0 1
Leukemia 29.5 10.8 65.2 36.4 10.5 94.4 26.4 3.2 91.37 5 2
All Other Sites 41.1 20.5 76.3 29.7 9.3 80.1 52.0 19.5 117.613 5 8
DATA SOURCE: Illinois Department of Public Health, Illinois State Cancer Registry, data as of November 2018
Breast in Situ (not in total) 11.8 1.4 58.1 2
III - 37

All Sites Combined and Selected Sites, All Races, 2012-2016Figures include invasive cancer with the exception of urinary bladder (includes in situ) and breast cancer in situ as a separate category. Incidence counts are five-year totals.
Rates are per 100,000 age-adjustd to the 2000 U.S. standard million population. Lower confidence intervals (LCI) and upper confidence intervals (UCI) are 95 percent for rates,
Tiwari method.
Site Rate LCI UCI
Both Sexes Males Females
Cancer Incidence Counts and Five-year Age-adjusted Rates by Sex
Rate LCI UCI Rate LCI UCICount Count Count
Henderson
All Sites 412.8 359.7 473.0 359.0 289.9 442.8 454.2 377.4 545.2240 103 137
Oral Cavity and Pharynx 10.8 4.3 26.0 18.7 6.7 48.6 2.0 0.1 26.27 6 1
Esophagus 3.2 0.4 16.2 6.5 0.8 33.12 2 0
Stomach 1.7 0.0 14.4 3.7 0.1 29.61 1 0
Colon and Rectum 40.2 25.6 62.6 25.1 9.9 58.2 55.5 31.9 95.024 7 17
Liver 7.6 2.5 21.8 12.2 3.3 40.1 2.8 0.1 27.55 4 1
Pancreas 7.7 2.5 22.0 8.8 1.8 35.5 6.0 0.7 31.75 3 2
Lung and Bronchus 68.1 48.6 95.0 79.1 50.9 122.5 55.7 31.3 96.242 25 17
Bones and Joints 4.0 0.1 20.3 7.9 0.2 40.51 1 0
Melanoma of the Skin 18.3 9.4 35.2 12.3 3.3 40.3 22.2 9.5 51.912 4 8
Breast (invasive) 73.6 51.3 103.7 142.2 99.3 200.540 0 40
Cervix 0
Corpus and Uterus, NOS 38.1 18.5 74.511
Ovary 18.5 6.8 47.86
Prostate 55.2 32.0 94.517
Testis 8.4 0.2 42.11
Urinary Bladder (includes in situ) 15.3 7.3 31.5 24.2 9.6 56.7 8.0 1.6 33.810 7 3
Kidney and Renal Pelvis 14.6 6.6 31.0 12.5 3.3 40.6 15.8 4.9 44.99 4 5
Brain and Nervous System 10.1 2.3 28.5 9.8 0.9 40.9 10.1 0.7 42.84 2 2
Hodgkin Lymphoma 5.5 0.5 22.0 7.9 0.2 40.5 3.1 0.1 28.02 1 1
Non-Hodgkin Lymphoma 15.1 6.8 31.8 19.3 7.0 49.5 10.7 2.1 38.89 6 3
Myeloma 0 0 0
Leukemia 16.0 7.6 32.7 20.4 7.4 51.5 10.1 2.7 36.210 6 4
All Other Sites 41.0 24.6 65.8 27.1 9.0 65.0 53.3 29.0 94.122 6 16
DATA SOURCE: Illinois Department of Public Health, Illinois State Cancer Registry, data as of November 2018
Breast in Situ (not in total) 17.3 6.3 46.0 6
III - 38
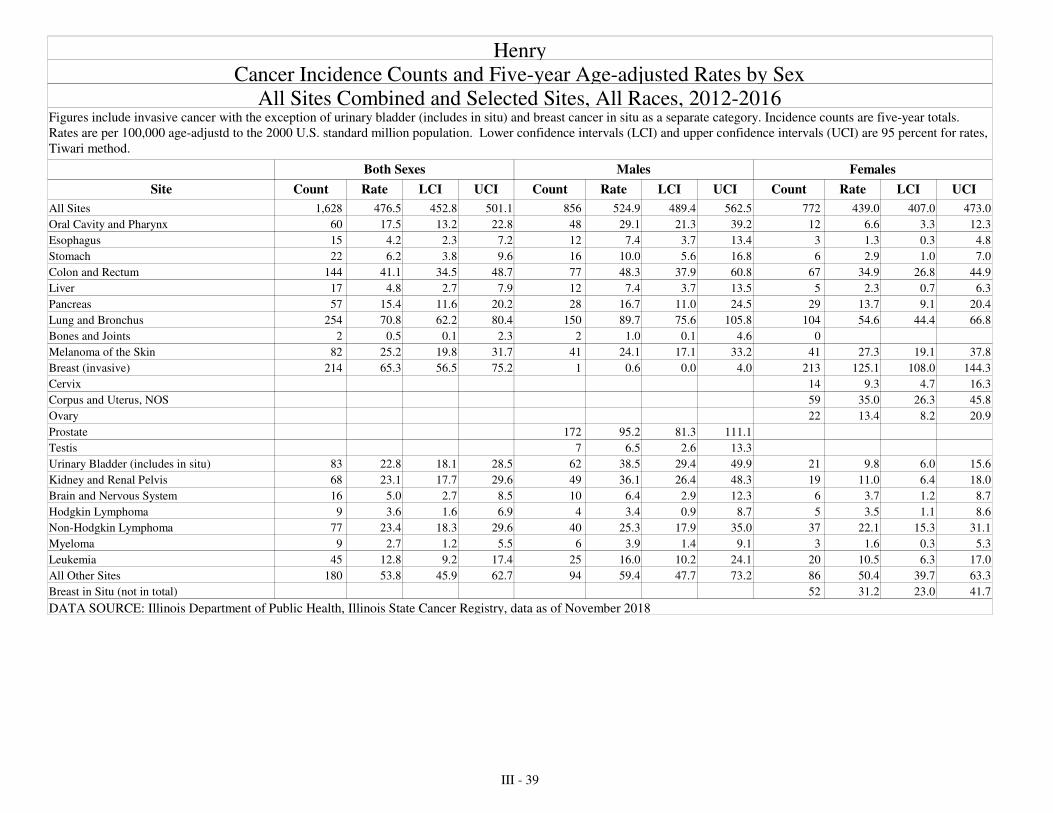
All Sites Combined and Selected Sites, All Races, 2012-2016Figures include invasive cancer with the exception of urinary bladder (includes in situ) and breast cancer in situ as a separate category. Incidence counts are five-year totals.
Rates are per 100,000 age-adjustd to the 2000 U.S. standard million population. Lower confidence intervals (LCI) and upper confidence intervals (UCI) are 95 percent for rates,
Tiwari method.
Site Rate LCI UCI
Both Sexes Males Females
Cancer Incidence Counts and Five-year Age-adjusted Rates by Sex
Rate LCI UCI Rate LCI UCICount Count Count
Henry
All Sites 476.5 452.8 501.1 524.9 489.4 562.5 439.0 407.0 473.01,628 856 772
Oral Cavity and Pharynx 17.5 13.2 22.8 29.1 21.3 39.2 6.6 3.3 12.360 48 12
Esophagus 4.2 2.3 7.2 7.4 3.7 13.4 1.3 0.3 4.815 12 3
Stomach 6.2 3.8 9.6 10.0 5.6 16.8 2.9 1.0 7.022 16 6
Colon and Rectum 41.1 34.5 48.7 48.3 37.9 60.8 34.9 26.8 44.9144 77 67
Liver 4.8 2.7 7.9 7.4 3.7 13.5 2.3 0.7 6.317 12 5
Pancreas 15.4 11.6 20.2 16.7 11.0 24.5 13.7 9.1 20.457 28 29
Lung and Bronchus 70.8 62.2 80.4 89.7 75.6 105.8 54.6 44.4 66.8254 150 104
Bones and Joints 0.5 0.1 2.3 1.0 0.1 4.62 2 0
Melanoma of the Skin 25.2 19.8 31.7 24.1 17.1 33.2 27.3 19.1 37.882 41 41
Breast (invasive) 65.3 56.5 75.2 0.6 0.0 4.0 125.1 108.0 144.3214 1 213
Cervix 9.3 4.7 16.314
Corpus and Uterus, NOS 35.0 26.3 45.859
Ovary 13.4 8.2 20.922
Prostate 95.2 81.3 111.1172
Testis 6.5 2.6 13.37
Urinary Bladder (includes in situ) 22.8 18.1 28.5 38.5 29.4 49.9 9.8 6.0 15.683 62 21
Kidney and Renal Pelvis 23.1 17.7 29.6 36.1 26.4 48.3 11.0 6.4 18.068 49 19
Brain and Nervous System 5.0 2.7 8.5 6.4 2.9 12.3 3.7 1.2 8.716 10 6
Hodgkin Lymphoma 3.6 1.6 6.9 3.4 0.9 8.7 3.5 1.1 8.69 4 5
Non-Hodgkin Lymphoma 23.4 18.3 29.6 25.3 17.9 35.0 22.1 15.3 31.177 40 37
Myeloma 2.7 1.2 5.5 3.9 1.4 9.1 1.6 0.3 5.39 6 3
Leukemia 12.8 9.2 17.4 16.0 10.2 24.1 10.5 6.3 17.045 25 20
All Other Sites 53.8 45.9 62.7 59.4 47.7 73.2 50.4 39.7 63.3180 94 86
DATA SOURCE: Illinois Department of Public Health, Illinois State Cancer Registry, data as of November 2018
Breast in Situ (not in total) 31.2 23.0 41.7 52
III - 39

All Sites Combined and Selected Sites, All Races, 2012-2016Figures include invasive cancer with the exception of urinary bladder (includes in situ) and breast cancer in situ as a separate category. Incidence counts are five-year totals.
Rates are per 100,000 age-adjustd to the 2000 U.S. standard million population. Lower confidence intervals (LCI) and upper confidence intervals (UCI) are 95 percent for rates,
Tiwari method.
Site Rate LCI UCI
Both Sexes Males Females
Cancer Incidence Counts and Five-year Age-adjusted Rates by Sex
Rate LCI UCI Rate LCI UCICount Count Count
Iroquois
All Sites 473.0 442.5 505.2 518.3 472.8 567.3 441.6 400.2 486.5976 503 473
Oral Cavity and Pharynx 15.5 10.2 22.8 18.0 10.1 30.1 13.1 6.6 23.730 17 13
Esophagus 6.5 3.5 11.3 12.0 6.1 21.8 2.3 0.3 9.014 12 2
Stomach 7.6 4.3 12.7 9.8 4.7 19.0 5.4 2.0 12.916 10 6
Colon and Rectum 51.6 41.9 63.1 46.6 33.8 63.1 54.7 41.0 72.1106 46 60
Liver 4.7 2.3 9.0 9.3 4.5 18.2 0.8 0.0 6.411 10 1
Pancreas 12.4 8.3 18.3 12.9 7.0 22.6 11.6 6.4 20.529 14 15
Lung and Bronchus 78.2 66.8 91.4 98.3 79.5 120.6 62.1 48.3 79.3171 98 73
Bones and Joints 1.7 0.3 5.4 1.6 0.0 8.7 1.6 0.2 7.63 1 2
Melanoma of the Skin 24.4 17.8 33.0 37.3 25.5 53.1 14.2 7.6 24.849 34 15
Breast (invasive) 59.5 48.9 71.9 3.7 1.0 10.7 109.4 89.3 133.0123 4 119
Cervix 4.1 0.7 12.53
Corpus and Uterus, NOS 34.7 24.2 48.837
Ovary 9.9 4.2 19.99
Prostate 84.7 67.8 105.288
Testis 3.9 0.5 13.12
Urinary Bladder (includes in situ) 20.9 15.2 28.4 38.4 26.8 53.8 8.1 3.7 16.546 36 10
Kidney and Renal Pelvis 20.7 14.6 28.7 29.4 19.3 43.4 13.6 6.7 24.741 28 13
Brain and Nervous System 5.5 2.6 10.5 8.8 3.6 18.4 2.6 0.5 9.111 8 3
Hodgkin Lymphoma 2.8 0.7 7.3 2.0 0.1 9.8 3.5 0.6 11.04 1 3
Non-Hodgkin Lymphoma 18.8 13.2 26.3 26.8 17.1 40.4 12.6 6.8 22.339 25 14
Myeloma 4.5 2.1 8.8 4.2 1.1 11.6 4.6 1.6 11.610 4 6
Leukemia 12.0 7.6 18.3 18.8 10.8 30.9 6.2 2.5 13.924 17 7
All Other Sites 59.1 47.9 72.3 51.8 37.7 69.9 66.5 49.6 87.5110 48 62
DATA SOURCE: Illinois Department of Public Health, Illinois State Cancer Registry, data as of November 2018
Breast in Situ (not in total) 21.9 13.9 33.5 24
III - 40

All Sites Combined and Selected Sites, All Races, 2012-2016Figures include invasive cancer with the exception of urinary bladder (includes in situ) and breast cancer in situ as a separate category. Incidence counts are five-year totals.
Rates are per 100,000 age-adjustd to the 2000 U.S. standard million population. Lower confidence intervals (LCI) and upper confidence intervals (UCI) are 95 percent for rates,
Tiwari method.
Site Rate LCI UCI
Both Sexes Males Females
Cancer Incidence Counts and Five-year Age-adjusted Rates by Sex
Rate LCI UCI Rate LCI UCICount Count Count
Jackson
All Sites 434.4 410.5 459.5 474.5 438.0 513.3 413.5 380.8 448.31,308 662 646
Oral Cavity and Pharynx 12.6 8.8 17.4 19.6 12.8 28.7 6.6 3.1 12.438 28 10
Esophagus 5.7 3.3 9.4 10.6 5.7 18.1 1.5 0.3 5.117 14 3
Stomach 3.0 1.3 5.9 4.5 1.5 10.0 1.7 0.3 5.59 6 3
Colon and Rectum 40.2 33.2 48.2 48.0 37.0 61.2 34.1 25.3 45.1124 69 55
Liver 6.7 4.0 10.5 10.1 5.6 17.0 3.6 1.1 8.720 15 5
Pancreas 8.4 5.5 12.4 7.5 3.5 14.0 9.6 5.4 15.927 10 17
Lung and Bronchus 70.8 61.5 81.2 84.1 69.0 101.4 61.8 50.0 75.5218 115 103
Bones and Joints 0.9 0.1 3.1 1.9 0.3 6.13 0 3
Melanoma of the Skin 21.5 16.5 27.7 26.3 18.3 36.7 18.9 12.4 27.766 37 29
Breast (invasive) 68.1 58.6 78.7 2.6 0.5 7.4 126.9 109.0 147.0198 3 195
Cervix 5.6 2.3 11.28
Corpus and Uterus, NOS 20.6 13.9 29.533
Ovary 8.2 4.2 14.612
Prostate 86.0 71.1 103.1124
Testis 6.6 2.7 13.28
Urinary Bladder (includes in situ) 19.0 14.6 24.6 35.8 26.5 47.2 5.3 2.5 10.363 53 10
Kidney and Renal Pelvis 20.3 15.4 26.2 27.4 19.3 37.8 14.2 8.7 22.061 39 22
Brain and Nervous System 6.7 4.0 10.6 6.8 3.1 13.1 6.7 3.1 12.720 10 10
Hodgkin Lymphoma 3.1 1.3 6.1 4.0 1.4 9.2 2.0 0.2 6.69 7 2
Non-Hodgkin Lymphoma 17.3 12.6 23.0 20.7 13.4 30.5 15.6 9.7 23.849 26 23
Myeloma 6.7 4.0 10.5 6.1 2.6 12.2 7.6 3.8 13.720 8 12
Leukemia 9.5 6.3 14.0 9.8 5.2 16.8 9.9 5.3 17.028 14 14
All Other Sites 53.6 45.2 63.2 58.0 45.4 73.0 51.2 39.9 64.8153 76 77
DATA SOURCE: Illinois Department of Public Health, Illinois State Cancer Registry, data as of November 2018
Breast in Situ (not in total) 30.4 21.5 41.7 41
III - 41

All Sites Combined and Selected Sites, All Races, 2012-2016Figures include invasive cancer with the exception of urinary bladder (includes in situ) and breast cancer in situ as a separate category. Incidence counts are five-year totals.
Rates are per 100,000 age-adjustd to the 2000 U.S. standard million population. Lower confidence intervals (LCI) and upper confidence intervals (UCI) are 95 percent for rates,
Tiwari method.
Site Rate LCI UCI
Both Sexes Males Females
Cancer Incidence Counts and Five-year Age-adjusted Rates by Sex
Rate LCI UCI Rate LCI UCICount Count Count
Jasper
All Sites 487.1 433.7 545.8 565.2 484.3 656.8 426.8 355.7 509.0325 184 141
Oral Cavity and Pharynx 16.6 8.0 31.3 25.7 10.8 53.1 10.4 1.8 33.411 8 3
Esophagus 0 0 0
Stomach 6.9 2.2 17.7 10.6 2.9 30.8 3.2 0.1 21.15 4 1
Colon and Rectum 61.5 43.6 84.8 68.3 41.5 107.1 56.4 34.1 90.141 21 20
Liver 1.1 0.0 9.5 1.7 0.0 18.11 0 1
Pancreas 9.6 3.8 21.5 6.3 0.7 25.7 11.9 3.7 32.57 2 5
Lung and Bronchus 73.7 54.3 98.6 79.6 51.6 118.8 68.4 42.8 105.551 27 24
Bones and Joints 0 0 0
Melanoma of the Skin 27.8 15.2 46.8 31.2 13.5 61.9 26.2 9.7 56.716 9 7
Breast (invasive) 59.9 41.8 83.6 117.6 82.0 164.739 0 39
Cervix 9.6 1.1 33.62
Corpus and Uterus, NOS 27.2 11.1 56.38
Ovary 9.8 1.8 31.83
Prostate 147.6 108.9 197.150
Testis 0
Urinary Bladder (includes in situ) 15.4 7.6 28.9 26.9 12.2 53.6 5.5 0.6 24.211 9 2
Kidney and Renal Pelvis 20.5 10.1 37.4 37.1 17.0 70.5 5.8 0.7 24.712 10 2
Brain and Nervous System 10.0 3.5 23.0 16.8 5.3 41.6 3.2 0.1 21.16 5 1
Hodgkin Lymphoma 0 0 0
Non-Hodgkin Lymphoma 12.5 5.7 25.3 13.9 4.4 35.9 11.6 3.1 33.19 5 4
Myeloma 4.8 1.3 14.6 10.9 2.9 31.54 4 0
Leukemia 13.6 6.5 26.5 26.9 12.2 53.6 2.6 0.1 19.910 9 1
All Other Sites 59.7 41.9 83.2 63.4 39.0 99.0 55.7 31.5 92.339 21 18
DATA SOURCE: Illinois Department of Public Health, Illinois State Cancer Registry, data as of November 2018
Breast in Situ (not in total) 22.6 9.6 47.5 8
III - 42

All Sites Combined and Selected Sites, All Races, 2012-2016Figures include invasive cancer with the exception of urinary bladder (includes in situ) and breast cancer in situ as a separate category. Incidence counts are five-year totals.
Rates are per 100,000 age-adjustd to the 2000 U.S. standard million population. Lower confidence intervals (LCI) and upper confidence intervals (UCI) are 95 percent for rates,
Tiwari method.
Site Rate LCI UCI
Both Sexes Males Females
Cancer Incidence Counts and Five-year Age-adjusted Rates by Sex
Rate LCI UCI Rate LCI UCICount Count Count
Jefferson
All Sites 519.8 491.3 549.7 569.6 526.6 615.2 498.1 458.0 540.91,309 680 629
Oral Cavity and Pharynx 14.1 9.8 19.8 20.9 13.5 31.2 6.4 3.0 12.736 26 10
Esophagus 6.1 3.5 10.2 9.6 4.9 17.3 2.6 0.6 7.816 12 4
Stomach 7.0 4.1 11.3 10.1 5.2 18.1 4.5 1.6 10.518 12 6
Colon and Rectum 53.8 45.0 64.0 55.8 43.0 71.4 52.5 40.3 67.5136 67 69
Liver 10.1 6.3 15.3 13.4 7.3 22.5 6.1 2.7 12.524 15 9
Pancreas 14.3 10.0 19.9 16.7 10.0 26.4 13.1 7.5 21.637 19 18
Lung and Bronchus 75.4 65.0 87.1 85.5 69.5 104.3 68.9 55.2 85.3195 103 92
Bones and Joints 1.0 0.1 3.6 2.0 0.2 7.62 0 2
Melanoma of the Skin 29.7 22.9 37.9 32.8 23.1 45.4 29.6 19.5 43.070 39 31
Breast (invasive) 72.8 62.2 84.7 1.6 0.2 6.5 142.0 121.1 165.8181 2 179
Cervix 12.0 6.3 20.914
Corpus and Uterus, NOS 34.8 24.6 48.042
Ovary 10.7 5.3 19.412
Prostate 137.8 117.8 160.5175
Testis 3.2 0.7 9.33
Urinary Bladder (includes in situ) 23.3 17.8 30.1 44.1 32.5 58.5 8.2 4.2 15.162 50 12
Kidney and Renal Pelvis 20.4 14.7 27.5 24.0 15.6 35.3 16.3 9.5 26.246 27 19
Brain and Nervous System 6.9 3.9 11.3 8.7 4.1 16.4 6.4 2.5 13.617 10 7
Hodgkin Lymphoma 2.1 0.6 5.5 1.9 0.2 7.2 2.5 0.3 8.64 2 2
Non-Hodgkin Lymphoma 17.0 12.2 23.1 22.2 14.4 33.1 12.6 7.3 20.843 26 17
Myeloma 7.2 4.3 11.6 6.7 3.1 13.4 7.4 3.4 14.419 9 10
Leukemia 14.7 10.1 20.9 20.2 12.4 31.0 10.8 5.3 19.634 21 13
All Other Sites 49.7 41.1 59.8 54.3 41.3 70.1 48.8 36.7 63.8123 62 61
DATA SOURCE: Illinois Department of Public Health, Illinois State Cancer Registry, data as of November 2018
Breast in Situ (not in total) 32.9 22.3 46.8 34
III - 43

All Sites Combined and Selected Sites, All Races, 2012-2016Figures include invasive cancer with the exception of urinary bladder (includes in situ) and breast cancer in situ as a separate category. Incidence counts are five-year totals.
Rates are per 100,000 age-adjustd to the 2000 U.S. standard million population. Lower confidence intervals (LCI) and upper confidence intervals (UCI) are 95 percent for rates,
Tiwari method.
Site Rate LCI UCI
Both Sexes Males Females
Cancer Incidence Counts and Five-year Age-adjusted Rates by Sex
Rate LCI UCI Rate LCI UCICount Count Count
Jersey
All Sites 450.2 415.7 487.0 493.2 440.9 550.3 421.7 375.5 472.4667 340 327
Oral Cavity and Pharynx 15.6 9.9 23.8 26.9 15.9 43.2 5.2 1.7 13.924 19 5
Esophagus 6.8 3.4 12.7 12.0 5.4 23.9 1.9 0.2 9.411 9 2
Stomach 2.6 0.7 7.2 2.8 0.3 11.6 2.7 0.3 10.94 2 2
Colon and Rectum 31.0 22.3 42.3 35.2 22.3 53.4 27.5 16.3 43.844 24 20
Liver 3.0 1.0 7.7 6.1 2.0 15.95 5 0
Pancreas 8.1 4.1 14.8 4.0 0.8 13.2 12.0 5.4 24.012 3 9
Lung and Bronchus 68.5 56.1 83.3 84.5 64.1 109.9 56.2 41.2 75.5107 59 48
Bones and Joints 0.6 0.0 4.3 1.1 0.0 8.81 1 0
Melanoma of the Skin 24.3 16.4 34.8 21.8 11.5 38.0 26.5 15.6 42.733 14 19
Breast (invasive) 68.2 55.0 84.0 130.7 105.2 161.098 0 98
Cervix 3.5 0.7 11.93
Corpus and Uterus, NOS 30.7 18.5 48.222
Ovary 11.6 5.5 22.710
Prostate 116.4 92.7 144.986
Testis 4.5 0.5 15.42
Urinary Bladder (includes in situ) 17.4 11.3 26.1 28.8 17.1 46.0 8.2 3.3 18.326 19 7
Kidney and Renal Pelvis 18.4 12.2 27.1 23.7 13.7 39.0 14.6 7.1 27.228 17 11
Brain and Nervous System 13.0 7.0 21.9 17.5 8.1 32.9 8.3 2.4 20.515 10 5
Hodgkin Lymphoma 3.4 0.9 8.9 7.0 1.9 18.34 4 0
Non-Hodgkin Lymphoma 14.4 8.8 22.5 15.0 6.8 29.1 14.9 7.6 27.221 9 12
Myeloma 5.0 2.1 10.6 8.0 2.8 18.8 2.3 0.3 10.18 6 2
Leukemia 18.2 11.9 26.9 24.1 13.6 40.1 13.6 7.0 25.128 16 12
All Other Sites 51.0 39.9 64.5 53.8 37.2 75.7 51.2 36.1 71.275 35 40
DATA SOURCE: Illinois Department of Public Health, Illinois State Cancer Registry, data as of November 2018
Breast in Situ (not in total) 24.3 14.1 39.6 18
III - 44

All Sites Combined and Selected Sites, All Races, 2012-2016Figures include invasive cancer with the exception of urinary bladder (includes in situ) and breast cancer in situ as a separate category. Incidence counts are five-year totals.
Rates are per 100,000 age-adjustd to the 2000 U.S. standard million population. Lower confidence intervals (LCI) and upper confidence intervals (UCI) are 95 percent for rates,
Tiwari method.
Site Rate LCI UCI
Both Sexes Males Females
Cancer Incidence Counts and Five-year Age-adjusted Rates by Sex
Rate LCI UCI Rate LCI UCICount Count Count
Jo Daviess
All Sites 458.3 425.4 493.4 522.6 474.2 575.3 405.4 360.4 455.2841 475 366
Oral Cavity and Pharynx 14.4 9.0 22.5 19.5 11.1 33.1 9.3 3.5 21.226 18 8
Esophagus 7.8 4.4 13.6 15.8 8.8 27.7 1.0 0.0 9.116 15 1
Stomach 6.1 2.6 12.5 7.6 2.1 19.6 4.8 1.6 14.010 5 5
Colon and Rectum 36.8 28.3 47.6 48.6 34.6 67.4 27.1 17.4 41.670 43 27
Liver 5.4 2.5 10.9 7.5 2.9 17.6 3.1 0.6 11.810 7 3
Pancreas 9.5 5.8 15.7 10.6 5.0 21.5 8.9 4.2 18.820 10 10
Lung and Bronchus 63.4 52.7 76.2 84.3 66.7 106.4 46.5 33.8 63.7127 80 47
Bones and Joints 1.3 0.0 6.6 2.7 0.1 13.41 0 1
Melanoma of the Skin 27.7 19.2 39.0 27.8 17.1 43.7 28.6 15.8 47.743 24 19
Breast (invasive) 67.2 54.3 82.7 131.7 106.0 162.4114 0 114
Cervix 3.7 0.3 14.62
Corpus and Uterus, NOS 28.0 17.3 43.827
Ovary 8.7 3.5 19.78
Prostate 109.4 89.3 133.7109
Testis 7.2 1.5 20.33
Urinary Bladder (includes in situ) 17.6 12.0 25.6 29.3 19.4 44.0 8.4 2.9 20.135 28 7
Kidney and Renal Pelvis 19.9 13.5 28.9 27.8 16.9 44.0 11.5 5.8 22.436 24 12
Brain and Nervous System 4.6 2.1 9.8 6.8 2.4 16.8 2.5 0.5 10.89 6 3
Hodgkin Lymphoma 6.4 2.1 14.5 9.5 2.6 23.6 2.7 0.1 13.45 4 1
Non-Hodgkin Lymphoma 16.3 10.8 24.1 25.1 15.3 40.0 7.8 3.6 17.531 22 9
Myeloma 3.5 1.5 8.1 5.6 2.0 14.6 1.5 0.2 9.58 6 2
Leukemia 15.7 9.9 24.3 21.0 11.6 35.7 11.7 5.0 24.427 17 10
All Other Sites 56.8 45.6 70.4 59.0 43.6 79.1 55.2 39.2 76.3104 54 50
DATA SOURCE: Illinois Department of Public Health, Illinois State Cancer Registry, data as of November 2018
Breast in Situ (not in total) 30.1 19.0 46.3 26
III - 45

All Sites Combined and Selected Sites, All Races, 2012-2016Figures include invasive cancer with the exception of urinary bladder (includes in situ) and breast cancer in situ as a separate category. Incidence counts are five-year totals.
Rates are per 100,000 age-adjustd to the 2000 U.S. standard million population. Lower confidence intervals (LCI) and upper confidence intervals (UCI) are 95 percent for rates,
Tiwari method.
Site Rate LCI UCI
Both Sexes Males Females
Cancer Incidence Counts and Five-year Age-adjusted Rates by Sex
Rate LCI UCI Rate LCI UCICount Count Count
Johnson
All Sites 459.7 415.1 508.4 554.1 485.3 630.6 377.5 318.5 445.7411 247 164
Oral Cavity and Pharynx 11.1 5.2 21.7 13.9 4.8 32.3 11.1 2.7 31.710 6 4
Esophagus 2.9 0.6 10.2 5.8 1.2 19.83 3 0
Stomach 4.6 1.2 12.9 10.6 2.7 28.34 4 0
Colon and Rectum 54.0 39.4 72.9 79.1 53.8 112.7 29.0 15.7 52.147 33 14
Liver 4.9 1.6 13.0 8.0 2.2 22.9 1.7 0.0 16.55 4 1
Pancreas 11.8 5.1 23.4 17.0 6.1 37.7 6.0 1.2 22.59 6 3
Lung and Bronchus 93.5 74.8 116.1 129.3 98.0 168.4 60.2 39.9 89.889 60 29
Bones and Joints 0 0 0
Melanoma of the Skin 15.2 7.7 27.4 11.9 3.8 29.4 22.7 8.3 49.712 5 7
Breast (invasive) 57.0 42.1 75.9 119.1 87.3 160.452 0 52
Cervix 7.8 0.7 29.32
Corpus and Uterus, NOS 25.0 12.6 47.612
Ovary 7.6 2.1 24.44
Prostate 86.3 62.1 118.143
Testis 2.7 0.1 16.21
Urinary Bladder (includes in situ) 21.7 13.3 34.4 37.4 21.8 61.1 7.5 1.4 26.021 18 3
Kidney and Renal Pelvis 23.2 13.8 37.3 32.9 17.8 56.8 11.3 3.6 30.019 14 5
Brain and Nervous System 5.2 1.3 14.3 2.3 0.1 15.2 9.3 1.5 30.34 1 3
Hodgkin Lymphoma 1.5 0.0 8.8 4.7 0.1 24.01 0 1
Non-Hodgkin Lymphoma 29.8 18.3 45.9 41.7 23.2 69.5 13.9 5.6 32.723 16 7
Myeloma 7.1 2.4 16.8 13.3 4.7 30.96 6 0
Leukemia 16.3 8.8 28.3 17.6 7.5 36.5 12.4 4.5 31.014 8 6
All Other Sites 34.9 23.2 51.0 44.3 26.2 70.9 28.3 13.3 54.230 19 11
DATA SOURCE: Illinois Department of Public Health, Illinois State Cancer Registry, data as of November 2018
Breast in Situ (not in total) 15.4 6.0 35.4 7
III - 46

All Sites Combined and Selected Sites, All Races, 2012-2016Figures include invasive cancer with the exception of urinary bladder (includes in situ) and breast cancer in situ as a separate category. Incidence counts are five-year totals.
Rates are per 100,000 age-adjustd to the 2000 U.S. standard million population. Lower confidence intervals (LCI) and upper confidence intervals (UCI) are 95 percent for rates,
Tiwari method.
Site Rate LCI UCI
Both Sexes Males Females
Cancer Incidence Counts and Five-year Age-adjusted Rates by Sex
Rate LCI UCI Rate LCI UCICount Count Count
Kane
All Sites 438.5 430.4 446.8 475.8 463.0 488.8 415.7 404.9 426.711,581 5,759 5,822
Oral Cavity and Pharynx 10.4 9.2 11.7 16.1 14.0 18.5 5.1 4.0 6.5292 219 73
Esophagus 3.6 2.9 4.4 6.3 4.9 7.9 1.1 0.6 1.895 78 17
Stomach 6.9 5.9 8.0 9.3 7.6 11.3 5.0 3.8 6.3179 110 69
Colon and Rectum 37.1 34.8 39.6 44.9 41.0 49.0 30.7 27.8 33.8962 531 431
Liver 5.7 4.8 6.7 9.1 7.5 11.0 2.8 2.0 3.9158 118 40
Pancreas 12.8 11.4 14.3 15.9 13.5 18.5 10.4 8.7 12.3318 177 141
Lung and Bronchus 51.2 48.4 54.1 59.7 55.0 64.6 45.1 41.6 48.91,298 669 629
Bones and Joints 1.0 0.7 1.5 1.1 0.6 1.9 0.9 0.5 1.627 15 12
Melanoma of the Skin 21.7 19.9 23.6 26.0 23.1 29.2 18.8 16.5 21.2569 308 261
Breast (invasive) 65.8 62.7 69.0 1.5 0.8 2.4 123.8 118.0 129.91,770 18 1,752
Cervix 6.8 5.5 8.491
Corpus and Uterus, NOS 27.2 24.6 30.1403
Ovary 10.7 9.0 12.6151
Prostate 104.8 99.1 110.71,390
Testis 6.8 5.4 8.484
Urinary Bladder (includes in situ) 23.9 22.0 26.0 41.5 37.6 45.6 10.3 8.6 12.1597 454 143
Kidney and Renal Pelvis 16.5 14.9 18.1 22.1 19.5 25.0 11.5 9.7 13.4443 280 163
Brain and Nervous System 7.2 6.2 8.3 8.1 6.6 9.9 6.3 5.0 7.8189 101 88
Hodgkin Lymphoma 2.4 1.8 3.1 2.6 1.8 3.7 2.1 1.4 3.161 34 27
Non-Hodgkin Lymphoma 18.7 17.0 20.4 22.1 19.4 25.1 15.9 13.9 18.2480 259 221
Myeloma 6.1 5.2 7.1 8.1 6.5 10.0 4.5 3.4 5.7163 99 64
Leukemia 13.7 12.2 15.2 16.9 14.6 19.6 11.2 9.5 13.2352 197 155
All Other Sites 58.5 55.5 61.5 52.8 48.6 57.3 65.5 61.2 70.11,509 618 891
DATA SOURCE: Illinois Department of Public Health, Illinois State Cancer Registry, data as of November 2018
Breast in Situ (not in total) 30.9 28.1 34.0 442
III - 47

All Sites Combined and Selected Sites, All Races, 2012-2016Figures include invasive cancer with the exception of urinary bladder (includes in situ) and breast cancer in situ as a separate category. Incidence counts are five-year totals.
Rates are per 100,000 age-adjustd to the 2000 U.S. standard million population. Lower confidence intervals (LCI) and upper confidence intervals (UCI) are 95 percent for rates,
Tiwari method.
Site Rate LCI UCI
Both Sexes Males Females
Cancer Incidence Counts and Five-year Age-adjusted Rates by Sex
Rate LCI UCI Rate LCI UCICount Count Count
Kankakee
All Sites 494.2 476.9 511.9 535.5 509.4 562.6 462.7 439.6 486.83,232 1,651 1,581
Oral Cavity and Pharynx 12.2 9.6 15.4 18.3 13.7 23.9 6.5 4.1 10.080 57 23
Esophagus 5.2 3.7 7.3 9.3 6.2 13.4 1.8 0.7 4.037 30 7
Stomach 5.9 4.1 8.1 8.2 5.3 12.2 3.8 2.0 6.639 26 13
Colon and Rectum 46.6 41.5 52.2 53.5 45.5 62.6 39.9 33.6 47.3313 167 146
Liver 6.1 4.4 8.3 10.0 6.9 14.2 2.5 1.1 4.843 34 9
Pancreas 14.9 12.1 18.2 16.8 12.4 22.3 13.6 9.9 18.1100 51 49
Lung and Bronchus 77.4 70.7 84.5 87.0 76.6 98.4 69.5 61.0 79.0516 267 249
Bones and Joints 0.6 0.1 1.7 0.4 0.0 2.0 0.8 0.1 2.73 1 2
Melanoma of the Skin 20.0 16.6 23.9 24.6 19.2 31.1 16.3 12.1 21.6126 74 52
Breast (invasive) 71.2 64.6 78.3 0.9 0.2 2.9 133.5 121.0 147.0444 3 441
Cervix 7.8 4.7 11.921
Corpus and Uterus, NOS 29.9 24.3 36.4106
Ovary 8.6 5.7 12.529
Prostate 102.8 91.9 114.7336
Testis 7.6 4.5 11.918
Urinary Bladder (includes in situ) 25.0 21.4 29.2 43.0 35.8 51.2 10.5 7.5 14.4170 130 40
Kidney and Renal Pelvis 22.4 18.9 26.5 28.7 22.8 35.6 17.1 13.0 22.1148 87 61
Brain and Nervous System 7.5 5.5 10.1 7.7 4.7 11.8 7.6 4.8 11.545 21 24
Hodgkin Lymphoma 3.8 2.4 5.8 4.6 2.4 8.0 3.0 1.3 5.722 13 9
Non-Hodgkin Lymphoma 18.9 15.6 22.6 25.7 20.2 32.3 13.2 9.6 17.8124 78 46
Myeloma 5.7 4.0 8.0 5.8 3.4 9.3 5.6 3.4 8.937 18 19
Leukemia 14.8 11.9 18.2 19.3 14.5 25.2 11.1 7.8 15.494 56 38
All Other Sites 59.8 53.8 66.3 61.3 52.6 71.1 60.2 51.8 69.6381 184 197
DATA SOURCE: Illinois Department of Public Health, Illinois State Cancer Registry, data as of November 2018
Breast in Situ (not in total) 18.1 13.8 23.5 60
III - 48

All Sites Combined and Selected Sites, All Races, 2012-2016Figures include invasive cancer with the exception of urinary bladder (includes in situ) and breast cancer in situ as a separate category. Incidence counts are five-year totals.
Rates are per 100,000 age-adjustd to the 2000 U.S. standard million population. Lower confidence intervals (LCI) and upper confidence intervals (UCI) are 95 percent for rates,
Tiwari method.
Site Rate LCI UCI
Both Sexes Males Females
Cancer Incidence Counts and Five-year Age-adjusted Rates by Sex
Rate LCI UCI Rate LCI UCICount Count Count
Kendall
All Sites 507.0 486.7 527.9 558.5 525.8 592.6 473.2 447.2 500.32,562 1,257 1,305
Oral Cavity and Pharynx 13.2 10.2 16.7 19.5 14.4 25.8 7.2 4.4 11.373 53 20
Esophagus 4.7 2.9 7.1 8.5 4.8 13.7 1.6 0.5 3.723 18 5
Stomach 7.3 5.1 10.1 11.6 7.4 17.2 3.8 1.9 6.938 27 11
Colon and Rectum 43.8 37.9 50.4 51.5 42.3 62.1 35.9 28.7 44.4214 124 90
Liver 4.9 3.1 7.3 8.1 4.6 13.1 2.2 0.8 4.924 18 6
Pancreas 13.8 10.4 17.8 13.7 8.8 20.1 13.8 9.5 19.363 28 35
Lung and Bronchus 60.8 53.5 68.7 73.0 60.9 86.7 51.7 42.9 61.7273 145 128
Bones and Joints 0.6 0.2 1.7 0.7 0.1 2.6 0.7 0.1 2.54 2 2
Melanoma of the Skin 19.2 15.6 23.3 19.6 14.2 26.5 19.4 14.6 25.3105 48 57
Breast (invasive) 73.2 66.0 81.0 1.2 0.2 3.5 137.8 124.4 152.4403 3 400
Cervix 3.2 1.5 6.010
Corpus and Uterus, NOS 30.5 24.3 37.788
Ovary 10.7 6.9 15.826
Prostate 130.1 114.9 146.7301
Testis 9.8 6.5 14.328
Urinary Bladder (includes in situ) 27.8 22.7 33.5 48.2 37.8 60.2 13.1 8.8 18.7115 84 31
Kidney and Renal Pelvis 17.8 14.3 21.8 22.6 17.0 29.3 13.3 9.3 18.596 59 37
Brain and Nervous System 6.4 4.4 8.9 9.1 5.5 14.1 4.2 2.2 7.336 23 13
Hodgkin Lymphoma 3.5 2.0 5.5 4.7 2.4 8.3 2.2 0.8 4.919 13 6
Non-Hodgkin Lymphoma 22.9 18.7 27.7 24.1 18.0 31.6 21.0 15.6 27.5113 59 54
Myeloma 7.0 4.7 10.0 10.3 6.0 16.3 4.7 2.4 8.133 20 13
Leukemia 15.7 12.3 19.8 23.5 17.2 31.1 9.2 5.8 13.779 55 24
All Other Sites 76.7 69.0 84.9 68.7 57.3 81.6 86.9 76.2 98.7398 149 249
DATA SOURCE: Illinois Department of Public Health, Illinois State Cancer Registry, data as of November 2018
Breast in Situ (not in total) 45.3 37.6 54.0 129
III - 49

All Sites Combined and Selected Sites, All Races, 2012-2016Figures include invasive cancer with the exception of urinary bladder (includes in situ) and breast cancer in situ as a separate category. Incidence counts are five-year totals.
Rates are per 100,000 age-adjustd to the 2000 U.S. standard million population. Lower confidence intervals (LCI) and upper confidence intervals (UCI) are 95 percent for rates,
Tiwari method.
Site Rate LCI UCI
Both Sexes Males Females
Cancer Incidence Counts and Five-year Age-adjusted Rates by Sex
Rate LCI UCI Rate LCI UCICount Count Count
Knox
All Sites 463.1 440.2 487.0 501.4 467.6 537.1 441.2 409.1 475.41,671 859 812
Oral Cavity and Pharynx 12.6 9.2 17.0 16.1 10.7 23.6 9.9 5.8 16.148 29 19
Esophagus 5.8 3.7 8.9 12.6 7.9 19.4 0.4 0.0 3.624 23 1
Stomach 4.7 2.8 7.7 6.8 3.5 12.3 3.2 1.2 7.618 12 6
Colon and Rectum 48.0 40.9 56.0 57.5 46.6 70.5 39.3 30.4 50.3176 100 76
Liver 4.3 2.5 7.1 7.5 4.0 13.0 1.5 0.3 5.217 14 3
Pancreas 11.4 8.3 15.5 11.9 7.4 18.5 11.3 7.0 17.645 22 23
Lung and Bronchus 71.0 62.5 80.3 85.0 71.6 100.5 59.1 48.8 71.4267 146 121
Bones and Joints 1.1 0.1 3.5 2.2 0.3 7.32 0 2
Melanoma of the Skin 22.1 17.1 28.2 26.7 19.2 36.4 18.7 12.2 27.675 45 30
Breast (invasive) 69.0 60.1 79.0 1.4 0.3 4.9 132.1 114.4 151.9240 3 237
Cervix 7.2 2.9 14.48
Corpus and Uterus, NOS 31.6 23.9 41.362
Ovary 9.2 5.1 15.716
Prostate 84.0 71.0 99.0153
Testis 6.5 2.8 12.88
Urinary Bladder (includes in situ) 22.3 17.9 27.7 39.9 31.0 50.9 9.4 5.7 15.189 69 20
Kidney and Renal Pelvis 21.9 17.1 27.8 29.5 21.6 39.5 15.4 9.8 23.376 49 27
Brain and Nervous System 8.1 5.2 12.3 10.7 6.0 17.8 5.8 2.6 11.326 16 10
Hodgkin Lymphoma 2.3 0.8 5.2 2.1 0.4 6.3 2.7 0.4 8.16 3 3
Non-Hodgkin Lymphoma 22.9 17.8 29.0 24.6 17.3 34.2 21.4 14.6 30.577 39 38
Myeloma 7.5 5.0 11.2 10.7 6.2 17.5 4.8 2.3 9.429 18 11
Leukemia 12.4 8.7 17.3 20.3 13.5 29.3 5.7 2.5 11.540 30 10
All Other Sites 48.2 40.9 56.6 47.5 37.4 59.6 50.3 39.5 63.4169 80 89
DATA SOURCE: Illinois Department of Public Health, Illinois State Cancer Registry, data as of November 2018
Breast in Situ (not in total) 33.5 24.7 44.5 55
III - 50

All Sites Combined and Selected Sites, All Races, 2012-2016Figures include invasive cancer with the exception of urinary bladder (includes in situ) and breast cancer in situ as a separate category. Incidence counts are five-year totals.
Rates are per 100,000 age-adjustd to the 2000 U.S. standard million population. Lower confidence intervals (LCI) and upper confidence intervals (UCI) are 95 percent for rates,
Tiwari method.
Site Rate LCI UCI
Both Sexes Males Females
Cancer Incidence Counts and Five-year Age-adjusted Rates by Sex
Rate LCI UCI Rate LCI UCICount Count Count
Lake
All Sites 450.9 443.9 457.9 469.8 459.2 480.6 441.5 432.1 451.116,875 8,133 8,742
Oral Cavity and Pharynx 11.0 9.9 12.1 14.7 13.0 16.6 7.6 6.4 8.9436 281 155
Esophagus 4.6 4.0 5.4 7.6 6.3 9.1 2.0 1.4 2.8178 138 40
Stomach 6.8 6.0 7.7 9.2 7.7 10.8 4.8 3.9 6.0250 156 94
Colon and Rectum 37.6 35.6 39.7 43.3 40.1 46.6 32.9 30.4 35.61,398 743 655
Liver 4.6 4.0 5.4 7.3 6.1 8.7 2.3 1.7 3.1180 133 47
Pancreas 14.4 13.2 15.7 16.5 14.5 18.7 12.5 10.9 14.2524 277 247
Lung and Bronchus 56.5 54.0 59.1 60.0 56.1 64.0 54.2 50.9 57.72,031 974 1,057
Bones and Joints 0.9 0.6 1.2 1.1 0.7 1.8 0.6 0.3 1.132 21 11
Melanoma of the Skin 22.9 21.3 24.5 27.0 24.5 29.7 20.1 18.1 22.3853 466 387
Breast (invasive) 75.4 72.5 78.2 1.9 1.2 2.7 141.3 136.0 146.72,874 32 2,842
Cervix 5.1 4.1 6.397
Corpus and Uterus, NOS 29.8 27.4 32.3623
Ovary 10.5 9.1 12.1210
Prostate 97.2 92.7 102.01,856
Testis 5.4 4.3 6.691
Urinary Bladder (includes in situ) 23.8 22.1 25.5 41.5 38.3 45.0 9.7 8.4 11.3847 655 192
Kidney and Renal Pelvis 16.3 15.0 17.7 24.7 22.4 27.3 9.1 7.8 10.6625 442 183
Brain and Nervous System 6.3 5.5 7.2 7.2 6.0 8.7 5.7 4.7 6.9231 124 107
Hodgkin Lymphoma 2.0 1.5 2.5 2.3 1.6 3.1 1.7 1.2 2.568 40 28
Non-Hodgkin Lymphoma 21.7 20.2 23.3 27.8 25.2 30.6 16.9 15.1 18.9792 458 334
Myeloma 5.7 4.9 6.5 6.5 5.3 7.9 5.0 4.1 6.2211 109 102
Leukemia 14.5 13.3 15.9 17.8 15.7 20.0 11.8 10.3 13.5523 296 227
All Other Sites 53.7 51.3 56.2 50.9 47.4 54.6 57.6 54.2 61.21,945 841 1,104
DATA SOURCE: Illinois Department of Public Health, Illinois State Cancer Registry, data as of November 2018
Breast in Situ (not in total) 38.7 36.0 41.6 787
III - 51

All Sites Combined and Selected Sites, All Races, 2012-2016Figures include invasive cancer with the exception of urinary bladder (includes in situ) and breast cancer in situ as a separate category. Incidence counts are five-year totals.
Rates are per 100,000 age-adjustd to the 2000 U.S. standard million population. Lower confidence intervals (LCI) and upper confidence intervals (UCI) are 95 percent for rates,
Tiwari method.
Site Rate LCI UCI
Both Sexes Males Females
Cancer Incidence Counts and Five-year Age-adjusted Rates by Sex
Rate LCI UCI Rate LCI UCICount Count Count
LaSalle
All Sites 516.9 500.1 534.2 587.8 562.0 614.6 464.1 441.6 487.53,796 2,034 1,762
Oral Cavity and Pharynx 14.6 11.9 17.8 23.9 19.0 29.7 6.3 3.8 9.8109 86 23
Esophagus 4.4 3.0 6.3 8.6 5.8 12.5 0.5 0.1 2.232 30 2
Stomach 4.9 3.4 6.9 7.5 4.8 11.1 2.8 1.3 5.336 26 10
Colon and Rectum 46.2 41.3 51.5 54.2 46.5 62.8 38.7 32.8 45.5350 186 164
Liver 6.6 4.9 8.7 10.0 7.0 13.9 3.4 1.8 5.951 37 14
Pancreas 13.5 10.9 16.5 14.7 10.8 19.5 12.3 9.0 16.5100 50 50
Lung and Bronchus 80.5 74.2 87.3 89.3 79.5 100.1 74.1 65.9 83.3616 313 303
Bones and Joints 0.7 0.1 1.8 0.8 0.1 2.7 0.5 0.0 2.63 2 1
Melanoma of the Skin 25.9 22.1 30.3 31.7 25.7 38.7 21.5 16.6 27.5176 103 73
Breast (invasive) 62.6 56.7 69.0 1.1 0.2 3.3 119.7 108.2 132.1445 3 442
Cervix 9.2 6.0 13.629
Corpus and Uterus, NOS 25.9 20.8 32.097
Ovary 11.9 8.6 16.345
Prostate 134.1 122.2 146.9487
Testis 8.0 4.9 12.321
Urinary Bladder (includes in situ) 32.3 28.3 36.8 56.9 49.0 65.7 12.0 8.9 16.1245 194 51
Kidney and Renal Pelvis 21.0 17.6 24.9 26.2 20.8 32.5 16.0 12.0 21.0147 87 60
Brain and Nervous System 8.1 6.0 10.7 8.7 5.7 12.8 7.5 4.7 11.353 28 25
Hodgkin Lymphoma 2.3 1.1 4.0 2.5 1.0 5.2 2.1 0.7 4.812 7 5
Non-Hodgkin Lymphoma 19.2 16.1 22.7 24.1 19.1 30.1 14.9 11.2 19.6144 83 61
Myeloma 6.5 4.8 8.7 8.0 5.3 11.8 5.1 3.2 8.050 28 22
Leukemia 12.7 10.1 15.7 13.9 10.1 18.6 12.4 8.8 17.091 48 43
All Other Sites 64.6 58.6 71.1 63.7 55.3 73.1 67.1 58.4 76.8457 215 242
DATA SOURCE: Illinois Department of Public Health, Illinois State Cancer Registry, data as of November 2018
Breast in Situ (not in total) 24.6 19.4 30.7 86
III - 52

All Sites Combined and Selected Sites, All Races, 2012-2016Figures include invasive cancer with the exception of urinary bladder (includes in situ) and breast cancer in situ as a separate category. Incidence counts are five-year totals.
Rates are per 100,000 age-adjustd to the 2000 U.S. standard million population. Lower confidence intervals (LCI) and upper confidence intervals (UCI) are 95 percent for rates,
Tiwari method.
Site Rate LCI UCI
Both Sexes Males Females
Cancer Incidence Counts and Five-year Age-adjusted Rates by Sex
Rate LCI UCI Rate LCI UCICount Count Count
Lawrence
All Sites 460.0 419.3 503.9 531.3 468.2 600.8 431.2 372.8 496.8483 261 222
Oral Cavity and Pharynx 9.0 4.1 17.6 12.8 4.6 28.4 5.3 1.1 18.19 6 3
Esophagus 9.2 4.4 17.6 15.6 6.7 31.6 5.1 0.5 19.610 8 2
Stomach 4.1 1.1 11.0 3.9 0.5 15.3 3.4 0.4 15.44 2 2
Colon and Rectum 40.0 28.8 54.4 50.9 32.8 75.8 31.0 18.1 51.143 25 18
Liver 8.9 3.9 17.5 13.7 5.5 29.1 5.0 0.5 19.39 7 2
Pancreas 12.3 6.5 21.7 12.9 4.7 28.5 10.7 4.3 25.013 6 7
Lung and Bronchus 81.9 65.4 101.6 101.0 74.7 133.8 64.8 44.9 91.987 50 37
Bones and Joints 0 0 0
Melanoma of the Skin 15.8 9.1 26.0 14.4 5.8 30.4 20.5 9.3 39.917 7 10
Breast (invasive) 47.4 34.8 63.2 96.0 69.5 130.149 0 49
Cervix 3.3 0.4 15.22
Corpus and Uterus, NOS 27.5 13.8 49.613
Ovary 6.7 1.2 21.63
Prostate 119.2 90.5 154.559
Testis 2.9 0.1 14.81
Urinary Bladder (includes in situ) 28.0 19.0 40.3 47.1 29.4 71.8 14.2 6.4 29.631 22 9
Kidney and Renal Pelvis 20.5 12.6 31.8 25.0 13.2 43.5 19.6 7.9 40.321 13 8
Brain and Nervous System 8.3 3.7 16.4 10.9 4.0 24.9 4.3 0.8 16.39 6 3
Hodgkin Lymphoma 8.2 3.5 16.5 7.1 1.8 19.5 10.2 2.5 27.48 4 4
Non-Hodgkin Lymphoma 17.1 9.8 27.9 14.8 5.9 31.0 21.8 9.9 42.017 7 10
Myeloma 7.6 3.3 15.5 8.3 2.2 21.8 6.2 1.7 19.08 4 4
Leukemia 11.6 6.2 20.5 14.8 5.9 31.0 9.7 3.5 23.813 7 6
All Other Sites 57.1 42.9 74.6 55.9 36.7 82.0 66.0 42.9 97.357 27 30
DATA SOURCE: Illinois Department of Public Health, Illinois State Cancer Registry, data as of November 2018
Breast in Situ (not in total) 16.3 6.6 34.4 8
III - 53

All Sites Combined and Selected Sites, All Races, 2012-2016Figures include invasive cancer with the exception of urinary bladder (includes in situ) and breast cancer in situ as a separate category. Incidence counts are five-year totals.
Rates are per 100,000 age-adjustd to the 2000 U.S. standard million population. Lower confidence intervals (LCI) and upper confidence intervals (UCI) are 95 percent for rates,
Tiwari method.
Site Rate LCI UCI
Both Sexes Males Females
Cancer Incidence Counts and Five-year Age-adjusted Rates by Sex
Rate LCI UCI Rate LCI UCICount Count Count
Lee
All Sites 496.2 467.4 526.5 515.1 473.9 559.2 491.3 449.6 536.21,172 603 569
Oral Cavity and Pharynx 14.8 10.1 21.1 24.4 15.9 36.0 5.8 2.2 13.034 27 7
Esophagus 5.0 2.5 9.0 6.3 2.5 13.5 3.8 1.2 10.112 7 5
Stomach 6.0 3.1 10.5 10.4 5.1 19.0 1.4 0.2 6.613 11 2
Colon and Rectum 44.6 36.4 54.4 41.8 30.7 55.9 45.8 34.2 60.5106 49 57
Liver 6.7 3.9 11.2 12.6 7.1 21.2 0.7 0.0 5.717 16 1
Pancreas 16.6 11.8 23.0 18.8 11.8 28.9 15.3 8.6 25.440 23 17
Lung and Bronchus 64.1 54.4 75.1 68.9 54.6 86.1 60.4 47.5 76.4160 83 77
Bones and Joints 1.0 0.1 4.1 1.4 0.0 7.0 0.7 0.0 5.72 1 1
Melanoma of the Skin 31.7 24.4 40.5 32.3 22.5 45.2 33.5 22.4 48.470 37 33
Breast (invasive) 61.8 51.8 73.3 1.0 0.0 6.1 125.5 104.8 149.4143 1 142
Cervix 12.9 6.4 23.312
Corpus and Uterus, NOS 42.2 30.7 56.950
Ovary 16.7 9.6 27.418
Prostate 97.2 80.4 116.8122
Testis 4.7 1.2 12.14
Urinary Bladder (includes in situ) 23.8 17.9 31.1 36.6 26.2 50.1 12.2 6.7 21.157 42 15
Kidney and Renal Pelvis 17.8 12.7 24.3 23.4 15.5 34.2 12.3 6.4 21.844 30 14
Brain and Nervous System 5.5 2.9 9.6 7.6 3.4 15.0 3.5 1.1 9.514 9 5
Hodgkin Lymphoma 3.6 1.3 7.9 4.3 1.2 11.2 2.8 0.3 10.06 4 2
Non-Hodgkin Lymphoma 24.2 18.0 31.9 26.5 17.6 38.5 22.0 14.0 33.455 29 26
Myeloma 6.8 3.7 11.5 6.1 2.2 13.7 7.3 3.3 14.815 6 9
Leukemia 16.7 11.7 23.2 21.5 13.6 32.6 11.0 5.9 19.439 24 15
All Other Sites 61.3 51.2 72.9 69.3 54.5 87.2 55.5 41.4 73.1139 78 61
DATA SOURCE: Illinois Department of Public Health, Illinois State Cancer Registry, data as of November 2018
Breast in Situ (not in total) 18.8 11.5 29.5 22
III - 54

All Sites Combined and Selected Sites, All Races, 2012-2016Figures include invasive cancer with the exception of urinary bladder (includes in situ) and breast cancer in situ as a separate category. Incidence counts are five-year totals.
Rates are per 100,000 age-adjustd to the 2000 U.S. standard million population. Lower confidence intervals (LCI) and upper confidence intervals (UCI) are 95 percent for rates,
Tiwari method.
Site Rate LCI UCI
Both Sexes Males Females
Cancer Incidence Counts and Five-year Age-adjusted Rates by Sex
Rate LCI UCI Rate LCI UCICount Count Count
Livingston
All Sites 521.6 492.4 552.2 570.1 526.2 616.8 488.3 448.6 530.71,263 651 612
Oral Cavity and Pharynx 13.7 9.5 19.4 21.2 13.7 31.6 6.3 2.8 13.035 26 9
Esophagus 4.4 2.1 8.3 7.8 3.4 15.4 1.4 0.2 6.111 9 2
Stomach 3.3 1.5 6.7 4.1 1.3 10.2 2.4 0.6 7.49 5 4
Colon and Rectum 50.8 42.0 61.0 56.2 43.2 72.2 47.1 35.2 62.0124 65 59
Liver 5.2 2.8 9.0 9.2 4.7 16.7 1.5 0.2 6.414 12 2
Pancreas 11.5 7.6 16.9 14.2 8.1 23.3 8.5 4.2 15.828 17 11
Lung and Bronchus 90.5 78.8 103.7 101.8 83.7 122.9 85.5 69.8 104.0222 114 108
Bones and Joints 0.5 0.0 2.9 1.1 0.0 6.11 1 0
Melanoma of the Skin 28.5 21.8 36.8 31.7 21.8 44.7 26.3 17.2 38.665 35 30
Breast (invasive) 72.8 62.1 85.0 1.0 0.0 5.8 139.3 118.4 163.0174 1 173
Cervix 13.5 7.0 23.413
Corpus and Uterus, NOS 25.7 17.5 36.734
Ovary 15.5 8.9 25.319
Prostate 113.5 95.1 134.6140
Testis 7.4 2.9 15.47
Urinary Bladder (includes in situ) 21.6 16.0 28.6 38.9 27.9 53.0 8.0 3.9 15.253 42 11
Kidney and Renal Pelvis 19.4 14.2 26.1 25.2 16.7 36.8 14.9 8.9 24.048 29 19
Brain and Nervous System 8.9 5.3 14.0 13.7 7.4 23.4 4.6 1.6 10.920 14 6
Hodgkin Lymphoma 0.9 0.1 3.6 1.9 0.2 7.32 0 2
Non-Hodgkin Lymphoma 17.4 12.4 23.8 22.9 14.7 34.2 12.2 7.0 20.242 25 17
Myeloma 6.9 3.9 11.4 9.9 4.9 18.1 4.3 1.4 10.516 11 5
Leukemia 17.3 12.1 23.9 21.2 13.1 32.6 13.2 7.4 22.139 22 17
All Other Sites 62.0 52.0 73.4 69.2 54.2 87.2 56.4 43.3 72.5147 76 71
DATA SOURCE: Illinois Department of Public Health, Illinois State Cancer Registry, data as of November 2018
Breast in Situ (not in total) 31.8 22.0 44.6 37
III - 55

All Sites Combined and Selected Sites, All Races, 2012-2016Figures include invasive cancer with the exception of urinary bladder (includes in situ) and breast cancer in situ as a separate category. Incidence counts are five-year totals.
Rates are per 100,000 age-adjustd to the 2000 U.S. standard million population. Lower confidence intervals (LCI) and upper confidence intervals (UCI) are 95 percent for rates,
Tiwari method.
Site Rate LCI UCI
Both Sexes Males Females
Cancer Incidence Counts and Five-year Age-adjusted Rates by Sex
Rate LCI UCI Rate LCI UCICount Count Count
Logan
All Sites 565.5 531.5 601.1 632.8 580.1 689.1 520.7 475.5 569.31,081 548 533
Oral Cavity and Pharynx 15.5 10.2 22.7 26.8 16.7 40.9 5.6 1.9 13.428 22 6
Esophagus 10.4 6.2 16.5 18.4 10.4 30.5 3.6 0.7 11.119 16 3
Stomach 4.2 1.9 8.5 6.2 2.0 14.8 2.8 0.7 9.09 5 4
Colon and Rectum 58.6 48.1 71.0 62.7 46.8 82.4 55.2 41.5 72.6112 54 58
Liver 9.5 5.7 15.2 16.8 9.5 28.0 3.0 0.6 9.719 16 3
Pancreas 18.2 12.6 25.6 21.0 12.1 33.9 16.5 9.6 27.036 17 19
Lung and Bronchus 104.2 90.2 119.9 129.4 106.3 156.3 85.6 68.7 106.0205 112 93
Bones and Joints 0.6 0.0 3.7 1.1 0.0 7.01 1 0
Melanoma of the Skin 20.3 14.1 28.3 25.4 15.9 38.7 15.5 8.2 27.037 23 14
Breast (invasive) 71.3 59.7 84.6 2.2 0.3 8.6 133.6 111.4 159.4140 2 138
Cervix 15.1 7.2 27.810
Corpus and Uterus, NOS 34.1 23.4 48.534
Ovary 6.7 2.3 15.56
Prostate 113.3 92.2 138.1103
Testis 8.1 3.2 17.27
Urinary Bladder (includes in situ) 29.8 22.5 38.9 48.5 34.6 66.4 14.6 8.2 24.658 41 17
Kidney and Renal Pelvis 16.4 10.8 23.9 25.3 15.2 39.6 8.1 3.7 16.529 20 9
Brain and Nervous System 9.2 5.4 15.0 8.4 3.5 17.2 10.8 4.9 20.818 8 10
Hodgkin Lymphoma 3.4 1.0 8.1 2.7 0.3 9.9 4.2 0.8 12.55 2 3
Non-Hodgkin Lymphoma 23.6 17.1 32.0 26.7 16.8 40.7 19.9 12.3 31.145 23 22
Myeloma 6.9 3.8 12.0 9.9 4.2 19.8 4.8 1.7 11.714 8 6
Leukemia 12.8 8.3 19.2 16.2 8.8 27.6 11.3 5.6 21.026 14 12
All Other Sites 65.4 54.0 78.7 63.9 47.7 84.0 69.7 53.2 90.0120 54 66
DATA SOURCE: Illinois Department of Public Health, Illinois State Cancer Registry, data as of November 2018
Breast in Situ (not in total) 26.2 16.9 39.3 26
III - 56

All Sites Combined and Selected Sites, All Races, 2012-2016Figures include invasive cancer with the exception of urinary bladder (includes in situ) and breast cancer in situ as a separate category. Incidence counts are five-year totals.
Rates are per 100,000 age-adjustd to the 2000 U.S. standard million population. Lower confidence intervals (LCI) and upper confidence intervals (UCI) are 95 percent for rates,
Tiwari method.
Site Rate LCI UCI
Both Sexes Males Females
Cancer Incidence Counts and Five-year Age-adjusted Rates by Sex
Rate LCI UCI Rate LCI UCICount Count Count
Macon
All Sites 547.9 530.2 566.0 604.7 577.7 632.7 509.7 486.0 534.43,928 1,991 1,937
Oral Cavity and Pharynx 17.7 14.7 21.2 25.0 19.8 31.3 11.3 8.1 15.4130 85 45
Esophagus 6.0 4.3 8.1 10.7 7.4 15.1 2.2 1.0 4.346 36 10
Stomach 7.5 5.5 10.1 10.5 7.2 15.0 4.9 2.8 8.250 33 17
Colon and Rectum 53.9 48.5 59.9 66.1 57.3 76.0 44.9 38.1 52.7386 213 173
Liver 7.1 5.4 9.4 12.6 9.1 17.1 2.3 1.2 4.457 45 12
Pancreas 13.8 11.3 16.8 12.9 9.3 17.5 14.1 10.7 18.5106 45 61
Lung and Bronchus 93.4 86.4 100.8 108.8 97.7 120.8 82.5 73.6 92.2701 366 335
Bones and Joints 0.3 0.0 1.3 0.2 0.0 1.8 0.4 0.0 2.32 1 1
Melanoma of the Skin 28.4 24.3 33.0 32.6 26.5 39.7 26.1 20.5 32.8189 105 84
Breast (invasive) 67.8 61.6 74.6 1.0 0.2 3.1 125.4 113.7 138.1471 3 468
Cervix 12.9 8.8 18.235
Corpus and Uterus, NOS 30.3 25.1 36.4127
Ovary 9.5 6.6 13.338
Prostate 121.0 109.4 133.5420
Testis 5.1 2.6 8.912
Urinary Bladder (includes in situ) 20.7 17.5 24.3 36.2 29.8 43.5 9.7 6.9 13.5158 118 40
Kidney and Renal Pelvis 21.7 18.2 25.6 27.8 22.1 34.5 16.8 12.8 21.9153 89 64
Brain and Nervous System 6.5 4.6 8.9 8.6 5.5 12.8 4.6 2.6 7.742 26 16
Hodgkin Lymphoma 3.1 1.8 5.1 3.0 1.2 6.1 3.3 1.5 6.316 7 9
Non-Hodgkin Lymphoma 21.0 17.7 24.9 24.8 19.3 31.4 18.1 14.1 23.0148 73 75
Myeloma 6.3 4.7 8.4 7.2 4.6 10.8 5.5 3.5 8.351 26 25
Leukemia 13.8 11.1 17.0 19.1 14.4 24.8 9.5 6.6 13.399 59 40
All Other Sites 72.9 66.3 80.0 71.8 62.5 82.1 75.3 65.9 85.7491 229 262
DATA SOURCE: Illinois Department of Public Health, Illinois State Cancer Registry, data as of November 2018
Breast in Situ (not in total) 37.2 30.9 44.5 135
III - 57

All Sites Combined and Selected Sites, All Races, 2012-2016Figures include invasive cancer with the exception of urinary bladder (includes in situ) and breast cancer in situ as a separate category. Incidence counts are five-year totals.
Rates are per 100,000 age-adjustd to the 2000 U.S. standard million population. Lower confidence intervals (LCI) and upper confidence intervals (UCI) are 95 percent for rates,
Tiwari method.
Site Rate LCI UCI
Both Sexes Males Females
Cancer Incidence Counts and Five-year Age-adjusted Rates by Sex
Rate LCI UCI Rate LCI UCICount Count Count
Macoupin
All Sites 497.4 472.4 523.5 574.8 536.1 615.7 438.9 405.9 474.21,588 863 725
Oral Cavity and Pharynx 14.3 10.3 19.4 25.7 18.0 35.8 3.9 1.5 8.845 38 7
Esophagus 5.6 3.4 9.0 11.2 6.7 18.1 0.7 0.0 4.520 19 1
Stomach 3.3 1.6 6.2 5.4 2.3 11.2 1.1 0.2 4.611 8 3
Colon and Rectum 53.4 45.3 62.6 61.2 48.7 76.1 47.9 37.5 60.6165 86 79
Liver 6.5 4.1 10.1 11.2 6.6 18.3 2.4 0.8 6.723 18 5
Pancreas 13.6 9.9 18.3 15.3 9.7 23.4 11.8 7.4 18.547 24 23
Lung and Bronchus 89.2 79.2 100.3 118.5 101.5 137.8 67.1 55.3 81.0299 180 119
Bones and Joints 1.5 0.3 4.3 2.0 0.2 7.0 1.1 0.0 5.63 2 1
Melanoma of the Skin 20.2 15.3 26.3 25.4 17.8 35.4 16.6 10.3 25.562 38 24
Breast (invasive) 65.1 56.0 75.2 1.8 0.4 6.0 121.7 104.5 141.1201 3 198
Cervix 11.9 6.3 20.314
Corpus and Uterus, NOS 26.2 18.8 35.844
Ovary 8.9 4.8 15.515
Prostate 106.4 90.7 124.3168
Testis 8.7 3.9 16.69
Urinary Bladder (includes in situ) 21.9 17.2 27.7 38.9 29.7 50.4 8.7 4.7 15.077 62 15
Kidney and Renal Pelvis 22.7 17.6 28.9 26.9 18.9 37.3 19.1 13.0 27.573 40 33
Brain and Nervous System 5.4 2.8 9.3 6.7 2.9 13.2 4.3 1.3 10.414 9 5
Hodgkin Lymphoma 3.6 1.5 7.2 2.6 0.5 7.7 4.8 1.5 11.08 3 5
Non-Hodgkin Lymphoma 15.7 11.6 21.0 22.7 15.4 32.4 9.6 5.6 15.951 33 18
Myeloma 5.9 3.7 9.4 10.1 5.7 17.0 2.7 0.8 7.121 16 5
Leukemia 15.0 10.8 20.4 18.4 11.9 27.5 11.8 6.8 19.445 26 19
All Other Sites 56.0 47.6 65.5 55.7 43.9 69.9 56.6 44.9 70.7173 81 92
DATA SOURCE: Illinois Department of Public Health, Illinois State Cancer Registry, data as of November 2018
Breast in Situ (not in total) 30.3 21.7 41.4 45
III - 58

All Sites Combined and Selected Sites, All Races, 2012-2016Figures include invasive cancer with the exception of urinary bladder (includes in situ) and breast cancer in situ as a separate category. Incidence counts are five-year totals.
Rates are per 100,000 age-adjustd to the 2000 U.S. standard million population. Lower confidence intervals (LCI) and upper confidence intervals (UCI) are 95 percent for rates,
Tiwari method.
Site Rate LCI UCI
Both Sexes Males Females
Cancer Incidence Counts and Five-year Age-adjusted Rates by Sex
Rate LCI UCI Rate LCI UCICount Count Count
Madison
All Sites 487.3 476.4 498.4 516.2 499.6 533.3 474.4 459.6 489.67,963 3,821 4,142
Oral Cavity and Pharynx 12.7 11.0 14.6 18.1 15.2 21.4 8.2 6.3 10.4215 145 70
Esophagus 6.6 5.4 8.0 12.3 9.9 15.1 1.9 1.1 3.2113 96 17
Stomach 4.6 3.6 5.8 6.1 4.4 8.3 3.5 2.4 5.077 44 33
Colon and Rectum 39.9 36.9 43.2 46.1 41.2 51.4 35.5 31.7 39.8665 339 326
Liver 6.9 5.7 8.3 10.5 8.4 13.1 3.7 2.5 5.2122 87 35
Pancreas 13.2 11.5 15.1 14.6 11.9 17.7 12.4 10.2 15.0223 107 116
Lung and Bronchus 81.6 77.3 86.2 92.7 85.7 100.1 74.1 68.6 80.01,365 679 686
Bones and Joints 1.3 0.7 2.1 2.0 1.1 3.5 0.6 0.1 1.517 13 4
Melanoma of the Skin 23.4 21.0 26.0 27.3 23.5 31.5 21.5 18.2 25.3362 199 163
Breast (invasive) 72.4 68.2 76.8 1.0 0.4 2.2 134.7 126.8 143.11,160 7 1,153
Cervix 8.6 6.5 11.163
Corpus and Uterus, NOS 29.0 25.6 32.8269
Ovary 10.4 8.3 12.989
Prostate 87.8 81.3 94.7702
Testis 4.9 3.3 7.029
Urinary Bladder (includes in situ) 23.7 21.3 26.2 41.6 36.9 46.7 10.6 8.5 13.0397 298 99
Kidney and Renal Pelvis 24.2 21.7 26.8 29.7 25.7 34.1 19.5 16.6 22.9380 213 167
Brain and Nervous System 8.2 6.8 9.9 8.8 6.7 11.4 7.7 5.8 10.1119 60 59
Hodgkin Lymphoma 2.4 1.7 3.4 2.7 1.6 4.2 2.2 1.2 3.634 18 16
Non-Hodgkin Lymphoma 19.8 17.6 22.1 24.7 21.1 28.6 16.0 13.5 19.0322 179 143
Myeloma 5.8 4.7 7.1 6.8 5.0 9.0 5.1 3.7 6.999 51 48
Leukemia 13.5 11.8 15.5 17.6 14.5 21.1 10.8 8.6 13.4216 122 94
All Other Sites 58.8 55.0 62.9 61.1 55.3 67.3 58.3 53.1 64.0925 433 492
DATA SOURCE: Illinois Department of Public Health, Illinois State Cancer Registry, data as of November 2018
Breast in Situ (not in total) 32.6 28.6 37.0 263
III - 59

All Sites Combined and Selected Sites, All Races, 2012-2016Figures include invasive cancer with the exception of urinary bladder (includes in situ) and breast cancer in situ as a separate category. Incidence counts are five-year totals.
Rates are per 100,000 age-adjustd to the 2000 U.S. standard million population. Lower confidence intervals (LCI) and upper confidence intervals (UCI) are 95 percent for rates,
Tiwari method.
Site Rate LCI UCI
Both Sexes Males Females
Cancer Incidence Counts and Five-year Age-adjusted Rates by Sex
Rate LCI UCI Rate LCI UCICount Count Count
Marion
All Sites 532.6 503.8 562.6 614.2 570.0 661.1 471.3 433.1 512.11,383 752 631
Oral Cavity and Pharynx 10.4 6.9 15.3 17.4 10.8 26.9 4.2 1.5 9.928 22 6
Esophagus 9.8 6.3 14.7 15.9 9.4 25.4 4.0 1.6 9.226 19 7
Stomach 5.1 2.8 8.8 7.9 3.7 15.0 3.2 1.0 8.415 10 5
Colon and Rectum 55.4 46.4 65.8 59.5 46.0 75.9 50.2 38.8 64.3143 70 73
Liver 6.3 3.5 10.5 8.7 4.3 16.2 4.2 1.2 10.516 11 5
Pancreas 12.5 8.5 17.9 18.1 11.3 27.8 7.7 3.5 14.934 23 11
Lung and Bronchus 81.8 71.3 93.6 101.0 84.1 120.6 67.4 54.3 83.0227 129 98
Bones and Joints 0.6 0.0 3.1 1.2 0.0 6.21 0 1
Melanoma of the Skin 31.0 23.8 39.7 37.8 26.8 51.8 26.5 17.2 38.971 42 29
Breast (invasive) 75.3 64.3 87.8 143.1 121.9 167.1182 0 182
Cervix 5.2 1.6 12.45
Corpus and Uterus, NOS 36.6 26.5 49.449
Ovary 8.2 3.9 15.411
Prostate 137.7 118.2 159.8182
Testis 2.6 0.3 8.92
Urinary Bladder (includes in situ) 22.8 17.5 29.4 41.7 30.9 55.3 8.2 4.3 14.964 51 13
Kidney and Renal Pelvis 24.4 18.4 31.7 34.8 24.7 47.8 16.1 9.6 25.662 41 21
Brain and Nervous System 3.7 1.5 7.6 5.0 1.6 11.8 2.7 0.5 8.68 5 3
Hodgkin Lymphoma 3.2 1.2 7.0 2.5 0.3 8.5 3.9 1.0 10.16 2 4
Non-Hodgkin Lymphoma 24.6 18.8 31.9 31.2 21.7 43.7 19.0 12.3 28.563 37 26
Myeloma 6.8 4.0 11.2 8.5 3.9 16.2 5.2 2.2 11.018 10 8
Leukemia 13.2 8.9 18.9 17.5 10.5 27.5 9.0 4.5 16.333 20 13
All Other Sites 54.5 45.4 65.0 66.8 52.2 84.3 45.7 34.4 59.7137 76 61
DATA SOURCE: Illinois Department of Public Health, Illinois State Cancer Registry, data as of November 2018
Breast in Situ (not in total) 24.0 16.2 34.5 33
III - 60

All Sites Combined and Selected Sites, All Races, 2012-2016Figures include invasive cancer with the exception of urinary bladder (includes in situ) and breast cancer in situ as a separate category. Incidence counts are five-year totals.
Rates are per 100,000 age-adjustd to the 2000 U.S. standard million population. Lower confidence intervals (LCI) and upper confidence intervals (UCI) are 95 percent for rates,
Tiwari method.
Site Rate LCI UCI
Both Sexes Males Females
Cancer Incidence Counts and Five-year Age-adjusted Rates by Sex
Rate LCI UCI Rate LCI UCICount Count Count
Marshall
All Sites 500.6 453.8 551.4 564.0 493.7 642.7 453.6 390.8 524.8460 247 213
Oral Cavity and Pharynx 19.0 10.4 32.5 29.3 14.7 53.8 10.6 2.3 30.816 12 4
Esophagus 5.2 1.7 13.8 9.0 2.4 26.0 1.6 0.0 15.35 4 1
Stomach 4.1 1.1 12.2 7.2 1.5 23.7 2.0 0.1 16.04 3 1
Colon and Rectum 55.4 40.7 74.3 59.3 37.8 89.9 52.6 33.5 80.751 25 26
Liver 3.7 1.0 11.6 4.4 0.5 19.6 3.0 0.4 17.04 2 2
Pancreas 10.6 5.2 20.5 15.8 6.3 35.1 6.9 1.8 22.211 7 4
Lung and Bronchus 73.6 57.6 93.4 93.7 67.6 128.3 57.6 39.0 84.574 43 31
Bones and Joints 0 0 0
Melanoma of the Skin 21.1 11.6 35.8 10.2 3.3 27.2 32.0 15.0 59.917 5 12
Breast (invasive) 53.8 38.6 73.7 104.0 74.1 143.146 0 46
Cervix 5.5 0.5 22.52
Corpus and Uterus, NOS 38.3 22.2 63.618
Ovary 23.1 9.7 47.29
Prostate 118.1 88.0 156.854
Testis 4.6 0.1 22.81
Urinary Bladder (includes in situ) 34.8 23.6 50.5 59.0 37.6 89.5 13.6 5.3 31.632 25 7
Kidney and Renal Pelvis 16.1 9.1 27.5 22.1 10.9 42.5 10.3 3.3 27.516 11 5
Brain and Nervous System 12.1 5.2 24.2 9.4 1.7 29.1 14.3 5.0 34.09 3 6
Hodgkin Lymphoma 1.9 0.2 9.1 2.1 0.1 16.0 1.7 0.0 15.52 1 1
Non-Hodgkin Lymphoma 15.7 7.7 28.8 28.4 13.2 54.1 3.8 0.5 18.413 11 2
Myeloma 9.1 4.1 18.8 14.4 5.2 33.6 5.5 1.1 20.69 6 3
Leukemia 14.1 7.1 26.0 9.8 3.1 26.3 17.8 6.7 39.413 5 8
All Other Sites 57.1 42.4 76.2 67.3 44.2 99.5 49.4 31.5 75.954 29 25
DATA SOURCE: Illinois Department of Public Health, Illinois State Cancer Registry, data as of November 2018
Breast in Situ (not in total) 37.7 20.1 65.6 15
III - 61

All Sites Combined and Selected Sites, All Races, 2012-2016Figures include invasive cancer with the exception of urinary bladder (includes in situ) and breast cancer in situ as a separate category. Incidence counts are five-year totals.
Rates are per 100,000 age-adjustd to the 2000 U.S. standard million population. Lower confidence intervals (LCI) and upper confidence intervals (UCI) are 95 percent for rates,
Tiwari method.
Site Rate LCI UCI
Both Sexes Males Females
Cancer Incidence Counts and Five-year Age-adjusted Rates by Sex
Rate LCI UCI Rate LCI UCICount Count Count
Mason
All Sites 485.2 441.7 532.3 517.0 454.2 587.0 469.2 408.0 537.8498 258 240
Oral Cavity and Pharynx 18.0 9.8 30.7 25.7 12.4 47.9 11.4 2.9 30.016 11 5
Esophagus 9.7 4.8 18.5 14.5 6.2 31.1 5.4 1.1 18.811 8 3
Stomach 2.6 0.5 9.2 3.5 0.4 16.1 1.8 0.0 13.83 2 1
Colon and Rectum 54.6 40.9 72.0 64.9 44.2 93.2 46.6 29.0 72.158 33 25
Liver 7.5 3.2 15.9 13.3 5.3 29.8 2.0 0.1 14.38 7 1
Pancreas 16.5 9.6 27.2 21.6 10.7 40.7 12.9 4.9 29.518 11 7
Lung and Bronchus 103.6 84.9 125.8 108.6 81.3 143.4 102.1 76.7 134.7111 55 56
Bones and Joints 0.8 0.0 6.6 1.6 0.0 13.41 0 1
Melanoma of the Skin 20.0 11.7 32.4 28.3 14.8 50.3 12.3 4.0 29.919 13 6
Breast (invasive) 53.9 39.2 72.6 1.9 0.0 14.1 103.9 75.1 140.850 1 49
Cervix 14.0 4.2 34.05
Corpus and Uterus, NOS 18.2 7.9 37.29
Ovary 4.4 0.9 17.13
Prostate 80.0 57.4 109.943
Testis 1.9 0.0 14.01
Urinary Bladder (includes in situ) 19.2 11.3 31.1 31.3 16.5 54.8 9.1 3.3 23.220 14 6
Kidney and Renal Pelvis 20.6 13.0 32.0 25.3 13.3 45.4 16.9 8.0 33.823 13 10
Brain and Nervous System 3.5 0.9 10.5 5.0 1.0 18.1 2.0 0.1 14.34 3 1
Hodgkin Lymphoma 2.6 0.3 10.0 3.2 0.1 17.4 1.5 0.0 13.32 1 1
Non-Hodgkin Lymphoma 17.8 10.5 29.0 15.0 6.4 31.9 20.9 9.9 40.219 8 11
Myeloma 4.5 1.4 11.9 4.3 0.5 17.8 4.4 0.9 17.15 2 3
Leukemia 16.9 9.3 28.7 20.5 9.1 40.8 15.3 5.6 34.116 9 7
All Other Sites 54.8 40.3 73.3 48.5 30.2 74.8 62.5 40.5 92.853 23 30
DATA SOURCE: Illinois Department of Public Health, Illinois State Cancer Registry, data as of November 2018
Breast in Situ (not in total) 21.5 9.8 42.0 10
III - 62

All Sites Combined and Selected Sites, All Races, 2012-2016Figures include invasive cancer with the exception of urinary bladder (includes in situ) and breast cancer in situ as a separate category. Incidence counts are five-year totals.
Rates are per 100,000 age-adjustd to the 2000 U.S. standard million population. Lower confidence intervals (LCI) and upper confidence intervals (UCI) are 95 percent for rates,
Tiwari method.
Site Rate LCI UCI
Both Sexes Males Females
Cancer Incidence Counts and Five-year Age-adjusted Rates by Sex
Rate LCI UCI Rate LCI UCICount Count Count
Massac
All Sites 464.1 421.9 509.9 512.8 449.5 583.2 428.9 372.0 492.7476 248 228
Oral Cavity and Pharynx 13.5 7.2 23.5 22.6 11.1 42.1 5.3 1.1 17.814 11 3
Esophagus 4.3 1.4 11.3 5.5 1.1 18.7 3.3 0.4 14.85 3 2
Stomach 5.0 1.6 12.6 8.9 2.4 24.2 2.0 0.1 13.35 4 1
Colon and Rectum 48.3 35.3 64.9 54.6 34.7 82.5 41.1 25.8 63.449 25 24
Liver 3.4 0.9 10.0 5.9 1.2 19.5 1.6 0.0 12.44 3 1
Pancreas 12.1 6.4 21.5 11.9 4.3 27.8 12.3 4.8 27.513 6 7
Lung and Bronchus 95.3 77.6 116.4 108.1 81.3 142.0 84.8 61.9 114.4105 56 49
Bones and Joints 0 0 0
Melanoma of the Skin 18.8 10.8 30.7 23.3 11.3 43.6 14.2 5.3 31.418 11 7
Breast (invasive) 61.8 47.0 80.3 2.4 0.1 14.7 115.0 87.0 150.163 1 62
Cervix 7.0 0.8 23.52
Corpus and Uterus, NOS 20.0 9.3 38.610
Ovary 5.8 1.4 18.34
Prostate 98.8 72.8 132.149
Testis 4.0 0.1 19.51
Urinary Bladder (includes in situ) 14.5 8.2 24.5 30.6 17.0 52.1 1.6 0.0 12.416 15 1
Kidney and Renal Pelvis 22.6 13.9 35.1 20.5 9.5 39.8 24.9 12.5 45.123 10 13
Brain and Nervous System 9.4 3.8 19.3 17.6 6.6 38.0 1.6 0.0 12.48 7 1
Hodgkin Lymphoma 4.6 0.9 13.3 8.6 1.6 25.43 0 3
Non-Hodgkin Lymphoma 12.8 6.5 23.1 17.1 6.8 36.3 8.8 2.7 22.812 7 5
Myeloma 3.8 1.0 10.7 8.6 2.3 23.64 4 0
Leukemia 15.2 7.7 27.0 13.1 4.7 30.3 18.0 6.8 38.113 6 7
All Other Sites 53.8 40.0 71.2 59.2 39.4 86.7 53.1 33.6 80.455 29 26
DATA SOURCE: Illinois Department of Public Health, Illinois State Cancer Registry, data as of November 2018
Breast in Situ (not in total) 21.2 10.8 38.7 12
III - 63

All Sites Combined and Selected Sites, All Races, 2012-2016Figures include invasive cancer with the exception of urinary bladder (includes in situ) and breast cancer in situ as a separate category. Incidence counts are five-year totals.
Rates are per 100,000 age-adjustd to the 2000 U.S. standard million population. Lower confidence intervals (LCI) and upper confidence intervals (UCI) are 95 percent for rates,
Tiwari method.
Site Rate LCI UCI
Both Sexes Males Females
Cancer Incidence Counts and Five-year Age-adjusted Rates by Sex
Rate LCI UCI Rate LCI UCICount Count Count
McDonough
All Sites 487.8 454.4 523.2 498.7 450.0 551.5 491.1 444.0 542.0869 409 460
Oral Cavity and Pharynx 15.1 9.5 22.8 24.9 14.6 39.8 6.7 2.2 15.825 19 6
Esophagus 3.6 1.4 7.9 5.6 1.8 14.1 1.7 0.2 7.87 5 2
Stomach 2.1 0.6 6.0 4.6 1.2 12.74 4 0
Colon and Rectum 52.4 42.1 64.6 52.7 37.9 71.8 49.8 36.6 66.796 44 52
Liver 4.0 1.4 8.8 4.4 1.1 12.3 3.7 0.5 12.27 4 3
Pancreas 9.9 5.5 16.4 9.4 4.2 18.8 10.2 3.9 21.317 9 8
Lung and Bronchus 74.2 62.3 88.0 76.9 58.8 99.1 73.7 57.8 93.2143 63 80
Bones and Joints 1.3 0.3 4.6 1.8 0.2 8.1 0.9 0.0 6.83 2 1
Melanoma of the Skin 26.1 18.7 35.6 35.2 23.0 51.8 18.7 10.3 31.446 28 18
Breast (invasive) 70.8 57.8 86.0 134.7 109.6 163.8114 0 114
Cervix 13.5 5.6 26.78
Corpus and Uterus, NOS 27.5 16.8 42.522
Ovary 4.7 1.5 12.25
Prostate 97.0 77.2 120.886
Testis 4.5 0.5 14.62
Urinary Bladder (includes in situ) 20.6 14.4 28.9 33.8 21.6 50.5 11.1 5.7 20.438 25 13
Kidney and Renal Pelvis 14.0 8.8 21.3 16.5 8.5 29.1 11.6 5.6 21.925 13 12
Brain and Nervous System 8.5 4.3 15.1 6.1 2.1 14.7 10.6 3.9 22.413 6 7
Hodgkin Lymphoma 2.2 0.4 6.7 3.7 0.4 12.7 1.3 0.0 7.73 2 1
Non-Hodgkin Lymphoma 19.0 13.1 26.9 19.2 10.4 32.6 20.3 12.4 32.036 15 21
Myeloma 5.8 3.0 10.6 6.4 2.3 14.9 5.2 1.9 12.712 6 6
Leukemia 15.6 10.5 22.6 27.2 16.8 41.8 7.8 3.5 16.131 22 9
All Other Sites 72.3 59.5 87.1 68.8 51.2 90.7 77.5 59.3 99.7126 54 72
DATA SOURCE: Illinois Department of Public Health, Illinois State Cancer Registry, data as of November 2018
Breast in Situ (not in total) 33.4 21.7 49.4 29
III - 64

All Sites Combined and Selected Sites, All Races, 2012-2016Figures include invasive cancer with the exception of urinary bladder (includes in situ) and breast cancer in situ as a separate category. Incidence counts are five-year totals.
Rates are per 100,000 age-adjustd to the 2000 U.S. standard million population. Lower confidence intervals (LCI) and upper confidence intervals (UCI) are 95 percent for rates,
Tiwari method.
Site Rate LCI UCI
Both Sexes Males Females
Cancer Incidence Counts and Five-year Age-adjusted Rates by Sex
Rate LCI UCI Rate LCI UCICount Count Count
McHenry
All Sites 456.0 445.4 466.8 478.7 462.4 495.3 444.5 430.3 459.17,561 3,671 3,890
Oral Cavity and Pharynx 11.3 9.8 13.1 17.3 14.5 20.5 5.9 4.4 7.8204 150 54
Esophagus 5.6 4.5 6.9 10.0 7.7 12.7 2.1 1.2 3.491 73 18
Stomach 5.7 4.5 7.0 8.1 6.1 10.6 3.6 2.4 5.291 62 29
Colon and Rectum 40.8 37.6 44.1 47.2 42.1 52.7 35.4 31.5 39.6664 353 311
Liver 4.1 3.1 5.2 6.4 4.7 8.6 2.1 1.2 3.369 51 18
Pancreas 12.6 10.9 14.5 14.5 11.7 17.6 11.1 8.9 13.7204 111 93
Lung and Bronchus 60.4 56.5 64.5 63.1 57.1 69.6 59.3 54.1 64.9959 450 509
Bones and Joints 0.8 0.4 1.4 0.7 0.3 1.7 0.7 0.3 1.712 6 6
Melanoma of the Skin 23.1 20.7 25.6 27.5 23.7 31.7 19.9 16.9 23.4373 208 165
Breast (invasive) 72.4 68.3 76.7 1.3 0.6 2.4 137.2 129.4 145.31,244 11 1,233
Cervix 4.9 3.5 6.841
Corpus and Uterus, NOS 29.1 25.7 32.9280
Ovary 13.4 11.1 16.2118
Prostate 101.8 94.8 109.2869
Testis 9.1 7.0 11.764
Urinary Bladder (includes in situ) 22.7 20.4 25.3 39.1 34.3 44.4 10.1 8.0 12.5355 269 86
Kidney and Renal Pelvis 16.7 14.7 18.8 21.7 18.5 25.4 11.9 9.7 14.5283 179 104
Brain and Nervous System 7.3 6.0 8.8 8.9 6.8 11.5 5.8 4.3 7.7115 64 51
Hodgkin Lymphoma 2.3 1.6 3.2 2.8 1.7 4.3 1.8 1.0 3.035 21 14
Non-Hodgkin Lymphoma 18.2 16.2 20.5 21.7 18.4 25.4 15.0 12.5 17.9302 171 131
Myeloma 5.6 4.5 6.9 7.0 5.1 9.3 4.6 3.2 6.392 53 39
Leukemia 11.3 9.6 13.1 15.2 12.3 18.5 8.2 6.3 10.5173 106 67
All Other Sites 57.8 54.0 61.8 55.2 49.6 61.2 62.3 57.0 68.1923 400 523
DATA SOURCE: Illinois Department of Public Health, Illinois State Cancer Registry, data as of November 2018
Breast in Situ (not in total) 31.2 27.6 35.2 285
III - 65

All Sites Combined and Selected Sites, All Races, 2012-2016Figures include invasive cancer with the exception of urinary bladder (includes in situ) and breast cancer in situ as a separate category. Incidence counts are five-year totals.
Rates are per 100,000 age-adjustd to the 2000 U.S. standard million population. Lower confidence intervals (LCI) and upper confidence intervals (UCI) are 95 percent for rates,
Tiwari method.
Site Rate LCI UCI
Both Sexes Males Females
Cancer Incidence Counts and Five-year Age-adjusted Rates by Sex
Rate LCI UCI Rate LCI UCICount Count Count
McLean
All Sites 463.3 448.5 478.5 502.4 479.5 526.1 439.2 419.4 459.63,878 1,924 1,954
Oral Cavity and Pharynx 13.2 10.8 16.0 17.0 13.1 21.7 10.1 7.2 13.6110 67 43
Esophagus 5.4 3.9 7.3 9.7 6.7 13.5 1.8 0.7 3.645 37 8
Stomach 5.2 3.7 7.0 8.0 5.3 11.4 3.0 1.6 5.044 30 14
Colon and Rectum 42.6 38.2 47.4 49.9 42.8 57.9 36.9 31.3 43.1351 184 167
Liver 5.5 4.1 7.3 9.5 6.7 13.1 2.1 1.0 4.050 40 10
Pancreas 12.6 10.2 15.3 15.4 11.6 20.2 10.2 7.4 13.7104 57 47
Lung and Bronchus 59.9 54.5 65.6 69.4 60.9 78.8 52.0 45.4 59.3486 253 233
Bones and Joints 0.6 0.2 1.5 0.5 0.1 1.9 0.7 0.2 2.25 2 3
Melanoma of the Skin 33.5 29.6 37.7 39.6 33.2 46.8 29.7 24.7 35.3278 146 132
Breast (invasive) 76.1 70.1 82.4 1.6 0.5 3.6 142.0 130.8 153.9631 5 626
Cervix 6.5 4.2 9.527
Corpus and Uterus, NOS 24.1 19.7 29.2110
Ovary 10.2 7.4 13.745
Prostate 112.2 102.0 123.3467
Testis 5.7 3.7 8.526
Urinary Bladder (includes in situ) 18.2 15.4 21.5 31.1 25.4 37.7 8.6 6.1 11.9151 111 40
Kidney and Renal Pelvis 16.3 13.6 19.4 23.4 18.7 28.9 10.3 7.5 13.9137 91 46
Brain and Nervous System 7.6 5.8 9.8 10.5 7.4 14.4 4.8 2.9 7.462 40 22
Hodgkin Lymphoma 1.7 0.9 3.0 2.0 0.8 4.1 1.7 0.6 3.614 8 6
Non-Hodgkin Lymphoma 16.9 14.1 20.0 19.5 15.2 24.6 14.9 11.5 19.0141 74 67
Myeloma 4.2 2.9 5.8 6.0 3.8 9.0 2.8 1.4 4.837 24 13
Leukemia 12.3 9.9 15.0 16.5 12.5 21.5 9.5 6.7 13.099 58 41
All Other Sites 55.2 50.1 60.6 54.8 47.3 63.1 57.4 50.4 65.2458 204 254
DATA SOURCE: Illinois Department of Public Health, Illinois State Cancer Registry, data as of November 2018
Breast in Situ (not in total) 27.9 23.0 33.5 119
III - 66

All Sites Combined and Selected Sites, All Races, 2012-2016Figures include invasive cancer with the exception of urinary bladder (includes in situ) and breast cancer in situ as a separate category. Incidence counts are five-year totals.
Rates are per 100,000 age-adjustd to the 2000 U.S. standard million population. Lower confidence intervals (LCI) and upper confidence intervals (UCI) are 95 percent for rates,
Tiwari method.
Site Rate LCI UCI
Both Sexes Males Females
Cancer Incidence Counts and Five-year Age-adjusted Rates by Sex
Rate LCI UCI Rate LCI UCICount Count Count
Menard
All Sites 521.9 472.5 575.4 595.0 517.6 681.3 467.6 404.1 539.2444 231 213
Oral Cavity and Pharynx 18.1 9.5 31.6 33.1 16.3 60.3 4.3 0.5 18.714 12 2
Esophagus 4.6 1.2 13.0 5.0 0.5 20.8 4.2 0.5 18.64 2 2
Stomach 9.2 3.8 19.4 7.0 1.4 23.2 10.8 3.0 28.88 3 5
Colon and Rectum 47.3 33.1 65.8 60.5 36.8 94.2 36.8 21.3 61.039 21 18
Liver 5.9 2.1 14.3 10.0 3.2 26.6 1.8 0.0 14.76 5 1
Pancreas 18.2 10.3 30.6 19.1 8.1 40.1 17.2 7.3 36.316 8 8
Lung and Bronchus 87.1 68.1 110.2 110.6 78.7 151.9 69.9 48.1 99.976 42 34
Bones and Joints 0 0 0
Melanoma of the Skin 30.0 18.2 46.8 34.5 16.9 62.6 26.4 12.1 50.822 12 10
Breast (invasive) 70.3 53.1 91.7 134.6 101.6 176.061 0 61
Cervix 5.8 0.5 22.82
Corpus and Uterus, NOS 25.0 13.2 45.413
Ovary 9.6 3.1 25.55
Prostate 108.1 79.2 145.649
Testis 10.3 2.0 30.43
Urinary Bladder (includes in situ) 23.0 14.1 36.3 50.3 30.2 79.8 2.0 0.1 15.221 20 1
Kidney and Renal Pelvis 32.5 20.4 49.5 40.9 22.1 69.9 26.4 11.8 51.325 15 10
Brain and Nervous System 12.6 5.1 25.6 18.2 5.6 42.7 6.0 1.2 21.08 5 3
Hodgkin Lymphoma 3.2 0.4 11.8 6.3 0.7 23.32 0 2
Non-Hodgkin Lymphoma 21.4 12.5 35.0 23.3 10.3 46.5 19.5 8.8 39.418 9 9
Myeloma 3.8 0.7 12.3 5.4 0.6 21.9 2.4 0.1 16.13 2 1
Leukemia 13.8 6.8 25.5 19.8 7.8 42.2 9.2 2.4 26.211 7 4
All Other Sites 44.4 30.9 62.3 39.0 21.9 65.6 49.6 29.9 78.438 16 22
DATA SOURCE: Illinois Department of Public Health, Illinois State Cancer Registry, data as of November 2018
Breast in Situ (not in total) 32.2 16.4 57.6 13
III - 67

All Sites Combined and Selected Sites, All Races, 2012-2016Figures include invasive cancer with the exception of urinary bladder (includes in situ) and breast cancer in situ as a separate category. Incidence counts are five-year totals.
Rates are per 100,000 age-adjustd to the 2000 U.S. standard million population. Lower confidence intervals (LCI) and upper confidence intervals (UCI) are 95 percent for rates,
Tiwari method.
Site Rate LCI UCI
Both Sexes Males Females
Cancer Incidence Counts and Five-year Age-adjusted Rates by Sex
Rate LCI UCI Rate LCI UCICount Count Count
Mercer
All Sites 477.6 436.6 521.7 498.6 440.2 563.4 466.7 408.9 531.1545 281 264
Oral Cavity and Pharynx 14.1 8.1 23.5 23.4 12.6 41.3 5.0 0.9 17.417 14 3
Esophagus 4.2 1.3 10.8 7.1 1.9 20.4 1.7 0.0 12.45 4 1
Stomach 5.8 2.3 13.1 10.2 3.7 24.3 1.6 0.0 12.27 6 1
Colon and Rectum 36.9 26.5 50.7 48.6 32.0 71.9 26.7 14.5 46.044 28 16
Liver 3.1 0.8 9.3 7.4 2.0 21.04 4 0
Pancreas 13.6 7.7 23.0 16.4 7.8 32.4 10.4 3.7 24.816 10 6
Lung and Bronchus 80.1 64.8 98.4 79.9 58.2 108.1 80.1 59.5 107.099 47 52
Bones and Joints 1.3 0.0 7.4 2.5 0.1 14.51 0 1
Melanoma of the Skin 32.9 22.5 46.9 35.9 21.7 57.1 31.4 16.9 53.735 20 15
Breast (invasive) 61.5 47.2 79.1 1.6 0.0 12.3 119.2 91.3 153.969 1 68
Cervix 5.2 0.5 19.52
Corpus and Uterus, NOS 28.7 16.5 47.818
Ovary 12.0 5.1 26.18
Prostate 77.4 56.2 105.346
Testis 10.4 2.1 28.73
Urinary Bladder (includes in situ) 19.1 12.0 29.5 34.0 20.6 54.2 5.3 1.1 17.723 20 3
Kidney and Renal Pelvis 16.6 9.9 26.9 24.8 12.9 44.2 9.8 3.5 23.719 13 6
Brain and Nervous System 9.9 4.7 18.9 13.1 5.1 29.0 7.3 1.7 21.411 7 4
Hodgkin Lymphoma 1.8 0.0 8.9 3.7 0.1 18.01 1 0
Non-Hodgkin Lymphoma 26.3 17.1 39.1 22.1 11.1 40.6 30.5 16.6 52.028 12 16
Myeloma 4.3 1.4 11.0 8.8 2.8 22.75 5 0
Leukemia 19.4 11.3 31.4 13.6 5.1 30.1 25.9 12.7 47.219 7 12
All Other Sites 60.7 45.9 79.0 60.1 40.7 86.5 63.5 41.8 92.965 33 32
DATA SOURCE: Illinois Department of Public Health, Illinois State Cancer Registry, data as of November 2018
Breast in Situ (not in total) 16.7 7.8 32.8 10
III - 68

All Sites Combined and Selected Sites, All Races, 2012-2016Figures include invasive cancer with the exception of urinary bladder (includes in situ) and breast cancer in situ as a separate category. Incidence counts are five-year totals.
Rates are per 100,000 age-adjustd to the 2000 U.S. standard million population. Lower confidence intervals (LCI) and upper confidence intervals (UCI) are 95 percent for rates,
Tiwari method.
Site Rate LCI UCI
Both Sexes Males Females
Cancer Incidence Counts and Five-year Age-adjusted Rates by Sex
Rate LCI UCI Rate LCI UCICount Count Count
Monroe
All Sites 443.5 414.8 473.7 471.8 429.2 517.7 424.3 385.1 466.7939 479 460
Oral Cavity and Pharynx 20.8 15.1 28.2 33.0 22.7 46.7 9.7 4.7 18.246 35 11
Esophagus 7.9 4.7 12.7 14.3 8.0 24.0 1.9 0.4 7.019 16 3
Stomach 3.2 1.3 7.0 4.3 1.3 11.1 2.0 0.2 7.87 5 2
Colon and Rectum 37.9 30.0 47.4 47.9 35.2 64.1 29.9 20.5 42.783 49 34
Liver 2.5 0.9 5.9 3.8 1.0 10.5 1.3 0.2 6.36 4 2
Pancreas 13.8 9.2 20.2 16.4 9.0 27.5 11.8 6.3 20.629 15 14
Lung and Bronchus 52.9 43.6 63.8 60.5 45.9 78.5 47.5 35.6 62.5117 61 56
Bones and Joints 0.7 0.0 3.6 1.2 0.0 7.01 1 0
Melanoma of the Skin 27.8 20.7 36.6 35.4 24.2 50.1 21.3 12.9 33.355 34 21
Breast (invasive) 69.9 58.6 82.7 0.9 0.0 6.0 132.5 111.1 157.2144 1 143
Cervix 4.7 1.2 12.54
Corpus and Uterus, NOS 30.1 20.6 43.034
Ovary 9.4 4.8 17.312
Prostate 105.5 86.5 127.7115
Testis 6.0 1.6 15.04
Urinary Bladder (includes in situ) 14.9 10.0 21.4 25.6 16.2 38.6 6.1 2.4 13.431 24 7
Kidney and Renal Pelvis 20.1 14.3 27.7 26.5 17.1 39.6 15.2 8.4 25.642 26 16
Brain and Nervous System 9.0 5.0 14.9 5.4 1.9 12.7 12.7 6.0 23.616 6 10
Hodgkin Lymphoma 1.6 0.2 5.3 3.2 0.4 10.82 0 2
Non-Hodgkin Lymphoma 17.6 12.2 24.7 18.9 11.1 30.2 16.3 9.3 26.836 19 17
Myeloma 4.2 2.0 8.1 5.2 1.7 12.7 3.9 1.3 10.210 5 5
Leukemia 12.7 8.2 18.9 11.3 5.7 20.4 13.7 7.4 23.626 12 14
All Other Sites 49.5 40.0 60.6 49.8 36.3 66.9 50.9 37.7 67.4100 47 53
DATA SOURCE: Illinois Department of Public Health, Illinois State Cancer Registry, data as of November 2018
Breast in Situ (not in total) 37.5 26.3 52.0 39
III - 69
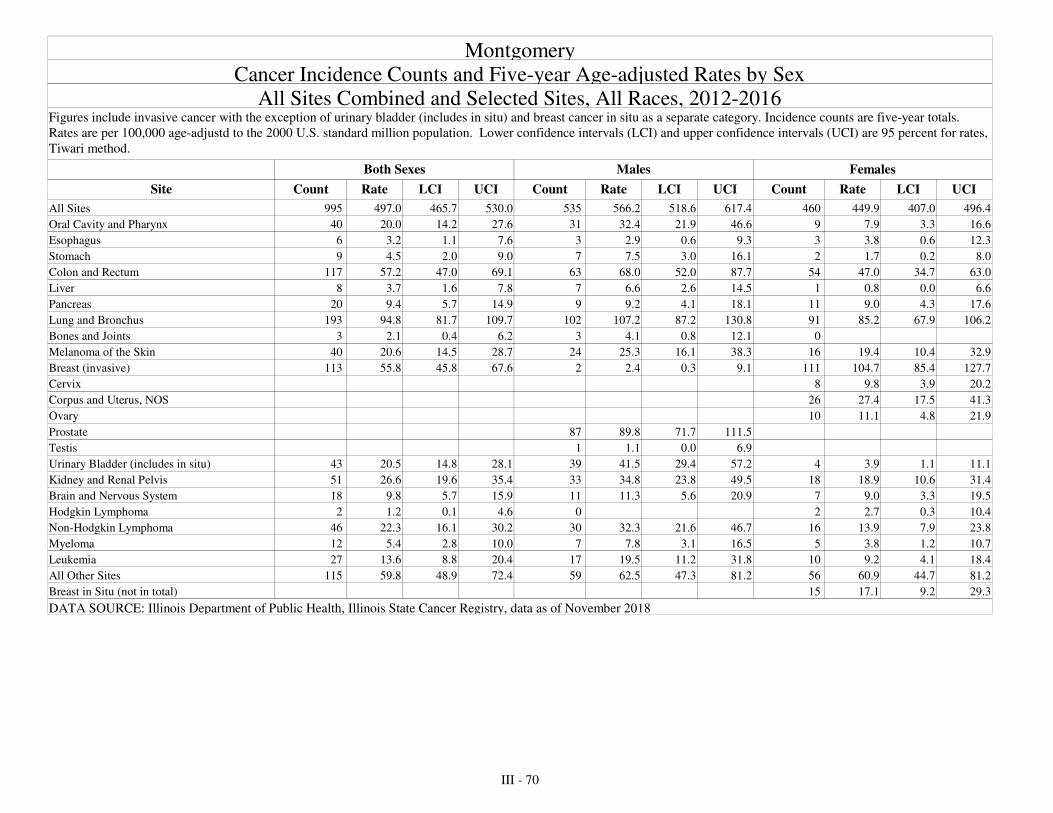
All Sites Combined and Selected Sites, All Races, 2012-2016Figures include invasive cancer with the exception of urinary bladder (includes in situ) and breast cancer in situ as a separate category. Incidence counts are five-year totals.
Rates are per 100,000 age-adjustd to the 2000 U.S. standard million population. Lower confidence intervals (LCI) and upper confidence intervals (UCI) are 95 percent for rates,
Tiwari method.
Site Rate LCI UCI
Both Sexes Males Females
Cancer Incidence Counts and Five-year Age-adjusted Rates by Sex
Rate LCI UCI Rate LCI UCICount Count Count
Montgomery
All Sites 497.0 465.7 530.0 566.2 518.6 617.4 449.9 407.0 496.4995 535 460
Oral Cavity and Pharynx 20.0 14.2 27.6 32.4 21.9 46.6 7.9 3.3 16.640 31 9
Esophagus 3.2 1.1 7.6 2.9 0.6 9.3 3.8 0.6 12.36 3 3
Stomach 4.5 2.0 9.0 7.5 3.0 16.1 1.7 0.2 8.09 7 2
Colon and Rectum 57.2 47.0 69.1 68.0 52.0 87.7 47.0 34.7 63.0117 63 54
Liver 3.7 1.6 7.8 6.6 2.6 14.5 0.8 0.0 6.68 7 1
Pancreas 9.4 5.7 14.9 9.2 4.1 18.1 9.0 4.3 17.620 9 11
Lung and Bronchus 94.8 81.7 109.7 107.2 87.2 130.8 85.2 67.9 106.2193 102 91
Bones and Joints 2.1 0.4 6.2 4.1 0.8 12.13 3 0
Melanoma of the Skin 20.6 14.5 28.7 25.3 16.1 38.3 19.4 10.4 32.940 24 16
Breast (invasive) 55.8 45.8 67.6 2.4 0.3 9.1 104.7 85.4 127.7113 2 111
Cervix 9.8 3.9 20.28
Corpus and Uterus, NOS 27.4 17.5 41.326
Ovary 11.1 4.8 21.910
Prostate 89.8 71.7 111.587
Testis 1.1 0.0 6.91
Urinary Bladder (includes in situ) 20.5 14.8 28.1 41.5 29.4 57.2 3.9 1.1 11.143 39 4
Kidney and Renal Pelvis 26.6 19.6 35.4 34.8 23.8 49.5 18.9 10.6 31.451 33 18
Brain and Nervous System 9.8 5.7 15.9 11.3 5.6 20.9 9.0 3.3 19.518 11 7
Hodgkin Lymphoma 1.2 0.1 4.6 2.7 0.3 10.42 0 2
Non-Hodgkin Lymphoma 22.3 16.1 30.2 32.3 21.6 46.7 13.9 7.9 23.846 30 16
Myeloma 5.4 2.8 10.0 7.8 3.1 16.5 3.8 1.2 10.712 7 5
Leukemia 13.6 8.8 20.4 19.5 11.2 31.8 9.2 4.1 18.427 17 10
All Other Sites 59.8 48.9 72.4 62.5 47.3 81.2 60.9 44.7 81.2115 59 56
DATA SOURCE: Illinois Department of Public Health, Illinois State Cancer Registry, data as of November 2018
Breast in Situ (not in total) 17.1 9.2 29.3 15
III - 70

All Sites Combined and Selected Sites, All Races, 2012-2016Figures include invasive cancer with the exception of urinary bladder (includes in situ) and breast cancer in situ as a separate category. Incidence counts are five-year totals.
Rates are per 100,000 age-adjustd to the 2000 U.S. standard million population. Lower confidence intervals (LCI) and upper confidence intervals (UCI) are 95 percent for rates,
Tiwari method.
Site Rate LCI UCI
Both Sexes Males Females
Cancer Incidence Counts and Five-year Age-adjusted Rates by Sex
Rate LCI UCI Rate LCI UCICount Count Count
Morgan
All Sites 537.6 507.0 569.8 607.7 560.8 657.7 493.8 452.0 538.61,233 650 583
Oral Cavity and Pharynx 18.4 13.0 25.5 23.2 14.5 35.2 14.5 8.1 24.240 23 17
Esophagus 5.6 3.1 9.8 10.1 5.0 18.5 2.3 0.5 7.814 11 3
Stomach 7.0 3.9 11.9 8.5 3.8 16.6 5.9 2.0 13.615 9 6
Colon and Rectum 46.0 37.6 55.9 62.2 47.7 79.9 32.0 23.2 43.8110 65 45
Liver 8.0 4.8 12.9 13.7 7.7 22.9 2.9 0.7 8.620 16 4
Pancreas 10.8 6.9 16.5 12.8 6.5 22.8 9.3 4.7 17.224 12 12
Lung and Bronchus 87.5 75.8 100.7 99.6 81.3 120.9 80.2 64.8 98.5209 108 101
Bones and Joints 1.0 0.1 4.0 2.2 0.2 8.52 0 2
Melanoma of the Skin 27.2 20.7 35.4 42.7 31.2 57.5 16.6 9.0 28.063 47 16
Breast (invasive) 74.4 62.9 87.5 143.8 121.2 169.6163 0 163
Cervix 5.4 1.7 13.05
Corpus and Uterus, NOS 26.6 18.2 38.034
Ovary 10.2 5.4 18.114
Prostate 124.9 104.8 148.0142
Testis 7.6 2.7 16.56
Urinary Bladder (includes in situ) 21.2 15.7 28.2 37.5 26.5 51.7 8.5 4.3 15.952 40 12
Kidney and Renal Pelvis 25.0 18.7 33.0 26.1 17.3 38.2 24.7 15.8 37.156 29 27
Brain and Nervous System 12.8 7.9 19.6 18.9 10.8 30.7 7.0 2.3 15.923 17 6
Hodgkin Lymphoma 4.8 2.0 9.5 4.6 1.2 11.8 5.4 1.4 13.88 4 4
Non-Hodgkin Lymphoma 19.5 14.1 26.4 24.3 15.4 36.6 15.0 9.2 23.945 24 21
Myeloma 7.7 4.5 12.5 10.8 5.5 19.5 5.4 1.9 12.518 12 6
Leukemia 12.8 8.4 18.9 16.1 9.3 26.4 10.5 5.0 19.828 17 11
All Other Sites 63.3 52.9 75.3 64.1 49.6 81.9 65.5 50.3 84.1142 68 74
DATA SOURCE: Illinois Department of Public Health, Illinois State Cancer Registry, data as of November 2018
Breast in Situ (not in total) 34.9 23.9 49.4 37
III - 71

All Sites Combined and Selected Sites, All Races, 2012-2016Figures include invasive cancer with the exception of urinary bladder (includes in situ) and breast cancer in situ as a separate category. Incidence counts are five-year totals.
Rates are per 100,000 age-adjustd to the 2000 U.S. standard million population. Lower confidence intervals (LCI) and upper confidence intervals (UCI) are 95 percent for rates,
Tiwari method.
Site Rate LCI UCI
Both Sexes Males Females
Cancer Incidence Counts and Five-year Age-adjusted Rates by Sex
Rate LCI UCI Rate LCI UCICount Count Count
Moultrie
All Sites 480.9 435.8 529.6 534.3 466.2 610.0 440.1 380.4 507.0448 232 216
Oral Cavity and Pharynx 14.9 7.7 26.1 31.0 16.1 54.313 13 0
Esophagus 6.8 2.4 15.4 11.9 3.7 28.9 2.2 0.1 13.86 5 1
Stomach 7.6 3.2 15.9 16.3 6.5 34.6 0.9 0.0 11.08 7 1
Colon and Rectum 43.6 31.5 59.2 50.3 31.7 76.7 40.0 24.4 62.945 23 22
Liver 1.9 0.2 7.9 3.9 0.5 16.32 2 0
Pancreas 16.5 9.4 27.5 23.0 11.0 43.3 10.6 3.7 25.216 10 6
Lung and Bronchus 68.4 52.6 87.8 73.4 50.0 104.6 64.5 44.0 92.265 32 33
Bones and Joints 1.0 0.0 6.6 2.0 0.1 13.51 1 0
Melanoma of the Skin 28.3 17.9 42.7 34.5 18.7 58.8 22.4 10.3 42.825 15 10
Breast (invasive) 60.6 44.8 80.3 6.4 0.7 22.6 109.0 79.8 145.754 2 52
Cervix 13.4 3.5 33.64
Corpus and Uterus, NOS 23.0 11.6 41.912
Ovary 26.4 13.0 48.112
Prostate 77.6 54.0 108.836
Testis 13.5 3.4 34.14
Urinary Bladder (includes in situ) 28.6 18.8 42.2 39.2 23.1 63.1 20.4 9.4 39.128 18 10
Kidney and Renal Pelvis 20.6 11.5 34.0 20.0 8.3 40.6 20.6 8.4 41.716 8 8
Brain and Nervous System 8.6 3.6 17.7 11.9 3.7 28.9 5.2 1.1 17.68 5 3
Hodgkin Lymphoma 3.0 0.3 10.7 6.2 0.7 22.02 2 0
Non-Hodgkin Lymphoma 30.0 19.6 44.3 48.2 29.5 74.9 15.9 5.9 34.328 21 7
Myeloma 7.6 3.0 16.3 6.8 1.4 21.3 8.3 2.2 22.77 3 4
Leukemia 14.8 7.9 25.6 17.1 6.8 36.2 11.4 4.4 26.014 7 7
All Other Sites 42.3 30.1 58.1 41.0 24.0 66.1 45.8 28.7 70.242 18 24
DATA SOURCE: Illinois Department of Public Health, Illinois State Cancer Registry, data as of November 2018
Breast in Situ (not in total) 27.8 15.1 47.9 15
III - 72

All Sites Combined and Selected Sites, All Races, 2012-2016Figures include invasive cancer with the exception of urinary bladder (includes in situ) and breast cancer in situ as a separate category. Incidence counts are five-year totals.
Rates are per 100,000 age-adjustd to the 2000 U.S. standard million population. Lower confidence intervals (LCI) and upper confidence intervals (UCI) are 95 percent for rates,
Tiwari method.
Site Rate LCI UCI
Both Sexes Males Females
Cancer Incidence Counts and Five-year Age-adjusted Rates by Sex
Rate LCI UCI Rate LCI UCICount Count Count
Ogle
All Sites 465.1 441.6 489.6 474.8 440.9 510.7 463.5 430.5 498.61,547 765 782
Oral Cavity and Pharynx 14.0 10.2 18.8 18.4 12.4 26.6 10.4 5.8 17.247 31 16
Esophagus 5.8 3.5 9.2 10.7 6.1 17.5 1.8 0.4 5.720 17 3
Stomach 6.4 3.9 10.0 8.5 4.5 14.9 4.7 1.9 9.721 13 8
Colon and Rectum 41.0 34.3 48.7 49.0 38.4 61.7 33.9 25.7 44.2138 77 61
Liver 4.2 2.4 7.2 8.3 4.5 14.4 0.5 0.0 3.615 14 1
Pancreas 10.2 7.2 14.3 15.4 9.9 23.2 6.5 3.4 11.937 25 12
Lung and Bronchus 68.6 60.0 78.1 83.8 70.0 99.7 57.0 46.4 69.5238 134 104
Bones and Joints 1.1 0.3 3.1 1.5 0.3 5.2 0.5 0.0 3.84 3 1
Melanoma of the Skin 28.7 22.8 35.6 27.4 19.5 37.5 30.6 22.1 41.389 42 47
Breast (invasive) 61.0 52.7 70.5 0.8 0.0 4.4 116.8 100.6 135.0199 1 198
Cervix 7.9 3.8 14.511
Corpus and Uterus, NOS 32.5 24.3 42.856
Ovary 12.6 7.6 19.721
Prostate 76.9 64.3 91.6135
Testis 6.7 2.8 13.38
Urinary Bladder (includes in situ) 22.5 17.7 28.2 37.4 28.4 48.4 9.8 5.7 16.179 61 18
Kidney and Renal Pelvis 20.2 15.5 25.8 24.1 17.2 33.2 16.5 10.7 24.668 41 27
Brain and Nervous System 6.7 3.9 10.7 6.0 2.5 12.0 7.6 3.6 14.218 8 10
Hodgkin Lymphoma 4.3 2.1 7.7 2.2 0.4 6.7 6.4 2.7 12.811 3 8
Non-Hodgkin Lymphoma 19.6 14.8 25.5 19.6 12.9 28.5 19.3 12.9 27.960 29 31
Myeloma 6.0 3.8 9.3 6.2 2.9 11.8 6.1 3.1 11.222 10 12
Leukemia 14.9 10.8 20.0 14.9 9.4 22.6 14.6 9.0 22.547 24 23
All Other Sites 62.7 54.1 72.3 57.1 45.5 70.8 67.5 55.2 81.8203 89 114
DATA SOURCE: Illinois Department of Public Health, Illinois State Cancer Registry, data as of November 2018
Breast in Situ (not in total) 20.6 14.1 29.2 34
III - 73

All Sites Combined and Selected Sites, All Races, 2012-2016Figures include invasive cancer with the exception of urinary bladder (includes in situ) and breast cancer in situ as a separate category. Incidence counts are five-year totals.
Rates are per 100,000 age-adjustd to the 2000 U.S. standard million population. Lower confidence intervals (LCI) and upper confidence intervals (UCI) are 95 percent for rates,
Tiwari method.
Site Rate LCI UCI
Both Sexes Males Females
Cancer Incidence Counts and Five-year Age-adjusted Rates by Sex
Rate LCI UCI Rate LCI UCICount Count Count
Peoria
All Sites 494.3 480.9 508.0 546.5 525.8 567.9 458.3 440.4 476.75,412 2,742 2,670
Oral Cavity and Pharynx 12.2 10.2 14.6 18.6 14.9 23.0 6.8 4.8 9.4133 93 40
Esophagus 6.9 5.4 8.7 12.8 9.8 16.4 2.1 1.1 3.777 64 13
Stomach 6.0 4.6 7.7 7.0 4.9 9.8 5.1 3.4 7.566 36 30
Colon and Rectum 45.0 41.0 49.2 55.0 48.5 62.1 36.4 31.7 41.8497 273 224
Liver 5.4 4.2 7.0 9.3 6.9 12.3 1.9 1.0 3.465 52 13
Pancreas 13.3 11.3 15.7 17.7 14.0 22.0 10.0 7.6 12.9149 84 65
Lung and Bronchus 83.1 77.7 88.7 98.4 89.8 107.7 71.3 64.7 78.6934 497 437
Bones and Joints 1.0 0.4 1.8 0.7 0.2 2.1 1.1 0.4 2.59 3 6
Melanoma of the Skin 25.4 22.4 28.7 35.8 30.5 41.7 17.9 14.5 21.9272 171 101
Breast (invasive) 73.8 68.6 79.4 0.6 0.1 1.9 137.8 127.9 148.2777 3 774
Cervix 8.8 6.3 12.043
Corpus and Uterus, NOS 27.0 22.9 31.6164
Ovary 10.3 7.8 13.462
Prostate 114.4 105.3 124.0619
Testis 6.0 3.8 8.925
Urinary Bladder (includes in situ) 21.8 19.1 24.8 38.2 32.8 44.2 9.0 6.7 11.7243 185 58
Kidney and Renal Pelvis 22.9 20.0 26.1 32.1 27.2 37.7 15.4 12.2 19.2242 158 84
Brain and Nervous System 6.1 4.6 7.8 7.1 4.9 10.0 5.5 3.6 7.964 35 29
Hodgkin Lymphoma 1.5 0.8 2.4 2.1 1.0 3.8 0.9 0.3 2.216 11 5
Non-Hodgkin Lymphoma 18.9 16.3 21.7 18.8 15.1 23.2 19.1 15.6 23.1207 93 114
Myeloma 5.7 4.3 7.3 7.1 4.8 10.1 4.4 2.9 6.561 33 28
Leukemia 11.2 9.2 13.5 14.1 10.9 18.1 9.0 6.6 12.0117 66 51
All Other Sites 54.5 50.0 59.3 50.6 44.3 57.6 58.4 52.0 65.4570 241 329
DATA SOURCE: Illinois Department of Public Health, Illinois State Cancer Registry, data as of November 2018
Breast in Situ (not in total) 33.2 28.5 38.5 189
III - 74

All Sites Combined and Selected Sites, All Races, 2012-2016Figures include invasive cancer with the exception of urinary bladder (includes in situ) and breast cancer in situ as a separate category. Incidence counts are five-year totals.
Rates are per 100,000 age-adjustd to the 2000 U.S. standard million population. Lower confidence intervals (LCI) and upper confidence intervals (UCI) are 95 percent for rates,
Tiwari method.
Site Rate LCI UCI
Both Sexes Males Females
Cancer Incidence Counts and Five-year Age-adjusted Rates by Sex
Rate LCI UCI Rate LCI UCICount Count Count
Perry
All Sites 478.2 441.7 517.2 504.0 450.8 562.1 474.4 421.1 533.1662 337 325
Oral Cavity and Pharynx 15.5 9.5 24.1 24.9 14.4 40.6 6.7 1.7 18.421 17 4
Esophagus 5.4 2.3 11.2 8.4 3.0 19.2 2.2 0.3 10.88 6 2
Stomach 2.6 0.7 7.3 4.0 0.8 13.0 0.9 0.0 8.84 3 1
Colon and Rectum 54.0 42.3 68.1 59.6 42.0 82.5 49.3 34.2 69.676 38 38
Liver 5.1 2.0 10.9 8.8 3.2 19.9 1.4 0.0 9.97 6 1
Pancreas 20.5 13.6 29.9 23.8 13.4 39.4 18.1 9.4 32.629 16 13
Lung and Bronchus 71.3 57.9 87.2 82.3 61.7 107.9 62.4 45.1 85.1101 55 46
Bones and Joints 0 0 0
Melanoma of the Skin 26.4 17.9 37.5 31.2 18.6 49.3 24.0 12.4 42.033 19 14
Breast (invasive) 60.9 48.1 76.3 123.8 96.8 156.482 0 82
Cervix 15.9 6.4 32.28
Corpus and Uterus, NOS 33.0 19.4 52.720
Ovary 5.0 1.3 15.04
Prostate 105.6 82.8 133.375
Testis 6.5 1.7 17.14
Urinary Bladder (includes in situ) 22.1 15.1 31.5 35.9 22.8 54.1 9.7 4.4 20.733 24 9
Kidney and Renal Pelvis 19.4 12.5 29.0 20.9 11.3 35.8 20.5 10.2 37.226 14 12
Brain and Nervous System 7.1 3.2 14.0 4.3 0.9 13.5 9.7 3.4 22.59 3 6
Hodgkin Lymphoma 3.1 0.6 8.9 1.8 0.0 10.0 5.2 0.6 17.63 1 2
Non-Hodgkin Lymphoma 16.1 10.0 24.9 12.5 5.3 25.2 19.0 10.2 33.322 8 14
Myeloma 4.3 1.5 9.8 6.9 2.2 17.2 1.6 0.0 10.36 5 1
Leukemia 11.3 6.4 18.9 12.4 4.9 25.7 11.6 5.2 23.716 7 9
All Other Sites 53.9 42.1 68.2 54.3 37.7 75.9 54.6 37.7 77.075 36 39
DATA SOURCE: Illinois Department of Public Health, Illinois State Cancer Registry, data as of November 2018
Breast in Situ (not in total) 19.5 10.4 34.3 14
III - 75

All Sites Combined and Selected Sites, All Races, 2012-2016Figures include invasive cancer with the exception of urinary bladder (includes in situ) and breast cancer in situ as a separate category. Incidence counts are five-year totals.
Rates are per 100,000 age-adjustd to the 2000 U.S. standard million population. Lower confidence intervals (LCI) and upper confidence intervals (UCI) are 95 percent for rates,
Tiwari method.
Site Rate LCI UCI
Both Sexes Males Females
Cancer Incidence Counts and Five-year Age-adjusted Rates by Sex
Rate LCI UCI Rate LCI UCICount Count Count
Piatt
All Sites 494.9 453.2 539.7 532.4 470.9 600.3 466.7 409.9 529.8553 286 267
Oral Cavity and Pharynx 11.1 5.8 19.8 8.1 2.6 21.0 13.1 5.5 27.813 5 8
Esophagus 3.5 0.9 9.8 5.6 1.1 18.2 1.7 0.0 12.04 3 1
Stomach 9.7 4.8 18.1 19.7 9.3 37.3 1.7 0.0 12.011 10 1
Colon and Rectum 43.2 31.4 58.3 54.8 36.2 80.2 31.9 18.4 52.547 29 18
Liver 6.7 2.9 14.1 10.8 3.9 25.1 3.2 0.4 14.08 6 2
Pancreas 14.4 8.1 24.3 15.8 6.5 32.7 12.6 5.4 26.716 8 8
Lung and Bronchus 72.3 57.3 90.5 86.7 63.0 117.1 60.4 42.0 85.183 46 37
Bones and Joints 0 0 0
Melanoma of the Skin 47.9 34.5 64.9 54.0 34.8 80.4 44.4 26.2 70.647 27 20
Breast (invasive) 58.1 44.3 75.2 111.1 84.6 144.164 0 64
Cervix 7.3 1.9 20.54
Corpus and Uterus, NOS 21.7 11.2 39.213
Ovary 17.1 7.3 34.59
Prostate 114.6 88.2 147.466
Testis 4.2 0.4 16.62
Urinary Bladder (includes in situ) 12.0 6.5 20.9 22.6 11.6 40.7 3.0 0.4 13.714 12 2
Kidney and Renal Pelvis 12.7 7.1 21.7 14.1 6.0 29.4 11.3 4.5 25.115 8 7
Brain and Nervous System 6.3 2.5 13.8 7.8 2.1 21.3 5.5 1.0 17.97 4 3
Hodgkin Lymphoma 0 0 0
Non-Hodgkin Lymphoma 19.2 11.6 30.2 19.5 9.0 37.4 18.2 8.8 34.821 10 11
Myeloma 5.8 2.3 12.9 6.0 1.2 18.8 5.8 1.6 17.57 3 4
Leukemia 14.4 7.9 24.5 16.2 6.8 33.2 12.5 4.8 27.715 8 7
All Other Sites 77.5 61.5 96.6 72.1 50.8 100.2 84.2 61.1 113.987 39 48
DATA SOURCE: Illinois Department of Public Health, Illinois State Cancer Registry, data as of November 2018
Breast in Situ (not in total) 31.4 17.4 52.6 16
III - 76

All Sites Combined and Selected Sites, All Races, 2012-2016Figures include invasive cancer with the exception of urinary bladder (includes in situ) and breast cancer in situ as a separate category. Incidence counts are five-year totals.
Rates are per 100,000 age-adjustd to the 2000 U.S. standard million population. Lower confidence intervals (LCI) and upper confidence intervals (UCI) are 95 percent for rates,
Tiwari method.
Site Rate LCI UCI
Both Sexes Males Females
Cancer Incidence Counts and Five-year Age-adjusted Rates by Sex
Rate LCI UCI Rate LCI UCICount Count Count
Pike
All Sites 504.2 461.7 550.0 543.2 480.8 612.0 486.1 426.0 552.9563 288 275
Oral Cavity and Pharynx 14.4 7.5 25.1 20.7 9.8 39.1 9.5 2.1 26.414 10 4
Esophagus 6.8 3.1 13.9 13.0 5.6 27.5 1.4 0.0 11.79 8 1
Stomach 4.3 1.3 11.2 9.5 3.0 23.75 5 0
Colon and Rectum 48.8 35.8 65.2 63.6 42.7 91.6 34.4 19.9 56.154 32 22
Liver 4.9 1.8 11.6 6.6 1.8 18.9 3.1 0.4 14.26 4 2
Pancreas 17.3 10.7 27.3 20.6 10.2 38.1 15.3 7.2 30.421 11 10
Lung and Bronchus 72.7 58.1 90.3 98.1 73.3 129.5 54.5 37.6 77.988 53 35
Bones and Joints 1.5 0.0 7.8 3.2 0.1 16.41 0 1
Melanoma of the Skin 35.5 24.0 50.7 21.1 10.4 39.0 51.6 31.1 80.134 11 23
Breast (invasive) 63.8 49.1 81.8 122.9 94.1 158.569 0 69
Cervix 10.4 2.4 28.04
Corpus and Uterus, NOS 20.4 10.8 36.713
Ovary 9.4 2.3 25.44
Prostate 95.6 71.8 125.856
Testis 11.9 3.2 29.74
Urinary Bladder (includes in situ) 30.1 21.0 42.3 52.0 34.1 76.7 15.1 7.1 30.037 27 10
Kidney and Renal Pelvis 15.2 8.5 25.5 21.8 10.7 40.3 9.0 2.7 23.316 11 5
Brain and Nervous System 2.8 0.3 10.0 3.6 0.1 17.1 1.7 0.0 12.32 1 1
Hodgkin Lymphoma 1.5 0.0 7.8 2.8 0.1 14.81 1 0
Non-Hodgkin Lymphoma 15.0 8.9 24.5 21.8 11.2 39.4 10.2 3.7 24.318 12 6
Myeloma 10.1 5.1 18.4 7.6 2.1 20.9 12.8 5.4 27.412 4 8
Leukemia 19.7 11.8 31.1 15.1 6.4 31.2 23.8 11.7 43.520 8 12
All Other Sites 66.4 51.5 84.6 57.7 38.6 83.7 77.5 54.6 107.475 30 45
DATA SOURCE: Illinois Department of Public Health, Illinois State Cancer Registry, data as of November 2018
Breast in Situ (not in total) 19.0 9.1 36.0 11
III - 77

All Sites Combined and Selected Sites, All Races, 2012-2016Figures include invasive cancer with the exception of urinary bladder (includes in situ) and breast cancer in situ as a separate category. Incidence counts are five-year totals.
Rates are per 100,000 age-adjustd to the 2000 U.S. standard million population. Lower confidence intervals (LCI) and upper confidence intervals (UCI) are 95 percent for rates,
Tiwari method.
Site Rate LCI UCI
Both Sexes Males Females
Cancer Incidence Counts and Five-year Age-adjusted Rates by Sex
Rate LCI UCI Rate LCI UCICount Count Count
Pope
All Sites 504.6 424.1 598.1 603.5 478.5 754.7 402.1 307.1 524.5172 102 70
Oral Cavity and Pharynx 25.8 11.2 55.9 41.0 15.5 96.6 9.1 1.1 57.39 7 2
Esophagus 0 0 0
Stomach 2.4 0.1 24.5 4.7 0.1 52.61 0 1
Colon and Rectum 34.8 15.9 69.5 43.1 12.6 108.4 28.5 10.3 81.012 6 6
Liver 6.0 0.7 29.7 7.2 0.2 51.7 4.7 0.1 52.62 1 1
Pancreas 15.3 6.1 39.9 13.1 2.7 56.4 17.6 4.8 67.17 3 4
Lung and Bronchus 80.5 54.3 119.6 81.5 47.2 141.7 80.6 43.3 148.832 17 15
Bones and Joints 0 0 0
Melanoma of the Skin 28.3 10.3 63.8 44.1 12.8 110.5 11.5 1.3 62.08 6 2
Breast (invasive) 37.5 20.3 68.9 3.9 0.1 45.2 73.8 38.9 139.714 1 13
Cervix 28.3 3.4 98.42
Corpus and Uterus, NOS 8.5 1.0 56.42
Ovary 25.4 6.8 80.54
Prostate 118.4 75.9 185.725
Testis 0
Urinary Bladder (includes in situ) 27.6 9.8 62.9 48.5 15.5 115.8 4.2 0.1 51.77 6 1
Kidney and Renal Pelvis 50.4 25.8 90.9 83.2 38.4 159.7 15.6 3.2 66.015 12 3
Brain and Nervous System 6.6 0.8 30.9 6.8 0.2 50.7 7.3 0.2 57.32 1 1
Hodgkin Lymphoma 0 0 0
Non-Hodgkin Lymphoma 29.4 12.7 62.0 39.4 11.9 100.3 18.7 5.1 68.910 6 4
Myeloma 0 0 0
Leukemia 5.1 0.6 27.9 4.7 0.1 46.6 6.1 0.2 55.02 1 1
All Other Sites 63.3 33.7 109.5 68.6 27.9 142.2 57.4 22.1 128.418 10 8
DATA SOURCE: Illinois Department of Public Health, Illinois State Cancer Registry, data as of November 2018
Breast in Situ (not in total) 26.7 7.2 82.7 4
III - 78

All Sites Combined and Selected Sites, All Races, 2012-2016Figures include invasive cancer with the exception of urinary bladder (includes in situ) and breast cancer in situ as a separate category. Incidence counts are five-year totals.
Rates are per 100,000 age-adjustd to the 2000 U.S. standard million population. Lower confidence intervals (LCI) and upper confidence intervals (UCI) are 95 percent for rates,
Tiwari method.
Site Rate LCI UCI
Both Sexes Males Females
Cancer Incidence Counts and Five-year Age-adjusted Rates by Sex
Rate LCI UCI Rate LCI UCICount Count Count
Pulaski
All Sites 530.1 458.7 610.6 625.8 513.6 757.4 455.6 365.2 563.8219 120 99
Oral Cavity and Pharynx 12.2 4.5 30.1 24.0 7.6 62.5 3.5 0.1 31.06 5 1
Esophagus 7.1 1.4 23.9 9.0 1.1 40.9 5.9 0.1 36.33 2 1
Stomach 7.0 1.4 23.6 9.6 1.1 42.3 4.7 0.1 33.63 2 1
Colon and Rectum 36.7 20.3 62.7 56.8 26.0 110.1 22.3 8.1 55.916 10 6
Liver 6.2 1.2 22.3 9.3 1.1 41.9 3.5 0.1 31.03 2 1
Pancreas 19.6 8.0 41.7 18.7 3.4 59.2 18.7 6.0 51.48 3 5
Lung and Bronchus 117.3 86.4 157.3 156.4 104.7 227.7 87.6 52.5 141.151 31 20
Bones and Joints 0 0 0
Melanoma of the Skin 19.7 8.9 40.4 28.2 10.2 67.8 11.9 2.4 42.99 6 3
Breast (invasive) 51.2 30.6 81.8 97.1 57.9 155.421 0 21
Cervix 9.7 0.2 47.11
Corpus and Uterus, NOS 53.8 24.1 105.110
Ovary 3.2 0.1 30.41
Prostate 113.9 71.9 175.424
Testis 11.8 0.3 55.01
Urinary Bladder (includes in situ) 28.7 14.4 53.0 49.1 21.7 98.4 10.6 2.1 40.412 9 3
Kidney and Renal Pelvis 28.3 12.6 55.2 37.6 12.4 87.2 20.3 4.8 58.210 6 4
Brain and Nervous System 4.4 0.5 19.8 4.3 0.1 34.2 4.2 0.1 32.52 1 1
Hodgkin Lymphoma 10.3 1.2 33.9 11.8 0.3 55.0 9.7 0.2 47.12 1 1
Non-Hodgkin Lymphoma 18.1 7.8 38.5 18.4 5.0 54.2 18.1 4.8 52.68 4 4
Myeloma 4.6 0.1 23.0 9.2 0.2 45.61 0 1
Leukemia 21.6 8.4 46.0 27.6 7.2 72.8 16.0 3.2 51.07 4 3
All Other Sites 43.6 26.4 69.9 39.4 17.8 81.2 45.6 22.3 87.720 9 11
DATA SOURCE: Illinois Department of Public Health, Illinois State Cancer Registry, data as of November 2018
Breast in Situ (not in total) 4.7 0.1 33.6 1
III - 79

All Sites Combined and Selected Sites, All Races, 2012-2016Figures include invasive cancer with the exception of urinary bladder (includes in situ) and breast cancer in situ as a separate category. Incidence counts are five-year totals.
Rates are per 100,000 age-adjustd to the 2000 U.S. standard million population. Lower confidence intervals (LCI) and upper confidence intervals (UCI) are 95 percent for rates,
Tiwari method.
Site Rate LCI UCI
Both Sexes Males Females
Cancer Incidence Counts and Five-year Age-adjusted Rates by Sex
Rate LCI UCI Rate LCI UCICount Count Count
Putnam
All Sites 438.9 377.8 508.5 561.7 461.9 679.4 343.1 268.0 436.4202 122 80
Oral Cavity and Pharynx 14.6 5.8 33.8 29.1 11.4 67.27 7 0
Esophagus 5.5 0.7 22.7 11.3 1.4 45.42 2 0
Stomach 5.7 1.2 21.6 11.4 2.3 42.73 3 0
Colon and Rectum 45.9 27.9 73.4 65.2 34.7 115.6 26.3 10.3 63.521 14 7
Liver 0 0 0
Pancreas 10.0 3.2 27.5 17.5 4.3 53.0 5.0 0.1 36.75 4 1
Lung and Bronchus 87.6 62.8 121.2 128.3 83.9 191.5 56.8 30.7 102.642 28 14
Bones and Joints 7.5 0.7 28.4 4.2 0.1 33.5 11.0 0.3 53.22 1 1
Melanoma of the Skin 26.8 12.8 51.2 25.9 10.2 61.7 27.3 7.4 72.312 7 5
Breast (invasive) 57.6 36.8 87.9 115.4 73.7 176.626 0 26
Cervix 3.5 0.1 33.71
Corpus and Uterus, NOS 24.9 9.9 60.87
Ovary 8.7 1.0 41.52
Prostate 102.7 66.4 156.726
Testis 0
Urinary Bladder (includes in situ) 33.7 17.9 59.7 65.8 32.8 120.2 7.2 0.8 38.414 12 2
Kidney and Renal Pelvis 14.2 5.6 33.1 20.6 6.4 56.0 7.0 0.8 38.17 5 2
Brain and Nervous System 8.0 1.6 26.0 11.0 1.3 44.7 5.0 0.1 36.73 2 1
Hodgkin Lymphoma 1.9 0.0 16.6 4.0 0.1 34.61 0 1
Non-Hodgkin Lymphoma 3.8 0.5 19.1 6.9 0.2 40.0 3.3 0.1 33.32 1 1
Myeloma 5.8 1.2 21.8 6.9 0.2 40.0 7.7 0.9 39.33 1 2
Leukemia 6.6 1.3 23.3 13.4 2.6 46.73 3 0
All Other Sites 33.7 16.4 62.1 41.4 13.7 94.3 29.9 11.3 70.413 6 7
DATA SOURCE: Illinois Department of Public Health, Illinois State Cancer Registry, data as of November 2018
Breast in Situ (not in total) 33.5 15.1 72.4 9
III - 80

All Sites Combined and Selected Sites, All Races, 2012-2016Figures include invasive cancer with the exception of urinary bladder (includes in situ) and breast cancer in situ as a separate category. Incidence counts are five-year totals.
Rates are per 100,000 age-adjustd to the 2000 U.S. standard million population. Lower confidence intervals (LCI) and upper confidence intervals (UCI) are 95 percent for rates,
Tiwari method.
Site Rate LCI UCI
Both Sexes Males Females
Cancer Incidence Counts and Five-year Age-adjusted Rates by Sex
Rate LCI UCI Rate LCI UCICount Count Count
Randolph
All Sites 489.6 460.0 520.8 538.5 494.1 586.0 476.0 432.4 523.11,068 565 503
Oral Cavity and Pharynx 15.4 10.6 22.0 22.8 14.6 34.3 8.1 3.3 17.034 25 9
Esophagus 4.0 1.8 7.9 9.0 4.0 17.69 9 0
Stomach 7.9 4.5 12.9 10.7 5.3 19.6 5.7 1.9 13.717 11 6
Colon and Rectum 48.8 39.9 59.4 51.9 38.6 68.4 42.8 31.7 57.2108 53 55
Liver 7.0 4.0 11.7 12.8 6.9 22.0 1.7 0.2 7.716 14 2
Pancreas 14.4 9.8 20.6 17.9 10.5 28.7 11.9 6.4 21.132 18 14
Lung and Bronchus 78.3 66.9 91.2 96.2 77.9 117.7 67.6 52.5 86.3174 100 74
Bones and Joints 0.8 0.0 4.0 1.6 0.0 8.61 0 1
Melanoma of the Skin 19.1 13.6 26.4 20.9 13.1 31.9 17.9 10.0 29.741 23 18
Breast (invasive) 57.2 47.1 68.9 0.7 0.0 5.5 121.6 99.3 147.7120 1 119
Cervix 4.2 0.8 12.43
Corpus and Uterus, NOS 41.8 29.8 57.544
Ovary 6.7 3.0 14.19
Prostate 80.7 64.6 99.991
Testis 7.5 3.0 15.77
Urinary Bladder (includes in situ) 23.6 17.5 31.4 42.2 30.2 57.5 8.5 3.7 17.352 42 10
Kidney and Renal Pelvis 28.4 21.7 36.7 38.3 27.5 52.2 18.7 11.0 30.263 43 20
Brain and Nervous System 4.4 2.1 8.6 3.8 1.0 10.4 6.4 2.1 15.110 4 6
Hodgkin Lymphoma 0.9 0.1 3.7 1.1 0.0 6.3 0.8 0.0 6.42 1 1
Non-Hodgkin Lymphoma 24.9 18.3 33.2 28.0 18.5 40.9 22.5 13.4 35.550 28 22
Myeloma 5.3 2.6 9.8 6.7 2.7 14.4 4.1 1.0 11.511 7 4
Leukemia 18.1 12.9 24.9 27.1 17.7 40.0 12.9 6.8 22.941 27 14
All Other Sites 62.8 52.3 74.9 60.2 45.8 77.9 70.6 54.1 91.0133 61 72
DATA SOURCE: Illinois Department of Public Health, Illinois State Cancer Registry, data as of November 2018
Breast in Situ (not in total) 26.6 17.3 39.6 28
III - 81

All Sites Combined and Selected Sites, All Races, 2012-2016Figures include invasive cancer with the exception of urinary bladder (includes in situ) and breast cancer in situ as a separate category. Incidence counts are five-year totals.
Rates are per 100,000 age-adjustd to the 2000 U.S. standard million population. Lower confidence intervals (LCI) and upper confidence intervals (UCI) are 95 percent for rates,
Tiwari method.
Site Rate LCI UCI
Both Sexes Males Females
Cancer Incidence Counts and Five-year Age-adjusted Rates by Sex
Rate LCI UCI Rate LCI UCICount Count Count
Richland
All Sites 496.1 453.8 541.5 523.1 462.2 590.5 483.9 424.5 549.8545 276 269
Oral Cavity and Pharynx 11.0 5.3 20.6 19.2 8.4 37.7 3.8 0.5 15.411 9 2
Esophagus 6.7 2.3 15.2 9.2 2.3 24.7 4.6 0.5 17.56 4 2
Stomach 1.5 0.2 6.8 3.8 0.5 15.52 2 0
Colon and Rectum 62.1 47.4 80.3 66.3 45.6 93.9 60.7 40.2 88.366 34 32
Liver 3.4 0.9 9.7 5.5 1.1 17.9 1.6 0.0 11.84 3 1
Pancreas 13.6 7.7 22.8 20.3 10.1 37.6 8.4 2.7 21.516 11 5
Lung and Bronchus 93.0 75.7 113.5 103.6 78.0 135.7 83.2 60.5 112.4105 56 49
Bones and Joints 0 0 0
Melanoma of the Skin 22.4 14.1 34.0 24.3 12.9 42.7 21.8 10.4 40.624 13 11
Breast (invasive) 68.7 53.4 87.3 131.2 101.6 167.473 0 73
Cervix 8.7 2.3 23.34
Corpus and Uterus, NOS 34.8 19.5 57.617
Ovary 3.2 0.4 14.12
Prostate 97.8 73.6 128.555
Testis 12.0 3.2 30.04
Urinary Bladder (includes in situ) 20.7 13.6 31.0 42.1 26.6 64.3 5.7 1.5 17.427 23 4
Kidney and Renal Pelvis 19.2 12.1 29.5 20.3 10.4 37.0 17.2 8.5 32.723 12 11
Brain and Nervous System 4.9 1.8 11.6 8.7 2.8 22.1 1.6 0.0 11.86 5 1
Hodgkin Lymphoma 0.7 0.0 5.8 1.5 0.0 11.61 1 0
Non-Hodgkin Lymphoma 14.1 8.0 23.5 15.0 6.4 30.9 12.9 5.6 27.216 8 8
Myeloma 4.0 1.3 10.3 9.4 3.0 23.35 5 0
Leukemia 19.8 12.1 31.1 26.0 13.1 46.5 13.9 6.2 28.722 12 10
All Other Sites 54.9 40.8 72.5 38.1 22.7 60.8 70.8 48.1 100.856 19 37
DATA SOURCE: Illinois Department of Public Health, Illinois State Cancer Registry, data as of November 2018
Breast in Situ (not in total) 20.5 9.8 38.5 11
III - 82

All Sites Combined and Selected Sites, All Races, 2012-2016Figures include invasive cancer with the exception of urinary bladder (includes in situ) and breast cancer in situ as a separate category. Incidence counts are five-year totals.
Rates are per 100,000 age-adjustd to the 2000 U.S. standard million population. Lower confidence intervals (LCI) and upper confidence intervals (UCI) are 95 percent for rates,
Tiwari method.
Site Rate LCI UCI
Both Sexes Males Females
Cancer Incidence Counts and Five-year Age-adjusted Rates by Sex
Rate LCI UCI Rate LCI UCICount Count Count
Rock Island
All Sites 452.5 438.6 466.7 488.7 467.9 510.3 431.0 411.9 450.84,284 2,166 2,118
Oral Cavity and Pharynx 11.7 9.6 14.2 16.3 12.8 20.7 7.8 5.5 10.9114 75 39
Esophagus 5.7 4.3 7.5 10.5 7.7 14.1 1.8 0.8 3.556 47 9
Stomach 6.4 4.8 8.4 8.3 5.7 11.7 4.9 3.1 7.560 34 26
Colon and Rectum 37.4 33.5 41.7 46.1 39.8 53.2 30.3 25.5 35.8354 199 155
Liver 6.9 5.3 8.9 12.5 9.4 16.3 1.9 0.8 3.868 59 9
Pancreas 13.9 11.6 16.5 15.2 11.7 19.5 12.8 9.9 16.5136 67 69
Lung and Bronchus 64.1 59.1 69.4 75.4 67.4 84.0 55.2 49.0 62.2634 340 294
Bones and Joints 0.2 0.0 0.9 0.2 0.0 1.3 0.3 0.0 1.62 1 1
Melanoma of the Skin 25.6 22.3 29.3 29.0 24.0 34.8 24.5 19.8 30.0228 123 105
Breast (invasive) 64.9 59.7 70.6 1.2 0.4 3.0 122.5 112.4 133.3600 5 595
Cervix 10.9 7.6 15.238
Corpus and Uterus, NOS 29.6 25.0 34.9153
Ovary 11.3 8.4 14.858
Prostate 98.1 89.3 107.6470
Testis 8.5 5.6 12.328
Urinary Bladder (includes in situ) 23.0 20.1 26.3 39.9 34.2 46.5 9.7 7.2 12.8230 175 55
Kidney and Renal Pelvis 16.5 13.9 19.5 20.6 16.5 25.5 13.0 9.8 17.0151 90 61
Brain and Nervous System 7.3 5.5 9.4 6.2 4.1 9.2 8.3 5.7 11.863 27 36
Hodgkin Lymphoma 3.9 2.6 5.6 4.6 2.6 7.4 3.1 1.6 5.530 17 13
Non-Hodgkin Lymphoma 16.7 14.1 19.7 19.6 15.6 24.4 14.4 11.1 18.5156 85 71
Myeloma 5.6 4.2 7.4 7.8 5.4 10.9 4.0 2.4 6.257 36 21
Leukemia 11.4 9.3 14.0 14.3 10.8 18.6 9.4 6.7 12.9102 59 43
All Other Sites 54.0 49.2 59.2 54.3 47.4 62.0 55.1 48.3 62.6496 229 267
DATA SOURCE: Illinois Department of Public Health, Illinois State Cancer Registry, data as of November 2018
Breast in Situ (not in total) 26.9 22.2 32.4 126
III - 83

All Sites Combined and Selected Sites, All Races, 2012-2016Figures include invasive cancer with the exception of urinary bladder (includes in situ) and breast cancer in situ as a separate category. Incidence counts are five-year totals.
Rates are per 100,000 age-adjustd to the 2000 U.S. standard million population. Lower confidence intervals (LCI) and upper confidence intervals (UCI) are 95 percent for rates,
Tiwari method.
Site Rate LCI UCI
Both Sexes Males Females
Cancer Incidence Counts and Five-year Age-adjusted Rates by Sex
Rate LCI UCI Rate LCI UCICount Count Count
Saline
All Sites 501.3 466.8 537.9 558.9 505.7 616.4 460.8 415.1 510.4840 428 412
Oral Cavity and Pharynx 15.9 10.0 24.2 25.7 14.9 41.4 7.1 2.5 16.624 18 6
Esophagus 8.5 4.5 14.8 15.8 7.6 29.0 2.9 0.6 10.114 11 3
Stomach 6.2 3.1 11.7 8.5 3.4 18.5 4.4 1.1 12.811 7 4
Colon and Rectum 51.8 41.0 64.7 65.0 47.5 87.2 39.3 27.1 55.884 48 36
Liver 6.3 3.1 11.7 10.6 4.5 21.7 2.8 0.6 9.911 8 3
Pancreas 8.5 4.8 14.3 8.3 3.3 18.1 8.2 3.7 17.116 7 9
Lung and Bronchus 84.4 71.3 99.5 96.9 76.1 122.0 76.3 59.7 96.7151 77 74
Bones and Joints 0 0 0
Melanoma of the Skin 25.1 17.3 35.3 25.3 14.4 41.2 24.9 14.5 40.138 18 20
Breast (invasive) 59.7 48.1 73.5 1.5 0.0 8.9 110.3 88.5 136.399 1 98
Cervix 12.2 4.7 25.57
Corpus and Uterus, NOS 33.0 22.1 48.131
Ovary 3.8 0.7 12.23
Prostate 108.1 86.6 133.890
Testis 4.3 0.5 14.52
Urinary Bladder (includes in situ) 22.1 15.7 30.5 34.6 22.7 51.1 12.6 6.7 22.940 27 13
Kidney and Renal Pelvis 26.2 19.0 35.5 35.8 23.7 52.4 18.0 10.3 30.246 29 17
Brain and Nervous System 8.9 4.6 15.8 7.3 2.6 17.0 10.8 4.1 23.013 6 7
Hodgkin Lymphoma 1.6 0.2 5.8 2.0 0.1 10.3 1.0 0.0 7.62 1 1
Non-Hodgkin Lymphoma 15.1 9.7 22.6 16.3 8.3 29.1 13.9 7.5 24.726 12 14
Myeloma 8.2 4.6 14.0 12.4 5.6 24.1 5.4 2.0 13.515 9 6
Leukemia 11.1 6.3 18.4 13.5 5.9 26.3 8.2 3.4 17.717 9 8
All Other Sites 65.2 52.5 80.1 67.0 48.9 90.0 65.7 48.1 87.9100 48 52
DATA SOURCE: Illinois Department of Public Health, Illinois State Cancer Registry, data as of November 2018
Breast in Situ (not in total) 15.4 7.8 27.8 13
III - 84

All Sites Combined and Selected Sites, All Races, 2012-2016Figures include invasive cancer with the exception of urinary bladder (includes in situ) and breast cancer in situ as a separate category. Incidence counts are five-year totals.
Rates are per 100,000 age-adjustd to the 2000 U.S. standard million population. Lower confidence intervals (LCI) and upper confidence intervals (UCI) are 95 percent for rates,
Tiwari method.
Site Rate LCI UCI
Both Sexes Males Females
Cancer Incidence Counts and Five-year Age-adjusted Rates by Sex
Rate LCI UCI Rate LCI UCICount Count Count
Sangamon
All Sites 528.7 515.5 542.1 583.7 563.0 605.0 492.3 474.9 510.26,439 3,182 3,257
Oral Cavity and Pharynx 15.6 13.4 18.1 24.7 20.7 29.3 7.7 5.7 10.3194 142 52
Esophagus 4.3 3.3 5.7 7.7 5.6 10.5 1.7 0.8 3.056 44 12
Stomach 6.2 4.8 7.8 7.2 5.0 9.9 5.2 3.6 7.472 38 34
Colon and Rectum 44.0 40.2 48.0 52.5 46.3 59.3 37.3 32.8 42.3535 274 261
Liver 7.7 6.2 9.4 12.2 9.5 15.5 3.9 2.5 5.7100 73 27
Pancreas 12.0 10.1 14.1 13.3 10.4 16.8 11.0 8.6 13.8152 75 77
Lung and Bronchus 80.9 75.9 86.2 95.5 87.2 104.4 70.8 64.5 77.51,008 516 492
Bones and Joints 1.3 0.7 2.2 2.0 1.0 3.7 0.7 0.2 1.915 11 4
Melanoma of the Skin 26.4 23.5 29.7 27.8 23.4 32.9 26.8 22.6 31.5307 148 159
Breast (invasive) 80.3 75.1 85.7 2.0 1.0 3.6 145.5 136.0 155.5959 12 947
Cervix 8.1 5.8 11.144
Corpus and Uterus, NOS 22.0 18.6 25.9157
Ovary 13.9 11.1 17.393
Prostate 122.8 113.7 132.5713
Testis 8.5 5.9 11.737
Urinary Bladder (includes in situ) 23.9 21.2 26.8 42.8 37.2 48.9 9.9 7.7 12.6298 226 72
Kidney and Renal Pelvis 25.0 22.2 28.1 34.4 29.5 39.8 17.3 14.2 21.0307 192 115
Brain and Nervous System 6.8 5.3 8.5 6.3 4.3 9.0 7.2 5.1 9.974 33 41
Hodgkin Lymphoma 3.0 2.0 4.3 2.6 1.4 4.5 3.4 2.0 5.530 13 17
Non-Hodgkin Lymphoma 22.8 20.1 25.8 29.5 25.0 34.7 17.4 14.4 21.0277 155 122
Myeloma 6.4 5.1 8.1 8.1 5.8 11.0 5.5 3.8 7.681 43 38
Leukemia 16.5 14.2 19.1 21.9 17.9 26.5 12.2 9.6 15.3193 113 80
All Other Sites 62.9 58.3 67.8 61.8 55.1 69.2 64.8 58.4 71.7737 324 413
DATA SOURCE: Illinois Department of Public Health, Illinois State Cancer Registry, data as of November 2018
Breast in Situ (not in total) 40.6 35.5 46.2 252
III - 85

All Sites Combined and Selected Sites, All Races, 2012-2016Figures include invasive cancer with the exception of urinary bladder (includes in situ) and breast cancer in situ as a separate category. Incidence counts are five-year totals.
Rates are per 100,000 age-adjustd to the 2000 U.S. standard million population. Lower confidence intervals (LCI) and upper confidence intervals (UCI) are 95 percent for rates,
Tiwari method.
Site Rate LCI UCI
Both Sexes Males Females
Cancer Incidence Counts and Five-year Age-adjusted Rates by Sex
Rate LCI UCI Rate LCI UCICount Count Count
Schuyler
All Sites 497.0 437.0 563.8 577.4 488.2 680.2 424.3 343.9 519.8264 156 108
Oral Cavity and Pharynx 8.2 2.7 22.0 13.3 3.6 39.7 3.1 0.1 27.15 4 1
Esophagus 4.9 1.0 17.7 9.6 1.9 34.43 3 0
Stomach 2.9 0.3 14.6 6.5 0.8 30.32 2 0
Colon and Rectum 40.9 25.0 64.4 50.0 26.3 88.9 32.8 13.5 70.021 13 8
Liver 5.0 1.0 17.8 9.3 1.9 33.73 3 0
Pancreas 7.4 2.0 21.4 12.2 2.5 39.4 3.1 0.1 27.14 3 1
Lung and Bronchus 95.0 70.6 126.5 114.1 76.8 165.7 75.4 47.0 119.153 31 22
Bones and Joints 0 0 0
Melanoma of the Skin 18.9 8.9 36.9 28.2 11.2 61.5 10.2 2.1 37.010 7 3
Breast (invasive) 56.5 37.9 82.4 6.9 0.8 30.9 108.9 71.4 162.131 2 29
Cervix 6.6 0.2 35.81
Corpus and Uterus, NOS 19.8 5.9 52.25
Ovary 4.9 0.1 31.21
Prostate 136.6 96.5 190.639
Testis 12.5 1.5 43.62
Urinary Bladder (includes in situ) 26.2 14.6 45.4 41.8 21.3 77.3 11.6 2.3 39.815 12 3
Kidney and Renal Pelvis 11.8 4.7 27.0 17.8 6.5 44.7 4.9 0.1 31.27 6 1
Brain and Nervous System 8.7 2.1 24.7 10.6 1.0 40.5 6.6 0.8 32.04 2 2
Hodgkin Lymphoma 0 0 0
Non-Hodgkin Lymphoma 7.2 1.9 21.0 8.0 0.9 33.5 5.8 0.6 30.74 2 2
Myeloma 5.3 1.1 18.5 6.9 0.8 30.9 3.6 0.1 28.23 2 1
Leukemia 22.9 10.7 43.6 19.8 6.3 50.0 26.4 8.0 64.910 5 5
All Other Sites 85.5 60.3 118.4 73.4 42.7 119.5 100.4 61.0 157.241 18 23
DATA SOURCE: Illinois Department of Public Health, Illinois State Cancer Registry, data as of November 2018
Breast in Situ (not in total) 36.7 15.9 75.1 9
III - 86

All Sites Combined and Selected Sites, All Races, 2012-2016Figures include invasive cancer with the exception of urinary bladder (includes in situ) and breast cancer in situ as a separate category. Incidence counts are five-year totals.
Rates are per 100,000 age-adjustd to the 2000 U.S. standard million population. Lower confidence intervals (LCI) and upper confidence intervals (UCI) are 95 percent for rates,
Tiwari method.
Site Rate LCI UCI
Both Sexes Males Females
Cancer Incidence Counts and Five-year Age-adjusted Rates by Sex
Rate LCI UCI Rate LCI UCICount Count Count
Scott
All Sites 547.5 472.8 632.0 560.7 453.0 689.1 553.7 448.3 678.9202 97 105
Oral Cavity and Pharynx 7.6 1.5 25.9 15.0 3.1 52.13 3 0
Esophagus 7.0 1.4 24.8 14.1 2.9 50.13 3 0
Stomach 8.1 1.7 27.0 11.7 1.4 48.5 5.7 0.1 39.03 2 1
Colon and Rectum 61.4 37.8 95.8 76.0 38.4 137.4 49.5 22.5 98.822 12 10
Liver 5.1 0.6 22.4 8.6 1.0 41.82 0 2
Pancreas 7.9 1.6 26.6 12.3 1.5 50.0 4.8 0.1 36.83 2 1
Lung and Bronchus 84.7 58.3 121.1 111.6 67.9 177.0 63.0 33.5 113.433 20 13
Bones and Joints 0 0 0
Melanoma of the Skin 25.3 11.0 51.2 15.7 3.2 53.4 34.2 11.2 81.99 3 6
Breast (invasive) 111.2 78.4 154.5 213.1 149.9 296.840 0 40
Cervix 8.8 1.1 42.02
Corpus and Uterus, NOS 43.0 17.1 92.68
Ovary 4.8 0.1 36.81
Prostate 130.7 82.3 200.823
Testis 0
Urinary Bladder (includes in situ) 12.8 4.2 33.1 16.9 3.4 55.9 8.6 1.0 41.75 3 2
Kidney and Renal Pelvis 28.1 13.3 54.1 34.9 12.5 81.6 20.6 5.6 59.410 6 4
Brain and Nervous System 14.1 2.9 39.8 8.9 0.2 48.0 19.6 2.3 67.03 1 2
Hodgkin Lymphoma 0 0 0
Non-Hodgkin Lymphoma 10.2 2.8 29.5 19.3 3.9 60.9 5.2 0.1 37.74 3 1
Myeloma 5.4 0.7 23.1 12.3 1.5 50.02 2 0
Leukemia 7.7 1.6 26.1 11.0 1.3 47.0 4.8 0.1 36.83 2 1
All Other Sites 60.8 38.1 93.9 70.2 35.7 127.6 59.5 28.8 112.623 12 11
DATA SOURCE: Illinois Department of Public Health, Illinois State Cancer Registry, data as of November 2018
Breast in Situ (not in total) 35.5 12.2 83.1 6
III - 87

All Sites Combined and Selected Sites, All Races, 2012-2016Figures include invasive cancer with the exception of urinary bladder (includes in situ) and breast cancer in situ as a separate category. Incidence counts are five-year totals.
Rates are per 100,000 age-adjustd to the 2000 U.S. standard million population. Lower confidence intervals (LCI) and upper confidence intervals (UCI) are 95 percent for rates,
Tiwari method.
Site Rate LCI UCI
Both Sexes Males Females
Cancer Incidence Counts and Five-year Age-adjusted Rates by Sex
Rate LCI UCI Rate LCI UCICount Count Count
Shelby
All Sites 475.1 440.6 512.0 513.6 463.4 568.2 449.8 401.5 502.8765 403 362
Oral Cavity and Pharynx 9.7 5.3 16.6 16.8 8.6 30.2 2.9 0.6 10.916 13 3
Esophagus 5.4 2.4 11.0 9.0 3.5 19.9 1.9 0.2 9.69 7 2
Stomach 4.1 1.6 9.1 4.0 0.8 13.0 4.2 1.2 12.87 3 4
Colon and Rectum 53.2 42.8 65.9 60.1 44.1 80.9 47.1 34.1 64.694 48 46
Liver 3.5 1.3 8.4 6.8 2.2 17.1 1.0 0.0 8.46 5 1
Pancreas 15.2 9.8 22.9 16.9 8.8 30.1 12.5 6.6 23.326 13 13
Lung and Bronchus 78.9 66.0 94.1 104.1 82.5 130.4 58.1 43.3 77.4135 82 53
Bones and Joints 0 0 0
Melanoma of the Skin 24.3 16.4 34.7 19.6 11.0 33.2 29.3 16.8 47.735 16 19
Breast (invasive) 82.0 67.1 99.4 1.2 0.0 8.8 158.8 129.5 193.2118 1 117
Cervix 8.4 2.5 20.45
Corpus and Uterus, NOS 24.4 14.7 38.921
Ovary 3.0 0.6 11.23
Prostate 101.0 80.5 126.085
Testis 16.0 6.4 32.47
Urinary Bladder (includes in situ) 17.6 11.9 25.6 28.3 17.9 43.7 8.4 3.6 18.331 23 8
Kidney and Renal Pelvis 18.2 12.1 26.8 28.1 17.2 44.0 9.0 3.8 19.330 22 8
Brain and Nervous System 4.8 1.6 11.0 6.9 2.1 17.5 2.8 0.1 13.46 5 1
Hodgkin Lymphoma 3.6 0.7 9.9 4.4 0.5 15.0 2.8 0.1 13.43 2 1
Non-Hodgkin Lymphoma 14.8 9.5 22.5 21.0 12.1 34.7 9.8 4.1 21.025 17 8
Myeloma 6.0 2.7 12.0 4.7 1.3 13.7 7.3 2.2 18.210 4 6
Leukemia 10.0 5.4 17.3 9.3 3.7 20.3 10.6 4.0 23.115 7 8
All Other Sites 49.4 38.5 62.6 55.4 39.7 75.8 47.3 32.0 67.878 43 35
DATA SOURCE: Illinois Department of Public Health, Illinois State Cancer Registry, data as of November 2018
Breast in Situ (not in total) 30.2 19.3 45.9 25
III - 88

All Sites Combined and Selected Sites, All Races, 2012-2016Figures include invasive cancer with the exception of urinary bladder (includes in situ) and breast cancer in situ as a separate category. Incidence counts are five-year totals.
Rates are per 100,000 age-adjustd to the 2000 U.S. standard million population. Lower confidence intervals (LCI) and upper confidence intervals (UCI) are 95 percent for rates,
Tiwari method.
Site Rate LCI UCI
Both Sexes Males Females
Cancer Incidence Counts and Five-year Age-adjusted Rates by Sex
Rate LCI UCI Rate LCI UCICount Count Count
St Clair
All Sites 475.5 464.3 486.8 514.1 496.6 532.0 450.7 436.0 465.97,195 3,488 3,707
Oral Cavity and Pharynx 14.6 12.7 16.7 22.3 18.8 26.2 8.2 6.3 10.6222 156 66
Esophagus 5.5 4.3 6.8 9.6 7.4 12.4 2.1 1.2 3.485 68 17
Stomach 4.7 3.7 6.0 7.2 5.3 9.7 2.7 1.7 4.271 48 23
Colon and Rectum 42.9 39.6 46.5 48.6 43.3 54.4 37.7 33.6 42.2644 324 320
Liver 7.2 5.9 8.7 11.2 8.8 14.0 3.8 2.6 5.4117 84 33
Pancreas 13.6 11.8 15.6 16.1 13.2 19.5 11.5 9.3 14.1213 112 101
Lung and Bronchus 77.9 73.5 82.6 90.0 82.8 97.8 69.1 63.5 75.11,189 601 588
Bones and Joints 0.7 0.3 1.3 0.9 0.3 2.0 0.5 0.1 1.49 5 4
Melanoma of the Skin 20.1 17.8 22.7 27.0 23.0 31.5 15.6 12.9 18.9287 170 117
Breast (invasive) 73.2 68.9 77.8 0.8 0.3 1.8 134.2 126.1 142.61,093 6 1,087
Cervix 9.5 7.3 12.167
Corpus and Uterus, NOS 29.5 25.9 33.5253
Ovary 10.4 8.3 13.085
Prostate 97.5 90.3 105.2715
Testis 5.7 4.0 8.035
Urinary Bladder (includes in situ) 21.7 19.4 24.2 39.1 34.3 44.5 8.7 6.9 11.0325 246 79
Kidney and Renal Pelvis 21.3 19.0 23.8 29.6 25.6 34.0 14.2 11.7 17.1329 213 116
Brain and Nervous System 6.3 5.1 7.8 6.9 5.1 9.3 5.9 4.2 8.092 49 43
Hodgkin Lymphoma 2.3 1.5 3.3 2.6 1.4 4.2 2.0 1.1 3.529 16 13
Non-Hodgkin Lymphoma 17.3 15.2 19.6 20.0 16.7 23.9 15.2 12.6 18.2255 131 124
Myeloma 7.9 6.6 9.5 10.1 7.7 13.0 6.6 4.9 8.6120 64 56
Leukemia 11.5 9.8 13.4 14.4 11.6 17.8 9.0 7.1 11.4167 92 75
All Other Sites 53.5 49.7 57.4 54.2 48.6 60.4 54.2 49.1 59.7793 353 440
DATA SOURCE: Illinois Department of Public Health, Illinois State Cancer Registry, data as of November 2018
Breast in Situ (not in total) 37.4 33.2 42.1 300
III - 89

All Sites Combined and Selected Sites, All Races, 2012-2016Figures include invasive cancer with the exception of urinary bladder (includes in situ) and breast cancer in situ as a separate category. Incidence counts are five-year totals.
Rates are per 100,000 age-adjustd to the 2000 U.S. standard million population. Lower confidence intervals (LCI) and upper confidence intervals (UCI) are 95 percent for rates,
Tiwari method.
Site Rate LCI UCI
Both Sexes Males Females
Cancer Incidence Counts and Five-year Age-adjusted Rates by Sex
Rate LCI UCI Rate LCI UCICount Count Count
Stark
All Sites 473.7 405.2 551.4 530.8 429.4 651.2 434.9 341.5 547.6190 103 87
Oral Cavity and Pharynx 17.0 6.1 39.0 38.5 14.4 85.47 7 0
Esophagus 8.8 2.4 26.1 17.8 4.8 53.24 4 0
Stomach 4.7 0.6 20.7 5.2 0.1 36.4 4.6 0.1 34.32 1 1
Colon and Rectum 82.6 54.4 121.1 90.7 49.9 153.5 78.3 40.9 137.331 16 15
Liver 0 0 0
Pancreas 10.8 2.7 30.5 19.1 3.7 59.2 4.0 0.1 33.04 3 1
Lung and Bronchus 58.1 37.6 87.8 64.0 33.9 114.3 54.6 28.1 100.726 13 13
Bones and Joints 2.0 0.1 16.6 4.0 0.1 33.71 1 0
Melanoma of the Skin 14.4 5.7 33.2 20.3 5.4 58.0 13.2 2.7 46.27 4 3
Breast (invasive) 55.7 33.8 87.7 106.7 64.1 169.522 0 22
Cervix 37.6 12.1 87.65
Corpus and Uterus, NOS 23.4 7.3 61.15
Ovary 0
Prostate 98.6 61.1 155.222
Testis 0
Urinary Bladder (includes in situ) 21.3 9.4 43.6 33.8 12.0 78.4 11.5 2.2 43.29 6 3
Kidney and Renal Pelvis 14.5 4.2 36.6 25.0 6.1 68.7 4.6 0.1 34.45 4 1
Brain and Nervous System 6.2 1.3 22.5 4.4 0.1 34.5 7.0 0.7 37.03 1 2
Hodgkin Lymphoma 8.5 1.0 29.6 9.1 0.2 46.9 7.9 0.2 42.72 1 1
Non-Hodgkin Lymphoma 23.7 11.1 46.7 35.9 13.9 79.9 10.3 2.0 41.010 7 3
Myeloma 0 0 0
Leukemia 6.1 1.2 22.1 8.2 1.0 39.5 4.0 0.1 33.03 2 1
All Other Sites 60.7 36.5 95.5 56.1 27.4 106.0 67.2 30.9 127.022 11 11
DATA SOURCE: Illinois Department of Public Health, Illinois State Cancer Registry, data as of November 2018
Breast in Situ (not in total) 4.4 0.1 34.0 1
III - 90

All Sites Combined and Selected Sites, All Races, 2012-2016Figures include invasive cancer with the exception of urinary bladder (includes in situ) and breast cancer in situ as a separate category. Incidence counts are five-year totals.
Rates are per 100,000 age-adjustd to the 2000 U.S. standard million population. Lower confidence intervals (LCI) and upper confidence intervals (UCI) are 95 percent for rates,
Tiwari method.
Site Rate LCI UCI
Both Sexes Males Females
Cancer Incidence Counts and Five-year Age-adjusted Rates by Sex
Rate LCI UCI Rate LCI UCICount Count Count
Stephenson
All Sites 421.7 398.8 445.6 425.5 392.9 460.4 425.4 393.0 460.01,411 669 742
Oral Cavity and Pharynx 10.0 6.7 14.6 15.3 9.3 24.0 4.8 2.2 9.732 22 10
Esophagus 4.6 2.7 7.7 9.0 5.0 15.4 0.8 0.1 4.317 15 2
Stomach 7.5 4.9 11.2 9.7 5.4 16.6 4.9 2.5 9.727 15 12
Colon and Rectum 38.6 32.3 46.0 45.6 35.5 57.9 33.3 25.5 43.2140 72 68
Liver 4.7 2.6 8.0 7.2 3.5 13.5 2.1 0.5 6.415 11 4
Pancreas 12.5 9.0 17.0 16.5 10.9 24.5 9.0 5.2 15.245 27 18
Lung and Bronchus 52.4 45.0 60.9 61.9 50.1 75.9 45.7 36.2 57.3186 100 86
Bones and Joints 1.5 0.3 4.4 1.6 0.2 6.3 1.3 0.0 6.33 2 1
Melanoma of the Skin 21.4 16.1 28.0 25.2 17.0 36.0 18.8 12.2 28.064 35 29
Breast (invasive) 70.5 61.0 81.2 1.1 0.1 4.9 132.9 114.7 153.3223 2 221
Cervix 10.6 5.1 19.112
Corpus and Uterus, NOS 35.5 27.0 46.166
Ovary 7.5 3.9 13.413
Prostate 91.7 77.7 107.7157
Testis 1.5 0.0 6.91
Urinary Bladder (includes in situ) 14.8 11.0 19.7 22.3 15.5 31.5 9.4 5.5 15.553 35 18
Kidney and Renal Pelvis 17.9 13.5 23.4 23.8 16.7 33.4 13.0 7.9 20.459 37 22
Brain and Nervous System 4.5 2.3 7.9 4.5 1.7 9.9 4.5 1.7 10.014 7 7
Hodgkin Lymphoma 1.6 0.4 4.4 2.8 0.5 8.4 0.5 0.0 3.94 3 1
Non-Hodgkin Lymphoma 14.1 10.2 19.2 16.9 10.9 25.3 12.0 7.1 19.347 26 21
Myeloma 6.0 3.7 9.5 5.9 2.8 11.5 6.0 3.0 11.322 10 12
Leukemia 14.6 10.3 20.0 15.9 9.7 24.6 14.1 8.4 22.346 23 23
All Other Sites 53.4 45.0 63.1 47.3 36.3 60.9 58.7 46.4 73.4165 69 96
DATA SOURCE: Illinois Department of Public Health, Illinois State Cancer Registry, data as of November 2018
Breast in Situ (not in total) 24.9 17.2 35.0 39
III - 91

All Sites Combined and Selected Sites, All Races, 2012-2016Figures include invasive cancer with the exception of urinary bladder (includes in situ) and breast cancer in situ as a separate category. Incidence counts are five-year totals.
Rates are per 100,000 age-adjustd to the 2000 U.S. standard million population. Lower confidence intervals (LCI) and upper confidence intervals (UCI) are 95 percent for rates,
Tiwari method.
Site Rate LCI UCI
Both Sexes Males Females
Cancer Incidence Counts and Five-year Age-adjusted Rates by Sex
Rate LCI UCI Rate LCI UCICount Count Count
Tazewell
All Sites 500.8 485.6 516.4 531.7 508.9 555.3 483.7 462.8 505.44,308 2,134 2,174
Oral Cavity and Pharynx 16.6 14.0 19.7 26.4 21.6 32.1 7.6 5.1 10.8143 109 34
Esophagus 5.1 3.7 6.8 9.4 6.5 13.0 1.9 0.9 3.647 37 10
Stomach 5.5 4.0 7.4 8.0 5.4 11.4 3.6 2.0 6.047 31 16
Colon and Rectum 47.0 42.4 51.9 55.4 48.2 63.5 40.8 35.0 47.4405 216 189
Liver 5.1 3.7 6.9 7.5 5.2 10.7 2.9 1.5 5.347 34 13
Pancreas 12.3 10.1 14.9 15.8 12.1 20.3 9.5 6.9 12.8111 63 48
Lung and Bronchus 82.4 76.5 88.8 93.6 84.3 103.7 74.1 66.4 82.5735 382 353
Bones and Joints 0.8 0.3 1.8 1.4 0.4 3.3 0.4 0.0 1.96 5 1
Melanoma of the Skin 26.5 22.9 30.5 27.7 22.5 33.6 26.6 21.5 32.4211 105 106
Breast (invasive) 80.2 74.1 86.7 1.4 0.4 3.2 151.1 139.5 163.6671 5 666
Cervix 9.0 6.0 12.931
Corpus and Uterus, NOS 27.0 22.4 32.2130
Ovary 10.2 7.4 13.748
Prostate 100.7 91.3 110.9433
Testis 7.5 4.8 11.124
Urinary Bladder (includes in situ) 26.0 22.8 29.7 43.1 36.8 50.2 12.4 9.5 16.0237 172 65
Kidney and Renal Pelvis 19.2 16.3 22.5 27.0 22.0 32.8 12.5 9.3 16.4162 106 56
Brain and Nervous System 6.5 4.8 8.7 7.0 4.5 10.4 6.1 3.8 9.250 26 24
Hodgkin Lymphoma 4.1 2.7 6.0 4.8 2.7 7.8 3.5 1.8 6.129 16 13
Non-Hodgkin Lymphoma 20.7 17.7 24.1 24.5 19.7 30.0 17.4 13.8 21.9180 96 84
Myeloma 4.4 3.2 6.1 4.4 2.6 7.0 4.5 2.8 6.941 19 22
Leukemia 8.6 6.7 11.0 11.9 8.7 16.0 6.1 3.9 9.371 46 25
All Other Sites 54.7 49.6 60.2 54.3 47.0 62.4 56.7 49.4 64.7449 209 240
DATA SOURCE: Illinois Department of Public Health, Illinois State Cancer Registry, data as of November 2018
Breast in Situ (not in total) 33.5 28.0 39.8 143
III - 92

All Sites Combined and Selected Sites, All Races, 2012-2016Figures include invasive cancer with the exception of urinary bladder (includes in situ) and breast cancer in situ as a separate category. Incidence counts are five-year totals.
Rates are per 100,000 age-adjustd to the 2000 U.S. standard million population. Lower confidence intervals (LCI) and upper confidence intervals (UCI) are 95 percent for rates,
Tiwari method.
Site Rate LCI UCI
Both Sexes Males Females
Cancer Incidence Counts and Five-year Age-adjusted Rates by Sex
Rate LCI UCI Rate LCI UCICount Count Count
Union
All Sites 517.9 477.3 561.4 551.9 492.7 616.9 491.4 435.4 553.1647 336 311
Oral Cavity and Pharynx 11.4 5.8 20.4 16.7 7.7 32.4 6.7 1.3 20.313 10 3
Esophagus 4.3 1.3 11.0 8.7 2.7 21.85 5 0
Stomach 3.5 1.1 9.4 6.0 1.6 17.6 1.4 0.0 11.05 4 1
Colon and Rectum 51.6 39.7 66.5 56.9 38.9 81.2 45.6 31.0 66.067 34 33
Liver 10.1 5.0 18.6 17.4 8.0 33.7 3.0 0.4 13.412 10 2
Pancreas 8.5 4.2 16.1 6.7 1.8 18.9 10.7 4.1 24.111 4 7
Lung and Bronchus 94.5 78.5 113.2 130.6 103.5 163.5 61.2 44.2 83.8127 83 44
Bones and Joints 1.5 0.2 6.7 2.1 0.1 12.4 1.3 0.0 10.62 1 1
Melanoma of the Skin 27.0 17.7 39.5 39.0 23.6 61.1 17.5 7.4 35.230 21 9
Breast (invasive) 80.0 64.1 98.9 3.7 0.4 14.7 153.1 122.1 190.197 2 95
Cervix 8.4 1.7 23.73
Corpus and Uterus, NOS 37.3 23.9 56.725
Ovary 11.2 4.1 25.57
Prostate 102.3 79.2 131.168
Testis 0
Urinary Bladder (includes in situ) 20.2 13.1 30.3 34.2 20.9 53.7 7.5 2.4 19.526 21 5
Kidney and Renal Pelvis 17.3 10.7 27.1 19.3 9.6 35.7 15.7 7.4 30.522 12 10
Brain and Nervous System 4.8 1.7 11.5 9.8 3.4 23.26 6 0
Hodgkin Lymphoma 3.7 0.7 11.0 1.6 0.0 11.2 6.0 0.7 20.53 1 2
Non-Hodgkin Lymphoma 18.9 12.0 29.0 13.2 5.7 27.5 24.4 13.5 41.724 8 16
Myeloma 3.0 0.8 8.7 7.0 1.9 19.44 4 0
Leukemia 10.8 5.3 19.9 14.0 5.1 30.5 8.0 2.5 20.512 7 5
All Other Sites 68.5 53.5 86.7 62.7 43.0 88.9 72.5 51.3 100.278 35 43
DATA SOURCE: Illinois Department of Public Health, Illinois State Cancer Registry, data as of November 2018
Breast in Situ (not in total) 28.2 15.8 47.3 17
III - 93

All Sites Combined and Selected Sites, All Races, 2012-2016Figures include invasive cancer with the exception of urinary bladder (includes in situ) and breast cancer in situ as a separate category. Incidence counts are five-year totals.
Rates are per 100,000 age-adjustd to the 2000 U.S. standard million population. Lower confidence intervals (LCI) and upper confidence intervals (UCI) are 95 percent for rates,
Tiwari method.
Site Rate LCI UCI
Both Sexes Males Females
Cancer Incidence Counts and Five-year Age-adjusted Rates by Sex
Rate LCI UCI Rate LCI UCICount Count Count
Vermilion
All Sites 512.1 492.3 532.6 565.9 535.8 597.3 476.5 449.5 504.82,668 1,384 1,284
Oral Cavity and Pharynx 13.5 10.5 17.2 17.9 12.9 24.3 9.6 6.1 14.570 44 26
Esophagus 5.0 3.3 7.4 8.1 4.9 12.7 2.9 1.2 6.028 20 8
Stomach 5.2 3.5 7.7 7.9 4.8 12.4 2.9 1.3 5.929 20 9
Colon and Rectum 56.3 49.8 63.6 67.0 56.7 78.6 47.1 38.9 56.6285 157 128
Liver 5.6 3.8 8.0 8.4 5.3 12.8 2.9 1.3 5.932 23 9
Pancreas 12.8 9.9 16.3 14.2 9.8 20.0 11.4 7.8 16.370 36 34
Lung and Bronchus 90.7 82.7 99.3 104.5 92.0 118.3 80.2 70.0 91.7493 261 232
Bones and Joints 2.7 1.3 4.9 2.9 1.1 6.4 2.5 0.7 6.011 6 5
Melanoma of the Skin 26.1 21.7 31.1 33.5 26.6 41.9 20.9 15.2 28.0133 83 50
Breast (invasive) 55.3 48.8 62.5 2.1 0.7 5.1 104.2 91.7 118.2280 5 275
Cervix 12.0 7.5 18.025
Corpus and Uterus, NOS 29.6 23.2 37.281
Ovary 13.5 9.3 19.136
Prostate 114.6 101.7 128.8295
Testis 4.4 1.9 8.78
Urinary Bladder (includes in situ) 22.1 18.2 26.6 39.2 31.5 48.4 9.0 5.8 13.5118 92 26
Kidney and Renal Pelvis 22.3 18.2 27.2 28.4 21.9 36.4 17.2 12.1 23.7110 67 43
Brain and Nervous System 5.7 3.7 8.5 6.6 3.6 11.1 5.3 2.6 9.627 15 12
Hodgkin Lymphoma 1.3 0.4 2.9 1.0 0.1 3.6 1.5 0.4 4.26 2 4
Non-Hodgkin Lymphoma 21.3 17.5 25.7 27.6 21.3 35.4 15.6 11.4 21.2114 67 47
Myeloma 5.4 3.5 7.9 5.5 2.9 9.7 5.2 2.9 8.828 13 15
Leukemia 14.2 11.1 18.1 21.2 15.7 28.2 8.2 5.0 12.773 50 23
All Other Sites 63.0 56.0 70.7 50.8 41.9 61.0 74.8 64.2 86.8316 120 196
DATA SOURCE: Illinois Department of Public Health, Illinois State Cancer Registry, data as of November 2018
Breast in Situ (not in total) 29.6 22.7 37.9 70
III - 94

All Sites Combined and Selected Sites, All Races, 2012-2016Figures include invasive cancer with the exception of urinary bladder (includes in situ) and breast cancer in situ as a separate category. Incidence counts are five-year totals.
Rates are per 100,000 age-adjustd to the 2000 U.S. standard million population. Lower confidence intervals (LCI) and upper confidence intervals (UCI) are 95 percent for rates,
Tiwari method.
Site Rate LCI UCI
Both Sexes Males Females
Cancer Incidence Counts and Five-year Age-adjusted Rates by Sex
Rate LCI UCI Rate LCI UCICount Count Count
Wabash
All Sites 462.3 415.3 513.7 533.5 460.5 615.7 400.2 340.4 468.7381 202 179
Oral Cavity and Pharynx 8.8 3.7 18.7 19.0 8.1 39.98 8 0
Esophagus 7.3 2.9 16.6 12.9 4.7 31.1 2.5 0.1 17.27 6 1
Stomach 2.2 0.3 9.7 2.2 0.1 16.4 2.1 0.1 16.32 1 1
Colon and Rectum 65.3 48.7 86.2 74.3 49.3 108.7 57.6 36.7 87.755 29 26
Liver 7.9 3.1 17.7 14.7 5.3 34.5 1.2 0.0 14.77 6 1
Pancreas 20.1 11.5 33.5 16.8 6.7 36.9 22.4 10.2 44.517 7 10
Lung and Bronchus 66.1 49.6 86.9 78.9 53.3 113.8 56.3 35.8 86.056 31 25
Bones and Joints 2.0 0.0 10.4 3.7 0.1 20.31 1 0
Melanoma of the Skin 6.5 2.4 15.7 12.0 3.9 30.5 2.5 0.1 17.26 5 1
Breast (invasive) 58.4 42.2 79.3 6.8 1.4 23.1 104.9 74.4 144.847 3 44
Cervix 9.8 1.2 32.32
Corpus and Uterus, NOS 17.4 7.3 37.38
Ovary 8.5 2.3 25.34
Prostate 86.9 60.6 122.336
Testis 13.2 2.6 36.93
Urinary Bladder (includes in situ) 17.1 9.6 29.2 24.0 10.9 47.4 10.1 3.9 25.816 9 7
Kidney and Renal Pelvis 24.5 14.3 39.6 47.1 26.3 78.3 5.6 1.1 21.019 16 3
Brain and Nervous System 7.8 2.4 19.1 10.0 1.9 30.0 6.3 0.6 24.55 3 2
Hodgkin Lymphoma 2.0 0.1 10.5 4.0 0.1 21.01 1 0
Non-Hodgkin Lymphoma 22.2 12.9 36.2 31.1 15.2 57.4 14.9 5.8 33.918 11 7
Myeloma 8.2 3.3 18.1 12.8 4.1 32.0 4.3 0.5 19.67 5 2
Leukemia 10.4 4.5 21.3 5.0 0.6 20.9 15.7 5.8 36.09 2 7
All Other Sites 59.5 43.0 80.8 58.1 34.0 92.8 58.3 37.9 87.747 19 28
DATA SOURCE: Illinois Department of Public Health, Illinois State Cancer Registry, data as of November 2018
Breast in Situ (not in total) 23.1 10.2 46.3 9
III - 95

All Sites Combined and Selected Sites, All Races, 2012-2016Figures include invasive cancer with the exception of urinary bladder (includes in situ) and breast cancer in situ as a separate category. Incidence counts are five-year totals.
Rates are per 100,000 age-adjustd to the 2000 U.S. standard million population. Lower confidence intervals (LCI) and upper confidence intervals (UCI) are 95 percent for rates,
Tiwari method.
Site Rate LCI UCI
Both Sexes Males Females
Cancer Incidence Counts and Five-year Age-adjusted Rates by Sex
Rate LCI UCI Rate LCI UCICount Count Count
Warren
All Sites 483.0 441.1 527.9 517.3 456.5 584.4 471.0 411.1 537.3533 277 256
Oral Cavity and Pharynx 13.1 7.1 22.3 17.2 8.1 33.2 8.6 2.5 21.915 10 5
Esophagus 8.1 3.9 15.5 15.6 6.6 31.7 2.6 0.3 12.210 8 2
Stomach 10.4 4.9 19.5 12.3 4.9 26.7 9.1 2.1 24.611 7 4
Colon and Rectum 53.0 40.2 68.9 70.9 49.2 99.4 42.3 26.5 64.661 36 25
Liver 1.5 0.2 6.6 3.2 0.4 13.62 2 0
Pancreas 11.5 6.0 20.5 11.7 4.1 26.7 11.1 4.1 24.813 6 7
Lung and Bronchus 63.6 50.3 79.9 93.4 69.1 124.0 41.2 27.2 61.079 51 28
Bones and Joints 0.7 0.0 5.2 1.3 0.0 10.71 1 0
Melanoma of the Skin 28.3 18.5 41.5 36.9 21.3 59.6 23.2 10.9 43.229 18 11
Breast (invasive) 88.3 69.8 110.2 1.8 0.0 11.9 169.7 133.5 212.787 1 86
Cervix 13.1 3.6 31.74
Corpus and Uterus, NOS 37.4 22.4 59.121
Ovary 11.2 4.2 25.17
Prostate 77.4 56.8 104.048
Testis 13.7 4.3 31.55
Urinary Bladder (includes in situ) 20.4 13.0 31.0 42.0 26.0 64.7 2.6 0.3 12.324 22 2
Kidney and Renal Pelvis 22.2 13.7 34.1 17.2 7.9 33.4 26.6 13.6 46.923 10 13
Brain and Nervous System 13.2 7.1 22.8 16.6 7.5 32.6 10.5 3.2 25.414 9 5
Hodgkin Lymphoma 2.6 0.3 9.2 2.0 0.0 12.1 3.3 0.1 16.02 1 1
Non-Hodgkin Lymphoma 11.9 6.4 20.7 18.1 8.4 34.6 5.7 1.5 16.614 10 4
Myeloma 4.0 1.3 10.2 3.2 0.4 13.6 4.8 1.0 15.75 2 3
Leukemia 12.1 6.3 21.3 15.8 6.6 32.2 8.0 2.3 20.813 8 5
All Other Sites 43.0 30.8 58.4 47.1 29.1 72.4 40.0 24.4 62.145 22 23
DATA SOURCE: Illinois Department of Public Health, Illinois State Cancer Registry, data as of November 2018
Breast in Situ (not in total) 24.9 13.1 43.5 14
III - 96

All Sites Combined and Selected Sites, All Races, 2012-2016Figures include invasive cancer with the exception of urinary bladder (includes in situ) and breast cancer in situ as a separate category. Incidence counts are five-year totals.
Rates are per 100,000 age-adjustd to the 2000 U.S. standard million population. Lower confidence intervals (LCI) and upper confidence intervals (UCI) are 95 percent for rates,
Tiwari method.
Site Rate LCI UCI
Both Sexes Males Females
Cancer Incidence Counts and Five-year Age-adjusted Rates by Sex
Rate LCI UCI Rate LCI UCICount Count Count
Washington
All Sites 487.6 443.8 535.0 556.9 490.1 631.0 426.7 369.5 491.0481 265 216
Oral Cavity and Pharynx 23.2 14.0 36.4 32.1 17.4 55.1 14.2 4.9 32.521 15 6
Esophagus 6.6 2.6 14.6 12.4 4.5 28.8 1.7 0.0 13.27 6 1
Stomach 4.1 1.1 11.5 8.9 2.3 24.34 4 0
Colon and Rectum 53.7 40.0 71.0 56.9 37.3 84.2 48.9 31.5 73.854 28 26
Liver 3.9 1.1 11.1 3.8 0.4 16.3 3.8 0.5 16.44 2 2
Pancreas 19.1 11.6 30.3 27.1 14.3 47.8 12.2 4.9 27.620 13 7
Lung and Bronchus 64.8 50.1 83.1 70.4 48.4 99.8 60.2 41.3 86.367 34 33
Bones and Joints 1.9 0.0 9.4 3.9 0.1 19.01 0 1
Melanoma of the Skin 19.0 10.8 31.3 24.2 11.5 45.5 14.7 5.5 32.518 11 7
Breast (invasive) 55.4 41.2 73.2 2.0 0.1 13.8 107.1 79.5 142.154 1 53
Cervix 5.3 0.6 19.82
Corpus and Uterus, NOS 21.6 11.4 39.313
Ovary 12.4 4.9 28.07
Prostate 149.1 116.2 189.373
Testis 8.6 1.6 25.73
Urinary Bladder (includes in situ) 16.0 9.2 26.6 25.5 13.3 45.6 7.4 2.0 21.317 13 4
Kidney and Renal Pelvis 12.3 6.4 22.0 21.3 10.4 40.1 3.9 0.5 16.613 11 2
Brain and Nervous System 10.9 4.7 21.6 12.3 3.7 30.2 9.3 2.2 25.89 5 4
Hodgkin Lymphoma 2.7 0.3 10.0 5.4 0.6 20.12 2 0
Non-Hodgkin Lymphoma 19.8 11.8 31.8 23.4 11.4 43.4 16.0 6.6 33.719 11 8
Myeloma 2.5 0.5 8.9 3.8 0.4 16.3 1.1 0.0 12.03 2 1
Leukemia 11.1 5.4 20.7 16.3 6.4 34.7 6.8 1.8 20.211 7 4
All Other Sites 64.1 48.1 83.8 53.6 33.9 81.2 76.1 51.7 108.559 24 35
DATA SOURCE: Illinois Department of Public Health, Illinois State Cancer Registry, data as of November 2018
Breast in Situ (not in total) 30.0 16.4 51.4 15
III - 97

All Sites Combined and Selected Sites, All Races, 2012-2016Figures include invasive cancer with the exception of urinary bladder (includes in situ) and breast cancer in situ as a separate category. Incidence counts are five-year totals.
Rates are per 100,000 age-adjustd to the 2000 U.S. standard million population. Lower confidence intervals (LCI) and upper confidence intervals (UCI) are 95 percent for rates,
Tiwari method.
Site Rate LCI UCI
Both Sexes Males Females
Cancer Incidence Counts and Five-year Age-adjusted Rates by Sex
Rate LCI UCI Rate LCI UCICount Count Count
Wayne
All Sites 473.3 433.8 515.8 525.0 466.1 589.9 438.3 384.2 498.4568 301 267
Oral Cavity and Pharynx 11.4 6.2 19.9 16.8 8.0 32.5 6.7 1.8 19.014 10 4
Esophagus 7.1 2.8 14.9 9.0 2.3 24.1 5.3 1.4 16.28 4 4
Stomach 3.8 1.2 10.0 8.8 2.8 22.05 5 0
Colon and Rectum 40.0 29.5 53.6 42.4 27.6 63.5 38.1 23.9 58.650 26 24
Liver 5.3 2.1 11.9 3.0 0.4 13.5 7.1 2.3 18.87 2 5
Pancreas 10.9 6.1 18.8 13.0 5.6 27.3 8.6 3.4 20.315 8 7
Lung and Bronchus 73.2 59.1 90.3 100.6 76.4 131.0 52.0 36.0 74.194 59 35
Bones and Joints 0 0 0
Melanoma of the Skin 21.4 13.9 32.2 30.5 17.6 50.3 14.6 6.6 29.426 17 9
Breast (invasive) 65.2 50.6 82.9 125.5 97.2 160.175 0 75
Cervix 9.9 2.9 24.75
Corpus and Uterus, NOS 27.7 14.9 47.516
Ovary 8.2 3.0 20.26
Prostate 129.0 101.4 162.777
Testis 8.8 1.7 24.93
Urinary Bladder (includes in situ) 17.3 11.0 26.7 36.0 22.2 56.2 2.4 0.3 12.323 21 2
Kidney and Renal Pelvis 21.6 13.9 32.5 22.0 11.6 39.1 22.1 11.4 39.726 13 13
Brain and Nervous System 6.6 1.9 15.7 5.0 0.5 18.8 8.2 1.5 23.95 2 3
Hodgkin Lymphoma 2.2 0.2 8.4 4.4 0.4 16.92 0 2
Non-Hodgkin Lymphoma 22.8 14.8 34.2 30.2 17.1 50.4 17.5 8.2 33.727 16 11
Myeloma 5.1 2.0 11.4 1.4 0.0 11.2 8.2 3.0 20.27 1 6
Leukemia 12.2 6.3 21.6 15.0 5.9 31.9 10.7 3.7 25.013 7 6
All Other Sites 57.6 43.7 74.9 53.4 35.6 77.9 61.2 40.9 88.464 30 34
DATA SOURCE: Illinois Department of Public Health, Illinois State Cancer Registry, data as of November 2018
Breast in Situ (not in total) 24.4 11.9 44.4 12
III - 98

All Sites Combined and Selected Sites, All Races, 2012-2016Figures include invasive cancer with the exception of urinary bladder (includes in situ) and breast cancer in situ as a separate category. Incidence counts are five-year totals.
Rates are per 100,000 age-adjustd to the 2000 U.S. standard million population. Lower confidence intervals (LCI) and upper confidence intervals (UCI) are 95 percent for rates,
Tiwari method.
Site Rate LCI UCI
Both Sexes Males Females
Cancer Incidence Counts and Five-year Age-adjusted Rates by Sex
Rate LCI UCI Rate LCI UCICount Count Count
White
All Sites 507.2 463.7 554.2 562.0 496.8 634.4 470.9 411.8 537.0543 282 261
Oral Cavity and Pharynx 13.1 6.7 23.5 23.2 11.2 43.5 3.1 0.4 14.913 11 2
Esophagus 6.6 2.8 14.3 14.5 6.2 30.88 8 0
Stomach 4.2 1.3 11.2 5.3 1.1 18.5 3.4 0.4 15.55 3 2
Colon and Rectum 42.8 31.4 57.7 46.4 29.6 70.6 42.2 26.6 65.249 24 25
Liver 7.7 3.2 16.3 7.2 1.9 21.1 8.2 2.0 23.58 4 4
Pancreas 15.9 9.3 26.1 14.0 5.6 30.7 17.5 8.4 34.118 7 11
Lung and Bronchus 88.8 71.8 109.3 123.8 94.3 160.7 60.6 42.3 85.899 62 37
Bones and Joints 2.5 0.2 9.7 1.7 0.0 13.4 3.4 0.1 17.62 1 1
Melanoma of the Skin 20.7 12.3 33.1 26.5 12.7 49.2 15.4 7.0 31.620 11 9
Breast (invasive) 65.4 49.8 84.8 124.2 94.0 161.866 0 66
Cervix 3.9 0.4 16.62
Corpus and Uterus, NOS 26.5 14.4 46.215
Ovary 6.4 1.1 21.13
Prostate 119.7 91.3 155.462
Testis 0
Urinary Bladder (includes in situ) 33.8 23.5 47.7 56.2 36.9 83.2 14.7 6.6 30.637 28 9
Kidney and Renal Pelvis 26.3 16.9 39.4 21.8 11.2 40.2 30.9 16.3 53.827 12 15
Brain and Nervous System 7.8 3.2 16.6 9.3 2.3 25.6 5.4 1.4 17.88 4 4
Hodgkin Lymphoma 0 0 0
Non-Hodgkin Lymphoma 20.2 12.3 31.8 15.9 6.8 33.3 24.3 12.4 44.022 8 14
Myeloma 3.2 0.9 9.8 7.4 2.0 21.44 4 0
Leukemia 14.8 7.4 26.5 14.6 4.9 33.8 15.2 5.5 33.913 6 7
All Other Sites 59.7 45.0 78.1 54.5 35.4 81.5 65.6 44.0 95.062 27 35
DATA SOURCE: Illinois Department of Public Health, Illinois State Cancer Registry, data as of November 2018
Breast in Situ (not in total) 6.7 1.2 21.6 3
III - 99

All Sites Combined and Selected Sites, All Races, 2012-2016Figures include invasive cancer with the exception of urinary bladder (includes in situ) and breast cancer in situ as a separate category. Incidence counts are five-year totals.
Rates are per 100,000 age-adjustd to the 2000 U.S. standard million population. Lower confidence intervals (LCI) and upper confidence intervals (UCI) are 95 percent for rates,
Tiwari method.
Site Rate LCI UCI
Both Sexes Males Females
Cancer Incidence Counts and Five-year Age-adjusted Rates by Sex
Rate LCI UCI Rate LCI UCICount Count Count
Whiteside
All Sites 474.2 452.2 497.2 534.1 500.4 569.5 427.5 398.2 458.51,866 987 879
Oral Cavity and Pharynx 11.8 8.8 15.7 19.7 14.0 27.2 4.8 2.4 9.251 40 11
Esophagus 6.4 4.1 9.6 12.2 7.7 18.7 0.9 0.1 4.026 24 2
Stomach 6.6 4.3 9.8 7.9 4.4 13.4 5.5 2.7 10.326 15 11
Colon and Rectum 43.2 36.8 50.5 54.8 44.4 67.1 32.6 25.2 41.9171 100 71
Liver 6.9 4.5 10.2 10.1 6.1 16.0 4.0 1.7 8.328 20 8
Pancreas 12.1 8.9 16.2 14.2 9.3 21.0 10.2 6.3 15.949 27 22
Lung and Bronchus 61.6 54.2 69.9 81.1 68.6 95.6 46.4 37.7 56.7256 152 104
Bones and Joints 0 0 0
Melanoma of the Skin 25.0 19.9 30.9 29.5 21.7 39.3 21.2 14.9 29.393 50 43
Breast (invasive) 71.1 62.4 80.8 0.4 0.0 3.3 137.1 120.1 156.0262 1 261
Cervix 7.8 4.0 13.714
Corpus and Uterus, NOS 27.7 21.1 36.161
Ovary 14.3 9.5 21.030
Prostate 95.8 82.6 110.9193
Testis 15.9 9.5 24.819
Urinary Bladder (includes in situ) 24.2 19.7 29.5 40.3 31.6 50.8 10.6 7.0 15.9104 76 28
Kidney and Renal Pelvis 19.9 15.6 25.2 25.8 18.8 34.7 15.2 10.0 22.378 48 30
Brain and Nervous System 4.6 2.6 7.6 7.2 3.6 13.0 2.4 0.9 6.018 12 6
Hodgkin Lymphoma 3.1 1.4 6.0 3.6 1.2 8.2 2.7 0.6 7.310 6 4
Non-Hodgkin Lymphoma 25.0 20.1 30.8 27.7 20.3 37.1 22.3 16.1 30.397 49 48
Myeloma 5.5 3.5 8.3 5.9 3.0 10.8 5.2 2.7 9.525 12 13
Leukemia 11.5 8.1 15.8 14.7 9.5 21.9 9.1 5.0 15.542 26 16
All Other Sites 56.7 49.0 65.3 67.3 55.3 81.2 47.5 37.8 59.0213 117 96
DATA SOURCE: Illinois Department of Public Health, Illinois State Cancer Registry, data as of November 2018
Breast in Situ (not in total) 23.4 16.6 32.1 43
III - 100

All Sites Combined and Selected Sites, All Races, 2012-2016Figures include invasive cancer with the exception of urinary bladder (includes in situ) and breast cancer in situ as a separate category. Incidence counts are five-year totals.
Rates are per 100,000 age-adjustd to the 2000 U.S. standard million population. Lower confidence intervals (LCI) and upper confidence intervals (UCI) are 95 percent for rates,
Tiwari method.
Site Rate LCI UCI
Both Sexes Males Females
Cancer Incidence Counts and Five-year Age-adjusted Rates by Sex
Rate LCI UCI Rate LCI UCICount Count Count
Will
All Sites 491.9 484.3 499.7 540.7 528.6 553.1 458.8 448.9 469.016,675 8,352 8,323
Oral Cavity and Pharynx 11.6 10.5 12.9 17.6 15.5 19.8 6.3 5.1 7.6408 296 112
Esophagus 5.3 4.5 6.1 9.6 8.0 11.4 1.7 1.1 2.5176 147 29
Stomach 6.9 6.0 7.9 10.4 8.8 12.3 4.0 3.1 5.1225 155 70
Colon and Rectum 43.8 41.5 46.2 53.1 49.3 57.2 36.3 33.5 39.31,440 789 651
Liver 6.1 5.3 7.0 9.3 7.8 10.9 3.3 2.5 4.2219 161 58
Pancreas 14.7 13.4 16.1 17.8 15.6 20.2 12.1 10.5 13.9473 262 211
Lung and Bronchus 65.9 63.1 68.9 75.4 70.8 80.3 59.2 55.6 63.02,119 1,077 1,042
Bones and Joints 0.8 0.5 1.2 1.0 0.6 1.7 0.7 0.3 1.229 17 12
Melanoma of the Skin 19.3 17.8 20.8 23.7 21.3 26.4 16.1 14.3 18.1664 371 293
Breast (invasive) 72.2 69.3 75.1 1.2 0.7 2.0 135.8 130.5 141.32,539 18 2,521
Cervix 6.3 5.2 7.6113
Corpus and Uterus, NOS 29.8 27.4 32.4585
Ovary 10.6 9.1 12.2197
Prostate 123.8 118.3 129.52,089
Testis 6.3 5.1 7.6102
Urinary Bladder (includes in situ) 24.2 22.4 26.0 42.6 39.0 46.3 10.1 8.7 11.8762 583 179
Kidney and Renal Pelvis 17.9 16.4 19.4 24.2 21.8 26.8 12.1 10.5 13.8622 401 221
Brain and Nervous System 6.6 5.7 7.5 7.3 6.0 8.8 5.9 4.8 7.2225 122 103
Hodgkin Lymphoma 3.9 3.3 4.7 4.6 3.6 5.7 3.3 2.5 4.3132 78 54
Non-Hodgkin Lymphoma 21.1 19.5 22.8 25.0 22.4 27.8 18.1 16.1 20.2687 368 319
Myeloma 5.9 5.1 6.8 7.5 6.1 9.1 4.7 3.7 5.8198 114 84
Leukemia 16.2 14.8 17.7 19.7 17.4 22.2 13.3 11.7 15.2538 298 240
All Other Sites 64.4 61.6 67.3 60.6 56.5 64.9 69.1 65.3 73.22,133 904 1,229
DATA SOURCE: Illinois Department of Public Health, Illinois State Cancer Registry, data as of November 2018
Breast in Situ (not in total) 39.8 36.9 42.7 758
III - 101

All Sites Combined and Selected Sites, All Races, 2012-2016Figures include invasive cancer with the exception of urinary bladder (includes in situ) and breast cancer in situ as a separate category. Incidence counts are five-year totals.
Rates are per 100,000 age-adjustd to the 2000 U.S. standard million population. Lower confidence intervals (LCI) and upper confidence intervals (UCI) are 95 percent for rates,
Tiwari method.
Site Rate LCI UCI
Both Sexes Males Females
Cancer Incidence Counts and Five-year Age-adjusted Rates by Sex
Rate LCI UCI Rate LCI UCICount Count Count
Williamson
All Sites 519.5 497.8 541.8 568.8 536.0 603.2 485.0 455.7 515.72,274 1,169 1,105
Oral Cavity and Pharynx 13.2 10.0 17.2 20.1 14.4 27.6 6.8 3.9 11.359 42 17
Esophagus 8.7 6.2 12.0 13.7 9.1 20.1 4.4 2.2 8.339 28 11
Stomach 5.7 3.6 8.7 8.5 4.8 14.0 3.7 1.5 7.824 16 8
Colon and Rectum 54.9 48.1 62.5 60.2 49.9 72.1 49.4 40.7 59.5243 124 119
Liver 6.7 4.6 9.5 12.3 8.2 18.0 1.7 0.5 4.733 29 4
Pancreas 14.9 11.5 19.0 15.4 10.3 22.1 14.6 10.3 20.568 31 37
Lung and Bronchus 94.3 85.5 103.9 118.3 103.7 134.5 75.3 64.7 87.3431 245 186
Bones and Joints 0.4 0.0 1.9 0.8 0.0 3.91 0 1
Melanoma of the Skin 29.7 24.5 35.8 36.2 28.2 46.0 24.5 17.8 32.8122 73 49
Breast (invasive) 59.6 52.3 67.7 113.6 99.5 129.3254 0 254
Cervix 10.4 6.1 16.619
Corpus and Uterus, NOS 30.2 23.4 38.670
Ovary 10.9 6.8 16.624
Prostate 93.7 81.1 107.9204
Testis 6.2 2.8 11.79
Urinary Bladder (includes in situ) 21.2 17.2 26.0 37.6 29.6 47.3 8.3 5.0 13.298 78 20
Kidney and Renal Pelvis 24.7 20.0 30.3 33.5 25.7 43.0 16.5 11.2 23.4100 65 35
Brain and Nervous System 9.1 6.3 12.8 10.2 6.0 16.1 8.0 4.4 13.335 19 16
Hodgkin Lymphoma 0.3 0.0 1.7 0.7 0.0 3.51 0 1
Non-Hodgkin Lymphoma 20.1 16.0 24.9 19.0 13.3 26.5 21.0 15.5 28.187 37 50
Myeloma 7.7 5.3 10.9 10.3 6.3 16.1 5.7 3.1 9.934 20 14
Leukemia 15.0 11.4 19.4 17.2 11.7 24.5 14.1 9.4 20.663 32 31
All Other Sites 59.6 52.4 67.6 56.3 46.3 67.8 64.5 53.7 76.8256 117 139
DATA SOURCE: Illinois Department of Public Health, Illinois State Cancer Registry, data as of November 2018
Breast in Situ (not in total) 21.7 15.9 29.0 49
III - 102

All Sites Combined and Selected Sites, All Races, 2012-2016Figures include invasive cancer with the exception of urinary bladder (includes in situ) and breast cancer in situ as a separate category. Incidence counts are five-year totals.
Rates are per 100,000 age-adjustd to the 2000 U.S. standard million population. Lower confidence intervals (LCI) and upper confidence intervals (UCI) are 95 percent for rates,
Tiwari method.
Site Rate LCI UCI
Both Sexes Males Females
Cancer Incidence Counts and Five-year Age-adjusted Rates by Sex
Rate LCI UCI Rate LCI UCICount Count Count
Winnebago
All Sites 475.9 465.5 486.5 499.0 483.4 515.1 464.8 450.5 479.58,339 4,060 4,279
Oral Cavity and Pharynx 11.6 10.1 13.4 18.6 15.8 21.9 5.3 3.9 7.1213 162 51
Esophagus 5.3 4.3 6.5 8.4 6.5 10.6 2.6 1.7 3.996 71 25
Stomach 7.0 5.8 8.3 10.1 8.0 12.6 4.4 3.1 6.0125 83 42
Colon and Rectum 38.5 35.6 41.6 40.9 36.5 45.7 36.6 32.7 40.9674 331 343
Liver 6.8 5.7 8.1 10.8 8.7 13.3 3.2 2.2 4.6128 95 33
Pancreas 12.8 11.2 14.6 12.9 10.6 15.7 12.5 10.4 15.0233 110 123
Lung and Bronchus 69.5 65.6 73.5 78.4 72.3 84.9 63.3 58.3 68.71,259 641 618
Bones and Joints 0.7 0.4 1.3 0.8 0.3 1.8 0.7 0.2 1.612 6 6
Melanoma of the Skin 24.9 22.5 27.6 29.2 25.4 33.4 22.3 19.1 25.9414 226 188
Breast (invasive) 70.3 66.3 74.6 2.0 1.1 3.3 130.8 123.3 138.81,202 16 1,186
Cervix 8.8 6.7 11.366
Corpus and Uterus, NOS 30.6 27.1 34.5289
Ovary 11.1 9.0 13.6104
Prostate 95.4 88.9 102.3831
Testis 6.4 4.6 8.841
Urinary Bladder (includes in situ) 21.5 19.4 23.8 36.8 32.6 41.5 9.6 7.7 11.9379 284 95
Kidney and Renal Pelvis 19.2 17.1 21.4 24.5 21.1 28.3 14.5 12.1 17.2332 196 136
Brain and Nervous System 5.7 4.6 7.1 7.3 5.5 9.6 4.3 3.0 6.093 56 37
Hodgkin Lymphoma 3.1 2.2 4.2 4.0 2.6 5.8 2.2 1.3 3.743 27 16
Non-Hodgkin Lymphoma 19.2 17.1 21.4 23.6 20.2 27.3 15.5 13.0 18.4335 189 146
Myeloma 7.2 6.0 8.6 8.9 7.0 11.3 5.8 4.4 7.5133 74 59
Leukemia 15.1 13.3 17.1 18.4 15.5 21.8 12.6 10.3 15.2255 140 115
All Other Sites 63.8 60.0 67.8 61.5 56.0 67.4 67.8 62.3 73.61,082 481 601
DATA SOURCE: Illinois Department of Public Health, Illinois State Cancer Registry, data as of November 2018
Breast in Situ (not in total) 31.6 27.9 35.7 280
III - 103

All Sites Combined and Selected Sites, All Races, 2012-2016Figures include invasive cancer with the exception of urinary bladder (includes in situ) and breast cancer in situ as a separate category. Incidence counts are five-year totals.
Rates are per 100,000 age-adjustd to the 2000 U.S. standard million population. Lower confidence intervals (LCI) and upper confidence intervals (UCI) are 95 percent for rates,
Tiwari method.
Site Rate LCI UCI
Both Sexes Males Females
Cancer Incidence Counts and Five-year Age-adjusted Rates by Sex
Rate LCI UCI Rate LCI UCICount Count Count
Woodford
All Sites 451.9 424.8 480.3 521.1 479.3 565.7 395.3 359.8 433.51,102 607 495
Oral Cavity and Pharynx 17.1 12.2 23.4 29.2 19.9 41.4 6.7 2.9 13.542 33 9
Esophagus 8.4 5.1 13.2 13.2 7.4 22.0 4.4 1.3 10.821 16 5
Stomach 2.8 1.2 5.9 3.9 1.3 9.8 1.2 0.3 5.48 5 3
Colon and Rectum 43.3 35.1 52.9 53.2 40.1 69.2 35.0 25.1 47.8104 59 45
Liver 5.4 2.9 9.4 8.3 3.9 15.8 2.7 0.7 7.814 10 4
Pancreas 9.7 6.3 14.4 13.9 8.0 22.9 6.3 2.8 12.727 17 10
Lung and Bronchus 54.8 45.7 65.2 57.2 44.0 73.4 53.0 40.8 67.8135 66 69
Bones and Joints 0.7 0.0 3.4 1.4 0.0 6.91 1 0
Melanoma of the Skin 30.6 23.7 38.9 40.3 29.3 54.4 22.5 14.4 33.872 46 26
Breast (invasive) 63.1 53.1 74.5 122.9 103.4 145.2150 0 150
Cervix 5.6 1.7 13.15
Corpus and Uterus, NOS 24.3 16.3 35.131
Ovary 11.8 6.3 20.414
Prostate 110.0 92.3 130.4142
Testis 5.5 1.5 13.44
Urinary Bladder (includes in situ) 23.3 17.6 30.4 40.9 29.8 55.1 8.7 4.4 16.059 47 12
Kidney and Renal Pelvis 16.8 11.9 23.1 24.9 16.4 36.4 9.3 4.7 16.841 29 12
Brain and Nervous System 6.7 3.6 11.5 12.9 6.7 22.3 0.4 0.0 4.414 13 1
Hodgkin Lymphoma 1.5 0.3 4.6 3.1 0.6 9.33 0 3
Non-Hodgkin Lymphoma 22.1 16.4 29.3 24.4 15.7 36.1 21.6 14.0 32.152 26 26
Myeloma 1.9 0.6 4.7 3.2 0.8 8.8 0.6 0.0 4.75 4 1
Leukemia 9.4 5.9 14.4 14.9 8.4 24.5 5.2 2.0 11.623 16 7
All Other Sites 56.3 46.9 67.1 63.9 49.7 81.1 49.9 37.6 65.0135 73 62
DATA SOURCE: Illinois Department of Public Health, Illinois State Cancer Registry, data as of November 2018
Breast in Situ (not in total) 43.5 31.6 58.3 48
III - 104

SECTION IV
County-specific Cancer Incidence Rates by Race
Illinois, 2012-2016
IV - 1

All Sites Combined and Selected Sites, White, 2012-2016Figures include invasive cancer with the exception of urinary bladder (includes in situ) and breast cancer in situ as a separate category. Incidence counts are five-year totals.
Rates are per 100,000 age-adjustd to the 2000 U.S. standard million population. Lower confidence intervals (LCI) and upper confidence intervals (UCI) are 95 percent for rates,
Tiwari method.
Site Rate LCI UCI
Both Sexes Males Females
Cancer Incidence Counts and Five-year Age-adjusted Rates by Sex
Rate LCI UCI Rate LCI UCICount Count Count
Illinois
All Sites 468.3 466.5 470.0 503.8 501.1 506.5 447.9 445.5 450.3279,239 138,308 140,931
Oral Cavity and Pharynx 12.3 12.0 12.6 18.4 17.9 18.9 6.8 6.5 7.17,490 5,314 2,176
Esophagus 5.1 4.9 5.3 9.0 8.7 9.4 1.8 1.7 2.03,146 2,531 615
Stomach 6.5 6.3 6.7 9.2 8.8 9.6 4.3 4.1 4.63,891 2,482 1,409
Colon and Rectum 41.9 41.4 42.4 48.9 48.1 49.8 36.1 35.4 36.825,135 13,264 11,871
Liver 5.8 5.6 5.9 9.1 8.7 9.4 2.9 2.7 3.03,598 2,653 945
Pancreas 13.1 12.8 13.3 15.2 14.7 15.7 11.3 10.9 11.77,965 4,139 3,826
Lung and Bronchus 64.8 64.1 65.4 74.4 73.4 75.5 57.8 57.0 58.639,130 20,083 19,047
Bones and Joints 0.9 0.9 1.0 1.1 1.0 1.2 0.8 0.7 0.9504 289 215
Melanoma of the Skin 22.9 22.5 23.3 27.8 27.2 28.5 19.7 19.1 20.213,232 7,484 5,748
Breast (invasive) 70.6 69.9 71.3 1.3 1.1 1.4 133.1 131.8 134.441,462 343 41,119
Cervix 7.4 7.0 7.71,973
Corpus and Uterus, NOS 30.0 29.4 30.69,737
Ovary 11.5 11.1 11.93,606
Prostate 101.1 99.9 102.329,709
Testis 7.2 6.9 7.51,757
Urinary Bladder (includes in situ) 22.9 22.6 23.3 39.8 39.0 40.6 10.0 9.7 10.413,868 10,463 3,405
Kidney and Renal Pelvis 18.1 17.7 18.4 24.5 23.9 25.1 12.5 12.1 12.910,762 6,804 3,958
Brain and Nervous System 6.9 6.6 7.1 8.0 7.7 8.4 5.8 5.6 6.13,838 2,142 1,696
Hodgkin Lymphoma 2.8 2.7 3.0 3.2 3.0 3.5 2.4 2.2 2.61,440 819 621
Non-Hodgkin Lymphoma 20.5 20.1 20.8 24.7 24.1 25.3 17.1 16.6 17.512,070 6,565 5,505
Myeloma 5.6 5.5 5.8 7.2 6.9 7.5 4.4 4.2 4.73,442 1,956 1,486
Leukemia 13.9 13.6 14.3 17.8 17.3 18.4 10.9 10.5 11.38,020 4,642 3,378
All Other Sites 57.8 57.2 58.5 55.8 54.9 56.8 61.4 60.5 62.333,464 14,869 18,595
DATA SOURCE: Illinois Department of Public Health, Illinois State Cancer Registry, data as of November 2018
Breast in situ (not in total) 33.1 32.4 33.7 9,872
IV - 2

All Sites Combined and Selected Sites, White, 2012-2016Figures include invasive cancer with the exception of urinary bladder (includes in situ) and breast cancer in situ as a separate category. Incidence counts are five-year totals.
Rates are per 100,000 age-adjustd to the 2000 U.S. standard million population. Lower confidence intervals (LCI) and upper confidence intervals (UCI) are 95 percent for rates,
Tiwari method.
Site Rate LCI UCI
Both Sexes Males Females
Cancer Incidence Counts and Five-year Age-adjusted Rates by Sex
Rate LCI UCI Rate LCI UCICount Count Count
Champaign
All Sites 439.5 424.8 454.7 476.0 453.5 499.2 417.1 397.1 437.93,553 1,786 1,767
Oral Cavity and Pharynx 11.1 8.9 13.8 17.3 13.2 22.2 5.8 3.7 8.789 64 25
Esophagus 4.9 3.5 6.7 8.4 5.7 11.8 1.9 0.9 3.843 34 9
Stomach 6.8 5.0 8.9 9.9 6.8 13.9 4.1 2.4 6.654 35 19
Colon and Rectum 33.9 29.9 38.3 43.1 36.5 50.6 25.9 21.2 31.3277 161 116
Liver 4.8 3.4 6.6 7.8 5.3 11.2 2.2 1.0 4.241 31 10
Pancreas 10.8 8.6 13.4 14.8 11.0 19.5 7.2 5.0 10.387 53 34
Lung and Bronchus 53.1 48.2 58.5 57.5 49.9 66.1 50.3 43.8 57.5437 211 226
Bones and Joints 0.8 0.2 1.8 1.0 0.2 2.8 0.6 0.1 2.25 3 2
Melanoma of the Skin 29.6 25.8 33.8 36.9 30.8 43.9 24.3 19.5 30.0234 136 98
Breast (invasive) 70.3 64.4 76.7 1.7 0.6 3.7 131.3 120.1 143.3554 6 548
Cervix 5.5 3.2 8.718
Corpus and Uterus, NOS 26.4 21.7 31.8116
Ovary 14.8 11.2 19.361
Prostate 106.7 96.5 117.8423
Testis 5.5 3.3 8.623
Urinary Bladder (includes in situ) 15.9 13.2 18.9 28.2 22.9 34.4 6.8 4.6 10.0132 102 30
Kidney and Renal Pelvis 15.7 13.0 18.9 24.1 19.1 30.0 8.6 6.0 11.9122 85 37
Brain and Nervous System 7.0 5.3 9.2 9.6 6.6 13.5 5.0 3.0 7.855 34 21
Hodgkin Lymphoma 1.9 1.1 3.2 2.5 1.1 4.8 1.4 0.5 3.216 10 6
Non-Hodgkin Lymphoma 19.1 16.2 22.5 24.4 19.6 30.1 14.9 11.4 19.2159 94 65
Myeloma 6.2 4.5 8.2 9.0 6.1 12.7 3.9 2.2 6.350 33 17
Leukemia 11.9 9.6 14.6 15.3 11.5 19.9 9.2 6.4 12.799 58 41
All Other Sites 58.8 53.4 64.7 52.2 44.8 60.4 67.0 58.9 76.0458 190 268
DATA SOURCE: Illinois Department of Public Health, Illinois State Cancer Registry, data as of November 2018
Breast in situ (not in total) 27.3 22.4 33.1 114
IV - 3

All Sites Combined and Selected Sites, White, 2012-2016Figures include invasive cancer with the exception of urinary bladder (includes in situ) and breast cancer in situ as a separate category. Incidence counts are five-year totals.
Rates are per 100,000 age-adjustd to the 2000 U.S. standard million population. Lower confidence intervals (LCI) and upper confidence intervals (UCI) are 95 percent for rates,
Tiwari method.
Site Rate LCI UCI
Both Sexes Males Females
Cancer Incidence Counts and Five-year Age-adjusted Rates by Sex
Rate LCI UCI Rate LCI UCICount Count Count
Cook
All Sites 446.0 442.9 449.0 479.7 475.0 484.5 428.5 424.4 432.686,213 41,928 44,285
Oral Cavity and Pharynx 11.2 10.7 11.6 16.7 15.9 17.6 6.4 5.9 6.92,191 1,523 668
Esophagus 4.4 4.1 4.7 7.6 7.0 8.2 1.7 1.5 2.0858 664 194
Stomach 8.3 7.9 8.7 11.4 10.7 12.1 5.9 5.4 6.41,606 977 629
Colon and Rectum 40.7 39.8 41.6 48.3 46.8 49.8 34.7 33.5 35.87,932 4,195 3,737
Liver 6.7 6.4 7.1 10.6 9.9 11.3 3.4 3.1 3.81,334 966 368
Pancreas 13.3 12.8 13.9 15.7 14.9 16.6 11.5 10.8 12.22,613 1,347 1,266
Lung and Bronchus 55.8 54.8 56.9 63.4 61.6 65.1 50.6 49.2 52.010,729 5,314 5,415
Bones and Joints 0.9 0.8 1.1 1.1 0.8 1.3 0.8 0.7 1.1169 91 78
Melanoma of the Skin 18.9 18.3 19.5 24.3 23.2 25.3 15.3 14.5 16.13,610 2,092 1,518
Breast (invasive) 69.0 67.8 70.2 1.2 1.0 1.5 129.5 127.2 131.813,159 106 13,053
Cervix 7.3 6.8 7.9684
Corpus and Uterus, NOS 31.7 30.6 32.83,327
Ovary 11.8 11.2 12.51,214
Prostate 99.2 97.1 101.39,175
Testis 7.0 6.5 7.6650
Urinary Bladder (includes in situ) 22.1 21.4 22.8 38.2 36.8 39.6 10.3 9.7 10.94,278 3,147 1,131
Kidney and Renal Pelvis 15.5 14.9 16.1 21.1 20.2 22.1 10.6 10.0 11.33,005 1,892 1,113
Brain and Nervous System 6.3 6.0 6.7 7.4 6.8 8.0 5.4 4.9 5.91,193 661 532
Hodgkin Lymphoma 3.0 2.7 3.3 3.5 3.1 3.9 2.5 2.2 2.9537 308 229
Non-Hodgkin Lymphoma 20.9 20.3 21.6 25.1 24.1 26.3 17.6 16.8 18.43,988 2,128 1,860
Myeloma 5.6 5.3 6.0 7.0 6.5 7.6 4.5 4.1 4.91,095 607 488
Leukemia 13.5 13.0 14.0 17.8 16.9 18.8 10.1 9.5 10.82,532 1,494 1,038
All Other Sites 54.2 53.2 55.3 53.2 51.6 54.8 56.8 55.3 58.310,334 4,591 5,743
DATA SOURCE: Illinois Department of Public Health, Illinois State Cancer Registry, data as of November 2018
Breast in situ (not in total) 33.5 32.4 34.8 3,229
IV - 4

All Sites Combined and Selected Sites, White, 2012-2016Figures include invasive cancer with the exception of urinary bladder (includes in situ) and breast cancer in situ as a separate category. Incidence counts are five-year totals.
Rates are per 100,000 age-adjustd to the 2000 U.S. standard million population. Lower confidence intervals (LCI) and upper confidence intervals (UCI) are 95 percent for rates,
Tiwari method.
Site Rate LCI UCI
Both Sexes Males Females
Cancer Incidence Counts and Five-year Age-adjusted Rates by Sex
Rate LCI UCI Rate LCI UCICount Count Count
DuPage
All Sites 474.8 468.3 481.4 498.3 488.3 508.5 466.6 457.7 475.621,468 10,187 11,281
Oral Cavity and Pharynx 11.8 10.8 12.9 17.7 15.9 19.6 6.9 5.9 8.1553 384 169
Esophagus 4.8 4.2 5.5 8.5 7.2 9.9 1.9 1.4 2.5225 176 49
Stomach 6.3 5.5 7.1 9.7 8.3 11.2 3.6 2.9 4.4285 195 90
Colon and Rectum 38.9 37.1 40.9 43.9 41.0 47.0 34.6 32.3 37.11,772 897 875
Liver 4.6 4.0 5.3 7.3 6.2 8.6 2.4 1.8 3.1218 157 61
Pancreas 12.0 11.0 13.0 13.9 12.3 15.7 10.5 9.3 11.8560 280 280
Lung and Bronchus 55.0 52.8 57.3 61.2 57.7 64.9 51.2 48.4 54.22,458 1,193 1,265
Bones and Joints 1.3 1.0 1.7 1.7 1.2 2.5 0.9 0.5 1.550 32 18
Melanoma of the Skin 22.7 21.2 24.2 28.2 25.9 30.7 18.8 17.0 20.8997 581 416
Breast (invasive) 80.6 77.9 83.4 1.4 0.9 2.0 150.1 145.1 155.33,639 27 3,612
Cervix 5.8 4.8 7.0124
Corpus and Uterus, NOS 31.6 29.4 33.9818
Ovary 12.8 11.4 14.4310
Prostate 108.7 104.3 113.32,433
Testis 7.9 6.6 9.3140
Urinary Bladder (includes in situ) 23.4 22.0 24.9 41.0 38.1 44.1 10.2 8.9 11.51,038 781 257
Kidney and Renal Pelvis 16.6 15.4 17.9 23.4 21.3 25.6 10.9 9.6 12.4760 492 268
Brain and Nervous System 7.2 6.4 8.1 8.1 6.9 9.5 6.4 5.4 7.6314 170 144
Hodgkin Lymphoma 2.7 2.2 3.3 3.2 2.4 4.1 2.3 1.7 3.1107 60 47
Non-Hodgkin Lymphoma 21.5 20.1 23.0 26.6 24.3 29.1 17.5 15.9 19.3957 522 435
Myeloma 6.4 5.7 7.2 8.5 7.2 10.0 4.9 4.0 5.9290 166 124
Leukemia 16.0 14.8 17.3 20.7 18.6 22.9 12.6 11.1 14.1683 392 291
All Other Sites 62.8 60.3 65.2 56.7 53.3 60.3 70.5 67.0 74.22,737 1,109 1,628
DATA SOURCE: Illinois Department of Public Health, Illinois State Cancer Registry, data as of November 2018
Breast in situ (not in total) 45.2 42.4 48.1 1,070
IV - 5

All Sites Combined and Selected Sites, White, 2012-2016Figures include invasive cancer with the exception of urinary bladder (includes in situ) and breast cancer in situ as a separate category. Incidence counts are five-year totals.
Rates are per 100,000 age-adjustd to the 2000 U.S. standard million population. Lower confidence intervals (LCI) and upper confidence intervals (UCI) are 95 percent for rates,
Tiwari method.
Site Rate LCI UCI
Both Sexes Males Females
Cancer Incidence Counts and Five-year Age-adjusted Rates by Sex
Rate LCI UCI Rate LCI UCICount Count Count
Kane
All Sites 444.5 435.9 453.2 480.7 467.3 494.3 423.5 412.1 435.210,681 5,304 5,377
Oral Cavity and Pharynx 10.5 9.3 11.9 16.1 13.9 18.6 5.2 4.0 6.7269 201 68
Esophagus 3.6 2.9 4.5 6.4 4.9 8.1 1.2 0.7 1.989 72 17
Stomach 6.7 5.7 7.9 8.8 7.1 10.8 4.9 3.7 6.3158 96 62
Colon and Rectum 37.2 34.7 39.8 44.6 40.6 49.0 31.1 28.0 34.3879 481 398
Liver 5.3 4.4 6.3 8.6 6.9 10.5 2.6 1.8 3.7135 101 34
Pancreas 12.8 11.3 14.4 16.0 13.5 18.7 10.4 8.7 12.4293 163 130
Lung and Bronchus 52.4 49.4 55.5 61.0 56.1 66.2 46.3 42.5 50.21,221 628 593
Bones and Joints 1.1 0.7 1.6 1.2 0.7 2.1 0.9 0.5 1.725 14 11
Melanoma of the Skin 23.3 21.4 25.4 28.0 24.8 31.4 20.1 17.7 22.8555 303 252
Breast (invasive) 66.3 63.0 69.7 1.6 0.9 2.6 124.9 118.7 131.31,614 18 1,596
Cervix 6.6 5.2 8.378
Corpus and Uterus, NOS 27.8 25.0 30.9373
Ovary 11.1 9.3 13.1142
Prostate 101.1 95.3 107.11,224
Testis 7.7 6.1 9.583
Urinary Bladder (includes in situ) 25.2 23.1 27.4 43.6 39.4 48.0 10.9 9.1 12.9579 439 140
Kidney and Renal Pelvis 16.8 15.2 18.5 22.6 19.8 25.6 11.7 9.9 13.8411 259 152
Brain and Nervous System 7.7 6.6 8.9 8.8 7.1 10.8 6.7 5.3 8.3181 98 83
Hodgkin Lymphoma 2.3 1.7 3.1 2.6 1.7 3.7 2.1 1.3 3.253 30 23
Non-Hodgkin Lymphoma 19.0 17.3 20.9 22.4 19.5 25.5 16.4 14.2 18.9447 239 208
Myeloma 6.1 5.1 7.2 7.9 6.3 9.8 4.7 3.5 6.0149 88 61
Leukemia 14.0 12.5 15.6 17.8 15.3 20.6 11.2 9.4 13.2330 190 140
All Other Sites 59.6 56.4 62.8 54.1 49.6 58.8 66.8 62.2 71.61,393 577 816
DATA SOURCE: Illinois Department of Public Health, Illinois State Cancer Registry, data as of November 2018
Breast in situ (not in total) 31.6 28.6 34.9 409
IV - 6

All Sites Combined and Selected Sites, White, 2012-2016Figures include invasive cancer with the exception of urinary bladder (includes in situ) and breast cancer in situ as a separate category. Incidence counts are five-year totals.
Rates are per 100,000 age-adjustd to the 2000 U.S. standard million population. Lower confidence intervals (LCI) and upper confidence intervals (UCI) are 95 percent for rates,
Tiwari method.
Site Rate LCI UCI
Both Sexes Males Females
Cancer Incidence Counts and Five-year Age-adjusted Rates by Sex
Rate LCI UCI Rate LCI UCICount Count Count
Kankakee
All Sites 485.2 466.8 504.2 521.0 493.4 549.7 459.5 434.6 485.62,752 1,398 1,354
Oral Cavity and Pharynx 12.9 10.0 16.4 20.0 14.8 26.4 6.1 3.5 9.971 53 18
Esophagus 5.4 3.7 7.7 9.6 6.3 14.2 1.8 0.7 4.333 27 6
Stomach 4.4 2.8 6.5 6.8 4.1 10.9 2.2 0.9 4.726 19 7
Colon and Rectum 42.7 37.5 48.5 50.3 42.1 59.9 35.4 29.1 42.8251 136 115
Liver 6.0 4.1 8.4 9.7 6.3 14.3 2.5 1.1 5.235 27 8
Pancreas 14.3 11.4 17.9 15.7 11.3 21.4 13.5 9.6 18.585 43 42
Lung and Bronchus 76.9 69.8 84.6 84.9 74.1 97.0 70.4 61.1 80.7449 230 219
Bones and Joints 0.5 0.1 1.7 0.5 0.0 2.6 0.5 0.0 2.52 1 1
Melanoma of the Skin 22.5 18.6 27.0 27.9 21.7 35.3 18.1 13.2 24.2122 73 49
Breast (invasive) 70.9 63.8 78.6 0.8 0.1 2.9 134.0 120.4 148.7383 2 381
Cervix 8.9 5.4 14.020
Corpus and Uterus, NOS 30.8 24.7 38.193
Ovary 8.4 5.4 12.625
Prostate 89.0 78.2 101.0253
Testis 9.3 5.5 14.618
Urinary Bladder (includes in situ) 25.9 21.9 30.4 44.8 37.0 53.7 10.4 7.2 14.8155 120 35
Kidney and Renal Pelvis 22.3 18.5 26.7 28.9 22.6 36.5 16.5 12.2 21.9127 76 51
Brain and Nervous System 8.2 5.8 11.2 8.2 4.9 12.9 8.4 5.2 12.941 19 22
Hodgkin Lymphoma 3.7 2.1 5.9 4.2 1.9 7.8 3.1 1.3 6.318 10 8
Non-Hodgkin Lymphoma 19.3 15.8 23.4 26.4 20.5 33.5 13.5 9.6 18.6112 71 41
Myeloma 5.2 3.5 7.4 4.8 2.6 8.3 5.4 3.1 8.930 14 16
Leukemia 15.2 12.1 19.0 19.1 14.0 25.5 12.1 8.3 17.083 48 35
All Other Sites 57.7 51.4 64.7 60.1 50.9 70.6 57.5 48.6 67.6320 158 162
DATA SOURCE: Illinois Department of Public Health, Illinois State Cancer Registry, data as of November 2018
Breast in situ (not in total) 16.2 11.8 21.9 46
IV - 7

All Sites Combined and Selected Sites, White, 2012-2016Figures include invasive cancer with the exception of urinary bladder (includes in situ) and breast cancer in situ as a separate category. Incidence counts are five-year totals.
Rates are per 100,000 age-adjustd to the 2000 U.S. standard million population. Lower confidence intervals (LCI) and upper confidence intervals (UCI) are 95 percent for rates,
Tiwari method.
Site Rate LCI UCI
Both Sexes Males Females
Cancer Incidence Counts and Five-year Age-adjusted Rates by Sex
Rate LCI UCI Rate LCI UCICount Count Count
Lake
All Sites 457.3 449.8 464.9 472.1 460.8 483.6 451.8 441.5 462.314,988 7,213 7,775
Oral Cavity and Pharynx 11.1 10.0 12.3 14.8 12.9 16.8 7.8 6.5 9.2387 249 138
Esophagus 5.0 4.2 5.8 8.2 6.8 9.8 2.2 1.5 3.0168 131 37
Stomach 6.2 5.4 7.2 8.9 7.4 10.6 4.0 3.1 5.1202 133 69
Colon and Rectum 36.5 34.4 38.6 41.1 37.9 44.6 32.4 29.8 35.31,196 626 570
Liver 4.1 3.4 4.9 6.1 4.9 7.5 2.3 1.6 3.2140 99 41
Pancreas 14.4 13.1 15.8 16.5 14.4 18.8 12.4 10.8 14.2463 245 218
Lung and Bronchus 57.3 54.6 60.0 59.9 55.9 64.2 55.6 52.0 59.31,822 867 955
Bones and Joints 0.9 0.6 1.3 1.2 0.7 1.9 0.6 0.3 1.128 19 9
Melanoma of the Skin 24.8 23.1 26.6 29.0 26.3 32.0 22.0 19.8 24.5806 444 362
Breast (invasive) 76.5 73.5 79.7 1.4 0.9 2.2 144.6 138.8 150.52,542 22 2,520
Cervix 5.1 4.0 6.479
Corpus and Uterus, NOS 30.1 27.6 32.9549
Ovary 10.7 9.1 12.4185
Prostate 94.7 89.9 99.71,598
Testis 6.2 4.9 7.786
Urinary Bladder (includes in situ) 25.3 23.5 27.1 43.7 40.2 47.4 10.6 9.0 12.2802 618 184
Kidney and Renal Pelvis 16.7 15.3 18.2 24.9 22.4 27.6 9.7 8.2 11.3560 391 169
Brain and Nervous System 6.8 5.9 7.8 7.5 6.2 9.1 6.4 5.2 7.8213 112 101
Hodgkin Lymphoma 2.1 1.6 2.8 2.4 1.6 3.3 2.0 1.3 2.961 35 26
Non-Hodgkin Lymphoma 23.1 21.4 24.9 29.5 26.6 32.5 18.0 16.0 20.2740 430 310
Myeloma 5.2 4.5 6.1 6.1 4.8 7.5 4.6 3.6 5.7172 91 81
Leukemia 15.3 14.0 16.8 18.4 16.2 20.9 12.7 11.0 14.6480 268 212
All Other Sites 54.2 51.6 57.0 51.7 47.9 55.7 58.1 54.3 62.01,709 749 960
DATA SOURCE: Illinois Department of Public Health, Illinois State Cancer Registry, data as of November 2018
Breast in situ (not in total) 39.2 36.3 42.4 682
IV - 8

All Sites Combined and Selected Sites, White, 2012-2016Figures include invasive cancer with the exception of urinary bladder (includes in situ) and breast cancer in situ as a separate category. Incidence counts are five-year totals.
Rates are per 100,000 age-adjustd to the 2000 U.S. standard million population. Lower confidence intervals (LCI) and upper confidence intervals (UCI) are 95 percent for rates,
Tiwari method.
Site Rate LCI UCI
Both Sexes Males Females
Cancer Incidence Counts and Five-year Age-adjusted Rates by Sex
Rate LCI UCI Rate LCI UCICount Count Count
Macon
All Sites 546.5 527.3 566.3 585.4 557.0 615.1 524.0 497.5 551.63,391 1,692 1,699
Oral Cavity and Pharynx 17.9 14.7 21.8 25.1 19.5 32.0 11.4 8.0 15.9114 74 40
Esophagus 5.8 4.1 8.1 10.7 7.3 15.4 1.8 0.8 4.141 33 8
Stomach 7.2 5.0 10.0 9.5 6.1 14.3 5.2 2.7 9.140 26 14
Colon and Rectum 52.9 47.1 59.4 63.9 54.6 74.5 44.6 37.1 53.3329 181 148
Liver 7.1 5.2 9.6 13.0 9.2 18.0 1.9 0.9 4.249 40 9
Pancreas 13.8 11.0 17.1 13.7 9.8 18.9 13.4 9.8 18.093 42 51
Lung and Bronchus 92.6 85.3 100.5 105.6 94.2 118.3 83.7 74.0 94.5612 317 295
Bones and Joints 0.4 0.0 1.7 0.3 0.0 2.2 0.6 0.0 3.12 1 1
Melanoma of the Skin 31.0 26.3 36.3 34.7 28.0 42.7 29.3 22.6 37.3177 99 78
Breast (invasive) 70.3 63.4 77.9 0.7 0.1 2.9 131.3 118.2 145.7421 2 419
Cervix 13.4 8.8 19.630
Corpus and Uterus, NOS 31.5 25.7 38.5112
Ovary 9.5 6.4 13.932
Prostate 106.5 95.0 119.2325
Testis 6.4 3.3 11.212
Urinary Bladder (includes in situ) 21.8 18.3 25.8 38.5 31.6 46.6 9.5 6.6 13.7148 113 35
Kidney and Renal Pelvis 22.4 18.6 26.8 26.9 20.9 34.1 18.8 14.1 24.8136 75 61
Brain and Nervous System 7.5 5.2 10.4 9.7 6.0 14.8 5.5 3.0 9.340 24 16
Hodgkin Lymphoma 3.4 1.8 5.7 3.0 1.1 6.7 3.7 1.6 7.514 6 8
Non-Hodgkin Lymphoma 21.0 17.3 25.2 23.7 18.0 30.7 18.9 14.4 24.5130 63 67
Myeloma 4.9 3.4 7.0 5.3 3.0 8.8 4.5 2.6 7.535 17 18
Leukemia 12.5 9.7 15.9 17.6 12.7 23.8 8.1 5.2 12.176 46 30
All Other Sites 73.4 66.1 81.3 70.6 60.7 81.8 77.3 66.7 89.2423 196 227
DATA SOURCE: Illinois Department of Public Health, Illinois State Cancer Registry, data as of November 2018
Breast in situ (not in total) 36.9 30.0 45.0 114
IV - 9

All Sites Combined and Selected Sites, White, 2012-2016Figures include invasive cancer with the exception of urinary bladder (includes in situ) and breast cancer in situ as a separate category. Incidence counts are five-year totals.
Rates are per 100,000 age-adjustd to the 2000 U.S. standard million population. Lower confidence intervals (LCI) and upper confidence intervals (UCI) are 95 percent for rates,
Tiwari method.
Site Rate LCI UCI
Both Sexes Males Females
Cancer Incidence Counts and Five-year Age-adjusted Rates by Sex
Rate LCI UCI Rate LCI UCICount Count Count
Madison
All Sites 485.6 474.3 497.1 513.2 496.1 530.8 474.6 459.1 490.57,410 3,568 3,842
Oral Cavity and Pharynx 12.8 11.1 14.8 18.8 15.7 22.2 7.7 5.8 10.1202 141 61
Esophagus 6.6 5.4 8.1 12.2 9.8 15.1 2.0 1.1 3.3106 90 16
Stomach 4.3 3.4 5.5 5.6 3.9 7.7 3.4 2.3 5.069 38 31
Colon and Rectum 39.7 36.6 43.0 45.2 40.2 50.6 35.8 31.8 40.3621 314 307
Liver 6.9 5.7 8.4 10.3 8.1 13.0 3.7 2.6 5.3113 79 34
Pancreas 13.2 11.4 15.1 14.9 12.1 18.2 12.0 9.8 14.7209 103 106
Lung and Bronchus 81.0 76.5 85.6 93.4 86.2 101.0 72.2 66.5 78.31,275 648 627
Bones and Joints 1.4 0.8 2.3 2.3 1.2 3.9 0.6 0.2 1.617 13 4
Melanoma of the Skin 24.4 21.8 27.2 27.7 23.8 32.0 23.3 19.7 27.5348 189 159
Breast (invasive) 72.1 67.7 76.7 1.1 0.4 2.3 135.0 126.7 143.71,075 7 1,068
Cervix 8.4 6.2 11.054
Corpus and Uterus, NOS 29.3 25.7 33.3252
Ovary 10.6 8.4 13.384
Prostate 84.7 78.1 91.8635
Testis 5.3 3.5 7.628
Urinary Bladder (includes in situ) 24.2 21.8 26.9 42.5 37.7 47.9 10.8 8.7 13.3383 288 95
Kidney and Renal Pelvis 23.8 21.3 26.5 28.6 24.6 33.2 19.7 16.6 23.2348 193 155
Brain and Nervous System 8.4 6.9 10.2 8.6 6.4 11.3 8.3 6.2 10.9112 55 57
Hodgkin Lymphoma 2.5 1.7 3.6 2.8 1.6 4.5 2.3 1.2 3.832 17 15
Non-Hodgkin Lymphoma 19.8 17.6 22.2 24.5 20.9 28.6 16.2 13.5 19.3303 167 136
Myeloma 5.5 4.4 6.9 6.7 4.9 9.0 4.7 3.3 6.589 48 41
Leukemia 13.1 11.3 15.1 17.7 14.6 21.3 9.7 7.6 12.3197 116 81
All Other Sites 58.6 54.6 62.8 60.3 54.4 66.7 58.7 53.2 64.7858 399 459
DATA SOURCE: Illinois Department of Public Health, Illinois State Cancer Registry, data as of November 2018
Breast in situ (not in total) 32.2 28.1 36.8 239
IV - 10

All Sites Combined and Selected Sites, White, 2012-2016Figures include invasive cancer with the exception of urinary bladder (includes in situ) and breast cancer in situ as a separate category. Incidence counts are five-year totals.
Rates are per 100,000 age-adjustd to the 2000 U.S. standard million population. Lower confidence intervals (LCI) and upper confidence intervals (UCI) are 95 percent for rates,
Tiwari method.
Site Rate LCI UCI
Both Sexes Males Females
Cancer Incidence Counts and Five-year Age-adjusted Rates by Sex
Rate LCI UCI Rate LCI UCICount Count Count
Peoria
All Sites 489.5 474.9 504.5 536.0 513.8 558.9 458.7 438.9 479.14,559 2,306 2,253
Oral Cavity and Pharynx 12.4 10.2 15.1 18.8 14.8 23.7 6.9 4.7 9.9114 80 34
Esophagus 7.3 5.7 9.3 13.8 10.4 17.9 1.9 1.0 3.771 60 11
Stomach 4.7 3.4 6.3 6.2 4.1 9.2 3.3 2.0 5.347 28 19
Colon and Rectum 43.9 39.7 48.5 54.1 47.2 61.9 34.9 29.8 40.7416 230 186
Liver 4.9 3.6 6.5 8.6 6.2 11.9 1.5 0.7 3.250 41 9
Pancreas 13.1 10.9 15.7 17.8 13.9 22.5 9.4 7.0 12.5128 74 54
Lung and Bronchus 81.2 75.6 87.3 95.1 86.1 105.0 70.5 63.4 78.4790 419 371
Bones and Joints 1.1 0.5 2.2 1.0 0.2 2.9 1.1 0.3 2.88 3 5
Melanoma of the Skin 28.4 24.9 32.3 39.9 33.9 46.7 20.0 16.0 24.8257 164 93
Breast (invasive) 72.5 66.8 78.6 0.2 0.0 1.4 136.8 125.9 148.4647 1 646
Cervix 9.1 6.1 12.934
Corpus and Uterus, NOS 27.8 23.2 33.1140
Ovary 10.9 8.1 14.456
Prostate 103.3 94.1 113.2484
Testis 7.1 4.4 10.723
Urinary Bladder (includes in situ) 22.5 19.6 25.8 38.9 33.1 45.5 9.4 7.0 12.5219 165 54
Kidney and Renal Pelvis 22.6 19.5 26.1 33.5 28.1 39.8 13.5 10.2 17.5202 140 62
Brain and Nervous System 6.3 4.6 8.3 7.1 4.6 10.4 5.8 3.7 8.853 28 25
Hodgkin Lymphoma 1.5 0.7 2.6 1.9 0.8 3.9 1.0 0.2 2.712 8 4
Non-Hodgkin Lymphoma 18.6 15.9 21.7 17.4 13.6 22.0 20.0 16.1 24.6177 75 102
Myeloma 5.1 3.7 6.8 6.6 4.3 9.8 3.8 2.3 6.047 26 21
Leukemia 11.8 9.5 14.4 15.2 11.5 19.8 9.2 6.5 12.6101 59 42
All Other Sites 55.5 50.4 60.9 49.1 42.4 56.7 61.8 54.4 69.9483 198 285
DATA SOURCE: Illinois Department of Public Health, Illinois State Cancer Registry, data as of November 2018
Breast in situ (not in total) 32.6 27.5 38.5 158
IV - 11

All Sites Combined and Selected Sites, White, 2012-2016Figures include invasive cancer with the exception of urinary bladder (includes in situ) and breast cancer in situ as a separate category. Incidence counts are five-year totals.
Rates are per 100,000 age-adjustd to the 2000 U.S. standard million population. Lower confidence intervals (LCI) and upper confidence intervals (UCI) are 95 percent for rates,
Tiwari method.
Site Rate LCI UCI
Both Sexes Males Females
Cancer Incidence Counts and Five-year Age-adjusted Rates by Sex
Rate LCI UCI Rate LCI UCICount Count Count
Rock Island
All Sites 451.7 437.1 466.8 480.3 458.6 502.8 436.6 416.4 457.63,918 1,949 1,969
Oral Cavity and Pharynx 11.3 9.1 13.9 15.9 12.2 20.4 7.4 5.0 10.6101 67 34
Esophagus 5.6 4.1 7.5 10.6 7.6 14.4 1.5 0.6 3.551 44 7
Stomach 6.1 4.5 8.1 8.6 5.9 12.2 4.2 2.5 6.854 33 21
Colon and Rectum 37.2 33.1 41.7 45.2 38.6 52.7 30.9 25.8 36.8322 177 145
Liver 6.3 4.7 8.2 11.4 8.4 15.3 1.7 0.7 3.658 50 8
Pancreas 13.8 11.4 16.5 15.2 11.6 19.7 12.6 9.6 16.4124 62 62
Lung and Bronchus 62.6 57.5 68.1 74.2 66.0 83.2 53.7 47.3 60.8577 310 267
Bones and Joints 0.3 0.0 1.0 0.2 0.0 1.5 0.4 0.0 1.92 1 1
Melanoma of the Skin 27.8 24.1 32.0 31.3 25.8 37.7 26.6 21.4 32.8224 121 103
Breast (invasive) 66.7 61.1 72.8 1.4 0.4 3.4 125.2 114.4 136.8563 5 558
Cervix 10.5 7.0 15.033
Corpus and Uterus, NOS 30.2 25.3 35.9143
Ovary 12.1 9.0 16.157
Prostate 91.1 82.2 100.7403
Testis 9.6 6.2 14.126
Urinary Bladder (includes in situ) 21.3 18.4 24.6 37.5 31.7 44.2 8.7 6.4 11.9200 153 47
Kidney and Renal Pelvis 16.3 13.6 19.5 20.6 16.2 25.8 12.6 9.3 16.8137 82 55
Brain and Nervous System 7.9 5.9 10.3 6.6 4.2 9.9 9.1 6.2 13.161 26 35
Hodgkin Lymphoma 4.4 2.9 6.4 5.1 2.9 8.4 3.7 1.8 6.529 16 13
Non-Hodgkin Lymphoma 17.5 14.6 20.7 20.1 15.8 25.4 15.4 11.8 19.9149 79 70
Myeloma 5.4 4.0 7.2 6.8 4.6 10.0 4.3 2.6 6.851 30 21
Leukemia 12.4 9.9 15.3 15.2 11.3 19.9 10.4 7.3 14.498 56 42
All Other Sites 53.9 48.8 59.4 53.8 46.5 61.9 55.4 48.2 63.5455 208 247
DATA SOURCE: Illinois Department of Public Health, Illinois State Cancer Registry, data as of November 2018
Breast in situ (not in total) 27.9 22.8 33.8 120
IV - 12

All Sites Combined and Selected Sites, White, 2012-2016Figures include invasive cancer with the exception of urinary bladder (includes in situ) and breast cancer in situ as a separate category. Incidence counts are five-year totals.
Rates are per 100,000 age-adjustd to the 2000 U.S. standard million population. Lower confidence intervals (LCI) and upper confidence intervals (UCI) are 95 percent for rates,
Tiwari method.
Site Rate LCI UCI
Both Sexes Males Females
Cancer Incidence Counts and Five-year Age-adjusted Rates by Sex
Rate LCI UCI Rate LCI UCICount Count Count
Sangamon
All Sites 528.3 514.4 542.5 582.5 560.8 604.8 492.6 474.1 511.65,840 2,898 2,942
Oral Cavity and Pharynx 16.1 13.7 18.7 25.6 21.3 30.6 7.7 5.6 10.4180 133 47
Esophagus 4.4 3.2 5.8 7.9 5.7 10.9 1.5 0.7 3.051 41 10
Stomach 5.5 4.2 7.2 6.5 4.3 9.3 4.6 3.0 6.859 31 28
Colon and Rectum 42.5 38.6 46.6 50.6 44.3 57.6 36.0 31.3 41.2474 242 232
Liver 7.3 5.9 9.1 12.0 9.2 15.4 3.4 2.1 5.487 66 21
Pancreas 11.8 9.9 14.1 12.9 9.9 16.5 11.0 8.5 14.1138 67 71
Lung and Bronchus 79.7 74.5 85.2 93.0 84.5 102.2 70.7 64.1 77.8910 462 448
Bones and Joints 1.4 0.7 2.4 2.0 0.9 3.8 0.9 0.2 2.414 10 4
Melanoma of the Skin 29.5 26.1 33.1 30.5 25.6 36.0 30.3 25.5 35.8304 148 156
Breast (invasive) 80.9 75.5 86.7 1.7 0.8 3.4 147.7 137.5 158.4875 9 866
Cervix 7.4 5.0 10.534
Corpus and Uterus, NOS 21.8 18.2 26.0141
Ovary 13.7 10.8 17.284
Prostate 120.8 111.4 130.9643
Testis 9.9 6.9 13.736
Urinary Bladder (includes in situ) 24.3 21.5 27.4 43.5 37.8 50.0 9.9 7.6 12.7279 213 66
Kidney and Renal Pelvis 24.1 21.2 27.3 33.8 28.8 39.5 15.8 12.7 19.6270 172 98
Brain and Nervous System 6.8 5.2 8.8 5.7 3.7 8.5 7.9 5.5 11.165 27 38
Hodgkin Lymphoma 2.9 1.9 4.3 3.0 1.6 5.3 2.8 1.4 4.925 13 12
Non-Hodgkin Lymphoma 22.9 20.1 26.0 30.3 25.4 35.8 17.0 13.9 20.7256 146 110
Myeloma 5.7 4.4 7.4 7.6 5.3 10.6 4.6 3.1 6.866 37 29
Leukemia 17.1 14.6 20.0 22.4 18.2 27.4 12.7 9.8 16.2179 104 75
All Other Sites 63.5 58.6 68.7 62.7 55.6 70.5 65.2 58.4 72.7670 298 372
DATA SOURCE: Illinois Department of Public Health, Illinois State Cancer Registry, data as of November 2018
Breast in situ (not in total) 38.6 33.4 44.5 213
IV - 13

All Sites Combined and Selected Sites, White, 2012-2016Figures include invasive cancer with the exception of urinary bladder (includes in situ) and breast cancer in situ as a separate category. Incidence counts are five-year totals.
Rates are per 100,000 age-adjustd to the 2000 U.S. standard million population. Lower confidence intervals (LCI) and upper confidence intervals (UCI) are 95 percent for rates,
Tiwari method.
Site Rate LCI UCI
Both Sexes Males Females
Cancer Incidence Counts and Five-year Age-adjusted Rates by Sex
Rate LCI UCI Rate LCI UCICount Count Count
St Clair
All Sites 478.0 464.9 491.5 511.6 491.6 532.2 458.0 440.2 476.45,293 2,601 2,692
Oral Cavity and Pharynx 14.8 12.6 17.3 21.7 17.9 26.2 8.7 6.4 11.6167 117 50
Esophagus 6.1 4.7 7.8 10.6 7.9 13.9 2.2 1.2 3.969 56 13
Stomach 3.8 2.7 5.2 6.3 4.2 9.1 1.7 0.9 3.243 31 12
Colon and Rectum 40.2 36.4 44.3 44.7 38.8 51.2 35.6 30.8 40.8440 218 222
Liver 6.3 4.9 7.9 9.9 7.4 13.1 3.0 1.8 4.873 54 19
Pancreas 12.6 10.6 14.9 14.3 11.1 18.1 11.1 8.6 14.2145 74 71
Lung and Bronchus 76.9 71.8 82.3 86.8 78.7 95.6 69.6 63.1 76.7873 439 434
Bones and Joints 0.5 0.2 1.2 0.9 0.2 2.3 0.3 0.0 1.46 4 2
Melanoma of the Skin 25.7 22.7 29.1 33.0 27.9 38.7 21.2 17.2 25.8266 159 107
Breast (invasive) 73.2 68.0 78.6 0.8 0.2 2.1 138.1 128.3 148.5795 4 791
Cervix 8.3 5.8 11.438
Corpus and Uterus, NOS 27.8 23.7 32.6169
Ovary 11.1 8.5 14.365
Prostate 85.1 77.4 93.3475
Testis 7.7 5.3 10.932
Urinary Bladder (includes in situ) 25.4 22.5 28.6 45.7 39.8 52.3 9.6 7.3 12.4288 223 65
Kidney and Renal Pelvis 20.4 17.8 23.4 28.8 24.3 33.9 12.8 10.0 16.2229 154 75
Brain and Nervous System 7.7 6.0 9.7 8.7 6.2 11.8 6.9 4.7 9.878 44 34
Hodgkin Lymphoma 2.6 1.6 4.0 3.1 1.6 5.3 2.1 1.0 4.122 13 9
Non-Hodgkin Lymphoma 18.8 16.3 21.7 22.2 18.2 26.9 16.0 12.9 19.8207 111 96
Myeloma 7.5 5.9 9.3 10.4 7.6 13.8 5.5 3.8 7.884 49 35
Leukemia 12.9 10.8 15.4 15.4 12.0 19.5 10.8 8.2 14.0138 73 65
All Other Sites 54.6 50.1 59.3 55.6 49.0 62.8 55.6 49.4 62.4591 271 320
DATA SOURCE: Illinois Department of Public Health, Illinois State Cancer Registry, data as of November 2018
Breast in situ (not in total) 35.8 30.8 41.3 201
IV - 14

All Sites Combined and Selected Sites, White, 2012-2016Figures include invasive cancer with the exception of urinary bladder (includes in situ) and breast cancer in situ as a separate category. Incidence counts are five-year totals.
Rates are per 100,000 age-adjustd to the 2000 U.S. standard million population. Lower confidence intervals (LCI) and upper confidence intervals (UCI) are 95 percent for rates,
Tiwari method.
Site Rate LCI UCI
Both Sexes Males Females
Cancer Incidence Counts and Five-year Age-adjusted Rates by Sex
Rate LCI UCI Rate LCI UCICount Count Count
Vermilion
All Sites 515.0 493.9 536.8 555.7 524.4 588.5 490.1 461.0 520.82,428 1,239 1,189
Oral Cavity and Pharynx 13.6 10.3 17.6 18.2 13.0 25.1 9.3 5.7 14.664 41 23
Esophagus 4.9 3.2 7.4 8.7 5.3 13.8 2.2 0.8 5.326 20 6
Stomach 5.1 3.3 7.7 7.7 4.5 12.5 2.9 1.2 6.226 18 8
Colon and Rectum 54.9 48.0 62.5 63.5 52.9 75.6 47.3 38.6 57.7251 135 116
Liver 4.3 2.7 6.7 6.0 3.4 10.4 2.6 1.0 5.822 15 7
Pancreas 12.5 9.5 16.2 13.4 9.0 19.4 11.7 7.9 16.963 31 32
Lung and Bronchus 90.6 82.2 99.6 103.2 90.2 117.6 81.2 70.4 93.4451 237 214
Bones and Joints 2.6 1.1 5.0 2.7 0.8 6.4 2.5 0.6 6.69 5 4
Melanoma of the Skin 25.0 20.4 30.4 32.3 25.0 41.1 19.8 13.9 27.5114 72 42
Breast (invasive) 57.7 50.6 65.6 2.2 0.7 5.6 108.6 94.9 123.8262 5 257
Cervix 13.1 8.1 20.124
Corpus and Uterus, NOS 32.7 25.6 41.380
Ovary 12.8 8.5 18.731
Prostate 107.0 94.0 121.6252
Testis 5.3 2.3 10.58
Urinary Bladder (includes in situ) 22.7 18.6 27.5 40.2 32.1 49.9 9.5 6.1 14.5112 87 25
Kidney and Renal Pelvis 22.5 18.1 27.7 28.6 21.6 37.2 17.2 11.8 24.3100 61 39
Brain and Nervous System 6.1 3.8 9.2 6.6 3.5 11.4 6.0 2.8 11.125 14 11
Hodgkin Lymphoma 1.4 0.5 3.3 1.1 0.1 4.2 1.8 0.4 5.16 2 4
Non-Hodgkin Lymphoma 22.5 18.4 27.4 29.3 22.4 37.7 16.6 11.9 22.8110 65 45
Myeloma 5.7 3.7 8.5 6.1 3.1 10.8 5.3 2.9 9.327 13 14
Leukemia 14.1 10.7 18.2 20.2 14.5 27.6 8.7 5.2 13.765 43 22
All Other Sites 66.4 58.7 74.8 53.5 43.9 64.7 78.5 66.9 91.7300 115 185
DATA SOURCE: Illinois Department of Public Health, Illinois State Cancer Registry, data as of November 2018
Breast in situ (not in total) 29.5 22.1 38.7 61
IV - 15

All Sites Combined and Selected Sites, White, 2012-2016Figures include invasive cancer with the exception of urinary bladder (includes in situ) and breast cancer in situ as a separate category. Incidence counts are five-year totals.
Rates are per 100,000 age-adjustd to the 2000 U.S. standard million population. Lower confidence intervals (LCI) and upper confidence intervals (UCI) are 95 percent for rates,
Tiwari method.
Site Rate LCI UCI
Both Sexes Males Females
Cancer Incidence Counts and Five-year Age-adjusted Rates by Sex
Rate LCI UCI Rate LCI UCICount Count Count
Will
All Sites 497.4 489.1 505.8 538.5 525.5 551.8 471.5 460.5 482.714,359 7,118 7,241
Oral Cavity and Pharynx 12.2 10.9 13.5 18.3 16.1 20.7 6.5 5.3 8.0365 265 100
Esophagus 5.8 4.9 6.8 10.4 8.6 12.3 1.9 1.3 2.8167 139 28
Stomach 6.4 5.5 7.4 9.8 8.1 11.7 3.6 2.7 4.8180 126 54
Colon and Rectum 43.6 41.2 46.2 52.4 48.4 56.8 36.3 33.3 39.51,225 672 553
Liver 5.7 4.9 6.7 8.6 7.1 10.4 3.1 2.3 4.2173 126 47
Pancreas 14.8 13.3 16.3 18.0 15.7 20.6 12.0 10.3 14.0413 231 182
Lung and Bronchus 67.4 64.3 70.6 76.4 71.4 81.7 61.2 57.3 65.41,869 940 929
Bones and Joints 0.9 0.6 1.3 1.1 0.6 1.8 0.8 0.4 1.426 15 11
Melanoma of the Skin 21.9 20.2 23.7 26.7 23.8 29.7 18.5 16.4 20.9639 358 281
Breast (invasive) 73.2 70.1 76.4 1.4 0.8 2.2 138.5 132.7 144.62,180 17 2,163
Cervix 6.4 5.1 7.895
Corpus and Uterus, NOS 30.1 27.4 32.9496
Ovary 10.7 9.1 12.4169
Prostate 112.1 106.4 117.91,619
Testis 7.1 5.7 8.795
Urinary Bladder (includes in situ) 25.8 23.9 27.8 45.2 41.3 49.4 10.8 9.2 12.6706 540 166
Kidney and Renal Pelvis 18.0 16.5 19.6 24.1 21.5 26.9 12.5 10.8 14.4532 338 194
Brain and Nervous System 6.8 5.9 7.9 7.4 6.0 9.0 6.2 5.0 7.6193 103 90
Hodgkin Lymphoma 3.9 3.2 4.8 4.4 3.4 5.7 3.4 2.5 4.6107 61 46
Non-Hodgkin Lymphoma 22.2 20.4 24.1 26.6 23.8 29.8 18.6 16.5 21.0618 337 281
Myeloma 5.5 4.7 6.4 7.0 5.6 8.6 4.3 3.3 5.6158 92 66
Leukemia 16.8 15.3 18.4 19.9 17.4 22.6 14.2 12.3 16.3473 256 217
All Other Sites 66.1 63.1 69.3 61.7 57.3 66.4 71.7 67.4 76.21,861 788 1,073
DATA SOURCE: Illinois Department of Public Health, Illinois State Cancer Registry, data as of November 2018
Breast in situ (not in total) 38.4 35.4 41.7 610
IV - 16

All Sites Combined and Selected Sites, White, 2012-2016Figures include invasive cancer with the exception of urinary bladder (includes in situ) and breast cancer in situ as a separate category. Incidence counts are five-year totals.
Rates are per 100,000 age-adjustd to the 2000 U.S. standard million population. Lower confidence intervals (LCI) and upper confidence intervals (UCI) are 95 percent for rates,
Tiwari method.
Site Rate LCI UCI
Both Sexes Males Females
Cancer Incidence Counts and Five-year Age-adjusted Rates by Sex
Rate LCI UCI Rate LCI UCICount Count Count
Winnebago
All Sites 479.0 467.8 490.3 496.6 480.1 513.5 473.3 457.8 489.27,446 3,611 3,835
Oral Cavity and Pharynx 12.3 10.6 14.2 19.4 16.4 22.9 5.8 4.2 7.8199 150 49
Esophagus 5.5 4.4 6.8 8.7 6.7 11.1 2.7 1.7 4.290 67 23
Stomach 6.3 5.1 7.8 9.3 7.2 11.9 3.9 2.7 5.6102 68 34
Colon and Rectum 36.9 33.8 40.1 38.5 34.0 43.4 35.7 31.6 40.3575 279 296
Liver 5.8 4.7 7.1 9.5 7.5 12.1 2.4 1.5 3.896 74 22
Pancreas 13.0 11.3 14.9 12.8 10.4 15.7 12.9 10.6 15.6212 98 114
Lung and Bronchus 69.3 65.2 73.5 77.3 71.0 84.1 63.9 58.6 69.51,133 573 560
Bones and Joints 0.8 0.4 1.5 0.8 0.2 1.9 0.8 0.2 1.910 5 5
Melanoma of the Skin 27.7 25.0 30.7 32.4 28.2 37.1 24.9 21.2 29.1403 224 179
Breast (invasive) 70.9 66.5 75.4 1.9 1.0 3.3 132.6 124.4 141.21,075 14 1,061
Cervix 9.4 7.1 12.359
Corpus and Uterus, NOS 31.0 27.2 35.2257
Ovary 11.3 9.1 14.094
Prostate 90.2 83.6 97.3705
Testis 7.7 5.5 10.540
Urinary Bladder (includes in situ) 22.1 19.8 24.6 37.8 33.3 42.8 9.8 7.8 12.2351 264 87
Kidney and Renal Pelvis 18.8 16.6 21.2 24.1 20.5 28.1 14.2 11.7 17.2286 170 116
Brain and Nervous System 6.3 5.0 7.8 8.1 6.0 10.7 4.6 3.1 6.588 54 34
Hodgkin Lymphoma 3.1 2.1 4.3 3.8 2.3 5.7 2.4 1.3 4.136 22 14
Non-Hodgkin Lymphoma 20.3 18.1 22.8 25.0 21.4 29.0 16.5 13.7 19.7318 180 138
Myeloma 6.5 5.3 7.9 8.0 6.1 10.4 5.3 3.9 7.1108 60 48
Leukemia 14.8 12.8 16.9 17.5 14.5 21.1 12.8 10.4 15.7223 119 104
All Other Sites 66.1 61.9 70.5 63.7 57.8 70.1 70.3 64.3 76.9986 445 541
DATA SOURCE: Illinois Department of Public Health, Illinois State Cancer Registry, data as of November 2018
Breast in situ (not in total) 32.8 28.7 37.3 254
IV - 17

All Sites Combined and Selected Sites, Black, 2012-2016Figures include invasive cancer with the exception of urinary bladder (includes in situ) and breast cancer in situ as a separate category. Incidence counts are five-year totals.
Rates are per 100,000 age-adjustd to the 2000 U.S. standard million population. Lower confidence intervals (LCI) and upper confidence intervals (UCI) are 95 percent for rates,
Tiwari method.
Site Rate LCI UCI
Both Sexes Males Females
Cancer Incidence Counts and Five-year Age-adjusted Rates by Sex
Rate LCI UCI Rate LCI UCICount Count Count
Illinois
All Sites 487.9 483.3 492.5 566.9 559.1 574.8 437.9 432.2 443.745,715 22,211 23,504
Oral Cavity and Pharynx 11.2 10.5 11.9 18.1 16.8 19.5 6.2 5.5 6.91,082 743 339
Esophagus 4.7 4.3 5.2 7.8 6.9 8.8 2.6 2.1 3.0448 306 142
Stomach 10.9 10.2 11.6 14.7 13.4 16.1 8.4 7.7 9.3978 529 449
Colon and Rectum 52.6 51.1 54.2 63.7 61.1 66.5 45.4 43.6 47.34,820 2,393 2,427
Liver 8.6 8.1 9.2 14.9 13.7 16.1 4.0 3.5 4.6886 659 227
Pancreas 16.8 16.0 17.7 19.3 17.8 20.8 15.1 14.0 16.21,523 720 803
Lung and Bronchus 75.7 73.8 77.5 95.0 91.7 98.4 63.1 61.0 65.36,939 3,522 3,417
Bones and Joints 0.6 0.5 0.8 0.8 0.5 1.1 0.6 0.4 0.863 32 31
Melanoma of the Skin 0.7 0.6 0.9 0.7 0.5 1.1 0.7 0.5 1.065 27 38
Breast (invasive) 77.6 75.8 79.4 2.1 1.6 2.6 133.5 130.4 136.77,247 76 7,171
Cervix 10.3 9.4 11.2532
Corpus and Uterus, NOS 29.3 27.9 30.81,652
Ovary 9.9 9.1 10.8525
Prostate 171.4 167.2 175.67,091
Testis 1.4 1.0 1.858
Urinary Bladder (includes in situ) 12.6 11.8 13.4 21.0 19.4 22.6 7.1 6.4 7.91,105 736 369
Kidney and Renal Pelvis 20.0 19.1 20.9 29.0 27.3 30.8 13.4 12.4 14.41,885 1,167 718
Brain and Nervous System 3.8 3.4 4.2 4.4 3.8 5.1 3.2 2.8 3.8357 188 169
Hodgkin Lymphoma 2.7 2.4 3.0 3.3 2.8 3.9 2.2 1.8 2.6259 147 112
Non-Hodgkin Lymphoma 13.3 12.5 14.1 15.6 14.4 16.9 11.6 10.6 12.51,228 620 608
Myeloma 12.6 11.9 13.4 14.7 13.4 16.0 11.3 10.4 12.21,145 546 599
Leukemia 11.2 10.5 11.9 14.4 13.1 15.7 9.0 8.2 9.91,020 544 476
All Other Sites 52.2 50.7 53.7 54.8 52.3 57.3 51.0 49.0 53.04,807 2,107 2,700
DATA SOURCE: Illinois Department of Public Health, Illinois State Cancer Registry, data as of November 2018
Breast in situ (not in total) 36.1 34.5 37.7 1,960
IV - 18

All Sites Combined and Selected Sites, Black, 2012-2016Figures include invasive cancer with the exception of urinary bladder (includes in situ) and breast cancer in situ as a separate category. Incidence counts are five-year totals.
Rates are per 100,000 age-adjustd to the 2000 U.S. standard million population. Lower confidence intervals (LCI) and upper confidence intervals (UCI) are 95 percent for rates,
Tiwari method.
Site Rate LCI UCI
Both Sexes Males Females
Cancer Incidence Counts and Five-year Age-adjusted Rates by Sex
Rate LCI UCI Rate LCI UCICount Count Count
Champaign
All Sites 471.4 425.9 520.2 502.6 430.7 582.4 447.3 389.2 511.2442 210 232
Oral Cavity and Pharynx 7.2 3.1 14.4 8.3 2.2 22.4 6.3 1.7 16.68 4 4
Esophagus 3.9 0.7 11.1 4.8 0.6 17.7 3.0 0.1 13.73 2 1
Stomach 7.1 2.7 15.1 1.2 0.0 11.3 11.7 4.1 25.67 1 6
Colon and Rectum 40.7 28.0 56.7 40.2 22.2 66.6 40.2 24.1 62.437 17 20
Liver 12.3 6.9 20.7 24.1 12.8 42.5 2.8 0.3 11.215 13 2
Pancreas 17.9 10.3 28.8 14.6 4.9 33.0 20.8 10.4 36.818 6 12
Lung and Bronchus 71.6 53.5 93.4 61.8 37.9 94.3 77.5 53.0 108.459 24 35
Bones and Joints 0 0 0
Melanoma of the Skin 1.8 0.0 8.0 2.4 0.1 11.81 0 1
Breast (invasive) 82.2 64.1 103.5 3.5 0.1 17.2 142.4 111.3 179.277 1 76
Cervix 4.7 0.9 14.23
Corpus and Uterus, NOS 7.4 1.9 19.04
Ovary 15.9 6.5 31.68
Prostate 171.2 130.8 219.672
Testis 2.2 0.1 13.41
Urinary Bladder (includes in situ) 12.5 5.9 22.7 13.2 2.9 34.5 12.9 4.6 27.412 5 7
Kidney and Renal Pelvis 18.8 10.8 30.1 31.9 14.8 58.4 10.6 3.7 23.419 13 6
Brain and Nervous System 2.2 0.4 7.1 4.7 0.8 16.63 3 0
Hodgkin Lymphoma 2.5 0.3 8.6 5.7 0.6 20.22 2 0
Non-Hodgkin Lymphoma 15.5 8.2 26.3 27.8 11.4 54.5 8.5 2.7 20.014 9 5
Myeloma 15.8 8.5 26.4 22.2 9.6 43.4 11.1 3.8 24.515 9 6
Leukemia 6.8 2.7 14.2 11.0 3.0 27.9 3.8 0.8 12.48 5 3
All Other Sites 62.4 46.3 82.0 54.0 33.4 82.3 65.4 44.0 92.856 23 33
DATA SOURCE: Illinois Department of Public Health, Illinois State Cancer Registry, data as of November 2018
Breast in situ (not in total) 33.3 19.2 53.4 18
IV - 19
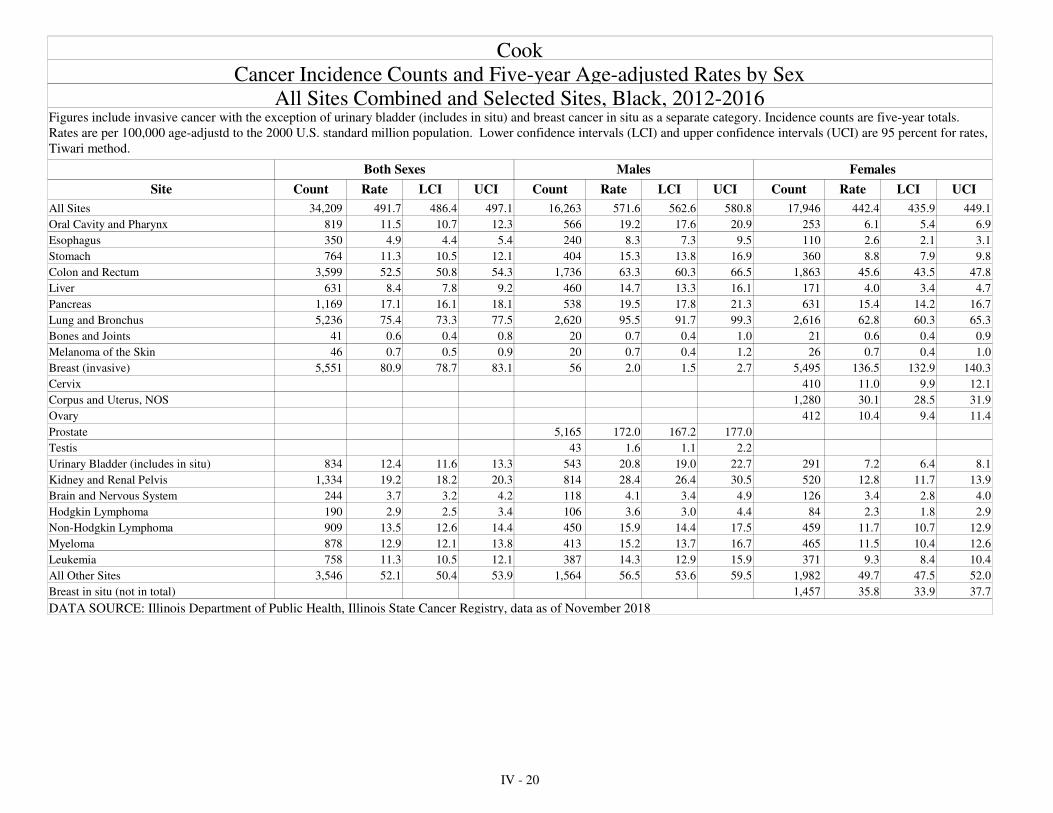
All Sites Combined and Selected Sites, Black, 2012-2016Figures include invasive cancer with the exception of urinary bladder (includes in situ) and breast cancer in situ as a separate category. Incidence counts are five-year totals.
Rates are per 100,000 age-adjustd to the 2000 U.S. standard million population. Lower confidence intervals (LCI) and upper confidence intervals (UCI) are 95 percent for rates,
Tiwari method.
Site Rate LCI UCI
Both Sexes Males Females
Cancer Incidence Counts and Five-year Age-adjusted Rates by Sex
Rate LCI UCI Rate LCI UCICount Count Count
Cook
All Sites 491.7 486.4 497.1 571.6 562.6 580.8 442.4 435.9 449.134,209 16,263 17,946
Oral Cavity and Pharynx 11.5 10.7 12.3 19.2 17.6 20.9 6.1 5.4 6.9819 566 253
Esophagus 4.9 4.4 5.4 8.3 7.3 9.5 2.6 2.1 3.1350 240 110
Stomach 11.3 10.5 12.1 15.3 13.8 16.9 8.8 7.9 9.8764 404 360
Colon and Rectum 52.5 50.8 54.3 63.3 60.3 66.5 45.6 43.5 47.83,599 1,736 1,863
Liver 8.4 7.8 9.2 14.7 13.3 16.1 4.0 3.4 4.7631 460 171
Pancreas 17.1 16.1 18.1 19.5 17.8 21.3 15.4 14.2 16.71,169 538 631
Lung and Bronchus 75.4 73.3 77.5 95.5 91.7 99.3 62.8 60.3 65.35,236 2,620 2,616
Bones and Joints 0.6 0.4 0.8 0.7 0.4 1.0 0.6 0.4 0.941 20 21
Melanoma of the Skin 0.7 0.5 0.9 0.7 0.4 1.2 0.7 0.4 1.046 20 26
Breast (invasive) 80.9 78.7 83.1 2.0 1.5 2.7 136.5 132.9 140.35,551 56 5,495
Cervix 11.0 9.9 12.1410
Corpus and Uterus, NOS 30.1 28.5 31.91,280
Ovary 10.4 9.4 11.4412
Prostate 172.0 167.2 177.05,165
Testis 1.6 1.1 2.243
Urinary Bladder (includes in situ) 12.4 11.6 13.3 20.8 19.0 22.7 7.2 6.4 8.1834 543 291
Kidney and Renal Pelvis 19.2 18.2 20.3 28.4 26.4 30.5 12.8 11.7 13.91,334 814 520
Brain and Nervous System 3.7 3.2 4.2 4.1 3.4 4.9 3.4 2.8 4.0244 118 126
Hodgkin Lymphoma 2.9 2.5 3.4 3.6 3.0 4.4 2.3 1.8 2.9190 106 84
Non-Hodgkin Lymphoma 13.5 12.6 14.4 15.9 14.4 17.5 11.7 10.7 12.9909 450 459
Myeloma 12.9 12.1 13.8 15.2 13.7 16.7 11.5 10.4 12.6878 413 465
Leukemia 11.3 10.5 12.1 14.3 12.9 15.9 9.3 8.4 10.4758 387 371
All Other Sites 52.1 50.4 53.9 56.5 53.6 59.5 49.7 47.5 52.03,546 1,564 1,982
DATA SOURCE: Illinois Department of Public Health, Illinois State Cancer Registry, data as of November 2018
Breast in situ (not in total) 35.8 33.9 37.7 1,457
IV - 20

All Sites Combined and Selected Sites, Black, 2012-2016Figures include invasive cancer with the exception of urinary bladder (includes in situ) and breast cancer in situ as a separate category. Incidence counts are five-year totals.
Rates are per 100,000 age-adjustd to the 2000 U.S. standard million population. Lower confidence intervals (LCI) and upper confidence intervals (UCI) are 95 percent for rates,
Tiwari method.
Site Rate LCI UCI
Both Sexes Males Females
Cancer Incidence Counts and Five-year Age-adjusted Rates by Sex
Rate LCI UCI Rate LCI UCICount Count Count
DuPage
All Sites 444.1 408.2 482.1 482.3 423.9 546.1 411.6 367.3 459.5747 345 402
Oral Cavity and Pharynx 6.3 2.8 12.0 15.0 6.7 29.111 11 0
Esophagus 6.2 2.4 12.6 7.3 1.6 20.0 5.0 1.4 12.69 4 5
Stomach 11.4 6.0 19.3 10.1 4.1 21.7 11.1 4.4 22.117 8 9
Colon and Rectum 50.6 39.1 64.2 53.5 35.8 76.6 47.0 33.2 64.386 39 47
Liver 4.7 2.1 9.3 7.4 2.5 17.9 2.6 0.5 8.29 6 3
Pancreas 9.3 4.4 16.6 7.4 2.2 18.6 9.9 3.7 20.313 5 8
Lung and Bronchus 45.4 33.4 59.9 64.9 40.9 96.1 33.9 21.8 49.862 31 31
Bones and Joints 1.8 0.1 6.7 0.6 0.0 8.2 2.0 0.1 8.92 1 1
Melanoma of the Skin 0.9 0.0 4.4 1.6 0.0 7.71 0 1
Breast (invasive) 77.3 63.0 93.7 1.0 0.0 8.8 131.0 107.2 158.2135 1 134
Cervix 5.1 2.0 11.27
Corpus and Uterus, NOS 29.5 17.9 45.226
Ovary 10.1 3.7 20.98
Prostate 170.0 139.0 205.9136
Testis 1.6 0.2 9.42
Urinary Bladder (includes in situ) 9.5 4.3 17.4 16.1 5.6 34.3 4.7 1.1 12.311 7 4
Kidney and Renal Pelvis 22.3 14.9 31.9 40.3 23.3 63.8 10.8 4.9 20.438 27 11
Brain and Nervous System 2.1 0.7 5.5 2.1 0.2 10.3 2.3 0.5 7.65 2 3
Hodgkin Lymphoma 1.5 0.4 4.6 2.4 0.5 10.3 0.7 0.0 5.24 3 1
Non-Hodgkin Lymphoma 16.1 9.7 24.9 12.7 5.4 25.7 18.1 9.4 30.828 11 17
Myeloma 12.9 7.4 20.7 11.2 4.8 22.9 13.7 6.3 25.421 9 12
Leukemia 11.7 6.5 19.1 12.4 4.5 26.5 11.0 5.0 20.619 8 11
All Other Sites 55.8 43.8 69.8 46.6 29.9 69.1 61.4 45.7 80.597 34 63
DATA SOURCE: Illinois Department of Public Health, Illinois State Cancer Registry, data as of November 2018
Breast in situ (not in total) 45.2 33.0 60.4 52
IV - 21

All Sites Combined and Selected Sites, Black, 2012-2016Figures include invasive cancer with the exception of urinary bladder (includes in situ) and breast cancer in situ as a separate category. Incidence counts are five-year totals.
Rates are per 100,000 age-adjustd to the 2000 U.S. standard million population. Lower confidence intervals (LCI) and upper confidence intervals (UCI) are 95 percent for rates,
Tiwari method.
Site Rate LCI UCI
Both Sexes Males Females
Cancer Incidence Counts and Five-year Age-adjusted Rates by Sex
Rate LCI UCI Rate LCI UCICount Count Count
Kane
All Sites 424.9 386.8 465.5 507.1 443.1 577.2 361.9 316.0 412.3530 283 247
Oral Cavity and Pharynx 14.3 8.1 23.2 23.3 11.3 41.8 7.2 2.3 17.118 13 5
Esophagus 3.6 1.1 8.7 7.8 2.4 19.35 5 0
Stomach 10.0 4.6 18.5 17.2 5.3 38.1 6.0 1.6 15.511 7 4
Colon and Rectum 41.8 30.3 55.8 63.3 41.1 92.2 26.1 15.3 41.451 32 19
Liver 8.2 3.9 15.1 16.9 7.6 32.4 1.0 0.0 7.011 10 1
Pancreas 20.9 12.3 32.7 23.4 10.6 43.4 18.7 8.4 34.721 11 10
Lung and Bronchus 50.5 37.2 66.7 60.3 38.1 89.7 43.7 27.8 64.756 30 26
Bones and Joints 0.5 0.0 3.7 0.9 0.0 8.51 1 0
Melanoma of the Skin 0.7 0.0 4.2 1.4 0.0 9.61 1 0
Breast (invasive) 70.5 56.3 87.1 130.1 104.4 160.294 0 94
Cervix 10.2 4.4 20.48
Corpus and Uterus, NOS 21.6 11.6 36.415
Ovary 5.8 1.6 15.04
Prostate 183.5 148.6 224.0111
Testis 0
Urinary Bladder (includes in situ) 8.5 3.4 16.7 15.1 5.5 31.9 2.7 0.1 11.99 8 1
Kidney and Renal Pelvis 14.1 8.3 22.4 19.6 10.4 34.2 8.8 2.9 19.820 14 6
Brain and Nervous System 3.1 1.0 7.7 2.9 0.3 11.8 3.3 0.7 10.55 2 3
Hodgkin Lymphoma 2.5 0.7 6.8 2.4 0.3 10.8 2.5 0.3 9.64 2 2
Non-Hodgkin Lymphoma 12.5 6.5 21.4 20.6 8.6 40.0 6.7 2.1 16.014 9 5
Myeloma 7.3 3.1 14.4 12.4 3.9 28.2 3.6 0.7 11.29 6 3
Leukemia 5.9 2.1 12.7 0.9 0.0 8.6 9.5 3.2 20.97 1 6
All Other Sites 46.3 33.9 61.4 35.2 20.1 56.7 54.5 37.1 76.955 20 35
DATA SOURCE: Illinois Department of Public Health, Illinois State Cancer Registry, data as of November 2018
Breast in situ (not in total) 28.2 16.6 44.7 19
IV - 22

All Sites Combined and Selected Sites, Black, 2012-2016Figures include invasive cancer with the exception of urinary bladder (includes in situ) and breast cancer in situ as a separate category. Incidence counts are five-year totals.
Rates are per 100,000 age-adjustd to the 2000 U.S. standard million population. Lower confidence intervals (LCI) and upper confidence intervals (UCI) are 95 percent for rates,
Tiwari method.
Site Rate LCI UCI
Both Sexes Males Females
Cancer Incidence Counts and Five-year Age-adjusted Rates by Sex
Rate LCI UCI Rate LCI UCICount Count Count
Kankakee
All Sites 567.0 513.2 624.7 641.6 556.9 735.2 502.4 434.9 577.2439 230 209
Oral Cavity and Pharynx 8.6 3.9 16.9 7.8 2.1 22.1 9.1 3.0 22.49 4 5
Esophagus 4.6 1.1 12.3 6.0 1.2 19.6 2.8 0.1 14.34 3 1
Stomach 16.0 8.0 28.3 17.8 6.0 39.4 14.9 5.3 32.412 6 6
Colon and Rectum 70.2 52.2 92.1 69.4 44.3 103.3 68.0 45.1 98.455 26 29
Liver 7.4 3.2 15.3 13.9 5.6 30.2 1.8 0.0 11.68 7 1
Pancreas 19.8 10.8 33.0 25.5 10.6 50.4 15.6 6.0 32.915 8 7
Lung and Bronchus 88.1 67.2 113.0 114.5 78.7 160.0 67.7 44.4 98.665 37 28
Bones and Joints 0.9 0.0 6.1 1.9 0.0 11.81 0 1
Melanoma of the Skin 0 0 0
Breast (invasive) 76.9 57.7 100.2 2.6 0.1 15.2 137.3 103.0 179.157 1 56
Cervix 0
Corpus and Uterus, NOS 28.8 14.5 50.812
Ovary 10.2 2.7 25.94
Prostate 211.1 164.6 266.278
Testis 0
Urinary Bladder (includes in situ) 17.8 9.4 30.2 25.7 11.2 49.7 10.7 3.3 25.614 9 5
Kidney and Renal Pelvis 24.4 14.1 39.0 24.1 9.6 48.7 24.7 11.6 45.718 8 10
Brain and Nervous System 2.7 0.3 9.7 5.1 0.6 18.22 0 2
Hodgkin Lymphoma 4.2 1.1 11.3 6.7 1.2 21.5 1.7 0.0 11.34 3 1
Non-Hodgkin Lymphoma 13.2 6.2 24.5 14.0 4.3 33.4 12.6 4.0 29.310 5 5
Myeloma 10.0 4.0 20.5 12.8 3.3 32.4 7.7 1.6 22.07 4 3
Leukemia 13.6 6.5 24.8 22.7 9.0 46.2 6.6 1.3 19.811 8 3
All Other Sites 71.5 53.0 94.3 67.2 41.5 102.2 75.0 50.0 107.753 23 30
DATA SOURCE: Illinois Department of Public Health, Illinois State Cancer Registry, data as of November 2018
Breast in situ (not in total) 34.6 18.6 58.4 14
IV - 23

All Sites Combined and Selected Sites, Black, 2012-2016Figures include invasive cancer with the exception of urinary bladder (includes in situ) and breast cancer in situ as a separate category. Incidence counts are five-year totals.
Rates are per 100,000 age-adjustd to the 2000 U.S. standard million population. Lower confidence intervals (LCI) and upper confidence intervals (UCI) are 95 percent for rates,
Tiwari method.
Site Rate LCI UCI
Both Sexes Males Females
Cancer Incidence Counts and Five-year Age-adjusted Rates by Sex
Rate LCI UCI Rate LCI UCICount Count Count
Lake
All Sites 453.0 423.3 484.1 523.1 473.1 576.7 402.1 365.5 441.2980 503 477
Oral Cavity and Pharynx 8.5 4.9 13.5 8.0 3.8 15.3 7.8 3.5 15.019 10 9
Esophagus 3.0 1.0 6.7 4.5 1.0 12.4 1.7 0.2 6.16 4 2
Stomach 12.5 7.8 18.9 17.7 9.2 30.3 8.4 3.7 16.024 15 9
Colon and Rectum 48.4 38.6 59.6 69.0 50.2 91.9 35.6 25.1 48.897 57 40
Liver 7.6 4.4 12.2 15.8 8.0 27.4 1.9 0.4 6.019 16 3
Pancreas 19.0 13.2 26.3 21.3 12.2 34.2 17.4 10.2 27.439 20 19
Lung and Bronchus 74.4 62.2 88.2 88.3 67.7 112.8 63.8 49.3 80.9147 75 72
Bones and Joints 1.2 0.2 3.7 1.5 0.2 6.7 0.8 0.0 4.63 2 1
Melanoma of the Skin 1.8 0.3 5.2 2.9 0.5 8.43 0 3
Breast (invasive) 72.2 60.8 85.0 8.8 3.0 19.2 125.1 105.3 147.4158 6 152
Cervix 10.3 5.6 17.614
Corpus and Uterus, NOS 28.6 19.6 40.235
Ovary 8.0 3.9 14.611
Prostate 149.0 125.1 176.2161
Testis 0.5 0.0 4.91
Urinary Bladder (includes in situ) 9.6 5.5 15.5 18.1 8.8 31.8 4.3 1.1 10.617 13 4
Kidney and Renal Pelvis 16.1 11.2 22.4 29.3 19.1 42.9 5.3 2.0 11.339 32 7
Brain and Nervous System 4.4 2.0 8.3 5.2 2.0 11.5 3.2 0.6 8.810 7 3
Hodgkin Lymphoma 0.9 0.2 3.1 1.9 0.4 6.83 3 0
Non-Hodgkin Lymphoma 8.7 5.1 13.9 11.3 4.9 21.7 7.0 2.8 14.019 11 8
Myeloma 13.3 8.6 19.5 16.6 8.5 28.6 11.1 6.0 18.828 14 14
Leukemia 8.7 5.2 13.5 10.3 5.3 18.6 6.9 2.8 13.721 13 8
All Other Sites 48.8 39.5 59.7 46.0 31.6 64.2 52.1 39.7 67.0106 43 63
DATA SOURCE: Illinois Department of Public Health, Illinois State Cancer Registry, data as of November 2018
Breast in situ (not in total) 31.1 21.7 43.0 38
IV - 24

All Sites Combined and Selected Sites, Black, 2012-2016Figures include invasive cancer with the exception of urinary bladder (includes in situ) and breast cancer in situ as a separate category. Incidence counts are five-year totals.
Rates are per 100,000 age-adjustd to the 2000 U.S. standard million population. Lower confidence intervals (LCI) and upper confidence intervals (UCI) are 95 percent for rates,
Tiwari method.
Site Rate LCI UCI
Both Sexes Males Females
Cancer Incidence Counts and Five-year Age-adjusted Rates by Sex
Rate LCI UCI Rate LCI UCICount Count Count
Macon
All Sites 555.1 504.0 609.8 747.1 650.9 852.6 426.9 369.2 490.9470 264 206
Oral Cavity and Pharynx 19.0 10.2 31.9 34.1 15.4 63.5 9.0 2.3 22.815 11 4
Esophagus 4.3 1.1 11.3 5.3 0.6 19.9 3.7 0.4 13.94 2 2
Stomach 12.7 5.7 23.9 18.6 6.6 40.5 6.9 1.4 19.79 6 3
Colon and Rectum 65.2 47.7 86.6 97.0 61.4 143.8 48.6 30.1 73.950 28 22
Liver 7.1 3.0 14.5 9.5 3.1 24.5 4.9 1.0 15.38 5 3
Pancreas 15.3 8.1 26.4 6.5 1.3 20.9 20.6 9.8 37.913 3 10
Lung and Bronchus 98.9 78.2 123.3 134.4 95.3 183.1 75.7 52.7 105.185 48 37
Bones and Joints 0 0 0
Melanoma of the Skin 0.9 0.0 5.7 1.8 0.0 13.61 1 0
Breast (invasive) 54.6 39.9 72.8 4.6 0.1 21.5 94.5 69.2 126.049 1 48
Cervix 11.6 3.7 26.75
Corpus and Uterus, NOS 25.3 13.2 43.713
Ovary 11.2 4.0 24.86
Prostate 218.7 172.4 273.587
Testis 0
Urinary Bladder (includes in situ) 14.1 6.3 26.3 20.0 5.0 48.6 13.8 4.4 30.99 4 5
Kidney and Renal Pelvis 19.2 10.7 31.5 39.7 20.0 69.4 5.4 0.6 18.116 14 2
Brain and Nervous System 1.9 0.2 7.4 4.0 0.5 17.02 2 0
Hodgkin Lymphoma 2.2 0.2 8.2 3.2 0.1 17.1 1.5 0.0 9.92 1 1
Non-Hodgkin Lymphoma 19.4 10.6 32.2 29.2 12.4 56.5 12.4 4.4 27.315 9 6
Myeloma 14.7 7.5 25.7 17.5 6.5 37.9 11.3 4.0 25.313 7 6
Leukemia 13.7 6.6 24.8 22.0 7.9 46.9 8.9 2.3 22.811 7 4
All Other Sites 67.7 50.7 88.5 80.8 51.0 120.7 61.9 41.0 89.357 28 29
DATA SOURCE: Illinois Department of Public Health, Illinois State Cancer Registry, data as of November 2018
Breast in situ (not in total) 41.1 24.8 63.9 20
IV - 25

All Sites Combined and Selected Sites, Black, 2012-2016Figures include invasive cancer with the exception of urinary bladder (includes in situ) and breast cancer in situ as a separate category. Incidence counts are five-year totals.
Rates are per 100,000 age-adjustd to the 2000 U.S. standard million population. Lower confidence intervals (LCI) and upper confidence intervals (UCI) are 95 percent for rates,
Tiwari method.
Site Rate LCI UCI
Both Sexes Males Females
Cancer Incidence Counts and Five-year Age-adjusted Rates by Sex
Rate LCI UCI Rate LCI UCICount Count Count
Madison
All Sites 526.9 478.1 579.1 557.6 480.1 643.3 504.4 442.2 572.5469 213 256
Oral Cavity and Pharynx 9.1 4.1 17.4 4.0 0.5 16.0 13.1 5.2 27.09 2 7
Esophagus 9.3 3.5 19.2 19.5 6.4 42.7 2.1 0.1 10.97 6 1
Stomach 7.8 2.7 16.9 14.2 3.4 35.8 4.6 0.4 16.26 4 2
Colon and Rectum 47.3 33.5 64.5 67.4 41.7 101.9 32.8 19.2 52.342 24 18
Liver 5.7 2.0 12.7 12.7 4.5 28.96 6 0
Pancreas 12.4 6.2 22.1 7.3 1.4 21.9 16.6 7.3 32.112 3 9
Lung and Bronchus 104.3 82.1 130.2 96.9 63.6 139.9 112.2 82.9 147.983 30 53
Bones and Joints 0 0 0
Melanoma of the Skin 0 0 0
Breast (invasive) 79.7 61.6 101.1 138.3 107.2 175.372 0 72
Cervix 15.8 6.5 31.58
Corpus and Uterus, NOS 26.9 14.4 45.414
Ovary 10.2 3.1 23.95
Prostate 128.3 95.4 168.856
Testis 2.7 0.1 14.71
Urinary Bladder (includes in situ) 12.6 6.3 22.4 22.8 9.5 45.1 5.9 1.1 17.212 9 3
Kidney and Renal Pelvis 35.8 23.8 51.2 52.6 30.7 83.1 22.6 11.4 39.931 19 12
Brain and Nervous System 7.2 2.8 15.0 10.3 3.2 25.5 4.5 0.5 15.47 5 2
Hodgkin Lymphoma 1.0 0.0 5.6 2.3 0.1 13.61 1 0
Non-Hodgkin Lymphoma 17.6 10.0 28.7 26.9 13.0 49.0 10.5 3.6 23.417 11 6
Myeloma 10.8 4.8 20.5 4.7 0.6 17.6 14.9 5.7 30.69 2 7
Leukemia 20.4 11.6 32.7 18.3 6.2 40.1 21.5 10.8 38.218 6 12
All Other Sites 58.7 43.3 77.5 66.6 42.8 98.6 51.8 32.9 77.153 28 25
DATA SOURCE: Illinois Department of Public Health, Illinois State Cancer Registry, data as of November 2018
Breast in situ (not in total) 38.2 23.3 58.8 21
IV - 26

All Sites Combined and Selected Sites, Black, 2012-2016Figures include invasive cancer with the exception of urinary bladder (includes in situ) and breast cancer in situ as a separate category. Incidence counts are five-year totals.
Rates are per 100,000 age-adjustd to the 2000 U.S. standard million population. Lower confidence intervals (LCI) and upper confidence intervals (UCI) are 95 percent for rates,
Tiwari method.
Site Rate LCI UCI
Both Sexes Males Females
Cancer Incidence Counts and Five-year Age-adjusted Rates by Sex
Rate LCI UCI Rate LCI UCICount Count Count
Peoria
All Sites 533.2 492.5 576.2 632.8 564.7 706.4 460.7 411.1 514.4711 367 344
Oral Cavity and Pharynx 10.4 5.4 17.9 19.9 9.5 36.3 3.2 0.3 11.314 12 2
Esophagus 5.5 1.9 11.9 9.0 2.2 22.6 3.5 0.4 11.86 4 2
Stomach 10.8 5.7 18.5 13.5 5.1 28.0 8.9 3.4 18.814 7 7
Colon and Rectum 49.3 37.3 63.9 64.1 43.0 91.3 38.7 25.4 56.363 34 29
Liver 7.3 3.4 13.4 9.5 3.6 20.5 5.1 1.3 13.411 7 4
Pancreas 16.6 9.9 25.8 19.0 8.4 36.0 14.5 7.0 26.421 10 11
Lung and Bronchus 104.4 86.3 124.8 139.9 107.5 178.3 78.6 58.9 102.5133 74 59
Bones and Joints 0.4 0.0 3.3 0.9 0.0 6.01 0 1
Melanoma of the Skin 0.5 0.0 3.5 1.0 0.0 6.31 0 1
Breast (invasive) 88.1 71.7 106.9 6.5 0.8 20.4 151.2 123.1 183.6111 2 109
Cervix 9.4 3.9 18.98
Corpus and Uterus, NOS 23.6 14.2 37.020
Ovary 4.2 0.7 12.53
Prostate 175.1 142.3 213.1112
Testis 3.7 0.4 13.02
Urinary Bladder (includes in situ) 15.0 8.7 23.7 34.8 19.6 56.2 1.2 0.0 7.019 18 1
Kidney and Renal Pelvis 29.5 20.6 40.8 27.6 15.8 44.7 30.8 18.6 47.539 18 21
Brain and Nervous System 5.9 2.6 11.4 9.3 2.9 21.6 3.9 0.9 11.010 6 4
Hodgkin Lymphoma 1.5 0.3 4.9 2.2 0.3 9.6 1.0 0.0 6.33 2 1
Non-Hodgkin Lymphoma 15.4 9.3 23.9 20.8 10.8 36.2 10.8 4.4 21.521 13 8
Myeloma 11.3 5.8 19.4 8.8 3.2 19.7 12.6 4.9 25.213 6 7
Leukemia 8.8 4.8 14.9 6.9 2.4 16.3 10.2 4.5 19.915 6 9
All Other Sites 53.5 41.2 68.1 62.2 41.7 88.5 47.4 32.9 65.871 34 37
DATA SOURCE: Illinois Department of Public Health, Illinois State Cancer Registry, data as of November 2018
Breast in situ (not in total) 33.3 20.9 50.0 24
IV - 27

All Sites Combined and Selected Sites, Black, 2012-2016Figures include invasive cancer with the exception of urinary bladder (includes in situ) and breast cancer in situ as a separate category. Incidence counts are five-year totals.
Rates are per 100,000 age-adjustd to the 2000 U.S. standard million population. Lower confidence intervals (LCI) and upper confidence intervals (UCI) are 95 percent for rates,
Tiwari method.
Site Rate LCI UCI
Both Sexes Males Females
Cancer Incidence Counts and Five-year Age-adjusted Rates by Sex
Rate LCI UCI Rate LCI UCICount Count Count
Rock Island
All Sites 405.1 354.6 460.4 472.8 393.6 562.4 345.4 281.6 418.6251 142 109
Oral Cavity and Pharynx 12.4 4.7 25.8 20.8 7.0 46.3 4.8 0.1 22.07 6 1
Esophagus 7.0 1.8 17.7 5.6 0.7 21.6 7.0 0.8 24.54 2 2
Stomach 9.4 2.9 21.5 2.8 0.1 17.2 14.3 3.8 35.65 1 4
Colon and Rectum 40.3 25.6 59.9 52.1 29.6 84.8 25.2 10.6 49.725 17 8
Liver 9.4 3.8 19.7 19.7 7.9 41.67 7 0
Pancreas 15.4 7.1 28.7 18.9 5.6 44.3 12.8 4.1 30.910 5 5
Lung and Bronchus 81.9 59.8 109.0 81.9 51.6 122.9 80.7 50.9 120.749 25 24
Bones and Joints 0 0 0
Melanoma of the Skin 0 0 0
Breast (invasive) 47.9 32.2 68.5 95.8 64.3 136.731 0 31
Cervix 7.1 0.9 24.42
Corpus and Uterus, NOS 19.4 8.3 39.18
Ovary 3.5 0.1 18.01
Prostate 139.5 97.6 192.440
Testis 1.9 0.0 15.21
Urinary Bladder (includes in situ) 15.7 6.8 30.0 13.7 4.4 33.3 15.3 4.0 37.99 5 4
Kidney and Renal Pelvis 22.5 11.9 38.3 29.9 11.9 60.1 17.4 6.1 38.414 8 6
Brain and Nervous System 0.8 0.0 6.8 1.8 0.0 13.51 0 1
Hodgkin Lymphoma 1.0 0.0 7.2 1.9 0.0 15.21 1 0
Non-Hodgkin Lymphoma 6.6 2.1 15.8 13.1 4.2 32.25 5 0
Myeloma 7.7 2.0 19.2 19.0 4.4 47.94 4 0
Leukemia 2.9 0.3 10.8 5.8 0.6 22.52 2 0
All Other Sites 43.0 27.2 64.1 46.1 23.2 80.7 40.3 20.3 70.725 13 12
DATA SOURCE: Illinois Department of Public Health, Illinois State Cancer Registry, data as of November 2018
Breast in situ (not in total) 20.1 7.3 43.2 6
IV - 28

All Sites Combined and Selected Sites, Black, 2012-2016Figures include invasive cancer with the exception of urinary bladder (includes in situ) and breast cancer in situ as a separate category. Incidence counts are five-year totals.
Rates are per 100,000 age-adjustd to the 2000 U.S. standard million population. Lower confidence intervals (LCI) and upper confidence intervals (UCI) are 95 percent for rates,
Tiwari method.
Site Rate LCI UCI
Both Sexes Males Females
Cancer Incidence Counts and Five-year Age-adjusted Rates by Sex
Rate LCI UCI Rate LCI UCICount Count Count
Sangamon
All Sites 571.6 520.4 626.0 650.4 561.3 748.6 530.4 466.5 600.2525 252 273
Oral Cavity and Pharynx 10.7 5.1 19.5 20.7 7.3 44.2 4.8 1.0 14.411 8 3
Esophagus 5.3 1.5 13.0 5.4 1.1 18.1 4.7 0.4 16.25 3 2
Stomach 15.8 8.0 27.4 20.4 6.9 44.3 13.4 4.6 29.213 7 6
Colon and Rectum 58.4 43.0 77.2 80.9 50.4 121.3 46.4 29.5 69.054 29 25
Liver 11.3 5.5 20.5 15.8 4.8 36.6 8.6 3.2 19.512 6 6
Pancreas 15.6 7.9 26.9 22.1 8.0 46.2 11.8 3.6 26.913 8 5
Lung and Bronchus 107.8 85.5 133.7 138.1 97.8 188.0 87.6 62.0 119.392 50 42
Bones and Joints 0.6 0.0 4.6 1.1 0.0 11.51 1 0
Melanoma of the Skin 1.0 0.0 5.6 1.7 0.0 9.81 0 1
Breast (invasive) 79.0 60.8 100.6 5.8 1.2 18.9 133.1 102.4 169.672 3 69
Cervix 11.6 4.6 24.37
Corpus and Uterus, NOS 32.7 18.1 53.716
Ovary 14.7 5.5 30.57
Prostate 147.7 109.2 194.661
Testis 1.4 0.0 12.11
Urinary Bladder (includes in situ) 18.8 10.6 30.5 36.3 16.6 66.6 8.9 2.6 21.317 12 5
Kidney and Renal Pelvis 35.6 23.9 50.7 48.4 27.3 78.6 26.7 14.1 45.533 19 14
Brain and Nervous System 6.6 2.7 13.7 7.4 2.3 20.3 5.7 1.1 16.68 5 3
Hodgkin Lymphoma 3.6 1.1 9.3 6.8 2.1 17.15 0 5
Non-Hodgkin Lymphoma 18.3 10.3 29.8 12.1 4.7 27.1 21.8 10.4 39.518 7 11
Myeloma 15.0 7.5 26.2 11.3 2.3 30.9 18.0 7.8 34.413 4 9
Leukemia 12.0 6.0 21.5 13.9 5.6 30.0 10.0 3.0 23.512 7 5
All Other Sites 59.1 43.3 78.3 61.7 34.5 99.4 61.5 41.3 87.653 21 32
DATA SOURCE: Illinois Department of Public Health, Illinois State Cancer Registry, data as of November 2018
Breast in situ (not in total) 61.6 42.1 86.8 34
IV - 29

All Sites Combined and Selected Sites, Black, 2012-2016Figures include invasive cancer with the exception of urinary bladder (includes in situ) and breast cancer in situ as a separate category. Incidence counts are five-year totals.
Rates are per 100,000 age-adjustd to the 2000 U.S. standard million population. Lower confidence intervals (LCI) and upper confidence intervals (UCI) are 95 percent for rates,
Tiwari method.
Site Rate LCI UCI
Both Sexes Males Females
Cancer Incidence Counts and Five-year Age-adjusted Rates by Sex
Rate LCI UCI Rate LCI UCICount Count Count
St Clair
All Sites 468.4 446.3 491.4 517.4 481.1 555.6 436.0 408.0 465.41,782 839 943
Oral Cavity and Pharynx 12.9 9.5 17.2 20.5 13.9 29.1 7.4 4.2 12.149 33 16
Esophagus 4.0 2.2 6.6 6.9 3.4 12.3 1.9 0.5 4.916 12 4
Stomach 6.9 4.4 10.2 8.3 4.5 14.2 5.6 2.8 10.125 14 11
Colon and Rectum 52.9 45.6 61.0 63.7 51.4 77.9 45.1 36.3 55.4199 104 95
Liver 9.3 6.6 12.8 15.5 10.4 22.5 4.5 2.2 8.241 30 11
Pancreas 18.0 13.9 23.0 23.4 16.1 32.6 14.1 9.4 20.267 37 30
Lung and Bronchus 83.0 73.7 93.1 103.1 86.9 121.4 69.6 58.6 82.0309 160 149
Bones and Joints 0.8 0.2 2.4 0.6 0.0 3.5 1.0 0.1 3.53 1 2
Melanoma of the Skin 0.8 0.1 2.4 1.4 0.1 5.1 0.3 0.0 2.23 2 1
Breast (invasive) 73.6 65.0 83.0 1.0 0.1 3.9 126.6 111.9 142.7281 2 279
Cervix 12.6 8.3 18.428
Corpus and Uterus, NOS 33.1 25.9 41.675
Ovary 8.7 5.1 13.718
Prostate 137.9 119.7 157.9230
Testis 1.2 0.1 4.42
Urinary Bladder (includes in situ) 10.9 7.5 15.1 17.0 10.5 25.8 6.6 3.5 11.336 23 13
Kidney and Renal Pelvis 25.0 20.1 30.6 34.8 26.0 45.5 18.1 12.8 24.997 58 39
Brain and Nervous System 2.7 1.3 5.0 2.6 0.8 6.3 2.8 1.0 6.111 5 6
Hodgkin Lymphoma 1.6 0.6 3.4 1.7 0.3 5.1 1.4 0.3 4.26 3 3
Non-Hodgkin Lymphoma 11.4 8.2 15.5 11.6 6.7 18.5 11.5 7.3 17.242 18 24
Myeloma 9.5 6.5 13.3 8.8 4.6 15.1 10.0 6.1 15.435 14 21
Leukemia 7.1 4.6 10.5 10.6 5.9 17.4 4.6 2.0 8.726 17 9
All Other Sites 48.9 41.9 56.7 47.0 36.4 59.6 50.6 41.4 61.2183 74 109
DATA SOURCE: Illinois Department of Public Health, Illinois State Cancer Registry, data as of November 2018
Breast in situ (not in total) 40.3 32.2 49.8 89
IV - 30

All Sites Combined and Selected Sites, Black, 2012-2016Figures include invasive cancer with the exception of urinary bladder (includes in situ) and breast cancer in situ as a separate category. Incidence counts are five-year totals.
Rates are per 100,000 age-adjustd to the 2000 U.S. standard million population. Lower confidence intervals (LCI) and upper confidence intervals (UCI) are 95 percent for rates,
Tiwari method.
Site Rate LCI UCI
Both Sexes Males Females
Cancer Incidence Counts and Five-year Age-adjusted Rates by Sex
Rate LCI UCI Rate LCI UCICount Count Count
Vermilion
All Sites 483.5 415.6 558.9 682.1 558.0 823.6 344.0 268.5 433.4197 122 75
Oral Cavity and Pharynx 12.0 3.6 28.5 13.6 1.3 47.0 12.1 2.3 36.45 2 3
Esophagus 4.3 0.5 15.7 8.9 1.1 31.92 0 2
Stomach 6.4 1.3 19.1 10.2 1.2 37.2 3.5 0.1 22.03 2 1
Colon and Rectum 73.4 47.5 107.3 98.9 55.0 161.1 50.8 24.0 92.727 17 10
Liver 22.6 10.5 42.2 35.6 14.6 72.5 10.3 1.2 35.610 8 2
Pancreas 16.5 6.3 34.6 24.0 7.5 57.2 9.5 1.0 34.07 5 2
Lung and Bronchus 98.5 69.1 135.3 149.1 91.8 225.4 67.4 37.8 110.640 24 16
Bones and Joints 3.4 0.4 13.7 3.0 0.1 23.3 3.4 0.1 21.62 1 1
Melanoma of the Skin 0 0 0
Breast (invasive) 32.9 17.6 55.6 63.2 33.9 106.714 0 14
Cervix 4.5 0.1 24.61
Corpus and Uterus, NOS 0
Ovary 24.9 7.9 57.45
Prostate 213.5 149.2 294.740
Testis 0
Urinary Bladder (includes in situ) 13.5 4.1 31.3 21.4 5.4 55.3 6.7 0.2 31.45 4 1
Kidney and Renal Pelvis 24.5 11.1 45.7 37.1 11.8 82.9 16.2 4.1 42.810 6 4
Brain and Nervous System 4.0 0.5 15.1 3.5 0.1 24.6 3.5 0.1 22.02 1 1
Hodgkin Lymphoma 0 0 0
Non-Hodgkin Lymphoma 8.4 2.1 22.2 10.4 0.9 39.0 6.9 0.8 27.14 2 2
Myeloma 3.9 0.1 17.8 6.7 0.2 31.41 0 1
Leukemia 20.1 7.5 41.5 39.7 12.8 87.5 6.7 0.2 31.47 6 1
All Other Sites 30.3 15.2 53.3 22.1 5.7 56.5 38.9 16.4 76.512 4 8
DATA SOURCE: Illinois Department of Public Health, Illinois State Cancer Registry, data as of November 2018
Breast in situ (not in total) 45.6 20.5 85.8 9
IV - 31

All Sites Combined and Selected Sites, Black, 2012-2016Figures include invasive cancer with the exception of urinary bladder (includes in situ) and breast cancer in situ as a separate category. Incidence counts are five-year totals.
Rates are per 100,000 age-adjustd to the 2000 U.S. standard million population. Lower confidence intervals (LCI) and upper confidence intervals (UCI) are 95 percent for rates,
Tiwari method.
Site Rate LCI UCI
Both Sexes Males Females
Cancer Incidence Counts and Five-year Age-adjusted Rates by Sex
Rate LCI UCI Rate LCI UCICount Count Count
Will
All Sites 495.8 469.5 523.0 629.9 582.4 679.9 401.3 370.9 433.51,632 892 740
Oral Cavity and Pharynx 9.1 5.6 13.7 15.0 7.9 25.2 5.2 2.4 9.927 17 10
Esophagus 3.2 1.3 6.5 7.9 2.7 16.8 0.4 0.0 2.88 7 1
Stomach 11.2 7.3 16.4 19.6 10.8 31.9 6.1 2.6 11.631 22 9
Colon and Rectum 52.8 44.3 62.4 70.0 53.7 89.2 42.2 32.9 53.2167 87 80
Liver 6.4 4.1 9.6 12.3 7.4 19.5 1.6 0.4 4.527 23 4
Pancreas 16.9 11.8 23.1 24.5 14.5 37.9 12.6 7.2 20.144 25 19
Lung and Bronchus 67.7 57.6 78.9 87.2 69.3 107.9 53.4 42.1 66.7197 109 88
Bones and Joints 0.6 0.1 2.0 0.8 0.1 4.1 0.4 0.0 2.73 2 1
Melanoma of the Skin 0 0 0
Breast (invasive) 68.9 59.7 79.1 124.3 108.1 142.3239 0 239
Cervix 5.6 2.9 10.012
Corpus and Uterus, NOS 31.6 23.8 41.263
Ovary 9.9 5.5 16.317
Prostate 223.8 198.6 251.3360
Testis 1.2 0.1 4.82
Urinary Bladder (includes in situ) 16.8 11.8 22.9 30.4 19.4 44.5 7.8 3.7 14.045 34 11
Kidney and Renal Pelvis 19.3 14.4 25.1 27.4 19.1 38.0 12.1 7.2 19.065 44 21
Brain and Nervous System 5.0 2.8 8.1 6.7 3.4 12.3 3.3 1.1 7.518 12 6
Hodgkin Lymphoma 4.2 2.5 6.7 6.0 3.2 10.9 2.7 1.0 6.119 13 6
Non-Hodgkin Lymphoma 15.4 10.9 20.9 16.6 9.2 27.1 15.0 9.5 22.449 22 27
Myeloma 10.7 7.2 15.2 15.7 9.0 25.1 7.0 3.8 12.036 21 15
Leukemia 9.4 6.3 13.6 13.8 8.2 21.8 5.8 2.7 10.733 22 11
All Other Sites 52.4 44.0 61.8 51.1 38.1 66.7 54.2 43.5 66.8170 70 100
DATA SOURCE: Illinois Department of Public Health, Illinois State Cancer Registry, data as of November 2018
Breast in situ (not in total) 44.1 35.2 54.7 92
IV - 32

All Sites Combined and Selected Sites, Black, 2012-2016Figures include invasive cancer with the exception of urinary bladder (includes in situ) and breast cancer in situ as a separate category. Incidence counts are five-year totals.
Rates are per 100,000 age-adjustd to the 2000 U.S. standard million population. Lower confidence intervals (LCI) and upper confidence intervals (UCI) are 95 percent for rates,
Tiwari method.
Site Rate LCI UCI
Both Sexes Males Females
Cancer Incidence Counts and Five-year Age-adjusted Rates by Sex
Rate LCI UCI Rate LCI UCICount Count Count
Winnebago
All Sites 508.3 471.1 547.5 587.0 524.4 654.7 455.1 409.1 504.6762 382 380
Oral Cavity and Pharynx 6.9 3.5 12.4 13.7 6.2 26.1 1.6 0.2 6.712 10 2
Esophagus 2.5 0.6 6.6 3.7 0.3 13.3 1.8 0.2 7.04 2 2
Stomach 12.2 7.0 19.5 16.9 7.6 31.6 9.0 3.5 18.418 11 7
Colon and Rectum 62.1 49.4 76.9 74.0 52.6 100.5 54.1 38.8 73.091 47 44
Liver 14.5 9.2 21.7 22.9 13.0 37.5 7.8 3.0 16.325 18 7
Pancreas 15.4 9.2 24.0 19.4 9.0 35.4 12.2 5.4 23.020 11 9
Lung and Bronchus 79.4 64.6 96.4 103.5 76.4 136.4 65.0 48.0 85.8110 59 51
Bones and Joints 1.6 0.2 5.7 3.6 0.1 15.1 0.9 0.0 5.72 1 1
Melanoma of the Skin 3.2 0.8 7.9 5.3 1.4 13.34 0 4
Breast (invasive) 73.8 60.4 89.2 3.2 0.4 11.5 130.4 106.8 157.4114 2 112
Cervix 7.0 2.5 15.36
Corpus and Uterus, NOS 27.4 17.5 40.925
Ovary 6.9 2.4 15.36
Prostate 165.8 135.0 201.3115
Testis 0
Urinary Bladder (includes in situ) 16.0 9.7 24.4 28.2 15.4 46.5 7.1 2.2 16.222 17 5
Kidney and Renal Pelvis 25.9 18.2 35.7 29.9 18.2 46.2 21.9 12.6 34.940 22 18
Brain and Nervous System 2.7 0.7 7.1 2.8 0.3 10.7 2.6 0.3 9.24 2 2
Hodgkin Lymphoma 3.0 0.9 7.1 3.8 0.7 11.9 2.2 0.3 8.05 3 2
Non-Hodgkin Lymphoma 8.7 4.6 14.9 9.6 3.5 20.7 8.3 3.2 17.214 7 7
Myeloma 17.1 10.7 25.7 24.9 12.9 42.4 11.8 5.5 21.924 14 10
Leukemia 14.8 9.1 22.6 21.2 10.9 36.6 9.7 4.1 19.123 15 8
All Other Sites 52.6 41.0 66.2 40.0 25.1 60.1 62.3 46.1 82.178 26 52
DATA SOURCE: Illinois Department of Public Health, Illinois State Cancer Registry, data as of November 2018
Breast in situ (not in total) 21.6 12.8 34.0 19
IV - 33

SECTION V
County-specific Cancer Incidence Rates by Hispanic Ethnicity
Illinois, 2012-2016
V - 1

All Sites Combined and Selected Sites, Non-Hispanic, 2012-2016Figures include invasive cancer with the exception of urinary bladder (includes in situ) and breast cancer in situ as a separate category. Incidence counts are five-year totals.
Rates are per 100,000 age-adjustd to the 2000 U.S. standard million population. Lower confidence intervals (LCI) and upper confidence intervals (UCI) are 95 percent for rates,
Tiwari method.
Site Rate LCI UCI
Both Sexes Males Females
Cancer Incidence Counts and Five-year Age-adjusted Rates by Sex
Rate LCI UCI Rate LCI UCICount Count Count
Illinois
All Sites 478.4 476.7 480.1 520.7 518.1 523.4 451.9 449.6 454.2316,635 156,738 159,897
Oral Cavity and Pharynx 12.7 12.5 13.0 19.4 18.9 19.9 7.0 6.7 7.38,578 6,070 2,508
Esophagus 5.1 5.0 5.3 9.1 8.7 9.4 2.0 1.8 2.13,551 2,793 758
Stomach 6.8 6.6 7.0 9.7 9.3 10.0 4.6 4.4 4.84,537 2,849 1,688
Colon and Rectum 44.1 43.6 44.6 51.8 50.9 52.6 37.9 37.3 38.629,325 15,337 13,988
Liver 6.0 5.8 6.2 9.5 9.2 9.9 2.9 2.8 3.14,189 3,082 1,107
Pancreas 13.5 13.2 13.7 15.6 15.1 16.1 11.8 11.4 12.19,136 4,656 4,480
Lung and Bronchus 67.7 67.0 68.3 78.8 77.8 79.9 59.6 58.8 60.445,757 23,496 22,261
Bones and Joints 0.9 0.8 1.0 1.1 0.9 1.2 0.7 0.6 0.8510 293 217
Melanoma of the Skin 21.5 21.2 21.9 26.3 25.7 27.0 18.4 17.9 18.913,651 7,698 5,953
Breast (invasive) 73.5 72.8 74.2 1.4 1.3 1.5 136.1 134.9 137.447,621 415 47,206
Cervix 7.5 7.2 7.92,255
Corpus and Uterus, NOS 29.7 29.1 30.210,962
Ovary 11.3 11.0 11.73,984
Prostate 111.5 110.4 112.736,113
Testis 6.3 5.9 6.61,578
Urinary Bladder (includes in situ) 22.0 21.7 22.4 38.5 37.8 39.3 9.7 9.4 10.014,846 11,133 3,713
Kidney and Renal Pelvis 18.1 17.8 18.4 24.9 24.4 25.5 12.3 11.9 12.711,941 7,555 4,386
Brain and Nervous System 6.6 6.3 6.8 7.7 7.4 8.0 5.6 5.3 5.93,962 2,189 1,773
Hodgkin Lymphoma 2.9 2.7 3.0 3.3 3.1 3.5 2.5 2.3 2.71,564 882 682
Non-Hodgkin Lymphoma 19.6 19.3 20.0 23.8 23.2 24.4 16.4 16.0 16.812,782 6,881 5,901
Myeloma 6.5 6.3 6.7 8.0 7.7 8.4 5.3 5.1 5.64,384 2,396 1,988
Leukemia 13.5 13.2 13.8 17.4 16.9 17.9 10.5 10.2 10.98,591 4,925 3,666
All Other Sites 57.7 57.1 58.3 56.6 55.8 57.5 60.2 59.3 61.136,818 16,397 20,421
DATA SOURCE: Illinois Department of Public Health, Illinois State Cancer Registry, data as of November 2018
Breast in situ (not in total) 34.6 33.9 35.2 11,635
V - 2

All Sites Combined and Selected Sites, Non-Hispanic, 2012-2016Figures include invasive cancer with the exception of urinary bladder (includes in situ) and breast cancer in situ as a separate category. Incidence counts are five-year totals.
Rates are per 100,000 age-adjustd to the 2000 U.S. standard million population. Lower confidence intervals (LCI) and upper confidence intervals (UCI) are 95 percent for rates,
Tiwari method.
Site Rate LCI UCI
Both Sexes Males Females
Cancer Incidence Counts and Five-year Age-adjusted Rates by Sex
Rate LCI UCI Rate LCI UCICount Count Count
Cook
All Sites 470.0 467.2 472.8 516.3 511.9 520.7 442.2 438.5 445.9113,484 54,810 58,674
Oral Cavity and Pharynx 12.2 11.7 12.6 18.9 18.0 19.7 6.7 6.3 7.22,956 2,060 896
Esophagus 4.7 4.4 5.0 8.1 7.5 8.6 2.1 1.9 2.41,175 871 304
Stomach 8.7 8.3 9.1 12.3 11.6 13.0 6.0 5.6 6.52,102 1,268 834
Colon and Rectum 45.4 44.5 46.3 54.1 52.7 55.6 38.9 37.9 40.011,042 5,663 5,379
Liver 6.8 6.4 7.1 11.0 10.4 11.6 3.4 3.1 3.71,705 1,233 472
Pancreas 14.2 13.8 14.7 16.5 15.7 17.3 12.6 12.0 13.23,519 1,729 1,790
Lung and Bronchus 64.0 62.9 65.0 75.0 73.4 76.8 56.3 55.0 57.615,717 7,835 7,882
Bones and Joints 0.9 0.7 1.0 1.0 0.8 1.2 0.7 0.6 0.9183 100 83
Melanoma of the Skin 16.0 15.4 16.5 20.9 20.0 21.9 12.7 12.1 13.43,729 2,157 1,572
Breast (invasive) 75.9 74.8 77.0 1.4 1.2 1.7 137.2 135.2 139.417,850 153 17,697
Cervix 7.8 7.3 8.3907
Corpus and Uterus, NOS 31.0 30.0 31.94,264
Ovary 11.5 10.9 12.21,503
Prostate 119.4 117.3 121.513,542
Testis 5.5 5.0 6.0537
Urinary Bladder (includes in situ) 20.2 19.7 20.8 35.4 34.3 36.7 9.6 9.1 10.24,970 3,597 1,373
Kidney and Renal Pelvis 15.9 15.4 16.5 22.5 21.6 23.4 10.7 10.1 11.33,849 2,406 1,443
Brain and Nervous System 5.8 5.5 6.1 6.8 6.3 7.3 5.0 4.6 5.41,285 689 596
Hodgkin Lymphoma 3.0 2.8 3.3 3.6 3.2 4.0 2.6 2.3 2.9627 351 276
Non-Hodgkin Lymphoma 19.1 18.5 19.7 23.2 22.3 24.2 16.0 15.3 16.74,498 2,347 2,151
Myeloma 7.5 7.1 7.8 8.9 8.4 9.5 6.4 6.0 6.91,824 935 889
Leukemia 12.6 12.1 13.1 16.6 15.8 17.4 9.7 9.2 10.32,933 1,662 1,271
All Other Sites 54.5 53.5 55.4 55.2 53.7 56.7 55.2 53.8 56.512,767 5,675 7,092
DATA SOURCE: Illinois Department of Public Health, Illinois State Cancer Registry, data as of November 2018
Breast in situ (not in total) 36.0 34.9 37.1 4,470
V - 3

All Sites Combined and Selected Sites, Non-Hispanic, 2012-2016Figures include invasive cancer with the exception of urinary bladder (includes in situ) and breast cancer in situ as a separate category. Incidence counts are five-year totals.
Rates are per 100,000 age-adjustd to the 2000 U.S. standard million population. Lower confidence intervals (LCI) and upper confidence intervals (UCI) are 95 percent for rates,
Tiwari method.
Site Rate LCI UCI
Both Sexes Males Females
Cancer Incidence Counts and Five-year Age-adjusted Rates by Sex
Rate LCI UCI Rate LCI UCICount Count Count
DuPage
All Sites 464.9 458.7 471.2 490.5 481.0 500.2 453.0 444.6 461.522,686 10,839 11,847
Oral Cavity and Pharynx 11.9 11.0 13.0 18.0 16.3 19.9 6.8 5.8 7.9599 421 178
Esophagus 4.7 4.1 5.3 8.0 6.8 9.4 1.9 1.5 2.6235 180 55
Stomach 6.4 5.7 7.1 9.4 8.1 10.9 3.9 3.2 4.8312 204 108
Colon and Rectum 39.1 37.3 40.9 44.6 41.7 47.6 34.3 32.0 36.61,909 983 926
Liver 4.7 4.1 5.4 7.4 6.3 8.7 2.4 1.9 3.1240 173 67
Pancreas 11.6 10.7 12.6 13.5 11.9 15.2 10.2 9.1 11.5582 292 290
Lung and Bronchus 53.3 51.2 55.4 60.2 56.9 63.8 48.7 46.0 51.52,585 1,277 1,308
Bones and Joints 1.2 0.8 1.6 1.7 1.2 2.4 0.7 0.3 1.147 33 14
Melanoma of the Skin 21.2 19.9 22.6 26.2 24.0 28.5 17.8 16.1 19.61,006 581 425
Breast (invasive) 79.8 77.2 82.4 1.4 1.0 2.1 147.7 142.9 152.73,893 31 3,862
Cervix 5.4 4.5 6.5129
Corpus and Uterus, NOS 31.0 28.9 33.3871
Ovary 12.2 10.8 13.6321
Prostate 109.4 105.1 113.82,669
Testis 7.1 5.9 8.5130
Urinary Bladder (includes in situ) 22.1 20.8 23.6 39.1 36.3 42.0 9.4 8.3 10.71,063 807 256
Kidney and Renal Pelvis 16.2 15.1 17.5 23.6 21.5 25.8 10.1 8.9 11.5797 530 267
Brain and Nervous System 6.9 6.1 7.7 7.9 6.7 9.2 6.1 5.1 7.2318 172 146
Hodgkin Lymphoma 2.6 2.1 3.1 2.9 2.2 3.8 2.2 1.6 3.0107 59 48
Non-Hodgkin Lymphoma 21.1 19.8 22.5 26.0 23.8 28.3 17.3 15.7 19.11,009 548 461
Myeloma 6.4 5.7 7.2 8.5 7.3 9.9 4.8 4.0 5.8310 179 131
Leukemia 14.9 13.8 16.1 19.5 17.6 21.6 11.6 10.2 13.1689 398 291
All Other Sites 61.5 59.2 63.9 56.0 52.7 59.4 68.3 64.9 71.82,865 1,172 1,693
DATA SOURCE: Illinois Department of Public Health, Illinois State Cancer Registry, data as of November 2018
Breast in situ (not in total) 46.0 43.4 48.8 1,186
V - 4

All Sites Combined and Selected Sites, Non-Hispanic, 2012-2016Figures include invasive cancer with the exception of urinary bladder (includes in situ) and breast cancer in situ as a separate category. Incidence counts are five-year totals.
Rates are per 100,000 age-adjustd to the 2000 U.S. standard million population. Lower confidence intervals (LCI) and upper confidence intervals (UCI) are 95 percent for rates,
Tiwari method.
Site Rate LCI UCI
Both Sexes Males Females
Cancer Incidence Counts and Five-year Age-adjusted Rates by Sex
Rate LCI UCI Rate LCI UCICount Count Count
Kane
All Sites 464.8 455.6 474.2 502.7 488.5 517.2 441.3 428.9 454.010,277 5,139 5,138
Oral Cavity and Pharynx 11.8 10.4 13.3 18.5 16.0 21.4 5.6 4.3 7.2275 207 68
Esophagus 3.8 3.0 4.7 6.7 5.2 8.5 1.2 0.7 2.188 71 17
Stomach 6.2 5.2 7.3 9.3 7.5 11.5 3.6 2.6 4.9138 93 45
Colon and Rectum 39.0 36.4 41.8 46.9 42.6 51.5 32.6 29.3 36.0865 470 395
Liver 5.1 4.2 6.2 8.1 6.4 10.1 2.6 1.8 3.8121 90 31
Pancreas 12.8 11.3 14.5 16.3 13.8 19.2 10.1 8.4 12.2277 157 120
Lung and Bronchus 54.7 51.6 58.0 63.8 58.7 69.2 48.2 44.3 52.31,220 628 592
Bones and Joints 0.9 0.5 1.5 0.8 0.3 1.7 1.1 0.5 2.017 7 10
Melanoma of the Skin 25.6 23.5 27.9 30.4 27.0 34.2 22.3 19.5 25.4550 302 248
Breast (invasive) 71.1 67.5 74.8 1.4 0.8 2.4 132.8 126.1 139.81,572 15 1,557
Cervix 7.1 5.5 9.071
Corpus and Uterus, NOS 27.7 24.7 30.9345
Ovary 11.4 9.5 13.6134
Prostate 108.9 102.7 115.41,244
Testis 7.9 6.0 10.163
Urinary Bladder (includes in situ) 26.0 23.9 28.3 45.4 41.1 50.1 11.0 9.2 13.1568 434 134
Kidney and Renal Pelvis 16.6 14.9 18.4 22.4 19.6 25.6 11.5 9.6 13.7373 236 137
Brain and Nervous System 7.8 6.6 9.2 8.8 6.9 11.0 6.9 5.4 8.8157 82 75
Hodgkin Lymphoma 2.7 2.0 3.6 3.0 2.0 4.5 2.3 1.4 3.648 27 21
Non-Hodgkin Lymphoma 19.0 17.2 21.0 22.5 19.5 25.8 16.4 14.1 18.9410 219 191
Myeloma 6.1 5.1 7.3 8.0 6.3 10.1 4.7 3.5 6.1142 83 59
Leukemia 14.5 12.9 16.3 18.1 15.4 21.1 11.8 9.8 14.0310 175 135
All Other Sites 62.3 58.8 65.9 55.3 50.6 60.4 70.5 65.4 76.01,289 536 753
DATA SOURCE: Illinois Department of Public Health, Illinois State Cancer Registry, data as of November 2018
Breast in situ (not in total) 33.4 30.1 37.0 392
V - 5

All Sites Combined and Selected Sites, Non-Hispanic, 2012-2016Figures include invasive cancer with the exception of urinary bladder (includes in situ) and breast cancer in situ as a separate category. Incidence counts are five-year totals.
Rates are per 100,000 age-adjustd to the 2000 U.S. standard million population. Lower confidence intervals (LCI) and upper confidence intervals (UCI) are 95 percent for rates,
Tiwari method.
Site Rate LCI UCI
Both Sexes Males Females
Cancer Incidence Counts and Five-year Age-adjusted Rates by Sex
Rate LCI UCI Rate LCI UCICount Count Count
Lake
All Sites 465.2 457.7 472.8 483.9 472.6 495.4 455.7 445.5 466.115,682 7,583 8,099
Oral Cavity and Pharynx 11.6 10.5 12.8 15.6 13.7 17.7 8.0 6.7 9.4414 265 149
Esophagus 4.9 4.2 5.7 8.0 6.6 9.6 2.2 1.6 3.0172 132 40
Stomach 6.3 5.5 7.3 8.4 7.0 10.1 4.5 3.6 5.7209 129 80
Colon and Rectum 38.0 35.9 40.3 44.4 41.0 48.0 32.8 30.1 35.61,277 683 594
Liver 4.5 3.8 5.3 7.1 5.8 8.6 2.2 1.6 3.1158 117 41
Pancreas 14.6 13.3 16.0 16.9 14.8 19.1 12.5 10.9 14.3492 260 232
Lung and Bronchus 59.1 56.5 61.9 62.6 58.5 66.9 56.8 53.3 60.41,972 944 1,028
Bones and Joints 0.9 0.6 1.3 1.0 0.6 1.7 0.7 0.3 1.327 17 10
Melanoma of the Skin 25.5 23.7 27.3 29.3 26.5 32.2 23.1 20.7 25.6836 455 381
Breast (invasive) 79.6 76.5 82.8 2.0 1.4 2.9 148.5 142.7 154.52,688 32 2,656
Cervix 4.6 3.6 5.874
Corpus and Uterus, NOS 29.5 27.0 32.1558
Ovary 11.3 9.7 13.1200
Prostate 99.0 94.2 104.01,731
Testis 6.0 4.7 7.576
Urinary Bladder (includes in situ) 24.9 23.1 26.7 43.7 40.3 47.4 9.9 8.5 11.6823 640 183
Kidney and Renal Pelvis 16.3 15.0 17.8 24.9 22.5 27.6 9.0 7.6 10.5565 400 165
Brain and Nervous System 6.6 5.7 7.7 7.7 6.3 9.4 5.8 4.7 7.2207 114 93
Hodgkin Lymphoma 2.1 1.6 2.7 2.4 1.6 3.3 1.9 1.2 2.857 34 23
Non-Hodgkin Lymphoma 22.0 20.4 23.8 28.2 25.5 31.1 17.4 15.4 19.5733 422 311
Myeloma 5.6 4.8 6.5 6.6 5.3 8.1 4.9 3.9 6.1192 101 91
Leukemia 14.5 13.2 16.0 17.9 15.8 20.3 11.7 10.1 13.5468 266 202
All Other Sites 54.8 52.2 57.6 52.2 48.4 56.2 58.5 54.8 62.51,753 765 988
DATA SOURCE: Illinois Department of Public Health, Illinois State Cancer Registry, data as of November 2018
Breast in situ (not in total) 40.4 37.4 43.6 722
V - 6
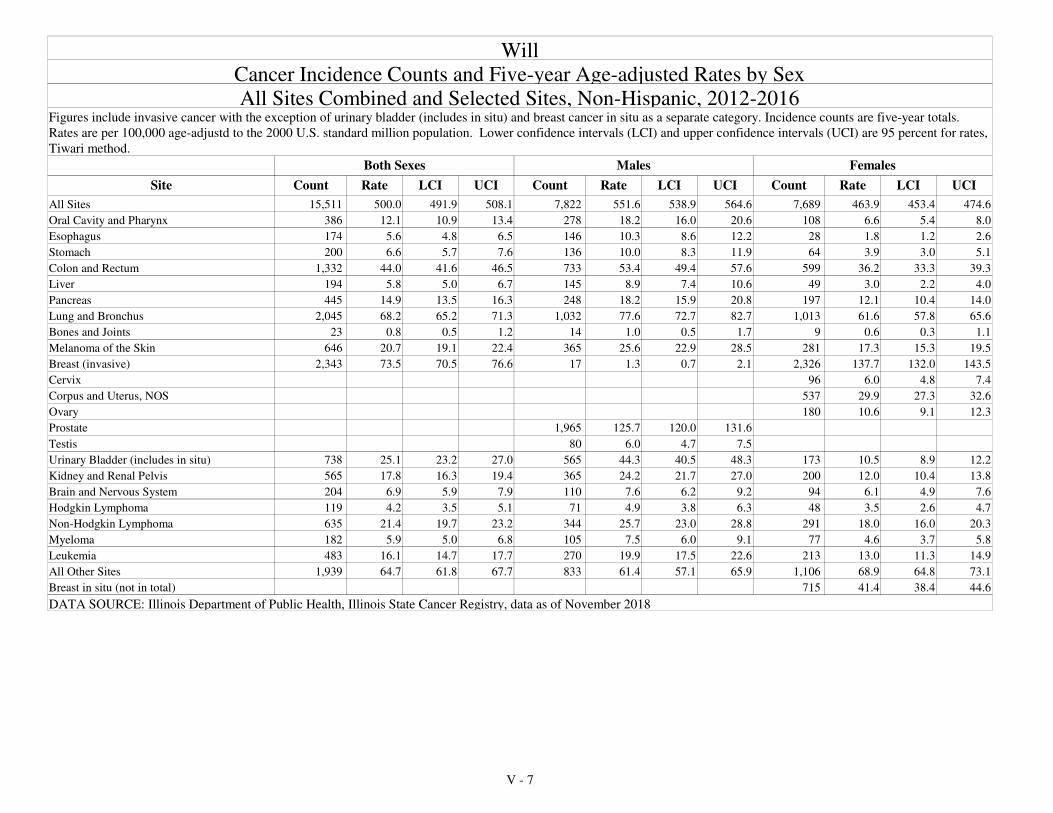
All Sites Combined and Selected Sites, Non-Hispanic, 2012-2016Figures include invasive cancer with the exception of urinary bladder (includes in situ) and breast cancer in situ as a separate category. Incidence counts are five-year totals.
Rates are per 100,000 age-adjustd to the 2000 U.S. standard million population. Lower confidence intervals (LCI) and upper confidence intervals (UCI) are 95 percent for rates,
Tiwari method.
Site Rate LCI UCI
Both Sexes Males Females
Cancer Incidence Counts and Five-year Age-adjusted Rates by Sex
Rate LCI UCI Rate LCI UCICount Count Count
Will
All Sites 500.0 491.9 508.1 551.6 538.9 564.6 463.9 453.4 474.615,511 7,822 7,689
Oral Cavity and Pharynx 12.1 10.9 13.4 18.2 16.0 20.6 6.6 5.4 8.0386 278 108
Esophagus 5.6 4.8 6.5 10.3 8.6 12.2 1.8 1.2 2.6174 146 28
Stomach 6.6 5.7 7.6 10.0 8.3 11.9 3.9 3.0 5.1200 136 64
Colon and Rectum 44.0 41.6 46.5 53.4 49.4 57.6 36.2 33.3 39.31,332 733 599
Liver 5.8 5.0 6.7 8.9 7.4 10.6 3.0 2.2 4.0194 145 49
Pancreas 14.9 13.5 16.3 18.2 15.9 20.8 12.1 10.4 14.0445 248 197
Lung and Bronchus 68.2 65.2 71.3 77.6 72.7 82.7 61.6 57.8 65.62,045 1,032 1,013
Bones and Joints 0.8 0.5 1.2 1.0 0.5 1.7 0.6 0.3 1.123 14 9
Melanoma of the Skin 20.7 19.1 22.4 25.6 22.9 28.5 17.3 15.3 19.5646 365 281
Breast (invasive) 73.5 70.5 76.6 1.3 0.7 2.1 137.7 132.0 143.52,343 17 2,326
Cervix 6.0 4.8 7.496
Corpus and Uterus, NOS 29.9 27.3 32.6537
Ovary 10.6 9.1 12.3180
Prostate 125.7 120.0 131.61,965
Testis 6.0 4.7 7.580
Urinary Bladder (includes in situ) 25.1 23.2 27.0 44.3 40.5 48.3 10.5 8.9 12.2738 565 173
Kidney and Renal Pelvis 17.8 16.3 19.4 24.2 21.7 27.0 12.0 10.4 13.8565 365 200
Brain and Nervous System 6.9 5.9 7.9 7.6 6.2 9.2 6.1 4.9 7.6204 110 94
Hodgkin Lymphoma 4.2 3.5 5.1 4.9 3.8 6.3 3.5 2.6 4.7119 71 48
Non-Hodgkin Lymphoma 21.4 19.7 23.2 25.7 23.0 28.8 18.0 16.0 20.3635 344 291
Myeloma 5.9 5.0 6.8 7.5 6.0 9.1 4.6 3.7 5.8182 105 77
Leukemia 16.1 14.7 17.7 19.9 17.5 22.6 13.0 11.3 14.9483 270 213
All Other Sites 64.7 61.8 67.7 61.4 57.1 65.9 68.9 64.8 73.11,939 833 1,106
DATA SOURCE: Illinois Department of Public Health, Illinois State Cancer Registry, data as of November 2018
Breast in situ (not in total) 41.4 38.4 44.6 715
V - 7

All Sites Combined and Selected Sites, Hispanic, 2012-2016Figures include invasive cancer with the exception of urinary bladder (includes in situ) and breast cancer in situ as a separate category. Incidence counts are five-year totals.
Rates are per 100,000 age-adjustd to the 2000 U.S. standard million population. Lower confidence intervals (LCI) and upper confidence intervals (UCI) are 95 percent for rates,
Tiwari method.
Site Rate LCI UCI
Both Sexes Males Females
Cancer Incidence Counts and Five-year Age-adjusted Rates by Sex
Rate LCI UCI Rate LCI UCICount Count Count
Illinois
All Sites 344.5 339.5 349.6 362.5 354.6 370.6 336.6 330.0 343.321,780 10,353 11,427
Oral Cavity and Pharynx 6.4 5.7 7.1 8.9 7.7 10.2 4.1 3.4 5.0399 269 130
Esophagus 2.3 1.9 2.8 3.9 3.1 4.9 0.9 0.6 1.4127 103 24
Stomach 11.2 10.2 12.1 12.8 11.4 14.5 9.8 8.6 11.0640 347 293
Colon and Rectum 32.6 31.0 34.2 37.5 35.0 40.2 28.5 26.5 30.61,943 1,055 888
Liver 10.9 10.0 11.8 16.5 14.9 18.3 5.7 4.8 6.7636 473 163
Pancreas 11.6 10.7 12.7 13.1 11.5 14.7 10.4 9.1 11.7614 328 286
Lung and Bronchus 27.2 25.7 28.8 32.7 30.2 35.4 23.1 21.3 25.11,373 729 644
Bones and Joints 0.9 0.7 1.1 0.9 0.7 1.3 0.8 0.5 1.188 49 39
Melanoma of the Skin 4.5 3.9 5.1 4.8 3.9 5.8 4.4 3.6 5.2280 129 151
Breast (invasive) 47.8 46.1 49.6 0.7 0.4 1.2 93.0 89.6 96.43,310 21 3,289
Cervix 9.3 8.3 10.4374
Corpus and Uterus, NOS 25.9 24.2 27.6958
Ovary 9.6 8.5 10.7338
Prostate 90.1 86.2 94.12,430
Testis 5.4 4.8 6.0331
Urinary Bladder (includes in situ) 11.2 10.2 12.2 17.7 15.8 19.8 5.9 5.0 6.9533 381 152
Kidney and Renal Pelvis 16.8 15.7 17.9 21.8 20.0 23.7 12.2 11.0 13.51,112 696 416
Brain and Nervous System 5.2 4.6 5.8 5.8 4.9 6.7 4.6 3.9 5.4405 222 183
Hodgkin Lymphoma 2.6 2.3 3.1 3.3 2.7 4.0 2.0 1.6 2.6227 135 92
Non-Hodgkin Lymphoma 17.8 16.7 19.0 19.9 18.1 21.9 16.0 14.5 17.51,095 594 501
Myeloma 6.9 6.1 7.6 7.8 6.7 9.1 6.0 5.1 7.0379 210 169
Leukemia 11.0 10.2 11.9 13.3 11.9 14.8 9.0 8.0 10.1850 498 352
All Other Sites 49.9 48.1 51.9 45.3 42.5 48.2 55.5 52.9 58.23,338 1,353 1,985
DATA SOURCE: Illinois Department of Public Health, Illinois State Cancer Registry, data as of November 2018
Breast in situ (not in total) 24.1 22.5 25.9 872
V - 8

All Sites Combined and Selected Sites, Hispanic, 2012-2016Figures include invasive cancer with the exception of urinary bladder (includes in situ) and breast cancer in situ as a separate category. Incidence counts are five-year totals.
Rates are per 100,000 age-adjustd to the 2000 U.S. standard million population. Lower confidence intervals (LCI) and upper confidence intervals (UCI) are 95 percent for rates,
Tiwari method.
Site Rate LCI UCI
Both Sexes Males Females
Cancer Incidence Counts and Five-year Age-adjusted Rates by Sex
Rate LCI UCI Rate LCI UCICount Count Count
Cook
All Sites 344.9 338.8 351.1 364.6 355.0 374.3 334.8 326.9 342.914,391 6,911 7,480
Oral Cavity and Pharynx 6.8 5.9 7.7 9.5 8.1 11.2 4.4 3.5 5.4276 183 93
Esophagus 2.4 1.9 2.9 3.9 2.9 5.0 1.0 0.6 1.689 71 18
Stomach 11.6 10.5 12.8 13.0 11.2 15.0 10.5 9.0 12.0443 231 212
Colon and Rectum 32.3 30.4 34.2 37.1 34.1 40.3 28.3 26.0 30.81,282 690 592
Liver 11.9 10.8 13.2 18.1 16.1 20.3 6.4 5.2 7.6473 350 123
Pancreas 11.6 10.4 12.8 13.3 11.5 15.4 10.0 8.6 11.6417 227 190
Lung and Bronchus 27.0 25.2 28.9 33.5 30.4 36.7 22.0 19.9 24.3925 509 416
Bones and Joints 0.8 0.5 1.0 0.8 0.5 1.2 0.7 0.4 1.149 27 22
Melanoma of the Skin 3.8 3.2 4.5 4.3 3.3 5.5 3.4 2.7 4.3156 78 78
Breast (invasive) 47.8 45.7 50.0 0.9 0.5 1.5 92.0 88.0 96.22,154 17 2,137
Cervix 10.1 8.9 11.5260
Corpus and Uterus, NOS 26.8 24.8 29.1656
Ovary 10.3 9.0 11.8238
Prostate 89.6 84.9 94.41,630
Testis 5.8 5.0 6.7213
Urinary Bladder (includes in situ) 11.4 10.2 12.7 18.5 16.2 21.1 5.7 4.6 7.0364 265 99
Kidney and Renal Pelvis 16.3 15.0 17.6 21.3 19.1 23.6 11.8 10.4 13.4715 447 268
Brain and Nervous System 4.9 4.3 5.7 5.0 4.1 6.1 4.8 3.9 5.8250 132 118
Hodgkin Lymphoma 2.8 2.4 3.4 3.5 2.8 4.4 2.2 1.6 2.9154 94 60
Non-Hodgkin Lymphoma 18.3 16.9 19.8 20.6 18.4 23.0 16.2 14.5 18.2738 400 338
Myeloma 6.9 6.0 7.8 8.0 6.6 9.5 5.9 4.8 7.1257 145 112
Leukemia 11.2 10.1 12.3 13.6 11.9 15.5 8.9 7.7 10.3546 322 224
All Other Sites 48.6 46.3 50.9 44.3 41.0 47.7 53.3 50.2 56.62,106 880 1,226
DATA SOURCE: Illinois Department of Public Health, Illinois State Cancer Registry, data as of November 2018
Breast in situ (not in total) 23.6 21.6 25.7 551
V - 9

All Sites Combined and Selected Sites, Hispanic, 2012-2016Figures include invasive cancer with the exception of urinary bladder (includes in situ) and breast cancer in situ as a separate category. Incidence counts are five-year totals.
Rates are per 100,000 age-adjustd to the 2000 U.S. standard million population. Lower confidence intervals (LCI) and upper confidence intervals (UCI) are 95 percent for rates,
Tiwari method.
Site Rate LCI UCI
Both Sexes Males Females
Cancer Incidence Counts and Five-year Age-adjusted Rates by Sex
Rate LCI UCI Rate LCI UCICount Count Count
DuPage
All Sites 376.6 353.4 400.8 376.7 340.5 415.4 386.8 356.2 419.21,295 562 733
Oral Cavity and Pharynx 5.3 3.0 8.6 7.5 3.4 14.0 3.8 1.4 7.920 12 8
Esophagus 4.3 2.0 7.8 6.4 2.4 13.0 2.6 0.5 7.112 9 3
Stomach 8.9 5.8 13.1 12.0 6.3 20.2 6.9 3.5 12.132 18 14
Colon and Rectum 35.3 28.1 43.7 38.9 27.5 52.9 32.7 23.6 43.9106 55 51
Liver 7.2 4.1 11.4 11.1 5.5 19.2 4.0 1.2 9.120 15 5
Pancreas 14.7 9.9 20.7 12.7 6.3 22.1 15.9 9.6 24.435 14 21
Lung and Bronchus 23.6 17.4 30.9 24.6 15.2 36.9 23.1 15.3 33.058 26 32
Bones and Joints 1.7 0.6 3.8 0.5 0.1 3.0 2.8 1.0 6.39 2 7
Melanoma of the Skin 5.6 3.0 9.2 7.0 2.6 14.1 4.7 2.0 9.319 9 10
Breast (invasive) 53.1 45.3 61.7 103.3 88.6 119.7215 0 215
Cervix 6.5 3.3 11.415
Corpus and Uterus, NOS 22.6 16.1 30.646
Ovary 11.5 7.2 17.326
Prostate 104.5 86.3 125.1144
Testis 5.2 3.2 8.720
Urinary Bladder (includes in situ) 12.0 7.8 17.5 12.9 6.8 21.6 11.0 5.8 18.629 16 13
Kidney and Renal Pelvis 17.0 12.8 22.2 22.6 15.2 32.0 12.4 7.7 18.764 39 25
Brain and Nervous System 4.4 2.6 7.0 3.8 2.0 7.3 4.7 2.1 8.923 12 11
Hodgkin Lymphoma 3.4 1.6 6.3 5.0 1.7 10.7 2.1 0.5 5.314 9 5
Non-Hodgkin Lymphoma 20.8 15.3 27.3 21.1 13.2 31.4 20.4 13.4 29.564 32 32
Myeloma 7.9 4.7 12.2 8.2 3.9 14.9 7.3 3.2 13.722 13 9
Leukemia 14.6 10.3 19.8 19.5 11.8 29.8 11.2 6.5 17.760 37 23
All Other Sites 64.9 55.7 75.0 53.1 40.0 68.7 77.3 64.7 91.6242 80 162
DATA SOURCE: Illinois Department of Public Health, Illinois State Cancer Registry, data as of November 2018
Breast in situ (not in total) 31.2 23.9 39.9 71
V - 10

All Sites Combined and Selected Sites, Hispanic, 2012-2016Figures include invasive cancer with the exception of urinary bladder (includes in situ) and breast cancer in situ as a separate category. Incidence counts are five-year totals.
Rates are per 100,000 age-adjustd to the 2000 U.S. standard million population. Lower confidence intervals (LCI) and upper confidence intervals (UCI) are 95 percent for rates,
Tiwari method.
Site Rate LCI UCI
Both Sexes Males Females
Cancer Incidence Counts and Five-year Age-adjusted Rates by Sex
Rate LCI UCI Rate LCI UCICount Count Count
Kane
All Sites 318.2 298.2 339.0 343.4 311.4 377.5 303.4 278.0 330.31,304 620 684
Oral Cavity and Pharynx 3.7 2.0 6.3 5.0 2.1 9.8 2.6 0.8 6.017 12 5
Esophagus 2.3 0.8 4.8 4.9 1.7 10.67 7 0
Stomach 11.8 7.9 16.6 9.4 4.7 16.2 13.7 8.2 21.241 17 24
Colon and Rectum 24.6 19.2 30.9 34.7 24.9 46.5 16.0 10.6 22.897 61 36
Liver 10.7 7.1 15.3 16.8 10.0 26.0 5.6 2.3 10.737 28 9
Pancreas 12.9 8.8 18.0 13.5 7.4 22.1 12.5 7.4 19.541 20 21
Lung and Bronchus 26.1 20.0 33.2 32.9 22.5 45.7 21.1 14.3 29.778 41 37
Bones and Joints 1.3 0.5 2.8 1.6 0.7 4.1 0.9 0.1 3.610 8 2
Melanoma of the Skin 4.3 2.3 7.1 2.9 0.8 7.3 5.6 2.7 10.219 6 13
Breast (invasive) 41.6 35.3 48.7 2.0 0.4 5.7 81.4 69.3 95.0198 3 195
Cervix 7.4 4.3 11.920
Corpus and Uterus, NOS 22.6 16.8 29.858
Ovary 7.0 3.7 11.917
Prostate 86.6 71.2 104.0146
Testis 4.3 2.6 7.121
Urinary Bladder (includes in situ) 9.2 5.8 13.5 14.1 7.9 22.5 5.0 2.1 9.729 20 9
Kidney and Renal Pelvis 17.1 12.8 22.3 20.9 14.2 29.4 13.3 8.2 20.170 44 26
Brain and Nervous System 7.6 4.7 11.4 10.2 5.3 17.2 5.2 2.3 9.932 19 13
Hodgkin Lymphoma 1.6 0.8 3.1 1.8 0.7 4.5 1.4 0.5 3.613 7 6
Non-Hodgkin Lymphoma 18.6 13.8 24.3 21.7 14.3 31.0 15.5 9.8 23.170 40 30
Myeloma 6.0 3.5 9.3 8.5 4.4 14.5 3.5 1.1 7.921 16 5
Leukemia 9.4 6.1 13.5 11.8 6.3 19.5 7.5 4.1 12.642 22 20
All Other Sites 47.5 40.3 55.6 39.9 29.9 51.8 55.5 45.3 67.2220 82 138
DATA SOURCE: Illinois Department of Public Health, Illinois State Cancer Registry, data as of November 2018
Breast in situ (not in total) 19.5 14.0 26.3 50
V - 11

All Sites Combined and Selected Sites, Hispanic, 2012-2016Figures include invasive cancer with the exception of urinary bladder (includes in situ) and breast cancer in situ as a separate category. Incidence counts are five-year totals.
Rates are per 100,000 age-adjustd to the 2000 U.S. standard million population. Lower confidence intervals (LCI) and upper confidence intervals (UCI) are 95 percent for rates,
Tiwari method.
Site Rate LCI UCI
Both Sexes Males Females
Cancer Incidence Counts and Five-year Age-adjusted Rates by Sex
Rate LCI UCI Rate LCI UCICount Count Count
Lake
All Sites 318.9 297.7 341.0 336.9 303.0 373.0 310.2 283.1 338.91,193 550 643
Oral Cavity and Pharynx 4.7 2.8 7.5 6.8 3.6 11.8 2.6 0.8 6.222 16 6
Esophagus 2.1 0.7 4.5 4.3 1.5 9.66 6 0
Stomach 13.3 9.0 18.7 22.1 13.2 33.9 6.8 3.4 11.841 27 14
Colon and Rectum 34.1 27.3 41.9 34.4 24.8 46.1 33.1 24.1 44.0121 60 61
Liver 6.0 3.5 9.5 10.0 5.2 17.1 2.5 0.9 5.722 16 6
Pancreas 11.9 7.8 17.3 13.7 7.1 23.1 10.7 5.6 17.932 17 15
Lung and Bronchus 23.6 17.4 31.0 27.7 17.5 40.7 20.7 13.3 30.259 30 29
Bones and Joints 1.2 0.2 3.4 2.2 0.3 7.1 0.5 0.0 2.85 4 1
Melanoma of the Skin 4.7 2.5 8.0 8.0 3.5 15.1 2.0 0.7 4.917 11 6
Breast (invasive) 45.9 38.4 54.2 89.1 75.3 104.6186 0 186
Cervix 8.1 5.0 12.423
Corpus and Uterus, NOS 32.0 23.9 41.865
Ovary 6.2 2.6 11.910
Prostate 82.5 66.4 101.0125
Testis 3.2 1.8 6.315
Urinary Bladder (includes in situ) 11.0 6.6 16.7 17.3 8.7 29.4 7.2 3.0 13.824 15 9
Kidney and Renal Pelvis 15.4 11.1 20.8 23.7 15.7 34.0 7.9 4.2 13.560 42 18
Brain and Nervous System 5.2 2.9 8.5 6.1 2.3 12.6 4.6 2.1 8.824 10 14
Hodgkin Lymphoma 2.0 0.8 4.1 2.8 0.7 7.3 1.2 0.4 3.511 6 5
Non-Hodgkin Lymphoma 14.9 10.7 20.0 17.7 11.4 26.2 12.0 7.1 18.759 36 23
Myeloma 7.2 4.0 11.6 5.7 2.2 11.7 8.1 3.7 14.819 8 11
Leukemia 10.6 7.3 14.7 9.9 6.1 15.4 10.5 6.1 16.855 30 25
All Other Sites 40.9 34.3 48.4 38.7 28.7 50.8 44.4 35.7 54.4192 76 116
DATA SOURCE: Illinois Department of Public Health, Illinois State Cancer Registry, data as of November 2018
Breast in situ (not in total) 27.3 20.6 35.4 65
V - 12

All Sites Combined and Selected Sites, Hispanic, 2012-2016Figures include invasive cancer with the exception of urinary bladder (includes in situ) and breast cancer in situ as a separate category. Incidence counts are five-year totals.
Rates are per 100,000 age-adjustd to the 2000 U.S. standard million population. Lower confidence intervals (LCI) and upper confidence intervals (UCI) are 95 percent for rates,
Tiwari method.
Site Rate LCI UCI
Both Sexes Males Females
Cancer Incidence Counts and Five-year Age-adjusted Rates by Sex
Rate LCI UCI Rate LCI UCICount Count Count
Will
All Sites 399.8 373.8 426.9 420.3 378.9 464.4 394.1 360.6 429.61,164 530 634
Oral Cavity and Pharynx 7.9 4.7 12.2 12.9 7.2 21.1 2.9 0.7 7.622 18 4
Esophagus 0.7 0.1 2.5 0.6 0.0 3.9 0.8 0.0 3.92 1 1
Stomach 9.1 5.5 13.9 15.2 8.2 25.1 3.9 1.3 8.925 19 6
Colon and Rectum 45.0 35.9 55.4 55.1 39.6 73.9 38.1 27.6 51.0108 56 52
Liver 11.6 7.2 17.5 16.2 8.4 27.1 7.8 3.3 14.825 16 9
Pancreas 12.0 7.6 17.8 13.7 7.0 23.5 10.6 5.3 18.228 14 14
Lung and Bronchus 33.3 25.5 42.4 43.9 30.5 60.4 24.5 16.0 35.674 45 29
Bones and Joints 1.2 0.4 3.0 1.4 0.3 4.9 1.0 0.2 3.76 3 3
Melanoma of the Skin 7.0 3.8 11.7 5.1 1.4 12.2 8.7 4.1 15.718 6 12
Breast (invasive) 54.5 46.2 63.9 0.4 0.0 3.4 108.3 92.2 126.2196 1 195
Cervix 7.0 4.0 11.717
Corpus and Uterus, NOS 28.1 20.3 37.948
Ovary 11.0 6.0 18.317
Prostate 105.0 85.3 127.4124
Testis 6.9 4.3 11.222
Urinary Bladder (includes in situ) 11.6 7.2 17.4 19.0 10.6 30.5 5.4 1.8 11.724 18 6
Kidney and Renal Pelvis 18.0 13.1 24.0 23.9 15.5 34.8 13.0 7.7 20.357 36 21
Brain and Nervous System 4.8 2.8 7.8 6.2 2.6 12.1 3.7 1.6 7.621 12 9
Hodgkin Lymphoma 2.1 1.1 3.9 2.1 0.8 5.4 2.0 0.7 5.113 7 6
Non-Hodgkin Lymphoma 16.0 11.5 21.5 15.4 9.0 24.5 16.9 10.9 25.052 24 28
Myeloma 7.3 3.9 12.0 10.1 4.3 19.1 5.0 1.8 10.416 9 7
Leukemia 14.1 10.0 19.4 12.8 7.6 20.2 15.1 9.2 23.155 28 27
All Other Sites 67.2 56.6 79.0 54.3 40.0 71.6 80.1 64.9 97.5194 71 123
DATA SOURCE: Illinois Department of Public Health, Illinois State Cancer Registry, data as of November 2018
Breast in situ (not in total) 22.6 15.9 31.1 43
V - 13

APPENDIX A
Illinois County Population Totals
2012-2016
A - 1

Total five-year population, 2012-2016, used to calculate rates. SOURCE: U.S. Census Bureau's Population Estimates Program
Illinois
White BlackAge
FemalesMales
Total Population White BlackTotal Population
<1 402,403 304,791 72,750 385,419 290,930 70,685
1-4 1,627,229 1,233,802 289,305 1,557,039 1,177,591 279,865
5-9 2,108,500 1,599,688 369,771 2,029,562 1,532,498 360,595
10-14 2,167,399 1,654,388 380,448 2,079,006 1,575,978 371,373
15-19 2,213,679 1,671,343 411,443 2,108,036 1,586,269 396,048
20-24 2,283,875 1,702,794 424,455 2,201,813 1,625,352 425,031
25-29 2,264,757 1,745,223 347,053 2,213,373 1,671,415 365,351
30-34 2,231,190 1,746,484 303,501 2,219,532 1,687,686 343,886
35-39 2,082,943 1,636,472 279,992 2,080,269 1,578,499 324,526
40-44 2,082,965 1,643,001 282,763 2,108,416 1,604,025 337,093
45-49 2,121,859 1,710,659 282,043 2,164,212 1,692,921 331,872
50-54 2,235,817 1,830,033 295,663 2,315,551 1,843,552 348,484
55-59 2,125,649 1,755,086 270,559 2,241,116 1,793,163 333,211
60-64 1,774,534 1,479,812 207,458 1,924,382 1,545,622 274,564
65-69 1,379,716 1,157,800 150,884 1,554,698 1,264,683 208,035
70-74 950,792 797,406 104,395 1,149,405 941,084 152,219
75-79 662,791 559,608 72,379 870,055 718,378 115,264
80-84 458,276 397,306 44,574 686,088 582,770 80,321
85+ 419,450 371,925 35,522 867,316 761,523 83,781
Total 31,593,824 24,997,621 4,624,958 32,755,288 25,473,939 5,202,204
Adams
White BlackAge
FemalesMales
Total Population White BlackTotal Population
<1 2,154 1,922 206 1,987 1,796 170
1-4 8,731 7,835 754 8,020 7,243 614
5-9 10,940 9,888 900 10,392 9,387 860
10-14 10,793 9,919 758 10,361 9,440 822
15-19 10,557 9,631 779 9,858 9,089 655
20-24 10,374 9,479 776 10,484 9,642 695
25-29 10,137 9,489 538 10,357 9,644 576
30-34 10,023 9,397 495 10,266 9,689 388
35-39 9,266 8,699 407 9,026 8,513 345
40-44 9,427 8,961 323 9,361 8,902 308
45-49 10,165 9,660 367 10,475 10,037 315
50-54 12,032 11,486 427 12,108 11,611 369
55-59 11,760 11,264 408 11,983 11,536 318
60-64 10,377 10,021 287 10,881 10,505 284
65-69 8,421 8,158 178 9,372 9,070 224
70-74 6,186 6,048 100 7,415 7,251 113
75-79 4,705 4,595 76 5,930 5,763 128
80-84 3,924 3,853 66 5,274 5,130 119
85+ 4,211 4,127 83 7,105 6,991 92
Total 164,183 154,432 7,928 170,655 161,239 7,395
Alexander
White BlackAge
FemalesMales
Total Population White BlackTotal Population
<1 243 136 107 239 118 121
1-4 1,048 570 476 992 446 542
5-9 1,189 620 567 1,180 574 603
10-14 1,124 617 498 1,146 635 509
15-19 942 484 451 891 481 404
20-24 1,079 590 484 1,031 504 525
25-29 919 585 324 967 545 420
30-34 873 531 334 930 591 328
35-39 861 549 301 908 568 315
40-44 753 509 233 1,030 653 369
45-49 1,120 763 351 1,045 610 429
50-54 1,268 875 378 1,332 837 485
55-59 1,371 933 413 1,343 896 420
60-64 1,278 870 389 1,344 900 430
65-69 987 789 189 1,062 780 268
70-74 811 655 156 906 709 189
75-79 540 434 100 693 555 134
80-84 376 275 97 563 421 135
85+ 324 241 83 572 447 124
Total 17,106 11,026 5,931 18,174 11,270 6,750
A - 2

Total five-year population, 2012-2016, used to calculate rates. SOURCE: U.S. Census Bureau's Population Estimates Program
Bond
White BlackAge
FemalesMales
Total Population White BlackTotal Population
<1 383 355 24 398 377 20
1-4 1,721 1,595 102 1,641 1,552 79
5-9 2,393 2,285 77 2,341 2,216 108
10-14 2,505 2,386 90 2,406 2,290 82
15-19 2,760 2,559 104 2,451 2,288 147
20-24 3,059 2,540 354 2,510 2,337 140
25-29 3,172 2,535 565 2,424 2,229 129
30-34 3,533 2,559 886 2,223 2,083 107
35-39 3,444 2,714 666 2,488 2,288 148
40-44 3,140 2,648 464 2,276 2,149 96
45-49 3,112 2,787 278 2,603 2,487 102
50-54 3,400 3,069 305 3,143 2,999 99
55-59 3,102 2,918 166 3,057 2,940 92
60-64 2,842 2,714 116 2,838 2,752 71
65-69 2,209 2,113 84 2,189 2,087 78
70-74 1,507 1,447 45 1,728 1,696 26
75-79 1,121 1,103 15 1,418 1,377 40
80-84 879 859 16 1,172 1,152 15
85+ 664 640 19 1,502 1,481 15
Total 44,946 39,826 4,376 40,808 38,780 1,594
Boone
White BlackAge
FemalesMales
Total Population White BlackTotal Population
<1 1,485 1,398 63 1,377 1,300 55
1-4 6,568 6,043 361 6,249 5,802 298
5-9 9,996 9,175 535 9,433 8,643 486
10-14 11,066 10,312 443 10,999 10,213 444
15-19 10,777 10,069 439 10,212 9,538 375
20-24 8,763 8,218 340 7,751 7,297 262
25-29 6,870 6,461 246 6,466 6,067 258
30-34 7,158 6,697 229 7,697 7,189 288
35-39 8,176 7,663 261 8,499 7,934 282
40-44 9,669 9,066 317 9,823 9,223 253
45-49 10,033 9,552 240 10,076 9,577 231
50-54 10,057 9,595 311 9,635 9,239 201
55-59 8,791 8,469 201 8,646 8,311 168
60-64 7,358 7,123 112 7,392 7,094 136
65-69 5,991 5,812 74 6,575 6,359 74
70-74 4,744 4,619 46 5,093 5,003 32
75-79 3,019 2,952 25 3,554 3,469 38
80-84 1,889 1,861 8 2,427 2,385 9
85+ 1,399 1,378 7 2,717 2,686 11
Total 133,809 126,463 4,258 134,621 127,329 3,901
Brown
White BlackAge
FemalesMales
Total Population White BlackTotal Population
<1 156 152 4 119 119 0
1-4 614 603 10 526 515 10
5-9 731 708 20 772 739 26
10-14 765 750 6 720 706 10
15-19 949 719 205 642 621 10
20-24 2,573 1,228 1,152 714 695 13
25-29 2,603 1,245 1,229 686 668 16
30-34 2,343 1,213 1,044 758 753 5
35-39 2,150 1,208 916 662 655 0
40-44 1,847 1,100 733 750 750 0
45-49 1,643 1,056 572 753 747 4
50-54 1,608 1,221 379 870 860 1
55-59 1,247 1,085 157 844 836 2
60-64 841 780 47 803 791 0
65-69 612 587 20 680 678 0
70-74 483 482 0 567 567 0
75-79 405 400 5 455 452 0
80-84 292 292 0 323 321 0
85+ 192 192 0 429 424 5
Total 22,054 15,021 6,499 12,073 11,897 102
A - 3

Total five-year population, 2012-2016, used to calculate rates. SOURCE: U.S. Census Bureau's Population Estimates Program
Bureau
White BlackAge
FemalesMales
Total Population White BlackTotal Population
<1 886 843 31 843 809 26
1-4 3,722 3,588 87 3,517 3,343 121
5-9 5,211 5,025 122 5,122 4,846 156
10-14 5,673 5,435 164 5,588 5,288 177
15-19 5,238 5,039 148 5,113 4,882 130
20-24 4,685 4,517 96 4,491 4,329 68
25-29 4,338 4,198 52 4,285 4,112 77
30-34 4,766 4,606 88 4,522 4,367 56
35-39 4,683 4,543 74 4,625 4,473 92
40-44 4,803 4,676 70 5,058 4,909 62
45-49 5,605 5,486 50 5,482 5,318 43
50-54 6,229 6,082 66 6,193 6,078 37
55-59 6,233 6,167 24 6,609 6,506 29
60-64 5,896 5,827 21 5,927 5,816 18
65-69 4,877 4,812 13 5,073 4,993 17
70-74 3,516 3,470 11 4,102 4,023 16
75-79 2,777 2,756 5 3,280 3,268 4
80-84 1,900 1,891 2 2,624 2,613 3
85+ 1,886 1,882 4 3,812 3,803 2
Total 82,924 80,843 1,128 86,266 83,776 1,134
Calhoun
White BlackAge
FemalesMales
Total Population White BlackTotal Population
<1 105 104 1 132 131 1
1-4 523 517 5 528 525 2
5-9 764 749 10 658 653 1
10-14 756 743 10 714 706 2
15-19 728 714 9 720 702 7
20-24 669 658 6 600 583 10
25-29 650 642 6 495 489 6
30-34 599 597 1 594 587 7
35-39 634 632 2 616 613 3
40-44 733 730 3 701 688 5
45-49 843 842 1 891 879 4
50-54 989 980 5 873 870 1
55-59 1,031 1,029 1 899 890 0
60-64 904 900 4 832 824 1
65-69 748 746 0 835 824 2
70-74 656 651 0 706 700 0
75-79 479 479 0 555 550 0
80-84 320 320 0 433 432 0
85+ 243 238 5 483 483 0
Total 12,374 12,271 69 12,265 12,129 52
Carroll
White BlackAge
FemalesMales
Total Population White BlackTotal Population
<1 350 337 9 362 348 13
1-4 1,446 1,373 34 1,484 1,408 43
5-9 1,910 1,855 34 1,876 1,769 60
10-14 2,362 2,259 77 1,973 1,897 56
15-19 2,208 2,074 80 2,066 1,961 56
20-24 2,016 1,935 56 1,839 1,786 28
25-29 1,874 1,833 30 1,634 1,586 25
30-34 1,943 1,866 51 1,894 1,847 31
35-39 1,889 1,816 49 1,779 1,725 21
40-44 2,090 2,031 41 2,034 1,973 30
45-49 2,103 2,062 27 2,220 2,165 30
50-54 2,781 2,727 36 2,744 2,704 20
55-59 2,902 2,846 32 2,997 2,951 17
60-64 2,995 2,923 42 2,916 2,876 19
65-69 2,731 2,682 31 2,746 2,708 15
70-74 2,093 2,072 7 2,156 2,145 8
75-79 1,459 1,436 10 1,517 1,512 3
80-84 993 989 0 1,233 1,223 8
85+ 879 874 5 1,622 1,593 26
Total 37,024 35,990 651 37,092 36,177 509
A - 4

Total five-year population, 2012-2016, used to calculate rates. SOURCE: U.S. Census Bureau's Population Estimates Program
Cass
White BlackAge
FemalesMales
Total Population White BlackTotal Population
<1 437 383 46 402 354 45
1-4 1,768 1,565 167 1,547 1,391 144
5-9 2,401 2,178 156 2,190 2,003 152
10-14 2,370 2,200 138 2,121 1,983 119
15-19 2,248 2,069 126 1,990 1,912 52
20-24 1,940 1,774 124 1,907 1,713 153
25-29 2,060 1,803 221 1,748 1,581 136
30-34 2,173 1,940 212 1,910 1,766 103
35-39 1,992 1,773 181 1,944 1,826 81
40-44 2,121 1,963 142 1,972 1,879 62
45-49 2,109 1,993 86 2,203 2,107 65
50-54 2,408 2,314 69 2,240 2,153 66
55-59 2,261 2,198 54 2,279 2,155 82
60-64 2,044 1,987 46 1,905 1,867 18
65-69 1,468 1,434 18 1,606 1,590 12
70-74 1,117 1,114 0 1,299 1,285 5
75-79 869 858 4 1,140 1,134 6
80-84 612 610 1 880 866 9
85+ 507 505 2 1,130 1,120 10
Total 32,905 30,661 1,793 32,413 30,685 1,320
Champaign
White BlackAge
FemalesMales
Total Population White BlackTotal Population
<1 6,189 4,165 1,404 5,854 3,931 1,312
1-4 23,549 16,146 5,270 22,259 15,261 4,980
5-9 27,359 19,043 6,014 27,009 18,518 6,270
10-14 26,052 18,324 5,723 25,770 17,857 5,806
15-19 53,311 36,870 7,776 50,107 35,092 8,072
20-24 92,396 62,614 10,888 80,270 54,158 11,675
25-29 43,733 30,779 5,263 40,084 28,491 5,480
30-34 35,261 25,942 4,082 34,177 24,841 4,801
35-39 29,015 21,623 3,707 28,593 20,857 4,391
40-44 26,078 20,016 3,386 26,747 19,919 4,107
45-49 24,543 19,505 3,104 25,656 20,115 3,433
50-54 26,732 22,161 2,966 29,050 23,653 3,433
55-59 27,435 23,417 2,795 30,260 25,198 3,549
60-64 24,388 21,027 2,424 26,460 22,360 2,741
65-69 18,228 15,927 1,461 20,035 17,060 2,012
70-74 11,683 10,200 900 14,092 12,364 1,178
75-79 8,537 7,615 578 10,878 9,616 894
80-84 6,509 5,929 398 8,893 8,010 641
85+ 5,758 5,426 231 11,480 10,625 640
Total 516,756 386,729 68,370 517,674 387,926 75,415
Christian
White BlackAge
FemalesMales
Total Population White BlackTotal Population
<1 895 862 23 845 813 22
1-4 3,722 3,582 104 3,539 3,363 75
5-9 5,179 5,044 108 5,004 4,801 122
10-14 5,284 5,130 114 4,862 4,743 79
15-19 5,381 5,166 178 4,723 4,574 88
20-24 5,669 5,359 256 4,621 4,526 53
25-29 5,475 5,097 310 4,613 4,511 42
30-34 5,432 5,138 220 4,622 4,513 32
35-39 5,343 5,095 197 4,485 4,396 35
40-44 5,478 5,188 253 4,886 4,776 31
45-49 6,057 5,703 326 5,391 5,302 39
50-54 6,641 6,414 188 6,148 6,059 20
55-59 6,525 6,347 146 5,984 5,929 17
60-64 5,411 5,291 88 5,599 5,564 16
65-69 4,225 4,194 9 4,810 4,777 5
70-74 3,276 3,252 4 3,901 3,863 4
75-79 2,677 2,650 12 3,155 3,115 21
80-84 1,736 1,722 13 2,618 2,584 23
85+ 1,687 1,684 1 3,326 3,294 9
Total 86,093 82,918 2,550 83,132 81,503 733
A - 5

Total five-year population, 2012-2016, used to calculate rates. SOURCE: U.S. Census Bureau's Population Estimates Program
Clark
White BlackAge
FemalesMales
Total Population White BlackTotal Population
<1 505 490 10 443 435 7
1-4 2,037 1,985 42 1,874 1,852 15
5-9 2,537 2,487 43 2,438 2,379 38
10-14 2,687 2,623 47 2,569 2,516 26
15-19 2,470 2,429 31 2,517 2,463 33
20-24 2,229 2,182 32 2,152 2,100 25
25-29 2,223 2,177 14 2,204 2,168 16
30-34 2,322 2,295 18 2,330 2,290 23
35-39 2,202 2,175 16 2,203 2,146 27
40-44 2,520 2,493 15 2,356 2,313 15
45-49 2,653 2,621 16 2,662 2,633 8
50-54 3,064 3,041 12 3,050 3,009 13
55-59 3,062 3,038 11 2,790 2,749 12
60-64 2,622 2,595 17 2,602 2,580 8
65-69 1,945 1,944 0 2,342 2,326 3
70-74 1,740 1,738 2 1,922 1,912 8
75-79 1,228 1,226 2 1,424 1,405 9
80-84 679 677 2 1,279 1,279 0
85+ 658 652 1 1,571 1,562 5
Total 39,383 38,868 331 40,728 40,117 291
Clay
White BlackAge
FemalesMales
Total Population White BlackTotal Population
<1 419 409 4 389 377 9
1-4 1,669 1,629 37 1,612 1,548 46
5-9 2,200 2,152 37 2,097 2,042 32
10-14 2,245 2,215 26 2,099 2,056 20
15-19 1,965 1,926 23 1,893 1,850 15
20-24 1,976 1,927 23 1,960 1,915 20
25-29 1,848 1,794 34 1,718 1,687 16
30-34 1,913 1,885 12 1,941 1,913 9
35-39 1,885 1,851 13 1,838 1,752 11
40-44 2,006 1,957 23 1,829 1,788 6
45-49 2,117 2,077 15 2,074 2,019 21
50-54 2,642 2,611 17 2,519 2,470 14
55-59 2,549 2,517 20 2,491 2,456 7
60-64 2,283 2,271 5 2,350 2,324 11
65-69 1,950 1,941 3 1,996 1,979 5
70-74 1,290 1,282 1 1,610 1,601 5
75-79 976 963 4 1,267 1,260 3
80-84 709 707 2 1,112 1,105 1
85+ 653 647 1 1,318 1,316 2
Total 33,295 32,761 300 34,113 33,458 253
Clinton
White BlackAge
FemalesMales
Total Population White BlackTotal Population
<1 1,104 1,074 20 1,011 982 22
1-4 4,432 4,296 87 4,029 3,864 119
5-9 5,852 5,681 112 5,317 5,106 146
10-14 5,969 5,776 98 5,736 5,536 131
15-19 5,975 5,631 254 5,394 5,207 134
20-24 6,414 5,594 769 5,366 5,119 115
25-29 7,088 6,026 989 5,335 5,200 71
30-34 7,199 6,233 911 5,627 5,491 64
35-39 6,699 5,689 940 5,228 5,118 58
40-44 6,357 5,650 615 5,341 5,190 78
45-49 7,153 6,520 586 6,287 6,154 75
50-54 7,713 7,282 382 7,227 7,051 86
55-59 7,084 6,863 171 6,682 6,542 65
60-64 5,693 5,540 122 5,683 5,575 57
65-69 4,300 4,207 63 4,528 4,443 44
70-74 3,155 3,099 32 3,652 3,554 31
75-79 2,375 2,350 14 2,806 2,771 13
80-84 1,713 1,708 2 2,538 2,502 12
85+ 1,500 1,482 1 2,935 2,886 27
Total 97,775 90,701 6,168 90,722 88,291 1,348
A - 6

Total five-year population, 2012-2016, used to calculate rates. SOURCE: U.S. Census Bureau's Population Estimates Program
Coles
White BlackAge
FemalesMales
Total Population White BlackTotal Population
<1 1,304 1,172 112 1,257 1,134 111
1-4 5,349 4,880 388 4,817 4,436 316
5-9 6,839 6,352 381 6,542 6,095 342
10-14 7,052 6,676 291 6,264 5,867 314
15-19 10,432 9,367 835 11,833 10,317 1,287
20-24 17,836 15,712 1,652 19,744 17,335 1,938
25-29 10,152 9,258 688 9,752 9,129 480
30-34 7,834 7,376 287 7,396 7,050 234
35-39 6,832 6,521 222 6,769 6,496 161
40-44 6,808 6,506 215 6,594 6,288 148
45-49 6,729 6,476 171 7,016 6,802 113
50-54 7,797 7,506 191 8,473 8,274 117
55-59 8,456 8,216 157 8,876 8,595 174
60-64 7,354 7,173 118 7,964 7,711 126
65-69 5,780 5,647 98 6,313 6,145 70
70-74 4,030 3,967 41 4,908 4,855 25
75-79 3,179 3,126 35 4,027 3,968 34
80-84 2,190 2,161 6 3,202 3,156 34
85+ 1,977 1,928 17 4,345 4,297 24
Total 127,930 120,020 5,905 136,092 127,950 6,048
Cook
White BlackAge
FemalesMales
Total Population White BlackTotal Population
<1 176,518 117,871 44,721 169,723 112,986 43,539
1-4 680,350 449,782 176,849 654,480 430,777 172,329
5-9 830,322 538,846 224,228 805,055 519,254 220,950
10-14 824,168 525,163 236,285 798,961 504,711 233,143
15-19 834,352 521,470 251,783 812,861 504,735 248,770
20-24 901,962 570,154 253,891 913,734 564,747 268,929
25-29 1,083,183 759,637 216,665 1,101,156 742,957 247,067
30-34 1,034,345 736,974 187,786 1,047,699 701,138 234,559
35-39 902,968 636,520 174,957 911,205 593,385 220,698
40-44 852,875 591,686 179,017 875,222 554,265 233,559
45-49 830,006 578,318 184,835 858,136 552,162 233,895
50-54 846,509 585,294 203,045 897,980 579,343 252,273
55-59 808,310 561,375 190,822 884,040 573,097 246,146
60-64 667,119 469,372 147,514 761,186 495,959 205,208
65-69 511,822 360,220 110,633 608,648 401,978 158,792
70-74 346,103 238,734 79,430 450,188 296,291 120,607
75-79 244,248 169,163 56,944 345,484 230,336 92,735
80-84 172,060 126,469 35,495 270,268 191,262 64,614
85+ 162,502 125,976 28,577 342,867 260,650 67,708
Total 12,709,722 8,663,024 2,983,477 13,508,893 8,810,033 3,565,521
Crawford
White BlackAge
FemalesMales
Total Population White BlackTotal Population
<1 497 481 14 547 528 12
1-4 2,024 1,972 37 2,155 2,069 49
5-9 2,571 2,497 64 2,611 2,527 33
10-14 2,724 2,631 62 2,740 2,661 55
15-19 2,904 2,730 128 2,607 2,509 62
20-24 3,459 2,889 516 2,538 2,461 49
25-29 3,793 2,978 748 2,666 2,604 32
30-34 3,588 2,780 786 2,557 2,491 25
35-39 3,476 2,775 658 2,567 2,505 28
40-44 3,423 2,780 605 2,691 2,628 22
45-49 3,596 3,071 488 2,904 2,840 26
50-54 3,859 3,547 276 3,409 3,346 21
55-59 3,722 3,526 171 3,464 3,407 21
60-64 3,157 3,083 57 3,101 3,048 18
65-69 2,465 2,445 13 2,787 2,764 7
70-74 1,758 1,758 0 2,144 2,125 7
75-79 1,379 1,363 7 1,822 1,802 5
80-84 960 949 3 1,440 1,423 5
85+ 819 808 3 1,767 1,766 0
Total 50,174 45,063 4,636 46,517 45,504 477
A - 7

Total five-year population, 2012-2016, used to calculate rates. SOURCE: U.S. Census Bureau's Population Estimates Program
Cumberland
White BlackAge
FemalesMales
Total Population White BlackTotal Population
<1 312 303 6 291 283 7
1-4 1,327 1,306 15 1,257 1,227 28
5-9 1,882 1,849 20 1,690 1,651 36
10-14 1,767 1,739 20 1,737 1,629 39
15-19 1,679 1,597 25 1,685 1,633 26
20-24 1,487 1,451 18 1,400 1,376 11
25-29 1,516 1,500 11 1,439 1,420 8
30-34 1,619 1,584 19 1,623 1,591 11
35-39 1,658 1,633 17 1,522 1,507 5
40-44 1,665 1,644 19 1,584 1,575 4
45-49 1,849 1,809 34 1,689 1,679 2
50-54 2,027 2,003 4 2,073 1,986 10
55-59 2,119 2,103 9 2,166 2,144 8
60-64 1,898 1,876 8 1,793 1,784 3
65-69 1,524 1,506 6 1,533 1,514 5
70-74 1,096 1,093 2 1,153 1,149 3
75-79 796 791 0 953 950 2
80-84 535 532 1 688 683 0
85+ 500 499 1 1,001 994 7
Total 27,256 26,818 235 27,277 26,775 215
DeKalb
White BlackAge
FemalesMales
Total Population White BlackTotal Population
<1 3,047 2,582 382 2,908 2,463 369
1-4 12,961 11,139 1,545 12,183 10,283 1,541
5-9 16,060 13,931 1,728 15,563 13,331 1,726
10-14 16,596 14,960 1,202 15,698 13,907 1,287
15-19 23,203 19,516 2,727 23,365 19,053 3,381
20-24 38,652 31,301 4,288 39,216 29,981 6,286
25-29 19,737 17,003 1,866 18,200 15,124 2,278
30-34 16,841 15,299 1,057 16,247 14,359 1,343
35-39 14,734 13,448 777 14,313 12,951 849
40-44 14,388 13,242 723 14,288 13,193 609
45-49 14,652 13,812 496 14,822 13,840 566
50-54 15,565 14,711 476 16,013 15,151 531
55-59 14,795 14,135 389 14,716 13,997 460
60-64 12,169 11,703 288 12,634 12,063 371
65-69 9,196 8,926 136 9,931 9,571 186
70-74 6,359 6,183 75 7,227 7,011 119
75-79 4,339 4,243 48 5,668 5,522 73
80-84 3,040 2,976 25 4,396 4,304 41
85+ 2,701 2,659 10 5,520 5,440 52
Total 259,035 231,769 18,238 262,908 231,544 22,068
DeWitt
White BlackAge
FemalesMales
Total Population White BlackTotal Population
<1 451 435 15 451 435 13
1-4 1,793 1,735 55 1,839 1,775 52
5-9 2,578 2,489 72 2,209 2,148 46
10-14 2,753 2,685 45 2,646 2,560 54
15-19 2,489 2,422 42 2,351 2,290 29
20-24 2,239 2,143 53 2,121 2,073 29
25-29 2,176 2,068 82 2,048 2,000 21
30-34 2,499 2,414 78 2,467 2,417 35
35-39 2,441 2,376 57 2,344 2,294 37
40-44 2,711 2,625 59 2,494 2,455 17
45-49 2,858 2,813 13 2,748 2,690 22
50-54 3,159 3,115 15 3,084 3,045 19
55-59 3,298 3,259 29 3,206 3,168 12
60-64 2,646 2,633 3 2,762 2,737 6
65-69 2,144 2,125 13 2,294 2,278 2
70-74 1,624 1,609 10 1,972 1,955 2
75-79 1,171 1,164 4 1,485 1,473 0
80-84 742 742 0 1,022 1,021 1
85+ 736 730 1 1,382 1,382 0
Total 40,508 39,582 646 40,925 40,196 397
A - 8

Total five-year population, 2012-2016, used to calculate rates. SOURCE: U.S. Census Bureau's Population Estimates Program
Douglas
White BlackAge
FemalesMales
Total Population White BlackTotal Population
<1 667 641 16 632 615 13
1-4 2,702 2,606 49 2,537 2,458 56
5-9 3,582 3,498 61 3,417 3,305 84
10-14 3,904 3,819 60 3,535 3,444 60
15-19 3,233 3,132 60 3,134 3,081 31
20-24 2,778 2,690 59 2,827 2,726 75
25-29 3,147 3,087 35 3,038 2,988 26
30-34 2,937 2,888 29 3,027 2,958 22
35-39 2,992 2,947 25 2,964 2,889 28
40-44 2,800 2,721 22 2,823 2,769 7
45-49 3,068 2,942 35 2,880 2,809 39
50-54 3,480 3,418 30 3,365 3,323 23
55-59 3,551 3,501 18 3,586 3,547 9
60-64 2,977 2,944 17 2,977 2,947 4
65-69 2,456 2,424 8 2,492 2,470 7
70-74 1,663 1,656 1 1,965 1,962 1
75-79 1,368 1,355 4 1,878 1,875 0
80-84 1,026 1,022 1 1,418 1,407 6
85+ 787 779 1 1,677 1,671 1
Total 49,118 48,070 531 50,172 49,244 492
DuPage
White BlackAge
FemalesMales
Total Population White BlackTotal Population
<1 27,224 21,841 1,872 26,236 20,971 1,844
1-4 114,276 91,169 7,500 109,893 87,267 7,394
5-9 152,932 121,491 10,525 146,451 115,696 10,241
10-14 162,020 129,538 11,804 155,359 124,001 11,194
15-19 164,344 133,231 12,986 156,104 126,408 11,995
20-24 148,640 121,207 10,952 140,875 113,863 10,236
25-29 149,661 121,520 9,013 142,172 111,524 9,742
30-34 151,995 120,944 8,723 150,594 115,826 10,848
35-39 147,650 116,186 8,061 148,547 113,583 10,958
40-44 150,784 121,242 7,623 157,271 123,142 10,722
45-49 162,615 136,159 7,125 171,940 141,187 9,569
50-54 174,651 150,907 6,576 187,610 160,003 8,472
55-59 167,002 145,310 5,714 177,986 152,986 7,363
60-64 137,223 118,797 3,925 146,619 124,717 5,429
65-69 103,878 88,830 2,544 114,178 97,410 3,615
70-74 68,150 57,997 1,546 79,940 69,275 1,965
75-79 43,839 38,087 773 55,850 49,417 1,171
80-84 29,532 26,745 395 44,820 41,043 786
85+ 28,297 26,586 247 60,117 56,580 774
Total 2,284,713 1,887,787 117,904 2,372,562 1,944,899 134,318
Edgar
White BlackAge
FemalesMales
Total Population White BlackTotal Population
<1 476 466 9 428 419 8
1-4 1,967 1,929 35 1,816 1,776 31
5-9 2,582 2,530 38 2,627 2,590 19
10-14 2,727 2,669 26 2,779 2,718 33
15-19 2,643 2,593 28 2,564 2,526 31
20-24 2,366 2,337 19 2,347 2,299 39
25-29 2,373 2,331 27 2,362 2,334 11
30-34 2,480 2,449 10 2,589 2,557 21
35-39 2,454 2,428 7 2,508 2,441 39
40-44 2,838 2,793 21 2,589 2,568 11
45-49 2,674 2,637 27 2,596 2,574 12
50-54 3,334 3,309 11 3,349 3,311 18
55-59 3,486 3,441 36 3,616 3,579 13
60-64 3,175 3,149 19 3,154 3,138 11
65-69 2,566 2,551 10 2,825 2,806 4
70-74 1,996 1,982 13 2,267 2,246 7
75-79 1,318 1,307 9 1,837 1,822 9
80-84 924 916 2 1,489 1,466 3
85+ 791 788 0 1,929 1,923 6
Total 43,170 42,605 347 45,671 45,093 326
A - 9

Total five-year population, 2012-2016, used to calculate rates. SOURCE: U.S. Census Bureau's Population Estimates Program
Edwards
White BlackAge
FemalesMales
Total Population White BlackTotal Population
<1 190 187 3 199 193 5
1-4 756 732 18 836 814 20
5-9 1,060 1,028 24 987 966 15
10-14 1,161 1,139 11 1,112 1,065 35
15-19 989 942 34 925 893 29
20-24 902 888 12 876 855 17
25-29 819 813 2 755 738 10
30-34 921 913 4 867 852 2
35-39 886 870 7 963 940 12
40-44 1,100 1,092 4 988 969 5
45-49 1,137 1,122 7 1,053 1,045 1
50-54 1,171 1,151 11 1,163 1,155 2
55-59 1,292 1,276 12 1,270 1,254 7
60-64 1,119 1,118 1 1,163 1,158 2
65-69 981 974 7 1,003 997 0
70-74 684 679 0 759 755 0
75-79 472 467 0 710 705 0
80-84 299 296 3 514 509 0
85+ 332 331 1 672 672 0
Total 16,271 16,018 161 16,815 16,535 162
Effingham
White BlackAge
FemalesMales
Total Population White BlackTotal Population
<1 1,125 1,101 20 1,086 1,057 20
1-4 4,654 4,543 79 4,398 4,259 94
5-9 5,921 5,768 79 5,468 5,325 74
10-14 5,864 5,741 58 5,440 5,294 63
15-19 5,936 5,758 60 5,016 4,945 40
20-24 5,608 5,464 71 5,204 5,103 62
25-29 5,548 5,420 61 5,207 5,103 52
30-34 5,629 5,526 39 5,137 5,075 17
35-39 4,952 4,859 44 4,659 4,570 24
40-44 4,813 4,712 48 4,577 4,505 14
45-49 5,359 5,285 29 5,377 5,269 23
50-54 6,569 6,488 36 6,553 6,473 12
55-59 6,294 6,252 15 6,325 6,286 16
60-64 5,282 5,224 18 5,298 5,260 13
65-69 3,941 3,896 14 4,359 4,323 5
70-74 2,888 2,870 2 3,595 3,575 4
75-79 2,172 2,166 4 2,857 2,845 6
80-84 1,517 1,506 1 2,217 2,215 1
85+ 1,212 1,212 0 2,896 2,884 2
Total 85,284 83,791 678 85,669 84,366 542
Fayette
White BlackAge
FemalesMales
Total Population White BlackTotal Population
<1 609 601 6 598 583 10
1-4 2,511 2,467 34 2,356 2,298 38
5-9 3,317 3,233 68 3,260 3,180 60
10-14 3,413 3,349 51 3,379 3,302 46
15-19 3,728 3,380 329 3,078 3,023 29
20-24 4,348 3,320 998 2,983 2,934 32
25-29 4,303 3,319 950 2,988 2,955 19
30-34 3,854 3,149 666 2,946 2,910 10
35-39 4,230 3,453 738 2,796 2,756 27
40-44 3,925 3,266 630 3,040 2,998 10
45-49 4,123 3,559 543 3,168 3,127 20
50-54 4,310 3,925 349 3,738 3,691 14
55-59 3,981 3,829 140 3,656 3,644 5
60-64 3,310 3,265 32 3,294 3,263 14
65-69 2,769 2,740 23 2,879 2,860 5
70-74 1,943 1,931 6 2,379 2,357 3
75-79 1,703 1,696 3 1,878 1,853 10
80-84 1,175 1,172 3 1,527 1,523 3
85+ 984 981 3 1,787 1,779 3
Total 58,536 52,635 5,572 51,730 51,036 358
A - 10

Total five-year population, 2012-2016, used to calculate rates. SOURCE: U.S. Census Bureau's Population Estimates Program
Ford
White BlackAge
FemalesMales
Total Population White BlackTotal Population
<1 358 349 5 355 347 6
1-4 1,649 1,596 30 1,422 1,387 23
5-9 2,187 2,086 66 2,056 1,993 41
10-14 2,395 2,299 77 2,439 2,372 41
15-19 2,384 2,318 50 2,045 1,980 39
20-24 1,961 1,880 54 1,654 1,612 35
25-29 1,815 1,741 60 1,676 1,631 32
30-34 1,917 1,841 66 1,855 1,822 18
35-39 1,926 1,861 37 2,008 1,975 12
40-44 2,040 1,994 26 1,945 1,911 13
45-49 2,076 2,048 13 2,198 2,165 12
50-54 2,528 2,498 13 2,555 2,517 25
55-59 2,778 2,741 15 2,777 2,741 12
60-64 2,162 2,123 21 2,104 2,083 3
65-69 1,700 1,685 8 1,726 1,720 2
70-74 1,233 1,227 2 1,505 1,494 8
75-79 1,015 1,012 2 1,270 1,268 2
80-84 738 736 2 1,127 1,124 1
85+ 598 591 7 1,771 1,766 2
Total 33,460 32,626 554 34,488 33,908 327
Franklin
White BlackAge
FemalesMales
Total Population White BlackTotal Population
<1 1,275 1,238 31 1,111 1,070 32
1-4 4,987 4,820 120 4,285 4,122 108
5-9 6,407 6,182 136 5,702 5,527 101
10-14 6,458 6,305 86 6,147 5,964 114
15-19 6,059 5,943 76 5,740 5,581 95
20-24 5,687 5,572 77 5,354 5,234 60
25-29 5,587 5,464 93 5,453 5,364 50
30-34 5,370 5,298 47 5,717 5,577 31
35-39 5,732 5,656 37 5,891 5,748 29
40-44 6,246 6,153 31 6,177 6,083 20
45-49 6,458 6,361 34 6,385 6,275 29
50-54 6,818 6,751 25 7,022 6,956 22
55-59 6,995 6,888 69 7,114 7,045 23
60-64 6,319 6,259 24 6,771 6,705 16
65-69 5,689 5,636 24 6,244 6,186 12
70-74 4,399 4,373 5 5,086 5,024 18
75-79 3,164 3,129 8 3,886 3,854 10
80-84 1,924 1,907 2 2,745 2,719 13
85+ 1,551 1,540 4 3,365 3,342 12
Total 97,125 95,475 929 100,195 98,376 795
Fulton
White BlackAge
FemalesMales
Total Population White BlackTotal Population
<1 854 827 24 827 800 19
1-4 3,684 3,560 90 3,633 3,511 77
5-9 5,009 4,884 87 4,897 4,730 111
10-14 5,605 5,509 66 5,200 5,065 83
15-19 5,606 5,342 221 4,874 4,786 66
20-24 6,273 5,038 1,041 4,399 4,279 81
25-29 6,211 4,957 1,009 4,567 4,460 74
30-34 6,631 5,358 1,085 4,632 4,549 39
35-39 6,420 5,338 941 5,063 4,975 46
40-44 6,645 5,852 703 4,943 4,866 33
45-49 6,573 5,812 689 5,396 5,341 24
50-54 6,728 6,288 369 6,134 6,049 27
55-59 6,381 6,140 206 6,510 6,435 30
60-64 6,010 5,897 85 6,159 6,104 28
65-69 4,975 4,889 51 5,253 5,216 17
70-74 3,706 3,675 12 4,209 4,172 3
75-79 2,709 2,681 18 3,246 3,196 30
80-84 1,996 1,983 8 2,858 2,824 24
85+ 1,761 1,741 18 3,564 3,537 22
Total 93,777 85,771 6,723 86,364 84,895 834
A - 11

Total five-year population, 2012-2016, used to calculate rates. SOURCE: U.S. Census Bureau's Population Estimates Program
Gallatin
White BlackAge
FemalesMales
Total Population White BlackTotal Population
<1 158 157 1 135 134 1
1-4 545 537 7 575 555 16
5-9 794 787 6 784 770 13
10-14 767 749 13 799 781 18
15-19 679 654 11 671 652 17
20-24 720 712 8 705 694 6
25-29 673 665 5 674 665 7
30-34 729 720 9 740 731 3
35-39 751 736 8 784 767 13
40-44 852 832 16 845 838 1
45-49 825 809 16 783 781 2
50-54 962 935 20 968 963 2
55-59 894 882 5 949 945 2
60-64 842 835 5 1,011 1,002 6
65-69 929 919 8 996 982 3
70-74 721 712 1 798 789 5
75-79 497 495 0 654 650 4
80-84 294 288 0 424 415 5
85+ 175 171 1 339 328 9
Total 12,807 12,595 140 13,634 13,442 133
Greene
White BlackAge
FemalesMales
Total Population White BlackTotal Population
<1 360 351 8 322 312 8
1-4 1,533 1,490 34 1,415 1,384 25
5-9 2,006 1,982 22 1,980 1,954 16
10-14 2,099 2,073 20 2,180 2,135 37
15-19 2,272 2,234 24 1,992 1,953 29
20-24 2,004 1,936 54 1,803 1,781 19
25-29 1,876 1,778 84 1,645 1,638 2
30-34 2,138 2,025 105 1,723 1,714 4
35-39 2,094 2,005 79 1,925 1,919 6
40-44 2,100 2,009 84 2,003 1,983 9
45-49 2,336 2,240 88 2,193 2,168 11
50-54 2,607 2,552 51 2,493 2,473 6
55-59 2,620 2,591 18 2,551 2,533 5
60-64 2,237 2,223 8 2,206 2,194 2
65-69 1,708 1,701 3 1,909 1,897 4
70-74 1,343 1,334 0 1,619 1,601 3
75-79 988 982 0 1,256 1,244 1
80-84 761 751 3 1,012 1,007 1
85+ 664 657 1 1,065 1,062 2
Total 33,746 32,914 686 33,292 32,952 190
Grundy
White BlackAge
FemalesMales
Total Population White BlackTotal Population
<1 1,616 1,557 40 1,429 1,375 31
1-4 6,902 6,659 138 6,333 6,061 159
5-9 9,573 9,143 234 8,805 8,419 213
10-14 10,013 9,547 284 9,404 9,032 221
15-19 8,803 8,415 275 8,407 8,149 176
20-24 7,362 7,095 187 7,240 6,990 171
25-29 7,343 7,093 134 7,425 7,144 158
30-34 8,616 8,252 202 8,725 8,419 172
35-39 8,708 8,424 144 8,659 8,344 154
40-44 8,807 8,516 146 8,732 8,426 165
45-49 9,036 8,772 164 8,900 8,607 130
50-54 9,204 9,055 81 9,071 8,828 126
55-59 8,406 8,251 74 8,386 8,227 64
60-64 6,762 6,673 36 6,832 6,711 50
65-69 5,348 5,236 79 5,517 5,400 41
70-74 3,752 3,706 19 4,235 4,199 17
75-79 2,460 2,432 12 2,866 2,830 14
80-84 1,369 1,353 6 2,331 2,299 16
85+ 1,194 1,178 7 2,662 2,644 5
Total 125,274 121,357 2,262 125,959 122,104 2,083
A - 12

Total five-year population, 2012-2016, used to calculate rates. SOURCE: U.S. Census Bureau's Population Estimates Program
Hamilton
White BlackAge
FemalesMales
Total Population White BlackTotal Population
<1 221 210 4 208 207 1
1-4 958 919 17 927 912 10
5-9 1,312 1,271 30 1,307 1,268 22
10-14 1,438 1,418 20 1,330 1,306 18
15-19 1,294 1,266 19 1,139 1,118 12
20-24 1,126 1,106 11 1,049 1,033 8
25-29 949 927 11 1,061 1,047 7
30-34 1,220 1,214 1 1,241 1,221 5
35-39 1,193 1,163 15 1,150 1,135 8
40-44 1,186 1,174 6 1,198 1,185 1
45-49 1,283 1,258 20 1,257 1,231 10
50-54 1,498 1,476 21 1,414 1,379 18
55-59 1,565 1,557 5 1,614 1,594 17
60-64 1,394 1,381 5 1,428 1,415 4
65-69 1,233 1,222 6 1,221 1,211 8
70-74 950 947 2 1,068 1,051 0
75-79 665 662 0 922 911 1
80-84 445 441 1 682 676 1
85+ 394 392 2 950 947 2
Total 20,324 20,004 196 21,166 20,847 153
Hancock
White BlackAge
FemalesMales
Total Population White BlackTotal Population
<1 493 483 8 491 476 10
1-4 2,129 2,061 56 1,823 1,742 62
5-9 2,863 2,791 59 2,680 2,560 79
10-14 2,835 2,762 49 2,816 2,738 41
15-19 2,759 2,706 34 2,553 2,480 32
20-24 2,453 2,408 33 2,264 2,240 21
25-29 2,319 2,236 35 2,182 2,148 13
30-34 2,448 2,389 25 2,418 2,370 16
35-39 2,488 2,462 12 2,411 2,361 8
40-44 2,562 2,534 8 2,424 2,387 11
45-49 2,896 2,868 12 2,839 2,817 11
50-54 3,453 3,405 23 3,496 3,453 14
55-59 3,689 3,640 19 3,685 3,668 7
60-64 3,357 3,347 6 3,393 3,365 6
65-69 2,839 2,824 10 3,106 3,073 10
70-74 2,070 2,050 7 2,588 2,568 4
75-79 1,701 1,691 6 1,946 1,936 4
80-84 1,221 1,213 1 1,503 1,498 0
85+ 997 994 2 1,938 1,936 2
Total 45,572 44,864 405 46,556 45,816 351
Hardin
White BlackAge
FemalesMales
Total Population White BlackTotal Population
<1 78 78 0 79 78 1
1-4 379 374 1 363 349 12
5-9 584 571 9 526 496 13
10-14 670 639 10 565 541 13
15-19 575 537 29 600 579 8
20-24 533 469 46 435 415 7
25-29 522 473 44 388 378 3
30-34 540 490 46 501 495 4
35-39 622 588 26 504 499 2
40-44 694 663 23 568 550 1
45-49 763 728 30 680 673 0
50-54 780 736 33 806 782 7
55-59 754 728 9 818 791 8
60-64 810 798 5 972 961 3
65-69 842 838 4 798 794 1
70-74 710 710 0 592 584 2
75-79 422 420 2 484 466 3
80-84 219 219 0 365 364 1
85+ 249 249 0 247 247 0
Total 10,746 10,308 317 10,291 10,042 89
A - 13

Total five-year population, 2012-2016, used to calculate rates. SOURCE: U.S. Census Bureau's Population Estimates Program
Henderson
White BlackAge
FemalesMales
Total Population White BlackTotal Population
<1 164 160 3 149 145 3
1-4 677 663 8 668 650 12
5-9 892 872 15 886 849 24
10-14 926 906 14 980 940 21
15-19 996 967 21 1,049 1,024 24
20-24 843 820 15 818 816 1
25-29 776 748 23 749 737 1
30-34 865 841 19 853 851 1
35-39 815 804 3 784 779 1
40-44 828 819 6 947 920 6
45-49 1,060 1,047 5 1,178 1,151 8
50-54 1,472 1,450 5 1,426 1,402 6
55-59 1,599 1,570 14 1,573 1,556 4
60-64 1,410 1,408 2 1,283 1,264 7
65-69 1,194 1,182 5 1,204 1,197 3
70-74 1,052 1,049 0 1,033 1,030 3
75-79 737 737 0 810 802 0
80-84 464 464 0 602 599 0
85+ 354 353 1 767 758 1
Total 17,124 16,860 159 17,759 17,470 126
Henry
White BlackAge
FemalesMales
Total Population White BlackTotal Population
<1 1,349 1,280 61 1,360 1,285 64
1-4 5,750 5,454 232 5,555 5,287 231
5-9 8,339 7,922 314 7,507 7,138 272
10-14 8,598 8,239 279 7,806 7,405 272
15-19 9,022 8,246 661 7,334 6,943 261
20-24 7,175 6,777 336 6,431 6,165 179
25-29 6,272 6,055 168 6,122 5,863 167
30-34 7,116 6,885 164 6,973 6,742 157
35-39 7,478 7,221 171 7,255 7,032 137
40-44 7,323 7,101 136 7,515 7,337 95
45-49 7,746 7,585 112 7,989 7,814 106
50-54 9,176 8,976 140 9,339 9,181 85
55-59 9,479 9,306 143 9,467 9,300 103
60-64 8,551 8,400 110 8,481 8,322 101
65-69 7,155 7,093 50 7,455 7,316 98
70-74 5,262 5,213 29 5,730 5,648 43
75-79 3,628 3,593 21 4,524 4,470 23
80-84 2,579 2,552 26 3,607 3,550 36
85+ 2,237 2,198 19 4,485 4,436 41
Total 124,235 120,096 3,172 124,935 121,234 2,471
Iroquois
White BlackAge
FemalesMales
Total Population White BlackTotal Population
<1 743 709 27 724 698 22
1-4 3,100 2,980 82 3,192 3,084 89
5-9 4,321 4,136 115 4,292 4,160 89
10-14 4,855 4,635 147 4,683 4,465 137
15-19 5,099 4,835 222 4,338 4,133 122
20-24 3,935 3,778 103 3,682 3,566 61
25-29 3,627 3,499 89 3,546 3,456 32
30-34 3,682 3,593 58 4,029 3,917 46
35-39 3,929 3,844 52 3,874 3,803 35
40-44 4,077 3,963 74 4,054 3,947 41
45-49 4,377 4,294 47 4,675 4,602 33
50-54 5,423 5,361 42 5,506 5,433 47
55-59 5,555 5,471 44 5,747 5,649 41
60-64 4,770 4,710 36 4,859 4,782 40
65-69 4,102 4,047 28 4,380 4,325 32
70-74 3,076 3,033 24 3,663 3,636 14
75-79 2,447 2,408 25 2,732 2,692 12
80-84 1,604 1,576 17 2,214 2,170 20
85+ 1,520 1,515 2 3,239 3,220 11
Total 70,242 68,387 1,234 73,429 71,738 924
A - 14

Total five-year population, 2012-2016, used to calculate rates. SOURCE: U.S. Census Bureau's Population Estimates Program
Jackson
White BlackAge
FemalesMales
Total Population White BlackTotal Population
<1 1,794 1,366 360 1,719 1,285 373
1-4 6,337 4,747 1,318 6,054 4,642 1,253
5-9 7,147 5,259 1,552 7,123 5,196 1,614
10-14 7,203 5,423 1,452 6,894 5,163 1,437
15-19 12,708 9,071 2,964 11,435 7,990 2,965
20-24 27,568 20,702 4,840 25,167 17,054 6,307
25-29 13,571 10,570 2,199 11,287 8,669 1,895
30-34 9,382 7,674 1,159 8,403 6,613 1,260
35-39 7,665 6,309 940 7,285 5,608 1,096
40-44 7,360 6,180 797 7,101 5,740 986
45-49 7,210 6,165 722 7,202 5,956 999
50-54 7,872 6,845 793 8,537 7,156 1,036
55-59 8,257 7,121 915 8,621 7,356 937
60-64 7,854 6,920 740 8,149 7,109 784
65-69 6,292 5,718 457 6,752 6,022 612
70-74 3,998 3,704 228 4,755 4,306 392
75-79 2,865 2,635 192 3,670 3,388 244
80-84 2,037 1,905 102 3,092 2,741 242
85+ 1,875 1,715 119 4,042 3,722 255
Total 148,995 120,029 21,849 147,288 115,716 24,687
Jasper
White BlackAge
FemalesMales
Total Population White BlackTotal Population
<1 290 290 0 260 257 3
1-4 1,194 1,180 13 1,125 1,111 8
5-9 1,608 1,588 15 1,432 1,421 5
10-14 1,575 1,546 21 1,571 1,549 18
15-19 1,434 1,407 20 1,458 1,422 21
20-24 1,225 1,212 7 1,262 1,237 10
25-29 1,310 1,288 9 1,227 1,217 8
30-34 1,531 1,520 6 1,317 1,301 6
35-39 1,450 1,445 1 1,248 1,236 2
40-44 1,306 1,289 6 1,337 1,321 0
45-49 1,506 1,493 3 1,665 1,651 2
50-54 2,186 2,166 8 1,811 1,807 1
55-59 1,847 1,840 2 1,848 1,840 2
60-64 1,594 1,578 12 1,648 1,631 2
65-69 1,354 1,348 5 1,328 1,319 4
70-74 912 905 3 1,008 1,005 0
75-79 736 730 2 843 834 1
80-84 621 619 0 694 679 3
85+ 456 451 0 904 890 3
Total 24,135 23,895 133 23,986 23,728 99
Jefferson
White BlackAge
FemalesMales
Total Population White BlackTotal Population
<1 1,260 1,039 207 1,176 986 173
1-4 4,860 4,101 700 4,819 3,928 758
5-9 5,881 5,038 777 5,796 4,905 767
10-14 6,015 5,085 779 5,459 4,786 617
15-19 5,869 4,902 870 5,044 4,310 656
20-24 6,594 5,228 1,285 5,419 4,627 661
25-29 6,726 5,440 1,180 5,292 4,667 514
30-34 6,783 5,455 1,188 5,625 4,962 550
35-39 6,594 5,475 953 5,124 4,621 405
40-44 6,552 5,572 850 5,488 4,946 391
45-49 6,897 6,105 706 5,837 5,434 339
50-54 6,875 6,218 592 6,393 6,030 317
55-59 6,695 6,241 400 6,801 6,367 335
60-64 6,301 5,903 322 6,483 6,058 357
65-69 5,307 5,014 237 5,384 5,097 225
70-74 3,803 3,640 137 4,204 4,062 110
75-79 2,655 2,558 66 3,237 3,092 123
80-84 1,699 1,652 38 2,464 2,366 70
85+ 1,581 1,523 35 3,271 3,188 72
Total 98,947 86,189 11,322 93,316 84,432 7,440
A - 15

Total five-year population, 2012-2016, used to calculate rates. SOURCE: U.S. Census Bureau's Population Estimates Program
Jersey
White BlackAge
FemalesMales
Total Population White BlackTotal Population
<1 522 510 10 520 496 5
1-4 2,372 2,318 39 2,316 2,173 39
5-9 3,304 3,213 37 3,292 3,182 59
10-14 3,694 3,589 40 3,472 3,374 55
15-19 3,833 3,719 72 3,985 3,844 85
20-24 3,708 3,579 84 3,812 3,711 65
25-29 3,003 2,930 51 3,014 2,961 33
30-34 3,167 3,098 45 3,068 3,026 19
35-39 2,993 2,931 21 3,122 3,077 24
40-44 3,261 3,217 22 3,305 3,265 9
45-49 3,732 3,675 22 3,859 3,791 16
50-54 4,424 4,368 24 4,712 4,582 31
55-59 4,238 4,169 39 4,367 4,238 32
60-64 3,618 3,569 26 3,687 3,643 22
65-69 2,800 2,765 16 3,033 3,008 3
70-74 2,211 2,196 7 2,451 2,442 1
75-79 1,668 1,651 3 1,978 1,975 0
80-84 1,051 1,043 0 1,511 1,506 2
85+ 925 924 1 1,778 1,759 3
Total 54,524 53,464 559 57,282 56,053 503
Jo Daviess
White BlackAge
FemalesMales
Total Population White BlackTotal Population
<1 484 467 13 462 449 10
1-4 2,129 2,056 54 2,015 1,922 52
5-9 3,238 3,131 70 2,917 2,830 59
10-14 3,457 3,346 86 3,064 2,978 60
15-19 3,354 3,281 58 2,930 2,823 45
20-24 2,721 2,665 36 2,424 2,366 39
25-29 2,611 2,554 27 2,267 2,209 24
30-34 2,678 2,619 28 2,646 2,584 24
35-39 2,739 2,700 23 2,620 2,568 27
40-44 3,081 3,031 23 2,976 2,938 21
45-49 3,339 3,283 28 3,342 3,282 25
50-54 4,144 4,091 19 4,108 4,059 18
55-59 4,234 4,182 31 4,645 4,598 22
60-64 4,544 4,493 22 4,709 4,674 15
65-69 4,560 4,522 11 4,473 4,439 7
70-74 3,264 3,236 8 3,441 3,422 4
75-79 2,448 2,418 5 2,480 2,477 0
80-84 1,442 1,422 1 1,761 1,754 1
85+ 1,254 1,250 0 2,169 2,158 3
Total 55,721 54,747 543 55,449 54,530 456
Johnson
White BlackAge
FemalesMales
Total Population White BlackTotal Population
<1 283 277 6 245 239 6
1-4 1,209 1,177 28 1,108 1,089 16
5-9 1,574 1,529 38 1,632 1,602 22
10-14 1,888 1,849 18 1,685 1,641 24
15-19 2,148 1,760 368 1,483 1,455 9
20-24 3,007 1,933 1,033 1,422 1,394 24
25-29 2,910 1,856 1,012 1,382 1,358 18
30-34 2,672 1,766 866 1,410 1,396 7
35-39 2,445 1,798 637 1,429 1,407 12
40-44 2,594 1,921 663 1,582 1,568 4
45-49 2,642 2,000 635 1,910 1,872 27
50-54 2,667 2,254 404 2,046 2,006 20
55-59 2,362 2,146 211 2,225 2,202 10
60-64 2,126 2,069 39 2,077 2,058 11
65-69 2,062 2,034 16 2,047 2,027 8
70-74 1,640 1,621 19 1,639 1,625 6
75-79 1,160 1,146 12 1,095 1,085 5
80-84 576 573 3 850 842 5
85+ 447 432 15 776 771 5
Total 36,412 30,141 6,023 28,043 27,637 239
A - 16

Total five-year population, 2012-2016, used to calculate rates. SOURCE: U.S. Census Bureau's Population Estimates Program
Kane
White BlackAge
FemalesMales
Total Population White BlackTotal Population
<1 17,315 15,182 1,391 16,439 14,389 1,348
1-4 72,927 63,350 5,975 71,101 61,598 5,807
5-9 102,497 87,904 8,296 98,947 84,381 8,036
10-14 107,383 92,940 8,223 102,204 87,952 7,966
15-19 100,563 86,224 8,660 94,743 81,442 7,622
20-24 84,679 72,407 7,608 80,140 68,877 6,955
25-29 78,349 67,909 6,137 75,469 64,437 6,303
30-34 86,505 76,329 5,265 84,944 73,463 5,932
35-39 89,802 78,774 5,033 89,292 76,956 5,875
40-44 93,949 82,022 5,268 94,627 82,110 5,623
45-49 95,031 84,920 4,841 94,319 83,492 5,283
50-54 94,511 85,742 4,562 94,595 85,206 4,941
55-59 83,083 75,631 4,111 84,216 75,952 4,303
60-64 67,742 61,529 3,265 71,749 64,615 3,829
65-69 51,749 47,382 2,189 57,176 52,172 2,586
70-74 34,221 31,358 1,355 40,428 36,998 1,767
75-79 22,671 20,838 843 27,592 25,490 1,156
80-84 14,346 13,465 420 20,806 19,636 640
85+ 12,508 11,916 299 24,727 23,683 582
Total 1,309,831 1,155,822 83,741 1,323,514 1,162,849 86,554
Kankakee
White BlackAge
FemalesMales
Total Population White BlackTotal Population
<1 3,426 2,615 771 3,213 2,397 776
1-4 13,796 10,610 3,036 13,539 10,305 3,048
5-9 19,203 14,756 4,141 18,200 13,953 3,937
10-14 20,319 15,566 4,344 19,009 14,707 3,886
15-19 20,537 15,861 4,266 20,216 16,068 3,708
20-24 20,672 16,504 3,743 20,477 16,191 3,940
25-29 16,892 13,464 3,110 16,693 12,969 3,425
30-34 16,742 13,669 2,820 17,218 13,938 2,934
35-39 16,394 13,665 2,479 16,901 13,711 2,806
40-44 17,063 14,306 2,406 17,117 13,923 2,791
45-49 17,395 14,795 2,331 18,148 15,231 2,621
50-54 19,425 16,601 2,562 19,920 16,686 2,954
55-59 18,773 16,011 2,504 19,213 16,290 2,707
60-64 16,424 14,227 1,904 17,021 14,494 2,255
65-69 12,605 11,124 1,330 14,107 12,370 1,573
70-74 9,032 8,134 824 10,212 9,087 996
75-79 6,228 5,536 603 7,995 7,079 849
80-84 4,612 4,156 421 6,235 5,532 653
85+ 4,451 4,122 303 7,929 7,313 555
Total 273,989 225,722 43,898 283,363 232,244 46,414
Kendall
White BlackAge
FemalesMales
Total Population White BlackTotal Population
<1 4,208 3,785 275 4,017 3,591 277
1-4 19,223 16,982 1,518 18,278 16,334 1,233
5-9 27,278 23,826 2,149 25,906 22,758 1,914
10-14 27,306 23,798 2,301 25,600 22,096 2,210
15-19 22,757 19,686 2,218 21,590 18,599 2,072
20-24 16,162 14,095 1,529 16,036 13,872 1,626
25-29 17,049 15,161 1,311 17,602 15,708 1,150
30-34 22,655 20,201 1,486 24,913 21,999 1,615
35-39 24,409 21,600 1,649 25,961 22,423 2,022
40-44 25,815 22,443 1,977 26,212 22,749 2,085
45-49 22,598 20,153 1,536 22,149 19,686 1,635
50-54 19,510 17,660 1,279 19,051 17,069 1,297
55-59 15,178 13,936 809 16,102 14,598 905
60-64 11,929 11,016 568 13,244 12,059 690
65-69 9,565 8,955 316 10,844 10,067 405
70-74 6,588 6,182 191 7,404 7,003 201
75-79 3,737 3,573 65 4,677 4,416 151
80-84 2,271 2,170 48 3,309 3,099 115
85+ 1,841 1,777 36 3,719 3,603 47
Total 300,079 266,999 21,261 306,614 271,729 21,650
A - 17

Total five-year population, 2012-2016, used to calculate rates. SOURCE: U.S. Census Bureau's Population Estimates Program
Knox
White BlackAge
FemalesMales
Total Population White BlackTotal Population
<1 1,418 1,157 234 1,327 1,081 220
1-4 5,496 4,554 855 5,185 4,208 882
5-9 7,077 6,031 948 6,979 5,882 1,000
10-14 7,707 6,697 942 7,201 6,253 836
15-19 8,414 7,229 986 8,071 7,002 846
20-24 9,600 7,465 1,823 8,822 7,699 865
25-29 8,790 6,690 1,926 6,760 6,005 683
30-34 8,284 6,416 1,726 6,628 5,964 573
35-39 8,278 6,709 1,437 6,779 6,239 430
40-44 7,698 6,400 1,204 6,897 6,341 374
45-49 8,087 7,144 869 7,596 7,170 333
50-54 8,975 8,216 648 9,010 8,628 297
55-59 9,089 8,504 500 9,438 9,015 322
60-64 9,029 8,556 410 9,364 9,010 255
65-69 7,338 7,054 231 7,961 7,701 197
70-74 5,446 5,269 146 6,223 6,021 174
75-79 3,894 3,736 147 4,857 4,692 147
80-84 2,822 2,766 53 4,321 4,127 145
85+ 2,616 2,560 48 5,025 4,852 148
Total 130,058 113,153 15,133 128,444 117,890 8,727
Lake
White BlackAge
FemalesMales
Total Population White BlackTotal Population
<1 20,102 16,315 2,146 19,140 15,500 2,044
1-4 88,814 71,282 9,016 84,393 68,514 8,388
5-9 126,023 100,628 12,295 120,312 96,236 11,641
10-14 138,181 113,378 12,241 131,024 106,693 11,465
15-19 148,559 122,882 14,343 130,953 107,625 12,484
20-24 133,493 109,019 14,356 109,238 88,064 12,597
25-29 98,963 79,970 9,543 90,260 71,037 10,571
30-34 99,959 81,014 8,210 100,321 78,769 9,528
35-39 105,863 85,592 7,312 110,265 86,385 9,041
40-44 117,945 96,450 7,829 122,155 98,339 8,809
45-49 128,387 108,872 7,910 133,584 111,868 8,849
50-54 136,379 118,300 8,716 141,855 121,959 9,310
55-59 124,279 109,245 7,556 128,075 111,379 8,254
60-64 97,545 86,291 5,412 101,534 88,558 6,015
65-69 73,170 64,993 3,519 78,079 68,706 3,988
70-74 47,888 42,549 2,024 54,346 47,979 2,668
75-79 30,945 27,616 1,421 38,766 34,356 2,059
80-84 21,317 19,440 808 30,370 27,423 1,436
85+ 20,508 19,295 566 38,031 35,169 1,499
Total 1,758,320 1,473,131 135,223 1,762,701 1,464,559 140,646
LaSalle
White BlackAge
FemalesMales
Total Population White BlackTotal Population
<1 3,047 2,857 138 2,910 2,730 126
1-4 12,455 11,746 505 11,808 11,186 437
5-9 16,972 16,093 597 16,519 15,355 607
10-14 18,508 17,675 610 18,205 17,281 623
15-19 18,309 17,076 1,029 16,993 16,168 549
20-24 18,396 16,317 1,858 15,703 15,006 455
25-29 18,064 16,159 1,635 15,060 14,387 353
30-34 18,002 16,508 1,234 15,986 15,421 308
35-39 16,770 15,475 1,073 15,044 14,504 239
40-44 17,172 15,961 1,016 16,049 15,567 195
45-49 18,963 17,754 974 18,154 17,569 214
50-54 21,952 21,193 525 21,410 20,889 237
55-59 21,662 21,123 361 21,160 20,767 174
60-64 18,569 18,199 185 18,034 17,721 118
65-69 13,899 13,722 82 14,729 14,474 98
70-74 10,197 10,079 49 11,893 11,735 32
75-79 7,543 7,495 19 9,381 9,292 44
80-84 5,426 5,393 21 7,716 7,656 23
85+ 5,284 5,246 33 10,653 10,616 13
Total 281,190 266,071 11,944 277,407 268,324 4,845
A - 18
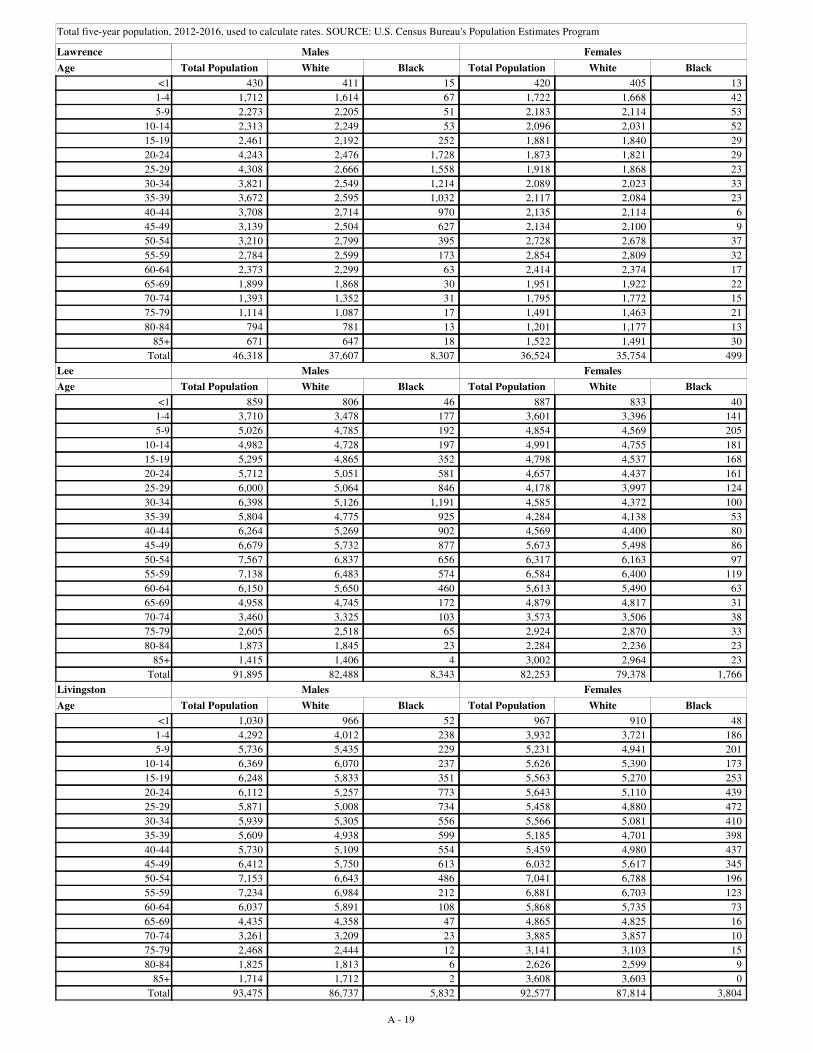
Total five-year population, 2012-2016, used to calculate rates. SOURCE: U.S. Census Bureau's Population Estimates Program
Lawrence
White BlackAge
FemalesMales
Total Population White BlackTotal Population
<1 430 411 15 420 405 13
1-4 1,712 1,614 67 1,722 1,668 42
5-9 2,273 2,205 51 2,183 2,114 53
10-14 2,313 2,249 53 2,096 2,031 52
15-19 2,461 2,192 252 1,881 1,840 29
20-24 4,243 2,476 1,728 1,873 1,821 29
25-29 4,308 2,666 1,558 1,918 1,868 23
30-34 3,821 2,549 1,214 2,089 2,023 33
35-39 3,672 2,595 1,032 2,117 2,084 23
40-44 3,708 2,714 970 2,135 2,114 6
45-49 3,139 2,504 627 2,134 2,100 9
50-54 3,210 2,799 395 2,728 2,678 37
55-59 2,784 2,599 173 2,854 2,809 32
60-64 2,373 2,299 63 2,414 2,374 17
65-69 1,899 1,868 30 1,951 1,922 22
70-74 1,393 1,352 31 1,795 1,772 15
75-79 1,114 1,087 17 1,491 1,463 21
80-84 794 781 13 1,201 1,177 13
85+ 671 647 18 1,522 1,491 30
Total 46,318 37,607 8,307 36,524 35,754 499
Lee
White BlackAge
FemalesMales
Total Population White BlackTotal Population
<1 859 806 46 887 833 40
1-4 3,710 3,478 177 3,601 3,396 141
5-9 5,026 4,785 192 4,854 4,569 205
10-14 4,982 4,728 197 4,991 4,755 181
15-19 5,295 4,865 352 4,798 4,537 168
20-24 5,712 5,051 581 4,657 4,437 161
25-29 6,000 5,064 846 4,178 3,997 124
30-34 6,398 5,126 1,191 4,585 4,372 100
35-39 5,804 4,775 925 4,284 4,138 53
40-44 6,264 5,269 902 4,569 4,400 80
45-49 6,679 5,732 877 5,673 5,498 86
50-54 7,567 6,837 656 6,317 6,163 97
55-59 7,138 6,483 574 6,584 6,400 119
60-64 6,150 5,650 460 5,613 5,490 63
65-69 4,958 4,745 172 4,879 4,817 31
70-74 3,460 3,325 103 3,573 3,506 38
75-79 2,605 2,518 65 2,924 2,870 33
80-84 1,873 1,845 23 2,284 2,236 23
85+ 1,415 1,406 4 3,002 2,964 23
Total 91,895 82,488 8,343 82,253 79,378 1,766
Livingston
White BlackAge
FemalesMales
Total Population White BlackTotal Population
<1 1,030 966 52 967 910 48
1-4 4,292 4,012 238 3,932 3,721 186
5-9 5,736 5,435 229 5,231 4,941 201
10-14 6,369 6,070 237 5,626 5,390 173
15-19 6,248 5,833 351 5,563 5,270 253
20-24 6,112 5,257 773 5,643 5,110 439
25-29 5,871 5,008 734 5,458 4,880 472
30-34 5,939 5,305 556 5,566 5,081 410
35-39 5,609 4,938 599 5,185 4,701 398
40-44 5,730 5,109 554 5,459 4,980 437
45-49 6,412 5,750 613 6,032 5,617 345
50-54 7,153 6,643 486 7,041 6,788 196
55-59 7,234 6,984 212 6,881 6,703 123
60-64 6,037 5,891 108 5,868 5,735 73
65-69 4,435 4,358 47 4,865 4,825 16
70-74 3,261 3,209 23 3,885 3,857 10
75-79 2,468 2,444 12 3,141 3,103 15
80-84 1,825 1,813 6 2,626 2,599 9
85+ 1,714 1,712 2 3,608 3,603 0
Total 93,475 86,737 5,832 92,577 87,814 3,804
A - 19
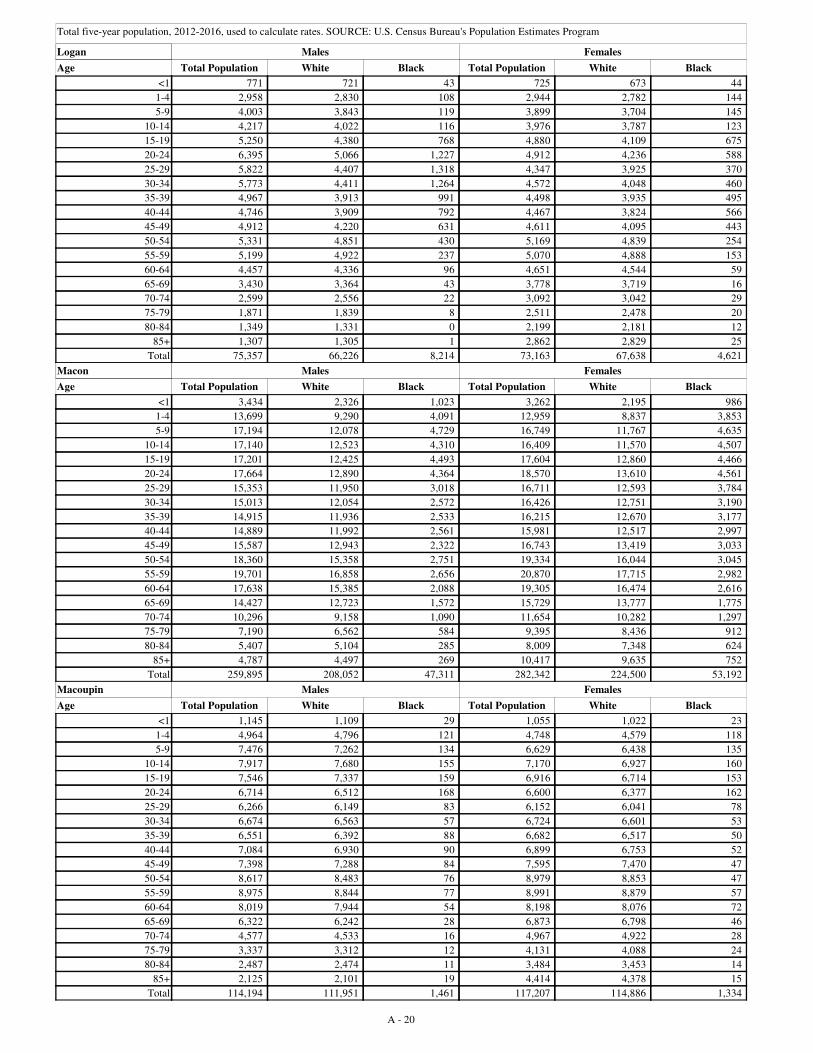
Total five-year population, 2012-2016, used to calculate rates. SOURCE: U.S. Census Bureau's Population Estimates Program
Logan
White BlackAge
FemalesMales
Total Population White BlackTotal Population
<1 771 721 43 725 673 44
1-4 2,958 2,830 108 2,944 2,782 144
5-9 4,003 3,843 119 3,899 3,704 145
10-14 4,217 4,022 116 3,976 3,787 123
15-19 5,250 4,380 768 4,880 4,109 675
20-24 6,395 5,066 1,227 4,912 4,236 588
25-29 5,822 4,407 1,318 4,347 3,925 370
30-34 5,773 4,411 1,264 4,572 4,048 460
35-39 4,967 3,913 991 4,498 3,935 495
40-44 4,746 3,909 792 4,467 3,824 566
45-49 4,912 4,220 631 4,611 4,095 443
50-54 5,331 4,851 430 5,169 4,839 254
55-59 5,199 4,922 237 5,070 4,888 153
60-64 4,457 4,336 96 4,651 4,544 59
65-69 3,430 3,364 43 3,778 3,719 16
70-74 2,599 2,556 22 3,092 3,042 29
75-79 1,871 1,839 8 2,511 2,478 20
80-84 1,349 1,331 0 2,199 2,181 12
85+ 1,307 1,305 1 2,862 2,829 25
Total 75,357 66,226 8,214 73,163 67,638 4,621
Macon
White BlackAge
FemalesMales
Total Population White BlackTotal Population
<1 3,434 2,326 1,023 3,262 2,195 986
1-4 13,699 9,290 4,091 12,959 8,837 3,853
5-9 17,194 12,078 4,729 16,749 11,767 4,635
10-14 17,140 12,523 4,310 16,409 11,570 4,507
15-19 17,201 12,425 4,493 17,604 12,860 4,466
20-24 17,664 12,890 4,364 18,570 13,610 4,561
25-29 15,353 11,950 3,018 16,711 12,593 3,784
30-34 15,013 12,054 2,572 16,426 12,751 3,190
35-39 14,915 11,936 2,533 16,215 12,670 3,177
40-44 14,889 11,992 2,561 15,981 12,517 2,997
45-49 15,587 12,943 2,322 16,743 13,419 3,033
50-54 18,360 15,358 2,751 19,334 16,044 3,045
55-59 19,701 16,858 2,656 20,870 17,715 2,982
60-64 17,638 15,385 2,088 19,305 16,474 2,616
65-69 14,427 12,723 1,572 15,729 13,777 1,775
70-74 10,296 9,158 1,090 11,654 10,282 1,297
75-79 7,190 6,562 584 9,395 8,436 912
80-84 5,407 5,104 285 8,009 7,348 624
85+ 4,787 4,497 269 10,417 9,635 752
Total 259,895 208,052 47,311 282,342 224,500 53,192
Macoupin
White BlackAge
FemalesMales
Total Population White BlackTotal Population
<1 1,145 1,109 29 1,055 1,022 23
1-4 4,964 4,796 121 4,748 4,579 118
5-9 7,476 7,262 134 6,629 6,438 135
10-14 7,917 7,680 155 7,170 6,927 160
15-19 7,546 7,337 159 6,916 6,714 153
20-24 6,714 6,512 168 6,600 6,377 162
25-29 6,266 6,149 83 6,152 6,041 78
30-34 6,674 6,563 57 6,724 6,601 53
35-39 6,551 6,392 88 6,682 6,517 50
40-44 7,084 6,930 90 6,899 6,753 52
45-49 7,398 7,288 84 7,595 7,470 47
50-54 8,617 8,483 76 8,979 8,853 47
55-59 8,975 8,844 77 8,991 8,879 57
60-64 8,019 7,944 54 8,198 8,076 72
65-69 6,322 6,242 28 6,873 6,798 46
70-74 4,577 4,533 16 4,967 4,922 28
75-79 3,337 3,312 12 4,131 4,088 24
80-84 2,487 2,474 11 3,484 3,453 14
85+ 2,125 2,101 19 4,414 4,378 15
Total 114,194 111,951 1,461 117,207 114,886 1,334
A - 20

Total five-year population, 2012-2016, used to calculate rates. SOURCE: U.S. Census Bureau's Population Estimates Program
Madison
White BlackAge
FemalesMales
Total Population White BlackTotal Population
<1 7,885 6,566 1,138 7,556 6,311 1,112
1-4 32,769 27,409 4,530 31,038 26,187 4,180
5-9 42,315 35,660 5,840 40,109 33,897 5,264
10-14 43,719 37,563 5,363 40,152 34,573 4,809
15-19 42,054 36,035 5,328 39,378 33,301 5,230
20-24 43,303 37,361 5,151 44,416 37,379 6,221
25-29 46,796 41,737 4,292 46,203 40,108 5,359
30-34 42,470 38,434 3,413 43,260 37,939 4,471
35-39 38,616 34,931 3,000 40,526 35,726 3,919
40-44 40,579 36,732 3,094 42,395 37,552 3,984
45-49 43,326 39,670 2,970 44,164 39,873 3,580
50-54 49,314 45,840 2,788 50,304 45,965 3,660
55-59 48,952 45,658 2,781 50,071 46,021 3,357
60-64 39,467 36,905 2,209 43,065 39,748 2,701
65-69 30,863 29,077 1,494 35,098 32,679 2,016
70-74 22,056 20,820 968 26,660 25,115 1,271
75-79 15,879 15,076 665 20,480 19,483 844
80-84 11,067 10,649 370 17,009 16,232 654
85+ 9,510 9,201 278 20,539 19,715 748
Total 650,940 585,324 55,672 682,423 607,804 63,380
Marion
White BlackAge
FemalesMales
Total Population White BlackTotal Population
<1 1,203 1,085 113 1,245 1,125 113
1-4 5,034 4,533 463 4,873 4,425 417
5-9 6,429 5,827 531 6,083 5,535 497
10-14 5,960 5,457 463 5,950 5,408 459
15-19 5,819 5,266 472 5,719 5,230 424
20-24 5,929 5,446 409 5,696 5,273 343
25-29 5,675 5,354 267 5,587 5,132 288
30-34 5,477 5,143 251 5,442 5,171 228
35-39 5,392 5,104 231 5,288 5,007 213
40-44 5,561 5,243 248 5,586 5,338 182
45-49 5,870 5,537 257 5,965 5,693 200
50-54 6,853 6,552 241 7,279 6,906 288
55-59 6,930 6,631 219 7,376 7,039 249
60-64 6,205 5,940 197 6,544 6,277 193
65-69 5,096 4,885 161 5,768 5,569 136
70-74 3,972 3,821 112 4,417 4,252 123
75-79 2,865 2,779 67 3,500 3,394 88
80-84 1,952 1,908 29 2,579 2,485 78
85+ 1,822 1,780 37 3,688 3,577 106
Total 94,044 88,291 4,768 98,585 92,836 4,625
Marshall
White BlackAge
FemalesMales
Total Population White BlackTotal Population
<1 309 305 3 311 305 5
1-4 1,251 1,215 20 1,258 1,215 42
5-9 1,783 1,735 32 1,629 1,572 36
10-14 1,843 1,790 37 1,713 1,666 26
15-19 1,851 1,814 26 1,637 1,584 22
20-24 1,734 1,693 27 1,638 1,609 20
25-29 1,445 1,406 24 1,439 1,404 28
30-34 1,593 1,559 15 1,579 1,542 9
35-39 1,654 1,589 18 1,551 1,511 22
40-44 1,778 1,739 20 1,604 1,561 15
45-49 1,869 1,840 17 1,916 1,890 4
50-54 2,283 2,267 5 2,326 2,308 7
55-59 2,341 2,321 8 2,364 2,342 1
60-64 2,315 2,294 12 2,252 2,240 6
65-69 1,823 1,806 7 1,959 1,946 4
70-74 1,510 1,501 1 1,586 1,577 2
75-79 990 988 1 1,285 1,280 1
80-84 794 791 1 1,094 1,084 0
85+ 662 659 0 1,183 1,174 0
Total 29,828 29,312 274 30,324 29,810 250
A - 21

Total five-year population, 2012-2016, used to calculate rates. SOURCE: U.S. Census Bureau's Population Estimates Program
Mason
White BlackAge
FemalesMales
Total Population White BlackTotal Population
<1 337 329 8 325 319 6
1-4 1,515 1,471 34 1,357 1,312 33
5-9 1,920 1,860 37 2,014 1,986 16
10-14 2,154 2,097 35 2,299 2,225 40
15-19 2,258 2,206 32 2,102 2,054 28
20-24 1,995 1,953 32 1,706 1,671 24
25-29 1,685 1,638 40 1,602 1,568 11
30-34 1,806 1,740 41 1,950 1,924 10
35-39 1,962 1,881 47 1,914 1,872 11
40-44 2,107 2,067 25 2,105 2,057 23
45-49 2,411 2,383 19 2,289 2,251 14
50-54 2,653 2,623 21 2,731 2,697 13
55-59 2,605 2,589 6 2,631 2,601 4
60-64 2,561 2,541 10 2,441 2,415 7
65-69 2,208 2,199 2 2,309 2,293 0
70-74 1,672 1,670 0 1,785 1,771 2
75-79 1,180 1,177 3 1,348 1,344 4
80-84 783 781 2 1,166 1,161 0
85+ 738 737 1 1,500 1,493 2
Total 34,550 33,942 395 35,574 35,014 248
Massac
White BlackAge
FemalesMales
Total Population White BlackTotal Population
<1 421 374 44 369 335 33
1-4 1,709 1,537 159 1,667 1,475 180
5-9 2,251 1,984 250 2,421 2,169 235
10-14 2,347 2,117 187 2,457 2,231 190
15-19 2,157 1,963 176 2,075 1,841 223
20-24 1,987 1,839 137 1,940 1,776 140
25-29 1,700 1,583 97 1,946 1,803 127
30-34 1,954 1,804 129 2,246 2,093 122
35-39 2,003 1,857 124 2,256 2,090 146
40-44 2,332 2,138 163 2,329 2,168 124
45-49 2,415 2,253 140 2,366 2,172 162
50-54 2,682 2,476 186 2,816 2,542 234
55-59 2,641 2,419 201 3,007 2,765 195
60-64 2,324 2,152 162 2,363 2,203 132
65-69 1,992 1,874 97 2,159 2,041 99
70-74 1,599 1,491 79 1,870 1,782 77
75-79 1,196 1,144 46 1,363 1,300 60
80-84 758 714 38 1,190 1,105 75
85+ 794 761 29 1,585 1,504 75
Total 35,262 32,480 2,444 38,425 35,395 2,629
McDonough
White BlackAge
FemalesMales
Total Population White BlackTotal Population
<1 709 637 58 712 623 71
1-4 3,120 2,715 247 2,789 2,417 267
5-9 3,818 3,365 318 3,604 3,205 292
10-14 3,757 3,477 208 3,708 3,350 232
15-19 6,875 6,097 535 8,134 6,828 1,079
20-24 15,242 13,132 1,630 12,997 11,071 1,427
25-29 6,561 5,975 452 5,063 4,500 475
30-34 4,263 3,947 222 4,156 3,801 237
35-39 3,620 3,311 183 3,579 3,235 154
40-44 3,654 3,397 140 3,601 3,327 140
45-49 3,643 3,389 139 3,794 3,591 95
50-54 4,338 4,107 103 4,577 4,373 117
55-59 4,588 4,423 114 4,868 4,672 118
60-64 4,392 4,239 88 4,652 4,478 90
65-69 3,790 3,709 42 3,814 3,712 36
70-74 2,619 2,546 51 2,845 2,759 47
75-79 1,732 1,679 18 2,335 2,280 27
80-84 1,233 1,211 4 2,117 2,099 8
85+ 1,301 1,287 5 3,102 3,083 15
Total 79,255 72,643 4,557 80,447 73,404 4,927
A - 22

Total five-year population, 2012-2016, used to calculate rates. SOURCE: U.S. Census Bureau's Population Estimates Program
McHenry
White BlackAge
FemalesMales
Total Population White BlackTotal Population
<1 8,313 7,859 201 7,899 7,400 230
1-4 36,568 34,369 949 34,179 31,975 910
5-9 53,575 49,574 1,538 51,284 47,541 1,241
10-14 60,661 56,530 1,410 57,812 53,982 1,286
15-19 58,962 55,525 1,336 55,151 51,626 1,284
20-24 47,356 44,842 1,047 44,266 41,786 940
25-29 41,022 38,752 960 37,881 35,779 700
30-34 44,450 41,986 901 44,072 41,605 643
35-39 47,130 44,273 868 47,817 44,513 801
40-44 54,527 50,844 1,068 55,987 52,237 827
45-49 61,656 58,500 980 63,840 60,555 892
50-54 65,276 62,649 960 65,674 63,017 740
55-59 57,198 55,147 687 57,527 55,223 582
60-64 44,162 42,718 395 44,888 43,080 379
65-69 33,131 32,072 199 36,001 34,551 277
70-74 22,816 22,054 107 25,718 24,950 118
75-79 14,042 13,599 60 16,809 16,295 84
80-84 8,868 8,643 37 11,944 11,613 67
85+ 6,884 6,730 20 13,918 13,687 34
Total 766,597 726,666 13,723 772,667 731,415 12,035
McLean
White BlackAge
FemalesMales
Total Population White BlackTotal Population
<1 5,251 4,034 715 5,266 4,004 698
1-4 21,281 16,604 2,704 21,080 16,315 2,712
5-9 27,161 21,766 3,307 26,449 20,951 3,317
10-14 27,302 22,373 3,486 26,166 21,378 3,196
15-19 34,653 29,056 4,133 39,141 33,402 4,382
20-24 54,399 46,647 5,309 57,080 48,863 5,505
25-29 28,427 22,508 2,599 28,817 23,327 2,427
30-34 29,109 22,567 2,423 28,804 22,945 2,574
35-39 27,093 21,745 2,030 26,857 22,000 2,251
40-44 25,861 21,553 2,031 24,976 21,367 2,060
45-49 24,953 21,778 2,031 26,196 22,804 2,231
50-54 27,006 24,253 1,954 28,273 25,390 2,046
55-59 24,832 22,748 1,524 26,934 24,608 1,664
60-64 20,776 19,208 1,105 23,111 21,631 980
65-69 16,094 15,131 580 16,948 15,977 660
70-74 10,360 9,886 254 12,053 11,425 409
75-79 7,289 7,026 171 9,167 8,725 288
80-84 4,857 4,677 108 7,595 7,288 211
85+ 4,846 4,679 97 9,926 9,645 205
Total 421,550 358,239 36,561 444,839 382,045 37,816
Menard
White BlackAge
FemalesMales
Total Population White BlackTotal Population
<1 301 294 6 275 270 4
1-4 1,427 1,367 50 1,266 1,236 27
5-9 1,931 1,870 49 2,026 1,956 58
10-14 2,109 2,050 38 2,058 1,973 67
15-19 2,096 2,039 36 1,946 1,862 40
20-24 1,705 1,653 44 1,594 1,535 38
25-29 1,506 1,466 25 1,571 1,533 27
30-34 1,597 1,557 35 1,848 1,816 25
35-39 1,890 1,826 46 1,778 1,752 16
40-44 1,811 1,763 28 1,904 1,851 30
45-49 2,028 2,009 14 2,273 2,240 17
50-54 2,467 2,445 17 2,651 2,600 17
55-59 2,583 2,572 10 2,437 2,397 23
60-64 2,081 2,071 5 2,299 2,272 11
65-69 1,863 1,833 16 1,952 1,940 8
70-74 1,202 1,187 4 1,344 1,333 7
75-79 895 886 6 1,092 1,090 0
80-84 566 565 1 696 690 0
85+ 456 451 5 999 996 0
Total 30,514 29,904 435 32,009 31,342 415
A - 23
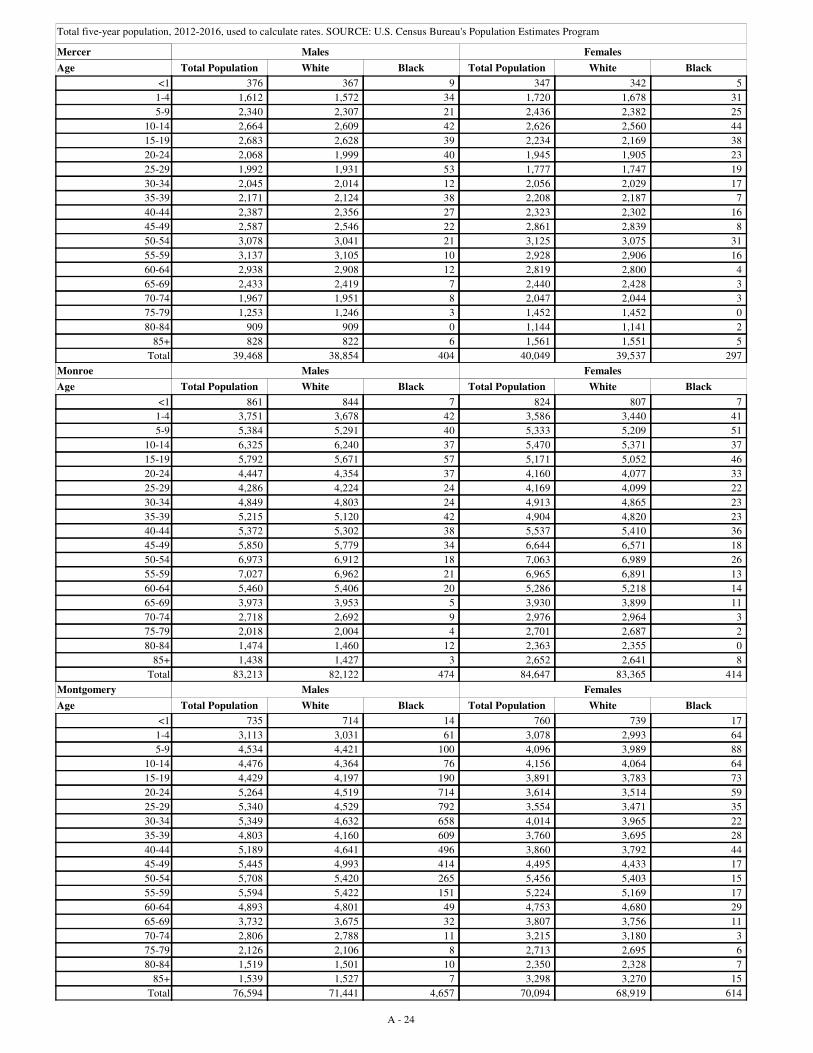
Total five-year population, 2012-2016, used to calculate rates. SOURCE: U.S. Census Bureau's Population Estimates Program
Mercer
White BlackAge
FemalesMales
Total Population White BlackTotal Population
<1 376 367 9 347 342 5
1-4 1,612 1,572 34 1,720 1,678 31
5-9 2,340 2,307 21 2,436 2,382 25
10-14 2,664 2,609 42 2,626 2,560 44
15-19 2,683 2,628 39 2,234 2,169 38
20-24 2,068 1,999 40 1,945 1,905 23
25-29 1,992 1,931 53 1,777 1,747 19
30-34 2,045 2,014 12 2,056 2,029 17
35-39 2,171 2,124 38 2,208 2,187 7
40-44 2,387 2,356 27 2,323 2,302 16
45-49 2,587 2,546 22 2,861 2,839 8
50-54 3,078 3,041 21 3,125 3,075 31
55-59 3,137 3,105 10 2,928 2,906 16
60-64 2,938 2,908 12 2,819 2,800 4
65-69 2,433 2,419 7 2,440 2,428 3
70-74 1,967 1,951 8 2,047 2,044 3
75-79 1,253 1,246 3 1,452 1,452 0
80-84 909 909 0 1,144 1,141 2
85+ 828 822 6 1,561 1,551 5
Total 39,468 38,854 404 40,049 39,537 297
Monroe
White BlackAge
FemalesMales
Total Population White BlackTotal Population
<1 861 844 7 824 807 7
1-4 3,751 3,678 42 3,586 3,440 41
5-9 5,384 5,291 40 5,333 5,209 51
10-14 6,325 6,240 37 5,470 5,371 37
15-19 5,792 5,671 57 5,171 5,052 46
20-24 4,447 4,354 37 4,160 4,077 33
25-29 4,286 4,224 24 4,169 4,099 22
30-34 4,849 4,803 24 4,913 4,865 23
35-39 5,215 5,120 42 4,904 4,820 23
40-44 5,372 5,302 38 5,537 5,410 36
45-49 5,850 5,779 34 6,644 6,571 18
50-54 6,973 6,912 18 7,063 6,989 26
55-59 7,027 6,962 21 6,965 6,891 13
60-64 5,460 5,406 20 5,286 5,218 14
65-69 3,973 3,953 5 3,930 3,899 11
70-74 2,718 2,692 9 2,976 2,964 3
75-79 2,018 2,004 4 2,701 2,687 2
80-84 1,474 1,460 12 2,363 2,355 0
85+ 1,438 1,427 3 2,652 2,641 8
Total 83,213 82,122 474 84,647 83,365 414
Montgomery
White BlackAge
FemalesMales
Total Population White BlackTotal Population
<1 735 714 14 760 739 17
1-4 3,113 3,031 61 3,078 2,993 64
5-9 4,534 4,421 100 4,096 3,989 88
10-14 4,476 4,364 76 4,156 4,064 64
15-19 4,429 4,197 190 3,891 3,783 73
20-24 5,264 4,519 714 3,614 3,514 59
25-29 5,340 4,529 792 3,554 3,471 35
30-34 5,349 4,632 658 4,014 3,965 22
35-39 4,803 4,160 609 3,760 3,695 28
40-44 5,189 4,641 496 3,860 3,792 44
45-49 5,445 4,993 414 4,495 4,433 17
50-54 5,708 5,420 265 5,456 5,403 15
55-59 5,594 5,422 151 5,224 5,169 17
60-64 4,893 4,801 49 4,753 4,680 29
65-69 3,732 3,675 32 3,807 3,756 11
70-74 2,806 2,788 11 3,215 3,180 3
75-79 2,126 2,106 8 2,713 2,695 6
80-84 1,519 1,501 10 2,350 2,328 7
85+ 1,539 1,527 7 3,298 3,270 15
Total 76,594 71,441 4,657 70,094 68,919 614
A - 24

Total five-year population, 2012-2016, used to calculate rates. SOURCE: U.S. Census Bureau's Population Estimates Program
Morgan
White BlackAge
FemalesMales
Total Population White BlackTotal Population
<1 962 829 124 885 759 120
1-4 3,765 3,275 439 3,463 3,086 354
5-9 4,988 4,401 534 4,465 4,028 399
10-14 5,146 4,557 525 4,810 4,324 421
15-19 6,192 5,326 735 5,351 4,812 429
20-24 6,408 5,413 915 5,950 5,442 439
25-29 5,806 4,872 843 5,245 4,882 318
30-34 6,085 4,894 1,084 4,881 4,581 240
35-39 5,436 4,501 856 4,518 4,278 200
40-44 5,088 4,372 623 4,709 4,448 175
45-49 5,531 4,956 513 5,350 5,095 188
50-54 6,553 6,006 473 6,353 6,131 182
55-59 6,491 6,044 383 6,321 6,087 181
60-64 5,604 5,385 173 5,777 5,621 110
65-69 4,671 4,556 80 5,018 4,915 76
70-74 3,270 3,168 83 4,013 3,928 80
75-79 2,378 2,318 53 3,046 2,993 52
80-84 1,685 1,651 22 2,480 2,436 36
85+ 1,532 1,508 24 3,507 3,475 21
Total 87,591 78,032 8,482 86,142 81,321 4,021
Moultrie
White BlackAge
FemalesMales
Total Population White BlackTotal Population
<1 458 451 5 456 452 4
1-4 1,871 1,838 24 1,947 1,903 39
5-9 2,734 2,687 33 2,545 2,491 44
10-14 2,792 2,732 33 2,618 2,568 44
15-19 2,516 2,464 32 2,238 2,197 24
20-24 2,042 2,003 22 1,965 1,926 17
25-29 2,070 2,030 26 2,063 2,036 11
30-34 2,217 2,160 43 2,378 2,358 13
35-39 2,074 2,050 20 2,167 2,132 13
40-44 2,043 2,015 16 2,090 2,058 8
45-49 2,209 2,189 11 2,212 2,190 14
50-54 2,462 2,438 3 2,722 2,683 3
55-59 2,434 2,416 8 2,583 2,570 2
60-64 2,324 2,309 7 2,383 2,360 10
65-69 1,833 1,830 3 2,033 2,024 4
70-74 1,379 1,372 2 1,457 1,442 5
75-79 1,042 1,033 9 1,209 1,207 0
80-84 742 737 5 1,059 1,056 0
85+ 703 697 6 1,662 1,662 0
Total 35,945 35,451 308 37,787 37,315 255
Ogle
White BlackAge
FemalesMales
Total Population White BlackTotal Population
<1 1,322 1,265 34 1,280 1,223 39
1-4 5,940 5,644 182 5,478 5,206 204
5-9 8,368 7,981 245 8,126 7,775 247
10-14 9,151 8,748 238 9,267 8,933 232
15-19 9,083 8,702 264 8,396 8,088 207
20-24 7,790 7,494 191 7,171 6,980 118
25-29 6,795 6,558 160 6,695 6,510 103
30-34 7,248 7,003 130 7,147 6,964 106
35-39 7,353 7,099 165 7,395 7,162 85
40-44 8,201 7,938 151 8,167 7,962 86
45-49 9,155 8,983 104 9,178 8,993 84
50-54 10,460 10,302 75 10,463 10,288 85
55-59 9,771 9,624 80 9,772 9,657 46
60-64 8,276 8,141 74 8,085 7,981 29
65-69 6,793 6,708 36 7,111 7,048 14
70-74 5,199 5,143 14 5,727 5,656 11
75-79 3,655 3,636 8 4,297 4,263 10
80-84 2,373 2,360 3 3,260 3,242 6
85+ 2,049 2,046 3 3,825 3,804 12
Total 128,982 125,375 2,157 130,840 127,735 1,724
A - 25

Total five-year population, 2012-2016, used to calculate rates. SOURCE: U.S. Census Bureau's Population Estimates Program
Peoria
White BlackAge
FemalesMales
Total Population White BlackTotal Population
<1 6,842 4,398 2,078 6,493 4,110 2,011
1-4 26,533 16,784 8,080 24,861 15,615 7,773
5-9 31,799 20,042 9,868 30,325 19,351 8,972
10-14 30,618 20,396 8,829 29,552 19,702 8,526
15-19 30,892 21,311 8,478 30,538 20,906 8,650
20-24 31,489 22,035 8,003 32,809 22,653 9,085
25-29 32,967 24,837 5,944 33,682 23,990 7,722
30-34 32,055 23,632 5,352 31,655 22,825 6,525
35-39 28,196 21,209 4,415 28,786 21,444 5,463
40-44 27,131 20,958 4,272 28,627 21,478 5,352
45-49 27,594 22,180 4,106 28,963 22,623 4,997
50-54 29,631 24,414 4,213 31,496 25,338 5,143
55-59 29,943 25,094 4,101 33,101 27,365 5,040
60-64 26,898 22,891 3,460 29,601 24,868 4,071
65-69 21,414 18,784 2,188 24,744 21,343 2,926
70-74 15,012 13,357 1,390 17,582 15,426 1,833
75-79 10,491 9,319 933 13,228 11,823 1,193
80-84 7,389 6,783 479 10,978 9,955 885
85+ 6,674 6,149 474 14,315 13,300 910
Total 453,568 344,573 86,663 481,336 364,115 97,077
Perry
White BlackAge
FemalesMales
Total Population White BlackTotal Population
<1 533 489 38 521 485 34
1-4 2,130 1,942 166 2,101 1,966 108
5-9 3,029 2,751 233 2,925 2,702 183
10-14 3,412 3,189 197 3,016 2,897 99
15-19 3,572 2,906 607 2,656 2,503 133
20-24 5,348 3,499 1,778 2,786 2,642 121
25-29 4,656 3,381 1,203 2,622 2,517 83
30-34 4,258 3,079 1,116 2,638 2,543 65
35-39 4,207 3,244 894 2,936 2,849 55
40-44 4,040 3,210 771 3,050 2,959 52
45-49 3,983 3,317 631 3,009 2,914 69
50-54 4,104 3,620 424 3,565 3,428 99
55-59 3,846 3,554 242 3,486 3,383 84
60-64 3,486 3,337 132 3,395 3,309 64
65-69 2,725 2,645 63 3,237 3,169 55
70-74 2,076 2,034 32 2,331 2,278 36
75-79 1,519 1,495 18 1,724 1,676 34
80-84 984 958 25 1,378 1,358 18
85+ 800 787 13 1,803 1,756 45
Total 58,708 49,437 8,583 49,179 47,334 1,437
Piatt
White BlackAge
FemalesMales
Total Population White BlackTotal Population
<1 441 432 5 421 413 6
1-4 1,887 1,830 41 1,742 1,705 27
5-9 2,556 2,480 55 2,318 2,239 56
10-14 2,897 2,835 36 2,752 2,665 52
15-19 2,749 2,689 37 2,718 2,647 44
20-24 2,189 2,146 22 1,958 1,895 35
25-29 2,067 2,024 23 1,972 1,943 13
30-34 2,369 2,328 23 2,252 2,226 9
35-39 2,433 2,385 28 2,399 2,370 4
40-44 2,405 2,382 15 2,519 2,459 23
45-49 2,601 2,555 19 2,786 2,735 8
50-54 3,313 3,262 23 3,426 3,383 14
55-59 3,362 3,335 19 3,355 3,334 7
60-64 2,767 2,738 18 2,775 2,758 5
65-69 2,322 2,313 2 2,393 2,385 3
70-74 1,645 1,637 0 1,827 1,823 2
75-79 1,205 1,199 4 1,581 1,576 1
80-84 825 819 5 1,119 1,114 0
85+ 778 773 1 1,098 1,096 2
Total 40,811 40,162 376 41,411 40,766 311
A - 26

Total five-year population, 2012-2016, used to calculate rates. SOURCE: U.S. Census Bureau's Population Estimates Program
Pike
White BlackAge
FemalesMales
Total Population White BlackTotal Population
<1 463 452 10 413 410 3
1-4 1,981 1,932 41 1,776 1,749 26
5-9 2,532 2,494 27 2,447 2,421 22
10-14 2,625 2,569 38 2,483 2,440 32
15-19 2,493 2,395 74 2,240 2,195 29
20-24 2,400 2,171 206 2,052 2,021 21
25-29 2,356 2,131 209 2,175 2,156 18
30-34 2,549 2,270 252 2,105 2,091 8
35-39 2,273 2,108 154 2,108 2,081 9
40-44 2,565 2,325 214 2,250 2,236 2
45-49 2,710 2,558 134 2,403 2,374 1
50-54 2,640 2,555 64 2,879 2,847 6
55-59 2,951 2,899 38 2,839 2,811 11
60-64 2,775 2,749 19 2,766 2,749 5
65-69 2,222 2,209 6 2,202 2,178 6
70-74 1,748 1,728 9 1,980 1,968 6
75-79 1,335 1,322 4 1,587 1,585 1
80-84 852 848 3 1,328 1,322 4
85+ 755 753 2 1,802 1,782 3
Total 40,225 38,468 1,504 39,835 39,416 213
Pope
White BlackAge
FemalesMales
Total Population White BlackTotal Population
<1 74 72 2 58 55 3
1-4 306 276 29 239 218 15
5-9 442 412 23 418 394 22
10-14 498 479 17 418 394 22
15-19 1,079 621 445 608 422 179
20-24 989 566 405 566 454 107
25-29 498 412 80 428 399 16
30-34 527 487 38 520 492 25
35-39 481 480 1 484 478 2
40-44 559 548 9 579 566 3
45-49 716 679 29 617 604 5
50-54 870 856 7 863 840 6
55-59 920 884 18 1,019 994 9
60-64 943 931 3 917 900 4
65-69 875 871 3 802 783 7
70-74 693 680 8 659 647 4
75-79 553 545 2 443 443 0
80-84 377 375 2 376 376 0
85+ 228 213 0 285 285 0
Total 11,628 10,387 1,121 10,299 9,744 429
Pulaski
White BlackAge
FemalesMales
Total Population White BlackTotal Population
<1 150 104 45 152 103 49
1-4 594 398 186 625 401 216
5-9 929 565 345 916 541 362
10-14 995 604 381 973 555 410
15-19 891 528 346 766 415 331
20-24 804 471 321 817 523 271
25-29 836 526 303 756 524 224
30-34 665 452 203 811 561 243
35-39 776 547 227 836 554 270
40-44 694 457 237 851 530 309
45-49 790 564 216 787 525 253
50-54 1,073 749 317 1,070 683 380
55-59 1,134 774 348 1,253 770 471
60-64 1,029 726 302 1,140 791 337
65-69 838 592 246 975 680 288
70-74 595 406 187 749 471 278
75-79 485 345 137 571 402 169
80-84 380 268 112 469 349 120
85+ 245 182 62 486 359 125
Total 13,903 9,258 4,521 15,003 9,737 5,106
A - 27

Total five-year population, 2012-2016, used to calculate rates. SOURCE: U.S. Census Bureau's Population Estimates Program
Putnam
White BlackAge
FemalesMales
Total Population White BlackTotal Population
<1 138 135 3 115 111 2
1-4 615 590 25 533 499 16
5-9 841 815 19 707 694 11
10-14 939 910 27 843 825 14
15-19 885 852 32 758 737 15
20-24 835 806 27 695 673 14
25-29 681 670 8 691 663 23
30-34 840 821 6 763 746 11
35-39 759 741 9 733 719 7
40-44 817 803 5 755 728 10
45-49 878 876 2 959 955 1
50-54 1,175 1,167 1 1,212 1,198 9
55-59 1,316 1,292 20 1,207 1,198 5
60-64 1,277 1,263 14 1,095 1,089 0
65-69 987 984 3 1,036 1,028 0
70-74 750 746 4 765 754 0
75-79 508 508 0 543 542 0
80-84 316 316 0 328 327 1
85+ 224 224 0 516 516 0
Total 14,781 14,519 205 14,254 14,002 139
Randolph
White BlackAge
FemalesMales
Total Population White BlackTotal Population
<1 854 794 56 825 760 58
1-4 3,425 3,171 238 3,375 3,123 229
5-9 4,513 4,216 248 4,159 3,858 263
10-14 4,662 4,387 229 4,443 4,118 284
15-19 4,670 4,121 500 4,045 3,769 249
20-24 5,961 4,351 1,540 3,961 3,679 229
25-29 7,506 4,850 2,564 3,782 3,571 174
30-34 7,755 5,078 2,605 4,149 3,963 138
35-39 6,879 4,772 2,046 4,021 3,814 156
40-44 6,629 4,916 1,632 4,127 3,918 147
45-49 6,664 5,313 1,312 4,516 4,328 148
50-54 7,247 6,273 942 5,407 5,248 109
55-59 6,655 5,964 659 5,598 5,424 132
60-64 5,430 5,067 342 5,029 4,892 111
65-69 4,130 3,986 126 4,320 4,217 94
70-74 3,011 2,898 107 3,492 3,414 69
75-79 2,244 2,202 40 2,803 2,765 28
80-84 1,386 1,372 14 2,439 2,406 22
85+ 1,455 1,425 30 3,224 3,184 36
Total 91,076 75,156 15,230 73,715 70,451 2,676
Richland
White BlackAge
FemalesMales
Total Population White BlackTotal Population
<1 493 472 14 486 472 10
1-4 2,076 1,993 55 1,949 1,886 42
5-9 2,639 2,557 50 2,361 2,271 47
10-14 2,569 2,486 53 2,420 2,349 46
15-19 2,420 2,353 31 2,106 2,060 32
20-24 2,377 2,286 31 2,236 2,166 27
25-29 2,264 2,194 34 2,219 2,134 43
30-34 2,336 2,262 28 2,356 2,285 30
35-39 2,304 2,257 31 2,241 2,181 7
40-44 2,243 2,182 31 2,303 2,249 6
45-49 2,510 2,471 14 2,442 2,404 3
50-54 2,898 2,870 14 2,951 2,928 6
55-59 2,950 2,893 36 2,999 2,965 16
60-64 2,570 2,534 22 2,626 2,597 8
65-69 2,005 1,978 11 2,169 2,140 6
70-74 1,613 1,592 8 1,898 1,863 6
75-79 1,395 1,384 2 1,655 1,647 1
80-84 913 903 2 1,271 1,258 9
85+ 831 825 0 1,904 1,889 3
Total 39,406 38,492 467 40,592 39,744 348
A - 28

Total five-year population, 2012-2016, used to calculate rates. SOURCE: U.S. Census Bureau's Population Estimates Program
Rock Island
White BlackAge
FemalesMales
Total Population White BlackTotal Population
<1 4,834 3,620 953 4,576 3,413 925
1-4 19,069 14,448 3,636 18,520 13,962 3,576
5-9 23,523 18,105 4,484 22,536 17,358 4,078
10-14 23,004 18,530 3,738 21,552 17,146 3,595
15-19 23,499 18,928 3,703 22,403 18,398 3,280
20-24 23,429 18,966 3,580 23,509 19,462 3,265
25-29 23,288 18,886 3,398 22,254 18,396 2,823
30-34 24,594 19,541 3,147 22,686 18,779 2,674
35-39 22,362 18,143 2,925 21,052 17,873 2,397
40-44 21,466 17,817 2,788 20,969 18,056 2,169
45-49 22,231 19,025 2,517 21,877 19,280 1,963
50-54 24,760 21,907 2,245 25,536 23,173 1,808
55-59 26,256 23,883 1,865 27,180 24,826 1,873
60-64 23,295 21,590 1,353 25,096 22,815 1,718
65-69 18,863 17,492 1,112 21,003 19,335 1,326
70-74 14,035 13,007 832 15,793 14,751 873
75-79 10,062 9,431 467 12,425 11,719 609
80-84 6,968 6,618 282 10,042 9,592 374
85+ 6,198 5,986 205 13,060 12,519 443
Total 361,736 305,923 43,230 372,069 320,853 39,769
Saline
White BlackAge
FemalesMales
Total Population White BlackTotal Population
<1 805 746 53 777 717 54
1-4 3,021 2,802 195 2,830 2,616 177
5-9 3,699 3,362 280 3,402 3,117 220
10-14 3,849 3,525 268 3,456 3,218 164
15-19 4,788 3,643 1,086 3,222 2,975 194
20-24 3,856 3,578 231 3,661 3,432 189
25-29 3,713 3,462 189 3,672 3,551 85
30-34 3,510 3,288 174 3,552 3,389 123
35-39 3,194 2,997 146 3,456 3,267 119
40-44 3,701 3,509 130 3,656 3,434 149
45-49 4,056 3,870 143 4,020 3,854 121
50-54 4,204 4,020 148 4,511 4,347 109
55-59 4,168 4,042 94 4,553 4,383 138
60-64 4,036 3,871 132 4,244 4,087 116
65-69 3,343 3,200 107 3,709 3,577 92
70-74 2,641 2,533 83 3,105 2,969 103
75-79 1,807 1,750 48 2,479 2,377 91
80-84 1,273 1,240 29 1,878 1,835 36
85+ 1,018 999 19 2,091 2,014 65
Total 60,682 56,437 3,555 62,274 59,159 2,345
Sangamon
White BlackAge
FemalesMales
Total Population White BlackTotal Population
<1 5,806 4,264 1,356 5,609 4,095 1,347
1-4 24,776 18,594 5,296 22,858 16,884 5,260
5-9 32,242 24,671 6,741 31,493 23,757 6,860
10-14 33,393 25,957 6,676 32,242 24,885 6,594
15-19 31,679 24,693 6,302 29,987 23,141 6,137
20-24 29,980 23,064 5,708 31,222 23,714 6,447
25-29 30,735 25,381 4,526 32,542 25,934 5,593
30-34 31,491 26,458 4,113 33,801 27,538 5,108
35-39 29,426 24,473 3,915 30,699 25,358 4,420
40-44 29,647 25,618 3,132 31,201 26,391 3,870
45-49 31,839 27,725 3,334 33,417 28,837 3,745
50-54 35,899 31,901 3,375 38,212 33,810 3,702
55-59 34,584 31,064 3,004 38,148 34,019 3,497
60-64 30,824 28,246 2,167 34,906 31,474 2,802
65-69 23,829 21,932 1,567 28,056 25,623 1,992
70-74 15,670 14,369 1,022 19,535 18,054 1,221
75-79 11,023 10,329 525 14,793 13,746 891
80-84 7,639 7,290 313 11,864 11,186 544
85+ 6,862 6,592 229 15,610 14,734 722
Total 477,344 402,621 63,301 516,195 433,180 70,752
A - 29

Total five-year population, 2012-2016, used to calculate rates. SOURCE: U.S. Census Bureau's Population Estimates Program
Schuyler
White BlackAge
FemalesMales
Total Population White BlackTotal Population
<1 159 147 12 158 150 6
1-4 682 640 42 670 631 27
5-9 981 949 32 1,013 975 34
10-14 1,075 1,063 8 1,114 1,078 31
15-19 1,118 1,095 17 953 928 24
20-24 921 887 27 861 840 13
25-29 984 907 72 817 785 18
30-34 1,109 1,019 76 963 894 57
35-39 1,335 1,205 124 861 838 16
40-44 1,422 1,276 146 1,126 1,083 33
45-49 1,539 1,356 183 1,090 1,042 32
50-54 1,444 1,300 133 1,284 1,263 12
55-59 1,496 1,371 118 1,290 1,276 9
60-64 1,413 1,364 48 1,251 1,235 6
65-69 1,128 1,109 11 977 976 0
70-74 831 820 9 882 882 0
75-79 565 556 9 684 682 2
80-84 444 443 1 580 580 0
85+ 409 409 0 694 689 0
Total 19,055 17,916 1,068 17,268 16,827 320
Scott
White BlackAge
FemalesMales
Total Population White BlackTotal Population
<1 138 137 0 107 106 0
1-4 579 566 10 498 488 7
5-9 767 745 11 853 845 8
10-14 853 828 15 813 803 6
15-19 808 791 15 843 817 15
20-24 701 683 7 655 639 8
25-29 598 598 0 650 637 3
30-34 638 629 9 731 723 3
35-39 781 773 8 732 716 6
40-44 783 773 6 822 812 8
45-49 859 847 6 909 900 1
50-54 1,096 1,093 1 1,094 1,085 4
55-59 1,059 1,054 2 935 935 0
60-64 817 814 1 880 877 3
65-69 633 632 1 719 706 10
70-74 509 508 1 642 641 1
75-79 485 481 4 543 542 1
80-84 293 291 1 380 380 0
85+ 202 202 0 425 420 0
Total 12,599 12,445 98 13,231 13,072 84
Shelby
White BlackAge
FemalesMales
Total Population White BlackTotal Population
<1 626 618 7 610 587 20
1-4 2,461 2,410 40 2,422 2,359 53
5-9 3,426 3,368 38 3,114 3,073 31
10-14 3,445 3,368 54 3,313 3,270 31
15-19 3,342 3,271 46 3,314 3,280 26
20-24 3,080 3,011 37 2,871 2,840 21
25-29 2,943 2,875 28 2,844 2,794 20
30-34 3,000 2,966 13 2,845 2,812 12
35-39 3,064 3,023 19 2,861 2,835 5
40-44 3,189 3,142 32 3,119 3,100 11
45-49 3,531 3,482 31 3,463 3,421 11
50-54 4,131 4,101 14 4,191 4,150 7
55-59 4,124 4,112 5 4,235 4,206 14
60-64 3,811 3,786 5 3,979 3,939 8
65-69 3,358 3,330 12 3,541 3,514 6
70-74 2,662 2,648 1 2,720 2,705 0
75-79 1,795 1,784 1 2,062 2,045 5
80-84 1,339 1,323 4 1,746 1,744 1
85+ 1,193 1,188 1 2,250 2,239 1
Total 54,520 53,806 388 55,500 54,913 283
A - 30

Total five-year population, 2012-2016, used to calculate rates. SOURCE: U.S. Census Bureau's Population Estimates Program
St Clair
White BlackAge
FemalesMales
Total Population White BlackTotal Population
<1 8,641 5,051 3,402 8,165 4,720 3,252
1-4 35,268 21,125 13,253 33,176 19,526 12,843
5-9 45,652 26,986 17,483 43,651 26,033 16,547
10-14 46,061 27,621 17,428 44,312 26,080 17,191
15-19 44,565 26,170 17,394 42,749 24,534 17,219
20-24 44,429 26,810 16,667 43,208 24,530 17,581
25-29 42,761 28,616 13,084 44,521 27,601 15,795
30-34 41,981 29,732 11,275 44,911 28,859 14,763
35-39 40,078 28,538 10,664 43,403 27,874 14,255
40-44 39,979 27,430 11,545 43,848 27,457 15,044
45-49 42,443 30,193 11,459 45,753 30,166 14,467
50-54 47,950 35,340 11,873 51,135 35,261 14,701
55-59 45,623 33,999 10,960 49,988 35,130 13,669
60-64 37,369 28,059 8,802 41,512 28,896 11,563
65-69 28,320 21,582 6,368 31,755 22,530 8,457
70-74 18,610 14,240 4,101 22,882 16,648 5,710
75-79 13,158 10,278 2,719 18,557 13,977 4,215
80-84 9,605 7,790 1,723 15,644 12,075 3,357
85+ 8,491 7,008 1,417 18,144 14,628 3,390
Total 640,984 436,568 191,617 687,314 446,525 224,019
Stark
White BlackAge
FemalesMales
Total Population White BlackTotal Population
<1 145 140 2 170 164 6
1-4 601 579 19 644 613 26
5-9 789 773 13 808 775 22
10-14 893 875 12 941 910 20
15-19 908 871 22 919 895 13
20-24 729 716 11 721 700 14
25-29 647 629 12 598 590 4
30-34 716 697 18 660 651 6
35-39 813 802 5 769 758 4
40-44 802 799 1 827 805 17
45-49 873 860 4 895 877 9
50-54 1,093 1,083 8 933 929 0
55-59 1,137 1,128 4 1,095 1,083 3
60-64 978 974 0 1,055 1,023 7
65-69 858 847 6 861 843 4
70-74 722 719 0 692 692 0
75-79 518 510 5 583 581 2
80-84 319 312 7 457 454 3
85+ 261 260 1 635 635 0
Total 13,802 13,574 150 14,263 13,978 160
Stephenson
White BlackAge
FemalesMales
Total Population White BlackTotal Population
<1 1,283 974 285 1,240 974 261
1-4 5,233 4,119 1,053 5,198 4,038 1,108
5-9 7,002 5,553 1,366 6,998 5,482 1,426
10-14 7,471 6,099 1,275 7,035 5,605 1,313
15-19 7,220 5,974 1,107 6,785 5,452 1,220
20-24 6,793 5,696 993 6,529 5,345 1,093
25-29 5,854 4,966 810 6,146 5,133 961
30-34 5,763 4,993 721 6,165 5,314 776
35-39 5,443 4,695 683 6,007 5,229 665
40-44 6,416 5,699 653 6,444 5,736 615
45-49 7,510 6,617 807 7,534 6,728 728
50-54 8,500 7,748 700 8,943 8,060 788
55-59 8,917 8,209 662 9,065 8,242 729
60-64 7,978 7,417 500 8,401 7,842 459
65-69 6,517 6,144 312 7,140 6,702 361
70-74 4,834 4,598 216 5,634 5,298 297
75-79 3,782 3,616 146 4,697 4,437 238
80-84 2,895 2,819 62 3,735 3,571 153
85+ 2,510 2,429 60 5,408 5,233 145
Total 111,921 98,365 12,411 119,104 104,421 13,336
A - 31

Total five-year population, 2012-2016, used to calculate rates. SOURCE: U.S. Census Bureau's Population Estimates Program
Tazewell
White BlackAge
FemalesMales
Total Population White BlackTotal Population
<1 4,090 3,929 105 3,793 3,616 112
1-4 16,702 16,044 406 16,543 15,846 437
5-9 22,383 21,416 544 22,062 21,125 531
10-14 22,581 21,787 454 21,770 20,897 433
15-19 21,022 20,243 459 19,264 18,585 392
20-24 18,853 18,062 483 18,153 17,604 326
25-29 20,562 19,368 814 19,420 18,709 317
30-34 22,942 21,663 873 21,687 20,903 342
35-39 22,584 21,548 693 21,530 20,816 245
40-44 21,441 20,557 567 21,495 20,835 229
45-49 22,012 21,299 419 21,657 21,132 204
50-54 23,479 22,938 319 24,285 23,899 140
55-59 23,630 23,215 238 24,665 24,348 102
60-64 20,943 20,698 97 22,119 21,846 86
65-69 16,882 16,725 62 18,559 18,321 43
70-74 11,811 11,690 35 13,943 13,799 25
75-79 8,875 8,829 18 11,575 11,460 36
80-84 6,574 6,547 13 9,417 9,347 17
85+ 5,616 5,595 10 11,144 11,094 19
Total 332,982 322,153 6,609 343,081 334,182 4,036
Union
White BlackAge
FemalesMales
Total Population White BlackTotal Population
<1 485 469 16 456 445 10
1-4 1,955 1,880 53 1,754 1,699 49
5-9 2,617 2,483 76 2,466 2,366 51
10-14 2,770 2,649 68 2,708 2,632 45
15-19 2,466 2,361 59 2,268 2,193 46
20-24 2,565 2,473 57 2,442 2,388 40
25-29 2,673 2,544 87 2,393 2,348 30
30-34 2,406 2,296 57 2,233 2,171 28
35-39 2,455 2,322 79 2,427 2,334 40
40-44 2,701 2,590 52 2,645 2,531 58
45-49 2,823 2,732 66 2,882 2,812 39
50-54 3,307 3,249 42 3,230 3,167 36
55-59 3,275 3,205 46 3,395 3,338 25
60-64 3,066 2,995 49 3,025 2,955 36
65-69 2,579 2,515 33 2,719 2,686 14
70-74 2,006 1,991 3 2,291 2,267 12
75-79 1,626 1,606 10 1,648 1,637 9
80-84 865 854 11 1,168 1,165 3
85+ 768 765 2 1,386 1,363 3
Total 43,408 41,979 866 43,536 42,497 574
Vermilion
White BlackAge
FemalesMales
Total Population White BlackTotal Population
<1 2,627 1,882 714 2,551 1,891 636
1-4 10,789 7,915 2,757 10,413 7,844 2,450
5-9 13,850 10,515 3,131 13,049 9,852 2,988
10-14 13,326 10,591 2,555 12,980 10,135 2,621
15-19 13,026 10,436 2,430 12,081 9,439 2,460
20-24 12,444 9,679 2,597 11,795 9,159 2,478
25-29 12,051 9,341 2,554 11,409 9,235 2,007
30-34 12,170 9,614 2,404 11,336 9,247 1,887
35-39 12,191 9,770 2,288 10,865 9,115 1,448
40-44 11,990 9,925 1,863 11,315 9,700 1,388
45-49 11,942 10,268 1,508 12,216 10,649 1,346
50-54 14,081 12,369 1,541 14,123 12,547 1,405
55-59 13,871 12,357 1,399 14,500 12,853 1,443
60-64 12,639 11,445 1,038 13,540 12,239 1,106
65-69 10,462 9,767 557 11,461 10,478 833
70-74 7,741 7,209 425 8,811 8,118 570
75-79 5,544 5,255 239 6,966 6,437 440
80-84 3,775 3,559 188 5,417 5,120 265
85+ 3,376 3,189 174 6,225 5,935 252
Total 197,895 165,086 30,362 201,053 169,993 28,023
A - 32

Total five-year population, 2012-2016, used to calculate rates. SOURCE: U.S. Census Bureau's Population Estimates Program
Wabash
White BlackAge
FemalesMales
Total Population White BlackTotal Population
<1 383 368 8 297 287 7
1-4 1,479 1,401 54 1,345 1,313 26
5-9 1,846 1,780 41 1,743 1,666 40
10-14 1,809 1,756 37 1,720 1,662 33
15-19 1,741 1,631 35 1,581 1,544 24
20-24 1,950 1,776 77 1,649 1,575 33
25-29 1,619 1,552 43 1,605 1,560 24
30-34 1,797 1,734 33 1,628 1,580 16
35-39 1,656 1,625 5 1,549 1,518 6
40-44 1,551 1,520 10 1,677 1,639 15
45-49 1,617 1,583 23 1,685 1,638 23
50-54 2,173 2,138 17 2,153 2,106 16
55-59 2,225 2,203 8 2,403 2,370 9
60-64 2,026 1,999 15 2,068 2,048 7
65-69 1,547 1,525 12 1,634 1,625 5
70-74 1,179 1,156 12 1,254 1,249 1
75-79 860 858 1 1,087 1,076 1
80-84 631 627 0 987 979 5
85+ 614 613 1 1,260 1,253 0
Total 28,703 27,845 432 29,325 28,688 291
Warren
White BlackAge
FemalesMales
Total Population White BlackTotal Population
<1 587 493 53 534 460 54
1-4 2,338 1,946 173 1,901 1,688 132
5-9 2,652 2,438 119 2,700 2,460 159
10-14 2,658 2,448 153 2,741 2,545 133
15-19 3,548 3,303 156 3,584 3,352 182
20-24 3,332 3,099 131 3,356 3,165 132
25-29 2,236 1,983 111 2,150 1,925 68
30-34 2,497 2,176 146 2,403 2,203 87
35-39 2,524 2,286 111 2,353 2,215 71
40-44 2,425 2,267 86 2,448 2,335 60
45-49 2,565 2,381 126 2,472 2,383 51
50-54 2,844 2,706 85 2,967 2,877 54
55-59 3,132 2,975 65 3,144 3,075 32
60-64 2,918 2,850 32 2,980 2,918 26
65-69 2,353 2,294 48 2,397 2,352 24
70-74 1,728 1,691 20 1,961 1,941 12
75-79 1,383 1,366 5 1,684 1,640 33
80-84 794 783 8 1,279 1,259 13
85+ 619 599 16 1,528 1,508 13
Total 43,133 40,084 1,644 44,582 42,301 1,336
Washington
White BlackAge
FemalesMales
Total Population White BlackTotal Population
<1 389 374 12 401 388 10
1-4 1,541 1,478 49 1,504 1,461 35
5-9 2,178 2,110 51 2,144 2,084 48
10-14 2,313 2,218 69 2,166 2,069 69
15-19 2,121 1,987 106 2,029 1,933 63
20-24 2,000 1,938 50 1,969 1,914 43
25-29 2,179 2,122 41 1,915 1,898 10
30-34 2,191 2,140 38 2,017 1,969 31
35-39 2,164 2,139 9 2,088 2,057 18
40-44 2,178 2,140 24 2,116 2,091 5
45-49 2,313 2,274 29 2,296 2,268 8
50-54 2,924 2,887 24 2,924 2,903 18
55-59 2,997 2,974 10 2,748 2,722 11
60-64 2,625 2,600 13 2,232 2,215 4
65-69 1,921 1,907 4 1,850 1,840 6
70-74 1,393 1,388 1 1,710 1,684 11
75-79 1,095 1,093 2 1,335 1,325 0
80-84 776 775 1 990 986 2
85+ 762 756 0 1,375 1,375 0
Total 36,060 35,300 533 35,809 35,182 392
A - 33

Total five-year population, 2012-2016, used to calculate rates. SOURCE: U.S. Census Bureau's Population Estimates Program
Wayne
White BlackAge
FemalesMales
Total Population White BlackTotal Population
<1 511 501 6 530 521 7
1-4 2,062 2,021 24 2,030 1,990 27
5-9 2,721 2,645 48 2,480 2,410 58
10-14 2,677 2,590 57 2,663 2,564 47
15-19 2,425 2,348 31 2,322 2,269 17
20-24 2,377 2,331 23 2,126 2,091 23
25-29 2,315 2,279 28 2,173 2,097 38
30-34 2,353 2,333 11 2,431 2,332 24
35-39 2,248 2,229 4 2,397 2,351 5
40-44 2,415 2,366 15 2,386 2,340 13
45-49 2,620 2,572 16 2,576 2,545 9
50-54 2,918 2,865 21 2,911 2,889 6
55-59 3,085 3,055 12 2,960 2,943 9
60-64 2,687 2,656 23 2,833 2,822 2
65-69 2,357 2,344 3 2,509 2,490 5
70-74 1,939 1,932 2 2,181 2,177 0
75-79 1,491 1,483 4 1,755 1,747 0
80-84 960 958 0 1,376 1,360 2
85+ 760 756 0 1,443 1,435 0
Total 40,921 40,264 328 42,082 41,373 292
White
White BlackAge
FemalesMales
Total Population White BlackTotal Population
<1 415 405 9 404 381 7
1-4 1,822 1,769 31 1,786 1,717 31
5-9 2,235 2,189 23 2,262 2,213 28
10-14 2,089 2,047 28 2,106 2,066 22
15-19 1,956 1,909 36 1,847 1,806 27
20-24 1,755 1,703 45 1,845 1,803 27
25-29 1,994 1,938 38 1,903 1,875 6
30-34 2,186 2,125 38 2,112 2,091 4
35-39 1,914 1,873 32 1,933 1,905 18
40-44 1,842 1,808 21 1,847 1,826 7
45-49 2,243 2,149 59 2,109 2,081 16
50-54 2,727 2,687 22 2,757 2,706 20
55-59 2,774 2,736 25 2,712 2,681 10
60-64 2,325 2,292 16 2,426 2,407 2
65-69 1,996 1,968 5 2,241 2,231 5
70-74 1,578 1,566 4 1,865 1,856 3
75-79 1,276 1,265 6 1,613 1,609 2
80-84 874 864 0 1,291 1,282 5
85+ 836 834 0 1,616 1,598 7
Total 34,837 34,127 438 36,675 36,134 247
Whiteside
White BlackAge
FemalesMales
Total Population White BlackTotal Population
<1 1,628 1,536 81 1,537 1,448 80
1-4 6,925 6,521 350 6,543 6,134 344
5-9 9,168 8,642 387 8,724 8,185 419
10-14 9,425 8,964 333 9,208 8,651 397
15-19 9,380 8,945 322 8,940 8,421 403
20-24 8,581 8,159 319 7,841 7,534 223
25-29 7,670 7,300 283 7,538 7,228 227
30-34 7,722 7,286 330 7,610 7,340 181
35-39 7,815 7,460 262 7,531 7,279 140
40-44 8,701 8,426 150 8,616 8,380 142
45-49 9,251 8,940 175 9,209 8,997 116
50-54 10,288 10,028 169 10,443 10,206 146
55-59 10,839 10,612 115 10,891 10,687 100
60-64 9,816 9,584 115 9,995 9,778 76
65-69 7,800 7,665 67 8,331 8,192 60
70-74 5,861 5,785 49 6,485 6,382 44
75-79 4,379 4,321 40 5,317 5,252 29
80-84 2,996 2,970 15 4,210 4,181 17
85+ 2,872 2,858 2 5,675 5,637 10
Total 141,117 136,002 3,564 144,644 139,912 3,154
A - 34

Total five-year population, 2012-2016, used to calculate rates. SOURCE: U.S. Census Bureau's Population Estimates Program
Will
White BlackAge
FemalesMales
Total Population White BlackTotal Population
<1 19,946 16,155 2,735 19,125 15,425 2,695
1-4 88,072 70,987 11,579 84,333 67,948 10,978
5-9 129,063 103,245 16,392 123,942 98,347 16,120
10-14 143,236 113,751 19,231 136,056 107,959 17,856
15-19 136,941 108,188 21,003 126,835 100,678 18,528
20-24 112,241 87,730 19,080 104,490 82,443 16,572
25-29 95,560 76,631 14,157 90,966 72,208 12,995
30-34 104,273 85,552 13,083 106,994 85,844 13,322
35-39 114,355 93,269 13,048 119,207 94,442 14,567
40-44 129,849 104,243 14,942 133,161 105,185 16,710
45-49 134,183 111,059 14,331 135,793 110,771 16,019
50-54 129,588 109,349 13,535 129,439 108,141 14,936
55-59 110,207 93,722 11,218 111,138 92,917 12,749
60-64 85,151 72,443 8,453 89,274 74,583 10,097
65-69 65,853 56,541 6,002 72,629 61,452 7,422
70-74 44,350 38,617 3,526 50,913 43,913 4,285
75-79 28,084 24,590 1,949 35,837 31,356 2,852
80-84 17,727 15,905 1,062 25,502 22,920 1,678
85+ 14,406 13,233 669 29,686 27,276 1,664
Total 1,703,085 1,395,210 205,995 1,725,320 1,403,808 212,045
Williamson
White BlackAge
FemalesMales
Total Population White BlackTotal Population
<1 2,041 1,855 156 1,909 1,731 150
1-4 8,311 7,547 607 7,763 6,994 583
5-9 10,807 9,821 801 10,042 9,090 723
10-14 10,549 9,694 717 10,273 9,397 681
15-19 9,523 8,691 703 8,886 8,144 599
20-24 9,866 8,775 917 9,698 8,990 526
25-29 11,535 10,184 1,051 10,748 10,024 484
30-34 11,506 10,209 1,102 10,830 10,077 482
35-39 11,398 10,182 977 10,180 9,519 441
40-44 11,164 10,132 853 10,477 9,865 374
45-49 11,178 10,268 706 10,412 9,880 330
50-54 11,918 11,261 489 12,023 11,536 331
55-59 11,570 11,107 340 11,865 11,418 289
60-64 10,248 9,933 239 10,834 10,439 263
65-69 9,177 8,887 194 10,062 9,748 190
70-74 6,662 6,422 146 8,005 7,819 96
75-79 4,742 4,646 54 6,006 5,892 69
80-84 3,054 2,981 42 4,201 4,117 60
85+ 2,481 2,416 46 4,872 4,801 49
Total 167,730 155,011 10,140 169,086 159,481 6,720
Winnebago
White BlackAge
FemalesMales
Total Population White BlackTotal Population
<1 9,075 6,801 1,934 8,741 6,538 1,895
1-4 37,512 28,060 7,982 35,436 26,703 7,368
5-9 49,039 36,515 10,350 46,661 34,964 9,639
10-14 50,256 38,225 9,873 48,167 36,556 9,321
15-19 48,033 37,223 8,821 46,024 35,861 8,284
20-24 45,057 34,980 8,386 45,761 35,047 8,968
25-29 43,686 34,752 7,200 45,130 35,192 8,151
30-34 43,681 35,622 6,009 45,711 36,203 7,252
35-39 42,009 34,899 5,309 43,243 34,860 6,436
40-44 45,296 37,853 5,562 46,135 37,866 6,126
45-49 47,250 40,393 5,133 48,405 40,800 5,829
50-54 52,396 45,496 5,425 53,283 45,492 6,101
55-59 50,210 44,275 4,560 52,204 45,305 5,431
60-64 43,273 38,480 3,668 46,611 41,165 4,307
65-69 35,175 31,676 2,758 38,780 34,811 3,120
70-74 24,878 22,502 1,641 28,788 25,778 2,312
75-79 16,799 15,430 1,012 21,331 19,303 1,593
80-84 11,705 10,877 666 16,961 15,779 962
85+ 10,685 10,132 430 21,444 20,336 943
Total 706,015 584,191 96,719 738,816 608,559 104,038
A - 35

Total five-year population, 2012-2016, used to calculate rates. SOURCE: U.S. Census Bureau's Population Estimates Program
Woodford
White BlackAge
FemalesMales
Total Population White BlackTotal Population
<1 1,140 1,116 22 1,044 1,018 24
1-4 5,098 4,953 83 4,670 4,523 110
5-9 6,944 6,683 132 6,492 6,322 102
10-14 7,412 7,200 117 6,789 6,597 123
15-19 7,024 6,766 137 6,816 6,612 129
20-24 6,019 5,859 98 5,861 5,653 134
25-29 4,991 4,852 84 4,676 4,586 38
30-34 5,468 5,381 46 5,743 5,573 47
35-39 5,826 5,737 53 5,654 5,572 41
40-44 5,705 5,608 38 5,820 5,710 24
45-49 6,322 6,200 57 6,344 6,208 27
50-54 7,238 7,130 32 7,304 7,193 31
55-59 7,167 7,100 25 7,214 7,135 29
60-64 6,409 6,347 25 6,335 6,218 36
65-69 4,852 4,796 9 4,652 4,583 20
70-74 3,253 3,224 11 3,575 3,548 2
75-79 2,448 2,434 2 2,865 2,843 7
80-84 1,668 1,667 1 2,459 2,443 4
85+ 1,761 1,760 1 3,764 3,761 1
Total 96,745 94,813 973 98,077 96,098 929
A - 36
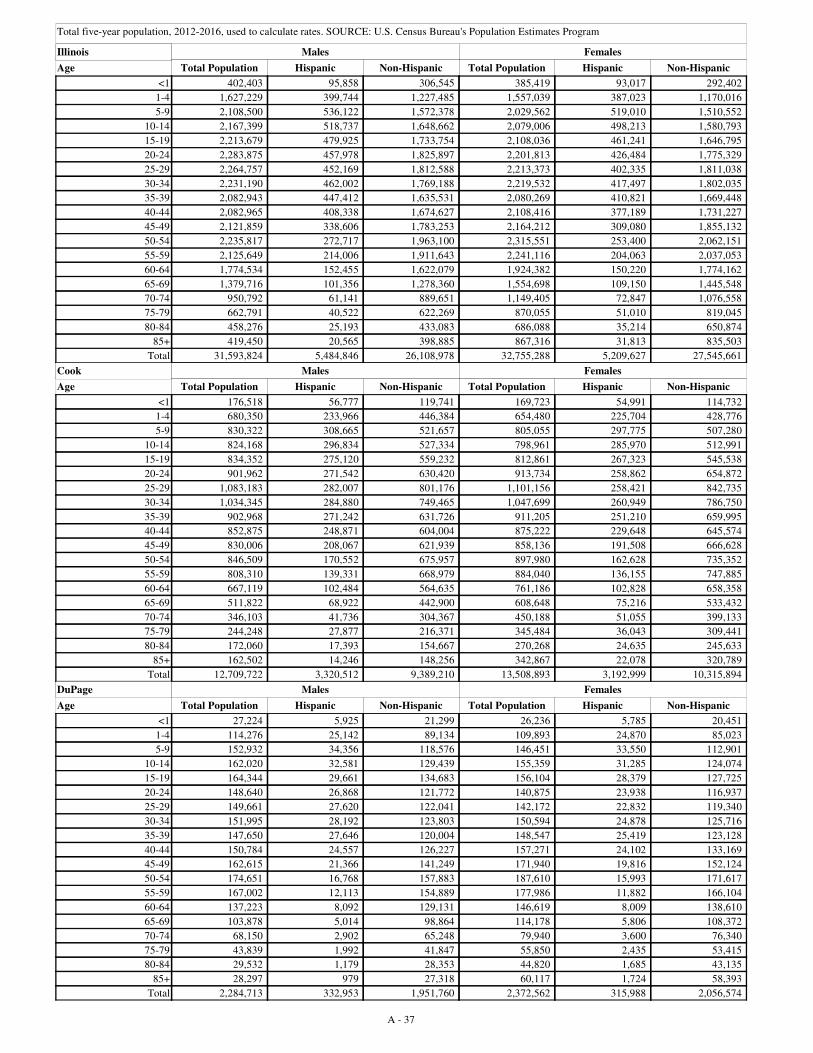
Total five-year population, 2012-2016, used to calculate rates. SOURCE: U.S. Census Bureau's Population Estimates Program
Hispanic Non-HispanicAge
Illinois FemalesMales
Total Population Hispanic Non-HispanicTotal Population
<1 402,403 95,858 306,545 385,419 93,017 292,402
1-4 1,627,229 399,744 1,227,485 1,557,039 387,023 1,170,016
5-9 2,108,500 536,122 1,572,378 2,029,562 519,010 1,510,552
10-14 2,167,399 518,737 1,648,662 2,079,006 498,213 1,580,793
15-19 2,213,679 479,925 1,733,754 2,108,036 461,241 1,646,795
20-24 2,283,875 457,978 1,825,897 2,201,813 426,484 1,775,329
25-29 2,264,757 452,169 1,812,588 2,213,373 402,335 1,811,038
30-34 2,231,190 462,002 1,769,188 2,219,532 417,497 1,802,035
35-39 2,082,943 447,412 1,635,531 2,080,269 410,821 1,669,448
40-44 2,082,965 408,338 1,674,627 2,108,416 377,189 1,731,227
45-49 2,121,859 338,606 1,783,253 2,164,212 309,080 1,855,132
50-54 2,235,817 272,717 1,963,100 2,315,551 253,400 2,062,151
55-59 2,125,649 214,006 1,911,643 2,241,116 204,063 2,037,053
60-64 1,774,534 152,455 1,622,079 1,924,382 150,220 1,774,162
65-69 1,379,716 101,356 1,278,360 1,554,698 109,150 1,445,548
70-74 950,792 61,141 889,651 1,149,405 72,847 1,076,558
75-79 662,791 40,522 622,269 870,055 51,010 819,045
80-84 458,276 25,193 433,083 686,088 35,214 650,874
85+ 419,450 20,565 398,885 867,316 31,813 835,503
Total 31,593,824 5,484,846 26,108,978 32,755,288 5,209,627 27,545,661
Hispanic Non-HispanicAge
Cook FemalesMales
Total Population Hispanic Non-HispanicTotal Population
<1 176,518 56,777 119,741 169,723 54,991 114,732
1-4 680,350 233,966 446,384 654,480 225,704 428,776
5-9 830,322 308,665 521,657 805,055 297,775 507,280
10-14 824,168 296,834 527,334 798,961 285,970 512,991
15-19 834,352 275,120 559,232 812,861 267,323 545,538
20-24 901,962 271,542 630,420 913,734 258,862 654,872
25-29 1,083,183 282,007 801,176 1,101,156 258,421 842,735
30-34 1,034,345 284,880 749,465 1,047,699 260,949 786,750
35-39 902,968 271,242 631,726 911,205 251,210 659,995
40-44 852,875 248,871 604,004 875,222 229,648 645,574
45-49 830,006 208,067 621,939 858,136 191,508 666,628
50-54 846,509 170,552 675,957 897,980 162,628 735,352
55-59 808,310 139,331 668,979 884,040 136,155 747,885
60-64 667,119 102,484 564,635 761,186 102,828 658,358
65-69 511,822 68,922 442,900 608,648 75,216 533,432
70-74 346,103 41,736 304,367 450,188 51,055 399,133
75-79 244,248 27,877 216,371 345,484 36,043 309,441
80-84 172,060 17,393 154,667 270,268 24,635 245,633
85+ 162,502 14,246 148,256 342,867 22,078 320,789
Total 12,709,722 3,320,512 9,389,210 13,508,893 3,192,999 10,315,894
Hispanic Non-HispanicAge
DuPage FemalesMales
Total Population Hispanic Non-HispanicTotal Population
<1 27,224 5,925 21,299 26,236 5,785 20,451
1-4 114,276 25,142 89,134 109,893 24,870 85,023
5-9 152,932 34,356 118,576 146,451 33,550 112,901
10-14 162,020 32,581 129,439 155,359 31,285 124,074
15-19 164,344 29,661 134,683 156,104 28,379 127,725
20-24 148,640 26,868 121,772 140,875 23,938 116,937
25-29 149,661 27,620 122,041 142,172 22,832 119,340
30-34 151,995 28,192 123,803 150,594 24,878 125,716
35-39 147,650 27,646 120,004 148,547 25,419 123,128
40-44 150,784 24,557 126,227 157,271 24,102 133,169
45-49 162,615 21,366 141,249 171,940 19,816 152,124
50-54 174,651 16,768 157,883 187,610 15,993 171,617
55-59 167,002 12,113 154,889 177,986 11,882 166,104
60-64 137,223 8,092 129,131 146,619 8,009 138,610
65-69 103,878 5,014 98,864 114,178 5,806 108,372
70-74 68,150 2,902 65,248 79,940 3,600 76,340
75-79 43,839 1,992 41,847 55,850 2,435 53,415
80-84 29,532 1,179 28,353 44,820 1,685 43,135
85+ 28,297 979 27,318 60,117 1,724 58,393
Total 2,284,713 332,953 1,951,760 2,372,562 315,988 2,056,574
A - 37

Total five-year population, 2012-2016, used to calculate rates. SOURCE: U.S. Census Bureau's Population Estimates Program
Hispanic Non-HispanicAge
Kane FemalesMales
Total Population Hispanic Non-HispanicTotal Population
<1 17,315 7,862 9,453 16,439 7,576 8,863
1-4 72,927 32,205 40,722 71,101 31,997 39,104
5-9 102,497 45,501 56,996 98,947 44,450 54,497
10-14 107,383 44,591 62,792 102,204 42,846 59,358
15-19 100,563 38,737 61,826 94,743 37,404 57,339
20-24 84,679 34,515 50,164 80,140 32,070 48,070
25-29 78,349 32,089 46,260 75,469 29,141 46,328
30-34 86,505 34,511 51,994 84,944 31,427 53,517
35-39 89,802 35,896 53,906 89,292 32,896 56,396
40-44 93,949 32,143 61,806 94,627 30,330 64,297
45-49 95,031 26,063 68,968 94,319 23,370 70,949
50-54 94,511 20,335 74,176 94,595 17,759 76,836
55-59 83,083 14,729 68,354 84,216 13,723 70,493
60-64 67,742 9,936 57,806 71,749 9,627 62,122
65-69 51,749 6,702 45,047 57,176 6,768 50,408
70-74 34,221 3,986 30,235 40,428 4,374 36,054
75-79 22,671 2,436 20,235 27,592 2,878 24,714
80-84 14,346 1,329 13,017 20,806 1,742 19,064
85+ 12,508 1,046 11,462 24,727 1,532 23,195
Total 1,309,831 424,612 885,219 1,323,514 401,910 921,604
Hispanic Non-HispanicAge
Lake FemalesMales
Total Population Hispanic Non-HispanicTotal Population
<1 20,102 6,977 13,125 19,140 6,702 12,438
1-4 88,814 29,391 59,423 84,393 28,567 55,826
5-9 126,023 39,717 86,306 120,312 38,506 81,806
10-14 138,181 39,438 98,743 131,024 37,343 93,681
15-19 148,559 37,186 111,373 130,953 34,059 96,894
20-24 133,493 32,781 100,712 109,238 28,786 80,452
25-29 98,963 27,856 71,107 90,260 24,618 65,642
30-34 99,959 29,143 70,816 100,321 27,267 73,054
35-39 105,863 29,963 75,900 110,265 28,875 81,390
40-44 117,945 28,225 89,720 122,155 26,859 95,296
45-49 128,387 23,936 104,451 133,584 21,988 111,596
50-54 136,379 18,939 117,440 141,855 17,377 124,478
55-59 124,279 13,309 110,970 128,075 12,169 115,906
60-64 97,545 8,510 89,035 101,534 8,241 93,293
65-69 73,170 5,415 67,755 78,079 5,756 72,323
70-74 47,888 2,952 44,936 54,346 3,477 50,869
75-79 30,945 2,055 28,890 38,766 2,348 36,418
80-84 21,317 1,150 20,167 30,370 1,547 28,823
85+ 20,508 796 19,712 38,031 1,408 36,623
Total 1,758,320 377,739 1,380,581 1,762,701 355,893 1,406,808
Hispanic Non-HispanicAge
Will FemalesMales
Total Population Hispanic Non-HispanicTotal Population
<1 19,946 4,920 15,026 19,125 4,841 14,284
1-4 88,072 21,004 67,068 84,333 20,494 63,839
5-9 129,063 30,394 98,669 123,942 29,752 94,190
10-14 143,236 31,516 111,720 136,056 29,727 106,329
15-19 136,941 28,789 108,152 126,835 26,978 99,857
20-24 112,241 24,021 88,220 104,490 22,153 82,337
25-29 95,560 20,648 74,912 90,966 18,934 72,032
30-34 104,273 22,424 81,849 106,994 20,737 86,257
35-39 114,355 23,771 90,584 119,207 22,662 96,545
40-44 129,849 22,957 106,892 133,161 21,824 111,337
45-49 134,183 19,095 115,088 135,793 17,271 118,522
50-54 129,588 13,964 115,624 129,439 12,629 116,810
55-59 110,207 9,991 100,216 111,138 8,846 102,292
60-64 85,151 6,421 78,730 89,274 6,207 83,067
65-69 65,853 4,211 61,642 72,629 4,502 68,127
70-74 44,350 2,714 41,636 50,913 2,989 47,924
75-79 28,084 1,643 26,441 35,837 2,147 33,690
80-84 17,727 1,061 16,666 25,502 1,570 23,932
85+ 14,406 837 13,569 29,686 1,177 28,509
Total 1,703,085 290,381 1,412,704 1,725,320 275,440 1,449,880
A - 38

B-1
APPENDIX B
ISCR County Cancer Site Groups

B-2
ISCR cancer site groups used in county tables
SEER site recodes
1 oral cavity & pharynx 2 esophagus 3 stomach 4 colorectal 5 liver 6 pancreas 7 lung & bronchus 8 bone 9 melanoma of skin 10 breast-invasive 11 cervix 12 uterus 13 ovary 14 prostate 15 testis 16 urinary bladder 17 kidney & renal pelvis 18 brain & CNS 19 Hodgkin's lymphoma 20 non-Hodgkin's lymphoma 21 myeloma 22 leukemia 23 all other sites 24 breast in situ
20010-20100 21010 21020 21041-21052 21071 21100 22030 23000 25010 26000 (behavior 3 only) 27010 27020-27030 27040 28010 28020 29010 29020 31010-31040 33011-33012 33041-33042 34000 35011-35043 21030, 21060, 21072, 21080, 21090, 21110, 21120, 21130, 22010, 22020, 22050, 22060, 24000, 25020, 27050, 27060, 27070 28030, 28040, 29030, 29040, 30000, 32010, 32020, 36010, 36020, 37000 26000 (behavior 2 only)

C-1
APPENDIX C
Formulas for Rates

C-2
Appendix C – formulas for rates Age-Adjusted Rate
An age-adjusted rate is a weighted average of crude rates, where the crude rates are calculated for different age groups and the weights are the proportions of persons in the corresponding age groups of a standard population. The standard populations used for this report is the U.S. populations 2000. The age-adjusted rate for an age group comprised of the ages x through y is calculated using the following formula:
yxaarate =
y
xiy
xjj
i
i
i
stdmil
stdmil
pop
count000,100
where counti is the number of cases for the ith age group, popi is the relevant population for the same age group, and stdmili is the standard population for the same age group.
Standard Error for an Age-Adjusted Rate
This calculation assumes that the cancer counts have Poisson distributions. Suppose that the age-adjusted rate is comprised of age groups x through y.
SEAArate = 000,100
21
2
2
y
xi i
iy
xjj
i
population
count
stdmil
stdmil
Age-Adjusted Rate Confidence Intervals Suppose that the age-adjusted rate is comprised of age groups x through y, and let:
iw =
y
xjji
i
stdmilpop
stdmil
v =
y
xiii countw2

C-3
The endpoints of a p × 100% confidence interval are calculated as:
lowCI =
000,1002
,22
2
v
ratepChiInv
rate
v
highCI = 000,100)2(
,2
12
2
v
ratepChiInv
rate
v
This method for calculating the confidence interval was initially developed by Fay and Feuer (1997) and further modified by Tiwari et al. (2006) on the algorithm for the upper confidence limit. The method produces similar confidence limits to the standard normal approximation when the counts are large and the population being studies is similar to the standard population. In other cases, the above method is more likely to ensure proper coverage. References: Johnson NL, Kotz S. Distributions in Statistics: Discrete Distributions. Johns Wiley, New York, 1969. Fay MP, Feuer EJ. Confidence intervals for directly standardized rates: method based on the gamma distribution. Statistics in Medicine 1997 Apr 15;16(7):791-801. Tiwari RC, Clegg LX, Zou Z. Efficient interval estimation for age-adjusted cancer rates. Stat Methods Med Res 2006 Dec;15(6):547-69.