illinois revenue volatility study - illinois general...
TRANSCRIPT

Illinois Revenue Volatility Study
Public Act 98 - 0682
As Presented by
Commission on Government Forecasting and Accountability
December 31, 2014

Commission on Government Forecasting and Accountability
COMMISSION CO-CHAIRMEN
Senator Michael Frerichs Representative Jil Tracy
SENATE HOUSE
David Koehler Kelly Burke Matt Murphy Elaine Nekritz Chapin Rose Raymond Poe
David Syverson Al Riley Donne Trotter Michael Tryon
EXECUTIVE DIRECTOR
Dan R. Long
DEPUTY DIRECTOR Laurie L. Eby
REVENUE MANAGER
Jim Muschinske
AUTHORS OF REPORT Eric Noggle Lynnae Kapp
Ben Varner Anthony Bolton
EXECUTIVE ASSISTANT
Donna Belknap

Illinois Revenue Volatility Study
Updated February 17, 2015
TABLE OF CONTENTS
Page Introduction 1 Research on Tax Volatility 2 History of Illinois’ Cash Receipts from State Sources 6 An Examination of the Volatility of Illinois’ Tax Revenues 10 Summary of Volatility by Fiscal Year (FY 1990 – FY 2014) 13 Volatility by Source Analyses 21 A Closer Look at the Big Three 55 A Closer Look at Federal Sources 68 Comparison of Different States’ Rainy Day Funds 71 Illinois’ Current Rainy Day Fund 83 An Examination of Deposit Mechanism Options 90 Analysis of How the Options Would Have Performed Historically in Illinois 95 Analysis of How the Options Would Perform Based on Most Recent Revenue Forecast 98 Final Thoughts on Deposit Mechanisms 99 Policy Road Map 101 Appendix I: Deposit Mechanism Scenarios 106 Appendix II: Budget Stabilization Act and Budget Stabilization Fund Legislation 112 Appendix III: Draft NCSL Fiscal Brief on Rainy Day Funds (Appendix A) 120

1
Introduction
On June 30, 2014, Governor Quinn signed into law P.A. 98-0682. A major component of this Public Act was the creation of the Illinois Revenue Volatility Study Act. Under this Act, the Commission on Government Forecasting and Accountability is charged with conducting a study of the volatility of the sources of general revenue funds collected by the State of Illinois. The Act states that the study shall include, but is not limited to:
1) An examination of Illinois’ tax base and tax revenue volatility; 2) The identification of economic variables that may influence the volatility of tax revenue; 3) An analysis of the adequacy of the balances in the Budget Stabilization Fund in relation to
the volatility of tax revenues; and 4) An examination of options for a deposit mechanism linked to one or more tax sources on the
basis of each tax source’s observed volatility, including; a. An analysis of how the options would have performed historically within Illinois;
and b. An analysis of how the options would likely perform based on the most recent
revenue forecast.
In response, the Commission is submitting the following report. It includes an examination of the volatility of Illinois’ general funds revenues, which is examined on both a fiscal year basis and on an individual source basis. The report then takes a closer look at the “big three” revenue sources (personal income tax, corporate income tax, sales tax) due to the significant influence that these sources have on the overall volatility of revenues to general funds.
The study then provides information regarding Illinois’ current Budget Stabilization Fund and how Illinois differs from other states in the implementation of rainy day funds. The report follows with an examination of deposit mechanism options for a rainy day fund in Illinois. Here, the Commission provides an analysis of how certain rainy day fund options would have performed if they had been put into effect over the past few decades. Also included is an estimate of how these deposit mechanism options would perform based on the Commission’s most recent revenue forecast.
However, before these various items specific to the legislation are addressed, the report opens with an examination of various studies that have been conducted on tax volatility over the years, and when appropriate, highlights information specific to Illinois.

2
Research on Tax Volatility
Research on the topic of state tax revenue variability has been conducted for decades. One of the earliest studies undertaken was by Groves and Kahn in 1952. From the 1950’s through the 1980’s, researchers studied tax revenues and defined them as either stable or unstable. In general, income taxes were seen as more unstable than sales taxes. Researchers also came to recognize the difference between the long-term growth of individual tax sources and the more short-term, business cycle related effects on tax collections. They also came to believe that there was a trade-off between growth and variability. Revenue from tax sources with higher growth rates were likely to have higher rates of variability and vice versa.
In 1991, Dye and McGuire studied the variability and growth rates of components of the sales tax base. One of the surprising things they found was that a broad-based sales tax had similar growth rates as a more narrow sales tax base but with less volatility. The narrow sales tax base excluded food and most services which would be similar to the current Illinois sales tax base. In the same study they observed that household income became more variable as total income increased which indicates that more progressive income tax rates would introduce more variability to the personal income tax revenue source. They also showed that a narrow sales tax could be more variable than a flat income tax which was counter to previous thinking.
Sobel and Holcombe (1996) used new methodologies to estimate the short-run elasticities of various tax revenue sources in 1996. They found that the corporate income tax was by far the most variable over the business cycle at 3.369. This means that a one percent change in income leads to a 3.369% change in corporate income tax. Personal income tax (1.229) and retail sales including food (1.229) were about the same. Not including food sales in the sales tax base increased the short term elasticity to 1.612. Motor fuels usage was least affected by the business cycle at 0.729.
Short-Run Elasticities of Major State Tax Bases Tax Base Short-Run Elasticity
Personal Taxable Income 1.164 Corporate Taxable Income 3.369
Retail Sales 1.229 Nonfood Retail Sales 1.612 Motor Fuels Usage 0.729
Source: Sobel & Holcombe (1996)
The next year the same researchers (Holcombe and Sobel, 1997) looked at short-term elasticities of the individual states for the income tax base and the sales tax base. Illinois had short-term elasticities that were higher than the U.S. average. The short-term elasticity for the individual income tax was 1.581 which was higher than the U.S. average of 1.092. The retail sales tax base including food was 1.231, while the retail sales tax base excluding food was at 1.471. Similar to the income tax base, these were

3
both higher than the U.S. average of 0.967 and 1.076. This would indicate that Illinois’ main tax revenue sources were somewhat more volatile than the U.S. average over the study period.
In a special report in the August 25, 2003 edition of State Tax Notes, Sobel and Wagner (2003) put together a summary of the research on tax variability and provided some suggestions for policymakers related to the topic. The first point the two researchers made was that for a state that currently has both an individual income tax and a retail sales tax that includes food, shifting the reliance more heavily toward one and away from the other will not have a significant impact on overall revenue variability.
The second point they made was that by including food in the sales tax base, it could reduce variability of sales tax revenue. As Illinois currently taxes food sales at a reduced rate of 1%, this is one way the state could reduce the variability of the sales tax. One argument against this practice is the progressivity of the sales tax but current federal law does not allow for taxation of items purchased with food stamps, so this somewhat mitigates the progressivity effects of taxing food sales.
They also point out that variability increases with income level. Thus, the more progressive a state’s income tax is, the more heavily it will rely on taxing in the higher income brackets, and thus, the more variable its total income tax revenue will be. Using U.S. averages of short term elasticity of personal income taxes, they estimated that by moving from a progressive income tax system to a flat income tax system, states could lower their short-term elasticity from 1.14 to 0.87. Illinois already has a flat income tax but this shows how variability could increase if a progressive income tax was introduced.
Sobel and Wagoner had three suggestions for policymakers related to weathering economic downturns:
1) Policymakers can “broaden” tax bases by reducing or eliminating exemptions, especially the food exemption for the sales tax.
2) Personal income variability increases significantly at higher levels of income, therefore, states can generate a more stable personal income tax stream by reducing/eliminating exemptions and relying on a less progressive tax structure [which Illinois’ flat tax already does].
3) Strategically align program expenditures with revenue source variability. Have programs that are difficult to reduce in the short-term funded by reliable revenue streams. Have programs that are more easily cut back in times of recession funded by revenue sources with higher levels of volatility.
A 2008 study (Felix, 2008) conducted on the states in the Tenth Federal Reserve District, which includes Colorado, Kansas, Nebraska, Oklahoma, Wyoming, the western third of Missouri and the northern half of New Mexico, found that general and selective sales taxes were less volatile than personal income taxes, corporate income taxes, and severance taxes. The personal income tax had the highest level of growth of these taxes, while the corporate income tax added the most volatility while providing limited growth.

4
In 2010, researchers at the Federal Reserve Bank of St. Louis (Cornia and Nelson, 2010) looked at State tax revenue growth and volatility. In their paper they highlighted a state level economic index developed by the Federal Reserve Bank of Philadelphia as being helpful in providing insight for anticipating future state tax revenue. The State Coincident Index is based on four factors that are collapsed into one statistic. This methodology uses the following variables to assess state level economic activity:
nonfarm payroll employment average hours worked in manufacturing the unemployment rate, and real wage and salary disbursements
These variables would also be indicators for the volatility of tax revenues that are based on economic factors such as the personal income tax, the corporate income tax, and the sales tax.
The researchers used this index to compare state economic growth to state tax revenue growth. They found that while economic growth and state tax revenue had similar average growth rates, tax revenues had a higher level of volatility. They found that tax revenues tended to skew negative which means that there were more years where tax revenues came in well below the norm (an outlier) than when compared to the economy as a whole. They concluded that due to the higher level of volatility in tax revenue, state budgets are very exposed and susceptible to potential economic downturns.
Cornia and Nelson also looked at the volatility of individual taxes. Similar to Sobel and Wagoner, they found that the corporate income tax had a very high level of volatility, while the motor fuel and alcohol related taxes had low levels of volatility. Unlike Sobel and Wagoner, Cornia and Nelson’s study determined that the individual income tax had both higher levels of growth and volatility when compared to sales taxes. This difference between the two studies may be due to differences in methodology or the fact that this study used more current data which may have shown some change in the tax collection dynamic that was previously not present. This difference could indicate that more reliance on the sales tax in Illinois could lower the volatility of state tax revenues though at the cost of lower growth as a consequence.
The researchers recommended that states use a diversified portfolio of tax revenue sources to obtain higher levels of growth, while limiting volatility. They ranked each state’s tax revenue portfolio using the Herfindahl-Hirshman Index which can be used to measure the diversification of a tax revenue portfolio. Based on this analysis, Illinois had the 15th most diversified tax revenue portfolio in 2008.
Looking at quarterly tax revenue between 1995 and 2009, Cornia and Nelson found that Illinois actually performed quite well when growth rates and volatility were considered. During that period, Illinois was middle of the pack at 29th for tax revenue growth but was the 9th lowest state for volatility. This would indicate that Illinois’ tax revenue grew somewhere near the median of States but faced volatility that would be more associated with a lower level of growth. In fact, when looking at individual state tax revenue collections, Illinois was part of the High Growth, Low Volatility quadrant which is the

5
most desired situation and in complete opposite of its state economy rating which was in the Low Growth, High Volatility quadrant.
Work done by economists at the Federal Reserve Bank of Chicago in 2012 indicates that state tax revenue volatility has increased since 2000 (McGranahan and Matton, 2012). Comparing aggregate state tax revenue to the previously discussed Coincident Index for the United States, they found that swings in tax revenue have increased since 2000. They found that changes in income tax collection patterns were primarily the reason for this increased volatility. They discovered that while wage and income levels matched the patterns of the overall economy, investment income experienced dramatic swings. In the 1980’s and 1990’s, investment income tracked the overall economy but beginning around 2000, it began to see large spikes in both the positive and negative direction.
The economists believed that many factors were potentially responsible for this change. The first factor responsible for the more pronounced swing in investment income was multiple declines in the overall economy. During this time period, two recessions occurred which would obviously affect investment income. The second reason cited was the change in capital gains tax policy as part of the Jobs and Growth Tax Relief Reconciliation Act of 2003 which potentially influenced an investor’s decision making process concerning when to take gains and in what amount.
Another explanation put forth for the increase in volatility of income tax revenue was a broader change in income tax policy by state governments during the business cycle. During the 1980’s and early 1990’s, state governments raised income tax rates during economic downturns to presumably make up for declines in overall tax revenue. These rates were then lowered during more stable economic times. However, since the mid-1990’s, states have essentially left income tax rates at the same level, no matter the economic conditions. Obviously, this pattern has not held in Illinois as seen in the recent temporary increase in income tax rates, but it does show a general change in tax policy over the last twenty years that has gone away from changing the income tax rates as the business climate changes. These changes may explain the differences that Cornia and Nelson found from previous studies in 2010.

6
History of Illinois’ Cash Receipts from State Sources
The following table displays a 25-year history of Illinois’ general funds revenues from State sources since FY 1990 as reported by the Comptroller in their Annual Traditional Budgetary Financial Reports. Some of the revenue sources are shown individually, while others are grouped into categories due to their relatively small amounts. The Other State Sources category includes the following sources that deposit revenues into General Funds: public utility taxes, cigarette tax, liquor tax, vehicle use tax, inheritance tax, insurance taxes, corporate franchise tax, interest on State funds and investments, Cook County Intergovernmental Transfer, and all other State tax sources. The “Transfers” category includes general funds revenue from the Lottery, the Gaming Fund Transfer, and other transfers.
This table is presented in a similar format in which the Commission has historically displayed general funds revenues in its numerous publications. The State sources are added to State transfers to equal “Total State Sources”. The “General Funds Subtotal”, which is the figure most often referred to when discussing overall revenues adds federal sources to Total State Sources, but also subtracts nongeneral funds distributions (amounts of the income tax set aside to the refund fund). The category “Total General Funds” includes cash-flow instruments, such as short-term borrowing and fund transfers. Most of the analyses in this study will focus on the General Funds Subtotal, as this is the “base” revenue figure for which the State of Illinois’ budget is predicated upon [shaded in black].
Personal Income
Tax
Corporate Income
Tax Sales Tax
Other State
SourcesState
TransfersTotal State
SourcesFederal Sources
Nongeneral Funds
Distribution
General Funds
Subtotal
Borrowing & Fund
Transfers
Total General Funds
FY 1990 $4,524 $755 $3,827 $1,767 $793 $11,666 $1,902 -$728 $12,841 $0 $12,841FY 1991 $4,795 $761 $3,863 $1,753 $771 $11,943 $2,054 -$736 $13,261 $0 $13,261FY 1992 $4,901 $776 $3,986 $1,853 $904 $12,419 $2,235 -$622 $14,031 $185 $14,216FY 1993 $5,143 $851 $4,094 $1,933 $781 $12,802 $2,646 -$699 $14,749 $300 $15,049FY 1994 $5,393 $931 $4,371 $2,037 $786 $13,518 $2,690 -$622 $15,586 $600 $16,186FY 1995 $5,710 $1,103 $4,651 $2,096 $926 $14,486 $3,098 -$582 $17,002 $300 $17,302FY 1996 $6,070 $1,208 $4,798 $2,026 $1,126 $15,228 $3,339 -$631 $17,936 $200 $18,136FY 1997 $6,551 $1,361 $4,992 $2,285 $1,084 $16,274 $3,269 -$689 $18,854 $0 $18,854FY 1998 $7,268 $1,402 $5,274 $2,327 $1,076 $17,347 $3,323 -$688 $19,982 $0 $19,982FY 1999 $7,778 $1,385 $5,609 $2,809 $1,191 $18,772 $3,718 -$815 $21,674 $0 $21,674FY 2000 $8,273 $1,527 $6,027 $3,049 $1,359 $20,236 $3,891 -$878 $23,249 $0 $23,249FY 2001 $8,607 $1,279 $5,958 $3,383 $1,413 $20,640 $4,320 -$854 $24,106 $0 $24,106FY 2002 $8,086 $1,043 $6,051 $3,317 $1,479 $19,976 $4,258 -$854 $23,379 $226 $23,605FY 2003 $7,979 $1,012 $6,059 $3,025 $1,683 $19,758 $3,940 -$911 $22,786 $2,201 $24,987FY 2004 $8,235 $1,419 $6,331 $3,310 $2,390 $21,685 $5,189 -$1,446 $25,428 $1,621 $27,049FY 2005 $8,872 $1,548 $6,595 $3,492 $2,231 $22,739 $4,691 -$1,270 $26,160 $2,023 $28,183FY 2006 $9,568 $1,784 $7,092 $3,374 $2,105 $23,923 $4,725 -$1,290 $27,359 $1,276 $28,635FY 2007 $10,425 $2,121 $7,136 $3,397 $2,246 $25,324 $4,703 -$1,388 $28,640 $1,632 $30,272FY 2008 $11,186 $2,201 $7,215 $3,549 $1,900 $26,052 $4,815 -$1,208 $29,659 $4,179 $33,838FY 2009 $10,219 $2,073 $6,773 $3,278 $1,593 $23,936 $6,567 -$1,359 $29,144 $2,976 $32,120FY 2010 $9,430 $1,649 $6,308 $3,107 $1,884 $22,378 $5,920 -$1,208 $27,090 $3,239 $30,329FY 2011 $12,301 $2,277 $6,833 $3,011 $2,182 $26,604 $5,386 -$1,502 $30,488 $3,309 $33,797FY 2012 $17,000 $2,983 $7,226 $3,051 $1,865 $32,125 $3,682 -$2,010 $33,797 $275 $34,072FY 2013 $18,324 $3,679 $7,355 $3,151 $1,689 $34,198 $4,154 -$2,288 $36,064 $539 $36,603FY 2014 $18,388 $3,640 $7,676 $3,230 $2,102 $35,037 $3,903 -$2,221 $36,718 $325 $37,043
25-Year Summary of General Funds Revenues - FY 1990 - FY 2014$ in millions

7
Below is a graph illustrating how State revenues to general funds have fluctuated since FY 1990. This chart focuses on the State Sources, and is broken down into four categories: Net Income Tax (gross income taxes less amounts to refund fund), Sales Tax, Other State Sources, and State Transfers. It does not include federal sources, short-term borrowing, and other cash flow tools. The chart also highlights the fiscal years that occurred during a recession, which shows the impact that downturns in the economy can have on State revenues. This downturn was especially noticeable during and immediately after the “Great Recession”, which officially lasted from December 2007 – June 2009.
The graph above illustrates how the income taxes are the primary revenue producer of the State sources. The income taxes’ composition of State Sources ranged between 41% and 49% for the period FY 1990-FY 2010. After the income tax rates were increased in Tax Year 2011, this composition increased to between 60% and 62%. The impact of the income tax increase can be seen in the above graph, starting with FY 2011.
Sales tax revenues are the next largest source of State revenues. Before the income tax increase, sales tax revenues generally represented 30% to 35% of State sources. After the increase, the composition has been lowered to near 25% of the total. The remaining State taxes generally made up 14% to 17% of revenue before the tax increase and near 10% after the tax increase. State Transfers makes up the remainder with 7% to 12% before the tax increase and around 5% to 8% after the tax hike
A graph depicting the composition of these State sources is shown on the following page.
$0
$5,000
$10,000
$15,000
$20,000
$25,000
$30,000
$35,000
FY1990
FY1991
FY1992
FY1993
FY1994
FY1995
FY1996
FY1997
FY1998
FY1999
FY2000
FY2001
FY2002
FY2003
FY2004
FY2005
FY2006
FY2007
FY2008
FY2009
FY2010
FY2011
FY2012
FY2013
FY2014
Fiscal Year
25-Year History of State Sources to General Funds Revenues [Excludes Federal Sources, Short-Term Borrowing, and Other Cash Flow Tools]
($ in millions)
Income Taxes (Net of Refunds)
Sales Tax Other State Sources State Transfers
= Times of Recessions

8
For the next two graphs, general funds revenues from federal sources are added to the State sources. Again, combined these two subsets make up the general funds “base” that is often referred to in budget discussions.
0%
10%
20%
30%
40%
50%
60%
70%
80%
90%
100%
FY1990
FY1991
FY1992
FY1993
FY1994
FY1995
FY1996
FY1997
FY1998
FY1999
FY2000
FY2001
FY2002
FY2003
FY2004
FY2005
FY2006
FY2007
FY2008
FY2009
FY2010
FY2011
FY2012
FY2013
FY2014
Fiscal Year
25-Year Composition of State Sources to General Funds Revenues [Excludes Federal Sources, Short-Term Borrowing, and Other Cash Flow Tools]
($ in millions)
Income Taxes (Net of Refunds)
Sales Tax Other State Sources State Transfers
$0
$5,000
$10,000
$15,000
$20,000
$25,000
$30,000
$35,000
$40,000
FY1990
FY1991
FY1992
FY1993
FY1994
FY1995
FY1996
FY1997
FY1998
FY1999
FY2000
FY2001
FY2002
FY2003
FY2004
FY2005
FY2006
FY2007
FY2008
FY2009
FY2010
FY2011
FY2012
FY2013
FY2014
Fiscal Year
25-Year History of General Funds Revenues[Excludes Short-Term Borrowing, and Other Cash Flow Tools]
($ in millions)
Income Taxes (Net of Refunds)
Sales Tax Other State Sources State Transfers Federal Sources
= Times of Recessions

9
As shown, even with federal sources added to the dataset, income taxes continue be the primary sources of General Funds’ base revenues. In the last year before the impact of the income tax increases were felt, income taxes made up 36% of the General Funds’ base total, sales tax made up 23%, federal sources contributed 23%, other State taxes 11%, and State transfers the remaining 5%. In FY 2014, including the impact of the income tax increase, income taxes made up 54% of the total, sales tax 21%, federal sources 11%, other State taxes 9%, and State transfers 6%.
While Federal Source’s composition average was 17% over the last twenty-five years, its percentage of the total can fluctuate greatly from year to year. In FY 2009, with the release of federal stimulus money to assist states during the economic downturn, federal sources’ composition rose to 23%. But often, as was the case in FY 2009, these revenues cannot be guaranteed from one year to the next, which is why the composition rate for federal sources was at 16% the year prior. Discussions regarding the volatility of federal sources, as well as the volatility of all sources to General Funds, are included in the following sections.
0%
10%
20%
30%
40%
50%
60%
70%
80%
90%
100%
FY1990
FY1991
FY1992
FY1993
FY1994
FY1995
FY1996
FY1997
FY1998
FY1999
FY2000
FY2001
FY2002
FY2003
FY2004
FY2005
FY2006
FY2007
FY2008
FY2009
FY2010
FY2011
FY2012
FY2013
FY2014
Fiscal Year
25-Year Composition of General Funds Revenues[Excludes Short-Term Borrowing, and Other Cash Flow Tools]
($ in millions)
Income Taxes (Net of Refunds)
Sales Tax Other State Sources State Transfers Federal Sources

10
An Examination of the Volatility of Illinois’ Tax Revenues In P.A. 98-0682, as part of the volatility study, the language states that the Commission’s study shall include:
(1) An examination of Illinois’ tax base and tax revenue volatility; (2) The identification of economic variables that may influence the volatility of tax revenue.
The previous section provided an initial look at General Funds’ revenues over the past 25 years. The following section takes this analysis one step further by examining the volatility of these revenues, as directed by the public act.
From year to year, there are often wide variances of volatility between the State’s revenue sources. Sometimes, this volatility is simply due to changes in the tax structure of a revenue source (rate changes, distribution modifications, etc.) For example, the liquor tax is, for the most part, a relatively stable revenue source. But since FY 2000, this source has twice experienced increases over 15%. On both occasions, the increase was due to a tax rate increase on alcoholic beverages. Other times the volatility is due to changes in factors that influence the amount of revenues collected from a particular source, such as economic variability. For example, the sales tax rate has not changed since FY 2000, but its growth rate has ranged from -6.9% in FY 2010 to as high as 8.3% in FY 2011. These highs and lows coincided with the behavior of the nation’s economy as a result of the “Great Recession”. And then there are occasions where these separate factors comingle creating more pronounced volatility. An example of this was recently experienced in the personal income tax. In FY 2011 and FY 2012, revenues from the personal income tax (net of refunds) grew 30.4% and 38.2% respectively. Much of this increase was due to the increase in the personal income tax rate from 3% to 5%. However, the Commission estimates that base growth increased 4.0% and 3.6% in these years, which also contributed to the $2.9 billion and $4.7 billion in year-over-year growth for these fiscal years. This base growth was due to an improvement in income related factors influenced by the recovery phase of the nation’s economy, such as employment and wages. One way of analyzing the volatility of Illinois’ revenue sources is to look at the average year-over-year change of each revenue source. For the purpose of this study, the Commission analyzed the average change in growth over the last twenty-five years, which encompasses three recessions (July 1990 – March 1991; March 2001 – November 2001; and December 2007 – June 2009) as well as three recovery periods and periods of strong growth. Graphs displaying these average revenue changes are shown on the following page. Included with these graphs are tables identifying the average year-over-year values for a particular source, along with its standard deviation values, and its range of change over the past twenty five years.

11
The graph groups the general fund revenue sources into six categories: personal income tax, corporate income tax, sales tax, all other State sources, transfers, and also includes Federal Sources. For this graph, only the estimated base changes of the income tax revenue sources are shown (3% portion of the recently imposed 5% personal income tax rate and the 4.8% portion of the 7% corporate income tax) so that the base volatility of the source can be seen without the influence of the 2011 tax increases. While numerous observations could be made by looking at this graph, a couple stand out in particular. The first is that over the last twenty-five fiscal years, not surprisingly, most of the growth has come from the three largest revenue sources: the personal income tax, the corporate income tax, and the sales tax. As shown in the composition graphs discussed earlier, revenues from the “big three” made up nearly 80% of the base revenues that go into the State’s General Fund. Factoring in the 2011 income tax increases, this percentage has risen to 84%. (These figures do not include revenues from short-term borrowing and other cash flow transfers). The second notable observation is that the 25-year average shows that Federal Sources has a year-over-year mean change of only $87 million per year. While this value appears small, considering federal sources has totaled over $6.5 billion in a year, a further look shows that this value is very misleading. During this time period, the year-over year change in revenues from Federal Sources has ranged from an increase of $1.752 billion in FY 2009 to a revenue decrease of $1.704 billion in FY 2012. So,
Fiscal YearPersonal Income Tax
(Base Only)Corporate Income Tax (Base Only) Sales Tax
Other State Sources Transfers Federal Sources
Average Year-Over-Year $ Change (FY 1990- FY 2014) $301 $71 $158 $68 $50 $87Standard Deviation (FY 1990 - FY 2014) $463 $188 $239 $184 $240 $631
Largest Year-Over-Year Change (FY 1990 - FY 2014) $857 $407 $525 $482 $707 $1,752Smallest Year-Over-Year Change (FY 1990 - FY 2014) -$967 -$424 -$465 -$292 -$346 -$1,704
Statistics on the Volatility of General Funds Revenue Sources(FY 1990 - FY 2014)
$ in millions
-$2,000
-$1,500
-$1,000
-$500
$0
$500
$1,000
$1,500
$2,000
Personal Income Tax(Base Only)
Corporate Income Tax(Base Only)
Sales Tax Other State Sources Transfers Federal Sources
$
in
millions
Average Year-Over-Year $ Change in General Funds Revenue Sources (FY 1990 - FY 2014)
Average Year-Over-Year $ Change (FY 1990- FY 2014)
For each revenue source, the bar graph displays the average year-over-year change ($ in millions) between FY 1990 and FY 2014. The vertical line in that source displays the
extent of the volatility that has occurred over the last 25 years.

12
while the mean value of $87 million may lead one to think that this revenue source has relatively little revenue fluctuation from year to year, further analyses show that just the opposite is true. In order to better understand this volatility, the previous graph includes, with each revenue source, a vertical line depicting the range of change in revenues over the past twenty-five years. As shown, while Federal Sources has had average growth of only $87 million, its range of growth has varied widely over this time period. In fact, its volatility is significantly more pronounced than the other revenue sources that fund Illinois’ general funds. As shown in the table above the previous graph, the standard deviation of federal sources is higher than the other sources, again showing how volatile this source can be. The Estate Tax (Inheritance Tax) is another source that has a wide variance of year-over-year change. Due to recent changes to its tax structure, the estate tax has seen growth as high as $113 million to a decrease in revenues of $121 million. These figures are included in the “Other State Sources” category of the previous graph. But, as shown, due to its relatively small size, the volatility from the sources in the “Other State Sources” category have very little influence on the volatility of general funds as a whole. While the fluctuation of revenues from the smaller sources should not be discounted from the standpoint of understanding Illinois’ overall revenue volatility, the numbers and the graphs indicate that the State’s volatility is, in essence, influenced by four areas: the “big three” (personal income tax, corporate income tax, sales tax) and federal sources. It is these sources that are the determining factors for the volatility of general funds revenues in a particular year. Federal sources, as discussed earlier, can have wide swings of revenue changes. Their composition of total revenues in recent history has ranged from as low as 11% in FY 2014 to as high as 23% in FY 2009. Because of this, despite having a smaller composition than the “big three” sources, federal sources often can be the “X factor” that determines the extent of the strength or weakness of general funds revenues in a given year (aside from revenue influences from tax rate changes).

13
Summary of Volatility by Fiscal Year (FY 1990-FY 2014)
The following section provides a year-by-year analysis of each fiscal year’s revenues over the last twenty-five years. Each analysis displays a fiscal year’s revenue totals categorized by revenue source, its year-over-year change in revenues, and concludes with a paragraph summarizing the events that helped shaped the amount of revenues collected in that particular fiscal year. The data shown in each fiscal year analysis is based on the data shown on page 6 and the year-over-year change in General Funds Revenues, as shown in the below summary table.
Personal Income
Tax
Corporate Income
Tax Sales Tax
Other State
Sources TransfersTotal State
SourcesFederal Sources
Nongeneral Funds
Distribution
General Funds
Subtotal
Borrowing & Fund
Transfers
Total General Funds
FY 1990 $776 $13 $99 $228 -$69 $1,047 $183 -$522 $708 $0 $708FY 1991 $272 $6 $36 -$14 -$22 $277 $152 -$9 $420 $0 $420FY 1992 $105 $14 $123 $100 $133 $475 $181 $114 $771 $185 $956FY 1993 $243 $76 $108 $80 -$123 $384 $411 -$77 $718 $115 $833FY 1994 $249 $80 $277 $104 $6 $716 $44 $77 $837 $300 $1,137FY 1995 $317 $172 $280 $59 $140 $968 $408 $40 $1,416 -$300 $1,116FY 1996 $360 $105 $147 -$70 $200 $741 $241 -$49 $933 -$100 $833FY 1997 $482 $153 $194 $259 -$42 $1,046 -$70 -$58 $918 -$200 $718FY 1998 $717 $41 $282 $42 -$8 $1,074 $54 $1 $1,129 $0 $1,129FY 1999 $510 -$17 $335 $482 $115 $1,424 $395 -$127 $1,692 $0 $1,692FY 2000 $495 $143 $418 $240 $168 $1,464 $173 -$62 $1,575 $0 $1,575FY 2001 $334 -$248 -$69 $334 $54 $404 $429 $23 $857 $0 $857FY 2002 -$521 -$236 $93 -$66 $66 -$664 -$62 $0 -$727 $226 -$501FY 2003 -$107 -$31 $8 -$292 $204 -$218 -$318 -$57 -$593 $1,975 $1,382FY 2004 $256 $407 $272 $285 $707 $1,927 $1,249 -$535 $2,642 -$580 $2,062FY 2005 $637 $129 $264 $182 -$159 $1,053 -$498 $176 $732 $402 $1,134FY 2006 $695 $236 $497 -$118 -$126 $1,185 $34 -$20 $1,199 -$747 $452FY 2007 $857 $336 $44 $23 $141 $1,401 -$22 -$98 $1,281 $356 $1,637FY 2008 $761 $80 $79 $152 -$346 $727 $112 $179 $1,018 $2,547 $3,565FY 2009 -$967 -$128 -$442 -$271 -$307 -$2,115 $1,752 -$151 -$514 -$1,203 -$1,717FY 2010 -$790 -$424 -$465 -$171 $291 -$1,558 -$647 $151 -$2,054 $263 -$1,791FY 2011 $2,871 $628 $525 -$96 $298 $4,226 -$534 -$294 $3,398 $70 $3,468FY 2012 $4,699 $706 $393 $40 -$317 $5,521 -$1,704 -$508 $3,310 -$3,034 $276FY 2013 $1,324 $696 $129 $100 -$176 $2,073 $472 -$278 $2,267 $264 $2,531FY 2014 $64 -$39 $321 $79 $413 $838 -$251 $66 $653 -$214 $439
Year-Over-Year Change in General Funds Revenues - FY 1990 - FY 2014$ in millions
14
FY 1990 Total State Sources
Federal Sources
Nongeneral Funds
Distribution
Subtotal General Funds
Borrowing & Fund
Transfers
Total General Funds
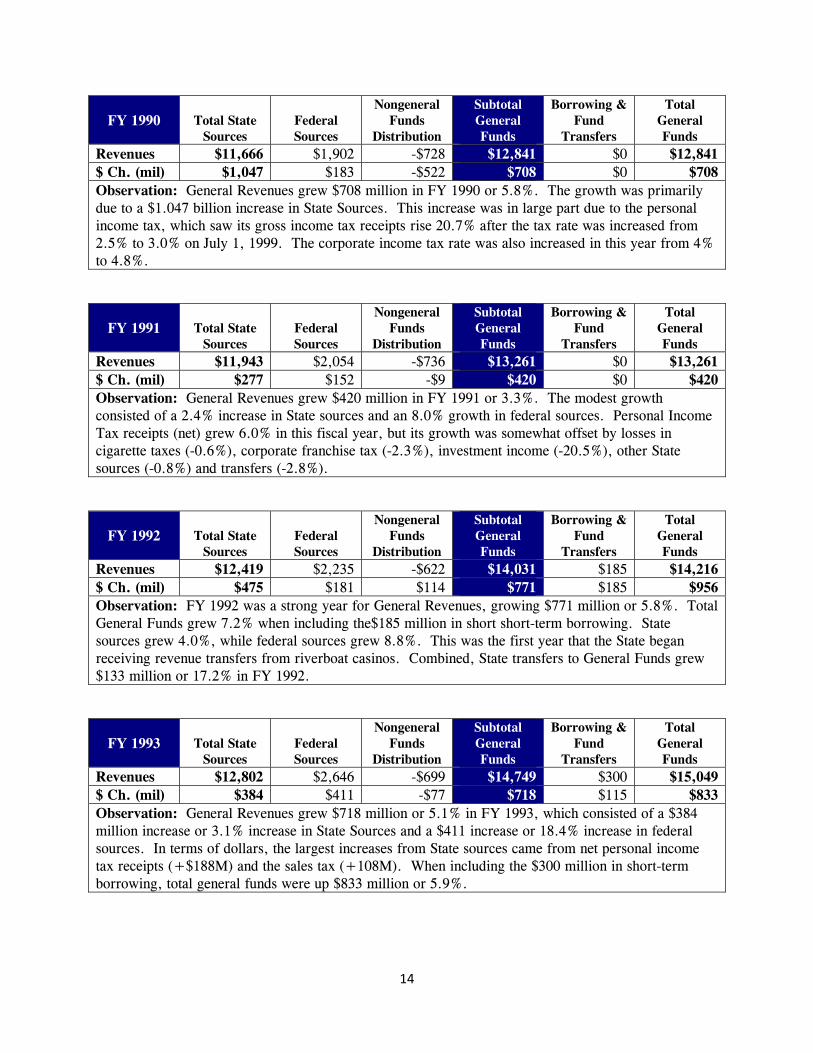
Revenues $11,666 $1,902 -$728 $12,841 $0 $12,841 $ Ch. (mil) $1,047 $183 -$522 $708 $0 $708 Observation: General Revenues grew $708 million in FY 1990 or 5.8%. The growth was primarily due to a $1.047 billion increase in State Sources. This increase was in large part due to the personal income tax, which saw its gross income tax receipts rise 20.7% after the tax rate was increased from 2.5% to 3.0% on July 1, 1999. The corporate income tax rate was also increased in this year from 4% to 4.8%.
FY 1991 Total State Sources
Federal Sources
Nongeneral Funds
Distribution
Subtotal General Funds
Borrowing & Fund
Transfers
Total General Funds
Revenues $11,943 $2,054 -$736 $13,261 $0 $13,261 $ Ch. (mil) $277 $152 -$9 $420 $0 $420 Observation: General Revenues grew $420 million in FY 1991 or 3.3%. The modest growth consisted of a 2.4% increase in State sources and an 8.0% growth in federal sources. Personal Income Tax receipts (net) grew 6.0% in this fiscal year, but its growth was somewhat offset by losses in cigarette taxes (-0.6%), corporate franchise tax (-2.3%), investment income (-20.5%), other State sources (-0.8%) and transfers (-2.8%).
FY 1992 Total State Sources
Federal Sources
Nongeneral Funds
Distribution
Subtotal General Funds
Borrowing & Fund
Transfers
Total General Funds
Revenues $12,419 $2,235 -$622 $14,031 $185 $14,216 $ Ch. (mil) $475 $181 $114 $771 $185 $956 Observation: FY 1992 was a strong year for General Revenues, growing $771 million or 5.8%. Total General Funds grew 7.2% when including the$185 million in short short-term borrowing. State sources grew 4.0%, while federal sources grew 8.8%. This was the first year that the State began receiving revenue transfers from riverboat casinos. Combined, State transfers to General Funds grew $133 million or 17.2% in FY 1992.
FY 1993 Total State Sources
Federal Sources
Nongeneral Funds
Distribution
Subtotal General Funds
Borrowing & Fund
Transfers
Total General Funds
Revenues $12,802 $2,646 -$699 $14,749 $300 $15,049 $ Ch. (mil) $384 $411 -$77 $718 $115 $833 Observation: General Revenues grew $718 million or 5.1% in FY 1993, which consisted of a $384 million increase or 3.1% increase in State Sources and a $411 increase or 18.4% increase in federal sources. In terms of dollars, the largest increases from State sources came from net personal income tax receipts (+$188M) and the sales tax (+108M). When including the $300 million in short-term borrowing, total general funds were up $833 million or 5.9%.

15
FY 1994 Total State Sources
Federal Sources
Nongeneral Funds
Distribution
Subtotal General Funds
Borrowing & Fund
Transfers
Total General Funds
Revenues $13,518 $2,690 -$622 $15,586 $600 $16,186 $ Ch. (mil) $716 $44 $77 $837 $300 $1,137 Observation: General Revenues grew $837 million in FY 1994 or 5.7%. The growth was mostly due to strong increases in the “big three” as personal income tax receipts grew $249 million or 4.8%, corporate tax receipts grew $80 million or 9.4%, and sales tax receipts increased $277 million or 6.8%. Although originally scheduled to fall during this year, the income tax rates for personal and corporate were made permanent on July 1, 1993 allowing this overall growth to materialize. When including the $600 million in short-term borrowing, total general funds were up $1.137 billion or 7.6%.
FY 1995 Total State Sources
Federal Sources
Nongeneral Funds
Distribution
Subtotal General Funds
Borrowing & Fund
Transfers
Total General Funds
Revenues $14,486 $3,098 -$582 $17,002 $300 $17,302 $ Ch. (mil) $968 $408 $40 $1,416 -$300 $1,116 Observation: FY 1995 was another strong year for General Revenues, as receipts grew $1.416 billion or 9.1%. The base growth for State Sources was a robust 7.2%. The sources leading this charge were again the “big three” with the personal income tax growing 5.9% or $317M, the corporate income tax increasing 18.4% or $172M, and the sales tax rising 6.4% or $280M million. Transfers also had a strong year, growing 17.8%, including a $53 million increase in riverboat transfers. Federal Sources also performed exceptionally well, increasing 15.2%. Total General Funds grew 6.9%.
FY 1996 Total State Sources
Federal Sources
Nongeneral Funds
Distribution
Subtotal General Funds
Borrowing & Fund
Transfers
Total General Funds
Revenues $15,228 $3,339 -$631 $17,936 $200 $18,136 $ Ch. (mil) $741 $241 -$49 $933 -$100 $833 Observation: Strong growth continued in FY 1996 as general funds increased $933 million or 5.5%. Total General Funds increased $833 million or 4.8%. This was a solid year for nearly all of the larger revenue sources as personal income tax (+6.3%), corporate income tax (+9.5%), sales (+3.2%), transfers (+17.8%), and federal sources (+7.8%) all had strong rates of growth.
FY 1997 Total State Sources
Federal Sources
Nongeneral Funds
Distribution
Subtotal General Funds
Borrowing & Fund
Transfers
Total General Funds
Revenues $16,274 $3,269 -$689 $18,854 $0 $18,854 $ Ch. (mil) $1,046 -$70 -$58 $918 -$200 $718 Observation: General Revenues grew $918 million or 5.1% in FY 1997. While still solid, this was the lowest year-over-year growth in six years. This slow-down was mainly because the large amounts of federal sources received in FY 1996 were not repeated in FY 1997, causing a 2.1% decline. State Sources continued its strong performance in FY 1997, growing $1.046 billion or 6.9%. The “big three” continued to lead the way as PIT receipts grew 7.9%, CIT receipts grew 12.7%, and sales tax receipts grew 4.0%. Overall, $200 million in short term borrowing was not repeated in FY 1997, causing total general funds to increase only $718 million or 4.0%.

16
FY 1998 Total State Sources
Federal Sources
Nongeneral Funds
Distribution
Subtotal General Funds
Borrowing & Fund
Transfers
Total General Funds
Revenues $17,347 $3,323 -$688 $19,982 $0 $19,982 $ Ch. (mil) $1,074 $54 $1 $1,129 $0 $1,129 Observation: General Revenues grew $1.129 billion in FY 1998 or 6.0%. The growth was primarily due to a $1.074 billion increase in State Sources, stemming from growth in all of the major areas with the biggest increases again coming from the personal income tax (up $717M or 10.9%) and the sales tax (up $282M or 5.6%). Cigarette tax revenues to general funds increased 15.3% in FY 1998 in part due to the rate increase from 44-cents to 58-cents per pack.
FY 1999 Total State Sources
Federal Sources
Nongeneral Funds
Distribution
Subtotal General Funds
Borrowing & Fund
Transfers
Total General Funds
Revenues $18,772 $3,718 -$815 $21,674 $0 $21,674 $ Ch. (mil) $1,424 $395 -$127 $1,692 $0 $1,692 Observation: General Revenues grew a robust $1.692 billion in FY 1999 or 8.5%. The growth was the largest increase over the last ten years. Despite a small falloff in corporate income tax receipts (-1.2%), total State sources grew 8.2%. PIT receipts grew 7.0% and sales tax increased by an impressive 6.4%. Many of the smaller sources also did well. Public Utility Taxes grew 11.7%, in part because the telecommunications tax rate was increased from 5% to 7% and the electric tax was replaced with a new excise tax. The cigarette tax grew another 16.5% due to its previously mentioned tax rate increase. Insurance tax revenues increased 128.6% as new insurance taxes were imposed to replace a tax that was earlier ruled as unconstitutional. Riverboat transfers increased 41.2% as riverboat casinos’ wagering tax changed from a flat rate to a graduated rate structure. In addition, investment income grew 16.5%. On top of all of this, federal sources grew another $395 million or 11.9%.
FY 2000 Total State Sources
Federal Sources
Nongeneral Funds
Distribution
Subtotal General Funds
Borrowing & Fund
Transfers
Total General Funds
Revenues $20,236 $3,891 -$878 $23,249 $0 $23,249 $ Ch. (mil) $1,464 $173 -$62 $1,575 $0 $1,575 Observation: General Revenues grew $1.575 billion in FY 2000 or 7.3%. The growth was primarily due to a $1.464 billion increase in State Sources, stemming from growth in all of the major areas with the biggest increases coming from the personal income tax (up $495M) and the sales tax (up $418M). During this year, liquor tax receipts were increased allowing this source to grow $70 million or 120.7%. Gaming fund transfers grew another $90 million in FY 2000, again reaping the revenue benefits of the recently imposed graduated tax structure.
17
FY 2001 Total State Sources
Federal Sources
Nongeneral Funds
Distribution
Subtotal General Funds
Borrowing & Fund
Transfers
Total General Funds
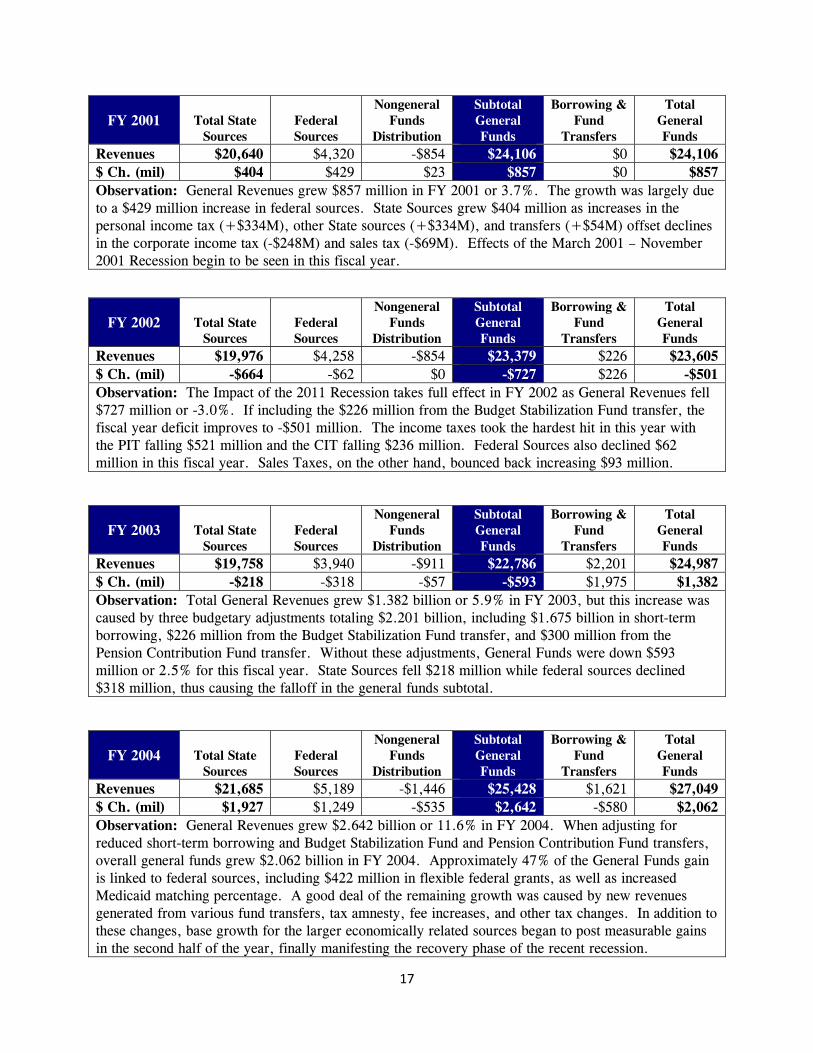
Revenues $20,640 $4,320 -$854 $24,106 $0 $24,106 $ Ch. (mil) $404 $429 $23 $857 $0 $857 Observation: General Revenues grew $857 million in FY 2001 or 3.7%. The growth was largely due to a $429 million increase in federal sources. State Sources grew $404 million as increases in the personal income tax (+$334M), other State sources (+$334M), and transfers (+$54M) offset declines in the corporate income tax (-$248M) and sales tax (-$69M). Effects of the March 2001 – November 2001 Recession begin to be seen in this fiscal year.
FY 2002 Total State Sources
Federal Sources
Nongeneral Funds
Distribution
Subtotal General Funds
Borrowing & Fund
Transfers
Total General Funds
Revenues $19,976 $4,258 -$854 $23,379 $226 $23,605 $ Ch. (mil) -$664 -$62 $0 -$727 $226 -$501 Observation: The Impact of the 2011 Recession takes full effect in FY 2002 as General Revenues fell $727 million or -3.0%. If including the $226 million from the Budget Stabilization Fund transfer, the fiscal year deficit improves to -$501 million. The income taxes took the hardest hit in this year with the PIT falling $521 million and the CIT falling $236 million. Federal Sources also declined $62 million in this fiscal year. Sales Taxes, on the other hand, bounced back increasing $93 million.
FY 2003 Total State Sources
Federal Sources
Nongeneral Funds
Distribution
Subtotal General Funds
Borrowing & Fund
Transfers
Total General Funds
Revenues $19,758 $3,940 -$911 $22,786 $2,201 $24,987 $ Ch. (mil) -$218 -$318 -$57 -$593 $1,975 $1,382 Observation: Total General Revenues grew $1.382 billion or 5.9% in FY 2003, but this increase was caused by three budgetary adjustments totaling $2.201 billion, including $1.675 billion in short-term borrowing, $226 million from the Budget Stabilization Fund transfer, and $300 million from the Pension Contribution Fund transfer. Without these adjustments, General Funds were down $593 million or 2.5% for this fiscal year. State Sources fell $218 million while federal sources declined $318 million, thus causing the falloff in the general funds subtotal.
FY 2004 Total State Sources
Federal Sources
Nongeneral Funds
Distribution
Subtotal General Funds
Borrowing & Fund
Transfers
Total General Funds
Revenues $21,685 $5,189 -$1,446 $25,428 $1,621 $27,049 $ Ch. (mil) $1,927 $1,249 -$535 $2,642 -$580 $2,062 Observation: General Revenues grew $2.642 billion or 11.6% in FY 2004. When adjusting for reduced short-term borrowing and Budget Stabilization Fund and Pension Contribution Fund transfers, overall general funds grew $2.062 billion in FY 2004. Approximately 47% of the General Funds gain is linked to federal sources, including $422 million in flexible federal grants, as well as increased Medicaid matching percentage. A good deal of the remaining growth was caused by new revenues generated from various fund transfers, tax amnesty, fee increases, and other tax changes. In addition to these changes, base growth for the larger economically related sources began to post measurable gains in the second half of the year, finally manifesting the recovery phase of the recent recession.
18
FY 2005 Total State Sources
Federal Sources
Nongeneral Funds
Distribution
Subtotal General Funds
Borrowing & Fund
Transfers
Total General Funds
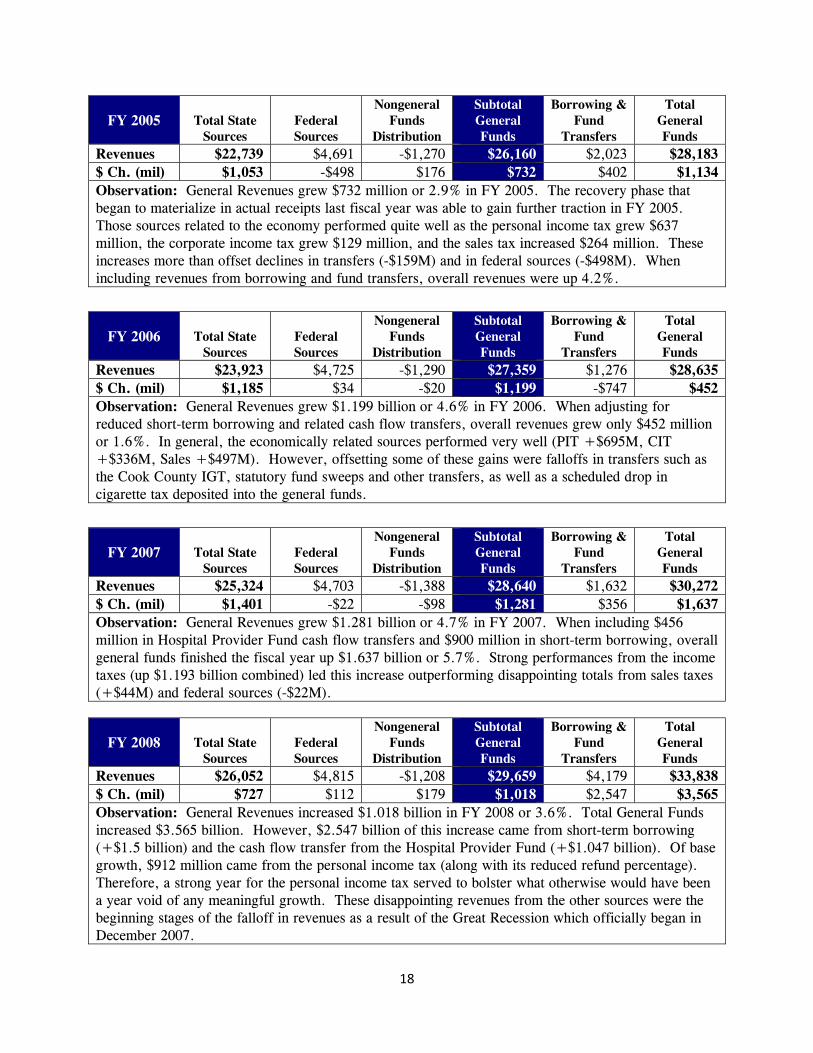
Revenues $22,739 $4,691 -$1,270 $26,160 $2,023 $28,183 $ Ch. (mil) $1,053 -$498 $176 $732 $402 $1,134 Observation: General Revenues grew $732 million or 2.9% in FY 2005. The recovery phase that began to materialize in actual receipts last fiscal year was able to gain further traction in FY 2005. Those sources related to the economy performed quite well as the personal income tax grew $637 million, the corporate income tax grew $129 million, and the sales tax increased $264 million. These increases more than offset declines in transfers (-$159M) and in federal sources (-$498M). When including revenues from borrowing and fund transfers, overall revenues were up 4.2%.
FY 2006 Total State Sources
Federal Sources
Nongeneral Funds
Distribution
Subtotal General Funds
Borrowing & Fund
Transfers
Total General Funds
Revenues $23,923 $4,725 -$1,290 $27,359 $1,276 $28,635 $ Ch. (mil) $1,185 $34 -$20 $1,199 -$747 $452 Observation: General Revenues grew $1.199 billion or 4.6% in FY 2006. When adjusting for reduced short-term borrowing and related cash flow transfers, overall revenues grew only $452 million or 1.6%. In general, the economically related sources performed very well (PIT +$695M, CIT +$336M, Sales +$497M). However, offsetting some of these gains were falloffs in transfers such as the Cook County IGT, statutory fund sweeps and other transfers, as well as a scheduled drop in cigarette tax deposited into the general funds.
FY 2007 Total State Sources
Federal Sources
Nongeneral Funds
Distribution
Subtotal General Funds
Borrowing & Fund
Transfers
Total General Funds
Revenues $25,324 $4,703 -$1,388 $28,640 $1,632 $30,272 $ Ch. (mil) $1,401 -$22 -$98 $1,281 $356 $1,637 Observation: General Revenues grew $1.281 billion or 4.7% in FY 2007. When including $456 million in Hospital Provider Fund cash flow transfers and $900 million in short-term borrowing, overall general funds finished the fiscal year up $1.637 billion or 5.7%. Strong performances from the income taxes (up $1.193 billion combined) led this increase outperforming disappointing totals from sales taxes (+$44M) and federal sources (-$22M).
FY 2008 Total State Sources
Federal Sources
Nongeneral Funds
Distribution
Subtotal General Funds
Borrowing & Fund
Transfers
Total General Funds
Revenues $26,052 $4,815 -$1,208 $29,659 $4,179 $33,838 $ Ch. (mil) $727 $112 $179 $1,018 $2,547 $3,565 Observation: General Revenues increased $1.018 billion in FY 2008 or 3.6%. Total General Funds increased $3.565 billion. However, $2.547 billion of this increase came from short-term borrowing (+$1.5 billion) and the cash flow transfer from the Hospital Provider Fund (+$1.047 billion). Of base growth, $912 million came from the personal income tax (along with its reduced refund percentage). Therefore, a strong year for the personal income tax served to bolster what otherwise would have been a year void of any meaningful growth. These disappointing revenues from the other sources were the beginning stages of the falloff in revenues as a result of the Great Recession which officially began in December 2007.

19
FY 2009 Total State Sources
Federal Sources
Nongeneral Funds
Distribution
Subtotal General Funds
Borrowing & Fund
Transfers
Total General Funds
Revenues $23,936 $6,567 -$1,359 $29,144 $2,976 $32,120 $ Ch. (mil) -$2,115 $1,752 -$151 -$514 -$1,203 -$1,717 Observation: Despite $1.566 billion in direct federal stimulus revenue, General Revenues fell $514 million in FY 2009 or -1.7%. The declines are attributed to the continuing effects of the Great Recession as the combined economic related sources (income and sales taxes) represented $1.689 billion in falloffs. In addition, lower transfers accounted for $307 million of the slowing. Federal sources aside, only public utility taxes and insurance taxes managed to post gains for the year which demonstrated that the recession’s grip was not discriminating, and that virtually all sectors of the economy were negatively impacted. Overall General Funds fell a combined $1.717 billion or 5.1%. This additional falloff can be attributed to the $1.5 billion decline in the cash flow transfer in the Hospital Provider Fund.
FY 2010 Total State Sources
Federal Sources
Nongeneral Funds
Distribution
Subtotal General Funds
Borrowing & Fund
Transfers
Total General Funds
Revenues $22,378 $5,920 -$1,208 $27,090 $3,239 $30,329 $ Ch. (mil) -$1,558 -$647 $151 -$2,054 $263 -$1,791 Observation: General Revenues fell another $2.054 billion in FY 2010 or -7.0%. Again, virtually all revenue sources experienced declines as a result of the impacts from the Great Recession. While this recession officially ended in June 2009, its ramifications on revenues continued for several fiscal years, especially in those taxes closely tied to economic sources. Of the base declines in FY 2010, approximately $1.5 billion or approximately 75% was due to the falloff from the “Big Three” revenue sources – PIT, CIT, and Sales Tax. The recession’s impact on employment, corporate profitability, and consumer activity, conspired to challenge revenues on a monthly basis. Even large gains in federal sources earlier in the fiscal year ultimately vanished as reimbursable spending slowed and was moved to non-general funds. Revenues from borrowing and fund transfers were up $263 million so the falloff in total general funds came in at -$1.791 billion or -5.6%.
FY 2011 Total State Sources
Federal Sources
Nongeneral Funds
Distribution
Subtotal General Funds
Borrowing & Fund
Transfers
Total General Funds
Revenues $26,604 $5,386 -$1,502 $30,488 $3,309 $33,797 $ Ch. (mil) $4,226 -$534 -$294 $3,398 $70 $3,468 Observation: General Revenues reversed course and rose 12.5% or $3.398 billion in FY 2011. State sources grew $4.226 billion in FY 2011, which was mainly due to the income tax increases which went into effect in January 2011 or half way thru the fiscal year. In addition, an amnesty program occurred during this fiscal year. The magnitude of the effect of these items masked the underlying improvement in the economic sources that was happening simultaneously with the tax changes. While impossible to dissect and assign values to each, it was clear from receipting performance that revenues were finally recovering from the dismal performances that occurred in the previous fiscal year. Accounting for the $70 million increase from borrowing and fund transfers, overall general funds were up $3.468 billion or 11.4%.

20
FY 2012 Total State Sources
Federal Sources
Nongeneral Funds
Distribution
Subtotal General Funds
Borrowing & Fund
Transfers
Total General Funds
Revenues $32,125 $3,682 -$2,010 $33,797 $275 $34,072 $ Ch. (mil) $5,521 -$1,704 -$508 $3,310 -$3,034 $276 Observation: General funds revenues grew $3.3 billion or 10.9% in FY 2012. The increase was fueled by comparatively higher income tax receipts stemming from the January 2011 rate increases as well as continued strong sales tax receipts. Those items were more than enough to overcome a significant falloff in federal sources resulting from less reimbursable spending as well as a return to a lower federal matching rate (under ARRA, states enjoyed approximately two years of higher reimbursable match that has ended). Total General Revenues increased only $276 million or 0.8% in FY 2012 because of the $3.034 billion in short-term borrowing, tobacco settlement proceeds, Pension Contribution Fund transfers, and Budget Stabilization Fund transfers that did not repeat in FY 2012.
FY 2013 Total State Sources
Federal Sources
Nongeneral Funds
Distribution
Subtotal General Funds
Borrowing & Fund
Transfers
Total General Funds
Revenues $34,198 $4,154 -$2,288 $36,064 $539 $36,603 $ Ch. (mil) $2,073 $472 -$278 $2,267 $264 $2,531 Observation: General Revenues increased $2.267 billion in FY 2013 or 6.7%. When including cash flow transfers, base general funds revenues grew $2.531 billion, or 7.4%. Both personal and corporate income taxes performed exceptionally well, in large part due to the “April Surprise”, which refers to an increase in tax receipts caused by taxpayers accelerating their tax payments in order to avoid higher federal taxes. However, underlying growth was strong throughout the fiscal year even before April. Federal sources contributed to the strong growth. But much of the $472 million increase in federal receipts is due to the surge of April income tax revenues, which allowed for an increase in reimbursable spending on Medicaid bills.
2014 Total State Sources
Federal Sources
Nongeneral Funds
Distribution
Subtotal General Funds
Borrowing & Fund
Transfers
Total General Funds
Revenues $35,037 $3,903 -$2,221 $36,718 $325 $37,043 $ Ch. (mil) $838 -$251 $66 $653 -$214 $439 Observation: General Revenues increased $653 million in FY 2014 or 1.8%. Sales taxes were up $321 million for the fiscal year. Other sources added $123 million to the overall yearly advance, due mostly to earlier one-time deposits of court settlement proceeds and prior year overpayments to SERS. While gross personal income taxes only grew $64 million and corporate income tax receipts actually fell $39 million, underlying strong performance was hidden by the April falloff related to the previous year’s April Surprise. Similarly, federal sources fell $251 million for the fiscal year, reflecting reduced reimbursable spending absent the revenues from the April Surprise. Overall general funds revenues were up only $439 million or 1.2% due to a $214 million decline in the backlog payment fund transfer.
21
Volatility by Source Analyses
The following section provides an in-depth look at each of the primary sources of general funds revenue in Illinois on an individual basis. For each source, their composition of estimated FY 2015 base revenues is shown, along with a description of the tax source’s rate and tax base. When applicable, a comparison of other state taxation for that source is included.
A description of that source’s revenue history is included along with a graph illustrating the fluctuation (or lack thereof) of receipts over the last twenty-five years. The Commission then provides a look at trends in the rates of change for that source over different time periods, as well as a brief description of expected future trends.
The second graph accompanying each revenue source illustrates a history of the year-over-year change in receipts. This chart is provided to get a sense of the type of volatility that each revenue source has had over the last fifteen to twenty-five years. Included in each of these graphs is a line graph displaying the year-over-year revenue change of total general funds. This line is included for two reasons: to see if the volatility of a particular source mirrors that of total general funds; and to put into perspective the extent of a source’s volatility in comparison to the overall volatility.
Following each volatility graph are paragraphs detailing the noted observations and further discussion for the reasons volatility did or did not occur for the time frame shown. This observation section will also analyze the importance of a revenue source’s volatility to overall volatility.
The order of analyses for each of the revenue sources will be consistent with how the Commission has historically laid out its revenue tables in numerous publications over the years.
22
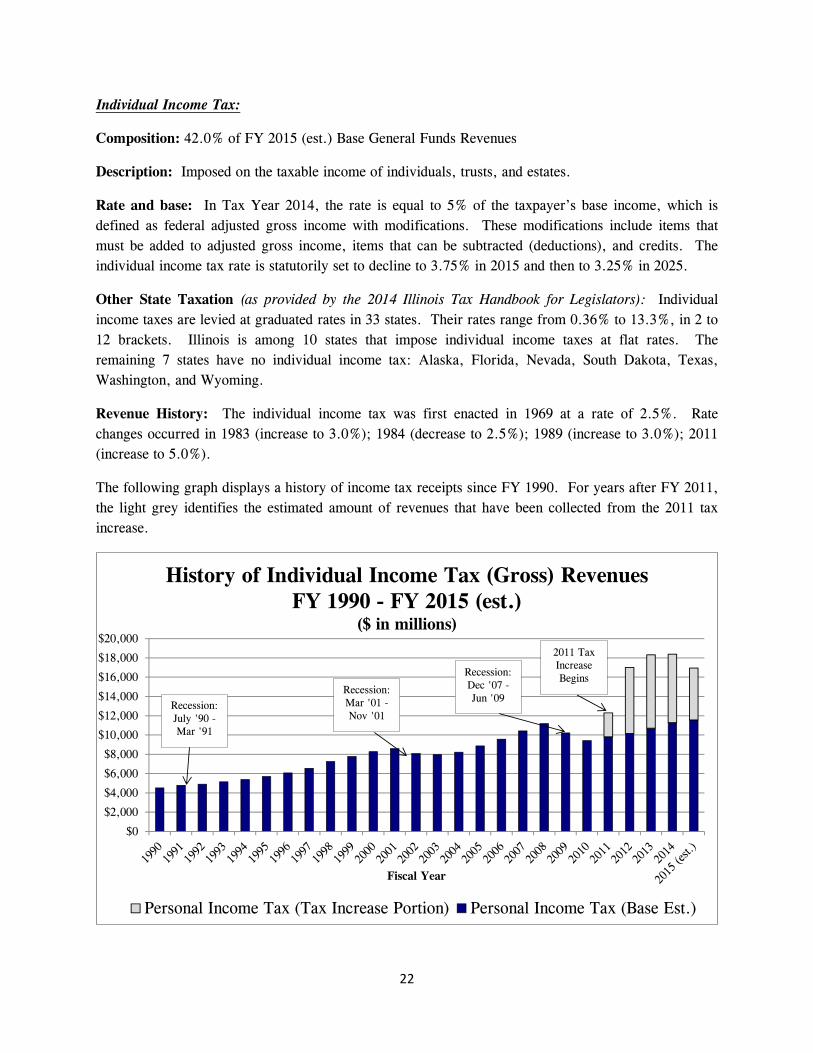
Individual Income Tax:
Composition: 42.0% of FY 2015 (est.) Base General Funds Revenues
Description: Imposed on the taxable income of individuals, trusts, and estates.
Rate and base: In Tax Year 2014, the rate is equal to 5% of the taxpayer’s base income, which is defined as federal adjusted gross income with modifications. These modifications include items that must be added to adjusted gross income, items that can be subtracted (deductions), and credits. The individual income tax rate is statutorily set to decline to 3.75% in 2015 and then to 3.25% in 2025.
Other State Taxation (as provided by the 2014 Illinois Tax Handbook for Legislators): Individual income taxes are levied at graduated rates in 33 states. Their rates range from 0.36% to 13.3%, in 2 to 12 brackets. Illinois is among 10 states that impose individual income taxes at flat rates. The remaining 7 states have no individual income tax: Alaska, Florida, Nevada, South Dakota, Texas, Washington, and Wyoming.
Revenue History: The individual income tax was first enacted in 1969 at a rate of 2.5%. Rate changes occurred in 1983 (increase to 3.0%); 1984 (decrease to 2.5%); 1989 (increase to 3.0%); 2011 (increase to 5.0%).
The following graph displays a history of income tax receipts since FY 1990. For years after FY 2011, the light grey identifies the estimated amount of revenues that have been collected from the 2011 tax increase.
$0
$2,000
$4,000
$6,000
$8,000
$10,000
$12,000
$14,000
$16,000
$18,000
$20,000
Fiscal Year
History of Individual Income Tax (Gross) RevenuesFY 1990 - FY 2015 (est.)
($ in millions)
Personal Income Tax (Tax Increase Portion) Personal Income Tax (Base Est.)
Recession:Mar '01 -Nov '01
Recession:Dec '07 -Jun '09
2011 Tax Increase Begins
Recession:July '90 -Mar '91

23
Trends and Outlook:
• 15-Year Average Annual % Change: 2.7% (base growth, excludes impact of tax increase)
• 10-Year Average Annual % Change: 3.4% (base growth, excludes impact of tax increase)
• 5-Year Average Annual % Change: 2.1% (base growth, excludes impact of tax increase)
• Anticipated 5-year Average Growth: Approximately 2.5%
Historical Volatility as Compared to Volatility of Total General Funds
Observations: The personal income tax has seen its share of peaks and valleys over the last twenty-five years. Over this time frame, this source has experienced two periods of negative growth, the first between FY 2002 and FY 2003 and a more pronounced period between FY 2009 and FY 2010. Recessions in these years and the associated impact on employment and personal income are considered the primary reason for this falloff in revenues during this period. The large year-over-year increases between FY 2011 and FY 2012 are primarily due to the transition to the higher rate of 5%, and the falloff in FY 2015 due to current law adjusting down the tax rate.
As shown above, the year-over-year change of the personal income tax very much resembles the line graph displaying the historical volatility of total general funds. This is due to the source’s large composition of the total. Therefore, any examination of future general fund volatility or rainy day fund mechanisms must be established with this fact in mind.
$272 $105 $243 $249 $317 $360 $482 $717 $510 $495 $334
-$521-$107
$256$637 $695 $857 $761
-$967-$790
$2,871
$4,699
$1,324
$64
-$1,446
-$3,000
-$2,000
-$1,000
$0
$1,000
$2,000
$3,000
$4,000
$5,000
$6,000
Fiscal Year
Year-Over-Year Change in Individual Income Tax (Gross) RevenuesFY 1990 - FY 2015 (est.)
($ in millions)
Personal Income Tax (Gross) Total General Funds

24
Corporate Income Tax:
Composition: 8.0% of FY 2015 (est.) Base General Funds Revenues
Description: Imposed on the taxable income of corporations, associations, joint-stock companies, and cooperatives.
Rate and base: In Tax Year 2014, the rate is equal to 7% of the tax base, which is the taxpayer’s federal taxable income with several modifications. The corporate income tax rate is statutorily set to decline to 5.25% in 2015 and then to 4.8% in 2025. Illinois’ corporate income tax rate is sometimes listed as 9.5%, which includes the current 7% tax rate and the 2.5% Personal Property Tax Replacement Income Tax (non general fund source).
Other State Taxation (as provided by the 2014 Illinois Tax Handbook for Legislators): Illinois is among 28 states that tax corporate income at flat rates, ranging from 4.63% in Colorado to 9.99% in Pennsylvania. Fourteen states tax corporate income at graduated rates, ranging from 1.48% to 12%. Five other states – Nevada, South Dakota, Texas, Washington, and Wyoming do not tax corporate income.
Revenue History: The corporate income tax was first enacted in 1969 at a rate of 4%. Rate changes occurred in 1983 (increase to 4.8%); 1984 (decrease to 4.0%); 1989 (increase to 4.8%); 2011 (increase to 7.0%).
The following graph displays a history of corporate income tax receipts since FY 1990. For years after FY 2011, the light grey identifies the estimated amount of revenues that have been collected from the 2011 tax increase.
$0
$500
$1,000
$1,500
$2,000
$2,500
$3,000
$3,500
$4,000
Fiscal Year
History of Corporate Income Tax (Gross) RevenuesFY 1990 - FY 2015 (est.)
($ in millions)
Corporate Income Tax (Tax Increase Portion) Corporate Income Tax (Base Est.)
Recession:Mar '01 -Nov '01
Recession:Dec '07 -Jun '09
2011 Tax Increase Begins
Recession:July '90 -Mar '91

25
Trends and Outlook:
• 15-Year Average Annual % Change: 5.2% (base growth, excludes impact of tax increase)
• 10-Year Average Annual % Change: 6.6% (base growth, excludes impact of tax increase)
• 5-Year Average Annual % Change: 4.9% (base growth, excludes impact of tax increase)
• Anticipated 5-year Average Growth: Approximately 3.5%
Historical Volatility as Compared to Volatility of Total General Funds
Observations: Historically, corporate income tax receipts fluctuate quite a bit from year to year. Since FY 1990, this source has experienced two periods of negative growth, the first between FY 2001 and FY 2003 and a more pronounced period between FY 2009 and FY 2010. Recessions in these years and the impact on corporate profits are considered the reason for these decreases. The large year-over-year increases between FY 2011 and FY 2013 are primarily due to the transition to the higher rate of 5%. The slowdown in FY 2014 is mainly due to higher-than-expected revenues in FY 2013 as a result of the April Surprise in tax revenues. In FY 2015, the expected declines are due to the scheduled rate reduction.
As shown above, the year-over-year change of the corporate income tax also resembles the volatility of total general funds, but on a smaller scale than that of personal income tax receipts. Still, even when removing the impact of the tax increase, over the past twenty-five years base revenues have increased by as much as $407 million in a given fiscal year and have fallen by as much as $424 million.
$6 $14 $76 $80 $172 $105 $153 $41
-$17
$143
-$248-$236-$31
$407$129 $236 $336
$80
-$128-$424
$628 $706 $696
-$39-$373
-$3,000
-$2,000
-$1,000
$0
$1,000
$2,000
$3,000
$4,000
Fiscal Year
Year-Over-Year Change in Corporate Income Tax (Gross) RevenuesFY 1990 - FY 2015 (est.)
($ in millions)
Corporate Income Tax (Gross) Total General Funds

26
Sales Tax:
Composition: 22.0% of FY 2015 (est.) Base General Funds Revenues
Description: Tax imposed on the sale and use of non-exempt tangible personal property. The sales tax in Illinois is made up of two matching pairs of taxes: 1) the retailers’ occupation tax and the use tax and 2) the service occupation tax, and the service use tax.
Rate and base: 6.25% of the purchase price (except on food and drugs, gasohol, blended ethanol, biodiesel, and biodiesel blends). The state retains 5% of the purchase price and the remaining 1.25% is paid to local governments. There are numerous exemptions to the sales tax such as sales to tax exempt organizations.
Other State Taxation (as provided by the 2014 Illinois Tax Handbook for Legislators): Sales taxes are imposed by 45 states. Their basic statewide rates range from 2.9% to 7.5%. Illinois’ rate of 6.25% ranks 12th highest in the country.
Revenue History: The retailers’ occupation tax was first introduced in 1933 at 2%. The use tax was enacted in 1955 at which time both rates were 2.5%. In 1961, the service related taxes were introduced and all rates were at 3.5%. In 1984, the rate was raised to 5% with an additional 1.25% for local governments being added in 1990.
$0
$1,000
$2,000
$3,000
$4,000
$5,000
$6,000
$7,000
$8,000
$9,000
Fiscal Year
History of Sales Tax RevenuesFY 1990 - FY 2015 (est.)
($ in millions)
Sales Tax
Recession:July '90 -Mar '91
Recession:Mar '01 -Nov '01
Recession:Dec '07 -Jun '09

27
Trends and Outlook:
• 15-Year Average Annual % Change: 2.5%
• 10-Year Average Annual % Change: 2.1%
• 5-Year Average Annual % Change: 2.7%
• Anticipated 5-year Average Growth: Approximately 2.0% - 2.5%
Historical Volatility as Compared to Volatility of Total General Funds
Observations: Sales tax revenue ordinarily shows slow but steady growth (2% - 3% per year) with declines occurring only during the depths of a recession. From FY 1950 to FY 2008, sales tax revenue only declined 5 times (with the largest declines being -2.9% and -1.9%) and never two years in a row until FY 2009. In FY 2009 and FY 2010, sales tax declined by over -6% in each of those years due to the Great Recession. Sales tax revenue is expected to continue this pattern of slow growth with some downside risk during economic slumps.
As shown above, the year-over-year change of sales tax also resembles the volatility of total general funds, but like the corporate income tax, is on a smaller scale than that of personal income tax receipts. Over the past fifteen years revenues have increased by as much as $525 million in a given fiscal year and have fallen by as much as $465 million.
$36 $123 $108$277 $280 $147 $194 $282 $335 $418
-$69
$93 $8$272 $264
$497
$44 $79
-$442-$465
$525 $393$129
$321 $166
-$3,000
-$2,000
-$1,000
$0
$1,000
$2,000
$3,000
$4,000
Fiscal Year
Year-Over-Year Change in Sales Tax RevenuesFY 1990 - FY 2015 (est.)
($ in millions)
Sales Tax Total General Funds

28
Public Utility Taxes:
Composition: 2.8% of FY 2015 (est.) Base General Funds Revenues
Description: Illinois taxes public utilities through three taxes on electricity use, natural gas use and telecommunications.
Rate and base: Electricity Excise Tax (≈ 40% of total) Residential - 0.33 cents to 0.202 cents per kilowatt-hour Non-Residential – 5.1% of purchase price
Natural Gas Revenue Tax and Gas Use Tax (≈ 15% of total) The lessor of: (a) 2.4 cents per therm of gas sold to each customer, or (b) 5% of gross revenue from each customer.
Telecommunications Excise Tax (≈ 45% of total) 7% of gross charges by businesses for transmitting messages in interstate or intrastate commerce.
Other State Taxation (as provided by the 2014 Illinois Tax Handbook for Legislators): Public utility taxes vary throughout the country. Rates for taxes on electricity and natural gas range from 1% to as high as 6.5%, or are based on kilowatt-hours or therms used. Telecommunication taxes range from 1% to 7%, or are based on the number of customers or length of phone lines.
Revenue History: Public utility taxes were enacted in the 1930’s and 1940’s in Illinois. The current rates for electricity and natural gas use were set in 1985, while the telecommunications tax was raised last in 1998. The chart below highlights total Public Utility tax revenue since FY 1990.
$0
$200
$400
$600
$800
$1,000
$1,200
$1,400
Fiscal Year
History of Public Utility Tax RevenuesFY 1990 - FY 2015 (est.)
($ in millions)
Public Utility
29
Trends and Outlook:
• 15-Year Average Annual % Change: 0.9%
• 10-Year Average Annual % Change: -0.5%
• 5-Year Average Annual % Change: -2.6%
• Anticipated 5-year Average Growth: Approximately -0.5% to -1.5% assuming federal Internet Tax Freedom Act is extended
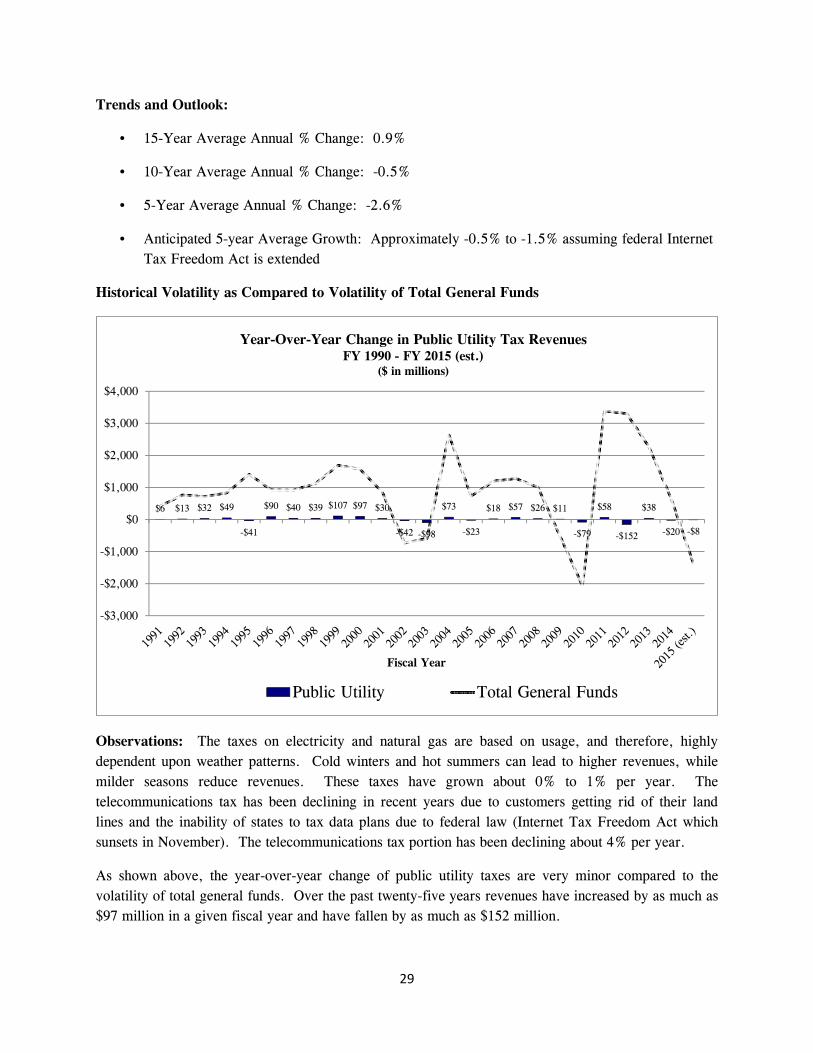
Historical Volatility as Compared to Volatility of Total General Funds
Observations: The taxes on electricity and natural gas are based on usage, and therefore, highly dependent upon weather patterns. Cold winters and hot summers can lead to higher revenues, while milder seasons reduce revenues. These taxes have grown about 0% to 1% per year. The telecommunications tax has been declining in recent years due to customers getting rid of their land lines and the inability of states to tax data plans due to federal law (Internet Tax Freedom Act which sunsets in November). The telecommunications tax portion has been declining about 4% per year.
As shown above, the year-over-year change of public utility taxes are very minor compared to the volatility of total general funds. Over the past twenty-five years revenues have increased by as much as $97 million in a given fiscal year and have fallen by as much as $152 million.
$6 $13 $32 $49
-$41
$90 $40 $39 $107 $97 $30
-$42 -$98
$73
-$23
$18 $57 $26 $11
-$79
$58
-$152
$38
-$20 -$8
-$3,000
-$2,000
-$1,000
$0
$1,000
$2,000
$3,000
$4,000
Fiscal Year
Year-Over-Year Change in Public Utility Tax RevenuesFY 1990 - FY 2015 (est.)
($ in millions)
Public Utility Total General Funds

30
Cigarette Tax:
Composition: 1.0% of FY 2015 (est.) Base General Funds Revenues
Description: A tax on cigarettes. This revenue source also includes a tax on tobacco products. Wholesale distributors collect the tax from retailers, who collect the use tax from customers. Retail sellers are relieved of paying the use tax if they pay the tax to distributors.
Rate and base: For the cigarette tax, the rate is equal to $1.98 per package of 20 cigarettes. The tobacco products tax is equal to 36% of wholesale price or 30-cents per ounce for moist snuff. It should be noted that many municipalities and home-rule units have their own local cigarette tax. For example, the City of Chicago collects a $1.18 per pack tax and Cook County collects a $3.00 per pack tax. Chicago’s combined rate when including city, county, State, and federal taxes is $7.17 per pack of 20 cigarettes, which ranks Chicago as having the highest combined tax rate of any city in the nation.
Other State Taxation (as provided by the 2014 Illinois Tax Handbook for Legislators): The tax on cigarettes ranges from $0.17 per pack in Missouri to $4.35 per pack in New York. There is also a federal tax of $1.01 per pack.
Revenue History: The cigarette tax was first enacted in 1941 at a rate of 2-cents per pack. The rate has changed many times over the years. The most recent tax increases occurred in 1997 (from $0.44/pack to $0.58/pack), 2002 (to $0.98/pack), and in 2012 (to $1.98/pack).
Distribution of Revenues: Cigarette tax revenues are distributed to both General and non-General Funds. The amount of cigarette tax revenues that goes to General Funds’ revenues is currently statutorily set at $29.2 million per month or $350 million per year (plus roughly $3 million to $5 million per year from distribution language that states that one-cent per pack is to go to GRF).
$0
$50
$100
$150
$200
$250
$300
$350
$400
$450
$500
Fiscal Year
History of Cigarette Tax Revenues (General Funds)FY 1990 - FY 2015 (est.)
($ in millions)
Cigarette

31
Trends and Outlook:
• 15-Year Average Annual % Change: -0.7%
• 10-Year Average Annual % Change: -1.0%
• 5-Year Average Annual % Change: 0.2%
• Anticipated 5-year Average Growth: Approximately 0.0% as the amount to General Funds is a statutorily set amount.
Historical Volatility as Compared to Volatility of Total General Funds
Observations: Revenues from the $1.00 tax increase in 2012 are to go into the Healthcare Provider Relief Fund (non-General Fund). Because the amount of cigarette tax revenues to the General Funds are statutorily set, the impact from the 2012 cigarette tax increase would not be seen in the previous graphs. Therefore, fluctuations in cigarette tax revenues (recent or future) to the general funds would be due to changes in the statutory language regarding the distributions of these revenues and not tied to the amount of cigarette packs taxed. Because of this and the relatively small composition that cigarette tax revenues make up of overall revenues, fluctuations in cigarette tax revenues to the General Funds have historically had minimal effect on overall volatility.
-$2 -$9
$8
-$13
$0 $0 $0 $46 $57
-$3
$0 $0 $0 $0 $50
-$50 -$50
$0 $0 $5 $0
-$1 -$1
$0 $2
-$3,000
-$2,000
-$1,000
$0
$1,000
$2,000
$3,000
$4,000
Fiscal Year
Year-Over-Year Change in Cigarette Tax Revenues to General FundsFY 1990 - FY 2015 (est.)
($ in millions)
Cigarette Total General Funds

32
Liquor Tax:
Composition: 0.5% of FY 2015 (est.) Base General Funds Revenues
Description: Imposed on the production and/or distribution of alcoholic beverages in Illinois.
Rate and base: In Tax Year 2014, the rate was $0.231/gallon on beer and cider with 0.5% to 7% alcohol, $1.39/gallon on wine (excluding cider with up to 7% alcohol), and $8.55/gallon on distilled liquors. All retail alcohol sellers pay a fee of $500/year. Manufacturers pay between $120/year and $3,600/year.
Other State Taxation (as provided by the 2014 Illinois Tax Handbook for Legislators): 17 states are liquor monopoly states, which sell liquor from state-run retailers. The remaining 32 states (apart from Illinois) have significant variance in their tax rates. Beer taxes range from $0.02/gallon in Wyoming to $1.15 in Tennessee. For wine, taxes vary depending on the alcohol percentage (above or below 14%), though Illinois does not make a distinction for taxation purposes. The taxes for wine differ significantly state-to-state, with a low of $0.11/gallon in the state of Louisiana for wine with an alcohol content below 14%. The highest taxes for wine are $3.00/gallon in the state of Florida for wine above 14% (though, in Florida only, the alcohol percentage for taxation is measured above or below 17.259%) Distilled liquor taxes range from $1.50/gallon in Maryland to $14.27/gallon in Washington.
Revenue History: The liquor tax (per gallon) was instituted in 1932 at $0.02 for beer/cider, $0.10 for wine up to 14% alcohol, $0.25 for wine over 14% alcohol, and $0.50 for distilled liquor. The rates were increased in 1941, 1959, 1969, 1999, and most recently in 2009.
$0
$20
$40
$60
$80
$100
$120
$140
$160
$180
Fiscal Year
History of Liquor Tax RevenuesFY 1990 - FY 2015 (est.)
($ in millions)
Liquor

33
Trends and Outlook:
• 15-Year Average Annual % Change: 9.8%
• 10-Year Average Annual % Change: 2.8%
• 5-Year Average Annual % Change: 0.9%
• Anticipated 5-year Average Growth: Approximately 1.5%
Historical Volatility as Compared to Volatility of Total General Funds
Observations: The liquor tax has remained relatively steady at a very low rate of growth over the previous two decades. The major changes in trends are primarily due to increases in the tax rate in 1999 and 2009. Overall, the liquor tax appears to be somewhat recession-proof in that it does not significantly jump in periods of growth or fall in periods of contraction. Volatility in this particular tax is minimal outside of legislated increases in the overall rate.
Over the past twenty-five years revenues have increased by as much as $70 million in a given fiscal year (in FY 2000 due to the 1999 tax increase) and have fallen by as much as $5 million. Without the impact of a tax increase, liquor tax revenues have increased by no more than $7 million per year over the last twenty-five years.
$0
-$5
$0 $0
-$2
$1
-$1
$1 $0 $70
-$4 -$1
$0 $4 $20 $5 $4 $2 $0 $1
-$2
$7 $1 $0 $0
-$3,000
-$2,000
-$1,000
$0
$1,000
$2,000
$3,000
$4,000
Fiscal Year
Year-Over-Year Change in Liquor Tax RevenuesFY 1990 - FY 2015 (est.)
($ in millions)
Liquor Total General Funds
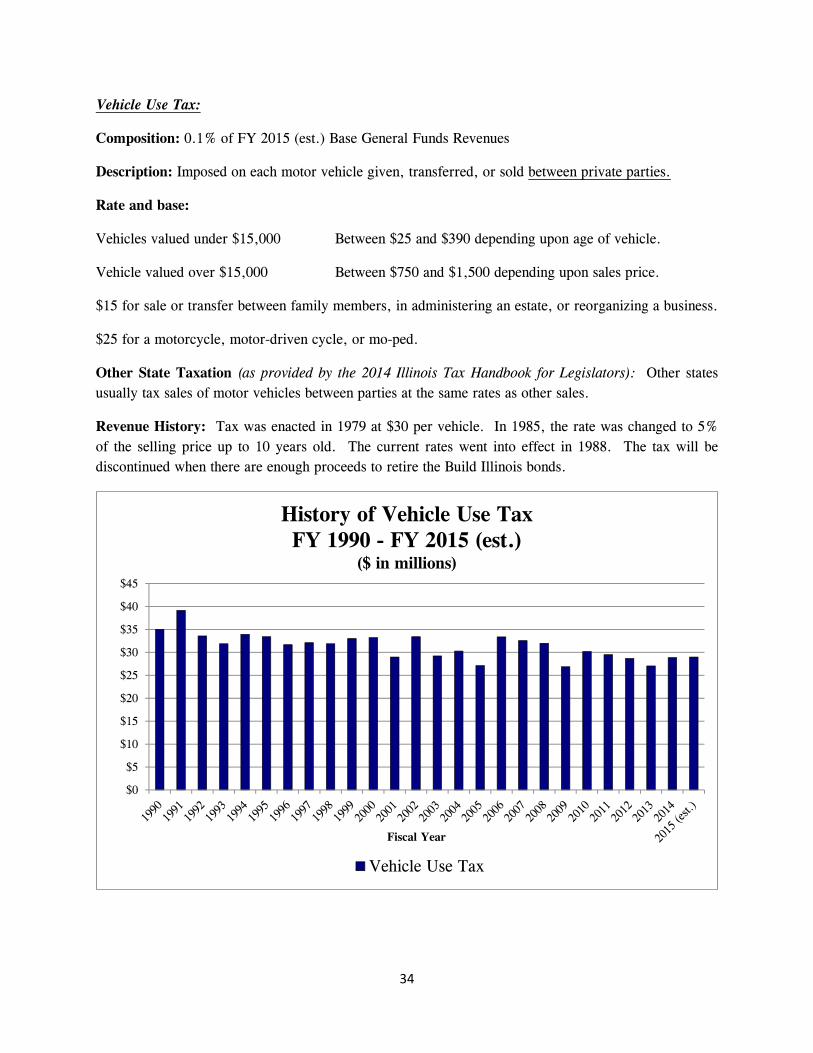
34
Vehicle Use Tax:
Composition: 0.1% of FY 2015 (est.) Base General Funds Revenues
Description: Imposed on each motor vehicle given, transferred, or sold between private parties.
Rate and base:
Vehicles valued under $15,000 Between $25 and $390 depending upon age of vehicle.
Vehicle valued over $15,000 Between $750 and $1,500 depending upon sales price.
$15 for sale or transfer between family members, in administering an estate, or reorganizing a business.
$25 for a motorcycle, motor-driven cycle, or mo-ped.
Other State Taxation (as provided by the 2014 Illinois Tax Handbook for Legislators): Other states usually tax sales of motor vehicles between parties at the same rates as other sales.
Revenue History: Tax was enacted in 1979 at $30 per vehicle. In 1985, the rate was changed to 5% of the selling price up to 10 years old. The current rates went into effect in 1988. The tax will be discontinued when there are enough proceeds to retire the Build Illinois bonds.
$0
$5
$10
$15
$20
$25
$30
$35
$40
$45
Fiscal Year
History of Vehicle Use TaxFY 1990 - FY 2015 (est.)
($ in millions)
Vehicle Use Tax

35
Trends and Outlook:
• 15-Year Average Annual % Change: -0.3%
• 10-Year Average Annual % Change: 0.1%
• 5-Year Average Annual % Change: 1.6%
• Anticipated 5-year Average Growth: Approximately 1.0%
Historical Volatility as Compared to Volatility of Total General Funds
Observations: The vehicle use tax has been declining about -1% per year since the beginning of the Great Recession but is expected to rebound some as average vehicle age (11.4 years) is currently at record highs. It is expected that vehicle use revenues will increase as consumers replace their older vehicles.
Over the past twenty-five years revenues have only increased by as much as $6 million in a given fiscal year and have only fallen by as much as $5 million. Because of the stable nature and relatively small size of this revenue source, the vehicle use tax has little to no impact on the overall volatility of State general funds revenues.
$0
-$4
$4
-$4
$1
-$3
$6
-$1 -$1 -$5
$3
-$1 -$1 -$2
$2 $0
-$3,000
-$2,000
-$1,000
$0
$1,000
$2,000
$3,000
$4,000
2000 2001 2002 2003 2004 2005 2006 2007 2008 2009 2010 2011 2012 2013 2014 2015(est.)
Fiscal Year
Year-Over-Year Change in Vehicle Use Tax Revenues to General FundsFY 1990 - FY 2015 (est.)
($ in millions)
Vehicle Use Tax Total General Funds

36
Estate Tax:
Composition: 0.6% of FY 2015 (est.) Base General Funds Revenues.
Description: Imposed on a decedent’s estate before distribution to heirs. All property left to a decedent’s surviving spouse is exempted.
Rate and base: The estate tax in Illinois is somewhat complicated as it is based on the “state tax credit” that would have been allowed for in an estate’s federal estate tax liability based on the federal tax law in effect in 2001. The threshold amount for estates to be subject to the Illinois estate tax is $4 million effective as of January 1, 2013.
Other State Taxation (as provided by the 2014 Illinois Tax Handbook for Legislators): Fourteen other states have estate taxes. An additional six states (Iowa, Kentucky, Maryland, Nebraska, New Jersey, and Pennsylvania) tax at the inheritance level instead of at the estate level. Maryland and New Jersey impose both an estate tax and an inheritance tax.
Revenue History: Estate tax revenue has shown a high level of volatility over the last decade. Estate taxes brought in over $350 million in FY 2008 but were down to around $120 million in FY 2011 due to the estate tax going away during calendar year 2010 due to a change in federal law. The high level of volatility is most likely due to two factors; 1) legislative changes in the estate tax at both the state and federal level and 2) the effect of economic conditions on household wealth.
To keep taxing estates, Illinois has had to deal with the repeal of the “state tax credit” at the federal level and the temporary repeal of the federal estate tax in 2010. The legislature has also raised the exemption level multiple times from $1 million in 2003 to its current level of $4 million. All of these have affected how much the State brings in from the estate tax.
$0
$50
$100
$150
$200
$250
$300
$350
$400
Fiscal Year
History of Estate Tax RevenuesFY 1990 - FY 2015 (est.)
($ in millions)
Estate Tax

37
Trends and Outlook:
• 15-Year Average Annual % Change: 3.3%
• 10-Year Average Annual % Change: 8.9%
• 5-Year Average Annual % Change: 9.2%
• Anticipated 5-year Average Growth: Approximately 3% - 5% with a high level of volatility
Historical Volatility as Compared to Volatility of Total General Funds
Observations: Forecasting the amount of revenue from the estate tax is currently quite difficult. Swift changes in both the economic climate and the taxing environment has led to a forecasting situation with little base to start from. FY 2014 was the first full year under the $4 million exemption level which was expected to significantly lower estate tax revenue. However, estate tax revenue was only down 6% as market gains largely offset the expected decrease from the increased exemption level. Going forward, the Commission expects some growth but with a continued high level of volatility due to this tax being predicated on the randomness of when people with large estates die.
Although the estate tax has proven to be a very volatile revenue source, from an overall perspective, its volatility has a relatively small impact on overall tax revenues. Over the past twenty-five years revenues have increased by as much as $113 million in a given fiscal year and have fallen by as much as $121 million. While these amounts are noteworthy, for comparison purposes, the $113 million increase in FY 2012 made up only 3.3% of the $3.309 billion increase in overall general funds revenues that occurred in FY 2012.
$5 $10 $47
-$11
$23 $5 $12 $51 $97 $1 $13
-$32 -$92 -$15
$88
-$38 -$8
$109
-$85 -$45 -$121
$113 $58
-$17 -$71
-$3,000
-$2,000
-$1,000
$0
$1,000
$2,000
$3,000
$4,000
Fiscal Year
Year-Over-Year Change in Estate Tax RevenuesFY 1990 - FY 2015 (est.)
($ in millions)
Estate Tax Total General Funds

38
Insurance Taxes and Fees:
Composition: 0.9% of FY 2015 (est.) Base General Funds Revenues
Description: The State imposes a number of taxes and fees on insurance companies. Foreign companies pay a privilege tax. All companies writing fire or fire-related policies, including domestic companies, pay a fire marshal’s tax. Insurance brokers writing non-standard policies with companies not licensed to do business in Illinois pay a surplus line producer’s tax.
Rate and base: • Privilege tax on insurers and HMOs:
0.4% of net taxable written premiums for accident and health insurance. 0.5% of net taxable written premiums on fire or fire-related insurance policies.
• Fire marshal’s tax: 1% of premiums on fire or fire-related insurance policies. • Surplus line producers’ tax: 3.5% of gross insurance premiums from policies issued in Illinois. • Workers’ Compensation Commission Operations Fund Surcharge: 1.01% of direct written
premiums for workers’ compensation liability insurance. • Numerous other fees on particular types of insurance activities.
Other State Taxation (as provided by the 2014 Illinois Tax Handbook for Legislators): All states impose a variety of privilege taxes and fees on insurers. The rates and fees vary, depending on the type of insurance taxed.
Revenue History: A 2% privilege tax on foreign companies was enacted in 1853. When that tax was held unconstitutional by the Illinois Supreme Court in 1997, a new privilege tax, on all insurance companies, was enacted in 1998. The fire marshal’s tax was enacted in 1909 at a rate of 0.5% and was increased to its current rate of 1% in 1979. The surplus line producers’ tax was enacted in 1937 at a rate of 2%. It rose to its current rate of 3.5% in 2003. The Illinois Workers’ Compensation Commission Operations Fund Surcharge was enacted in 2003 at a rate of 1.5%. This rate was reduced to 1.01% in 2004.
$0
$50
$100
$150
$200
$250
$300
$350
$400
Fiscal Year
History of Insurance Tax Revenues (General Funds)FY 1990 - FY 2015 (est.)
($ in millions)
Insurance

39
Trends and Outlook:
• 15-Year Average Annual % Change: 3.5%
• 10-Year Average Annual % Change: -0.7%
• 5-Year Average Annual % Change: 0.0%
• Anticipated 5-year Average Growth: Little to no growth. The Insurance Tax has seen very little growth over the past five years and this trend is expected to continue.
Historical Volatility as Compared to Volatility of Total General Funds
Observations: After hitting its high-water mark in FY 2004 ($362 million), revenues from insurance taxes and fees have receipted into the General Funds, on average, $325 million per year. The FY 2014 total was slightly above that average at $333 million. The FY 2015 estimate is $330 million. Insurance Taxes and Fees generate an additional $100 million or so in “non-general funds” revenues each year. These additional revenues go into various funds, including the Insurance Financial Regulation Fund, the Fire Prevention Fund, the Insurance Producers’ Administration Fund, the Insurance Premium Tax Refund Fund, and the Illinois Workers’ Compensation Commission Operations Fund.
As shown in the above graph, aside from revenue changes due to tax changes, the insurance tax is a relatively stable revenue source and has very little impact on the volatility of overall general funds revenues from year to year. Outside of tax changes, over the past twenty-five years revenues have increased by as much as $49 million in a given fiscal year and have fallen by as much as $25 million.
$5 $43
-$27 -$29
$2 $1
-$14 -$55
$117 $1 $37 $26 $41 $49
-$20 -$25 -$7 -$12
$36
-$12 -$6
$29
-$11 -$1 -$3
-$3,000
-$2,000
-$1,000
$0
$1,000
$2,000
$3,000
$4,000
Fiscal Year
Year-Over-Year Change in Insurance Tax Revenues to General FundsFY 1990 - FY 2015 (est.)
($ in millions)
Insurance Total General Funds

40
Corporate Franchise Tax:
Composition: 0.6% of FY 2015 (est.) Base General Funds Revenues
Description: An annual franchise tax is imposed on all corporations, domestic or foreign, who conduct business in Illinois. A tax also applies when corporations begin business in Illinois. An additional franchise tax applies when a corporation changes its capital structure or engages in a merger or consolidation.
Rate and base: In Tax Year 2014, the rate was 0.15% of paid-in capital (the total amount paid to the corporation by initial buyers of shares) for initial franchises, 0.15% of any increases in paid-in capital during the year (additional franchise tax), and 0.1% of paid-in capital each year for an annual franchise tax.
Other State Taxation (as provided by the 2014 Illinois Tax Handbook for Legislators): Corporate franchise taxes are levied in all other states based on capital stock and paid-in surpluses. The tax schedules in other states vary considerably based on a variety of factors.
Revenue History: The initial franchise tax was 0.05% from 1934-1966, 0.1% from 1967-1991, and 0.15% from 1991-present. The additional franchise tax was 0.05% from 1934-1966, 0.1% from 1967-1991, and 0.15% from 1991-present. The annual franchise tax was 0.05% from 1934-1983 and 0.1% from 1984-present. A tax amnesty program was conducted in 2008 and collected $21.9 million in outstanding tax liabilities.
$0
$50
$100
$150
$200
$250
Fiscal Year
History of Corporate Franchise Tax RevenuesFY 1990 - FY 2015 (est.)
($ in millions)
Corp. Franchise

41
Trends and Outlook:
• 15-Year Average Annual % Change: 4.1%
• 10-Year Average Annual % Change: 2.5%
• 5-Year Average Annual % Change: 0.3%
• Anticipated 5-year Average Growth: Approximately 1.0%
Historical Volatility as Compared to Volatility of Total General Funds
Observations: The corporate franchise tax has seen modest, though fickle, growth over the past two decades. While a moderate period of growth can be seen from FY 2000 to FY 2008, this revenue source has been inconsistent in previous (before 2000) and later (after 2008) years. Recessions in 2003 and 2009 may be the likely culprit for the downturn in revenues in those years.
As shown in the above graph, the corporate franchise tax is a relatively stable revenue source and has very little impact on the volatility of overall general funds revenues from year to year. Over the past twenty-five years revenues have increased by as much as $32 million in a given fiscal year and have fallen by as much as $24 million.
-$2 -$2
$10
-$3
$12
-$1
$20
-$3 -$1
$22 $7 $13
-$17
$21 $18 $0 $12 $32
-$24
$7
-$1 -$15
$13
-$2
$2
-$3,000
-$2,000
-$1,000
$0
$1,000
$2,000
$3,000
$4,000
Fiscal Year
Year-Over-Year Change in Corporate Franchise Tax RevenuesFY 1990 - FY 2015 (est.)
($ in millions)
Corp. Franchise Total General Funds

42
Interest on State Funds and Investments:
Composition: 0.1% of FY 2015 (est.) Base General Funds Revenues
Description: Many State funds invested by the State treasurer earn income on their cash balances from investments, such as repurchase agreements, commercial paper, time deposits and certificates of deposit. This income is deposited into general funds and other specified funds based on each fund’s pro-rated share of the total balance of all invested funds, or by specific statutory direction. The general funds receive the largest share of investment income.
Rate and base: Revenue from interest on State funds and investments is based upon the amount of money invested (i.e. fund balances) and market rates of return primarily for short term investments. The treasurer is limited to what types and durations of investments to invest in. The State is primarily invested in assets with duration of less than 2 years.
Revenue History: Interest on State funds and investments was a much bigger revenue source in the late 1990’s and early 2000’s. In FY 2001, interest on State funds and investments brought in over $250 million. In recent years, the total has been around $20 million to $30 million due to the very low rates of return on interest bearing assets. The Federal Reserve’s monetary policy since the Great Recession has kept interest rates at historic lows in hopes of inducing more economic activity.
$0
$50
$100
$150
$200
$250
$300
Fiscal Year
History of Interest on State Funds & InvestmentsFY 1990 - FY 2015 (est.)
($ in millions)
Investment Income

43
Trends and Outlook:
• 15-Year Average Annual % Change: -2.9%
• 10-Year Average Annual % Change: 2.8%
• 5-Year Average Annual % Change: -18.0%
• Anticipated 5-year Average Growth: Approximately 2% but could spike due to increased economic activity and a change in Federal Reserve policy.
Historical Volatility as Compared to Volatility of Total General Funds
Observations: Due to the Federal Reserve’s response to the Great Recession, interest rates have been at historic lows since approximately January of 2009. Interest rates have risen some in the last year but are still near historic lows. Revenue from interest is expected to jump considerably once the Federal Reserve begins to tighten its monetary policy due to increased economic activity. Single year growth of over 100% would not be surprising.
As shown in the above graph, due to little change by the Feds in raising the interest rates, revenues from interest in Illinois have been stagnant over the past five years. But changes by the Federal Reserve in future years could change this revenue source from a stagnant one to more of a volatile one. Still, due to the relatively small amounts that this source generates, year-over-year changes in interest revenues have historically had little impact on the overall volatility of overall general funds.
-$33 -$48 -$21
$1 $61 $12 $11 $38 $30 $21 $41
-$139 -$69 -$11
$18 $80 $51 $8
-$131 -$55
$2
-$7 -$1
$0 $5
-$3,000
-$2,000
-$1,000
$0
$1,000
$2,000
$3,000
$4,000
Fiscal Year
Year-Over-Year Change in Interest on State Funds & InvestmentsFY 1990 - FY 2015 (est.)
($ in millions)
Investment Income Total General Funds

44
Cook County Intergovernmental Transfer:
Composition: 0.7% of FY 2015 (est.) Base General Funds Revenues
Description: The State receives a portion of federal Medicaid reimbursements paid to Cook County hospital through an intergovernmental agreement. The agreement is designed to capture additional federal reimbursement by allowing the State to claim the maximum rates for Medicaid patients at the hospital.
Rate and base: The amount the State receives from the Cook County IGT has remained at $244 million since FY 2010 as a result of federal rules governing the maximum payments that hospitals can receive.
Revenue History: Below is a graph displaying the revenue history of the Cook County IGT since FY 1997.
Observations: The Cook County Intergovernmental Transfer is an agreed upon amount that has remained at $244 million since FY 2010. As a result, unless changes to this agreed amount occur, this revenue source has no impact on the overall volatility of general funds revenues.
$0
$50
$100
$150
$200
$250
$300
$350
$400
$450
$500
1997 1998 1999 2000 2001 2002 2003 2004 2005 2006 2007 2008 2009 2010 2011 2012 2013 2014 2015(est.)
Fiscal Year
History of Cook County Intergovernmental TransferFY 1997 - FY 2015 (est.)
($ in millions)
Cook County IGT

45
Other Sources:
Composition: 1.7% of FY 2015 (est.) Base General Funds Revenues
Description: A mix of revenues and fees that are, by statute, automatically receipted in the General Funds.
Rate and base: In any given year, up to 320 revenue streams may be receipted into the General Funds. The top sources are: Build Illinois Escrow, Hotel Tax, Certificate of Title, Commercial Distribution Fee (CDF), Limited Liability Co. Act, Securities Division, State ID Card Fees, SOS Late Fees, Liquor License Fees, and additional Fee Increases begun in FY 2004 and FY 2005.
Revenue History: In some years, additional one-time revenues sources have been receipted to the General Funds categorized as Other Sources. Court settlement proceeds have been receipted when a court case has been settled in the State’s favor, and the losing side has had to pay a settlement to the State. In some years the amounts are notable: FY 2010 - $35 million, FY 2014 - $78 million, and so far in FY 2015 - $118 million. There have also been policy changes affecting revenues. The Commercial Distribution Fee was created in FY 2004 and then amended to be reduced in later fiscal years. In FY 2005, CDF receipts were $120 million, they have ranged from $40 million -$50 million since FY 2007. While some revenue streams are predictable, others fluctuate due to the economy - Hotel Tax - or other circumstances – Build Illinois Escrow excess revenues are receipted in the General Revenue Fund when the escrow from a refunded Build Illinois bond has been fully satisfied.
$0
$100
$200
$300
$400
$500
$600
$700
2000 2001 2002 2003 2004 2005 2006 2007 2008 2009 2010 2011 2012 2013 2014 2015(est.)
Fiscal Year
History of Revenues from Other SourcesFY 2000 - FY 2015 (est.)
($ in millions)
Other Sources

46
Trends and Outlook:
• Average Change Since FY 2000: 11.0%
• Average Change Since FY 2005: 3.4%
• Average Change Since FY 2010: 7.6%
• Anticipated 5-year Avg. Growth: Excluding one-time sources, there is little growth in base revenues.
Historical Volatility as Compared to Volatility of Total General Funds
Observations: The large jump from FY 2000 to FY 2001 is due to Build Illinois Escrow funds being directed into the General Revenue Fund ($200 million). FY 2002 receipted $314 million in Build Illinois Escrow funds. The drop in FY 2003 is also attributed to the Build Illinois Escrow Fund as it only receipted $49 million into GRF. This line remained around $30 - $50 million in subsequent years, except in FY 2011 ($8 million) and FY 2012 ($1 million).
The increase in FY 2004 is attributed to a one-time $47 million receipt from the Pension Contribution Fund per statute. FY 2010 saw some decline in the mix of sources but stayed in the positives due to $35 million in court settlements. FY 2013 saw some growth in lines including the CDF and Hotel Tax and included a $16 million court settlement. The increases in FY 2014 came from $78 million in court settlements and a one-time $58 million repayment of a prior fiscal year overpayment. FY 2015 will see an influx of $118 million from court settlements.
Aside from one-time sources, revenues from other services are a relatively stagnant source. But one-time revenues can cause significant volatility in the amount of revenues collected from year to year. Over the past fifteen years revenues have increased by as much as $213 million in a given fiscal year and have fallen by as much as $163 million. While these revenue changes have little impact on overall revenues that total above $35 billion, it should be noted that the FY 2014 increase of $123 million in revenues from other sources made up 28% of the overall increase in general revenues figure of $439 million. Therefore, the importance of increases from these “smaller” sources cannot be discounted.
$4$213 $105
-$163
$90 $29
-$27
$8
-$7 -$24
$13
-$27 -$5
$63 $123 $19
-$3,000
-$2,000
-$1,000
$0
$1,000
$2,000
$3,000
$4,000
2000 2001 2002 2003 2004 2005 2006 2007 2008 2009 2010 2011 2012 2013 2014 2015(est.)
Fiscal Year
Year-Over-Year Change in Revenues from Other Sources to General FundsFY 2000 - FY 2015 (est.)
($ in millions)
Other Sources Total General Funds

47
Lottery:
Composition: 1.9% of FY 2015 (est.) Base General Funds Revenues
Description: The lottery gets revenue from ticket sales; agent fees; and interest on funds held.
Rate and base: Not applicable.
Other State Taxation: Forty-three other states have lotteries. Illinois had the 11th highest amount of sales ($2.8 billion) and the 18th highest amount of sales per capita ($220) in FY 2013.
Revenue History: The proceeds from the lottery originally all went towards education. In recent years, a significant amount has begun to be siphoned off towards the capital projects fund. Beginning in FY 2010, the transfer to the Common School Fund was capped at the FY 2009 level of $625 million with an amount equal to inflation added going forward.
$0
$100
$200
$300
$400
$500
$600
$700
$800
Fiscal Year
History of Lottery Transfer (General Funds)FY 1990 - FY 2015 (est.)
($ in millions)
Lottery

48
Trends and Outlook:
• 15-Year Average Annual % Change: 1.6%
• 10-Year Average Annual % Change: 1.7%
• 5-Year Average Annual % Change: 1.4%
• Anticipated 5-year Average Growth: Approximately 2.0% - 2.5% based on inflation conditions.
Historical Volatility as Compared to Volatility of Total General Funds
Observations: Since the introduction of the transfer of excess lottery proceeds to the Capital Projects Fund, forecasting the lottery’s contribution to the General Funds has been relatively simple. An examination of the recent history of the Consumer Price Index (CPI), along with a study of current sentiment of future inflation expectations can lead to a relatively accurate forecast for lottery transfers.
As shown in the above graph, revenues from the lottery have been relatively steady over the last fifteen years with relatively low volatility, ranging from an increase of $56 million in FY 2006 to a decrease of -$48 million in FY 2007. Because of these low year-over-year changes, this revenue source has had very little impact on the volatility of overall general funds. And unless there are changes to the distribution of lottery levels in the future, this low volatility will continue into the foreseeable future.
-$14
$31
-$23 -$36
$36 $6
-$4 -$30 -$20 -$25 -$14
$54
-$15
$30 $44 $56
-$48
$35
-$32
$0 $7 $8 $16 $12 $14
-$3,000
-$2,000
-$1,000
$0
$1,000
$2,000
$3,000
$4,000
Fiscal Year
Year-Over-Year Change in Lottery Revenues to General FundsFY 1990 - FY 2015 (est.)
($ in millions)
Lottery Total General Funds

49
Riverboat Gaming Fund Transfer:
Composition: 0.8% of FY 2015 (est.) Base General Funds Revenues
Description: The State receives revenues from Illinois’ ten licensed riverboat casinos through wagering taxes, admission taxes, and license fees.
Rate and base: • Wagering Tax: A graduated tax structure, ranging from 15% to 50% of a riverboat casino’s
adjusted gross receipts. • Admission Tax: a) $2 per person if admissions in 2004 were up to 1 million (Rock Island);
b) $3 per person for all other casinos. • License fees:
$25,000 nonrefundable application fee. $5,000 annual operator’s fee. $50,000 fee for background investigation costs. $5,000 annual gambling device supplier’s fee.
Other State Taxation: Many states have licensed commercial casinos. Other states in the Midwest with riverboat casinos are Iowa, Indiana, and Missouri. Wisconsin also has 11 Native American tribal casinos. The tax rates vary from state to state. Like Illinois, Indiana and Iowa have graduated tax structures with rates maxing out at 40% and 24%, respectively. Missouri has a flat tax of 21% on gross gaming revenue.
Revenue History: Illinois’ wagering tax was enacted in 1990 at a flat rate of 20% of adjusted gross receipts. The tax was changed to a graduated tax in 1997. In 2002, the maximum rate was 50%. In 2003, the maximum rate was increased to 70%. The maximum rate was reduced back to 50% in 2005.
$0
$100
$200
$300
$400
$500
$600
$700
$800
Fiscal Year
History of Gaming Fund TransferFY 1990 - FY 2015 (est.)
($ in millions)
Gaming Fund Transfer

50
Distribution: 5% of each casino’s adjusted gross receipts are distributed to local governments. A portion of revenues from the Des Plaines Casino are paid into the Cook County criminal justice system and to the School Infrastructure Fund. Another portion is set aside to pay administration and enforcement costs. The remainder is transferred from the State Gaming Fund to the Education Assistance Fund (General Funds). These are the amounts shown in the previous graph.
Trends and Outlook: • 15-Year Average Annual % Change: 3.6% • 10-Year Average Annual % Change: -6.3% • 5-Year Average Annual % Change: -5.0% • Anticipated 5-year Average Growth: -6.3%
Historical Volatility as Compared to Volatility of Total General Funds
Observations: After hitting its peak in the mid-2000s, revenues from Illinois casinos have been on a noticeable downward trend, falling at an average rate of 6.3% over the last 10 years. Several factors have contributed to this falloff, including the struggling economy, the indoor smoking ban on casinos, and increased competition from neighboring states. The latest figures show that the video gaming industry may also be having a negative impact on Illinois casinos, especially in the Chicago area where five of the State’s ten casinos reside. The Des Plaines Casino (opened in 2013) was the only casino to have positive growth in FY 2014 and has helped slow this overall downward trend in gaming revenues.
As shown in the above graph, revenues from riverboat transfers have fluctuated quite a bit over the last twenty-five years. The impact that these fluctuations have had on overall general funds depends on the year in question. For example, the $130 million increase in transfers in FY 2001 made up 15% of the overall $857 million increase in that fiscal year. However, due to the wide swings in overall growth in recent years, the year-over-year changes in riverboat transfers have had a relatively small influence on bottom line growth levels. In future years, while the impact is expected to continue to be small, the growth of video gaming in Illinois is expected to lower riverboat transfer figures even further, thus contributing a negative influence on year-over-year figures.
$0 $8 $46 $64 $53 $34
-$20 -$15
$70 $90 $130 $10 $84 $107 $38
-$10 -$4 -$121-$134
$1
-$107
$16 $5
-$24 -$21
-$3,000
-$2,000
-$1,000
$0
$1,000
$2,000
$3,000
$4,000
Fiscal Year
Year-Over-Year Change in Riverboat Revenues to General FundsFY 1990 - FY 2015 (est.)
($ in millions)
Gaming Fund Transfer Total General Funds

51
Other Transfers:
Composition: 4.0% of FY 2015 (est.) Base General Funds Revenues
Description: Specific funds are required by statute to make transfers to the General Funds. Amounts, timing and triggering mechanisms differ by each fund.
Rate and base: Top sources: Build Illinois Fund, Capital Projects Fund (CPF - required $245 million beginning in FY 2010), Hospital Provider Fund (began in FY 2007), Metropolitan Exposition Auditorium and Office Building (MEAOB) Fund, Warrant Escheat, Protest Fund, and the whistleblower funds.
Revenue History: There were additional funds from FY 2003 – FY 2007 including chargebacks, fund sweeps, transfers from increased fees, and transfers from the Efficiency Initiative Revolving Fund. Other years which had one-time transfers include: FY 2004 - liquor protest funds ($76 million) and State Pension Fund per statute ($48 million); FY 2006-FY 2008 & FY 2014- FY 2015 - Income Tax Refund Fund (ITRF); FY 2010 sweeps of $283 million; FY 2011 ($496) and FY 2015 (estimated $650 million) - Interfund Borrowing.
Trends and Outlook: • Average Change Since FY 2000: 12.8% • Average Change Since FY 2005: 5.2% • Average Change Since FY 2010: 22.8% • Anticipated 5-year Avg. Growth: Excluding one-time transfers, there is little growth in base
transfers.
$0
$200
$400
$600
$800
$1,000
$1,200
$1,400
$1,600
$1,800
2000 2001 2002 2003 2004 2005 2006 2007 2008 2009 2010 2011 2012 2013 2014 2015(est.)
Fiscal Year
History of Revenues from Other TransfersFY 2000 - FY 2015 (est.)
($ in millions)
Other Transfers

52
Historical Volatility as Compared to Volatility of Total General Funds
Observations: Revenues from other transfers historically experience wide levels of fluctuations. While these fluctuations do not necessarily mirror the level of fluctuation in overall general funds from year to year, the extent of these fluctuations has shown to have a significant impact on general funds’ bottom lines. Over the last fifteen years levels of year-over-year change have ranged from a $570 million increase in FY 2004 to a $341 million falloff in FY 2012. These huge swings are in part due to the one-time nature of many of these transfers. Below is a brief description of the transfers that have occurred over the last several years.
Fund sweeps began in FY 2003 ($165 million) and chargebacks and fee increase transfers began in FY 2004 (combined $522 million). The negative changes in FY 2005-2006 were caused by court cases on the constitutionality of sweeps and chargebacks, so these transfers were blocked by the Treasurer and $250 million of these funds were redirected to other health-care related funds. FY 2007 had transfers from the Income Tax Refund Fund ( $120 million) and sweeps/fees ($315 million). FY 2008-FY 2009 show decreases because FY 2007 was the last year for chargebacks, and sweeps were not used. FY 2010 had $283 million in sweeps and a partial year from the Capital Projects Fund ($110 million). FY 2011 had Interfund Borrowing ($496 million) and CPF ($205 million). FY 2012 saw a decrease even with $420 million of CPF transfers (to make up for the two previous years). FY 2013 had CPF ($210 million) and FY 2014 had CPF ($280 million) and ITRF ($397 million). FY 2015 is estimated to see transfers to GRF from CPF ($245 million), ITRF ($100 million) and Interfund Borrowing ($650 million). FY 2016 will show a decline of 52.4% because it is not expected to get the one-time transfers, but will be getting its $245 million from the CPF.
$103
-$62
$2 $135$570
-$241 -$172
$193
-$260 -$141
$290 $398
-$341 -$197
$425 $427
-$3,000
-$2,000
-$1,000
$0
$1,000
$2,000
$3,000
$4,000
2000 2001 2002 2003 2004 2005 2006 2007 2008 2009 2010 2011 2012 2013 2014 2015(est.)
Fiscal Year
Year-Over-Year Change in Revenues from Other Transfers to General FundsFY 2000 - FY 2015 (est.)
($ in millions)
Other Transfers Total General Funds
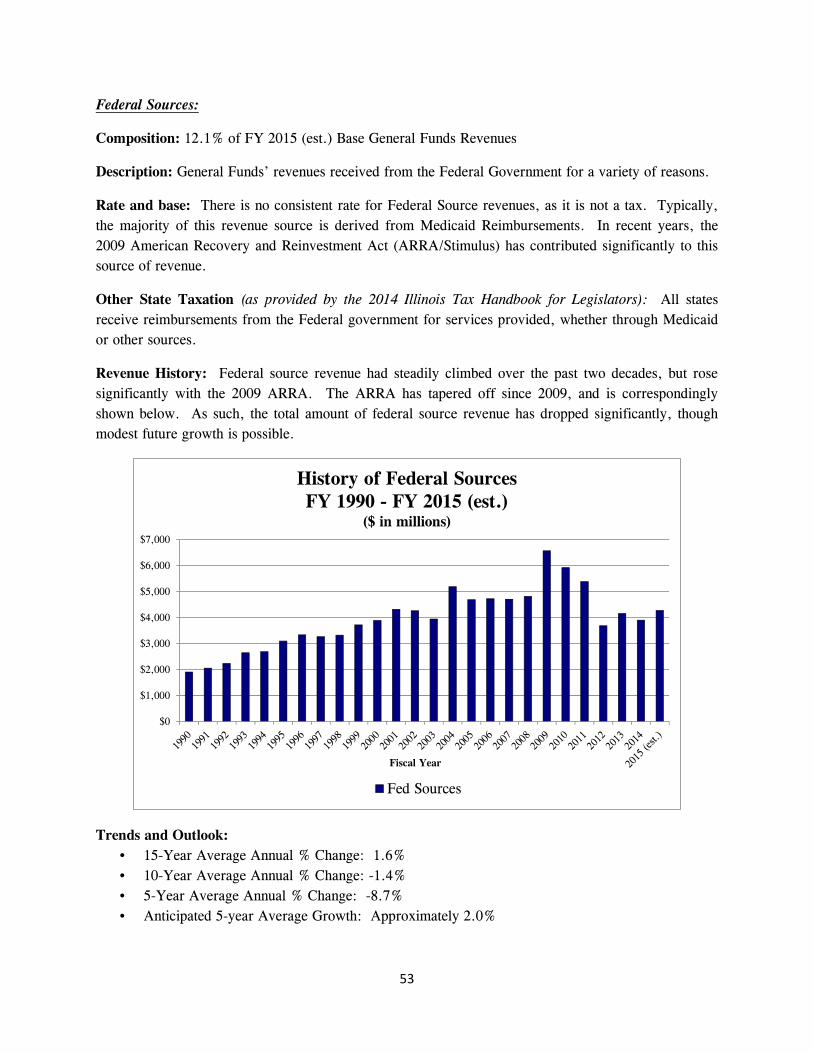
53
Federal Sources:
Composition: 12.1% of FY 2015 (est.) Base General Funds Revenues
Description: General Funds’ revenues received from the Federal Government for a variety of reasons.
Rate and base: There is no consistent rate for Federal Source revenues, as it is not a tax. Typically, the majority of this revenue source is derived from Medicaid Reimbursements. In recent years, the 2009 American Recovery and Reinvestment Act (ARRA/Stimulus) has contributed significantly to this source of revenue.
Other State Taxation (as provided by the 2014 Illinois Tax Handbook for Legislators): All states receive reimbursements from the Federal government for services provided, whether through Medicaid or other sources.
Revenue History: Federal source revenue had steadily climbed over the past two decades, but rose significantly with the 2009 ARRA. The ARRA has tapered off since 2009, and is correspondingly shown below. As such, the total amount of federal source revenue has dropped significantly, though modest future growth is possible.
Trends and Outlook: • 15-Year Average Annual % Change: 1.6% • 10-Year Average Annual % Change: -1.4% • 5-Year Average Annual % Change: -8.7% • Anticipated 5-year Average Growth: Approximately 2.0%
$0
$1,000
$2,000
$3,000
$4,000
$5,000
$6,000
$7,000
Fiscal Year
History of Federal SourcesFY 1990 - FY 2015 (est.)
($ in millions)
Fed Sources

54
Historical Volatility as Compared to Volatility of Total General Funds
Observations: As shown above, the volatility of federal sources mirrored overall general funds for much of the last twenty-five years. This is not necessarily surprising considering that federal source revenue’s composition of total general funds has averaged near 20% for much of this time period and because revenues from federal sources traditionally follow general economic trends. For example, when a recession hit in 2002 and revenues from economically-tied sources fell, so did revenues from federal sources (as shown in FY 2002 and FY 2003). As the economy recovered, so did federal source revenues (FY 2004).
This correlation in the volatility of federal sources and overall revenues appears to change in FY 2009 as overall revenues fell $1.718 billion despite a $1.752 billion increase in federal sources. However, this increase in federal sources was due, in large part, because of the ARRA federal stimulus package. This stimulus money was allocated by the federal government to help alleviate the revenue pressures that States felt as a result of the Great Recession.
The federal stimulus money continued to come in thru FY 2010, FY 2011, and FY 2012, albeit at a reduced rate. It is for this reason that the year-over-year values for federal sources are shown to fall in these fiscal years. The amount of stimulus money was significantly less in FY 2012, which helps to explain the $1.7 billion falloff in federal source revenues for that year.
The revenues in FY 2013 and FY 2014, with much reduced federal stimulus monies, have trended towards traditional year-over-year changes. A more typical federal source growth pattern is expected in the immediate future as revenues will again be primarily dependent on Medicaid funding reimbursements and other usual federal programs. However, it should be stressed that this revenue source is inherently prone to changes in federal funding priorities. For this reason the volatility of federal sources can be difficult to predict. And because the volatility of federal sources tends to make up a significant portion of the volatility of total general funds, this uncertainty makes estimating future volatility from overall revenues extremely challenging.
$152 $181$411
$44$408 $241
-$70
$54$395
$173$429
-$62-$318
$1,249
-$498
$34
-$22
$112
$1,752
-$647-$534
-$1,704
$472
-$251
$370
-$3,000
-$2,000
-$1,000
$0
$1,000
$2,000
$3,000
$4,000
Fiscal Year
Year-Over-Year Change in Federal SourcesFY 1990 - FY 2015 (est.)
($ in millions)
Fed Sources Total General Funds

55
A Closer Look at the “Big Three” As the previous sections have pointed out, due to their large composition of the general funds total, the “big three” revenue sources (personal income tax, corporate income tax, sales tax) have the largest influence on the volatility of general funds revenues from year to year. With this in mind the following section provides a more detailed look at the components of the tax base that make up these influential revenue sources. Many contend that Illinois may need to make changes to its tax structure to control revenue volatility so that economically-tied falloffs in the future can be minimized. (Although, others would argue that Illinois’ volatility is comparatively stable and that no significant changes are necessary). Because of their influence on the overall revenue picture, if modifying the State’s tax base to stabilize the volatility of General Funds was desired, tax changes would most likely have to come from the “big three” revenue sources. The following section includes discussions of proposals that have been offered in recent years that could impact revenue collections and volatility, including making adjustments to the tax expenditures (exemptions, credits, and deductions) that are currently reducing the taxable base and, in the case of the sales tax, broadening the tax base by taxing more services. The concept here is that a broader tax base will result in less volatility. While this type of change would likely reduce revenue volatility, it should be noted that it might also constrain future growth rates. Individual Income Tax Illinois increased its flat individual income tax rate from 3% to 5% in January 2011. It is statutorily set to fall back to 3.75% in January 2015. Currently, Illinois is one of seven states that impose a flat income tax (most have graduated tax rates). At the 3% rate, Illinois had the lowest tax rate of those with a flat tax. However, at the 5% rate, only Massachusetts (5.5%) has a higher flat rate. Seven states have no income tax and in two states, the income tax is limited to dividends and interest income only. Despite the ups and downs of income tax revenues in Illinois over the past decade, the individual income tax is considered a relatively stable revenue source compared to many other states. This is due to Illinois’ flat rate structure. Under a graduated tax structure, the highs and lows of revenues are much more pronounced because the volatility is often dependent on the income levels of the taxpayers at the upper end of the graduated tax scale. Years in which the economy is strong and taxpayers have a high level of capital gains, revenues from the higher tax brackets are strong, yielding large increases in income tax revenues. However, years in which the economy struggles and capital gains fall off, states with graduated tax structures can experience significant year-over-year declines.

56
So while Illinois’ tax base is more stable than states with graduated tax structures, Illinois often does not experience the level of increases that these other states experience. On the other hand, the falloff in revenues from income taxes will typically be less severe in Illinois than those states with a graduated tax structure. Therefore, the challenge with having a flat tax is that income tax growth is limited to increases in the taxable base– that is, unless tax rates are increased, which is of course what happened in Tax Year 2011. While the individual income tax may not be as volatile as some states, as recent history has shown, there still can be significant fluctuations in revenues. The reasons for these fluctuations can be better understood by looking at the components of the personal income tax. This revenue source is often broken down into three components: withholding payments, estimated payments, and final payments. A table displaying a revenue history of these components and their annual rates of change since FY 2000 is shown below.
Withholding payments are the largest component of income tax receipts, making up between 73% and 83% of total personal income tax receipts since FY 2000. These are the taxes that are withheld from paychecks and are based on employee‘s wages. Revenues collected from this method are the least volatile of the three types of payments. Between FY 2000 and FY 2010 the range of change for withholding tax payments has ranged from an increase of 7.2% in FY 2007 to a 2.8% loss in FY 2010.
Withholding Estimated FinalWithholding % change Estimated % change Final % change Total % Change
FY 2000 $6,260 5.9% $1,059 5.8% $947 8.6% $8,266 6.2%FY 2001 $6,540 4.5% $1,089 2.8% $989 4.5% $8,618 4.3%FY 2002 $6,470 -1.1% $924 -15.1% $696 -29.7% $8,090 -6.1%FY 2003 $6,460 -0.2% $839 -9.2% $678 -2.6% $7,977 -1.4%FY 2004 $6,646 2.9% $832 -0.9% $747 10.2% $8,224 3.1%FY 2005 $6,937 4.4% $958 15.2% $970 29.9% $8,865 7.8%FY 2006 $7,346 5.9% $1,115 16.3% $1,113 14.8% $9,574 8.0%FY 2007 $7,873 7.2% $1,315 18.0% $1,282 15.2% $10,470 9.4%FY 2008 $8,187 4.0% $1,476 12.2% $1,506 17.5% $11,169 6.7%FY 2009 $8,033 -1.9% $1,169 -20.8% $1,012 -32.8% $10,214 -8.6%FY 2010 $7,808 -2.8% $872 -25.4% $776 -23.4% $9,456 -7.4%FY 2011 $10,296 31.9% $1,113 27.6% $987 27.3% $12,396 31.1%FY 2012 $13,738 33.4% $1,576 41.6% $1,641 66.2% $16,956 36.8%FY 2013 $14,202 3.4% $1,853 17.6% $2,248 37.0% $18,303 7.9%FY 2014 $14,596 2.8% $1,982 6.9% $1,753 -22.0% $18,331 0.2%
According to the Department of Revenue, tax forms are typically categorized are as follows: Withholding: Forms 501, 941, 501/941 C, and W-3. Estimated: Form 1040 ES. Final: Forms 1040 C, 1040 F/O, 801, 505, as well as "Bad Check Penalty" revenues.
Revenue History of the Components of the Personal Income Tax
Note: These revenue totals may not match the Commission's reported "actuals" simply due to slight timing differences between taxes reported by the Dept. of Revenue and revenues received by the Comptroller.
$ in millions

57
Increases of 31.9% and 33.4% occurred in FY 2011 and FY 2012, but these increases were due to the 2011 tax increase. Estimated tax payments generally make up the next largest portion of individual income tax receipts, comprising, on average, 11.0% of total receipts since FY 2000. Estimated payments reflect what the owners of more volatile sources of income – such as investment and self-employment income – project they will owe by the end of the year. Generally, estimated payments are made in four installments throughout the year. Estimated tax receipts are traditionally a more volatile source because their revenues are tied to the performances of businesses and investments. In economic downturns, estimated payments can see drastic declines in revenues. This was the case following the “Great Recession” as estimated tax receipts fell 20.8% and 25.4%, respectively, in FY 2009 and FY 2010. However, estimated tax receipts can also experience significant increases as well during strong years of economic growth. This was the case in FY 2005-FY 2008 when the average rate of growth was 15.4%. Final tax payments have made up, on average, 10.3% of tax receipts since FY 2000. These payments are generally paid at the time that annual income taxes are filed, although they can be paid throughout the year. In FY 2014, 76.8% of final payments were paid in March and April. This component is also very volatile. Between FY 2000 and FY 2010, the annual rate of change has ranged from an increase of 29.9% in FY 2005 to a decline of 32.8% in FY 2009. Like the estimated tax payment, the volatility of final payments is typically tied to the performance of the economically-tied variables. The chart on the following page displays income tax receipts in a stacked-bar format by type of payments for the period FY 2000 – FY 2014. The impact of the tax hike can begin to be seen in FY 2011. As shown, due to its size, withholding payments generally impact the direction of revenues (positive or negative growth), despite being less volatile than the other two methods of payments. However, estimated and final payments tend to emphasize the direction that revenues go. When withholding revenues increase, estimated and final payments tend to see more pronounced increases. But when withholding receipts fall, drastic falloffs in estimated and final payments tend to occur. For example, in FY 2005, withholding receipts were up a solid 4.4%. But when including the 15.2% increase in estimated payments and the 29.9% increase in final payments, total receipts from the individual income tax were up a robust 7.8%. On the other hand, when withholding receipts fell 1.9% in FY 2009, estimated payments fell 20.8% and final payments declined a staggering 32.8% resulting in a total falloff of 8.6%. Therefore, while withholding receipts have the most influence on overall receipts, it is the other two components that tend to influence the extent of the volatility of this revenue source.

58
Illinois’ individual tax base, like numerous other states, is based on the federal definition of income, but with several modifications. These modifications often come in the form of exemptions, credits, and deductions. These “tax expenditures” can have a significant impact on the revenue source’s bottom line. For example, according to the Comptroller’s Tax Expenditure Report, the various exemptions, credits, and deductions offered to Illinois taxpayers reduced State income tax revenues by $3.9 billion in FY 2012 and by $4.4 billion in FY 2013. The largest tax expenditures for the personal income tax are shown in the following table.
$0
$2,000
$4,000
$6,000
$8,000
$10,000
$12,000
$14,000
$16,000
$18,000
$20,000
FY2000
FY2001
FY2002
FY2003
FY2004
FY2005
FY2006
FY2007
FY2008
FY2009
FY2010
FY2011
FY2012
FY2013
FY2014
Components of Personal Income Tax Receipts(FY 2000 - FY 2014)
$ in millions
Withholding Estimated Final
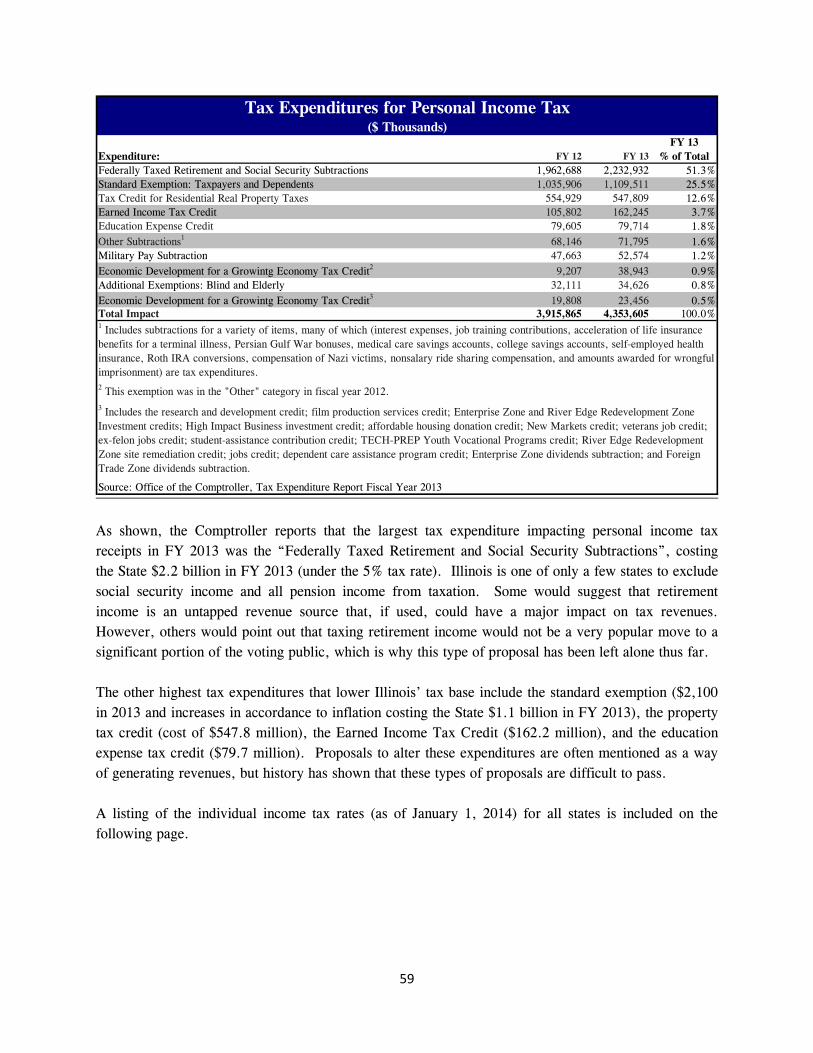
59
As shown, the Comptroller reports that the largest tax expenditure impacting personal income tax receipts in FY 2013 was the “Federally Taxed Retirement and Social Security Subtractions”, costing the State $2.2 billion in FY 2013 (under the 5% tax rate). Illinois is one of only a few states to exclude social security income and all pension income from taxation. Some would suggest that retirement income is an untapped revenue source that, if used, could have a major impact on tax revenues. However, others would point out that taxing retirement income would not be a very popular move to a significant portion of the voting public, which is why this type of proposal has been left alone thus far. The other highest tax expenditures that lower Illinois’ tax base include the standard exemption ($2,100 in 2013 and increases in accordance to inflation costing the State $1.1 billion in FY 2013), the property tax credit (cost of $547.8 million), the Earned Income Tax Credit ($162.2 million), and the education expense tax credit ($79.7 million). Proposals to alter these expenditures are often mentioned as a way of generating revenues, but history has shown that these types of proposals are difficult to pass. A listing of the individual income tax rates (as of January 1, 2014) for all states is included on the following page.
Expenditure: FY 12 FY 13FY 13
% of TotalFederally Taxed Retirement and Social Security Subtractions 1,962,688 2,232,932 51.3%Standard Exemption: Taxpayers and Dependents 1,035,906 1,109,511 25.5%Tax Credit for Residential Real Property Taxes 554,929 547,809 12.6%Earned Income Tax Credit 105,802 162,245 3.7%Education Expense Credit 79,605 79,714 1.8%Other Subtractions1 68,146 71,795 1.6%Military Pay Subtraction 47,663 52,574 1.2%Economic Development for a Growintg Economy Tax Credit2 9,207 38,943 0.9%Additional Exemptions: Blind and Elderly 32,111 34,626 0.8%Economic Development for a Growintg Economy Tax Credit3 19,808 23,456 0.5%Total Impact 3,915,865 4,353,605 100.0%
Source: Office of the Comptroller, Tax Expenditure Report Fiscal Year 2013
Tax Expenditures for Personal Income Tax($ Thousands)
1 Includes subtractions for a variety of items, many of which (interest expenses, job training contributions, acceleration of life insurance benefits for a terminal illness, Persian Gulf War bonuses, medical care savings accounts, college savings accounts, self-employed health insurance, Roth IRA conversions, compensation of Nazi victims, nonsalary ride sharing compensation, and amounts awarded for wrongful imprisonment) are tax expenditures.2 This exemption was in the "Other" category in fiscal year 2012.3 Includes the research and development credit; film production services credit; Enterprise Zone and River Edge Redevelopment Zone Investment credits; High Impact Business investment credit; affordable housing donation credit; New Markets credit; veterans job credit; ex-felon jobs credit; student-assistance contribution credit; TECH-PREP Youth Vocational Programs credit; River Edge Redevelopment Zone site remediation credit; jobs credit; dependent care assistance program credit; Enterprise Zone dividends subtraction; and Foreign Trade Zone dividends subtraction.

60
# of
State Low High Brackets Low High Child.ALABAMA 2.0 - 5.0 3 500 - 3,001 1,500 3,000 500
ALASKA
ARIZONA 2.59 - 4.54 5 10,000 - 150,001 2,100 4,200 2,100
ARKANSAS (a) 1.0 - 7.0 6 4,199 - 34,600 26 52 26
CALIFORNIA (a) 1 - 12.3 9 7,582 - 508,500 106 212 326
COLORADO 4.63 1 3,950 7,900 3,950
CONNECTICUT 3.0 - 6.7 6 10,000 - 250,000 13,000 24,000 0
DELAWARE 2.2 - 6.75 6 5,000 - 60,001 110 220 110
FLORIDA
GEORGIA 1.0 - 6.0 6 750 - 7,001 2,700 5,400 3,000
HAWAII 1.4 - 11.0 12 2,400 - 200,001 1,040 2,080 1,040
IDAHO (a) 1.6 - 7.4 7 1,409 - 10,568 3,950 7,900 3,950
ILLINOIS* 5.0 1 2,050 4,100 2,050
INDIANA 3.4 1 1,000 2,000 2,500
IOWA (a) 0.36 - 8.98 9 1,515 - 68,175 40 80 40
KANSAS 2.7 - 4.8 2 15,000 2,250 4,500 2,250
KENTUCKY 2.0 - 6.0 6 3,000 - 75,001 20 40 20
LOUISIANA 2.0 - 6.0 3 12,500 - 50,001 4,500 9,000 1,000
MAINE (a) 0 - 7.95 3 5,200 - 20,900 3,900 7,800 3,900
MARYLAND 2.0 - 5.75 8 1,000 - 250,000 3,200 6,400 3,200
MASSACHUSETTS (a) 5.2 1 4,400 8,800 1,000
MICHIGAN (a) 4.25 1 3,950 7,900 3,950
MINNESOTA (a) 5.35 - 9.85 4 24,680 - 152,541 3,950 7,900 3,950
MISSISSIPPI 3.0 - 5.0 3 5,000 - 10,001 6,000 12,000 1,500
MISSOURI 1.5 - 6.0 10 1,000 - 9,001 2,100 4,200 1,200
MONTANA (a) 1.0 - 6.9 7 2,700 - 16,400 2,280 4,560 2,280
NEBRASKA (a) 2.46 - 6.84 4 3000 - 29000 128 256 128
NEVADA
NEW HAMPSHIRE
NEW JERSEY 1.4 - 8.97 6 20,000 - 500,000 1,000 2,000 1,500
NEW MEXICO 1.7 - 4.9 4 5,500 - 16,001 3,950 7,900 3,950
NEW YORK 4.0 - 8.82 8 8,200 - 1,029,250 0 0 1,000
NORTH CAROLINA 5.8 1
NORTH DAKOTA (a) 1.22 - 3.22 5 36,900 - 405,100 3,950 7,900 3,950
OHIO (a) 0.534 - 5.392 9 5,000 - 200,000 1,700 3,400 1,700
OKLAHOMA 0.5 - 5.25 7 1,000 - 8,701 1,000 2,000 1,000
OREGON (a) 5.0 - 9.9 4 3,250 - 125,000 191 382 191
PENNSYLVANIA 3.07 1
RHODE ISLAND 3.75 - 5.99 3 59,600 - 135,500 3,800 7,600 3,800
SOUTH CAROLINA (a) 0 - 7 6 2,880 - 14,400 3,950 7,900 3,950
SOUTH DAKOTA
TENNESSEE
TEXAS
UTAH 5 1
VERMONT (a) 3.55 - 8.95 5 36,900 405,100 3,950 7,900 3,950
VIRGINIA 2 - 5.75 4 3,000 - 17,001 930 1,860 930
WASHINGTON
WEST VIRGINIA 3 - 6.5 5 10,000 - 60,000 2,000 4,000 2,000
WISCONSIN (a) 4.4 - 7.65 4 7,500 - 225,000 700 1,400 700
WYOMING
Illinois' Individual Income Tax Rate is statutorily set to fall to 3.75% on January 1, 2015. Illinois' Standard Exemption amounts are indexed to the rate of inflation.
Source: The Federation of Tax Administrators. For further detail about these rates, please go to the following website: http://www.taxadmin.org/fta/rate/ind_inc.pdf
(a) 17 states have statutory provision for automatically adjusting to the rate of inflation the dollar values of the income tax brakets, standard deductions, and/or personal exemptions. Massachusetts, Michigan, and Nebraska index the personal exemption amounts only.
---Flat rate---
No State Income Tax
No State Income Tax
STATE INDIVIDUAL INCOME TAX RATES(Tax rates for tax year 2014 -- as of January 1, 2014)
No State Income Tax
---Flat rate---
---Tax Rates--- --Income Brackets-- ---Personal Exemption---
Single Married
---Flat rate---
---Flat rate---
---Flat rate---
No State Income Tax
---Flat rate---
No State Income Tax
State Income Tax of 6% on Dividends and Interest Income Only.
No State Income Tax
No State Income Tax
State Income Tax of 5% on Dividends and Interest Income Only.
---Flat rate--- -----------None-----------
---Flat rate--- None

61
Corporate Income Tax Illinois increased its flat corporate income tax rate from 4.8% to 7.0% in January 2011. It is statutorily set to fall back to 5.25% in January 2015. Illinois is currently one of thirty-two states with a flat corporate income tax. As discussed previously, the corporate income tax is a much more volatile source than that of the individual income tax. This is because the corporate income tax does not have the stable stream of withholding taxes contributing to its receipts. Its receipts are based on the two more volatile components: estimated taxes and final taxes. A revenue history of these components since FY 2000 is displayed below.
Since FY 2000, estimated payments make up, on average, around 60% of total corporate income tax receipts. Similar to the personal income, estimated tax receipts from the corporate income tax often experience dramatic fluctuations in its revenue totals. This is because estimated payments are based on anticipated corporate profits which are difficult to predict and by their nature experience different levels of variability from year to year. The annual rate of change of these estimated receipts has ranged from a decline of 23.7% in FY 2001 to an increase of 29.2% in FY 2005 (not counting the large increases in FY 2011 and FY 2012 that were heavily influenced by the income tax rate hikes). Final payments, which make up, on average, the remaining 40% of corporate tax receipts can also experience high levels of volatility. Between FY 2000 and FY 2010, the annual rate of change has ranged from a decline of 38.5% in FY 2010 to an increase of 39.1% in FY 2007. Again, this does not include the increases experienced from the 2011 tax increases, which were seen in FY 2011 and FY 2012 totals.
Estimated FinalEstimated % change Final % change Total % Change
FY 2000 $1,056 16.3% $498 -2.7% $1,554 9.4%
FY 2001 $805 -23.7% $499 0.3% $1,305 -16.0%FY 2002 $652 -19.1% $415 -16.9% $1,067 -18.3%FY 2003 $663 1.8% $355 -14.5% $1,018 -4.5%FY 2005 $986 29.2% $601 -12.3% $1,587 9.5%FY 2006 $1,139 15.6% $673 11.9% $1,812 14.2%FY 2007 $1,258 10.5% $936 39.1% $2,194 21.1%FY 2008 $1,310 4.1% $911 -2.6% $2,221 1.2%FY 2009 $1,012 -22.7% $1,078 18.3% $2,090 -5.9%FY 2010 $1,015 0.3% $663 -38.5% $1,678 -19.7%FY 2011 $1,342 32.2% $939 41.6% $2,281 35.9%FY 2012 $1,837 36.9% $1,166 24.2% $3,003 31.7%FY 2013 $2,191 19.2% $1,499 28.5% $3,689 22.8%FY 2014 $2,204 0.6% $1,464 -2.3% $3,668 -0.6%
According to the Department of Revenue, tax forms are typically categorized are as follows: Estimated: Form 1120 ES.
Final: Forms 1000, 1023C, 1023CES, 1041, 1065, 1120, 1120C, 1120ST, 505B, 801, 990T, as well as revenues from adjustments.
Revenue History of the Components of the Corporate Income Tax$ in millions

62
Below is a graph breaking down the corporate income tax receipts by type of payment between FY 2000 and FY 2014. Again, the impact of the income tax hike can be seen starting in FY 2011. The volatility of corporate income tax receipts can clearly be seen in this graph.
One important aspect that helps explain the volatility of the corporate income tax is the fact that the income tax payments from just a few companies can have a major impact on overall receipts. According to 2010 tax data from the Illinois Department of Revenue, there were 111,519 corporate income tax filers in Illinois. But only 33,619 of these, or 30.1% of these filers, had a corporate income tax liability. Furthermore, of the nearly $1.8 billion in corporate tax liability in this year, 98.5% of the liability came from only 7.2% of the corporate income tax filers. Broken down even further, 303 Illinois corporations had a liability of over $1.0 million. While they make up only 0.3% of all filers, their tax liability made up 67.0% of total corporate income tax liabilities in tax year 2010. Therefore, dramatic changes in the tax receipts of one of these top level companies can have a significant impact on overall corporate tax receipts, thus contributing to the volatility often seen in this revenue source. If the taxpayer does not have federal tax liability, there would also be no tax liability in the State of Illinois. This is an important point because when discussions occur regarding altering the taxable base to obtain more revenues, as long as Illinois continues to piggy-back off of the federal tax form, the State is limited to what changes it can make to generate more corporate tax dollars. One thing that it can do is change the tax rates, which the State, of course, did in 2011. The other thing is make changes to the “tax expenditures” that reduce Illinois corporation’s tax liability.
$0
$500
$1,000
$1,500
$2,000
$2,500
$3,000
$3,500
$4,000
FY2000
FY2001
FY2002
FY2003
FY2005
FY2006
FY2007
FY2008
FY2009
FY2010
FY2011
FY2012
FY2013
FY2014
Components of Corporate Income Tax Receipts(FY 2000 - FY 2014)
$ in millions
Estimated Final
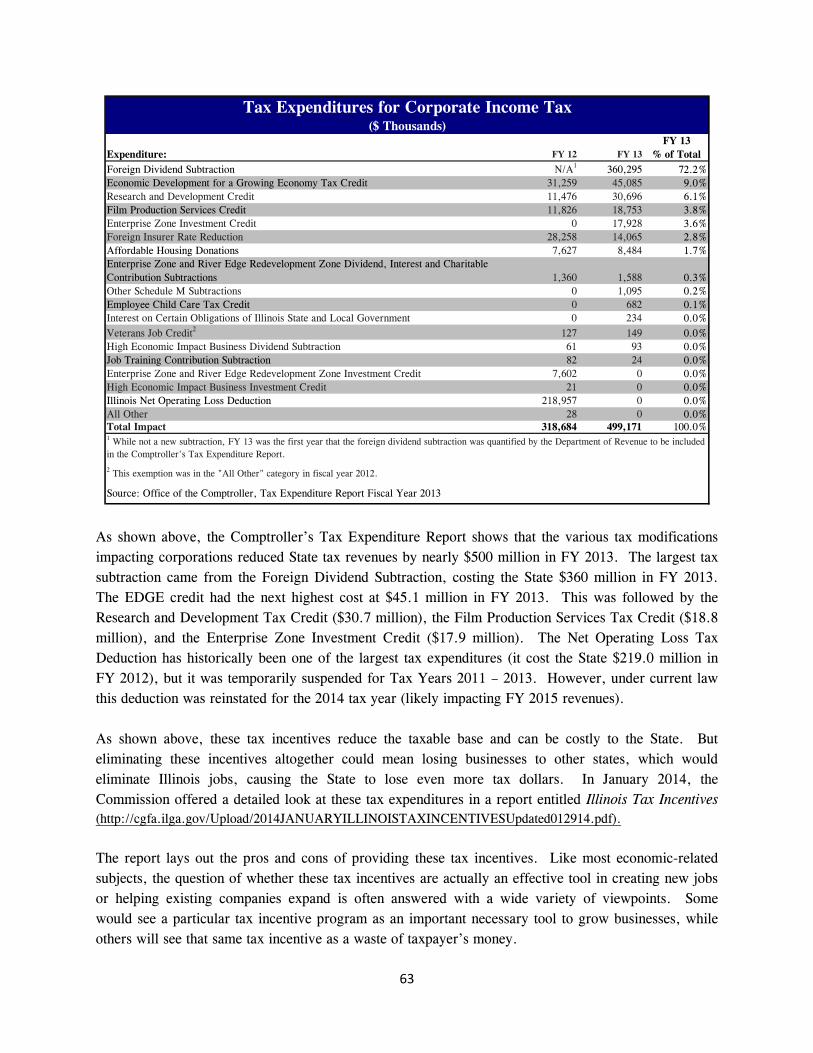
63
As shown above, the Comptroller’s Tax Expenditure Report shows that the various tax modifications impacting corporations reduced State tax revenues by nearly $500 million in FY 2013. The largest tax subtraction came from the Foreign Dividend Subtraction, costing the State $360 million in FY 2013. The EDGE credit had the next highest cost at $45.1 million in FY 2013. This was followed by the Research and Development Tax Credit ($30.7 million), the Film Production Services Tax Credit ($18.8 million), and the Enterprise Zone Investment Credit ($17.9 million). The Net Operating Loss Tax Deduction has historically been one of the largest tax expenditures (it cost the State $219.0 million in FY 2012), but it was temporarily suspended for Tax Years 2011 – 2013. However, under current law this deduction was reinstated for the 2014 tax year (likely impacting FY 2015 revenues). As shown above, these tax incentives reduce the taxable base and can be costly to the State. But eliminating these incentives altogether could mean losing businesses to other states, which would eliminate Illinois jobs, causing the State to lose even more tax dollars. In January 2014, the Commission offered a detailed look at these tax expenditures in a report entitled Illinois Tax Incentives (http://cgfa.ilga.gov/Upload/2014JANUARYILLINOISTAXINCENTIVESUpdated012914.pdf). The report lays out the pros and cons of providing these tax incentives. Like most economic-related subjects, the question of whether these tax incentives are actually an effective tool in creating new jobs or helping existing companies expand is often answered with a wide variety of viewpoints. Some would see a particular tax incentive program as an important necessary tool to grow businesses, while others will see that same tax incentive as a waste of taxpayer’s money.
Expenditure: FY 12 FY 13FY 13
% of TotalForeign Dividend Subtraction N/A1 360,295 72.2%Economic Development for a Growing Economy Tax Credit 31,259 45,085 9.0%Research and Development Credit 11,476 30,696 6.1%Film Production Services Credit 11,826 18,753 3.8%Enterprise Zone Investment Credit 0 17,928 3.6%Foreign Insurer Rate Reduction 28,258 14,065 2.8%Affordable Housing Donations 7,627 8,484 1.7%Enterprise Zone and River Edge Redevelopment Zone Dividend, Interest and Charitable Contribution Subtractions 1,360 1,588 0.3%Other Schedule M Subtractions 0 1,095 0.2%Employee Child Care Tax Credit 0 682 0.1%Interest on Certain Obligations of Illinois State and Local Government 0 234 0.0%Veterans Job Credit2 127 149 0.0%High Economic Impact Business Dividend Subtraction 61 93 0.0%Job Training Contribution Subtraction 82 24 0.0%Enterprise Zone and River Edge Redevelopment Zone Investment Credit 7,602 0 0.0%High Economic Impact Business Investment Credit 21 0 0.0%Illinois Net Operating Loss Deduction 218,957 0 0.0%All Other 28 0 0.0%Total Impact 318,684 499,171 100.0%
Source: Office of the Comptroller, Tax Expenditure Report Fiscal Year 2013
Tax Expenditures for Corporate Income Tax($ Thousands)
2 This exemption was in the "All Other" category in fiscal year 2012.
1 While not a new subtraction, FY 13 was the first year that the foreign dividend subtraction was quantified by the Department of Revenue to be included in the Comptroller's Tax Expenditure Report.

64
A listing of the corporate income tax rates (as of January 1, 2014) for all states is included below. As provided by the Federation of Tax Administrators, Illinois’ corporate tax rate is shown to be 9.5%, which includes Illinois’ 2.5% personal property replacement tax.
State Tax Rates# of
BracketsState Tax Rates
# of Brackets
ALABAMA 6.5 1 MISSOURI 6.25 1ALASKA 0 - 9.4 25,000 222000 10 MONTANA 6.75 1ARIZONA 6.5 1 NEBRASKA 5.58 - 7.81 2
ARKANSAS 1.0 - 6.5 3,000 100,001 6 NEW HAMPSHIRE 8.5 1CALIFORNIA 8.84 1 NEW JERSEY 9.0 1
COLORADO 4.63 1 NEW MEXICO 4.8 - 7.3 500,000 1 million 3CONNECTICUT 7.5 1 NEW YORK 7.1 1DELAWARE 8.7 1 NORTH CAROLINA 6 1
FLORIDA 5.5 1 NORTH DAKOTA 1.48 - 4.53 25,000 50,001 3GEORGIA 6.0 1 OHIO ***
HAWAII 4.4 - 6.4 25,000 100,001 3 OKLAHOMA 6.0 1IDAHO 7.4 1 OREGON 6.6 - 7.6 2ILLINOIS* 9.5 1 PENNSYLVANIA 9.99 1
INDIANA** 7.5 1 RHODE ISLAND 9.0 1IOWA 6.0 - 12.0 25,000 250,001 4 SOUTH CAROLINA 5.0 1KANSAS 4 1 SOUTH DAKOTA 6.0-0.25
KENTUCKY 4.0 - 6.0 50,000 100,001 3 TENNESSEE 6.5 1LOUISIANA 4.0 - 8.0 25,000 200,001 5 TEXAS ****
MAINE 3.5 - 8.93 25,000 250,000 4 UTAH 5MARYLAND 8.25 1 VERMONT (b) 6.0 - 8.5 10,000 25,000 3MASSACHUSETTS 8.0 1 VIRGINIA 6.0 1
MICHIGAN 6.0 1 WEST VIRGINIA 6.5 1MINNESOTA 9.8 1 WISCONSIN 7.9 1
MISSISSIPPI 3.0 - 5.0 5,000 10,001 3 DIST Of COLUMBIA 9.975 1
Note: Nevada, Washington, and Wyoming do not have state corporate income taxes.
**** Texas imposes a Franchise Tax, known as the margin tax.
RANGE OF STATE CORPORATE INCOME TAX RATES(For tax year 2014 -- as of January 1, 2014)
----Flat Rate--------Flat Rate----
Tax Brackets
----Flat Rate----
----Flat Rate--------Flat Rate----
----Flat Rate----
----Flat Rate----
* Illinois' rate includes a 2.5% personal property replacement tax. The rate is statutorily set to decline from 7% to 5.25% (or 7.75% when including the CPPRT rate of 2.5%) on January 1, 2015.
Source: The Federation of Tax Administrators. For further detail about these rates, please go to the following website: http://www.taxadmin.org/fta/rate/corp_inc.pdf
----Flat Rate----
----Flat Rate----
----Flat Rate----
----Flat Rate--------Flat Rate----
----Flat Rate--------Flat Rate----
----Flat Rate----
----Flat Rate----
----Flat Rate----
----Flat Rate----
----Flat Rate--------Flat Rate----
Tax Brackets
(banks only)
----Flat Rate----
----Flat Rate--------Flat Rate----
----Flat Rate--------Flat Rate----
** Indiana's Adjusted Gross Income Tax on general corporations and non-financial institutions was lowered from 8.5% to 8% on July 1, 2012 and to 7.5% on July 1, 2013. It is set to further decrease to 7% on July 1, 2014 and finally to 6.5% on July 1, 2015.
*** Ohio does not levy a tax based on income, but imposes a Commercial Activity Tax (CAT) equals $150 for gross receipts between $150,000 and $1 million, plus 0.26% of gross receipts over $1 million.
----Flat Rate----
----Flat Rate----
----Flat Rate----
----Flat Rate----
----Flat Rate----
250,000----Flat Rate----
----Flat Rate----

65
Sales Tax One policy change that is often mentioned by researchers as a way to reduce the amount of variability from a tax revenue source is to broaden the tax base. Similar to diversifying a stock portfolio, the more items or situations that are taxed, the less likely tax revenue derived from that source will be adversely affected by changes in the business environment. One tax that is often mentioned as potentially being more volatile than necessary is the sales tax. In Illinois and most states that have sales taxes, there are numerous exemptions. These exemptions reduce the tax base upon which the sales tax is levied. These exemptions vary from state-to-state and often are tailored to favor local industries. In many states, such as Illinois, services are often exempted from the sales tax base. Researchers have indicated that including a larger number of services within its sales tax base may help reduce the volatility of its sales tax revenue by diversifying its sources of revenue. Illinois only taxes 17 services, while some states tax up to 160 different services. The Commission estimated in 2011 that the State could receive up to $4.0 billion a year in additional sales tax revenue if services were included in the tax base. While implementing a broad based sales tax on services will most likely decrease volatility, a sales tax implemented only on a select few services could actually increase sales tax volatility. For example, a sales tax aimed at luxury services would likely be the first to decline during periods of economic downturn, whereas a service tax on haircuts would likely be less affected as this service is more of a necessity. According to the Office of the Comptroller’s FY 2013 Tax Expenditure report, Illinois relinquishes approximately $3.5 billion per year in sales tax revenue from specific exemptions. This amount does not include tax revenue lost to the general tax policy of not taxing services in Illinois. A list of the largest sales tax exemptions (known as tax expenditures) can be found on the next page. Tax expenditures are enacted for a variety of reasons. In Illinois, they have been used to provide tax fairness (e.g. food and prescription drug exemption from sales taxes), encourage education (e.g. tuition tax credits), and promote economic development (e.g. tax exemptions for Enterprise Zone businesses). Illinois currently has over 50 classes of items and kinds of situations that are exempt from the sales tax. One of the largest sales tax exemptions is for food and drug sales which accounts for almost half the sales tax expenditures under the sales and use tax. Prior to 1984, the State of Illinois taxed food and drug sales, but since then, has had a policy of not taxing them at the State level. Illinois taxes food and drug sales at a reduced rate of 1% which goes to local governments. This is similar to 38 other states that either: exempt food sales, tax it at a lower rate, or do not have a sales tax at all. Almost all states exempt prescription drugs, while 10 states, including Illinois, have a reduced rate or no sales tax on non-prescription drugs. Researchers have indicated that by forgoing taxing food and drug purchases, states are reducing their sales tax revenue and increasing the volatility of their sales tax receipts. In FY 2013, the Department of Revenue estimated that the State of Illinois’s food, drug and medical device exemption cost the State approximately $1.6 billion in sales tax revenue. The food and drug exemptions made up the vast majority of this amount. The reason for these type of exemptions are

66
often cited as to improve the progressivity of the tax as it hits poorer households harder than middle and upper class households. Under federal law, items purchased with food stamps cannot be taxed; therefore, if the sales tax base was broadened in Illinois to include sales of food, there would still be some protection for the very poor. As indicated previously, since 1984, Illinois has made a policy decision to not tax food and drug purchases with the trade-off of reduced revenue and increased sales tax revenue volatility. Sales to exempt organizations (such as governmental bodies and tax-exempt organizations) accounted for approximately $333 million in FY 2013. This was followed by the Traded-In Property Exemption at $282 million. The Farm Chemicals Exemption which includes feed and seed totaled $267 million, while the Manufacturing and Assembling Machinery and Equipment Exemption reduced sales tax revenue by approximately $200 million. These kinds of exemptions vary from state to state but most states have an assortment similar to Illinois. The table on the following page summarizes sales tax bases around the country. The table illustrates sales tax rates, how many services are taxed in each state, along with which states exempt food and drug sales.
Expenditure: FY 12 FY 13FY 13
% of TotalFood, Drugs, and Medical Appliances Rate Reduction 1,635,000 1,644,000 46.9%Sales to Exempt Organizations 405,000 333,000 9.5%Traded-In Property Exemption1 315,000 282,000 8.1%Farm Chemicals (Includes Feed and Seed) Exemption 259,000 267,000 7.6%Manufacturing and Assembling Machinery and Equipment Exemption 183,000 204,000 5.8%Gasohol Discount 142,000 146,100 4.2%Biodiesel Discount and Exemption 127,000 132,700 3.8%Retailer's Discount 121,000 124,500 3.6%Rolling Stock Exemption 74,000 76,100 2.2%Farm Machinery and Equipment Exemption 57,000 71,000 2.0%Sales of Vehicles to Automobile Rentors Exemption 43,000 45,600 1.3%Sales of Motor Vehicles to Non-Residents Exemption2 43,000 39,900 1.1%Manufacturer's Purchase Credit 37,500 34,539 1.0%Newsprint and Ink to Newspapers and Magazines Exemption 32,000 32,000 0.9%Building Materials Within Enterprise Zone, River Edge Redevelopment Zone, or Intermodal Terminal Facility Redevelopment Project Exemption 4,100 23,899 0.7%Designated Tangible Personal Property within Enterprise Zone Exemption 20,000 18,608 0.5%Graphic Arts Machinery and Equipment Exemption 8,000 10,200 0.3%All Other3 6,900 17,060 0.5%Total Impact 3,512,500 3,502,206 100.0%
Source: Office of the Comptroller, Tax Expenditure Report Fiscal Year 2013
Tax Expenditures for Sales and Use Tax
1 Beginning in fiscal year 2013, this expenditure applies only to motor vehicles. The Department of Revenue no longer has data to estimate the non-motor vehicle share.
2 This exemption is given only to buyers whose home state extends the same exemption to Illinois residents. Thus, Illinois taxes the full amount of out-of-state sales when an Illinois resident brings a vehicle back to register. In that way, Illinois receives some compensation for this tax expenditure in a way that it does not for others.3 Two newly reported exemptions were added to this category in fiscal year 2013: High Impact Business Building Materials Exemption and High Impact Business Designated Tangible Personal Property Exemption. They were formerly added in to the Designated Tangible Personal Property within Enterprise Zone Exemption.
($ Thousands)

67
STATETax Rate
(percentage) Services Taxed Food (1)Prescription
DrugsNonprescription
DrugsALABAMA 4.0 37 *ALASKA none 1 * *ARIZONA 5.6 55ARKANSAS 6.5 72 1.5% (4) *CALIFORNIA (3) 7.5 21 * *COLORADO 2.9 15 * *CONNECTICUT 6.35 79 * *DELAWARE none 143 * * *FLORIDA 6.0 63GEORGIA 4 36 * (4) *HAWAII 4 160 *IDAHO 6 29 *ILLINOIS 6.25 17 1% 1% 1%INDIANA 7 24 * *IOWA 6 94 * *KANSAS 6.15 74 *KENTUCKY 6 28 * *LOUISIANA 4 55 * (4) *MAINE 5.5 25 * *MARYLAND 6 39 * * *MASSACHUSETTS 6.25 18 * *MICHIGAN 6 26 * *MINNESOTA 6.875 66 * * *MISSISSIPPI 7 72 *MISSOURI 4.225 26 1.225% *MONTANA none 18 *NEBRASKA 5.5 77 * *NEVADA (5) 6.85 (5) 18 * *NEW HAMPSHIRE none 11 * * *NEW JERSEY 7 74NEW MEXICO 5.125 158 * *NEW YORK 4 57 * * *NORTH CAROLINA 4.75 30 * (4) *NORTH DAKOTA 5 26 * *OHIO 5.75 68 * *OKLAHOMA 4.5 32 *OREGON none 0 * * *PENNSYLVANIA 6 55RHODE ISLAND 7 29 * *
SOUTH CAROLINA 6 35 * *SOUTH DAKOTA 4 146 *TENNESSEE 7 67 5.0% *TEXAS 6.25 83 * * *UTAH 5.95 (4) 58 1.75% (4) *VERMONT 6 32 * * *VIRGINIA 5.3 (2) 18 2.5% (2) * *WASHINGTON 6.5 158 * *WEST VIRGINIA 6 106 * *WISCONSIN 5 76 * *WYOMING 4 58 * *DIST. OF COLUMBIA 5.75 73 * * ** -- indicates exempt from tax, blank indicates subject to general sales tax rate.
Source: FEDERATION OF TAX ADMINISTRATORS
EXEMPTIONS
STATE SALES TAX BASE (updated 2/17/2015)
(5) Nevada sales tax rate scheduled to decrease to 6.5% on July 1, 2015.
(1) Some state tax food, but allow a rebate or income tax credit to compensate poor households. They are: HI, ID, KS, OK, and SD.
(2) Includes statewide 1.0% tax levied by local governments in Virginia.
(3) Tax rate may be adjusted annually according to a formula based on balances in the unappropriated general fund and the school foundation fund.
(4) Food sales subject to local taxes. Includes a statewide 1.25% tax levied by local governments in Utah.

68
A Closer Look at Federal Sources As mentioned earlier, Federal Sources are oftentimes the “x-factor,” which determines the magnitude of the total revenue volatility. Essentially, Federal Sources to the General Funds are comprised primarily of Federal reimbursements derived from Medicaid spending. There are other, smaller, components, but Medicaid reimbursements usually comprise at least 90 percent of total Federal Sources receipts. Since Federal Sources is not a tax-based revenue source, and instead based upon state spending, receipt patterns are dictated by appropriation levels, available cash for spending, and state spending priorities for that fiscal year. In addition, changes at the federal level can have a significant impact on volatility experienced at the state level. A primary example of Federal spending priorities affecting Illinois revenue volatility in the recent past is the American Recovery and Reinvestment Act of 2009, otherwise known as the Federal Stimulus program. This program was utilized to provide additional financing and employment support to the states during the 2008-2009 recession. The payments for this program were disbursed over a period of years. However, this source of revenue for Illinois was entirely dependent on being passed by a contentious national legislature. Though it is not an issue of economic volatility, the political volatility involved in disbursing federal moneys to the states has an effect on state revenues from this particular source. The totals for this source are shown in the following graph.
From a high point in 2009 of approximately $6.5 billion in General Fund revenues, all Federal Sourced General Fund revenue for Illinois has dropped significantly to $3.9 billion in FY 2014. This follows the drop-off in Federal Stimulus funding since 2009. While more money was being distributed to

69
Illinois in the past, the slowdown in the Stimulus program has in part resulted in less federal revenue for Illinois. For the purposes of this report, it is useful to consider the current state of affairs in detail for Federal Sources revenues. To that end, revenue for the 2014 Fiscal Year is shown in the following chart.
$ in MillionsRevenue Source Number
Revenue Source Name FY 2014 Totals
439 Reimburse Audits-Fed Prog $4.86441 Reimburse Audits-DPA $0.25594 Department of Agriculture $0.15602 Consumer Product Safety $0.00604 Department of Defense $0.60618 HHS $2.05618 HHS $0.02626 Department of the Interior $0.09629 Department of Justice $0.03629 Department of Justice $0.00641 Tennessee Valley Authority $0.12661 USDA Food Stamp Admin. $82.54663 USDA Food Nutrition Services $10.46664 USDA Supplies Commodities $0.01674 Health Standards Quality $8.42675 Medical Administration $338.93676 Medical Assistance $3,370.35677 Refugee/Entrant Program $3.35679 Title IV-D $10.65687 Food Stamp Admin. $0.00691 Medical Administration* $0.00692 Medical Assistance* $32.89693 Refugee/Entrant Program $0.00694 Title IV-D Child Support $0.00764 Indirect Cost Reimbursement $1.979426 Federal Government $45.46
Total $3,913.20
* Federal Reimbursement for Public Aid Recoveries Trust.Note: Revenue Lines with $0 are due to inflows smaller than $1000.
FY 2014 Federal Sources: General Revenue Sources

70
As shown, the 2014 Fiscal Year Federal Sources General Revenue inflow was dominated by the Medical Assistance (Medicaid) line. This accounted for approximately $3.4 billion (86 percent) out of a total $3.9 billion in General Revenue for Illinois. Administration expenses for this line took up another approximately $339 million (8.7 percent), as shown above. The remaining approximately $204 million (5 percent) is made up of various smaller programs and initiatives.

71
Comparison of Different States’ Rainy Day Funds
The first rainy day fund (RDF) was a Working Capital Fund created in Florida in 1959 to pay for services during the summer after a crop freeze the previous year. The idea began to take root by 1980 when ten states had created Funds and another 20 more were created by the end of the decade. Today approximately 48 states have some kind of reserve fund, although not all are considered by experts to be rainy day funds [A Drop in the Bucket: Rainy day funds proved no match against recession-era budget gaps, by Todd Haggerty and Jonathan Griffin, National Conference of State Legislatures, April 2014, p. 23]. In some studies, Illinois’ Budget Stabilization Fund is not considered a true rainy day fund but instead is considered a cash-flow fund. This section looks at the Rainy Day Funds of each state. The following section will discuss Illinois’ rainy day fund in detail.
Although states had already been through the recession in 2001, and tried to prepare their rainy day funds for the future, they were still not prepared for the large and lasting impact of the Great Recession (December 2007-June 2009). States did not have enough money in their rainy day funds to counter the deep cuts of the Great Recession over the length of time it would last. Even after 2009, it has taken time for states’ economies to try to reach pre-recession levels. The Great Recession has influenced budgets for years going forward, sometimes realigning whole states’ budgets [State Budgeting and Lessons Learned from the Economic Downturn: Analysis and Commentary from State Budget Officers, Summer 2013, The National Association of State Budget Officers, p. 12-13]. While States worked to recover jobs, revenues and their overall economies, they would also have to re-evaluate their revenue and tax receipts, expenditures and savings.
Even those states that were able to save what they thought was a large amount failed to have enough to counter the economic problems of the Great Recession. In the summer of 2008, states had approximately $60 billion saved in rainy day funds. In the next year, deficits equaled $117 billion.” [Building State Rainy day funds: Policies to Harness Revenue Volatility, Stabilize Budgets, and Strengthen Reserves, July 2014, the Pew Charitable Trusts, p. 1]
State Rainy Day Funds as a Percentage of Expenditures
The table on the following page shows state rainy day funds as a percentage of state expenditures from FY 2005 through FY 2013. Many states dipped into their rainy day funds either during or after the Great Recession, or in some cases both, equaling about two-thirds of states from 2008-2010. [Managing Uncertainty: How State Budgeting Can Smooth Revenue Volatility, The Pew Charitable Trusts, p. 13].
There were several states that didn’t carry a balance for most if not all of those years. Two states do not have rainy day funds – Kansas and Montana, and Arkansas has not carried a balance in its RDF. California carried less than a 0.5% balance in FY 2007, and carried negative balances from FY 2010 to FY 2012, finally carrying a balance of 1.63% of expenditures in FY 2013. New Jersey fluctuated between 1% and 2.2% from FY 2005 – FY 2008, but then had a $0 balance from FY 2009 – FY 2013. Pennsylvania had a $0 balance from FY 2010 through FY 2013, and Wisconsin only carried a balance in FY 2007 (of 0.4% of expenditures).

72
StateFY 2005 % of ann exp
FY 2006 % of ann exp
FY 2007 % of ann exp
FY 2008 % of ann exp
FY 2009 % of ann exp
FY 2010 % of ann exp
FY 2011 % of ann exp
FY 2012 % of ann exp
FY 2013 % of ann exp
9-Yr Avg for State
Alabama 2.63% 6.02% 8.49% 2.88% 2.43% 0.00% 0.00% 0.19% 0.20% 2.54%Alaska 74.66% 74.65% 54.77% 147.59% 155.23% 156.96% 238.18% 226.44% 209.84% 148.70%Arizona 2.19% 7.42% 6.61% 1.49% 0.02% 0.00% 0.00% 3.00% 5.36% 2.90%Arkansas 0.00% 0.00% 0.00% 0.00% 0.00% 0.00% 0.00% 0.00% 0.00% 0.00%California 0.00% 0.00% 0.47% 0.00% 0.00% -7.01% -4.15% -2.58% 1.63% -1.29%Colorado 1.60% 0.00% 3.79% 3.82% 2.00% 1.96% 2.27% 3.90% 4.71% 2.67%Connecticut 4.36% 7.66% 8.95% 8.47% 8.21% 0.00% 0.00% 0.50% 1.43% 4.40%Delaware 5.24% 5.06% 5.16% 5.35% 5.64% 6.04% 5.69% 5.18% 5.44% 5.42%Florida 4.04% 4.11% 4.38% 4.85% 1.16% 1.30% 1.17% 2.12% 2.87% 2.89%Georgia 1.57% 4.48% 8.06% 5.27% 1.17% 0.73% 1.92% 2.18% 3.92% 3.25%Hawaii 0.00% 1.15% 1.15% 1.37% 1.12% 1.30% 0.20% 0.44% 0.42% 0.79%Idaho 0.76% 4.91% 4.73% 5.05% 4.71% 1.33% 0.00% 0.94% 4.99% 3.05%Illinois 1.07% 1.14% 1.08% 1.02% 1.02% 0.00% 0.95% 0.80% 0.91% 0.89%Indiana 2.69% 2.74% 2.81% 2.85% 2.80% 0.00% 0.44% 2.59% 3.61% 2.28%Iowa 4.91% 7.81% 9.94% 10.05% 8.75% 7.97% 8.23% 10.01% 9.53% 8.58%Kansas 0.00% 0.00% 0.00% 0.00% 0.00% 0.00% 0.00% 0.00% 0.00% 0.00%Kentucky 0.38% 1.41% 2.64% 2.28% 0.08% 0.00% 0.00% 1.29% 1.28% 1.04%Louisiana 6.40% 8.81% 8.07% 8.06% 9.10% 7.42% 8.31% 5.38% 5.31% 7.43%Maine 1.69% 2.79% 0.00% 3.71% 0.00% 0.00% 2.48% 1.44% 1.95% 1.56%Maryland 4.63% 6.15% 10.10% 4.74% 4.59% 4.56% 4.71% 4.50% 4.63% 5.40%Massachusetts 7.26% 8.42% 8.46% 7.78% 3.07% 2.20% 4.30% 5.09% 4.59% 5.69%Michigan 0.02% 0.02% 0.02% 0.02% 0.02% 0.03% 0.02% 4.43% 5.71% 1.14%Minnesota 9.22% 7.16% 7.18% 7.19% 2.34% 0.00% 0.06% 3.97% 3.51% 4.51%Mississippi 2.43% 0.44% 1.24% 7.16% 6.32% 5.95% 3.86% 2.05% 1.01% 3.38%Missouri 3.26% 3.47% 3.41% 3.46% 3.08% 3.45% 3.24% 3.16% 3.14% 3.29%Montana 0.00% 0.00% 0.00% 0.00% 0.00% 0.00% 0.00% 0.00% 0.00% 0.00%Nebraska 6.51% 9.40% 16.51% 16.81% 17.30% 14.10% 9.42% 12.45% 10.70% 12.58%Nevada 0.00% 7.43% 7.47% 2.12% 0.00% 0.00% 0.00% 1.27% 2.58% 2.32%New Hampshire 1.28% 5.17% 6.52% 5.82% 0.61% 0.64% 0.69% 0.73% 0.72% 2.46%New Jersey 1.04% 2.00% 1.60% 2.22% 0.00% 0.00% 0.00% 0.00% 0.00% 0.76%New Mexico 14.61% 14.36% 10.76% 12.23% 6.43% 5.17% 9.44% 12.78% 11.17% 10.77%New York 2.00% 2.03% 2.00% 2.26% 2.21% 2.31% 2.18% 2.31% 2.22% 2.17%North Carolina 1.98% 3.69% 4.22% 3.84% 0.76% 0.81% 1.56% 2.08% 3.22% 2.46%North Dakota 11.06% 10.35% 19.76% 16.61% 26.27% 20.50% 23.38% 17.36% 24.82% 18.90%Ohio 2.32% 4.07% 3.91% 3.83% 0.00% 0.00% 0.00% 0.91% 1.73% 1.86%Oklahoma 9.32% 8.94% 9.14% 9.26% 9.13% 7.29% 4.60% 9.93% 8.52% 8.46%Oregon 0.00% 0.00% 0.00% 4.57% 1.94% 1.57% 0.16% 0.66% 1.02% 1.10%Pennsylvania 1.43% 2.08% 2.72% 2.75% 2.79% 0.00% 0.00% 0.00% 0.00% 1.31%Rhode Island 3.11% 3.07% 2.45% 1.73% 2.67% 3.91% 4.40% 4.92% 5.35% 3.51%South Carolina 1.48% 2.73% 2.56% 1.33% 0.00% 2.17% 13.78% 5.22% 6.35% 3.96%South Dakota 13.55% 12.97% 12.19% 9.10% 9.28% 9.45% 9.32% 11.18% 10.46% 10.83%Tennessee 3.02% 3.59% 5.55% 6.83% 5.16% 4.79% 2.84% 2.74% 3.11% 4.18%Texas 0.02% 1.25% 3.71% 10.23% 15.86% 21.64% 12.95% 13.76% 15.12% 10.50%Utah 3.67% 6.04% 6.27% 6.97% 8.35% 4.71% 4.93% 5.70% 7.80% 6.05%Vermont 4.43% 4.67% 4.74% 4.83% 5.24% 5.24% 4.65% 4.64% 5.59% 4.89%Virginia 3.47% 6.99% 6.64% 5.88% 3.61% 1.99% 1.93% 1.86% 2.57% 3.88%Washington 0.00% 0.00% 2.07% 2.07% 0.14% 0.63% 0.01% 0.85% 1.74% 0.84%West Virginia 2.32% 10.08% 13.92% 15.46% 11.88% 15.12% 17.47% 20.56% 21.42% 14.25%Wisconsin 0.00% 0.00% 0.41% 0.00% 0.00% 0.00% 0.00% 0.00% 0.00% 0.05%Wyoming 34.33% 0.00% 16.18% 16.33% 22.74% 22.74% 47.59% 48.42% 51.85% 28.91%Annual Avg* 3.03% 4.17% 4.74% 4.60% 3.46% 2.69% 2.75% 3.36% 3.83%
Rainy Day Funds as a Percentage of States' Expenditures
Source: The Fiscal Survey of States, National Governors Association and National Association of State Budget Officers (issues from Spring 2006 - Spring 2014)* The Annual Averages exlude the following states due to their consistently high percentages which would skew the results: Alaska, North Dakota, West Virginia and Wyoming.Note: Kansas has a balance budget requirement.

73
Even in FY 2006, a few states started to see their economy being affected. Wyoming had an RDF at $446 million, or 34.3% of expenditures in FY 2005 which dropped to $0 in FY 2006. Wyoming began building up its RDF again starting in FY 2007 to 16.2%, increasing every year reaching 51.9% in FY 2013. Mississippi decreased its Rainy day fund by 81% in FY 2006 while expenditures rose.
Some states started to feel the impact in FY 2007, with 11 states seeing decreases in their RDFs as a percentage of expenditures, seven due to increases in expenditures, Maine used all of its rainy day funds, and three states saw a decrease in rainy day funds and expenditure increases. There was one notable case in FY 2007. Alaska increased its RDF by 24%, but saw an increase in expenditures of 70%. Even with these changes, Alaska’s RDF was still almost 55% of its expenditures that year.
Fifteen states were affected in FY 2008, with large decreases in eight states’ rainy day fund balances, including Georgia by 1/3, Maryland by over 50%, Alabama by 63%, and Arizona by 78%. This is the year that California’s and Wisconsin’s RDF balances went to $0. Three states had a decrease in percentage of RDF to expenditure due to increases in expenditures, and five of the states’ decreases were based on increased expenditures and decreases in rainy day fund balances at the same time.
FY 2009 was the worst year with twenty-eight states with lower percentages of RDF to expenditures, only four of which were due to increases in expenditures alone. Twelve states reduced expenditures from the previous fiscal year, but still had to use portions of their rainy day funds. Half of these states saw a decrease of 50% - 100% in the rainy day funds, five of which went to $0 (Maine, Nevada, New Jersey, Ohio, and South Carolina).
In FY 2010 there were fewer states affected and with less drastic changes. Twenty-two states saw a reduction in their RDF to expenditure percentage, seventeen of which reduced expenditures but still used portions of their rainy day funds. Idaho saw a rainy day fund decrease of 76% and five states had a $0 RDF balance – Alabama, Connecticut, Illinois, Indiana and Minnesota. Illinois’ $0 balance was due to a delay in repayment to the fund into the beginning of the next fiscal year.
During FY 2011 some states were still feeling the effects of the recession. Fifteen states saw reductions in their RDF to expenditure percentage rate. Idaho and Pennsylvania went to $0 balances, Washington had $1 million, and Hawaii and Oregon were down to $10 million each in their rainy day funds. Hawaii, Oregon and Washington had also reduced expenditures to deal with their deficit problems.
FY 2012 had ten states with reduced percentages of RDF to expenditures. Notable cases in this time period include Tennessee and Virginia who increased rainy day fund amounts and expenditures, but still saw a reduced percentage. South Carolina had increases in expenditures, but also had a decrease of 60% in its Rainy day fund. North Dakota’s percentage decreased due to a 35% increase in expenditures while its rainy day fund was static.
In FY 2013 there were thirteen states with lower RDF to expenditure percentages. Only five of these decreases were due to lower rainy day fund balances, and all were related to expenditure increases.
There were some states that weathered the Great Recession and its aftermath much better than the rest. Even with a dip in its percentage of rainy day fund to expenditures in FY 2007, Alaska’s percentage

74
never fell below 50%, and has remained over 200% since FY 2011, although this is an anomaly based on high revenues from natural resources and lower expenditures. There were nine other states that never fell below 3% - 6.5%, and two more -- North Dakota and South Dakotas -- which never fell below 9%-10%.
“Several states also reported that rainy day funds were not heavily relied upon because economic indicators suggested that the downturn would be a permanent reset for the state’s budget...Spending was reduced and rainy day funds maintained as long as possible.” [State Budgeting and Lessons Learned From the Economic Downturn, National Association of State Budget Officers, 2013, p. 12.]
Some states have been able to make their rainy day funds a priority and beef them up for future years. Alaska’s mineral revenues and Texas oil and natural gas revenues are dedicated funds for their RDFs. Other successful states fund their RDFs with surplus funds which are aided by revenues derived from natural resources or minerals such as oil, natural gas and coal: Nebraska, New Mexico, North Dakota, South Dakota, Texas, West Virginia and Wyoming. The FY 2013 percentage of rainy day funds to expenditures for Alaska is 210%, Wyoming is 52%, North Dakota is 25%, and West Virginia is 21%. Nebraska, New Mexico, South Dakota and Texas all range above 10%.
Importance of Rainy Day Funds
Not all states have the resources to contribute into their rainy day funds. Some of those issues come from priorities to increase spending or cut taxes in times of prosperity, rather than saving. Other times a state sees a surplus, they decide to create or expand programs. But regardless, the failure to create a reserve will be one less tool states will have available during steep economic downturns.
“Governments are difficult to turn around quickly, and when hard times come, the demand for services increases. A solid reserve fund gives a government time to make careful and smart adjustments to economic downturns without resorting to slash and burn cuts that will interrupt service delivery...and cause damage to the jurisdiction’s overall health. One of the lessons of the Great Recession is that the purpose of a reserve fund is to serve as a bridge to ensure cash flow and service delivery. What a reserve fund is not is a means to avoid tough choices. As soon as economic realities begin to change – not after the bottom has fallen out – a government needs to begin adjusting its expenditures.” [Governing for a Rainy Day, http://www.governing.com/templates/gov_print_article?id=205269101, Mark Funkhouser, April 30, 2013] “But rainy day funds should only be used to reduce the impact of budget shortfalls that arise from cyclical downturns – not to cope with long-term structural problems. [A Primer on State Rainy day funds, Institute on Taxation and Economic Policy, July 2004]
Rating agencies consider well-funded RDFs a positive for states and a measure of liquidity. As for Illinois’ rainy day fund, Standard & Poor’s notes in a review of the State’s April 2014 General Obligation bond sale, that besides issues with pension liabilities and economic performance, “the state's financial flexibility will continue to be constrained without a meaningful budget stabilization or rainy-day fund”. In early November 2014, Standard & Poor’s upgraded California one level for a constitutional change that would require windfall revenues to be put into their rainy day fund. This measure was approved by 69% of voters on their election day ballots.

75
The sections below show how the different states have approached their rainy day funds. [Source: draft NCSL Fiscal Brief on Rainy Day Funds. See appendices].
Rainy Day Fund Cap
Many initial Rainy day funds were given caps. Rating agencies, who consider rainy day funds a positive for state liquidity, offered a rule of thumb in the 1980s of 3% - 5% of revenues to be set aside for a rainy day fund. “Before the Great Recession, 37 states set caps using a fixed percentage of appropriations or revenue, most commonly 5 to 10 percent.” [Building State Rainy day funds: Policies to Harness Revenue Volatility, Stabilize Budgets, and Strengthen Reserves, July 2014, the Pew Charitable Trusts, p. 4-5]. Rainy day fund caps were often set too low and even if a state reached its cap, which isn’t always the case, the amount of funds were not enough to cover the drastic decline in revenues seen during the Great Recession. Current studies state that 10%-15% of revenues would be a better fund goal, with the Government Finance Officers Association on the high end of that or suggesting two months of general fund revenues [A Drop in the Bucket: Rainy day funds proved no match against recession-era budget gaps, by Todd Haggerty and Jonathan Griffin, State Legislatures, April 2014, p. 22].
Currently, 34 states have caps based on their general funds revenues, 7 based on expenditures, 7 have no caps and 2 use dollar amounts (Source: NCSL).
NUMBER OF STATES PER TYPE OF FUND CAP
Percentage By % of Revenues By % of Expenditures
3%-4% 1 1
5%-6.5% 10 3
7%-8% 9 1
9%-10% 8 1
12%-13% 2
15% 4
20% 1
TOTAL 34 7
By $ Amount 2
No Cap 7

76
As seen in the above table, the majority of states use the percentage of current or previous fiscal year general fund revenues as their cap, with over a third of these states at 6% of general fund revenues and under, and the majority at 10% and under. Illinois has this same type of cap which is set at 5% of general funds revenues. Seven states cap their rainy day funds as a percentage of expenditures, all but one are capped at 10% and under. Only one state has the high cap of 20% of expenditures and that’s Nevada, but three states can exceed their caps – Maryland at 7.5% of general fund revenues, Pennsylvania at 6% of general fund revenues, and North Carolina at 8% of general fund expenditures.
Of the states with no cap, two are considered not to have rainy day funds, Kansas and Montana, although Kansas is required to have a balanced budget every year. There is one state that has a rainy day fund which had no balance from FY 2005 through FY 2013 – Arkansas, whose cap is a mere $125 million, and whose expenditures for those years ranged from $3.63 billion to $4.73 billion. Minnesota has a cap of $1.003 billion on its two accounts combined, and California (which is counted in this exercise under a 5% cap) is capped at either 5% of general funds revenues or $8 billion, whichever is more.
Only 12 states base their caps on fluctuations in revenues or in the economy, and in most cases, the cap has hindered states from saving an amount that would actually offset lower revenues. .” [Building State Rainy day funds: Policies to Harness Revenue Volatility, Stabilize Budgets, and Strengthen Reserves, July 2014, the Pew Charitable Trusts, p. 1]
Funding a Rainy Day Fund
How do you fund the Rainy day fund? A revenue stream, several revenue streams, one-time increases in revenues that were not expected, a percentage of revenues received or budgeted?
The National Conference of State Legislatures and the Pew Charitable Trusts have recently released studies on rainy day funds which discuss linking a state’s revenue volatility to the funding and uses of that state’s rainy day fund. The size of the rainy day fund should be linked to how much would be needed to cover times of volatility that decrease state revenues. Each state is different in its economy, revenue makeup, volatility types and levels. There is no single answer that will fit every state, but Pew has stated that linking savings to volatility can follow one of three common methods: linking overall revenue volatility to funding, linking particular volatile revenue streams or linking funding to the state’s economic conditions. [Building State Rainy day funds: Policies to Harness Revenue Volatility, Stabilize Budgets, and Strengthen Reserves, July 2014, the Pew Charitable Trusts, p. 15]
Twenty-three states deposit a portion of general funds revenues into their rainy day funds. Fourteen states use a percentage of all appropriations or surpluses from all funds. Eleven states use specific types of revenues or a combination of funding.
Alabama, Alaska, Louisiana and Texas, have oil, natural gas and/or mineral revenues that are used specifically to fund their Rainy day funds. Of these states, Alabama and Alaska have no cap on their rainy day funds, and Louisiana (4%) and Texas (10%) have caps based on a percentage of general fund revenues. Texas also requires 50% of a fiscal year’s unencumbered general funds balance at the end of

77
the biennium to be deposited in their rainy day fund. Mississippi places the first $5 million in interest earned on the Ayers Settlement Fund into its RDF.
Hawaii appropriates funds from general revenue funds to its rainy day fund, but also adds 15% of tobacco settlement monies received by the State annually, and 5% of the general fund balance when general funds revenues for two successive fiscal years exceed 5% for each of the preceding fiscal years.
West Virginia’s main fund receives 50% of surplus revenue (boosted by its revenues from coal), and its secondary fund received all remaining proceeds from the Tobacco Settlement Medical Trust Fund in 2006 along with any outstanding loan repayments due to the TSMTF fund.
Missouri’s Budget Reserve Fund was started with transfers of the balances of the Cash Operating Reserve Fund and the Budget Stabilization Fund. Interest on the Fund is put back in. When a “cash operating transfer” goes out of the fund, the repayment and interest that would have been earned are transferred back into the fund.
Massachusetts uses a combination of 0.5% of taxes, settlement revenues over $10 million, and capital gains tax revenues over $1 billion. Kentucky’s RDF funding comes from general funds surplus and unexpended appropriations. Washington deposits 1% of general state revenues plus ¾ of any extraordinary revenue growth at the end of the biennium.
Deposit Mechanisms
What trigger mechanism do you use to move money into the Fund? What requirements must be met and who approves it? Is the mechanism automatic without approvals that could be subject to political interference? Or is there approval from elected officials – Governor, Comptroller, Treasure, a majority vote of the Legislature?
Thirty-seven states have conditional deposit mechanisms. If a specific situation is present, then funds will be placed in the rainy day fund:
Twenty-three states put their deposits into their RDF only when there is a surplus or unexpended balances in funds, using either the total or a portion of the total.
Five states deposit funds based on a growth scenario, whether it be growth in general fund revenues or a separate factor such as personal income growth.
Three states have specific revenue sources that fund it based on conditional circumstances: o Alaska’s RDF receives funding when there are settlements related to minerals; o Louisiana from mineral revenues over $750 million; and o Missouri receives interest on the moneys originally transferred from the Fund.

78
Another three states are filled by appropriations with no specific requirements: o Alabama’s Governor certifies to the Comptroller and General Assembly when revenues
are such that proration would occur in appropriations from State General Funds. Then funds are redirected from the Alabama Trust Fund which receives oil and gas capital payments;
o Ohio’s General Assembly is to maintain the Fund by appropriation that equals its cap of 5% of general fund revenues for the preceding fiscal year; and
o Arkansas’ General Assembly is to provide funds to its RDF. Three use at least two separate conditional revenue scenarios for funding:
o In Maryland, the annual funding of the RDF is based on its cash balance. If the RDF is below 3% of estimated general funds revenue, the Governor shall include at least $100 million in the budget. If the RDF is between 3% and the cap of 7.5% of estimated general funds revenue, then the appropriation should be the lesser of $50 million or the amount necessary for the RDF balance to exceed the cap (which is allowed).
o Texas has several funding mechanisms for its RDF: 50% of any unencumbered general revenue fund balance; an amount of general revenue equal to 75% of oil production tax collections
that exceed the base year of FY 1987; an amount of general revenue equal to 75% of natural gas production tax
collections that exceed the base year of FY 1987; and the Legislature may appropriate additional funds.
o NY has two funds, one with a required source and the other with a conditional source of funding. The Tax Stabilization Reserve Fund receives general fund cash surpluses up to
a maximum of 0.2% of total general fund disbursements. The Rainy Day Reserve Fund shall receive transfers up to 0.3% of the
aggregate amount estimated to be disbursed from the general fund in the current fiscal year, and may receive funds by appropriation or at the request of the Director of the Budget.

79
Eleven states have required deposits, no matter what the situation.
Eight with automatic formulas: o Based on a percentage of estimated General Fund revenues: California (3%), Florida
(at least 5%), and Rhode Island (2%). o Tennessee is a required 10% minimum of estimated general funds growth. o Colorado has statutorily required amounts per year to be put in its RDF. o Oregon’s is based on 1% of General Funds appropriations per biennium. o Mississippi receives all of the interest off of a particular fund that is invested (The
Ayers Settlement Fund. o Virginia bases its RDF funding by formula as specified in the state’s constitution:
Deposit ≥ 0.5 x [(certified tax revenues) x (fiscal year's % increase - average increase over six years)]. However, growth in certified tax revenues may be excluded, in whole or in part, from the computation immediately preceding for a period of time not to exceed 6 calendar years from the calendar year in which such tax rate increase or exemption repeal was effective.
Three with automatic formulas plus at least one separate conditional one: o Hawaii’s RDF receives automatic deposits from 15% of tobacco settlement revenues,
plus 5% of general funds balance whenever the state’s general fund revenues for each of two successive years exceeds each preceding fiscal year by 5%.
o Massachusetts requires the deposit of 0.5% of total revenues from taxes in the preceding fiscal year, and then allows excess funds from one-time settlements over $10 million, and excess funds over $1 billion in capital gains income.
o Washington requires 1% of general state revenues to be transferred to the RDF. The fund may also receive ¾ of any extraordinary revenue growth at the end of the biennium, as long as annual average state employment growth over the biennium is 1% or greater.
Several states have more than one type of RDF. Five states have two funds that can be used for stabilizing the budget, cash flow and/or emergencies (such as natural disasters). Three states have an RDF and a separate fund specifically to save for education. South Carolina has an RDF and a separate fund for capital projects, although this fund can be used for general funds, too. Vermont has three funds, a Budget Stabilization Trust Fund for deficits, a General Fund Budget Reserve (Rainy Day Reserve) for insufficient funding of expenditures, and an Education Fund Budget Stabilization Reserve.
Some states require the funding mechanism to go through the budget/appropriations process. While most of the states’ RDF mechanisms are through state statute, some states have theirs set through their constitution. Making the funding mechanism of a rainy day fund a constitutional requirement makes it difficult to change if any of the provisions of the Fund - funding mechanism, withdrawal requirements, repayment criteria or cap - are not working properly.

80
Twenty-one states fund their rainy day savings from surpluses at the end of the year. A criticism of this is that in this way funding is not planned and is not even a priority. [Building State Rainy day funds: Policies to Harness Revenue Volatility, Stabilize Budgets, and Strengthen Reserves, July 2014, the Pew Charitable Trusts, p. 7]. Some states spend any surplus revenues they might have by increasing expenditures or through supplemental expenditures. If your funding mechanism is based on surpluses, and you never have a surplus, there will be no money in your RDF.
A few states fund their rainy day funds using forecast errors while others use a percentage of revenue. Neither of these choices allow for the actual ups and downs in revenues or the economy. Some states leave the funding completely up to the legislature by appropriation. If the legislature cannot agree, or does not see the RDF as a priority, it will often not be funded [Building State Rainy day funds: Policies to Harness Revenue Volatility, Stabilize Budgets, and Strengthen Reserves, July 2014, the Pew Charitable Trusts, p. 8].
Tying the deposit mechanism to unexpected growth in revenues or economic factors is practiced in 12 states. Tied to total revenues are Hawaii, Idaho, Tennessee, Virginia, and Washington. Specifically, Virginia compares the current fiscal year’s growth rate to the average of the previous 6 years, setting aside 50%, and assumes that the growth was abnormal and not sustainable in future years. States that tie the deposits to a specific volatile revenue stream are Alaska, Louisiana, Massachusetts and Texas. And three states tie deposits to economic volatility: Arizona, Indiana and Michigan. [Building State Rainy day funds: Policies to Harness Revenue Volatility, Stabilize Budgets, and Strengthen Reserves, July 2014, the Pew Charitable Trusts, p. 10-15]
Pew Research recommends each state tie their deposits to their RDFs based on each state’s specific drivers of volatility, but allow for not saving in years with lower revenues. Timing of deposits should be studied so that they are effective, and should be considered a budget priority. The size of the fund should relate to each state’s history with volatility and how much that state would need in an economic downturn. Volatility studies and policy changes should be studied often. [Building State Rainy day funds: Policies to Harness Revenue Volatility, Stabilize Budgets, and Strengthen Reserves, July 2014, the Pew Charitable Trusts, p. 10-15]
Withdrawal of Funds
States need to decide their goals for the rainy day fund when deciding how it will be used. Whether it will be used for cash flow issues, failure of forecasted revenues, deficits, economic downturns, and/or emergencies (natural disasters), each state must set the criteria for when the state can tap their funds. Withdrawal rules should not be too loose or too strict, and should take into consideration the repayment provisions for the fund. [Building State Rainy day funds: Policies to Harness Revenue Volatility, Stabilize Budgets, and Strengthen Reserves, July 2014, the Pew Charitable Trusts, p. 9] While some states may generally allow the use of funds, others have specific requirements to be met to allow for the withdrawal of funds, and may only allow for a portion of the fund to be used. A few states specifically spell out uses to maintain programs for public health, safety and welfare; for education, for pensions, for state obligations that may not get funded (bonds); for settlements to be paid out; for retroactive tax

81
refunds. Six states just require that the legislature votes on an appropriation from the RDF with no limitations on what they are used for. Colorado has no criteria set at all.
After deciding and limiting the use of the Fund, it should be decided how much can be used --a portion or all? Who approves the withdrawal of funds? Who decides if the funds can be used? Should it be the Governor, the Comptroller, the Treasurer, the Legislature or some combination of these actors?
Sixty percent of states require withdrawals to be approved by votes of the Legislature, most as an appropriation from the RDF to general funds. Two states allow the Governor to make the decision on their own and one state allows the State Board of Executive to make the decision at the end of the fiscal year, after which the amount is to be included in the next fiscal year’s budget. Four states allow some form of the state’s CFO or Director of Finance to make the decision while notifying the legislature in some way, and Illinois allows for the Comptroller to make the transfer. Albeit under ambiguous criteria, five states have the transfer of funds done automatically due to a specific criteria or formula in statute.
Four states split out the approval between the executive and legislative branches depending on the fund they are from or how the funds are to be used. Nevada and New Jersey require the legislature to vote but if they are not in session, the Governor can declare an emergency and make the decision. Colorado has no criteria for the removal of moneys from its RDF.
The National Association of State Budget Officers recommends not using the entire rainy day fund in one year, but over multiple years. It also may be reasonable to delay the use of rainy day funds until decline in revenues is slowing and looking to turn around. Cuts to spending would occur first, then the RDF could be used to help sustain the level of spending [State Budgeting and Lessons Learned from the Economic Downturn: Analysis and Commentary from State Budget Officers, Summer 2013, The National Association of State Budget Officers, p. 2-3]. Colorado law states that if revenue forecasts indicate that over half the reserve will be depleted in a given fiscal year, the Governor is required to reduce General Fund appropriations to ensure that at least half of the reserve remains [Memorandum: Rainy day funds, Colorado Legislative Council Staff, January 20, 2010].
Repayment into the Rainy Day Fund
Repayment into the RDF may need to be a priority depending on how well the funding mechanism is working. But, should the fund be paid by the end of the fiscal year, or over several years? Will the current mechanism set up to save funds to the Rainy day fund take care of rebuilding it? Should repayment be delayed until the State’s economy has stabilized, and how will it be decided that the State’s economy has stabilized?
Thirty-two states do not require repayment into their rainy day funds, allowing the deposit mechanism to catch the fund back up to its cap. The remaining states have differing terms for repayment of their RDF. Illinois and Mississippi have RDFs that are considered to be working cash funds instead. These funds are to be repaid within the same fiscal year. Colorado requires its rainy day fund to be replenished each year which is a part of its budgeting process to set aside funds for its reserve [Memorandum: Rainy day funds, Colorado Legislative Council Staff, January 20, 2010].

82
Rainy day funds for Rhode Island must be paid back in 2 years, Missouri in 3 years, and both Alabama and Utah allow 10 years for repayment. Arkansas does have provisions for repayment, but has no time frame, a $125 million cap, and has never funded its RDF. California only requires that repayment occur for its Special Fund for Economic Uncertainties as soon as there are sufficient monies in the general fund, but does not have specific provisions for its Budget Stabilization Account.
Seven states have more complicated repayment provisions:
Florida requires that beginning 3 fiscal years after the use of rainy day funds, each year for 5 years one-fifth of what is owed is to be paid back from General Funds.
Iowa requires its cash reserve to be paid back in the same fiscal year, but its Economic Emergency Fund has no repayment provisions.
In Pennsylvania, money that was appropriated from that Fund which has lapsed is returned. For South Carolina, funds must be repaid within three fiscal years, by at least 1% of general
fund revenue of latest completed fiscal year up to the 5% cap. West Virginia requires payment in 90 days. This is based on provisions that the amount of
funds borrowed are capped at 1.5% of the general revenue estimate for the current fiscal year, or the amount the Governor decides is needed to meet state obligations.
New York has two funds with different types of withdrawals and each type of withdrawal has a different method of repayment:
o The Tax Stabilization Revenue Fund must be repaid within six years in three equal installments and stipulated in annual budget bills. Funds loaned on a temporary basis must be repaid by the end of the fiscal year.
o If funds are withdrawn from the Rainy Day Reserve Fund for an economic downturn, they must be repaid in three years. The Governor is required to set up provisions for repayment through appropriation for withdrawals for catastrophic events. Funds loaned on a temporary basis must be repaid by the end of the fiscal year.
Minnesota statute is a guideline with no specific time line or method of repayment. Statute says “The restoration of the budget reserve should be governed by principles based on the full economic cycle rather than the budget cycle. Restoration of the budget reserve should occur when objective measures, such as increased growth in total wages, retail sales, or employment, reflect upturns in the state's economy.”
“Budget officers from some states have also expressed concern that repayment provisions for rainy day funds are too stringent. Strict repayment provisions means that the state must refund the money taken from the rainy day account rather quickly, often before revenues have been given time to improve.” [State Budgeting and Lessons Learned From the Economic Downturn, National Association of State Budget Officers, Summer 2013, p. 14.]

83
Illinois’ Current Rainy Day Fund
Many of the studies used as research for this report stated that Illinois does not have a rainy day fund. It may come as a surprise to some, but Illinois does have a rainy day fund. The State of Illinois established the Budget Stabilization Fund (Fund #0686) on May 16, 2000, under Public Act 91-0703. Initially the Fund was set up to help with cash flow issues, for which it has been used, and was later designated to help the State with budget deficits. Following is information related to the Fund, including a timeline of the creation of the Fund and the changes made up to the present day.
June 2001 – Allows transfers from Budget Stabilization Fund to General Revenue Fund for cash flow issues
May 2000 - Creation of Budget Stabilization Fund
July 2001 – Transfer of $225 million from Tobacco Settlement Recovery Fund & $100,298 from Homeowners Tax Relief Fund into Budget Stabilization Fund as funding source November 2001 – First transfer from Budget
Stabilization Fund to General Revenue Fund
June 2002 – First repayment from General Revenue Fund transferred into Budget Stabilization Fund
June 2004 – Transfer of $50 million from General Revenue Fund to Budget Stabilization Fund to strengthen the Fund
July 2004 – Creation of the Budget Stabilization Act for budget deficits with triggering mechanism to fund it
June 2006 – Addition of Pension Stabilization Fund to the Act
January 2008 –FY 2008 is excluded from the triggering mechanism
June 2011 – Exception allowed for FY 2011 repayment to occur after the end of the fiscal year, but by July 15, 2011 June 2014 –Additional changes to the
Pension Stabilization Fund sections of Act
TIMELINE
January 2001 – Transfer of $601,764 from the Homeowners Tax Relief Fund into Budget Stabilization Fund
84
3) An analysis of the adequacy of the balances in the Budget Stabilization Fund in relation to the volatility of tax revenues;
History and Use of Fund
The State of Illinois established a “Rainy Day Fund” when the Budget Stabilization Fund (BSF) was created May 16, 2000, under Public Act 91-0703. Initial seed money was transferred in January 2001 from the Homeowner Tax Relief Fund in the amount of $601,764. The Fund received a one-time transfer from the “unencumbered balance of the Tobacco Settlement Recovery Fund” as of June 30, 2001, at the direction of the Governor under Public Acts 91-0704 and 92-0011. This transfer of $225 million occurred in July of FY 2002, plus $100,298 in transfers from the Homeowner Tax Relief Fund. The Treasurer was allowed to invest the funds, with proceeds to be deposited back into the Fund.
Public Act 92-0011 also allowed for the transfer of funds from the Budget Stabilization Fund to the General Revenue Fund (GRF) “in order to meet deficits resulting from timing variations between disbursements and the receipt of funds within a fiscal year”. These funds were to be transferred back by June 30 of the fiscal year borrowed.
These “cash flow” transfers began in FY 2002, with the Budget Stabilization Fund transferring approximately $225.7 million to the GRF in November FY 2002, which was transferred back to the BSF in June FY 2002. In FY 2003, the transfer of approximately $226 million from the BSF to the GRF occurred in July, and was transferred back over May and June of that fiscal year.
In FY 2004, as part of the Budget Implementation Act, fund transfers under the State Finance Act included a one-time transfer of $50 million from the General Revenue Fund to the Budget Stabilization Fund. This transfer occurred in June FY 2004. This increased the BSF to $276 million which would be used to transfer to GRF for cash-flow purposes.
From FY 2005 on, the full $276 million was transferred back and forth from the Budget Stabilization Fund to the General Revenue Fund, as needed by the GRF. In some years, FY 2009 - FY 2011, the transfers occurred more than once (see the table on the following page), and an exception was made for FY 2011 allowing the GRF until July 15, 2011 to transfer back the funds.
Although the Budget Stabilization Fund had been created and used for the purposes statutorily allowed, there was nothing in place to add revenues to the Fund. The Budget Stabilization Act [30 ILCS 122] was created through Public Act 93-0660, effective July 1, 2004. The Act meant to set up budget limitations that would allow a triggering mechanism for transferring additional funds into the Budget Stabilization Fund up to 5% of the State’s annual general funds revenues. (The most current version of the Budget Stabilization Act is attached at the end of this section, and includes information regarding the Pension Stabilization Fund.)

85
TRA
NSF
ERS
OF
0686
BU
DG
ET S
TABI
LIZA
TIO
N F
UN
D B
ALA
NC
E TO
AN
D F
RO
M 0
001
GEN
ERA
L R
EVEN
UE F
UND
(in m
illio
ns)
Fisc
al Y
ear
July
Aug
Sep
Oct
Nov
Dec
Jan
Feb
Mar
Apr
May
Jun
TOTA
LG
RF N
ETFY
200
2Tr
ansf
er in
to G
RF22
522
5Tr
ansf
er o
ut o
f G
RF(2
26)
(226
)FY
200
3Tr
ansf
er in
to G
RF22
622
6Tr
ansf
er o
ut o
f G
RF(2
6)(2
00)
(226
)FY
200
4*Tr
ansf
er in
to G
RF22
622
6Tr
ansf
er o
ut o
f G
RF(1
35)
(141
)(2
76)
FY 2
005
Tran
sfer
into
GRF
276
276
Tran
sfer
out
of
GRF
(95)
(181
)(2
76)
FY 2
006
Tran
sfer
into
GRF
276
276
Tran
sfer
out
of
GRF
(76)
(200
)(2
76)
FY 2
007
Tran
sfer
into
GRF
276
276
Tran
sfer
out
of
GRF
(276
)(2
76)
FY 2
008
Tran
sfer
into
GRF
276
276
Tran
sfer
out
of
GRF
(276
)(2
76)
FY 2
009
Tran
sfer
into
GRF
276
5020
050
576
Tran
sfer
out
of
GRF
(50)
(300
)(2
26)
(576
)FY
201
0Tr
ansf
er in
to G
RF27
640
130
7015
060
145
275
1146
Tran
sfer
out
of
GRF
(100
)(7
0)(2
30)
(130
)(1
35)
(205
)(8
70)
FY 2
011^
Tran
sfer
into
GRF
235
100
200
535
Tran
sfer
out
of
GRF
(276
)(6
0)(2
00)
(536
)FY
201
2Tr
ansf
er in
to G
RF27
527
5Tr
ansf
er o
ut o
f G
RF(2
75)
(275
)(5
50)
FY 2
013
Tran
sfer
into
GRF
275
275
Tran
sfer
out
of
GRF
(275
)(2
75)
FY 2
014
Tran
sfer
into
GRF
275
275
Tran
sfer
out
of
GRF
(275
)(2
75)
* In
FY
200
4, S
tatu
te re
quire
d a
one-
time
trans
fer f
rom
GRF
to th
e Bu
dget
Sta
biliz
atio
n Fu
nd.
^ A
ny m
oney
s bor
row
ed in
FY
201
1 sh
all b
e re
paid
no
late
r tha
n Ju
ly 1
5, 2
011
(FY
201
2).
00 0 276 (1)
(275
)
00(1) 0 (50) 0 0

86
Purpose The Act explains the purpose of the Fund, which among other things is to “meet State obligations whenever casual deficits or failures in revenue occur”, to address budget shortfalls and to maintain a high bond rating. These goals also fall under the same purposes described for most rainy day funds. Due to the facts that no other funds have been added to the Budget Stabilization Fund and it must be paid back at the end of the same fiscal year in which it was borrowed, the Fund has only been used for cash flow purposes and would not be sufficient to deal with substantial swings in revenue volatility.
Deposit Trigger
The Act sets limitations on the States’ annual budgets, with the current guidelines as follows:
If estimated General Funds revenues exceed the prior fiscal year’s estimated General Funds revenues by more than 4%, then appropriations and transfers from the General Funds shall not be greater than 99% of estimated General Funds for the fiscal year.
If General Funds revenue estimates exceed prior fiscal year’s estimates by more than 4% for two consecutive years, then appropriations and transfers from the General Funds shall not be greater than 98% of estimated General Funds for the fiscal year.
Public Act 95-0707 excluded FY 2008 from these budget limitations.
The following terms for these calculations are defined in the Act as follows:
"estimated general funds revenues include, for each budget year, all taxes, fees, and other revenues expected to be deposited into the State's general funds, including recurring transfers from other State funds into the general funds.”
“Year-over-year comparisons used to determine the percentage growth factor of estimated general funds revenues shall exclude the sum of the following: (i) expected revenues resulting from new taxes or fees or from tax or fee increases during the first year of the change, (ii) expected revenues resulting from one-time receipts or non-recurring transfers in, (iii) expected proceeds resulting from borrowing, and (iv) increases in federal grants that must be completely appropriated based on the terms of the grants.”
If the criteria are met for one year where estimated General Funds revenues exceed the previous year’s by over 4%, the 1% of appropriations and transfers that are not to be spent are to be divided in half between the Budget Stabilization Fund and the Pension Stabilization Fund. If met for two consecutive years or more, the 2% of appropriations and transfers that are not to be spent are to be divided in half between the Budget Stabilization Fund and the Pension Stabilization Fund.
[The original Act did not include the Pension Stabilization Fund, and budget limitations were 99.5% (instead of current 99%) and 99% for two consecutive years (instead of current 98%), with the 0.5% or the 1.0% in funds all going to the Budget Stabilization Fund. Public Act 94-0839, effective June 2006, changed these provisions and added the Pension Stabilization Fund to the Act.]

87
Deposit Mechanism
If the savings are triggered, the Comptroller is to transfer 1/12 of the total amount on the first day of each month of that fiscal year or as soon thereafter as possible into the Budget Stabilization Fund. By August 31 each fiscal year, the amount to be transferred must be reconciled with actual general funds revenues, and the percentages to be transferred based off of that amount.
For each fiscal year, beginning July 1, 2006, the budget proposal to the General Assembly shall identify liabilities incurred in a prior fiscal year under Section 25 of the State Finance Act and the budget proposal shall provide funding as allowable pursuant to the Budget Stabilization Act.
Fund Balance Limit
The cap on the Budget Stabilization Fund is 5% of the total of general funds revenues estimated for that fiscal year. If there are outstanding liabilities under Section 25 of the State Finance Act from prior fiscal years, the Comptroller is required to transfer 1/12 of the total amount that would have been transferred under the Act over the 5% for those Section 25 liabilities.
The Act does not prohibit appropriations of additional revenues into the Budget Stabilization Fund.
Positive Elements of the Budget Stabilization Act
The Budget Stabilization Act has some positive elements:
Allows for savings to pay outstanding liabilities for prior fiscal years. Limitation to appropriations to save money for a rainy day. Does not prohibit additional revenues from being added to the fund. The Fund’s cap represents a goal. Has a requirement for the payback to the Budget Stabilization Fund of funds used.
Problems with the Budget Stabilization Act
Unfortunately, the current legislation contains enough deficiencies and ambiguity that, if there were years when the process could have been triggered, it wasn’t. The statute has no process for review on its effectiveness or that of the Fund’s ability to deal with budget and economic crises. Below are specific areas that could be addressed to improve its effectiveness.
The cap for the Budget Stabilization Fund is 5%. Whether the cap is too low or high should be reviewed on a regular schedule. Current studies state that 10%-15% of revenues would be a better fund goal, with the Government Finance Officers Association on the high end of that or suggesting two months of general fund revenues.
The Fund only has one stated source for funding (estimated revenue growth over 4%). If this criterion is never met then you have no additional money being saved in the Fund. Multiple funding sources with their own triggers and mechanisms should be explored and possibly added to the Act, i.e. unexpected one-time revenues.

88
There is no process to review the effectiveness of the trigger to save funds or the mechanism for transferring funds.
The trigger for funding the Fund is based on each fiscal year’s General Funds estimate. The Act does not delineate whose estimate is to be used. Each year the Governor’s Office of Management and Budget as well as the Commission on Government Forecasting and Accountability create estimates. In recent years, the Legislature has been passing resolutions with their own official estimate after hearings reviewing the estimates from GOMB, IDOR, CGFA, outside organizations and interested parties. It would stand to reason that the legislatively passed revenue resolution should serve as the forecast in determining the trigger, but the statute is unclear.
The Act does not clarify who makes the official decision on whether the funding process is triggered, the Governor, the Comptroller, the Legislature, etc.
The Act does not give conditions to be met before the Fund is used (withdrawal criteria). There is no process of approval for the funds to be used (withdrawal approval). Funds are required to be paid back within the same fiscal year. In cases where there is a bad
economy and a large decline in revenues, there may need to be a longer payback time with increments required at various time intervals. The last two recessions have resulted in consecutive fiscal years of actual severe declines that would have made it virtually impossible to repay the rainy day fund under current law.
Conclusion
The current Budget Stabilization Fund has been used repeatedly in a cash flow borrowing manner. The Fund has had a maximum balance of $226 million to $276 million each year. Although the Fund has been helpful in alleviating some cash-flow and timing issues for the States’ budget, it does not hold a sufficient amount of funds to really help with the State’s budget crises. More funding from various sources, a higher level of funding, and a longer reimbursement time could aid the State in times of need. Illinois could also keep its Budget Stabilization Fund as a cash flow fund and create a second fund for economic downturns. Either way, the Budget Stabilization Fund would still need to be restructured to fix its flaws, including adding revenues to fund it.
Illinois could follow one or more of the methods of linking volatility to its funding of the Budget Stabilization Fund: linking overall revenue volatility to funding, linking particular volatile revenue streams to funding or linking funding to the state’s economic conditions. Some ideas based on what other states have done could include:
Volatile revenue streams: Some states use one-time funds that are not a part of annual revenues to fund their RDF. Illinois does have extra one-time “windfalls” in some fiscal years which go into the general funds either automatically as “Other Sources” or are transferred (“Other Transfers”) by existing statute, legislation, or direction of the Governor — Income Tax Refund Fund overages, court settlements, overpayment by funds, residual Tobacco Settlement Funds, excess whistleblower funds.

89
Annual automatic revenue stream: Some states are able to use tax and fee revenues from the production of natural energy resources. Illinois passed the Illinois Hydraulic Fracturing Tax Act (June 2013). This is an industry in its infancy in Illinois. All proceeds from these taxes and fees are to be paid into the General Revenue Fund. This is a new revenue stream for the State which has never been included in State budgets. A portion of it could be used in some way as a revenue source for the Budget Stabilization Fund.
Illinois’ current way of funding the Budget Stabilization Fund does link overall revenue volatility to the Fund by using a percentage of growth in general funds revenue, but the Act explaining the deposit mechanism leaves too many issues unclear, including who decides the threshold has been reached and whose revenue estimate is used.
The Budget Stabilization Act should be reviewed to fix the issues that have caused it to be ineffective. Changes should strengthen the fund and scheduled reviews should occur to make sure the Fund and Act are still doing what they are expected to do. Once the State’s reserves start improving, rating agencies would see this as a credit positive and could upgrade the State’s rating.

90
An Examination of Deposit Mechanism Options
In P.A. 98-0682, as part of the volatility study, the language states that the Commission’s study shall include:
(4) An examination of options for a deposit mechanism linked to one or more tax sources on the basis of each tax source’s observed volatility, including:
(A) An analysis of how the options would have performed historically within Illinois; and
(B) An analysis of how the options would likely perform based on the most recent revenue forecast.
In response, the Commission created the following two deposit mechanism models: “funding when flourishing” and “monthly set-aside”. These models were developed by taking a retrospective look at revenues to see what type of deposit mechanism could have been used in order for there to be enough revenues set aside to account for the revenue losses that occurred as a result of the most recent recessions.
Why do the models in this study only look at revenues? The models simply look at revenues and do not include spending factors. To do so would go beyond the scope of this report and require policy decisions that are not able to be made by the Commission. If it is determined that more revenues are needed beyond what these base revenues can generate, these adjustments would have to be implemented by lawmakers.
Why do the models only use data thru FY 2010 and not FY 2014? The models use the revenue data between FY 1990 and FY 2010. This period covers three recessions and periods of strong growth. It does not include data between FY 2011 and FY 2014 because this data was affected by the income tax rate increases that took effect in Tax Year 2011. Some would argue that these tax rate increases would not have been implemented (or at least to the extent that it was increased) if an adequate rainy day fund was in existence prior to the recession. For this reason, this study looks at revenues before the income tax increases.
When can the Rainy Day Fund (RFD) be tapped under the models?: Again, the goal is to have enough revenue in a rainy day fund that can support years with revenue deficits. For the purpose of these models, it will be established that the rainy day funds can only be tapped if revenues have year-over-year declines. Only the value of the difference can be taken from the rainy day fund. Obviously, this threshold could be adjusted. [The higher this threshold, the higher the amount of revenues that would be needed to be set aside in a rainy day fund to adequately fund years of disappointing revenues.]
How much revenue should have been set aside? The amount of support that the rainy day fund should provide is highly debatable. Some would argue that the point in which rainy day funds should be tapped should be when year-over-year losses are less than 0% (say -2%) because the State should seek ways to cut expenses instead of completely relying on rainy day revenues to balance a budget. Others, however, would argue that the rainy day funds should be obtained anytime there is need,

91
regardless of the annual rate of growth. Obviously, the higher the desired rate for revenues, the higher the amount of revenues that will be needed to be set aside so that the right amount of funds is available to fund these desired levels. For the purpose of this study, this examination focuses on providing, at the minimum, level revenues (at least 0% growth).
If the goal is to avoid year-over-year revenue fall-offs, there must be enough available monies in the rainy day fund to safeguard against declines. Recent history will show what amounts of revenue would have been needed to avoid the revenue declines that the State has experienced over the past 25 years. Between FY 1990 and FY 2010, there have been four fiscal years in which general fund base revenues (General Funds Subtotal) declined from one year to the next.
FY 2002 (-$727M or -3.0%) FY 2003 (-$593M or -2.5%) FY 2009 (-$515M or -1.7%) FY 2010 (-$2.054B or -7.0%).
All four of these deficits came at the heels of recessions. The accumulated value of these four years of year-over-year deficits was $3.9 billion. Therefore, if it is the objective of a rainy day fund to have available enough revenues so that State budgets can rely on, at least, level spending, then history has shown that at least $3.9 billion in accumulated revenues would have been needed in a rainy day fund to fund these four fiscal years of “rainy day” moments. While not all of this $3.9 billion would have been needed in one fiscal year, the $2.054 billion drop that occurred in FY 2010 shows that these available funds can vanish quickly.
It is important to point out that the models used in this examination will assume that a new revenue base would be established each year when determining amounts that can be drawn from rainy day funds. For example, in FY 2008, the general funds base amount was $29.659 billion. In FY 2009, revenues dropped to $29.144 billion for a year-over-year decline of $515 million. Under the template used in this study, this $515 million would have been funded by rainy day funds so that revenues would remain at FY 2008 levels. However, the FY 2009 revenue total of $29.144 billion becomes the new base to which the next fiscal year is compared. So when revenues fell to $27.090 billion in FY 2010, this is considered as an additional $2.054 billion loss in revenues. If the FY 2010 figure was compared to the FY 2008 highpoint, the revenue loss would have been higher at $2.589 billion, which would have required a larger amount of set-aside monies from the rainy day fund to keep this fiscal year at level funding. This type of “hold-harmless” mechanism would require larger amounts of revenues that would make it much more difficult to fund. For this reason, a “new base” is established each year that does not factor in the funding from these rainy-day allocations.
To put things in perspective, in FY 2010, the last year before the income tax rate increases, base general funds revenues totaled $27.090 billion. Therefore, a rainy day fund of $3.9 billion equates to 14.4% of the State’s FY 2010 revenues. In FY 2014, under the higher income tax rates, base revenues to General Funds amounted to $36.7 billion. A rainy-day fund goal of $3.9 billion equates to 10.6% of the State’s FY 2014 general funds revenues.

92
Which revenue sources will be used in rainy day fund calculations?: As discussed throughout this report, the “big three” taxes (personal income tax, corporate income tax, sales tax) are the primary revenue sources in Illinois and their volatility have a direct impact on overall general funds’ volatility. For this reason, the “big three” are included in each of the subsets used in this exercise. The three models used in this analysis are as follows:
Model A: “Big Three” (Personal Income Tax (net), Corporate Income Tax (net), Sales Tax)
Model B: State Sources to General Funds (PIT, CIT, Sales, Public Utility, Cigarette, Liquor, Vehicle Use Tax, Inheritance Tax, Insurance Tax, Corporate Franchise, Interest on State Funds and Investments, Cook County Intergovernmental Transfer, other State Sources, and State Transfers). This model does not include federal sources, short-term borrowing, or other cash-flow tools.
Model C: General Funds Subtotal: Includes all State Sources to General Funds and federal sources. It excludes short-term borrowing and other cash-flow tools (Backlog Payment Fund Transfers, Tobacco Liquidation Proceeds, HPF and HHSMTF Transfers, Budget Stabilization Fund Transfer, and Pension Contribution Fund Transfers).
Those revenues noted to be excluded in Model C are not included in any of the models because, for the most part, these revenues are most accurately viewed as cash flow tools and not considered “base” revenues.

93
How would the rainy day funds be obtained? The Commission looked at two ways in which revenues could be deposited into a rainy day fund. These two deposit mechanisms are discussed on the following pages.
Deposit Mechanism 1: “Funding when Flourishing”. Under this method, revenues are deposited into the rainy day fund only in fiscal years that are flourishing. In other words, if revenues reach a certain level of positive growth, the “excess” revenues would then be deposited into a rainy day fund. The budgetary benefit of this mechanism is that fiscal years in which revenues are stagnant or declining would not see revenues removed from the budget, thereby not burdening fiscal years in which revenues are struggling. The concern with this type of mechanism is that this method would be highly dependent on strong revenue years for funding. In these flourishing years, potentially large amounts of revenues would be set aside into a rainy day fund. The amount would depend on the extent that revenues surpass a predetermined “trigger rate” of growth.
This calculated trigger rate would be dependent on several variables: the revenue sources funding the rainy day fund, the time period for which the rainy day funds would be obtained, and the amount of funds desired to be deposited in the rainy day fund. To calculate the rates that would have been sufficient to fund the revenue deficits over the past 25 years, the following formulas were used:
RSum: Sum of Revenues in model in a given year. RDF Trigger Value: Trigger Rate * Previous Fiscal Year’s RSum Amount Deposited in RDF: If a Fiscal Year’s RSum is greater than RDF Trigger Value, then RDF Amount = (RSum – RDF Trigger Value) else
RDF Amount = $0 Amount Subtracted from RDF: If a Fiscal Year’s General Fund RSum is less than Previous Fiscal Year’s General Fund RSum, then Amount Subtracted = Difference between Current and Previous Fiscal Year Total otherwise Amount Subtracted = $0 Trigger Rate: Maximum rate (to nearest tenth) that when applied to calculation results in a positive General Funds RDF Balance

94
Deposit Mechanism 2: “Monthly Set-Aside”. A portion of revenues could be set aside each month into a rainy day fund. This method would be set up similar to that of the income tax refund fund. Under this method, a pre-determined percentage of revenues would be subtracted each month from the revenue source used to fund the rainy day fund. Under this set-up, the amount extracted would have no relation to revenue performance. In other words, even if revenues are struggling to match receipts from the prior year, revenues would still be subtracted from the total and deposited into a rainy day fund. The benefit of this mechanism is that this would guarantee that rainy day funds would build and be available.
The formula for this model would be as follows: RSum: Sum of Revenues in model in a given year. Amount Deposited in RDF: Set-Aside Rate * each Fiscal Year’s RSum Amount Subtracted from RDF: If a Fiscal Year’s General Fund RSum is less than Previous Fiscal Year’s General Fund RSum, then Amount Subtracted = Difference between Current and Previous Fiscal Year Total otherwise Amount Subtracted = $0 Set-Aside Rate: Minimum rate (to nearest tenth) that when applied to calculation results in a positive General Funds RDF Balance

95
Analysis of How the Options Would Have Performed Historically in Illinois
The Commission looked at two different ways of funding a rainy day fund, Deposit Mechanism 1 or the “Funding when Flourishing” model, and Deposit Mechanism 2 or the “Monthly Set-Aside” model. With each deposit mechanism, different variables can impact the value of the rate that would have been sufficient to avoid year-over-year losses in general funds revenues. These variables include the revenue source used to fund the rainy day fund and the time frame in which rainy day funds are accrued. The results of the various calculations are shown in the appendix at the end of this report. A summary of the findings are shown below:
“Funding when Flourishing” Results:
For the “funding when flourishing” deposit mechanism models, the trigger rate is the most important variable. The trigger rate is the maximum rate (to nearest tenth) that when applied to the model’s formula results in a positive General Funds RDF Balance The value of this trigger rate changes depending on the revenue sources used to fund the rainy day fund, and the time period needed to fund these shortfalls.
As shown in the table above, if the “big three” revenue sources were used for funding a rainy day fund for the FY 1990 – FY 2010 time-frame, the trigger rate would have needed to be at 4.4%. In other words, to avoid year-over-year declines, revenues in excess of 4.4% would have needed to be deposited into a rainy day fund to adequately fund the revenue falloffs that were to come. However, for the shorter FY 2000 – FY 2010 time period, there would not have been enough time for excess revenues from the “big three” to accumulate to pay for $727 million and $593 million declines in overall general funds revenues in FY 2002 and FY 2003. This example suggests that merely relying on the “big three”
"Funding when Flourishing"Trigger Rate
Revenue Source Used to Fund Rainy
Day Fund
Historical Time Frame Used in Rainy Day
Calculation
Average Growth
Rate
Revenues in Excess of this Growth Rate Would Have
Adequately Funded Deficits "Big Three" FY 1990 - FY 2010 3.5% 4.4%"Big Three" FY 2000 - FY 2010 1.6% N/A
State Sources FY 1990 - FY 2010 3.5% 4.5%State Sources FY 2000 - FY 2010 1.7% 1.3%
Base General Funds FY 1990 - FY 2010 4.0% 5.0%Base General Funds FY 2000 - FY 2010 2.2% 2.4%
Calculated Rates That Would Have Been Sufficient to Fund a Rainy Day Fund that Avoided Year-Over-Year Deficits in Revenues between FY 1990 - FY 2010

96
to cover revenue deficits may not be best under the “funding when flourishing” format, especially in cases where rainy day funds are immediately needed.
If only State sources were used to fund the rainy day fund (no federal sources), the trigger rate would have needed to be 4.5% for the FY 1990-FY 2010 time period. The trigger rate is slightly higher because there are more revenues in the “base” to contribute to the rainy day fund. For the FY 2000 – FY 2010 time period, the model would have adequately funded the revenue deficits that were to come, but the trigger rate would have had to be at a rate of 1.3%. This means that all revenues in excess of the growth rate of 1.3% growth would have needed to be placed into the rainy day fund, leaving very little room for growth in “normal” funding.
If all base general funds revenues, including federal sources, were used in the calculation for the period between FY 1990 and FY 2010, the calculated trigger rate would have been increased to 5.0%. Again, the trigger rate is higher because, with the inclusion of federal sources, there would be more revenues available to support the rainy day fund allocation. If these rainy day fund deposits did not start until FY 2000, there would have been less time to build the revenues needed to offset these losses. As a result, the trigger rate drops to 2.4%.
To put the calculated “trigger rates” in perspective, the average annual growth of the “big three” and State Sources for the FY 1990 – FY 2010 time frame was 3.5%. The model’s calculations show that a trigger rate of 4.4% and 4.5% would have been necessary to safeguard against future revenue declines using these revenue sources. Therefore, the calculated trigger rate was approximately one percentage point above the average growth rate.
A similar finding was found using base general funds as the revenue source. The average growth rate of base general funds was 4.0% for this time frame. The calculated trigger rate was 5.0%. Here, again, the calculated trigger rate was approximately one percentage point above the average growth rate. Therefore, when observing the figures from the longer time-frame, these calculations would suggest that to adequately fund a rainy day fund, revenues in excess of around one percentage point above the average growth rate should be deposited into a rainy day fund if the desired deposit mechanism of choice is the “Funding when Flourishing” model.
But, it must be stressed that these calculations were based on a longer time frame. This historical look showed that the “funding when flourishing” mechanism would not have been as reliable if the deficits would have had to be paid with excess revenues between FY 2000 and FY 2010. As mentioned earlier, using only revenues from the “big three” would have failed to provide the necessary revenues to fund the year-over-year declines that were to come. If State Sources were used, the deficits could have been adequately funded, but this trigger rate of 1.3% would have been lower than the sources’ average growth rate of 1.7%. This situation leaves very little room for growth in the State’s many essential areas of funding. The inclusion of federal sources improves this scenario slightly as the calculated trigger rate of 2.4% is, at least, higher than the average rate of growth of 2.2%. But it shows how difficult that funding the revenue deficits would have been if the State had to rely on revenues from this shorter time period.

97
The bottom line is that it appears that the “funding when flourishing” mechanism can be successful if there are multiple years of growth where upon excess funds can accrue before being used for future revenue declines. But if the years of revenue declines come prematurely, this type of mechanism may not be sufficient to cover all of the declining revenues that may occur.
“Monthly Set-Aside” Results:
In the “monthly set-aside” model, the most prominent variable is the “set-aside rate”. The set-aside rate is the minimum rate (to nearest tenth) that when applied to the formula results in a positive General Funds RDF Balance. Results of the calculations under different scenarios are shown above.
To sufficiently fund the revenue deficits between FY 1990 and FY 2010 and using only the “big three” taxes, 1.4% of revenues from these sources would have needed to be set aside for the rainy day fund. If the time frame was shortened to FY 2000 – FY 2010, the “set-aside rate” would have needed to be increased to 3.5% to adequately fund the year-over-year deficits.
If State sources were used in this calculation (less federal sources), 1.1% of these revenues would have been needed to sufficiently fund these shortfalls for the period between FY 1990 and FY 2010. For the shorter period (FY 2000 – FY 2010), the percentage needed would have been increased to 2.3%. The set-aside rates are lower than when using only “big three” revenues because a larger pot of monies is drawn from to obtain this desired level of funding.
For the same reason, these set-aside percentages are reduced even further if all base general funds are used in the calculation. If the State would have set aside 0.9% of all general fund base revenues between FY 1990 and FY 2010, this would have been sufficient to fund the four years of year-over-
"Monthly Set-Aside"Set-Aside Rate
Revenue Source Used to Fund Rainy Day
Fund
Historical Time Frame Used in Rainy Day
CalculationAverage
Growth Rate
Minimum Percentage of Revenues Set Aside to
Adequately Fund Deficits "Big Three" FY 1990 - FY 2010 3.5% 1.4%"Big Three" FY 2000 - FY 2010 1.6% 3.1%
State Sources FY 1990 - FY 2010 3.5% 1.1%State Sources FY 2000 - FY 2010 1.7% 2.3%
Base General Funds FY 1990 - FY 2010 4.0% 0.9%Base General Funds FY 2000 - FY 2010 2.2% 1.9%
Calculated Rates That Would Have Been Sufficient to Fund a Rainy Day Fund that Avoided Year-Over-Year Deficits in Revenues between FY 1990 - FY 2010

98
year deficits during this time frame. If the time frame to build these rainy day funds was shortened to FY 2000 – FY 2010, the set-aside percentage would have needed to be raised to 1.9%.
Therefore, the fewer revenue sources that are used in this type of required allocation, the higher the percentage of revenues that are needed to be set aside to pay for future deficits. Similarly, recent history has shown that the shorter the time frame to obtain these desired rainy day funds, the higher the percentage of set-aside revenues that would be needed.
Analysis of How the Options Would Perform Based on Most Recent Revenue Forecast
So, which revenue sources should these rainy day funds be extracted from and at what rate? Obviously, if states knew when recessions and revenue downturns were going to occur, they would be able to better prepare. But, unfortunately, states do not have this luxury. What states can do is look back at the data that is available and use recent history as a guideline.
If the rainy day allocation was to come from base general funds, statistics would suggest that, under the “monthly set-aside” model, the set-aside rate should be approximately 0.9% to 1.9% of revenues. Higher percentages would be needed if your revenue base excludes some of these base sources. If the “funding when flourishing” method was used, historical data would suggest that the trigger rate should be approximately one percentage point above average growth. But again, this model was only successful using a twenty-year time period in which excess revenues had time to accumulate in a rainy day fund before they would have been needed. Whether the State will have that benefit in the future is unknown.
One of the last points that P.A. 98-0682 asked the Commission to address was how a deposit mechanism would likely perform based on the most recent revenue forecast. Unfortunately, this question is extremely difficult to answer based on the political uncertainty of income tax rates. Under current law, the income tax rates are set to fall on January 1, 2015, but the reality is that this will create a significant reduction in revenues in FY 2015, and especially in FY 2016.
For the purpose of answering this question, the Commission has to assume current law. Under this scenario, revenue declines will occur in FY 2015 and FY 2016. Once the transition to the lower tax rates has taken place and assuming “normal” growth patterns reemerge, revenues should again begin to grow in FY 2017. It is likely at this point that a rainy day fund could begin to accrue new funds.
As discussed previously, the “funding when flourishing” method is successful when there are enough “above average” years of revenue growth to deposit excess revenues into a rainy day fund. The Commission acknowledges that if the nation’s economy continues to improve, “above average” revenue increases could occur which would trigger deposits into a rainy day fund under this method (of course, depending on the pre-determined trigger rate chosen). But these “flourishing” years cannot be projected by the Commission with any degree of certainty. As a result, using current estimates to calculate the performance of the “funding when flourishing” model cannot be made at this time.

99
Final Thoughts on Deposit Mechanisms
Some would argue that basing a deposit mechanism on recent history is “overkill’ because these historical figures are based on the declines from the Great Recession and that these steep drops were an extreme case that likely will not be repeated in the foreseeable future. Setting aside funds would mean less money would be available for other budgetary items, which could be an unpopular decision at a time when numerous budgetary areas are seeking additional funding.
But others would point out that this is the whole point of rainy day funds – to have funds available to offset the losses that occur during these unforeseen events. The contention here is that if the State had an effective rainy day fund in place, Illinois would not be in the financial position that they find themselves in today.
One important aspect of a rainy day fund that must be mentioned is in regards to the financial discipline it takes to have one. As shown in the RDF models in the appendix, in order to have a positive RDF balance and to support the declines that occurred following the Great Recession, the RDF balance for most of the models had to increase to between $2.0 billion and $3.0 billion. As the rainy day fund’s balance neared this mark, it would have been difficult to leave that large of an amount in an inaccessible fund. But history showed this is the amount of money that would have been necessary to avoid the large declines in revenues that Illinois experienced in FY 2009 and FY 2010.
Many states, however, do have a “cap” or a “cap%” in place that limits the amount of revenues that can be deposited into a rainy day fund. As shown in the NCSL table at the end of the appendices, these cap percentages range from 4% of state revenues (Louisiana) to 20% of total appropriations from the general fund (Nevada). As the table shows and as mentioned in the previous examples, sometimes the cap is tied to revenues, while other times the cap is tied to appropriations.
Again, looking at Illinois’ historical data, the largest year-over-year falloffs occurred in FY 2009 and FY 2010. At the end of FY 2008, base general funds revenues totaled $29.659 billion. The previous calculations determined that a rainy day balance of between $2.0 billion and $3.0 billion was necessary at the end of FY 2008 to fund the falloffs in revenues that occurred over the next two fiscal years. This equates to a percentage of between 8% and 12% of the State’s general funds total at that time, which falls within the range of “caps” seen throughout the country. Therefore, a goal of approximately 10% of general funds revenues seems to be a logical percentage to strive for. The difficulty comes in how to get there and the speed in which to do so. This is another decision that policy makers will have to discuss if rainy day funding is prioritized.
100
Another complicated aspect of setting up a rainy day fund is determining whether to do so knowing that the State is already in debt. At the end of FY 2014, the Comptroller reported that Illinois’ backlog of bills was at approximately $4.6 billion. While there will always be some bills on hand, until the State’s level of backlogs are lowered to a more manageable level, many argue that funding a rainy day fund is not feasible and sets up a “rob Peter to pay Paul” scenario. Some would suggest that if a rainy day fund was setup, then these rainy day funds should be used immediately to pay off these backlogs. This process would then be used until this backlog is improved. Once that occurs, revenues could then accrue in a rainy day fund. Again, this is another topic of conversation for policy makers.

101
Policy Road Map
To conclude the report, the Commission has put together a list of policy questions to help policy makers arrive at how a rainy day fund could potentially be constructed.
1. Should the State of Illinois have a rainy day fund (RDF)? The National Conference of State Legislatures, the National Association of State Budget Officers, Pew Charitable Trusts, and the major ratings agencies all recommend rainy day funds as a tool for states to use during times of economic downturns and revenue shortfalls. Forty-eight states have implemented a rainy day funding mechanism. Illinois is one of those states with the introduction of the Budget Stabilization Fund and the Pension Stabilization Fund.
2. When should a rainy day fund be implemented?
Some people may question the validity of funding a rainy day fund when current bills are not being paid in a timely manner. Rainy day funds are often funded with revenue surpluses but states that chronically struggle to have balanced budgets will likely find it even more difficult to adequately fund a rainy day fund. Illinois may not want to immediately implement a rainy day fund until it pays down its old bills and is able to improve its budget structure going forward. However, the legislative framework might be put into statute now, so that the when the economic and structural balance situation improves, a rainy day fund can be funded.
3. What is the purpose of the rainy day fund?
Though Illinois has previously indicated that a rainy day fund is good fiscal policy, the implementation of the Budget Stabilization Fund has acted more as a cash flow management tool instead of a source of emergency funding in times of revenue decline. A policy decision must be made on what the ultimate goal is for the proposed fund. Is the fund meant to:
Keep revenues at a certain growth level? Back-fill a portion of a revenue short fall? Assure a certain level of expenditures? Guarantee funding for specific, vital programs?

102
4. Should the State create a new fund or reform the Budget Stabilization Fund? Some states have a single rainy day fund, while others have multiple funds. Some states have general rainy day funds; others have funds that serve as safety nets for specific line items or programs. Illinois’ current rainy day fund, the Budget Stabilization Fund, is currently used more as a cash flow management tool. The State could continue to use the fund for this purpose and create a whole new fund or set of funds. Or its current function may be deemed as unnecessary, in which case, the Budget Stabilization Fund could be reformed to resemble a more traditional rainy day fund.
5. How should the rainy day fund be funded?
The answer to this question may depend on the answer to what the purpose of the fund is. If the fund is meant to be a general rainy day fund, a wide array of funding mechanisms are available such as end of year surpluses, a monthly/quarterly payment based on a percentage of revenues, or using one-time windfalls. Some states like to link rainy day funds for specific programs to related funding sources such as a rainy day fund meant as a reserve for healthcare related programs being funded by healthcare related tax sources. Some states use a combination of these approaches, so that if one funding mechanism isn’t working, another might be able to contribute to the rainy day fund.
6. What is the deposit mechanism? Various trigger mechanisms are used throughout the country.
23 states use an end of year surplus method 5 states use an excess of revenue growth model 8 states use specific condition criteria related to various revenue source or
budget factors 3 states use appropriations with no specific requirements 11 states have required deposits no matter the situation, often based on a
formula related to economic or revenue collection conditions
7. Who is in charge of determining if a deposit is required? In the past, there has been some confusion as who is in charge of deciding if there should be a deposit into Illinois’ Budget Stabilization Fund. Good rainy day fund legislation should clearly identify who is responsible for determining if a deposit is required and the amount needed to be deposited.

103
8. What is the funding goal for the RDF? A policy decision must be made for what size of revenue downturn the state is trying to protect against. In analyzing revenue data from FY 1990 to FY 2010 which covered three recessions, the Commission estimated that drops in revenue collections ranged from approximately 5% during the less severe recessions to almost 10% during the Great Recession. Based on forecasted general revenue of $35.352 billion in FY 2015, 5% of general revenues would equal $1.768 billion and 10% would equal $3.535 billion.
9. Should the fund have a cap? Should this be the same as the funding goal? Most states have a cap on the amount of money that can be put into a rainy day fund though this amount has been rarely reached in recent years. Most states (34) use a percentage of revenues to cap the amount that can go into their rainy day fund though some (7) use a percentage of expenditures. These percentages mostly cluster between 5% and 10% but range from approximately 3% to 20%. Two states use a specific dollar amount, while seven states have no cap at all.
10. How quickly does the State want to fund the RDF? A properly funded rainy day fund is likely not going to be fully funded in one fiscal year. Therefore, a policy decision must be made as to how quickly the fund should be funded and to what level. In recent years, rainy day funds around the country have averaged around 2.7% to 4.74% of expenditures. The amount in the Budget Stabilization Fund has consistently averaged approximately 1% of expenditures. How quickly money grows in a rainy day fund is directly linked to the deposit mechanism. Deposit mechanisms that count on excess revenue for funding can have large annual variations with numerous years of no deposits depending upon the economic conditions. Continual funding of a rainy day fund allows for more consistent funding but puts annual pressure on the budgeting process. At current levels, a deposit mechanism of 1% of revenue would equate to approximately $353 million per year in Illinois.
11. What is the withdrawal mechanism for the RDF? Sound rainy day fund legislation must clearly identify under what circumstances a withdrawal from the rainy day fund is allowed. Policy decisions must be made about under what circumstances call for the use of rainy day funds. It must also be decided how much can be used and when. Some states have very loose rules allowing for use of rainy day funds under numerous circumstances during any part of the fiscal year, while other states have more narrow rules limiting the situations and times under which funds can be used.

104
12. Who decides to trigger the withdrawal? It must be plainly stated who approves the withdrawal of funds. Sixty percent of states require a vote of the legislature, while a few leave it up to members of the Executive branch including Governors, Directors of Finance, and Comptrollers. Some split the responsibility between both branches, while some have it done automatically.
13. Should there be a repayment mechanism for the RDF? A policy decision may be made as to if there needs to be a repayment of the withdrawn funds once a withdrawal has occurred. If the answer to this question is yes, it should be decided how quickly the payment needs to be made. Currently, money taken from Illinois’ Budget Stabilization Fund has to be paid back by the end of the fiscal year. Thirty-two states do not require repayment of withdrawn funds and allow for the normal funding mechanism to replenish the RDF.
14. What kind of oversight and review process is needed? Periodic review of the processes and procedures related to the rainy day fund is necessary. A well-defined approach that unambiguously defines who is responsible for reviewing if the rainy day fund is meeting the states needs is crucial.
105
Citations
Bruce, Donald; William F. Fox, and M. H. Tuttle. “Tax Base Elasticities: A Multi-State Analysis of Long-Run and Short-Run Dynamics” Southern Economic Journal, October 2006, 73(2): 315-341.
Cornia, Gary C. and Ray D. Nelson, 2010. “State Tax Revenue Growth and Volatility” Federal Reserve Bank of St. Louis Regional Economic Development, 6(1), 23-58.
Dye, Richard F., and Therese J. McGuire. “Growth and Variability of State Individual Income and General Sales Taxes.” National Tax Journal March, 1991, 44(1): 55-66.
Felix, Alison R., 2008. “The Growth and Volatility of State Tax Revenue Sources in the Tenth District” Federal Reserve Bank of Kansas City Economic Review, 93(3), 63-88.
Groves, Harold M., and C. Harry Kahn. “The Stability of State and Local Tax Yields.” American Economic Review, March 1952, 42(2): 87-102.
Holcombe, Randall G., and Russel S. Sobel. 1997. Growth and Variability in State Tax Revenue: An Anatomy of State Fiscal Crises. Westport, Conn.: Greenwood Press.
MCGranahan, Leslie and Richard H. Mattoon. 2012. “State Tax Revenues over the Business Cycle: Patterns and Policy Responses” Federal Reserve Bank of Chicago: Chicago Fed Letter, June 2012. No. 299.
Sobel, Russell S. and Randall G. Holcombe. 1996. “Measuring the Growth and Variability of Tax Bases Over the Business Cycle.” National Tax Journal 49(4): 535-552.
Sobel, Russell S. and Gary A. Wagner., “Cyclical Variability in State Government Revenue: Can Tax Reform Reduce It?” State Tax Notes 29(8) (August 2003): 569-576.

106
Appendix I: Deposit Mechanism Scenarios
Funding Source: "Big Three"* Deposit Mechanism: "Funding when Flourishing"
Minimum Trigger Rate to Maintain a Positive Year-Over-Year Revenue Balance: 4.4%
"Big Three" Annual Rainy Day Fund (RFD) Calculated Amount from RDF
Fiscal Tax Growth of Trigger Value Amount to RDF Needed to Avoid RDF
Year Revenues Funds* (4.4% over prior year) ($ over 4.4% Growth) Year-Over-Year Deficit Balance
1990 $8,379 4.6% $8,365 $14 $0 $141991 $8,683 3.6% $8,747 $0 $0 $141992 $9,040 4.1% $9,065 $0 $0 $141993 $9,389 3.9% $9,438 $0 $0 $141994 $10,073 7.3% $9,803 $270 $0 $2841995 $10,882 8.0% $10,516 $366 $0 $6501996 $11,445 5.2% $11,361 $84 $0 $7341997 $12,216 6.7% $11,948 $268 $0 $1,0011998 $13,256 8.5% $12,753 $503 $0 $1,5041999 $13,956 5.3% $13,840 $117 $0 $1,6212000 $14,950 7.1% $14,570 $380 $0 $2,0012001 $14,990 0.3% $15,608 $0 $0 $2,0012002 $14,325 -4.4% $15,649 $0 -$727 $1,2742003 $14,138 -1.3% $14,956 $0 -$593 $6812004 $14,539 2.8% $14,761 $0 $0 $6812005 $15,746 8.3% $15,179 $567 $0 $1,2482006 $17,155 8.9% $16,439 $716 $0 $1,9632007 $18,294 6.6% $17,909 $385 $0 $2,3482008 $19,394 6.0% $19,099 $295 $0 $2,6432009 $17,706 -8.7% $20,247 $0 -$515 $2,1282010 $16,179 -8.6% $18,485 $0 -$2,054 $74
Funding Source: "Big Three"* Deposit Mechanism: "Funding when Flourishing"
Minimum Trigger Rate to Maintain a Positive Year-Over-Year Revenue Balance (Note: This percentage would have fund 2.5%
"Big Three" Annual Rainy Day Fund (RFD) Calculated RDF
Fiscal Tax Growth of Trigger Value Amount to RDF Triggered RDF
Year Revenues Funds* (2.5% over prior year) ($ over 2.5% Growth) if Annual Loss Balance
2000 $14,950 7.1% $14,305 $645 $0 $6452001 $14,990 0.3% $15,324 $0 $0 $6452002 $14,325 -4.4% $15,365 $0 -$727 -$822003 $14,138 -1.3% $14,683 $0 -$593 -$6752004 $14,539 2.8% $14,492 $47 $0 -$6282005 $15,746 8.3% $14,903 $843 $0 $2152006 $17,155 8.9% $16,140 $1,015 $0 $1,2302007 $18,294 6.6% $17,583 $710 $0 $1,9412008 $19,394 6.0% $18,751 $643 $0 $2,5832009 $17,706 -8.7% $19,879 $0 -$515 $2,0682010 $16,179 -8.6% $18,148 $0 -$2,054 $14
Model A-1: FY 1990 - FY 2010
Model A-1: FY 2000 - FY 2010
Example of Rainy Day Fund Model That Would Have Been Sufficient to Fund General Funds Revenue Deficits for the period FY 2000 - FY 2010
* Only includes revenues from the personal income tax, the corporate income tax, and the sales tax.
Example of Rainy Day Fund Model That Would Have Been Sufficient to Fund General Funds Revenue Deficits for the period FY 1990 - FY 2010
* Only includes revenues from the personal income tax, the corporate income tax, and the sales tax.

107
Funding Source: "Big Three"* Deposit Mechanism: "Monthly Set-Aside"
1.4%
"Big Three" Annual Calculated Amount from RDF
Fiscal Tax Growth of Amount to RDF Needed to Avoid RDF
Year Revenues Funds* (1.5% of Net Revenues) Year-Over-Year Deficit Balance
1990 $8,379 4.6% $117 $0 $1171991 $8,683 3.6% $122 $0 $2391992 $9,040 4.1% $127 $0 $3651993 $9,389 3.9% $131 $0 $4971994 $10,073 7.3% $141 $0 $6381995 $10,882 8.0% $152 $0 $7901996 $11,445 5.2% $160 $0 $9501997 $12,216 6.7% $171 $0 $1,1211998 $13,256 8.5% $186 $0 $1,3071999 $13,956 5.3% $195 $0 $1,5022000 $14,950 7.1% $209 $0 $1,7122001 $14,990 0.3% $210 $0 $1,9222002 $14,325 -4.4% $201 -$727 $1,3952003 $14,138 -1.3% $198 -$593 $1,0002004 $14,539 2.8% $204 $0 $1,2042005 $15,746 8.3% $220 $0 $1,4242006 $17,155 8.9% $240 $0 $1,6642007 $18,294 6.6% $256 $0 $1,9202008 $19,394 6.0% $272 $0 $2,1922009 $17,706 -8.7% $248 -$515 $1,9252010 $16,179 -8.6% $227 -$2,054 $97
Funding Source: "Big Three"* Deposit Mechanism: "Monthly Set-Aside"
3.1%
"Big Three" Annual Calculated Amount from RDF
Fiscal Tax Growth of Amount to RDF Needed to Avoid RDF
Year Revenues Funds* (2.4% of Net Revenues) Year-Over-Year Deficit Balance
2000 $14,950 7.1% $463 $0 $02001 $14,990 0.3% $465 $0 $4652002 $14,325 -4.4% $444 -$727 $1822003 $14,138 -1.3% $438 -$593 $272004 $14,539 2.8% $451 $0 $4782005 $15,746 8.3% $488 $0 $9662006 $17,155 8.9% $532 $0 $1,4982007 $18,294 6.6% $567 $0 $2,0652008 $19,394 6.0% $601 $0 $2,6662009 $17,706 -8.7% $549 -$515 $2,7002010 $16,179 -8.6% $502 -$2,054 $1,147
Model A-2: FY 1990 - FY 2010
Model A-2: FY 2000 - FY 2010
Example of Rainy Day Fund Model That Would Have Been Sufficient to Fund General Funds Revenue Deficits for the period FY 2000 - FY 2010
Minimum Rate of Revenues Set Aside to Rainy Day Fund to Support a Positive Year-Over-Year Revenue Balance:
* Only includes revenues from the personal income tax, the corporate income tax, and the sales tax.
Example of Rainy Day Fund Model That Would Have Been Sufficient to Fund General Funds Revenue Deficits for the period FY 1990 - FY 2010
* Only includes revenues from the personal income tax, the corporate income tax, and the sales tax.
Minimum Rate of Revenues Set Aside to Rainy Day Fund to Maintain a Positive Year-Over-Year Revenue Balance:

108
Funding Source: State Sources Deposit Mechanism: "Funding when Flourishing"
Minimum Trigger Rate to Maintain a Positive Year-Over-Year Revenue Balance: 4.5%
Revenues Annual Rainy Day Fund (RFD) Calculated Amount from RDF
Fiscal from State Growth of Trigger Value Amount to RDF Needed to Avoid RDF
Year Sources Funds* (4.5% over prior year) ($ over 4.5% Growth) Year-Over-Year Deficit Balance
1990 $10,939 5.0% $10,882 $57 $0 $571991 $11,207 2.5% $11,431 $0 $0 $571992 $11,796 5.3% $11,711 $85 $0 $1421993 $12,103 2.6% $12,327 $0 $0 $1421994 $12,896 6.6% $12,648 $248 $0 $3901995 $13,904 7.8% $13,476 $428 $0 $8181996 $14,597 5.0% $14,530 $66 $0 $8851997 $15,585 6.8% $15,253 $331 $0 $1,2161998 $16,659 6.9% $16,286 $373 $0 $1,5891999 $17,956 7.8% $17,409 $547 $0 $2,1372000 $19,358 7.8% $18,764 $594 $0 $2,7302001 $19,786 2.2% $20,229 $0 $0 $2,7302002 $19,121 -3.4% $20,676 $0 -$727 $2,0032003 $18,846 -1.4% $19,982 $0 -$593 $1,4102004 $20,239 7.4% $19,695 $545 $0 $1,9552005 $21,469 6.1% $21,150 $319 $0 $2,2742006 $22,634 5.4% $22,435 $198 $0 $2,4722007 $23,937 5.8% $23,652 $285 $0 $2,7572008 $24,844 3.8% $25,014 $0 $0 $2,7572009 $22,577 -9.1% $25,962 $0 -$515 $2,2422010 $21,170 -6.2% $23,593 $0 -$2,054 $188
Funding Source: State Sources Deposit Mechanism: "Funding when Flourishing"
Minimum Trigger Rate to Maintain a Positive Year-Over-Year Revenue Balance: 1.3%
Revenues Annual Rainy Day Fund (RFD) Calculated RDF
Fiscal from State Growth of Trigger Value Amount to RDF Triggered RDF
Year Sources Funds* (2.8% over prior year) ($ over 2.8% Growth) if Annual Loss Balance
2000 $19,358 7.8% $18,190 $1,168 $0 $1,1682001 $19,786 2.2% $19,610 $176 $0 $1,3442002 $19,121 -3.4% $20,043 $0 -$727 $6172003 $18,846 -1.4% $19,370 $0 -$593 $242004 $20,239 7.4% $19,091 $1,148 $0 $1,1722005 $21,469 6.1% $20,502 $967 $0 $2,1392006 $22,634 5.4% $21,748 $885 $0 $3,0242007 $23,937 5.8% $22,928 $1,009 $0 $4,0332008 $24,844 3.8% $24,248 $596 $0 $4,6292009 $22,577 -9.1% $25,167 $0 -$515 $4,1142010 $21,170 -6.2% $22,870 $0 -$2,054 $2,060
Model B-1: FY 1990 - FY 2010
Example of Rainy Day Fund Model That Would Have Been Sufficient to Fund General Funds Revenue Deficits for the period FY 1990 - FY 2010
* State Sources include the General Funds distributions of the following sources: Personal Income Tax (Gross), Personal Income Tax (Gross), Sales Tax, Public Utility Tax, Cigarette Tax, Liquor Tax, Vehicle Use Tax, Inheritance Tax, Insurance Taxes and Fees, Corporate Franchise Tax, Interest on State Funds & Investments, Cook County Intergovernmental Transfer, and Other State Sources. It also includes State Transfers (Lottery, Gaming Fund, Other Transfers) and the subtractions from nongeneral funds distributions (amounts to refund fund).
* State Sources include the General Funds distributions of the following sources: Personal Income Tax (Gross), Personal Income Tax (Gross), Sales Tax, Public Utility Tax, Cigarette Tax, Liquor Tax, Vehicle Use Tax, Inheritance Tax, Insurance Taxes and Fees, Corporate Franchise Tax, Interest on State Funds & Investments, Cook County Intergovernmental Transfer, and Other State Sources. It also includes State Transfers (Lottery, Gaming Fund, Other Transfers) and the subtractions from nongeneral funds distributions (amounts to refund fund).
Model B-1: FY 2000 - FY 2010
Example of Rainy Day Fund Model That Would Have Been Sufficient to Fund General Funds Revenue Deficits for the period FY 2000 - FY 2010

109
Funding Source: State Sources Deposit Mechanism: "Monthly Set-Aside"
1.1%
Revenues Annual Calculated Amount from RDF
Fiscal from State Growth of Amount to RDF Needed to Avoid RDF
Year Sources Funds* (1.1% of Net Revenues) Year-Over-Year Deficit Balance
1990 $10,939 5.0% $120 $0 $1201991 $11,207 2.5% $123 $0 $2441992 $11,796 5.3% $130 $0 $3731993 $12,103 2.6% $133 $0 $5061994 $12,896 6.6% $142 $0 $6481995 $13,904 7.8% $153 $0 $8011996 $14,597 5.0% $161 $0 $9621997 $15,585 6.8% $171 $0 $1,1331998 $16,659 6.9% $183 $0 $1,3171999 $17,956 7.8% $198 $0 $1,5142000 $19,358 7.8% $213 $0 $1,7272001 $19,786 2.2% $218 $0 $1,9452002 $19,121 -3.4% $210 -$727 $1,4282003 $18,846 -1.4% $207 -$593 $1,0422004 $20,239 7.4% $223 $0 $1,2652005 $21,469 6.1% $236 $0 $1,5012006 $22,634 5.4% $249 $0 $1,7502007 $23,937 5.8% $263 $0 $2,0132008 $24,844 3.8% $273 $0 $2,2872009 $22,577 -9.1% $248 -$515 $2,0202010 $21,170 -6.2% $233 -$2,054 $199
Funding Source: State Sources Deposit Mechanism: "Monthly Set-Aside"
2.3%
Revenues Annual Calculated Amount from RDF
Fiscal from State Growth of Amount to RDF Needed to Avoid RDF
Year Sources Funds* (1.9% of Net Revenues) Year-Over-Year Deficit Balance
2000 $19,358 7.8% $445 $0 $02001 $19,786 2.2% $455 $0 $4552002 $19,121 -3.4% $440 -$727 $1682003 $18,846 -1.4% $433 -$593 $82004 $20,239 7.4% $466 $0 $4742005 $21,469 6.1% $494 $0 $9682006 $22,634 5.4% $521 $0 $1,4882007 $23,937 5.8% $551 $0 $2,0392008 $24,844 3.8% $571 $0 $2,6102009 $22,577 -9.1% $519 -$515 $2,6142010 $21,170 -6.2% $487 -$2,054 $1,047
Model B-2: FY 1990 - FY 2010
Example of Rainy Day Fund Model That Would Have Been Sufficient to Fund General Funds Revenue Deficits for the period FY 1990 - FY 2010
Minimum Rate of Revenues Set Aside to Rainy Day Fund to Maintain a Positive Year-Over-Year Revenue Balance:
Minimum Rate of Revenues Set Aside to Rainy Day Fund to Support a Positive Year-Over-Year Revenue Balance:
* State Sources include the General Funds distributions of the following sources: Personal Income Tax (Gross), Personal Income Tax (Gross), Sales Tax, Public Utility Tax, Cigarette Tax, Liquor Tax, Vehicle Use Tax, Inheritance Tax, Insurance Taxes and Fees, Corporate Franchise Tax, Interest on State Funds & Investments, Cook County Intergovernmental Transfer, and Other State Sources. It also includes State Transfers (Lottery, Gaming Fund, Other Transfers) and the subtractions from nongeneral funds distributions (amounts to refund fund).
* State Sources include the General Funds distributions of the following sources: Personal Income Tax (Gross), Personal Income Tax (Gross), Sales Tax, Public Utility Tax, Cigarette Tax, Liquor Tax, Vehicle Use Tax, Inheritance Tax, Insurance Taxes and Fees, Corporate Franchise Tax, Interest on State Funds & Investments, Cook County Intergovernmental Transfer, and Other State Sources. It also includes State Transfers (Lottery, Gaming Fund, Other Transfers) and the subtractions from nongeneral funds distributions (amounts to refund fund).
Model B-2: FY 2000 - FY 2010
Example of Rainy Day Fund Model That Would Have Been Sufficient to Fund General Funds Revenue Deficits for the period FY 2000 - FY 2010

110
Funding Source: All General Funds* Deposit Mechanism: "Funding when Flourishing"
Minimum Trigger Rate to Maintain a Positive Year-Over-Year Revenue Balance: 5.0%
General Annual Rainy Day Fund (RFD) Calculated Amount from RDF
Fiscal Funds Growth of Trigger Value Amount to RDF Needed to Avoid RDF
Year Revenues* Funds* (5.0% over prior year) ($ over 5.0% Growth) Year-Over-Year Deficit Balance
1990 $12,841 5.8% $12,739 $102 $0 $1021991 $13,261 3.3% $13,483 $0 $0 $1021992 $14,031 5.8% $13,924 $107 $0 $2091993 $14,749 5.1% $14,733 $16 $0 $2251994 $15,586 5.7% $15,486 $100 $0 $3251995 $17,002 9.1% $16,365 $637 $0 $9621996 $17,936 5.5% $17,852 $83 $0 $1,0451997 $18,854 5.1% $18,832 $21 $0 $1,0661998 $19,982 6.0% $19,796 $186 $0 $1,2521999 $21,674 8.5% $20,982 $693 $0 $1,9452000 $23,249 7.3% $22,758 $491 $0 $2,4362001 $24,106 3.7% $24,411 $0 $0 $2,4362002 $23,379 -3.0% $25,311 $0 -$727 $1,7092003 $22,786 -2.5% $24,548 $0 -$593 $1,1162004 $25,428 11.6% $23,926 $1,503 $0 $2,6182005 $26,160 2.9% $26,700 $0 $0 $2,6182006 $27,359 4.6% $27,468 $0 $0 $2,6182007 $28,640 4.7% $28,726 $0 $0 $2,6182008 $29,659 3.6% $30,072 $0 $0 $2,6182009 $29,144 -1.7% $31,142 $0 -$515 $2,1032010 $27,090 -7.0% $30,601 $0 -$2,054 $49
Funding Source: All General Funds* Deposit Mechanism: "Funding when Flourishing"
Minimum Trigger Rate to Maintain a Positive Year-Over-Year Revenue Balance: 2.4%
General Annual Rainy Day Fund (RFD) Calculated RDF
Fiscal Funds Growth of Trigger Value Amount to RDF Triggered RDF
Year Revenues* Funds* (3.1% over prior year) ($ over 3.1% Growth) if Annual Loss Balance
2000 $23,249 7.3% $22,195 $1,054 $0 $1,0542001 $24,106 3.7% $23,807 $299 $0 $1,3532002 $23,379 -3.0% $24,684 $0 -$727 $6262003 $22,786 -2.5% $23,940 $0 -$593 $332004 $25,428 11.6% $23,333 $2,095 $0 $2,1282005 $26,160 2.9% $26,039 $121 $0 $2,2502006 $27,359 4.6% $26,788 $571 $0 $2,8202007 $28,640 4.7% $28,015 $625 $0 $3,4452008 $29,659 3.6% $29,327 $332 $0 $3,7772009 $29,144 -1.7% $30,371 $0 -$515 $3,2622010 $27,090 -7.0% $29,843 $0 -$2,054 $1,208
Model C-1: FY 1990 - FY 2010
Example of Rainy Day Fund Model That Would Have Been Sufficient to Fund General Funds Revenue Deficits for the period FY 1990 - FY 2010
* Includes State revenue sources, transfers, Federal Sources. and the subtractions from nongeneral funds distributions (amounts to refund fund). It excludes Short-Term Borrowing, Backlog Payment Fund Transfers, Tobacco Liquidation Proceeds, HPF and HHSMTF Transfers, Budget Stabilization Fund Transfer, and Pension Contribution Fund Transfers.
* Includes State revenue sources, transfers, Federal Sources. and the subtractions from nongeneral funds distributions (amounts to refund fund). It excludes Short-Term Borrowing, Backlog Payment Fund Transfers, Tobacco Liquidation Proceeds, HPF and HHSMTF Transfers, Budget Stabilization Fund Transfer, and Pension Contribution Fund Transfers.
Model C-1: FY 2000 - FY 2010
Example of Rainy Day Fund Model That Would Have Been Sufficient to Fund General Funds Revenue Deficits for the period FY 2000 - FY 2010

111
Funding Source: All General Funds* Deposit Mechanism: "Monthly Set-Aside"
0.9%
General Annual Calculated Amount from RDF
Fiscal Funds Growth of Amount to RDF Needed to Avoid RDF
Year Revenues* Funds* (0.9% of Net Revenues) Year-Over-Year Deficit Balance
1990 $12,841 5.8% $116 $0 $1161991 $13,261 3.3% $119 $0 $2351992 $14,031 5.8% $126 $0 $3611993 $14,749 5.1% $133 $0 $4941994 $15,586 5.7% $140 $0 $6341995 $17,002 9.1% $153 $0 $7871996 $17,936 5.5% $161 $0 $9491997 $18,854 5.1% $170 $0 $1,1181998 $19,982 6.0% $180 $0 $1,2981999 $21,674 8.5% $195 $0 $1,4932000 $23,249 7.3% $209 $0 $1,7022001 $24,106 3.7% $217 $0 $1,9192002 $23,379 -3.0% $210 -$727 $1,4032003 $22,786 -2.5% $205 -$593 $1,0152004 $25,428 11.6% $229 $0 $1,2442005 $26,160 2.9% $235 $0 $1,4792006 $27,359 4.6% $246 $0 $1,7252007 $28,640 4.7% $258 $0 $1,9832008 $29,659 3.6% $267 $0 $2,2502009 $29,144 -1.7% $262 -$515 $1,9972010 $27,090 -7.0% $244 -$2,054 $187
Funding Source: All General Funds* Deposit Mechanism: "Monthly Set-Aside"
1.9%
General Annual Calculated Amount from RDF
Fiscal Funds Growth of Amount to RDF Needed to Avoid RDF
Year Revenues* Funds* (1.5% of Net Revenues) Year-Over-Year Deficit Balance
2000 $23,249 7.3% $442 $0 $02001 $24,106 3.7% $458 $0 $4582002 $23,379 -3.0% $444 -$727 $1752003 $22,786 -2.5% $433 -$593 $152004 $25,428 11.6% $483 $0 $4982005 $26,160 2.9% $497 $0 $9952006 $27,359 4.6% $520 $0 $1,5152007 $28,640 4.7% $544 $0 $2,0592008 $29,659 3.6% $564 $0 $2,6232009 $29,144 -1.7% $554 -$515 $2,6622010 $27,090 -7.0% $515 -$2,054 $1,122
Model C-2: FY 1990 - FY 2010
Example of Rainy Day Fund Model That Would Have Been Sufficient to Fund General Funds Revenue Deficits for the period FY 1990 - FY 2010
Minimum Rate of Revenues Set Aside to Rainy Day Fund to Maintain a Positive Year-Over-Year Revenue Balance:
Minimum Rate of Revenues Set Aside to Rainy Day Fund to Support a Positive Year-Over-Year Revenue Balance:
* Includes State revenue sources, transfers, Federal Sources. and the subtractions from nongeneral funds distributions (amounts to refund fund). It excludes Short-Term Borrowing, Backlog Payment Fund Transfers, Tobacco Liquidation Proceeds, HPF and HHSMTF Transfers, Budget Stabilization Fund Transfer, and Pension Contribution Fund Transfers.
* Includes State revenue sources, transfers, Federal Sources. and the subtractions from nongeneral funds distributions (amounts to refund fund). It excludes Short-Term Borrowing, Backlog Payment Fund Transfers, Tobacco Liquidation Proceeds, HPF and HHSMTF Transfers, Budget Stabilization Fund Transfer, and Pension Contribution Fund Transfers.
Model C-2: FY 2000 - FY 2010
Example of Rainy Day Fund Model That Would Have Been Sufficient to Fund General Funds Revenue Deficits for the period FY 2000 - FY 2010

112
Appendix II: (30 ILCS 122/) Budget Stabilization Act
(30 ILCS 122/1) Sec. 1. Short title. This Act may be cited as the Budget Stabilization Act. (Source: P.A. 93-660, eff. 7-1-04.) (30 ILCS 122/5) Sec. 5. Budget Stabilization Fund. The Budget Stabilization Fund is a special fund in the State treasury established for the purpose of reducing the need for future tax increases, maintaining the highest possible bond rating, reducing the need for short term borrowing, providing available resources to meet State obligations whenever casual deficits or failures in revenue occur, and providing the means of addressing budgetary shortfalls. In authorizing transfers from the Budget Stabilization Fund, whenever possible, priority consideration should be given to meeting obligations for secondary and elementary education, child care, and other programs that may provide a direct benefit to children. (Source: P.A. 93-660, eff. 7-1-04.) (30 ILCS 122/10) Sec. 10. Budget limitations. (a) Except as provided in subsection (b-5), in addition to Section 50-5 of the State Budget Law of the Civil Administrative Code of Illinois, the General Assembly's appropriations and transfers or diversions as required by law from general funds shall not exceed 99% of the estimated general funds revenues for the fiscal year when revenue estimates of the State's general funds revenues exceed the prior fiscal year's estimated general funds revenues by more than 4%. (b) Except as provided in subsection (b-5), the General Assembly's appropriations and transfers or diversions as required by law from general funds shall not exceed 98% of the estimated general funds revenues for the fiscal year when revenue estimates of the State's general funds revenues exceed the prior fiscal year's estimated general funds revenues by more than 4% for 2 or more consecutive fiscal years. (b-5) The limitations on appropriations and transfers or diversions set forth under subsections (a) and (b) do not apply for State fiscal year 2008. (c) For the purpose of this Act, "estimated general funds revenues" include, for each budget year, all taxes, fees, and other revenues expected to be deposited into the State's general funds, including recurring transfers from other State funds into the general funds.
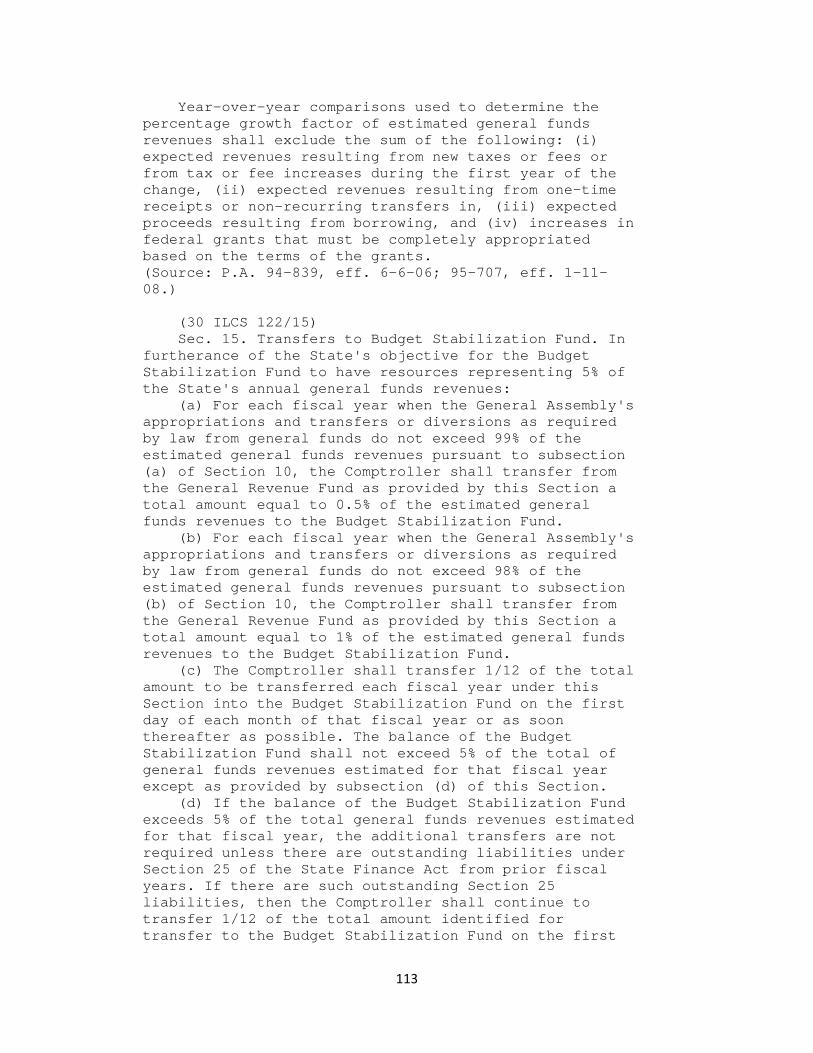
113
Year-over-year comparisons used to determine the percentage growth factor of estimated general funds revenues shall exclude the sum of the following: (i) expected revenues resulting from new taxes or fees or from tax or fee increases during the first year of the change, (ii) expected revenues resulting from one-time receipts or non-recurring transfers in, (iii) expected proceeds resulting from borrowing, and (iv) increases in federal grants that must be completely appropriated based on the terms of the grants. (Source: P.A. 94-839, eff. 6-6-06; 95-707, eff. 1-11-08.) (30 ILCS 122/15) Sec. 15. Transfers to Budget Stabilization Fund. In furtherance of the State's objective for the Budget Stabilization Fund to have resources representing 5% of the State's annual general funds revenues: (a) For each fiscal year when the General Assembly's appropriations and transfers or diversions as required by law from general funds do not exceed 99% of the estimated general funds revenues pursuant to subsection (a) of Section 10, the Comptroller shall transfer from the General Revenue Fund as provided by this Section a total amount equal to 0.5% of the estimated general funds revenues to the Budget Stabilization Fund. (b) For each fiscal year when the General Assembly's appropriations and transfers or diversions as required by law from general funds do not exceed 98% of the estimated general funds revenues pursuant to subsection (b) of Section 10, the Comptroller shall transfer from the General Revenue Fund as provided by this Section a total amount equal to 1% of the estimated general funds revenues to the Budget Stabilization Fund. (c) The Comptroller shall transfer 1/12 of the total amount to be transferred each fiscal year under this Section into the Budget Stabilization Fund on the first day of each month of that fiscal year or as soon thereafter as possible. The balance of the Budget Stabilization Fund shall not exceed 5% of the total of general funds revenues estimated for that fiscal year except as provided by subsection (d) of this Section. (d) If the balance of the Budget Stabilization Fund exceeds 5% of the total general funds revenues estimated for that fiscal year, the additional transfers are not required unless there are outstanding liabilities under Section 25 of the State Finance Act from prior fiscal years. If there are such outstanding Section 25 liabilities, then the Comptroller shall continue to transfer 1/12 of the total amount identified for transfer to the Budget Stabilization Fund on the first

114
day of each month of that fiscal year or as soon thereafter as possible to be reserved for those Section 25 liabilities. Nothing in this Act prohibits the General Assembly from appropriating additional moneys into the Budget Stabilization Fund. (e) On or before August 31 of each fiscal year, the amount determined to be transferred to the Budget Stabilization Fund shall be reconciled to actual general funds revenues for that fiscal year. The final transfer for each fiscal year shall be adjusted so that the total amount transferred under this Section is equal to the percentage specified in subsection (a) or (b) of this Section, as applicable, based on actual general funds revenues calculated consistently with subsection (c) of Section 10 of this Act for each fiscal year. (f) For the fiscal year beginning July 1, 2006 and for each fiscal year thereafter, the budget proposal to the General Assembly shall identify liabilities incurred in a prior fiscal year under Section 25 of the State Finance Act and the budget proposal shall provide funding as allowable pursuant to subsection (d) of this Section, if applicable. (Source: P.A. 93-660, eff. 7-1-04; 94-839, eff. 6-6-06.) (30 ILCS 122/20) (Text of Section before amendment by P.A. 98-599) Sec. 20. Pension Stabilization Fund. (a) The Pension Stabilization Fund is hereby created as a special fund in the State treasury. Moneys in the fund shall be used for the sole purpose of making payments to the designated retirement systems as provided in Section 25. (b) For each fiscal year when the General Assembly's appropriations and transfers or diversions as required by law from general funds do not exceed 99% of the estimated general funds revenues pursuant to subsection (a) of Section 10, the Comptroller shall transfer from the General Revenue Fund as provided by this Section a total amount equal to 0.5% of the estimated general funds revenues to the Pension Stabilization Fund. (c) For each fiscal year when the General Assembly's appropriations and transfers or diversions as required by law from general funds do not exceed 98% of the estimated general funds revenues pursuant to subsection (b) of Section 10, the Comptroller shall transfer from the General Revenue Fund as provided by this Section a total amount equal to 1.0% of the estimated general funds revenues to the Pension Stabilization Fund. (d) The Comptroller shall transfer 1/12 of the total amount to be transferred each fiscal year under this Section into the Pension Stabilization Fund on the first

115
day of each month of that fiscal year or as soon thereafter as possible; except that the final transfer of the fiscal year shall be made as soon as practical after the August 31 following the end of the fiscal year. Before the final transfer for a fiscal year is made, the Comptroller shall reconcile the estimated general funds revenues used in calculating the other transfers under this Section for that fiscal year with the actual general funds revenues for that fiscal year. The final transfer for the fiscal year shall be adjusted so that the total amount transferred under this Section for that fiscal year is equal to the percentage specified in subsection (b) or (c) of this Section, whichever is applicable, of the actual general funds revenues for that fiscal year. The actual general funds revenues for the fiscal year shall be calculated in a manner consistent with subsection (c) of Section 10 of this Act. (Source: P.A. 94-839, eff. 6-6-06.) (Text of Section after amendment by P.A. 98-599) Sec. 20. Pension Stabilization Fund. (a) The Pension Stabilization Fund is hereby created as a special fund in the State treasury. Moneys in the fund shall be used for the sole purpose of making payments to the designated retirement systems as provided in Section 25. (b) For each fiscal year through State fiscal year 2014, when the General Assembly's appropriations and transfers or diversions as required by law from general funds do not exceed 99% of the estimated general funds revenues pursuant to subsection (a) of Section 10, the Comptroller shall transfer from the General Revenue Fund as provided by this Section a total amount equal to 0.5% of the estimated general funds revenues to the Pension Stabilization Fund. (c) For each fiscal year through State fiscal year 2014, when the General Assembly's appropriations and transfers or diversions as required by law from general funds do not exceed 98% of the estimated general funds revenues pursuant to subsection (b) of Section 10, the Comptroller shall transfer from the General Revenue Fund as provided by this Section a total amount equal to 1.0% of the estimated general funds revenues to the Pension Stabilization Fund. (c-5) In addition to any other amounts required to be transferred under this Section, in State fiscal year 2016 and each fiscal year thereafter through State fiscal year 2045, or when each of the designated retirement systems, as defined in Section 25, has

116
achieved 100% funding, whichever occurs first, the State Comptroller shall order transferred and the State Treasurer shall transfer from the General Revenue Fund to the Pension Stabilization Fund an amount equal to 10% of (1) the sum of the amounts certified by the designated retirement systems under subsection (a-5) of Section 2-134, subsection (a-10) of Section 14-135.08, subsection (a-10) of Section 15-165, and subsection (a-10) of Section 16-158 of this Code for that fiscal year minus (2) the sum of (i) the transfer required under subsection (c-10) of this Section for that fiscal year and (ii) the sum of the required State contributions certified by the retirement systems under subsection (a) of Section 2-134, subsection (a-5) of Section 14-135.08, subsection (a-5) of Section 15-165, and subsection (a-5) of Section 16-158 of this Code for that fiscal year. The transferred amount is intended to represent one-tenth of the annual savings to the State resulting from the enactment of this amendatory Act of the 98th General Assembly. (c-10) In State fiscal year 2019, the State Comptroller shall order transferred and the State Treasurer shall transfer $364,000,000 from the General Revenue Fund to the Pension Stabilization Fund. In State fiscal year 2020 and each fiscal year thereafter until terminated under subsection (c-15), the State Comptroller shall order transferred and the State Treasurer shall transfer $1,000,000,000 from the General Revenue Fund to the Pension Stabilization Fund. (c-15) The transfers made beginning in State fiscal year 2020 pursuant to subsection (c-10) of this Section shall terminate at the end of State fiscal year 2045 or when each of the designated retirement systems, as defined in Section 25, has achieved 100% funding, whichever occurs first. (d) The Comptroller shall transfer 1/12 of the total amount to be transferred each fiscal year under this Section into the Pension Stabilization Fund on the first day of each month of that fiscal year or as soon thereafter as possible; except that the final transfer of the fiscal year shall be made as soon as practical after the August 31 following the end of the fiscal year. Until State fiscal year 2015, before the final transfer for a fiscal year is made, the Comptroller shall reconcile the estimated general funds revenues used in calculating the other transfers under this Section for that fiscal year with the actual general funds revenues for that fiscal year. The final transfer for the fiscal year shall be adjusted so that the total amount transferred under this Section for that fiscal

117
year is equal to the percentage specified in subsection (b) or (c) of this Section, whichever is applicable, of the actual general funds revenues for that fiscal year. The actual general funds revenues for the fiscal year shall be calculated in a manner consistent with subsection (c) of Section 10 of this Act. (Source: P.A. 98-599, eff. 6-1-14.) (30 ILCS 122/25) (Text of Section before amendment by P.A. 98-599) Sec. 25. Transfers from the Pension Stabilization Fund. (a) As used in this Section, "designated retirement systems" means: (1) the State Employees' Retirement System of Illinois; (2) the Teachers' Retirement System of the State of Illinois; (3) the State Universities Retirement System; (4) the Judges Retirement System of Illinois; and (5) the General Assembly Retirement System. (b) As soon as may be practical after any money is deposited into the Pension Stabilization Fund, the State Comptroller shall apportion the deposited amount among the designated retirement systems and the State Comptroller and State Treasurer shall pay the apportioned amounts to the designated retirement systems. The amount deposited shall be apportioned among the designated retirement systems in the same proportion as their respective portions of the total actuarial reserve deficiency of the designated retirement systems, as most recently determined by the Governor's Office of Management and Budget. Amounts received by a designated retirement system under this Section shall be used for funding the unfunded liabilities of the retirement system. Payments under this Section are authorized by the continuing appropriation under Section 1.7 of the State Pension Funds Continuing Appropriation Act. (c) At the request of the State Comptroller, the Governor's Office of Management and Budget shall determine the individual and total actuarial reserve deficiencies of the designated retirement systems. For this purpose, the Governor's Office of Management and Budget shall consider the latest available audit and actuarial reports of each of the retirement systems and the relevant reports and statistics of the Public Pension Division of the Department of Financial and Professional Regulation. (d) Payments to the designated retirement systems

118
under this Section shall be in addition to, and not in lieu of, any State contributions required under Section 2-124, 14-131, 15-155, 16-158, or 18-131 of the Illinois Pension Code. (Source: P.A. 94-839, eff. 6-6-06.) (Text of Section after amendment by P.A. 98-599) Sec. 25. Transfers from the Pension Stabilization Fund. (a) As used in this Section, "designated retirement systems" means: (1) the State Employees' Retirement System of Illinois; (2) the Teachers' Retirement System of the State of Illinois; (3) the State Universities Retirement System; (4) the Judges Retirement System of Illinois; and (5) the General Assembly Retirement System. (b) As soon as may be practical after any money is deposited into the Pension Stabilization Fund, the State Comptroller shall apportion the deposited amount among the designated retirement systems and the State Comptroller and State Treasurer shall pay the apportioned amounts to the designated retirement systems. The amount deposited shall be apportioned among the designated retirement systems in the same proportion as their respective portions of the total actuarial reserve deficiency of the designated retirement systems, as most recently determined by the Governor's Office of Management and Budget. Amounts received by a designated retirement system under this Section shall be used for funding the unfunded liabilities of the retirement system. Payments under this Section are authorized by the continuing appropriation under Section 1.7 of the State Pension Funds Continuing Appropriation Act. (c) At the request of the State Comptroller, the Governor's Office of Management and Budget shall determine the individual and total actuarial reserve deficiencies of the designated retirement systems. For this purpose, the Governor's Office of Management and Budget shall consider the latest available audit and actuarial reports of each of the retirement systems and the relevant reports and statistics of the Public Pension Division of the Department of Insurance. (d) Payments to the designated retirement systems under this Section shall be in addition to, and not in lieu of, any State contributions required under Section 2-124, 14-131, 15-155, 16-158, or 18-131 of the Illinois Pension Code.

119
(30 ILCS 105/6z-51) Budget Stabilization Fund
(a) The Budget Stabilization Fund, a special fund in the State Treasury, shall consist of moneys appropriated or transferred to that Fund, as provided in Section 6z-43 and as otherwise provided by law. All earnings on Budget Stabilization Fund investments shall be deposited into that Fund. (b) The State Comptroller may direct the State Treasurer to transfer moneys from the Budget Stabilization Fund to the General Revenue Fund in order to meet cash flow deficits resulting from timing variations between disbursements and the receipt of funds within a fiscal year. Any moneys so borrowed in any fiscal year other than Fiscal Year 2011 shall be repaid by June 30 of the fiscal year in which they were borrowed. Any moneys so borrowed in Fiscal Year 2011 shall be repaid no later than July 15, 2011. (Source: P.A. 97-44, eff. 6-28-11.)
Payments to the designated retirement systems under this Section received after the effective date of this amendatory Act of the 98th General Assembly, and any investment earnings attributable to such payments, do not reduce and do not constitute payment of any portion of the required State contribution under Article 2, 14, 15, 16, or 18 of the Illinois Pension Code in the current fiscal year. Such amounts shall not reduce, and shall not be included in the calculation of, the required State contribution under Article 2, 14, 15, 16, or 18 of the Illinois Pension Code in any future fiscal year, until the designated retirement system has reached the targeted funding ratio as prescribed by law for that retirement system. Such payments may be invested in the same manner as other assets of the designated retirement system and shall be used in the calculation of the system's funding ratio for the purposes of this Section and Section 20 of this Act. Payments under this Section may be used for any associated administrative costs. (Source: P.A. 98-599, eff. 6-1-14.) (30 ILCS 122/90) Sec. 90. (Amendatory provisions; text omitted). (Source: P.A. 93-660, eff. 7-1-04.) (30 ILCS 122/99) Sec. 99. Effective date. This Act takes effect July 1, 2004. (Source: P.A. 93-660, eff. 7-1-04.)
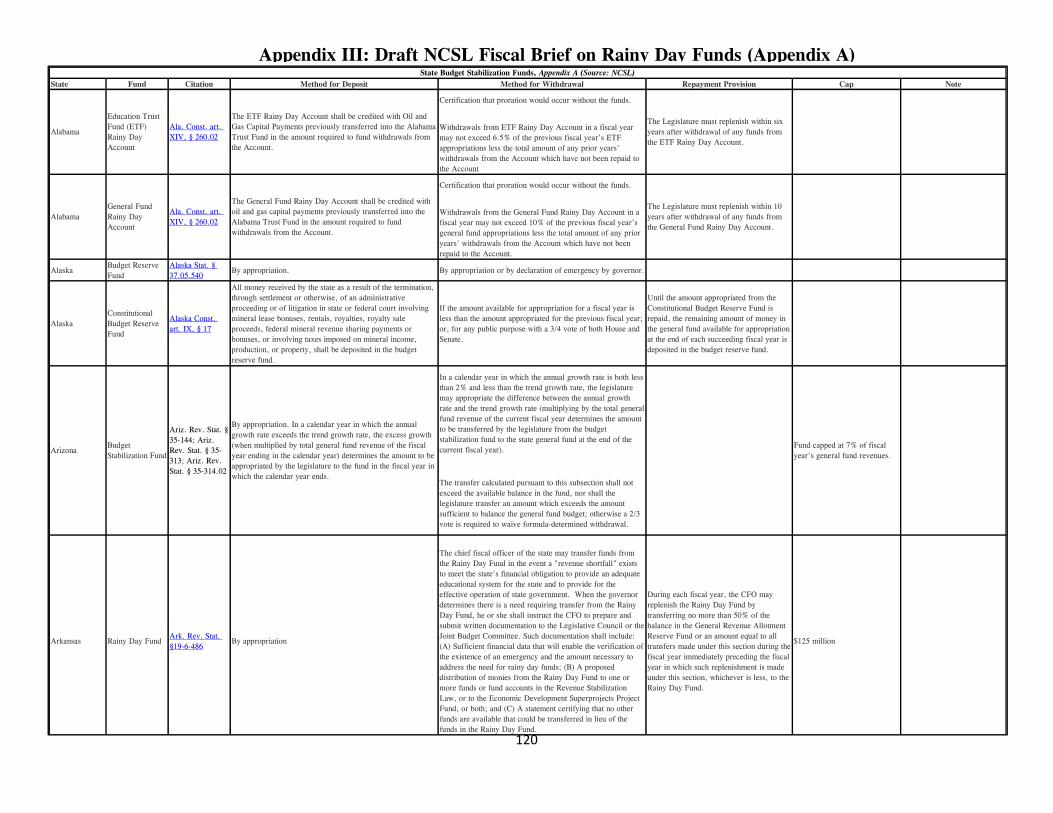
120
State Fund Citation Method for Deposit Method for Withdrawal Repayment Provision Cap Note
Certification that proration would occur without the funds.
Withdrawals from ETF Rainy Day Account in a fiscal year may not exceed 6.5% of the previous fiscal year’s ETF appropriations less the total amount of any prior years' withdrawals from the Account which have not been repaid to the Account
Certification that proration would occur without the funds.
Withdrawals from the General Fund Rainy Day Account in a fiscal year may not exceed 10% of the previous fiscal year’s general fund appropriations less the total amount of any prior years' withdrawals from the Account which have not been repaid to the Account.
Alaska Budget Reserve Fund
Alaska Stat. § 37.05.540
By appropriation. By appropriation or by declaration of emergency by governor.
Alaska Constitutional Budget Reserve Fund
Alaska Const. art. IX, § 17
All money received by the state as a result of the termination, through settlement or otherwise, of an administrative proceeding or of litigation in state or federal court involving mineral lease bonuses, rentals, royalties, royalty sale proceeds, federal mineral revenue sharing payments or bonuses, or involving taxes imposed on mineral income, production, or property, shall be deposited in the budget reserve fund.
If the amount available for appropriation for a fiscal year is less than the amount appropriated for the previous fiscal year; or, for any public purpose with a 3/4 vote of both House and Senate.
Until the amount appropriated from the Constitutional Budget Reserve Fund is repaid, the remaining amount of money in the general fund available for appropriation at the end of each succeeding fiscal year is deposited in the budget reserve fund.
In a calendar year in which the annual growth rate is both less than 2% and less than the trend growth rate, the legislature may appropriate the difference between the annual growth rate and the trend growth rate (multiplying by the total general fund revenue of the current fiscal year determines the amount to be transferred by the legislature from the budget stabilization fund to the state general fund at the end of the current fiscal year).
The transfer calculated pursuant to this subsection shall not exceed the available balance in the fund, nor shall the legislature transfer an amount which exceeds the amount sufficient to balance the general fund budget; otherwise a 2/3 vote is required to waive formula-determined withdrawal.
Arkansas Rainy Day FundArk. Rev. Stat. §19-6-486
By appropriation
The chief fiscal officer of the state may transfer funds from the Rainy Day Fund in the event a "revenue shortfall" exists to meet the state's financial obligation to provide an adequate educational system for the state and to provide for the effective operation of state government. When the governor determines there is a need requiring transfer from the Rainy Day Fund, he or she shall instruct the CFO to prepare and submit written documentation to the Legislative Council or the Joint Budget Committee. Such documentation shall include: (A) Sufficient financial data that will enable the verification of the existence of an emergency and the amount necessary to address the need for rainy day funds; (B) A proposed distribution of monies from the Rainy Day Fund to one or more funds or fund accounts in the Revenue Stabilization Law, or to the Economic Development Superprojects Project Fund, or both; and (C) A statement certifying that no other funds are available that could be transferred in lieu of the funds in the Rainy Day Fund.
During each fiscal year, the CFO may replenish the Rainy Day Fund by transferring no more than 50% of the balance in the General Revenue Allotment Reserve Fund or an amount equal to all transfers made under this section during the fiscal year immediately preceding the fiscal year in which such replenishment is made under this section, whichever is less, to the Rainy Day Fund.
$125 million
State Budget Stabilization Funds, Appendix A (Source: NCSL)
Alabama
Education Trust Fund (ETF) Rainy Day Account
Ala. Const. art. XIV, § 260.02
The ETF Rainy Day Account shall be credited with Oil and Gas Capital Payments previously transferred into the Alabama Trust Fund in the amount required to fund withdrawals from the Account.
The Legislature must replenish within six years after withdrawal of any funds from the ETF Rainy Day Account.
Arizona Budget Stabilization Fund
Ariz. Rev. Stat. § 35-144; Ariz. Rev. Stat. § 35-313; Ariz. Rev. Stat. § 35-314.02
By appropriation. In a calendar year in which the annual growth rate exceeds the trend growth rate, the excess growth (when multiplied by total general fund revenue of the fiscal year ending in the calendar year) determines the amount to be appropriated by the legislature to the fund in the fiscal year in which the calendar year ends.
Fund capped at 7% of fiscal year's general fund revenues.
AlabamaGeneral Fund Rainy Day Account
Ala. Const. art. XIV, § 260.02
The General Fund Rainy Day Account shall be credited with oil and gas capital payments previously transferred into the Alabama Trust Fund in the amount required to fund withdrawals from the Account.
The Legislature must replenish within 10 years after withdrawal of any funds from the General Fund Rainy Day Account.
Appendix III: Draft NCSL Fiscal Brief on Rainy Day Funds (Appendix A)

121
State Fund Citation Method for Deposit Method for Withdrawal Repayment Provision Cap Note
CaliforniaBudget Stabilization Account
Cal. Const. art. XVI, §20
In each fiscal year, the controller shall transfer from the general fund to the Budget Stabilization Account a sum equal to 3% of the estimated amount of general fund revenues for the current fiscal year. (Transfers may be suspended or reduced by executive order of the governor.)
Monies in the sinking fund subaccount (see Notes) are continuously appropriated to the treasurer to be expended for the purpose of retiring deficit recovery bonds. Other funds transferred to the account in a fiscal year shall not be deposited in the sinking fund subaccount and may, by statute, be transferred to the general fund.
5% of estimated general fund revenues or $8 billion, whichever is greater.
Of the monies transferred to the Budget Stabilization Account each fiscal year, 50% shall be deposited in the Deficit Recovery Bond Retirement Sinking Fund Subaccount (housed within the Budget Stabilization Account), for the purpose of retiring deficit recovery bonds.
California Special Fund for Economic Uncertainties
Cal. Gov't Code § 16418
Year-end surplus or by appropriation.
1) Transfer by controller to cover revenue shortfall or other general fund deficiency; or 2) Director of finance can allocate funds for disaster relief (with notification to the Joint Legislative Budget Committee).
The controller returns all of the monies transferred out of the Special Fund without payment of interest as soon as there are sufficient monies in the general fund.
Connecticut Budget Reserve Fund
Conn. Gen. Stat. § 4-30a; see also Conn. Const. Amend. Art. 3, § 18
Year-end surplus is transferred by the state treasurer to the Budget Reserve Fund.
Automatic appropriation to cover immediately preceding fiscal year’s deficit to the extent funds are available. To use surplus monies for purposes beyond budget deficit relief or reduction of bonded indebtedness, authorization must be granted by 3/4 of the members of each house.
Fund cannot exceed 10% of net general fund appropriations for the fiscal year in progress. If a surplus exists after Fund appropriation, remaining surplus is appropriated to State Employees Retirement, subject to a 5% cap of the system’s unfunded past service liability. If a surplus still remains, it is appropriated to reduce bonded indebtedness as specified in statute.
Interest derived from the Fund is credited to the general fund.
Delaware Budget Reserve Account
Del. Const. art. VIII, § 6; Del. Code tit. 29, § 6533
Automatic deposit from any unencumbered funds from previous year. Unencumbered funds shall be determined by subtracting from the actual unencumbered funds at the end of any fiscal year an amount, which together with the latest estimated revenues, is necessary to fund the ensuing fiscal year's general fund budget. This includes the required estimated general fund supplemental and automatic appropriations for said ensuing fiscal year less estimated reversions.
By appropriation to cover budget deficit or to compensate for revenue reductions; requires 3/5 vote.
5% of general fund
District of Columbia
Emergency Cash Reserve Fund
D.C. Code § 1-204.50a
Deposit required each year to maintain a balance of 2% of expenditures.
Based on a policy developed by the chief financial officer, in consultation with the mayor, for uses such uses as, but not limited to, unanticipated and nonrecurring extraordinary needs of an emergency nature including a natural disaster or in the event of a state of emergency as declared by the mayor.
Must be fully replenished within two years of use (50% per year).
2% of expenditures
District of Columbia
Contingency Cash Reserve Fund
D.C. Code § 1-204.50a
Deposit required each year to maintain a balance of 4% of expenditures.
Based on a policy developed by the Chief Financial Officer, in consultation with the mayor, for uses such as, but not limited to, unanticipated and nonrecurring extraordinary needs including to cover a revenue shortfall.
Must be fully replenished within two years of use (50% per year).
4% of expenditures
State Budget Stabilization Funds, Appendix A (Source: NCSL)

122
State Fund Citation Method for Deposit Method for Withdrawal Repayment Provision Cap Note
Florida Budget Stabilization Fund
Fla. Stat. § 215.18; Fla. Stat. § 215.32; Fla. Stat. § 216.221; Fla. Stat. § 216.222; Fla. Stat. § 252.37
By Sept. 15 of each year, the governor authorizes the chief financial officer to transfer to the Budget Stabilization Fund an amount equal to at least 5% of net revenue collections for the general revenue fund during the last completed fiscal year. Monies needed for the Budget Stabilization Fund may be appropriated by the Legislature from any funds.
Budget Stabilization Funds may be used to offset a deficit in the general revenue fund, to provide funding for states of emergency, or to provide temporary transfers as defined by law (see Fla. Stat. § 215.18). A transfer from the Budget Stabilization Fund may be approved: 1) by the governor in response to a declared disaster within a declaration period (see § 252.37(2)); 2) by the governor and Legislative Budget Commission to satisfy budget authority granted for declared disasters when not within the declaration period; 3) by the comptroller to address an end-of-year revenue shortfall (see § 216.222); 4) by the governor and House/Senate appropriations chairs to offset a revenue shortfall under 1.5% of monies appropriated from the general revenue fund (see § 216.221); and, 5) by the governor and House/Senate appropriations chairs for temporary transfers to general revenue (see §§ 216.222(1)(c) and 215.18).
Repayment of budget stabilization funds shall be made in five equal annual transfers from the general revenue fund, beginning in the third fiscal year following the year in which the expenditure was made. If the transfer was made to address an end-of-year revenue shortfall, the comptroller shall first repay the fund with any general revenue carried forward.
Not to exceed 10% of the last completed fiscal year's net general revenue fund collections.
The Budget Stabilization Fund may be used as a revolving fund for transfers as provided in Fla. Stat. § 215.18; however, any interest earned must be deposited in the general revenue fund.
Georgia Revenue Shortfall Reserve
Ga. Code § 45-12-71; Ga. Code § 45-12-93
Surplus at the end of each fiscal year is added and reserved to the Revenue Shortfall Reserve.
By appropriation to cover any deficit by which total expenditures exceed net revenues.
Not to exceed 15% of the previous fiscal year's net revenue.
General Assembly may appropriate from the Revenue Shortfall Reserve up to 1% of the net revenue collections of the preceding fiscal year for funding increased K-12 needs.
Hawaii Emergency and Budget Reserve Fund
Hawaii Rev. Stat. §§ 328L-2, 3
By appropriation, plus 15% of tobacco settlement monies received by the state. In addition, 5% of the state general fund balance at the close of the fiscal year will be deposited, whenever state general fund revenues for each of two successive fiscal years exceed revenues for each of the preceding fiscal years by 5%.
With a 2/3 majority approval of both houses, the legislature may make appropriations from the fund for the following reasons: 1) to maintain levels of programs determined to be essential to the public health, safety, welfare, and education; 2) to provide for counter cyclical economic and employment programs in periods of economic downturn; 3) to restore facilities destroyed or damaged or services disrupted by disaster in any county; and 4) to meet other emergencies when declared by the governor or determined to be urgent by the legislature. The governor, through an appropriations bill, may recommend expenditures from the fund.
Transfers shall not be made to the Emergency and Budget Reserve Fund if the balance is equal to or more than 10% of general fund revenues for the preceding fiscal year.
All interest earned from the fund will be credited to the general fund.
At the end of the fiscal year, if the state board of examiners determines that insufficient general fund monies are available to meet the level of general fund appropriations authorized by the legislature for that same fiscal year, the board is authorized to transfer certain unencumbered monies from the budget stabilization fund to the general fund. Such transfers will be the final accounting adjustment to close the fiscal year and shall be limited to the amount of the insufficiency or one-half of one percent (0.5%) of the original general fund appropriations made for the fiscal year just ending, whichever is less. Any transfer made pursuant to this section from the budget stabilization fund to the general fund shall be specifically addressed in the governor's executive budget recommendation for the following year which is then subject to review or action by the legislature.
Appropriations of monies from the budget stabilization fund in any year shall be limited to 50% after the fund balance has reached 5%.
State Budget Stabilization Funds, Appendix A (Source: NCSL)
Interest earnings from the investment of monies in the Budget Reserve Account are credited to the permanent building account.
Idaho Budget Reserve Account
Idaho Code § 57-814; Idaho Code § 57-814A
If the state controller certifies that the receipts to the general fund for the fiscal year just ending have exceeded the receipts of the previous fiscal year by more than 4%, then the state controller shall transfer all general fund collections in excess of said 4% increase to the budget stabilization fund, up to a maximum of 1% of the actual general fund collections of the fiscal year just ending. The state controller shall make the transfers in four equal amounts during September, December, March and June of the next fiscal year.
5% of the total general fund receipts for the fiscal year just ending.

123
State Fund Citation Method for Deposit Method for Withdrawal Repayment Provision Cap Note
Illinois Budget Stabilization Fund
Ill. Rev. Stat. ch. 30, §§ 122/5- 122/25; Ill. Rev. Stat. ch. 30, § 105/6z-51
If general fund revenues increase by more than 4% from the prior fiscal year's revenues and appropriations from the general fund do not exceed 99% of general fund revenues, 0.5% of general fund revenues are transferred to the Budget Stabilization Fund. If general fund revenues increase by more than 4% for two consecutive fiscal years and appropriations from the general fund do not exceed 98% of general fund revenues, 1% of general fund revenues are transferred to the Budget Stabilization Fund. Transfers to the Budget
Stabilization Fund occur on the 1st day of each month in shares of 1/12 of the total fiscal year's Budget Stabilization Fund appropriation.
The state comptroller may direct the state treasurer to transfer monies from the Budget Stabilization Fund to the general fund in order to meet cash flow deficits resulting from timing variations between disbursements and the receipt of funds within a fiscal year.
Monies borrowed must be repaid by June 30 of the fiscal year in which they were borrowed.
5% of the total of general fund revenues.
"The Budget Stabilization Fund is … established for the purpose of reducing the need for future tax increases, maintaining the highest possible bond rating, reducing the need for short term borrowing, providing available resources to meet state obligations whenever casual deficits or failures in revenue occur, and providing the means of addressing budgetary shortfalls. In authorizing transfers from the Budget Stabilization Fund … priority consideration should be given to meeting obligations for [K-12] education, child care, and other programs that may provide a direct benefit to children."
Indiana
Counter-Cyclical Revenue and Economic Stabilization Fund
Ind. Code § 4-10-18-1, et seq.; see also Ind. Code § 6-1.1-21.5-3 and Ind. Code § 6-1.1-21.9-2
Statutory formula triggered when the annual growth rate in adjusted personal income exceeds 2%.
Statutory formula triggered when the annual growth rate in adjusted personal income is less than negative 2%.
Fund capped at 7% of state general fund revenue.
Iowa Cash Reserve Fund
Iowa Code § 8.56; Iowa Code § 8.57
By appropriation when there is a year-end general fund surplus.
By appropriation for non-recurring emergency expenditures; requires 3/5 vote of both chambers if the fund’s balance drops to less than 3.75% of the adjusted revenue estimate for the year in which the appropriation is made.
Monies in the cash reserve fund may be used for cash flow purposes during a fiscal year provided that any monies so allocated are returned to the cash reserve fund by the end of that fiscal year.
Fund capped at 7.5% of the adjusted general fund revenue estimate for the current fiscal year.
Iowa Economic Emergency Fund
Iowa Code § 8.55By appropriation when there is a year-end general fund surplus.
By appropriation for emergency expenditures. Appropriation may not exceed $50 million.
Fund capped at 2.5% of the adjusted revenue estimate for the fiscal year.
Kentucky Budget Reserve Trust Fund
Ky. Rev. Stat. § 48.705
The lesser of: 1) 50% of general fund revenue surplus; or 2) the amount necessary, from the general fund revenue surplus plus the unexpended balance of appropriations, to make the balance of the Budget Reserve Trust Fund account equal to 5% of general fund revenue receipts.
By appropriation 5% of general fund revenue receipts.
Louisiana Budget Stabilization Fund
La. Const. art. VII, § 10.3; see also La. Rev. Stat. §§ 39:94; 39:95
Automatic deposit of revenues exceeding $750 million from taxes on the production of, or exploration for, minerals. With some limitations, the $750 million base may be increased every 10 years, beginning in the year 2000, by a law enacted by a 2/3 vote.
By appropriation, not to exceed one-third of the fund and requiring a 2/3 vote of both houses of the legislature when: 1) the official forecast for a fiscal year is less than revenues received by the state in the preceding fiscal year; or 2) if a deficit for the current fiscal year is projected due to a decrease in the official forecast.
4% of total state revenue receipts for the previous fiscal year.
State Budget Stabilization Funds, Appendix A (Source: NCSL)

124
State Fund Citation Method for Deposit Method for Withdrawal Repayment Provision Cap Note
Maine Budget Stabilization Fund
Me. Rev. Stat. tit. 5, §§ 1531, et seq.
Unappropriated general fund surplus – after the obligated additional appropriations for essential programs and services for kindergarten to grade 12 education – must be transferred to the stabilization fund.
Subject to annual legislative deliberations.
Fund may not exceed 12% of total general fund revenues in the immediately preceding state fiscal year.
Fund also may not be reduced below 1% of total general fund revenue in the immediately preceding state fiscal year.
Maryland Revenue Stabilization Account
Md. State Fin. & Procurement Code § 7-311
By appropriation. If account balance is below 3% of estimated general fund revenues, the governor shall include in the budget bill an appropriation equal to at least $100 million; if balance is at least 3% but less than 7.5% of estimated general fund revenues, the governor shall include in the budget bill an appropriation equal to at least the lesser of $50 million or the amount necessary for the fund balance to exceed 7.5% of estimated general fund revenues for the fiscal year.
Transferred by governor if authorized by an act of the General Assembly or specifically authorized in the state budget bill as enacted; Legislature may reduce amount transferred by amending the budget bill.
Once the fund contains 7.5% of estimated general fund revenues, the legislature may exceed the amount, but they are not required to.
0.5% of the total revenue from taxes in the preceding fiscal year shall be available to be used as revenue for the current fiscal year and 0.5% of the total revenue from taxes in the preceding fiscal year shall be transferred to the Stabilization Fund. Any remaining amount shall be transferred to the Stabilization Fund.
By appropriation: 1) to make up any difference between actual state revenues and allowable state revenues when actual revenues fall below the allowable amount; or 2) to replace the state and local loss of federal funds; or 3) for any event that threatens the health, safety or welfare of the people or the fiscal stability of the state.
Upon receiving a written joint certification from the commissioner of revenue and the attorney general that a state agency is in receipt of a one-time settlement or judgment for the commonwealth that exceeds $10,000,000 in any one fiscal year, the comptroller shall transfer said proceeds from the general fund to the Stabilization Fund.
If money is deposited due to excess capital gains revenue, 5% of any amount transferred to the Commonwealth Stabilization Fund shall then be transferred from the Commonwealth Stabilization Fund to the State Retiree Benefits Trust Fund and 5% of any amount transferred to the Commonwealth Stabilization Fund shall then be transferred from the Commonwealth Stabilization Fund to the Commonwealth's Pension Liability Fund.
If the department of revenue certifies that the amount of tax revenues estimated to have been collected from capital gains income exceeds $1B in a fiscal year, the comptroller shall transfer quarterly any such amount that exceeds $1B collected during that fiscal year to the Commonwealth Stabilization Fund
Michigan
Countercyclical Budget & Economic Stabilization Fund
Mich. Comp. Laws § 18.1351, et seq.
Statute requires appropriation of an amount equal to: (annual growth rate in real personal income in excess of 2%) X (total general fund revenues for the fiscal year ending in the current calendar year).
If annual growth rate in real personal income is negative, withdrawal equals (deficiency) X (total general fund revenues for the fiscal year ending in the current calendar year), but no more than needed to balance budget. Also, if unemployment is between 8% and 11.9%, 2.5% of fund can be used for economic stabilization in calendar quarter; if unemployment is over 12%, 5% of fund can be used for economic stabilization in calendar quarter. Additionally, an emergency appropriation from the fund may be made with 2/3 majority vote of both houses.
10% of general fund and school aid revenues for fiscal year.
State Budget Stabilization Funds, Appendix A (Source: NCSL)
Massachusetts Commonwealth Stabilization Fund
Mass. Gen. Laws Ch. 29, § 2H; Ch 29, §§5C, G
Fund capped at 15% of current fiscal year revenues.

125
State Fund Citation Method for Deposit Method for Withdrawal Repayment Provision Cap Note
Minnesota Budget Reserve and Cash Flow Accounts
Minn. Stat. §16A.152
If surplus remains in the general fund after close of biennium, commissioner of finance allocates money to the following accounts in following order: (1) the cash flow account until that account reaches $350 million; (2) the budget reserve account until that account reaches $653 million; (3) the amount necessary to increase the aid payment schedule for school district aid and credit payments; (4) the amount necessary to restore all or a portion of the net aid reductions under section 127A.441 and to reduce the property tax revenue recognition shift; and (5) to the state airports fund, the amount necessary to restore the amount transferred from the state airports fund under Laws 2008, chapter 363, article 11, section 3, subdivision 5
By transfer authorized by the commissioner of finance, with approval of the governor and in consultation with the Legislative Advisory Commission, when: (1) a negative budgetary balance is projected and when objective measures (such as reduced growth in total wages) reflect downturns in the state’s economy; or (2) probable receipts for the general fund will be less than anticipated and the amount available for the rest of the biennium will be insufficient.
The restoration of the budget reserve should be governed by principles based on the full economic cycle rather than the budget cycle. Restoration of the budget reserve should occur when objective measures, such as increased growth in total wages, retail sales, or employment, reflect upturns in the state's economy.
De facto cap of $1,003 million ($350 million cap on cash flow account; $653 million cap on budget reserve account).
Mississippi Working Cash-Stabilization Reserve Fund
Miss. Code § 27-103-203
The first $5 million of interest earned on the Ayers Settlement Fund for each fiscal year shall be deposited into the Reserve Fund until a total of $70 million has been deposited into the fund. Subsequently, the interest earned on the funds shall be deposited in the Reserve Fund until the balance of principal and interest in the fund reaches 7.5% of general fund appropriations for the current fiscal year.
Transfer by the executive director of the Department of Finance & Administration: 1) to meet cash-flow needs; or 2) to cover deficits (up to $50 million in any one fiscal year); or 3) to provide funds for disaster assistance.
Borrowed funds must be repaid within the same fiscal year.
Once Working Cash-Stabilization fund reaches $70 million, then 7.5% of general fund appropriations.
If the governor reduces the expenditures of the state or any of its agencies below their appropriations, or in the event of a disaster, the governor may request the General Assembly to appropriate funds from the Budget Reserve Fund to cover the reduced expenditures or budget needs due to disasters. The maximum amount which may be appropriated at any one time for such budget stabilization purposes shall be 1/2 of the sum of the balance in the fund.
Any transfers requested of the General Assembly by the governor require 2/3 vote of both houses of the General Assembly.
Nebraska Cash Reserve Fund
Neb. Rev. Stat. § 84-612
Transfer by state treasurer when actual general fund net receipts for the preceding three months exceed estimated receipts for the three-month period.
Transfer is made to the general fund when the cash balance in the general fund is inadequate to meet current obligations. Transfers may be made for additional purposes, as authorized in statute.By appropriation if: 1) the total actual revenue of the state falls short by 5% or more of the total anticipated revenue for the biennium in which the appropriation is made; or 2) the Legislature, or the Interim Finance Committee if the Legislature is not in session, and governor declare a fiscal emergency.
The money in the Account may be allocated directly by the Legislature to be used for any other purpose.
State Budget Stabilization Funds, Appendix A (Source: NCSL)
Nevada
Account to Stabilize Operation of State Government
Nev. Rev. Stat. § 353.288
State Controller must deposit into the Account to Stabilize Operation of State Government 40% of the unrestricted balance of the state general fund which remains after subtracting an amount equal to 7% of all appropriations made from the general fund.
Balance in the Account is not to exceed 20% of total appropriations from general fund.
MissouriBudget Reserve Fund
Mo. Const. art. IV, § 27(a)
The commissioner of administration shall transfer from the general fund to the budget reserve fund an amount equal to a "cash operating transfer" plus interest, prior to May 16 of the fiscal year in which the transfer was made.
1/3 of the amount transferred or expended from the Budget Reserve Fund (plus interest) shall stand appropriated to the budget reserve fund during each of the next three fiscal years, and such amount, and any additional amounts which may be appropriated for that purpose, shall be transferred from the fund which received such transfer to the budget reserve fund by the fifteenth day of the fiscal year for each of the next three fiscal years or until the full amount, plus interest, has been returned to the Budget Reserve Fund. The maximum amount which may be outstanding at any one time and subject to repayment to the Budget Reserve Fund for budget stabilization purposes shall be one-half of the sum of the balance in the fund and all outstanding amounts appropriated or otherwise owed to the fund.
7.5% of net general revenue for previous fiscal year.

126
State Fund Citation Method for Deposit Method for Withdrawal Repayment Provision Cap Note
New Hampshire Revenue Stabilization Reserve Account
N.H. Rev. Stat. § 9:13-e
With some limitations, transfer by comptroller of any surplus at the end of each biennium.
Transfer by comptroller with the approval of fiscal committee and governor when: 1) general fund operating deficit occurred for most recently completed fiscal year; and 2) unrestricted general fund revenues in the most recently completed fiscal year were less than budget forecast. Fund cannot be used for any other purpose without a 2/3 vote of each house of the General Court and governor’s approval.
Fund capped at 10% of actual general fund unrestricted revenues for the most recently completed fiscal year.
New Jersey Surplus Revenue Fund
N.J. Stat. § 52:9H-14, et seq.
50% of actual revenue collections in excess of governor’s certification of revenues.
By appropriation only: 1) upon certification by the governor that anticipated general fund revenues are estimated to be less than those certified upon approval of appropriations act; 2) upon findings by the legislature that to offset anticipated general fund revenue declines, an appropriation from the fund is more prudent than a tax increase; 3) when the governor declares an emergency and notifies the Joint Legislative Budget Oversight Committee.
Fund capped at 5% of anticipated revenues.
If in a fiscal year an appropriation is made from the Surplus Revenue Fund for reasons other than a declared emergency, no new taxes or increase in existing taxes can be enacted unless a decline in general fund revenue is greater than 2%.
New Mexico Operating Reserve Fund
N.M. Stat. § 6-4-2.1
Transfer from general fund. By specific authorization of the Legislature only in the event that general fund revenues and balances are insufficient to meet authorized levels of appropriations.
New York Tax Stabilization Reserve Fund
N.Y. State Fin. Law § 92; (See also N.Y. Const. art. 7, § 17)
Any general fund cash surpluses existing at year-end, up to a maximum contribution of 0.2% of total general fund disbursements.
By transfer at the end of a fiscal year when general fund receipts fall below the aggregate amount disbursed from the general fund. The fund also can be temporarily loaned to the general fund to assist with cash flow.
Once borrowed, fund must be paid back within six years in three equal installments. Repayments to the Tax Stabilization Reserve Fund shall be stipulated in annual budget bills. Monies loaned on a temporary basis must be repaid in cash by the end of the fiscal year in which they were borrowed.
Reserve fund balance cannot exceed 2% of general fund disbursements for the fiscal year.
By appropriation
In the event of an economic downturn or catastrophic event, and upon notification to leaders of the executive and legislative branches, the director of the budget may authorize and direct the comptroller to transfer from the rainy day reserve fund to the general fund the amount needed to meet the requirements of the state financial plan. An economic downturn is defined as five consecutive months of decline in the composite index of business cycle indicators.
Withdrawals made due to economic downturn shall be repaid in cash within a period of three years. Withdrawals made due to catastrophic events shall be subject to repayment provisions to be proposed by the governor and implemented by appropriation or transfer of funds.
OR
At the request of the director of the budget, the state comptroller shall transfer monies to the rainy day reserve fund up to and including an amount equivalent to 0.3% of the aggregate amount projected to be disbursed from the general fund during the then-current fiscal year, unless such transfer would increase the rainy day reserve fund to an amount in excess of 3% of the aggregate amount projected to be disbursed from the general fund during the fiscal year immediately following the then-current fiscal year, in which event such transfer shall be limited to such amount as will increase the rainy day reserve fund to such 3% limitation.
Monies may also be temporarily loaned to the general fund during any fiscal year in anticipation of the receipt of revenues from taxes, fees and other sources required to be paid into the general fund during such fiscal year.
Monies temporarily loaned to the general fund must be repaid in cash during the same fiscal year.
North Carolina Savings Reserve Account
N.C. Gen. Stat. § 143C-4-2
Transfer of 1/4 of any unreserved credit balance at the end of the fiscal year.
Funds reserved to the Savings Reserve Account shall be available for expenditure only upon an act of appropriation by the General Assembly "[…] to address unanticipated events and circumstances such as natural disasters, economic downturns, threats to public safety, health, and welfare, and other emergencies."
It is a goal of the General Assembly and the state to accumulate and maintain a balance in the Savings Reserve Account equal to or greater than 8% of the prior year's general fund operating budget.
State Budget Stabilization Funds, Appendix A (Source: NCSL)
New YorkRainy Day Reserve Fund
N.Y. State Fin. Law § 92-cc
Fund cannot exceed 3% of projected general fund disbursements for the upcoming fiscal year.

127
State Fund Citation Method for Deposit Method for Withdrawal Repayment Provision Cap Note
North Dakota Budget Stabilization Fund
N.D. Cent. Code §§ 54-27.2-01, -02,-03
Transfer of general fund surplus in excess of $65 million at the end of the biennium.
Governor may transfer for revenue shortfall in excess of 2.5% of the estimate made by the most recently adjourned Assembly.
9.5% of the current biennial general fund budget.
OhioBudget Stabilization Fund
Ohio Rev. Code Ann. § 131.43
General Assembly to maintain by appropriation an amount of money in the budget stabilization fund that amounts to approximately 5% of the general fund revenues for the preceding fiscal year.
Governor submits to the General Assembly proposals for appropriations between the general fund and the budget stabilization fund.
Approximately 5% of general fund revenues for the preceding fiscal year.
The balance of the Budget Stabilization Fund may be combined with the balance in the general fund for purposes of cash management.
Up to 3/8 of the balance may be appropriated if: 1) forthcoming fiscal year general fund revenue is certified to be less than that of current fiscal year certification; or 2) if a revenue failure has occurred with respect to the general fund of the state treasury. Also, up to 1/4 of the balance may be appropriated if: 1) emergency declaration by governor with concurrence by Legislature with a 2/3 vote; 3) joint emergency declaration by speaker and president pro tempore with concurrence by Legislature with a 3/4 vote.
In years where there is no general fund shortfall and the balance at the beginning of the current fiscal year in the Fund is equal to or greater than $80 million, up to $10 million may be expended for the purpose of providing incentives to support retention of at-risk manufacturing establishments in order to retain employment for residents.
OregonEducation Stability Fund
Or. Const. art. XV, § 4 (see Or. Rev. Stat. § 348.716)
18% of net proceeds from the state lottery are deposited in the fund until the fund cap is reached. The Legislature may make additional appropriations into the fund.
Appropriation may be made with 3/5 of each house if: 1) the last quarterly economic and revenue forecast for a biennium indicates general fund revenues for the next biennium will be at least 3% less than appropriations from the state's general fund for the current biennium; 2) there has been a decline for two or more consecutive quarters in the last 12 months in seasonally adjusted nonfarm payroll employment; 3) a quarterly economic and revenue forecast projects that revenues in the state's general fund in the current biennium will be at least 2% below what the revenues were projected to be in the revenue forecast on which the adopted budget for the current biennium was based; or 4) if the proposed appropriation, allocation or transfer is approved by 3/5 of each house and the governor declares an emergency; or 4) if the Legislative Assembly and the governor declares an emergency.
5% of general fund revenues from the previous biennium.
Appropriations from the Education Stabilization Fund must be used on public education.
Oregon Rainy Day FundOr. Rev, Stat. § 293.144, et seq.
An amount equal to 1% of the general fund appropriations made for that biennium is to be transferred to the Rainy Day Fund; if the ending balance is equal to or less than 1% of the general fund appropriations, then the entire amount of the ending balance is to be transferred to the Rainy Day Fund.
Appropriation may be made with 3/5 of each house if: 1) the last quarterly economic and revenue forecast for a biennium indicates general fund revenues for the next biennium will be at least 3% less than appropriations from the state's general fund for the current biennium; 2) there has been a decline for two or more consecutive quarters in the last 12 months in seasonally adjusted nonfarm payroll employment; or 3) a quarterly economic and revenue forecast projects that revenues in the state's general fund in the current biennium will be at least 2% below what the revenues were projected to be in the revenue forecast on which the adopted budget for the current biennium was based.
7.5% of general fund revenues from the previous biennium.
Legislature may not appropriate more than 2/3 of the fund for any one biennium.
State Budget Stabilization Funds, Appendix A (Source: NCSL)
Oklahoma Constitutional Reserve Fund
Okla. Const. art. X, § 23
Transfer by the state treasurer of surplus of previous fiscal year's general fund revenue estimates.
15% of general fund revenue for the preceding fiscal year.

128
State Fund Citation Method for Deposit Method for Withdrawal Repayment Provision Cap Note
Pennsylvania Budget Stabilization Reserve Fund
Pa. Stat. tit. 72, § 1701-A, et seq.
In the event of a surplus in the general fund, 25% of the surplus is deposited into the Budget Stabilization Reserve Fund, or by appropriation.
By appropriation with 2/3 vote of both chambers when governor declares an emergency or to counterbalance downturns in the economy that will result in significant unanticipated revenue shortfalls.
If the Budget Stabilization Reserve Fund exceeds 6% of the actual general fund revenues received for the fiscal year in which the surplus occurs, 10% of the surplus shall be deposited by the end of the next succeeding quarter into the Budget Stabilization Reserve Fund.
Any money appropriated from the Budget Stabilization Reserve Fund which has then lapsed is returned to the Budget Stabilization Reserve Fund.
Puerto Rico Budgetary Fund P.R. Stat Tit. 23 § 106
Budgetary Fund to be maintained at not less than one third of one percent (1/3 of 1%) of the total Joint Budget Resolution (the governor may order a larger deposit).
The Governor may transfer funds to cover appropriations when resources are insufficient, to provide for payment of public debt service, to address any unexpected situation in the public service, or to honor obligations of programs funded with contributions or grants from the U.S. government that have not been received.
Fund capped at 6% of the appropriated funds of the Budget Joint Resolution in any year.
Rhode Island
State Budget Reserve and Cash Stabilization Account
R.I. Gen. Laws § 35-3-20; R.I. Gen. Laws § 35-3-20.1; see also R.I. Const. art. IX, § 16, and R.I. Gen. Laws § 35-6-1
State budget cannot exceed 98% (FY2012 97.2; and FY2013 and subsequent years 97%) of estimated state general revenues. An amount remaining between the budget cap (currently 98%) and 100% of estimated state general revenues is transferred by the controller into the Budget Reserve Account.
By a majority vote of each house of the General Assembly when the budget officer declares that actual general fund revenue will not equal the original estimates upon which appropriations were based.
State statutes call for the fund to be repaid in the second fiscal year following the fiscal year in which a transfer was made from the fund.
Fund capped at 4.6% for FY2012 of total fiscal year resources. It is then capped at 5% for FY2013 and all subsequent years.
South Carolina General Reserve Fund
S.C. Const. art. III, § 36; see also S.C. Code § 11-11-310
Transfer of prior year unobligated cash balance. By appropriation.
Amount must be restored to the Budget Reserve Fund within three fiscal years at a rate of not less than 1% of general fund revenue of latest completed fiscal year until fund is restored to 5%.
Incremental cap increase annually. Starting in FY2011, the cap is raised 0.5% until it reaches 5% of general fund appropriations for the prior fiscal year.
In any fiscal year in which the General Reserve Fund does not maintain the percentage amount required, monies from the Capital Reserve Fund first must be used to fully replenish the requisite percentage amount in the General Reserve Fund, and by appropriation when revenues at the end of the fiscal year are projected to be less than expenditures authorized by appropriation for that year.
If the Capital Reserve Fund is not tapped to address a budget deficit, the Legislature (with 2/3 vote of members present and voting, but not less than 3/5 vote of total membership) can appropriate money from the fund: 1) to finance in cash previously authorized capital improvement bond projects; 2) to retire interest or principal on bonds previously issued; or 3) for capital improvements or other nonrecurring purposes.
South Dakota General Reserve Fund
S.D. Codified Laws § 4-7-32
Transfer of prior year unobligated cash balance to General Reserve Fund
By special appropriation of the Legislature to redress unforeseen expenditure obligations or unforeseen revenue shortfalls. Appropriations must be approved by 2/3 vote of each house.
10% of general fund.
State Budget Stabilization Funds, Appendix A (Source: NCSL)
South CarolinaCapital Reserve Fund
S.C. Code § 11-11-320; S.C. Code § 11-11-325; S.C. Code § 11-11-335; see also S.C. Const. art. III, § 36
The Legislature shall appropriate an amount equal to 2% of general fund revenue of the latest completed fiscal year.
Fund capped at 2% of general fund appropriations for the prior fiscal year.
Any monies remaining in the Fund at the end of the fiscal year lapse and are credited to the general fund. The Capital Reserve Fund may not be used to offset a midyear budget reduction.

129
State Fund Citation Method for Deposit Method for Withdrawal Repayment Provision Cap Note
Tennessee Reserve for Revenue Fluctuations
Tenn. Code § 9-4-211
The governor shall include in the budget document and the general appropriations bill an amount of 10% or greater of the estimated growth in state tax revenues.
Transfer by the commissioner of Finance and Administration to offset revenue shortfalls, with notification to the chairs of the Finance, Ways & Means Committees of the Senate and House. Expenditure from the fund cannot exceed $100 million or 1/2 of the available reserve to meet expenditure requirements in excess of budgeted appropriation levels.
8% of estimated state tax revenues to be allocated to the general fund and education trust fund for given fiscal year.
The statute declares legislative intent to be that, to the extent practicable, revenue shortfalls will be offset by reductions in expenditures before using amounts in the reserve fund.
Texas Economic Stabilization Fund
Tex. Const. art. III, § 49-g
The constitutional amendment creating the fund mandates the following revenue transfers to it: 1) one-half of any unencumbered general revenue fund balance at the end of each fiscal biennium; 2) an amount of general revenue equal to 75% of the amount by which oil production tax collections in any future fiscal year exceed oil production tax collections in FY1987; 3) an amount of general revenue equal to 75% of the amount by which natural gas production tax collections in any future fiscal year exceed oil production tax collections in FY1987; 4) the Legislature also may appropriate additional funds.
By appropriation with a 3/5 vote of members present if: 1) the comptroller certifies that appropriations from general revenue made by the preceding Legislature for the current biennium exceed available general revenues for the remainder of the biennium; 2) an estimate of anticipated revenues for a succeeding biennium is less than the revenues estimated to be available for the current biennium; 3) for any purpose with 2/3 vote of members present.
Fund capped at 10% of general revenue fund deposits (excluding interest and investment income) during the preceding biennium.
Utah Budget Reserve Account
Utah Code §63J-1-312
25% of general fund surplus.By appropriation to cover operating deficits, state settlement agreements, retroactive tax refunds, or deficits in public education appropriations.
If a surplus exists and if, within the last 10 years, the Legislature has appropriated any money from the general fund Budget Reserve Account that has not been replaced, up to an additional 25% more of the surplus must be transferred to the general fund Budget Reserve Account to replace the amounts appropriated from the fund.
Fund capped at 8% of the general fund appropriation and Uniform School Fund appropriation amount for the fiscal year in which a surplus occurred.
Vermont Budget Stabilization Trust Fund
Vt. Stat. tit. 32, § 308
Undesignated general fund surplus; also, any additional amounts as may be authorized by the General Assembly.
Transfer by the commissioner of Finance and Management to the extent necessary to offset a general fund deficit.
Fund is capped at 5% of general fund appropriations for the prior fiscal year.
Vermont
Education Fund Budget Stabilization Reserve
Vt. Stat. tit. 16, §4026
Undesignated education fund surplus; also, any additional amounts as may be authorized by the General Assembly.
Transfer by the commissioner of Finance and Management to the extent necessary to offset the undesignated education fund deficit.
Fund is capped at 5% of education fund appropriations for the prior fiscal year, minus the amount distributed to school districts by municipalities for netting purposes.
Vermont
General Fund Budget Reserve (Rainy Day Reserve)
Vt. Stat. tit. 32, §308C
Any remaining unreserved and undesignated General Fund surplus shall be deposited in the General Fund Balance Reserve at the end of the FY.
By appropriation, if the General Assembly determines there are insufficient revenues to fund expenditures for the operation of State government at a level the General Assembly finds “prudent and required.”
Fund should not exceed 5% of the appropriations from the General Fund for the prior fiscal year without legislative authorization.
State Budget Stabilization Funds, Appendix A (Source: NCSL)
Fund capped at 9% of the Education Fund appropriations for the fiscal year in which the Education Fund revenue surplus occurred.
UtahEducation Budget Reserve Account
Utah Code § 63J-1-313
25% of education fund surplus.The Legislature may appropriate money from the Education Fund Budget Reserve Account only to resolve an Education Fund budget deficit.
If a surplus exists and if, within the last 10 years, the Legislature has appropriated any money from the Education Fund Budget Reserve Account that has not been replaced, up to an additional 25% more of the surplus must be transferred to the Education Fund Budget Reserve Account to replace the amounts appropriated from the fund.
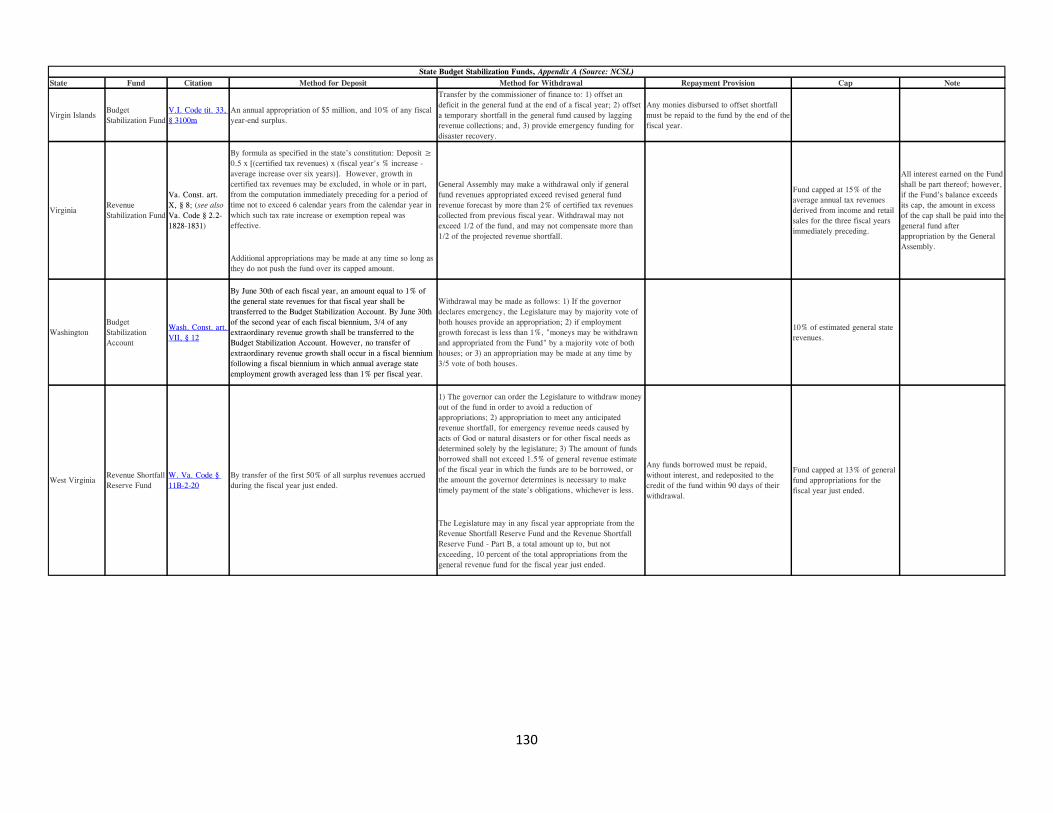
130
State Fund Citation Method for Deposit Method for Withdrawal Repayment Provision Cap Note
Virgin Islands Budget Stabilization Fund
V.I. Code tit. 33, § 3100m
An annual appropriation of $5 million, and 10% of any fiscal year-end surplus.
Transfer by the commissioner of finance to: 1) offset an deficit in the general fund at the end of a fiscal year; 2) offset a temporary shortfall in the general fund caused by lagging revenue collections; and, 3) provide emergency funding for disaster recovery.
Any monies disbursed to offset shortfall must be repaid to the fund by the end of the fiscal year.
By formula as specified in the state’s constitution: Deposit ≥ 0.5 x [(certified tax revenues) x (fiscal year's % increase - average increase over six years)]. However, growth in certified tax revenues may be excluded, in whole or in part, from the computation immediately preceding for a period of time not to exceed 6 calendar years from the calendar year in which such tax rate increase or exemption repeal was effective.
Additional appropriations may be made at any time so long as they do not push the fund over its capped amount.
WashingtonBudget Stabilization Account
Wash. Const. art. VII, § 12
By June 30th of each fiscal year, an amount equal to 1% of the general state revenues for that fiscal year shall be transferred to the Budget Stabilization Account. By June 30th of the second year of each fiscal biennium, 3/4 of any extraordinary revenue growth shall be transferred to the Budget Stabilization Account. However, no transfer of extraordinary revenue growth shall occur in a fiscal biennium following a fiscal biennium in which annual average state employment growth averaged less than 1% per fiscal year.
Withdrawal may be made as follows: 1) If the governor declares emergency, the Legislature may by majority vote of both houses provide an appropriation; 2) if employment growth forecast is less than 1%, "moneys may be withdrawn and appropriated from the Fund" by a majority vote of both houses; or 3) an appropriation may be made at any time by 3/5 vote of both houses.
10% of estimated general state revenues.
1) The governor can order the Legislature to withdraw money out of the fund in order to avoid a reduction of appropriations; 2) appropriation to meet any anticipated revenue shortfall, for emergency revenue needs caused by acts of God or natural disasters or for other fiscal needs as determined solely by the legislature; 3) The amount of funds borrowed shall not exceed 1.5% of general revenue estimate of the fiscal year in which the funds are to be borrowed, or the amount the governor determines is necessary to make timely payment of the state's obligations, whichever is less.
The Legislature may in any fiscal year appropriate from the Revenue Shortfall Reserve Fund and the Revenue Shortfall Reserve Fund - Part B, a total amount up to, but not exceeding, 10 percent of the total appropriations from the general revenue fund for the fiscal year just ended.
Virginia Revenue Stabilization Fund
Va. Const. art. X, § 8; (see also Va. Code § 2.2-1828-1831)
General Assembly may make a withdrawal only if general fund revenues appropriated exceed revised general fund revenue forecast by more than 2% of certified tax revenues collected from previous fiscal year. Withdrawal may not exceed 1/2 of the fund, and may not compensate more than 1/2 of the projected revenue shortfall.
Fund capped at 15% of the average annual tax revenues derived from income and retail sales for the three fiscal years immediately preceding.
All interest earned on the Fund shall be part thereof; however, if the Fund's balance exceeds its cap, the amount in excess of the cap shall be paid into the general fund after appropriation by the General Assembly.
State Budget Stabilization Funds, Appendix A (Source: NCSL)
West Virginia Revenue Shortfall Reserve Fund
W. Va. Code § 11B-2-20
By transfer of the first 50% of all surplus revenues accrued during the fiscal year just ended.
Any funds borrowed must be repaid, without interest, and redeposited to the credit of the fund within 90 days of their withdrawal.
Fund capped at 13% of general fund appropriations for the fiscal year just ended.
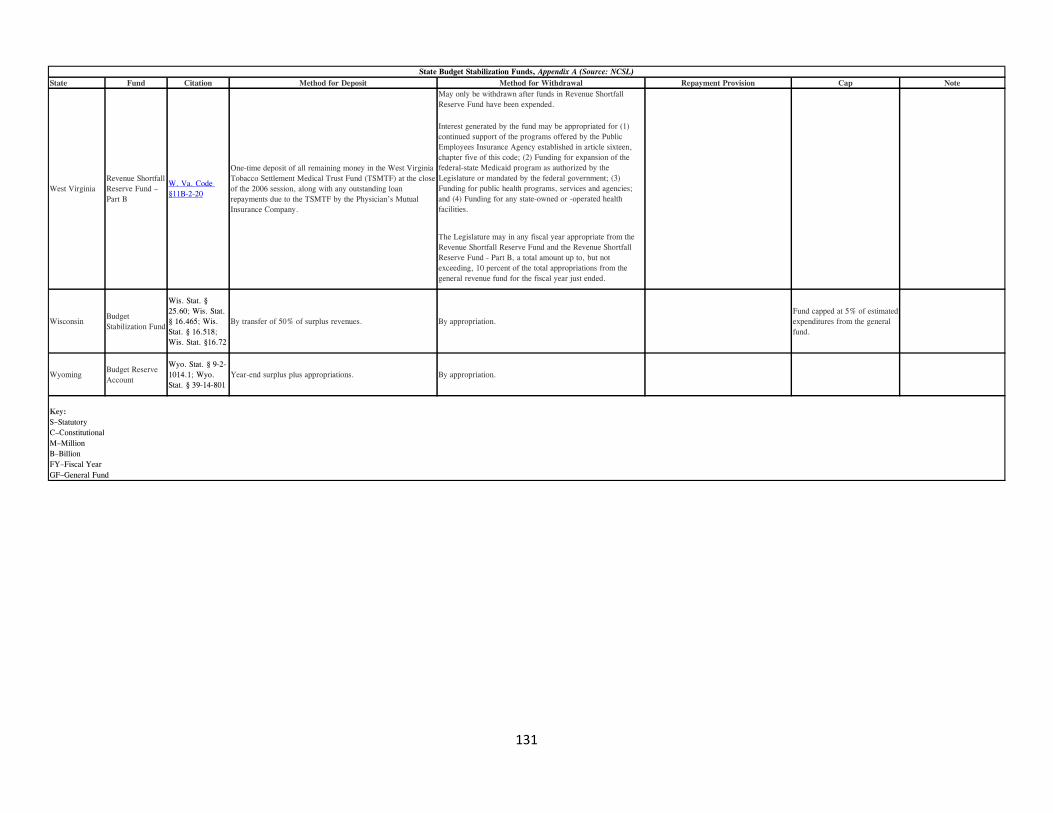
131
State Fund Citation Method for Deposit Method for Withdrawal Repayment Provision Cap NoteMay only be withdrawn after funds in Revenue Shortfall Reserve Fund have been expended.
Interest generated by the fund may be appropriated for (1) continued support of the programs offered by the Public Employees Insurance Agency established in article sixteen, chapter five of this code; (2) Funding for expansion of the federal-state Medicaid program as authorized by the Legislature or mandated by the federal government; (3) Funding for public health programs, services and agencies; and (4) Funding for any state-owned or -operated health facilities.
The Legislature may in any fiscal year appropriate from the Revenue Shortfall Reserve Fund and the Revenue Shortfall Reserve Fund - Part B, a total amount up to, but not exceeding, 10 percent of the total appropriations from the general revenue fund for the fiscal year just ended.
Wisconsin Budget Stabilization Fund
Wis. Stat. § 25.60; Wis. Stat. § 16.465; Wis. Stat. § 16.518; Wis. Stat. §16.72
By transfer of 50% of surplus revenues. By appropriation.Fund capped at 5% of estimated expenditures from the general fund.
Wyoming Budget Reserve Account
Wyo. Stat. § 9-2-1014.1; Wyo. Stat. § 39-14-801
Year-end surplus plus appropriations. By appropriation.
West VirginiaRevenue Shortfall Reserve Fund – Part B
W. Va. Code §11B-2-20
One-time deposit of all remaining money in the West Virginia Tobacco Settlement Medical Trust Fund (TSMTF) at the close of the 2006 session, along with any outstanding loan repayments due to the TSMTF by the Physician’s Mutual Insurance Company.
State Budget Stabilization Funds, Appendix A (Source: NCSL)
FY–Fiscal YearGF–General Fund
Key:S–StatutoryC–ConstitutionalM–MillionB–Billion

BACKGROUND
The Commission on Government Forecasting and Accountability (CGFA), a bipartisan, joint legislative commission, provides the General Assembly with information relevant to the Illinois economy, taxes and other sources of revenue and debt obligations of the State. The Commission's specific responsibilities include:
1) Preparation of annual revenue estimates with periodic updates;
2) Analysis of the fiscal impact of revenue bills;
3) Preparation of State debt impact notes on legislation which would appropriate bond funds or increase bond authorization;
4) Periodic assessment of capital facility plans;
5) Annual estimates of public pension funding requirements and preparation of pension impact notes;
6) Annual estimates of the liabilities of the State's group health insurance program and approval of contract renewals promulgated by the Department of Central Management Services;
7) Administration of the State Facility Closure Act. The Commission also has a mandate to report to the General Assembly ". . . on economic trends in relation to long-range planning and budgeting; and to study and make such recommendations as it deems appropriate on local and regional economic and fiscal policies and on federal fiscal policy as it may affect Illinois. . . ." This results in several reports on various economic issues throughout the year. The Commission publishes several reports each year. In addition to a “Monthly Briefing”, the Commission publishes the "Revenue Estimate and Economic Outlook" which describes and projects economic conditions and their impact on State revenues. The “Legislative Capital Plan Analysis” examines the State's capital appropriations plan and debt position. “The Financial Conditions of the Illinois Public Retirement Systems” provides an overview of the funding condition of the State’s retirement systems. Also published are an Annual Fiscal Year “Budget Summary”; “Report on the Liabilities of the State Employees’ Group Insurance Program”; and “Report of the Cost and Savings of the State Employees’ Early Retirement Incentive Program”. The Commission also publishes each year special topic reports that have or could have an impact on the economic wellbeing of Illinois. All reports are available on the Commission’s website. These reports are available from: Commission on Government Forecasting and Accountability 703 Stratton Office Building Springfield, Illinois 62706 (217) 782-5320 (217) 782-3513 (FAX)
http://cgfa.ilga.gov