illumina q2 2017 financial results · illumina q2 2017 financial results august 1, 2017. 2 safe...
TRANSCRIPT

© 2017 Illumina, Inc. All rights reserved.
Illumina Q2 2017 Financial ResultsAugust 1, 2017
2
Safe Harbor Statement
This communication may contain forward-looking statements that involve risks and
uncertainties, such as Illumina’s expectations regarding its financial outlook and
guidance for fiscal 2017 and the launch of any products. Among the important factors
that could cause actual results to differ materially from those in any forward-looking
statements are (i) our ability to further develop and commercialize our instruments and
consumables and to deploy new products, services and applications, and expand the
markets for our technology platforms; (ii) our ability to manufacture robust
instrumentation and consumables; (iii) our ability to successfully identify and integrate
acquired technologies, products, or businesses; (iv) our expectations and beliefs
regarding future conduct and growth of the business and the markets in which we
operate; (v) challenges inherent in developing, manufacturing, and launching new
products and services, including the timing of customer orders and impact on existing
products and services; and (vi) the application of generally accepted accounting
principles, which are highly complex and involve many subjective assumptions,
estimates, and judgments, together with other factors detailed in our filings with the
Securities and Exchange Commission, including our most recent filings on Forms 10-K
and 10-Q, or in information disclosed in public conference calls, the date and time of
which are released beforehand. We undertake no obligation, and do not intend, to
update these forward-looking statements, to review or confirm analysts’ expectations, or
to provide interim reports or updates on the progress of the current quarter.

3
Q2 2017 OverviewRevenue and Non-GAAP EPS exceeded expectations
● Sequencing consumables and microarrays drove the outperformance versus
guidance
● NovaSeq orders surpassed expectations by 30%; >230 orders to date
● GM% drivers included the NovaSeq introduction, array services mix and
inventory reserves
● OM% drivers were the lower GM% and headcount additions
$ in millions, except % and per share data (non-GAAP)1 Q2’17 Q2’16 Δ
Revenue $662.4 $600.1 10%
Gross Margin 67.0% 72.4% (540 bps)
Operating Margin2 22.1% 27.2% (510 bps)
EPS3 $0.82 $0.86 (5%)
1. Financials include $39.0 million and $32.0 million of stock-based compensation expense in Q2’17 and Q2’16, respectively
2. Excluding GRAIL and Helix, operating margin for Q2’17 was 24.4% compared to 29.8% in Q2’16
3. Non-GAAP attributable to Illumina stockholders
4
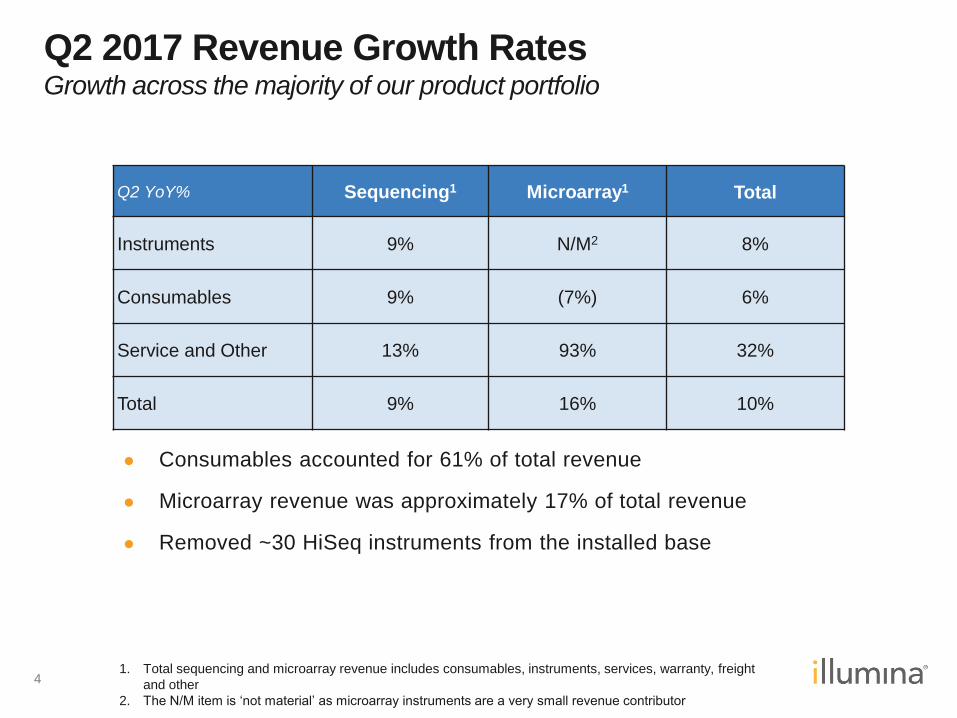
Q2 2017 Revenue Growth RatesGrowth across the majority of our product portfolio
Q2 YoY% Sequencing1 Microarray1 Total
Instruments 9% N/M2 8%
Consumables 9% (7%) 6%
Service and Other 13% 93% 32%
Total 9% 16% 10%
● Consumables accounted for 61% of total revenue
● Microarray revenue was approximately 17% of total revenue
● Removed ~30 HiSeq instruments from the installed base
1. Total sequencing and microarray revenue includes consumables, instruments, services, warranty, freight
and other
2. The N/M item is ‘not material’ as microarray instruments are a very small revenue contributor
5
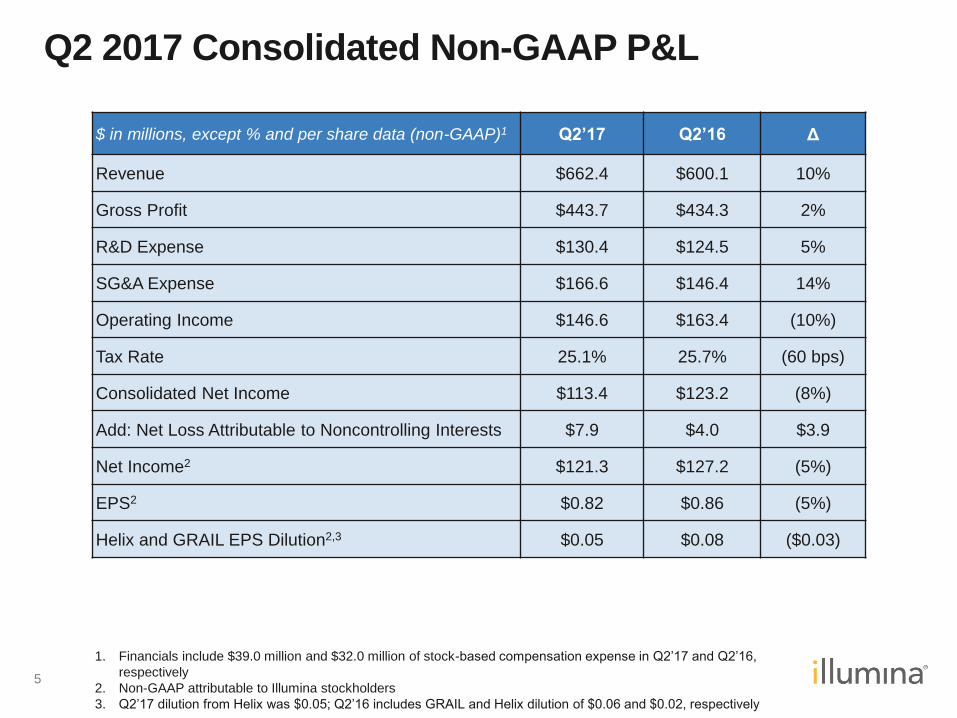
Q2 2017 Consolidated Non-GAAP P&L
1. Financials include $39.0 million and $32.0 million of stock-based compensation expense in Q2’17 and Q2’16,
respectively
2. Non-GAAP attributable to Illumina stockholders
3. Q2’17 dilution from Helix was $0.05; Q2’16 includes GRAIL and Helix dilution of $0.06 and $0.02, respectively
$ in millions, except % and per share data (non-GAAP)1 Q2’17 Q2’16 Δ
Revenue $662.4 $600.1 10%
Gross Profit $443.7 $434.3 2%
R&D Expense $130.4 $124.5 5%
SG&A Expense $166.6 $146.4 14%
Operating Income $146.6 $163.4 (10%)
Tax Rate 25.1% 25.7% (60 bps)
Consolidated Net Income $113.4 $123.2 (8%)
Add: Net Loss Attributable to Noncontrolling Interests $7.9 $4.0 $3.9
Net Income2 $121.3 $127.2 (5%)
EPS2 $0.82 $0.86 (5%)
Helix and GRAIL EPS Dilution2,3 $0.05 $0.08 ($0.03)

6
Balance Sheet / Cash FlowStrong cash position
$ in millions, except DSO Q2’17 Q1’17
Cash & Investments $1,893.1 $1,777.8
Inventory $309.2 $298.8
Accounts Receivable (DSO) $371.9 (51) $368.4 (56)
Principal Amount of Convertible Notes Outstanding $1,150.0 $1,150.0
Operating Cash Flow $177.6 $168.0
Free Cash Flow $109.0 $84.6
● Consolidated operating cash flow was lowered by $13 million due to Helix
● DSO lower due to improvement in revenue linearity

7
2017 GuidanceUpdated FY’17 revenue growth outlook
1. Guidance given via 8-k and press release on August 1, 2017; assumes constant currency rates from August 1, 2017
2. Includes $0.18 of dilution from Helix
3. Attributable to Illumina stockholders
20171
Revenue1
~12%
Non-GAAP EPS2,3
$3.60 - $3.70
GAAP EPS2,3
$5.36 - $5.46

8
Non-GAAP Reconciliations
Appendix
9
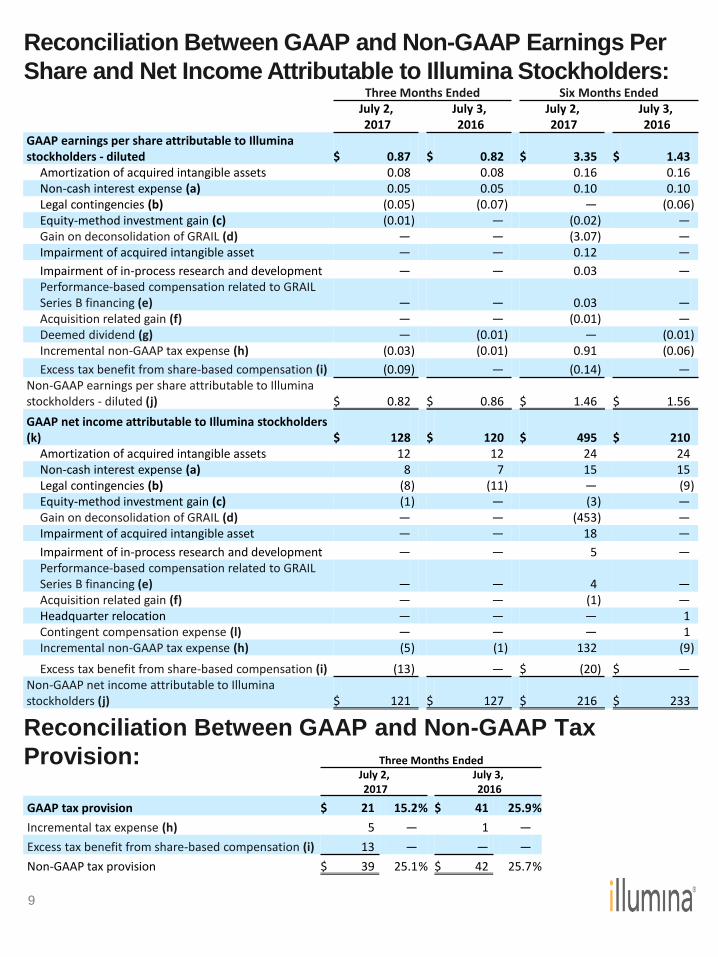
Reconciliation Between GAAP and Non-GAAP Earnings Per
Share and Net Income Attributable to Illumina Stockholders:
Reconciliation Between GAAP and Non-GAAP Tax
Provision:
Three Months Ended Six Months EndedJuly 2,2017
July 3,2016
July 2,2017
July 3,2016
GAAP earnings per share attributable to Illumina stockholders - diluted $ 0.87 $ 0.82 $ 3.35 $ 1.43
Amortization of acquired intangible assets 0.08 0.08 0.16 0.16Non-cash interest expense (a) 0.05 0.05 0.10 0.10Legal contingencies (b) (0.05) (0.07) — (0.06)Equity-method investment gain (c) (0.01) — (0.02) —Gain on deconsolidation of GRAIL (d) — — (3.07) —Impairment of acquired intangible asset — — 0.12 —
Impairment of in-process research and development — — 0.03 —Performance-based compensation related to GRAIL Series B financing (e) — — 0.03 —Acquisition related gain (f) — — (0.01) —Deemed dividend (g) — (0.01) — (0.01)Incremental non-GAAP tax expense (h) (0.03) (0.01) 0.91 (0.06)
Excess tax benefit from share-based compensation (i) (0.09) — (0.14) —Non-GAAP earnings per share attributable to Illumina stockholders - diluted (j) $ 0.82 $ 0.86 $ 1.46 $ 1.56
GAAP net income attributable to Illumina stockholders (k) $ 128 $ 120 $ 495 $ 210
Amortization of acquired intangible assets 12 12 24 24Non-cash interest expense (a) 8 7 15 15Legal contingencies (b) (8) (11) — (9)Equity-method investment gain (c) (1) — (3) —Gain on deconsolidation of GRAIL (d) — — (453) —Impairment of acquired intangible asset — — 18 —
Impairment of in-process research and development — — 5 —Performance-based compensation related to GRAIL Series B financing (e) — — 4 —Acquisition related gain (f) — — (1) —Headquarter relocation — — — 1Contingent compensation expense (l) — — — 1Incremental non-GAAP tax expense (h) (5) (1) 132 (9)
Excess tax benefit from share-based compensation (i) (13) — $ (20) $ —Non-GAAP net income attributable to Illumina stockholders (j) $ 121 $ 127 $ 216 $ 233
Three Months EndedJuly 2,2017
July 3,2016
GAAP tax provision $ 21 15.2% $ 41 25.9%
Incremental tax expense (h) 5 — 1 —
Excess tax benefit from share-based compensation (i) 13 — — —
Non-GAAP tax provision $ 39 25.1% $ 42 25.7%
10
Footnotes to the Reconciliation Between GAAP and Non-
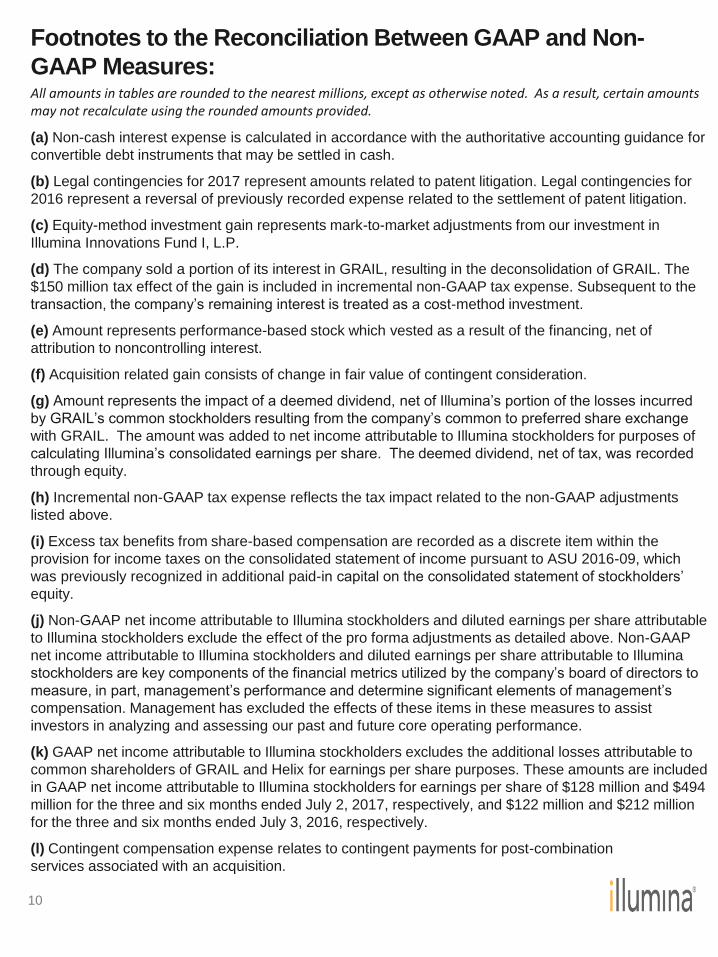
GAAP Measures:All amounts in tables are rounded to the nearest millions, except as otherwise noted. As a result, certain amounts may not recalculate using the rounded amounts provided.
(a) Non-cash interest expense is calculated in accordance with the authoritative accounting guidance for
convertible debt instruments that may be settled in cash.
(b) Legal contingencies for 2017 represent amounts related to patent litigation. Legal contingencies for
2016 represent a reversal of previously recorded expense related to the settlement of patent litigation.
(c) Equity-method investment gain represents mark-to-market adjustments from our investment in
Illumina Innovations Fund I, L.P.
(d) The company sold a portion of its interest in GRAIL, resulting in the deconsolidation of GRAIL. The
$150 million tax effect of the gain is included in incremental non-GAAP tax expense. Subsequent to the
transaction, the company’s remaining interest is treated as a cost-method investment.
(e) Amount represents performance-based stock which vested as a result of the financing, net of
attribution to noncontrolling interest.
(f) Acquisition related gain consists of change in fair value of contingent consideration.
(g) Amount represents the impact of a deemed dividend, net of Illumina’s portion of the losses incurred
by GRAIL’s common stockholders resulting from the company’s common to preferred share exchange
with GRAIL. The amount was added to net income attributable to Illumina stockholders for purposes of
calculating Illumina’s consolidated earnings per share. The deemed dividend, net of tax, was recorded
through equity.
(h) Incremental non-GAAP tax expense reflects the tax impact related to the non-GAAP adjustments
listed above.
(i) Excess tax benefits from share-based compensation are recorded as a discrete item within the
provision for income taxes on the consolidated statement of income pursuant to ASU 2016-09, which
was previously recognized in additional paid-in capital on the consolidated statement of stockholders’
equity.
(j) Non-GAAP net income attributable to Illumina stockholders and diluted earnings per share attributable
to Illumina stockholders exclude the effect of the pro forma adjustments as detailed above. Non-GAAP
net income attributable to Illumina stockholders and diluted earnings per share attributable to Illumina
stockholders are key components of the financial metrics utilized by the company’s board of directors to
measure, in part, management’s performance and determine significant elements of management’s
compensation. Management has excluded the effects of these items in these measures to assist
investors in analyzing and assessing our past and future core operating performance.
(k) GAAP net income attributable to Illumina stockholders excludes the additional losses attributable to
common shareholders of GRAIL and Helix for earnings per share purposes. These amounts are included
in GAAP net income attributable to Illumina stockholders for earnings per share of $128 million and $494
million for the three and six months ended July 2, 2017, respectively, and $122 million and $212 million
for the three and six months ended July 3, 2016, respectively.
(l) Contingent compensation expense relates to contingent payments for post-combination
services associated with an acquisition.

11
Reconciliation Between GAAP and Non-GAAP Results of
Operations as a Percent of Revenue:Three Months Ended Six Months Ended
July 2,2017
July 3,2016
July 2,2017
July 3,2016
GAAP gross profit $ 434 65.5 % $ 424 70.6 % $ 802 63.6 % $ 821 70.0 %
Amortization of acquired intangible asset 10 1.5 % 10 1.8 % 21 1.7 % 21 1.8 %Impairment of acquired intangible asset — — — — 18 1.4 % — —Non-GAAP gross profit (a) $ 444 67.0 % $ 434 72.4 % $ 841 66.7 % $ 842 71.8 %
GAAP research and development expense $ 130 19.7 % $ 125 20.7 % $ 275 21.8 % $ 249 21.2 %Impairment of in-process research and development — — — — (5) (0.4)% — —Non-GAAP research and development expense $ 130 19.7 % $ 125 20.7 % $ 270 21.4 % $ 249 21.2 %
GAAP selling, general and administrative expense $ 169 25.4 % $ 148 24.7 % $ 332 26.3 % $ 298 25.4 %
Amortization of acquired intangible assets (2) (0.2)% (2) (0.3)% (3) (0.2)% (3) (0.2)%Performance-based compensation related to GRAIL Series B financing (b) — — — — (10) (0.8)% — —Acquisition related gain (c) — — — — 1 0.1 % — —Contingent compensation expense (d) — — — — — — (1) (0.1)%Headquarter relocation — — — — — — (1) (0.1)%Non-GAAP selling, general and administrative expense $ 167 25.2 % $ 146 24.4 % $ 320 25.4 % $ 293 25.0 %
GAAP operating profit $ 143 21.6 % $ 162 27.0 % $ 195 15.5 % $ 283 24.2 %
Amortization of acquired intangible assets 12 1.7 % 12 2.0 % 24 1.9 % 24 2.0 %Legal contingencies (e) (8) (1.2)% (11) (1.8)% — — (9) (0.7)%Impairment of acquired intangible asset — — — — 18 1.4 % — —Performance-based compensation related to GRAIL Series B financing (b) — — — — 10 0.8 % — —Impairment of in-process research and development — — — — 5 0.4 % — —
Acquisition related gain (c) — — — — (1) (0.1)% — —Headquarter relocation — — — — — — 1 0.1 %Contingent compensation expense (d) — — — — — — 1 0.1 %Non-GAAP operating profit (a) $ 147 22.1 % $ 163 27.2 % $ 251 19.9 % $ 300 25.7 %
GAAP other income (expense), net $ (2) (0.3)% $ (5) (0.8)% $ 450 35.7 % $ (10) (0.9)%Non-cash interest expense (f) 8 1.2 % 7 1.2 % 15 1.2 % 15 1.3 %
Equity-method investment gain (g) (1) (0.2)% — — (3) (0.2)% — —
Gain on deconsolidation of GRAIL (h) — — — — (453) (36.0)% — —Non-GAAP other income, net (a) $ 5 0.7 % $ 2 0.4 % $ 9 0.7 % $ 5 0.4 %_______________________________________________________________
All amounts in tables are rounded to the nearest millions, except as otherwise noted. As a result, certain amounts may not
recalculate using the rounded amounts provided.

12
Footnotes to the Reconciliation Between GAAP and Non-
GAAP Results of Operations:
All amounts in tables are rounded to the nearest millions, except as otherwise noted. As a result, certain amounts may not recalculate using the rounded amounts provided.
(a) Non-GAAP gross profit, included within non-GAAP operating profit, is a key measure of the
effectiveness and efficiency of manufacturing processes, product mix and the average selling
prices of the company’s products and services. Non-GAAP operating profit, and non-GAAP other
income (expense), net, exclude the effects of the pro forma adjustments as detailed above.
Management has excluded the effects of these items in these measures to assist investors in
analyzing and assessing past and future operating performance.
(b) Amount represents performance-based stock which vested as a result of the financing.
(c) Acquisition related gain consists of change in fair value of contingent consideration.
(d) Contingent compensation expense relates to contingent payments for post-combination
services associated with an acquisition.
(e) Legal contingencies for 2017 represent amounts related to patent litigation. Legal
contingencies for 2016 represent a reversal of previously recorded expense related to the
settlement of patent litigation.
(f) Non-cash interest expense is calculated in accordance with the authoritative accounting
guidance for convertible debt instruments that may be settled in cash.
(g) Equity-method investment gain represents mark-to-market adjustments from our investment in
Illumina Innovations Fund I, L.P.
(h) The company sold a portion of its interest in GRAIL in Q1 2017, resulting in the
deconsolidation of GRAIL. Subsequent to the transaction, the company’s remaining interest is
treated as a cost-method investment.

13
Reconciliation of Non-GAAP Financial Guidance
The company’s future performance and financial results are subject to risks and uncertainties, and
actual results could differ materially from the guidance set forth below. More information on potential
factors that could affect the company’s financial results is included from time to time in the company’s
public reports filed with the Securities and Exchange Commission, including the company’s Form 10-
K for the fiscal year ended January 1, 2017 filed with the SEC on February 13, 2017, and the
company’s Form 10-Q for the fiscal quarter ended April 2, 2017. The company assumes no obligation
to update any forward-looking statements or information.
(a) The company sold a portion of its interest in GRAIL, resulting in the deconsolidation of GRAIL. The
$150 million tax effect of the gain is included in incremental non-GAAP tax expense. Subsequent to the
transaction, the company’s remaining interest is treated as a cost-method investment.
(b) Non-cash interest expense is calculated in accordance with the authoritative accounting guidance
for convertible debt instruments that may be settled in cash.
(c) Amount represents performance-based stock which vested as a result of the financing, net of
attribution to noncontrolling interest.
(d) Equity-method investment gain represents mark-to-market adjustments from our investment in
Illumina Innovations Fund I, L.P.
(e) Acquisition related gain consists of change in fair value of contingent consideration.
(f) Incremental non-GAAP tax expense reflects the tax impact related to the non-GAAP adjustments
listed above.
Fiscal Year 2017
GAAP diluted earnings per share attributable to Illumina stockholders $5.36 - $5.46
Gain on deconsolidation of GRAIL (a) (3.07)
Amortization of acquired intangible assets 0.30
Non-cash interest expense (b) 0.20
Impairment of acquired intangible asset 0.12
Impairment of in-process research and development 0.03
Performance-based compensation related to Series B financing (c) 0.03
Equity-method investment gain, net (d) (0.02)
Acquisition related gain (e) (0.01)
Incremental non-GAAP tax expense (f) 0.80
Excess tax benefits from share-based compensation (g) (0.14)
Non-GAAP diluted earnings per share attributable to Illumina stockholders $3.60 - $3.70