illustrating the extent and severity of the 2015...
TRANSCRIPT

FEWS NET ETHIOPIA
[email protected] www.fews.net/ethiopia
FEWS NET is a USAID-funded activity. The content of this report does not necessarily reflect the
view of the United States Agency for International Development or the United States Government.
ETHIOPIA Special Report December 17, 2015
Illustrating the extent and severity of the 2015 drought
An assessment of historical rainfall data indicates that central/eastern Ethiopia has experienced the worst drought in more than 50 years. As a result, a major food security Emergency is expected to persist through much of 2016. This report presents a series of maps which illustrate the
extent and the severity of the drought as well as its impacts on water availability, crop and rangeland conditions, and food security. For a more detailed narrative and analysis of the drought’s current and expected impacts on food security, please visit www.fews.net/ethiopia.
Map 1. March – September 2015 rainfall anomaly (% of the 1981-2014 average) for East Africa
Source: FEWS NET/USGS
This map illustrates how rainfall between March and September 2015 deviated from the 1981-2014 average across the East Africa Region. During this period, rainfall was more than 25 percent below average across large areas of central/eastern Ethiopia and eastern Sudan, and smaller areas of Djibouti, Eritrea, northeastern Somalia, northern Darfur, and western Kenya. The March-September period includes the major agricultural seasons of these countries.

ETHIOPIA Special Report December 17, 2015
Famine Early Warning Systems Network 2
Map 2. March – September 2015 rainfall anomaly (% of the 1981-2014 average) for Ethiopia
Source: FEWS NET/USGS
This map provides a more detailed view of how rainfall between March and September 2015 deviated from the 1981-2014 average in Ethiopia. During this period rainfall was more than 35 percent below average across much of Afar Region, northern Somali Region, and parts of eastern Amhara. An even larger area had rainfall more than 25 percent below average. An analysis of two rainfall datasets, CenTrends (1960-2014) and CHIRPS (1981-2015), indicates that total rainfall averaged 480 mm across central/eastern Ethiopia1 between March and September 2015, the lowest level in more than 50 years (Figure 1).
1 Central/eastern Ethiopia was defined as the area bordered by the blue line in Map 2.
Figure 1. March to September rainfall in central/eastern1 Ethiopia (1960-2015)
Source: USGS, Florida State University
ETHIOPIA Special Report December 17, 2015
Famine Early Warning Systems Network 3
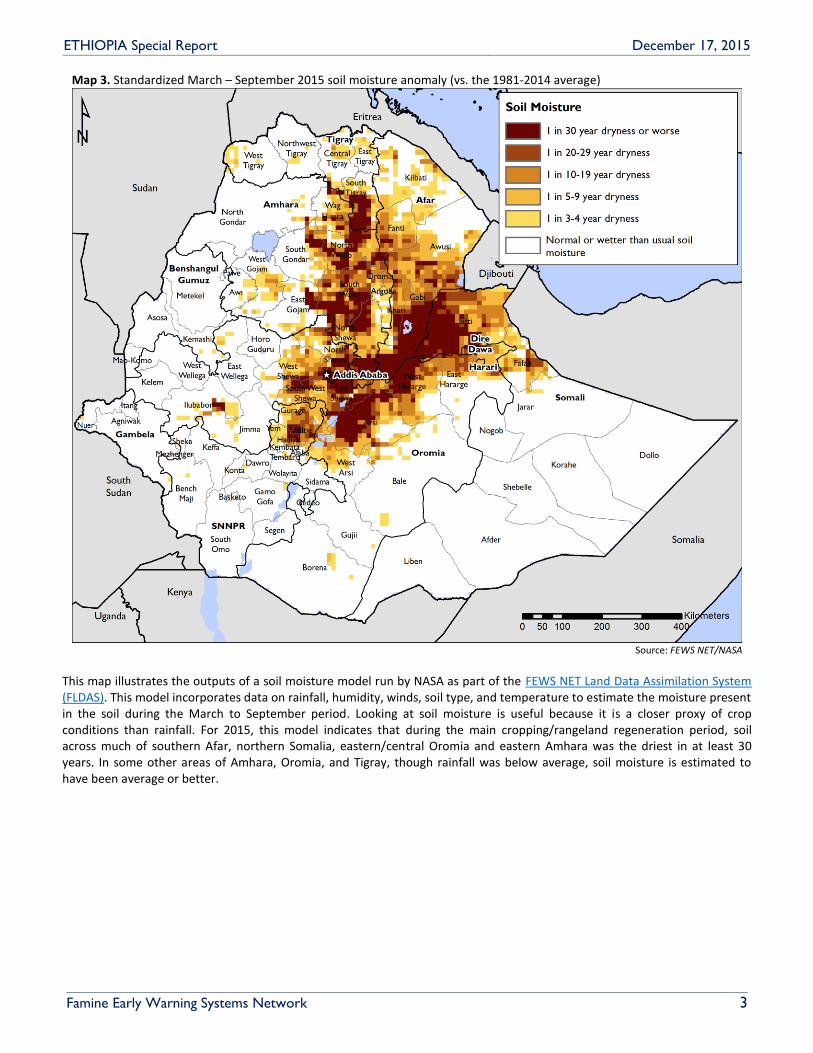
Map 3. Standardized March – September 2015 soil moisture anomaly (vs. the 1981-2014 average)
Source: FEWS NET/NASA
This map illustrates the outputs of a soil moisture model run by NASA as part of the FEWS NET Land Data Assimilation System (FLDAS). This model incorporates data on rainfall, humidity, winds, soil type, and temperature to estimate the moisture present in the soil during the March to September period. Looking at soil moisture is useful because it is a closer proxy of crop conditions than rainfall. For 2015, this model indicates that during the main cropping/rangeland regeneration period, soil across much of southern Afar, northern Somalia, eastern/central Oromia and eastern Amhara was the driest in at least 30 years. In some other areas of Amhara, Oromia, and Tigray, though rainfall was below average, soil moisture is estimated to have been average or better.

ETHIOPIA Special Report December 17, 2015
Famine Early Warning Systems Network 4
Map 4. Water availability per capita anomaly (% of the 1981-2014 average)
Source: FEWS NET/NASA
This map presents another output of the FEWS NET Land Data Assimilation System (FLDAS) - water availability per capita compared to the long-term average. This data suggests severe water deficits (less than 35 percent of average) in the northern pastoral and eastern cropping areas highlighted in previous maps as well as significant deficits (less than 50% of average) in large additional areas of the country.

ETHIOPIA Special Report December 17, 2015
Famine Early Warning Systems Network 5
Map 5. End of season Meher maize crop conditions based on the Water Requirements Satisfaction Index (WRSI)
Source: FEWS NET/USGS
Map 5 presents the results of the WRSI, a water balance model, for Meher season maize. This analysis suggests Poor crop conditions or crop failure in Jijiga zone (Somali region), parts of East and West Hararghe, Arsi, West Arsi, and North Shewa (Oromia region), North Wollo, South Wollo, and North Shewa (Amhara Region), and four of the five zones of Tigray. Mediocre crop conditions are even more widespread. Similar analyses of sorghum, wheat, beans, and barley estimate broadly similar patterns of crop conditions. Field assessments suggest that in the worst affected areas crop conditions could be similar to, or worse than, the model outputs suggest.

ETHIOPIA Special Report December 17, 2015
Famine Early Warning Systems Network 6
Map 6. November 26 – December 5, 2015 vegetation anomaly (vs. 2001-10 average)
Source: FEWS NET/USGS
This map uses eMODIS Normalized Difference Vegetation Index (NDVI) to estimate the current health of vegetation compared to average. This data indicates that vegetation conditions are below-average in central/eastern Oromia, southern Afar, eastern Amhara, and much of Tigray. These poor vegetation conditions are particularly concerning in northern pastoral areas of Afar and Somali Region which are unlikely to receive significant rains for another three to four months. In the southern half of the country vegetation conditions are significantly better than usual following above-average rainfall since October.

ETHIOPIA Special Report December 17, 2015
Famine Early Warning Systems Network 7
Map 7. Projected food security classification (January – March 2016)
Source: FEWS NET
Following the worst drought in more than 50 years, a major food security emergency is ongoing in central and eastern Ethiopia. The Government of Ethiopia estimates that 10.2 million people will require emergency food assistance in 2016, making Ethiopia the country with the largest acutely food insecure population in the world. Already, significant populations in northern Somali region and southern Afar are in Emergency (IPC Phase 4), meaning that they are unable to access adequate food for survival and face an increased risk of malnutrition and mortality. Map 7 illustrates that, by the January to March period, the area classified as Emergency is expected to expand to include areas of eastern Oromia; after March, areas classified as Emergency may increase further. Sustained, large-scale, multi-sectoral emergency assistance is required immediately to save lives and livelihoods.