image analysis of microscopic crack patterns applied to
TRANSCRIPT

HAL Id: hal-01687308https://hal.archives-ouvertes.fr/hal-01687308
Submitted on 15 Feb 2019
HAL is a multi-disciplinary open accessarchive for the deposit and dissemination of sci-entific research documents, whether they are pub-lished or not. The documents may come fromteaching and research institutions in France orabroad, or from public or private research centers.
L’archive ouverte pluridisciplinaire HAL, estdestinée au dépôt et à la diffusion de documentsscientifiques de niveau recherche, publiés ou non,émanant des établissements d’enseignement et derecherche français ou étrangers, des laboratoirespublics ou privés.
Image analysis of microscopic crack patterns applied tothermal fatigue heat-checking of high temperature tool
steelsSabine Le Roux, Farid Medjedoub, Gilles Dour, Farhad Rezai-Aria
To cite this version:Sabine Le Roux, Farid Medjedoub, Gilles Dour, Farhad Rezai-Aria. Image analysis of microscopiccrack patterns applied to thermal fatigue heat-checking of high temperature tool steels. Micron,Elsevier, 2013, 44, pp.347-358. �10.1016/j.micron.2012.08.007�. �hal-01687308�

Image analysis of microscopic crack patterns applied to thermal fatigueheat-checking of high temperature tool steels
Sabine Le Roux, Farid Medjedoub1, Gilles Dour2, Farhad Rézaï-Aria ∗
Université de Toulouse, Mines Albi, ICA (Institut Clément Ader), Campus Jarlard, F-81013 Albi Cedex 09, France
Keywords:Image analysisScanning electron microscopyThermal fatigueCrack patternOxidationHot work tool steel
a b s t r a c t
Surface cracking or heat-checking is investigated at a microscopic scale on a hot work tool steel(X38CrMoV5) tested under thermal fatigue. Thermal fatigue tests are periodically interrupted to observethe surface of the specimens by scanning electron microscopy (SEM). A non destructive and semi-automatic method is developed to assess and evaluate the two-dimensional crack pattern initiated on theoxide scale layer formed on the specimen surface. The crack pattern is characterized by image analysis interms of density, morphological and topological features. This technique allows to determine the numberof cycles to initiate the microscopic heat-checking and to follow its evolution.
1. Introduction
One of the major damage mechanisms occurring in hot formingtool steels under thermal fatigue solicitations is the formation ofa network of interconnected cracks, often named “heat-checking”(Jean et al., 1999; Medjedoub et al., 2005; Norström et al., 1981;Persson et al., 2004). This kind of crack pattern is generally observedwhen a surface is subjected to the removal of a diffusing heat (incooling) or liquid (in drying), as for example in thermally quenchedceramic materials (Korneta et al., 1998), dried mud (Velde, 1999;Vogel et al., 2005), drying of thin layers and films prepared bya sol–gel process (Bockmeyer and Löbmann, 2007; Shorlin et al.,2000). Persson et al. (2004) have related the heat-checking devel-oping on hot work tool steels to a strong thermal gradient thatprovides tensile stresses during the cooling phase. In brittle mate-rials, the tensile stresses are relieved by the development of a crackpattern on the surface (Korneta et al., 1998).
Different techniques are used to analyze surface crack damage.Norström et al. (1981) evaluated and ranked the steel resistanceto heat-checking by a comparative method based on in-housestandard charts. This technique allows a qualitative classificationof the steels, but is limitative. Indeed, such method does not give
∗ Corresponding author. Tel.: +33 563493082; fax: +33 563493099.E-mail address: [email protected] (F. Rézaï-Aria).
1 Present address: Airbus France, Site de Saint Martin du Touch, 316 Route deBayonne, 31060 Toulouse Cedex 9, France.
2 Present address: NOPSEMA, Level 08 Alluvion Bld, 58 Mounts Bay Road, Perth6000 WA, Australia.
a very precise quantification of the damage grading, and it is onlysuitable for a specific type of damage at a given scale of observa-tion. Moreover, this evaluation is rather subjective, since the resultscan vary from an observer to another. More recently, quantitativeinvestigations have been proposed using image analysis softwareto evaluate the “crack density” (Andersons and Leterrier, 2005;Bockmeyer and Löbmann, 2007; Jean et al., 1999; Lemoine et al.,1986; Maillot et al., 2005; Wu and Xu, 2002). These methods con-stitute a more precise tool to qualify the damage rate. Differentdefinitions (and unities) are proposed for the crack density, whichare not always clearly expressed. It can be stated that the crackdensity is a global parameter, which solely represents the severityof the crack network, independently of its morphology. The fractaldimension, measured by the “box-counting” method, is sometimesused to quantify the complex geometry of soil cracking patterns(Velde, 1999) or heterogeneous materials under compressive load-ing (Yan et al., 2002). This approach, which leads also to representthe irregularity of the crack pattern by a global coefficient, gener-ally requires different scales of observation of the same pattern, andis furthermore difficult to interpret. Some geometrical aspects, likethe fragment area (Andersons and Leterrier, 2005), the crack seg-ments length (Lemoine et al., 1986; Velde, 1999), or the orientationof the crack segments (Lemoine et al., 1986), have been in additionexamined in different works.
Some studies focus specifically with topological properties(Korneta et al., 1998; Shorlin et al., 2000), and the hierarchical struc-ture of the crack patterns (Bohn et al., 2005). These approaches,applicable to any cellular structure, provide interesting informationon the structural organization of a crack network. For exam-ple, the distribution of the number of sides or neighbors of the

Nomenclature
a system-constant in Aboav–Weaire’s lawA area of the heat-checking cellsAm average area of the heat-checking cellsAref reference area of the digital imageci individual cell of the cellular mosaicct cooling time of the thermal cycleC compactness factordb number of crack branches per unit areadc number of cells per unit areadn number of branching nodes per unit areaE elongation ratioFmin minimum Ferret diameterFmax maximum Ferret diameterht heating time of the thermal cyclej crack junctions classLc total cracks lengthm(n) average number of first neighbors of n-neighbored
cellsn number of first neighbors of a heat-checking cell⟨n⟩ average number of first neighbors of the cellsnsd variance of the number of first neighbors of the cellsN number of cyclesNc number of heat-checking cellsNb number of crack branchesNi number of cycles necessary for heat-checking initi-
ationNn number of nodesNsat number of cycles necessary to achieve !satP Crofton perimeter of the heat-checking cellsP(A) frequency distribution of the area of the heat-
checking cellsP(j) frequency distribution of the crack junction classesP(n) frequency distribution of the number of first neigh-
bors of the cellsP(ˇ) frequency distribution of angles between the radi-
ating branches from a nodeP(") frequency distribution of the crack branch orienta-
tionsRa arithmetic mean roughnesst timeT temperatureTmin minimum temperature of the thermal cycleTmax maximum temperature of the thermal cycleˇ angle between the radiating branches from a crack
junction#2 variance of the frequency distribution P(n)!hc heat-checking density!sat saturated heat-checking density" orientation of crack branches
polygonal fragments or crack junction angles can help to under-stand the formation mechanism of the crack network, as long asthe experimental observations are carried out appropriately. Vogelet al. (2005) exploit Minkowski functions to investigate the geom-etry of the crack patterns formed during the desiccation of claysoils. Based on mathematical morphology tools and especially thedistance function, this generic method allows to describe the mor-phological and topological features of any kind of crack pattern,even not fully-connected ones. But it requires that the area ofthe crack can be precisely evaluated, and therefore, images with asufficiently high magnification or resolution are necessary. A com-plex method, based on automatic edge detection and recognition
algorithms, is proposed by Lauschmann et al. (2001) to analyzethe fractography of crack networks in thin layers. It consists indetecting and classifying the crack elements in finishing, crossing orpassing branches in knots of the network. This method can be usedto model the formation of a crack pattern in relation with fracturemechanics.
The present paper deals with a semi-automatic analysis ofthe superficial crack pattern from SEM micrographs, using imageprocessing and mathematical morphology tools. This method isapplied to characterize the microscopic heat-checking patterns,appearing generally on tool steels under thermal fatigue tests.The oxidation and cracking mechanisms are described. The heat-checking density is measured and some quantitative features aredetermined on the crack branches (length, orientation), the branch-ing points (density, class junctions, angles) and the cells (size,shape, number of first neighbors). A complete description of thegeometrical and topological features of the heat-checking patternis reported for a unique test condition.
2. Thermal fatigue experiments
2.1. Test specimens
Thermal fatigue tests are performed on X38CrMoV5 (AISI H11)tool steel (see Table 1), quenched and double tempered to achievea tempered martensitic structure with 47 HRC hardness (Jean et al.,1999; Medjedoub, 2004). Specimens are of hollow cylindrical shapewith a central part of 40 mm length, a 30 mm external diameter, andan internal axial hole of 10 mm diameter, for circulation of coolingwater (Fig. 1a). The specimens have a wall thickness of 10 mm in thecentral gauge area. The external surface is mechanically polishedto reach an arithmetic mean roughness (Ra) of 0.02 !m.
2.2. Thermal fatigue rig
The thermal fatigue rig uses the induction heating of specimensby a CELES-25 kW high frequency generator (100–400 kHz). Theinduction frequency is about 115 kHz, resulting in a very fast heat-ing of the specimen. During the test, continuous cooling is ensuredby cold water circulating through the internal hole with a flow rateof 20 l/min. The external surface is air-cooled by natural convec-tion. The temperature of the specimen is measured by a K-typethermocouple spot welded to the specimen surface (Fig. 1b).
2.3. Test conditions
Different thermal cycles, with a maximum temperature (Tmax)ranking from 600 to 685 ◦C and a heating time (ht) ranging from 1.0to 1.6 s, are applied (Fig. 2). For all the experiments, the cooling time(ct) is adjusted to achieve a minimum temperature (Tmin) of 100 ◦Con the specimen surface (Table 2). In order to investigate the surfaceheat-checking and cracking evolution, the thermal fatigue experi-ments were regularly interrupted at different intervals: every 500or 1000 cycles until 3000 cycles, then every 2000 or 2500 cycles upto 15,000 cycles, and every 10,000 cycles right up to the end of thetest (Medjedoub et al., 2005).
3. Crack pattern analysis procedure
3.1. SEM image acquisition
The heat-checking surface morphology is observed using a scan-ning electron microscope (SEM) with a back-scattering electronsdetector. A magnification of 250 times, sufficient to distinguishthe micro-cracks, is selected. A cartography of a randomly selected

Table 1Chemical composition of X38CrMoV5 (AISI H11) steel.
Element C Cr Mo V Si Mn S P Fe
Weight% 0.396 5.05 1.25 0.47 0.94 0.36 <0.003 0.009 bal.
Fig. 1. Thermal fatigue specimen (a) and rig (b).
area of 0.825 mm2, chosen in the central region of the specimenwhere the temperature is uniformly distributed (“gauge area”),is systematically reconstructed by assembling a matrix of (3 × 3)image-fields (Fig. 3). To facilitate this reconstruction, an overlap-ping region representing approximately 15% of the image field istaken between two adjacent images. The resulting cartography issaved in the “Tiff” format, and transferred on the image analysisunit. The size of this digital image is about (1740 × 1210) pixels2,leading to a resolution of 0.5 !m/pixel. This mapping technique isoptimized to provide detailed information on a large representativearea, with a sufficiently precise resolution to detect the micro-cracks.
3.2. Image processing
The image analysis software Aphelion [ADCIS] is used to assessand evaluate the heat-checking density and morphology on the car-tographies. Two algorithms are employed depending on the imagecontrast.
When the contrast between the micro-cracks and non-crackedoxide layer is sufficiently high (as in Fig. 4a), the cartography anal-ysis is performed automatically. The treatment consists of severalsteps including pre-processing techniques, Boolean operations andmathematical morphology transformations (Coster and Chermant,1989; Russ, 1995; Serra, 1982):
1. Median filtering using a (3 × 3) pixels2 mask, to reduce the noisein the initial gray-scale image (Fig. 4b).
2. Contrast enhancement of “b” by the “top-hat” transformationusing a (5 × 5) pixels2 structuring element, followed by a lin-ear expansion of the gray scale range (Fig. 4c). This allows toextract thin black lines (representing the cracks) placed on anheterogeneous background (oxide surface).
Table 2Thermal cycles used in the thermal fatigue experiments (the test with Tmax = 650 ◦Cis considered as the reference test).
Minimumtemperature,Tmin (◦C)
Maximumtemperature,Tmax (◦C)
Heating time,ht (s)
Coolingtime, ct (s)
100600 1.0 15.0650 1.2 17.0685 1.6 22.0
3. Gray double thresholding of image “c” followed by a regiongrowing routine, to extract the darkened micro-cracks (Fig. 4d).The obtained binary cracks network may contain some discon-tinuities resulting from an incomplete thresholding of the finestcracks.
4. Complementation of the thresholded image “d” in order to splitthe resulting heat-checking cells, using a “watershed segmenta-tion” which reconstructs most of the cells boundaries (Fig. 4e).This operation suppresses the small discontinuities in the cracksnetwork.
5. Thickening of the binary image “e” using a “skeleton by zoneof influence”, followed by a complementation of the resultingimage (Fig. 4f).
This algorithm leads to a skeletonized representation (reducedto a single pixel in width) of the fully inter-connected cracks net-work prior to quantification analysis.
When micro-cracks are not sufficiently opened (specially at thebeginning of the heat-checking process), the contrast is often nothigh enough to allow an automatic detection of the heat-checkingpattern (Fig. 5a). In this case, the cartography is carefully drawnon a transparent paper and digitized using a scanner at 256 graylevels and 150 dpi. The resulting gray scale images have a lowerresolution (estimated at 1 !m/pixel) than original SEM, due to thewidth of the manual line tracing. Although this acquisition step is
50
150
250
350
450
550
650
750
0 5 10 15 20 25 30
T (°
C)
t (s)
TF cycle100-600 °C100-650 °C100-685 °C
Fig. 2. Temperature-time profiles measured in the central area of the specimen forthe (100 ◦C – Tmax) thermal fatigue tests (Tmax = 600, 650 and 685 ◦C).
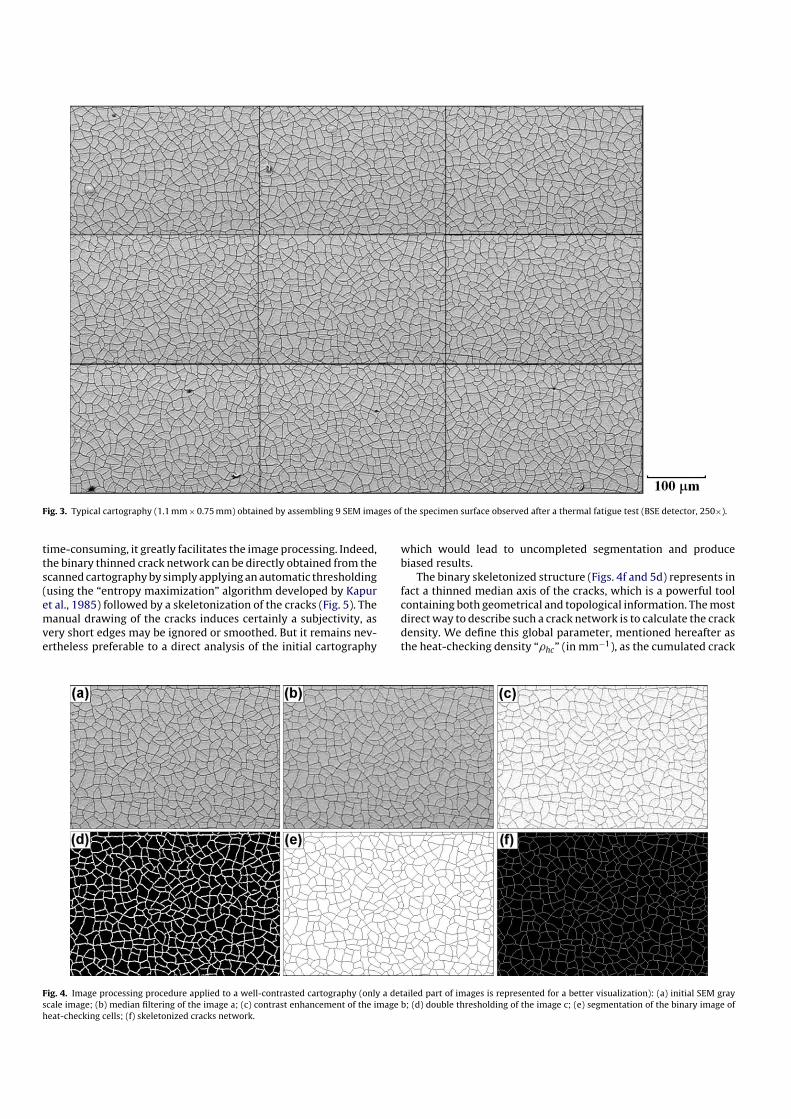
Fig. 3. Typical cartography (1.1 mm × 0.75 mm) obtained by assembling 9 SEM images of the specimen surface observed after a thermal fatigue test (BSE detector, 250×).
time-consuming, it greatly facilitates the image processing. Indeed,the binary thinned crack network can be directly obtained from thescanned cartography by simply applying an automatic thresholding(using the “entropy maximization” algorithm developed by Kapuret al., 1985) followed by a skeletonization of the cracks (Fig. 5). Themanual drawing of the cracks induces certainly a subjectivity, asvery short edges may be ignored or smoothed. But it remains nev-ertheless preferable to a direct analysis of the initial cartography
which would lead to uncompleted segmentation and producebiased results.
The binary skeletonized structure (Figs. 4f and 5d) represents infact a thinned median axis of the cracks, which is a powerful toolcontaining both geometrical and topological information. The mostdirect way to describe such a crack network is to calculate the crackdensity. We define this global parameter, mentioned hereafter asthe heat-checking density “!hc” (in mm−1), as the cumulated crack
Fig. 4. Image processing procedure applied to a well-contrasted cartography (only a detailed part of images is represented for a better visualization): (a) initial SEM grayscale image; (b) median filtering of the image a; (c) contrast enhancement of the image b; (d) double thresholding of the image c; (e) segmentation of the binary image ofheat-checking cells; (f) skeletonized cracks network.

Fig. 5. Image processing procedure applied to a depicted cartography (only a detailed part of images is represented for a better visualization): (a) initial SEM gray scaleimage; (b) depicted cartography; (c) automatic thresholding of image b; (d) skeletonization of image c.
length “Lc” (in mm) divided by the area of the reference surface“Aref” (in mm2):
!hc(X) = Lc(X)Aref
(1)
3.3. Geometrical parameters
The heat-checking network can be regarded as a planar mosaicconstituted of quasi-convex polygons (called “cells”). To charac-terize the morphology of these cells, it is necessary to invert thebinary image of the skeletonized crack network by the complemen-tation operation (Fig. 6a). The cells which are partially included inthe image field are removed (Fig. 6b), and the remaining cells arelabeled (Fig. 6c).
For each cell ci, the following calibrated geometrical parametersare calculated: area A(ci), Crofton perimeter P(ci), length (evaluatedby the minimum Ferret diameter Fmin(ci)), and width (evaluatedby the maximum Ferret diameter Fmax(ci)) (Coster and Chermant,1989; Wang, 2006). The shape of the cells is characterized by thecompactness, defined as:
C(ci) = 16.A(ci)
P(ci)2 (2)
and the elongation, defined as:
E(ci) = Fmax(ci) − Fmin(ci)Fmax(ci) + Fmin(ci)
(3)
both of which range between 0 and 1. The compactness value is 1 fora perfect square, and smaller for shapes with irregular boundaries.The elongation equals to 0 in the case of a circle or a square, andapproaches 1 for an ellipse that is long and narrow.
All these data are calculated on the entire field, and used toobtain frequency distributions describing the cells geometry andstatistical parameters (such as the average size and the standard
deviation). Because the heat-checking cartographies are taken ona large area, the number of cells included inside the images isvery high (between 500 and 4000 cells depending on the testconditions). The classical corrections generally required for pla-nar sampling, like the Miles–Lantuéjoul statistical method used tocompensate the edge effects (Lantuéjoul, 1978), are therefore notneeded.
On the skeletonized crack network, the pixels having at leastthree neighboring pixels are considered as cracks junctions orcrack intersections (called “branching points” or “nodes”). Thesenodes delimit the cell sides called “crack branches”. To analyzethe morphological characteristics of crack branches, one needfirst to remove the nodes from the skeletonized crack network(Fig. 7a–c). This results in individualization of the crack branches.The crack branches intersecting the field border are eliminated andthe remaining ones labeled.
The length and the orientation of the crack branches are mea-sured respectively by the maximum Ferret diameter (Fmax) and itscorresponding angle " (Wang, 2006). The possible range between0◦ and 180◦ for the cracks orientation is divided into 36 classeshaving a width of 5◦. The cumulated crack length is calculated asthe centered sum of all branches having an orientation in the rangeof ±2.5◦ around the prescribed direction, and the normalized fre-quency distribution of cracks orientation P(") is presented as polargraphs (called “rose plot”).
The crack junction orientations are determined by the follow-ing procedure. The nodes of the crack network are extracted oneby one on the labeled image of the branching points (Fig. 7d),and dilated twice using a square structuring element (Fig. 7e). Theintersection between the dilated nodes and the crack branches ofFig. 7c provides markers in the branches radiating from the con-sidered node. A geodesic dilatation (also called “reconstruction”)from these markers reconstitutes the complete radiating branches(Fig. 7f), of whom the orientations are measured using the maxi-mum Ferret angle (defined above) with a precision of 1◦. The angle

Fig. 6. Individual analysis of the heat-checking cells: (a) binary image of cells (complementary image of Fig. 4f or Fig. 5d); (b) elimination of all the cells interrupted by theimage border; (c) individualization of the cells by the labeling procedure.
(ˇ) between each radiating branch is then calculated, and the fre-quency distribution of the cracks junction orientation is achievedconsidering 18 classes having a width of 10◦.
The previous procedure allows also to classify the crack junc-tions with respect to the number of radiating branches, simplyby counting the individualized branches in Fig. 7f. For the sakeof simplicity, we call “class 3 junction” a node connected tothree crack branches, “class 4 junction” a node connected to fourcrack branches, “class 5 junction” a node connected to five crackbranches, etc.
3.4. Topological parameters
Topological parameters are features which remain invariantwhen the analyzed object is modified by a geometric transforma-tion (like stretching or distortion). From a topological point of view,the crack network can be characterized by the number of crackbranches (Nb), the number of nodes (Nn) whereas the cellular struc-ture (i.e., the inverted crack network), by the number of cells (Nc).The density of crack branches (db), nodes (dn) and cells (dc) arethen expressed in mm−2, as the ratio of the number of each feature
(corrected to take into account the edge effects) to the referencesurface Aref.
Another interesting topological feature of the cellular structureis the number of first neighbors n of each cell, and specially theaverage value ⟨n⟩ and the frequency distribution P(n). Two cells areconsidered neighbors if they share at least one side. According tothe Lantuéjoul’s procedure (Lantuéjoul, 1978), the determinationof n requires four steps. First, the individualized cells are extractedone by one from the cellular mosaic (Fig. 8a). Then, the selectedcell is dilated twice using a square structuring element (Fig. 8b).The intersection between the dilated cell and the mosaic struc-ture provides markers both in the analyzed cell and in the firstneighboring cells, which are reconstituted by a geodesic recon-struction (Fig. 8c). It is straightforward to remove the central celland count then the number of remaining cells constituting the firstneighbors (Fig. 8d). This algorithm is applied to all the cells of thenetwork, and leads to a label image in which the cells are clas-sified according to their number of first neighbors (Fig. 8e). Then-neighbored cells can be selected by a simple thresholding of thelabel image, and the average number of neighbors of order 2 (i.e.,the average number m(n) of neighbors of the cells that are adjacent
Fig. 7. Detection of the nodes and crack branches (only a detailed part of images is represented for a better visualization): (a) skeletonized crack network; (b) detectionof branching points (in gray) on the skeletonized structure; (c) crack branches resulting from the removing of branching points on the crack network; (d) selection of onenode; (e) selected node dilated twice; (f) reconstructed radiating crack branches from the selected node; (g) determination of ˇ angles between radiating branches from theselected node.

Fig. 8. Procedure to determine the number of first neighbors of the heat-checking cells: (a) selection of one cell in the cellular mosaic; (b) dilatation of the selected cell; (c)neighboring cells reconstruction; (d) labeling and counting of the first neighbors; (e) image of the cellular mosaic in which the cells are classified with a gray level related totheir number of first neighbors.
to n-neighbored cells) can be determined by applying again theLantuéjoul’s procedure (Fortes and Pina, 1993). These topologicalnumbers are then used in some semi-empirical laws describingthe correlation between neighboring cells in planar cellular struc-tures.
According to the classic Aboav–Weaire’s law, the average num-ber of neighbors of cells surrounding an n-neighbored cell m(n) islinearly proportional to 1/n (Korneta et al., 1998; Zsoldos and Szasz,1999), which is usually expressed by the equation:
n · m(n) = (⟨n⟩ − a)n + (⟨n⟩ · a + #2) (4)
where “⟨n⟩” is the average number of first neighbors of cells, “a” is asystem-constant, and “#2” is the variance of P(n). This relationshipindicates that many-neighbored cells tend to have few-neighboredneighbors, and vice versa (Fortes and Pina, 1993; Korneta et al.,1998). In Eq. (4), “a” is related to the slope of the regression line,ranging for most of cellular structures between 0.5 and 1.5. “#2”characterizes the rate of disordering in the cellular structure: themore it increases, the more the cells are randomly distributed.Different values are reported for “#2”: 0.6–1.1 in biological cells,0.24–2.86 in soap foam, 1.72 in arsenic-selenium glass, 1.07 in corkpatterns, 2.75 ± 0.07 in crack patterns produced by thermal shockin ceramics, etc. (Zsoldos and Szasz, 1999).
4. Results and discussion
4.1. Thermal fatigue cracking mechanism
Detailed SEM observations have revealed that the heat-checkingpattern is composed of thin interconnected cracks of differentlengths and orientations, due to the oxide-scale cracking under
the thermal stresses (Figs. 3 and 9). This is due to cyclic transi-tion thermal gradients, induced by repeated heating and coolingof the surface. The morphology of oxide layer changes with thetesting conditions, specially the maximum temperature Tmax of thethermal cycle (Medjedoub, 2004). For Tmax up to 600 ◦C, the oxidelayer is made of juxtaposed spangles, and when Tmax increasesbeyond 650 ◦C, the structure of the oxide layer become alveolarand more adherent (Fig. 9). Post-mortem observations of specimencross-sections revealed the formation of a duplex oxide-scale: asuperficial layer rich in iron oxide (constituted mainly of hematiteoxide Fe2O3), and an internal compact layer rich in Cr2O3. Thesetwo layers present quasi-identical thicknesses (Fig. 10a). As can beseen in Fig. 10b, the micro-cracks occur in the outer-layer of theoxide scale and often stop at the interface between the two layers.As the external oxide layer is more porous, one can suppose thatthe micro-cracks originate on structural defects like porosities. Itleads to a homogeneous crack pattern on the oxide surface (Fig. 3),which conforms to the heat-checking density statistical analysis(see hereafter).
Unfortunately, the crack width, which in fact represents thecrack lips opening, is not large enough to be precisely quantifiedconsidering the cartography resolution. However, SEM observa-tions seem to show that the crack width tends to grow whilecycling, specially at the first stages of the heat-checking cell for-mation (Fig. 11a). In comparison to our case, the crack opening ismuch easier to observe in desiccated soils (Vogel et al., 2005).
4.2. Initiation and evolution of the heat-checking density
A typical evolution of heat-checking pattern and density asa function of the number of cycles is shown in Fig. 11, for the
Fig. 9. SEM micrographs of the superficial oxide layer, showing various morphologies depending on the maximal temperature of the thermal fatigue test: Tmax = 600 ◦C (a);Tmax = 650 ◦C (b); Tmax = 685 ◦C (c).

Fig. 10. SEM cross-section observations of the specimen after the reference test (100–650 ◦C cycle), showing the oxide layer structure (a), and micro-cracks in the oxideouter-layer (b).
Fig. 11. Evolution of the heat-checking during the reference thermal fatigue test (100–650 ◦C cycle): heat-checking aspect on SEM micrographs (a) and cartographies (b) at1500, 5000 and 15,000 cycles; (c) evolution of the heat-checking density !hc versus number of cycles; (d) method to estimate the number of cycles (Ni) for heat-checkinginitiation.

0
0.2
0.4
0.6
0.8
1(a) (b)
0 200 400 600 800 1000 1200
P(A)
Area (µ m²)
1500 cycles5000 cycles10000 cycles20000 cycles
0.3
0.4
0.5
0.6
0.7
0 5000 10000 15000 20000
Mea
n sha
pe fa
ctor
Number of cycles
ElongationCompactness
Fig. 12. Evolution of the size and morphology of the heat-checking cells with the number cycles N: (a) cumulative frequency distribution of the area P(A); (b) mean shapefactors versus N.
0%1%2%3%4%5%
0°10°
20°30°
40°
50°60°
70°80°
90°100 °
110 °120 °
130 °
140 °150 °
160 °170 °
0%1%2%3%4%5%
0°10°
20°30°
40°
50°60°
70°80°
90°100 °
110 °120 °
130 °
140 °150 °
160 °170 °
0%1%2%3%4%5%
0°10°
20°30°
40°
50°60°
70°80°
90°100 °
110 °120 °
130 °
140 °150 °
160 °170 °
cumulated crack length
(a) (b) (c)
Fig. 13. Frequency distributions of crack branch orientations P(") (normalized crack length versus "): N = 1000 cycles (a); N = 5000 cycles (b); N = 20,000 cycles (c).
reference thermal fatigue test (100–650 ◦C). It is observed that thereis an incubation period where no crack is detected (it must beremembered that the detection limit does not allow to detect thecrack with opening less than 0.5 !m). Then, micro-cracks initiate,propagate and coalesce rapidly to form a network of interconnectedcracks (Fig. 11a and b). Fig. 11c shows a sigmoidal trend for theevolution of the heat-checking density !hc versus number of ther-mal cycles. As soon as heat-checking formation process is initiated,!hc raises abruptly to reach a maximum value, prior to stabilizingto a asymptotic limit (named !sat) beyond 5000 cycles. This limitremains quasi-constant (or saturated) for further thermal fatiguecycles. The number of cycles necessary to achieve !sat is namedNsat (Fig. 11c). The slight decrease of !hc following the peak valueis explained by an oxide healing of some very shallow cracks. To
assess the homogeneity of the heat-checking in the gauge areaof the specimen, five cartographies were taken in different zonesat the end of two thermal fatigue tests (Tmax = 600 and 650 ◦C).A standard deviation ($) of about 3.5 was obtained for a !hc of135 mm−1. The small variation of !hc values in the saturated stage(Fig. 11c) is of the same order of magnitude as $ (2.4–4.4, depend-ing on the testing conditions), proving a well stabilized unmodifiedheat-checking pattern. Furthermore, we take for our careful obser-vations that indeed the crack network remains quasi the same once!sat has been reached. At the most, some cracks tend to open more,but follow the initial path.
According to the definition of Glenny (1967), the number ofcycles for the heat-checking initiation (Ni) is the arithmetic valuebetween the number of cycle when the heat-checking is first
0
0.2
0.4
0.6
0.8
1(a) (b)
3 4 5
P(j)
Crack junction class (j)
1 000 cycles5 000 cycles10 000 cycles20 000 cycles
0%
5%
10%
15%0
10°20°
30°
40°
50°
60°
70°80°
90°100°
110°
120°
130°
140°
150°
160°170°
1 000 cycles 5 000 cycles 10 000 cycles 20 000 cycles
Fig. 14. Frequency distributions of the crack junction classes P(j) (a), and angles P(ˇ) (b).

Fig. 15. Frequency distributions P(n) of the number of first neighbors n of the heat-checking cells (a), and corresponding classified cellular mosaic images (b), for increasingnumber of cycles N (1000, 5000 and 20,000 cycles).
detected and the last previous thermal fatigue test interruptioncycle, respectively named N2 and N1 (Fig. 11d). Because of the dras-tic sigmoidal evolution of the heat-checking density, the accuracyof the Ni value depends principally on the thermal fatigue interrup-tion intervals and on crack detection limit. As in major experiments,tests were interrupted after every 500 cycles prior to heat-checkingcells formation, we achieve a relatively fine estimation of Ni.
4.3. Morphological and topological features of the heat-checkingnetwork
The evolution of the morphological and topological character-istics of the heat-checking cells resulting from the oxide-scalecracking have been investigated during the cycling, for thereference thermal fatigue test (100–650 ◦C). The size and themorphology of the heat-checking cells become more regular andhomogeneous with increasing number of cycles (Fig. 12a). The cellcompactness and elongation reach stabilized mean values (respec-tively 0.6 and 0.4), characterizing polygonal cells with irregularboundaries (Fig. 12 b).
Fig. 13, which presents the rose plot of the individualized crackbranches orientation, indicates that the micro-cracks develop in alldirections. A preferential cracking along 0◦ and 90◦, correspondingto the maximal thermal stresses and strains solicitation directions,is however observed. The heat-checking network remains quasi-isotropic along with the number of cycles. It can be noted that thisisotropic trend is enhanced with increasing the number of cycles.Indeed, at the beginning of the fragmentation process (i.e., for lownumber of cycles), crack branches oriented along 0◦ and 90◦ are lesspredominant (Fig. 13a). When the heat-checking is stable, we canclearly observe four symmetry axes on the rose plot along 0◦, 45◦,45◦, 90◦ and 135◦ directions (Fig. 13c).
All along the fragmentation process, the crack junctions are pre-dominantly trivalent in the heat-checking network (Fig. 14a). Thesame phenomenon was noted by Korneta et al. (1998) on quenchedceramics. Bohn et al. (2005) have observed that triplets of cracksare generally formed on a surface defect. Frequency distributionsof crack junction angles show that they range mostly between 100◦
and 150◦, with a peak at 120◦ appearing when the network reachesthe stabilized regime (Fig. 14b). This angle corresponds, in fact, to“Y-shaped” junctions, related to an hexagonal type crack network.One can also note that 90◦ and 180◦ angles are weakly represented,and so-called “T-shaped” junctions are less present. A “T-shaped”junction is generally formed when a pre-existing cell is divided intwo. Observing similar frequency distributions (with a strong peakaround 120◦) in desiccated clay soils, Vogel et al. (2005) concludedthat the cells remains stable after their early formation. Shorlin et al.(2000) have reported that in drying layers, 120◦ junction anglesare formed in the early stage of the crack pattern development,whereas 90◦ ones correspond to later crack propagation (due tothe local stress field around cracks). The fact that “Y-shaped” junc-tions are predominantly observed on the oxide layer of the steelinvestigated here proves again that the heat-checking network isalso very rapidly stabilized following its initiation.
From the initiation of the heat-checking network to its stabiliza-tion, the cells mosaic are constituted of a majority of cells with 5, 6or 7 first neighbors (Fig. 15). The average number of first neighborsof cells ⟨n⟩ is very closed to 6, which is the ergodic theoretical valueexpressed by Euler’s theorem (Bohn et al., 2005; Lantuéjoul, 1978).The frequency distributions P(n) follow a quasi-normal law, exceptwhen the heat-checking network is not saturated (i.e., for low num-ber of cycles). We can also note that P(n = 6) > P(n = 5) > P(n = 7) isverified whatever the number of cycles. The same characteristicshave been observed in quenched ceramics (Korneta et al., 1998),whereas crack networks formed in a drying layer are mostly foursided (Shorlin et al., 2000).
Fig. 16a demonstrates the applicability of the Aboav–Weaire’scorrelation (4) for the heat-checking patterns obtained with the ref-erence thermal fatigue test (100–650 ◦C). Whatever the number ofcycles considered, we find a near perfect agreement to this law, withcorrelation coefficients better than 0.99. The calculated param-eters in the stabilized regime (a = 1.11 ± 0.15, a/⟨n⟩ = 0.19 ± 0.04,#2 = 1.50 ± 0.23) correspond to the case of a trivalent polygonal sys-tem (Zsoldos and Szasz, 1999). The rather low #2 value indicatesthat the rate of disordering is lower than in crack patterns producedby thermal shock in ceramics, where #2 = 2.75 ± 0.07 (Korneta et al.,

(a)R 2 = 0.999
R 2 = 0.994
R 2 = 0.999
0
20
40
60
80
2 4 6 8 10 12 14Number of first neighbors n
nm(n
)
1000 cycles5000 cycles20000 cycles
(b)
1,0
1,5
2,0
2,5
3,0
3,5
0 5000 10000 15000 20000Number of cycles
µ 2
Fig. 16. Application of the Aboav–Weaire’s law to the heat-checking pattern at different number of cycles N: (a) linear correlation nm(n) versus n (m(n) is the average numberof neighbors of cells surrounding a n-neighbored cell); (b) evolution of #2 versus N.
(a)
R 2 = 0.967
R 2 = 0.993
R 2 = 0.997
0200400600800
10001200
2 4 6 8 10 12 14Number of first neighbors n
Am(n
) ( µm²
)
1000 cycles5000 cycles20000 cycles
(b)
20
40
60
80
100
120
0 5000 10000 15000 20000Number of cycles
dAm/
dn
Fig. 17. Application of the Lewis’ law to the heat-checking pattern at different number of cycles N: (a) linear relationship between the average area of the cells Am(n) andtheir number of first neighbors n; (b) evolution of (dAm/dn) versus N.
1998). The decreasing evolution of #2 versus the number of cyclesreveals also that the heat-checking tends to reach a more orderedstate in the stabilized regime (Fig. 16b).
Another topological correlation, known as the Lewis’ law, statesthe fact that the average area of the cells (Am) increases linearlywith their number of first neighbors n (Zsoldos and Szasz, 1999).The heat-checking network follows perfectly this law, specially inthe saturated regime (Fig. 17a). The slope of the linear variationdecreases to a pseudo-saturation (Fig. 17b), and the correlationcoefficient, always higher than 0.96, increases slightly with thenumber of cycles (Fig. 17a). One can note in Figs. 16a and 17a thatwhen n > 10, the scattering increases, due to a lower number of cellsfor this population.
This investigation of the topological properties of the heat-checking pattern indicates that the stabilized cellular mosaic isa near hexagonal structure. This kind of organization character-izes many random tessellations observed in natural phenomena,for example crack patterns in ceramics (Korneta et al., 1998), soapfoams, cooling-induced patterns in lava flows, shrinkage crack pat-terns in mud, etc. (Zsoldos and Szasz, 1999).
5. Conclusions
Heat-checking of hot work tool steel (X38CrMoV5) has beeninvestigated under thermal fatigue experiments. The specimen sur-face is subjected to cyclic induction heating and natural cooling,under various test conditions. The thermal fatigue cycle is period-ically interrupted, and the surface of the specimen is examined byscanning electron microscopy. Detailed observations have revealedthat a multi-directional connected crack network is mainly formed
on a bi-layer oxide scales. The heat-checking formation and evo-lution has been investigated by image analysis. Automated orsemi-automated procedures have been developed, depending uponthe quality of the SEM images, in order to describe the morpho-logical and topological features of the microscopic heat-checkingnetwork.
The heat-checking density follows a sigmoidal evolution, rapidlyreaching an asymptotic value indicating the crack pattern satu-ration. The heat-checking cells size and shape homogenizes withincreasing the number of cycles. The saturated crack pattern isquasi-isotropic, with two dominant orientations corresponding tothe maximal thermo-mechanical loading directions. Most of thecrack junctions are trivalent, “Y-shaped”, with an angle distributioncentered around 120◦. This cellular pattern is closed to a triva-lent polygonal structure. According to the Euler’s law, the averagenumber of neighbors for the cells tends to be 6. An investiga-tion of the correlations between neighboring cells shows that bothAboav–Weaire’s and Lewis’ laws are applicable for heat-checkingpatterns, even in the non-saturated regime. All the characteristicsof the microscopic heat-checking pattern (aspect, density, morpho-logical and topological parameters) tend to stabilize after a criticalnumber of thermal cycles.
The method develop here could be adapted to quantify themorphology of any kind of interconnected crack network, at anyscale of magnification. For example, the crack patterns appearingin the glaze of ceramics (Bohn et al., 2005), in thin films preparedby sol–gel process (Bockmeyer and Löbmann, 2007), and in oxidecoatings on polymer substrate under biaxial tension (Andersonsand Leterrier, 2005) present a quite similar aspect and developmentto those observed on our specimens.

Acknowledgments
The authors would like to thank the CTIF (Centre Technique desIndustries de Fonderie), in particular Dr. P. Hairy, for supporting apart of this activity. The French National Program on Forging (ACRIIand Simulforge) and CETIM are also acknowledged for the financialsupport.
References
Andersons, J., Leterrier, Y., 2005. Advanced fragmentation stage of oxide coating onpolymer substrate under biaxial tension. Thin Solid Films 471, 209–217.
Bockmeyer, M., Löbmann, P., 2007. Crack formation in TiO2 films prepared bysol–gel processing: quantification and characterization. Thin Solid Films 515,5212–5219.
Bohn, S., Pauchard, L., Couder, Y., 2005. Hierarchical crack pattern as formed bysuccessive domain divisions. I: temporal and geometrical hierarchy. PhysicalReview E 71, 123–139.
Coster, M., Chermant, J.L., 1989. Précis d’analyse d’images. Presses du CNRS, Paris.Fortes, M.A., Pina, P., 1993. Average topological properties of successive
neighbours of cells in random networks. Philosophical Magazine B 67,263–276.
Glenny, E., 1967. Thermal and High-strain Fatigue. The Institute of Metals and theIron and Steel Institute, London.
Jean, S., Miquel, B., Le Roux, S., Rézaï-Aria, F., 1999. An investigation on heat check-ing of hot work tool steels. In: Proceedings of the 5th International Conferenceon Tooling, Tool Steels of the Next Century, University of Leoben, Austria,September 29–October 1, pp. 185–193.
Kapur, J.N., Sahoo, P.K., Wong, A.K.C., 1985. A new method for gray-level picturethresholding using the entropy of the histogram. Computer Vision Graphics andImage Processing 29, 273–285.
Korneta, W., Mendiratta, S.K., Monteiro, J., 1998. Topological and geometrical prop-erties of crack patterns produced by thermal shock in ceramics. Physical ReviewE 57 (3), 3142–3152.
Lantuéjoul, C., 1978. Grain dependence test in a polycrystalline ceramic. PraktischeMetallographie 8, 40–50.
Lauschmann, H., Wetzig, K., Menzel, S., Göbel, T., 2001. Fractography of cracknetworks in thin layers. Materials Characterization 46, 105–111.
Lemoine, P., Marini, B., Meny, L., 1986. Etude de la fatigue thermique superfi-cielle d’un acier inoxydable austénitique. In: Journées de Printemps de la SF2M,Fatigue à Haute Température, Paris, pp. 331–344.
Maillot, V., Fissolo, A., Degallaix, G., Degallaix, S., 2005. Thermal fatigue cracknetworks parameters and stability: an experimental study. International Journalof Solids and Structures 42, 759–769.
Medjedoub, F., 2004. Ph.D. Thesis, Ecole des Mines de Paris, Paris, France.Medjedoub, F., Dour, G., Rezaï-Aria, F., Hairy, P., 2005. Endommagement par
faïencage des moules de fonderie sous pression en fatigue thermique: origines,mécanismes et approches. Fonderie Fondeur d’Aujourd’hui 244, 22–37.
Norström, L.A., Svensson, M., Öhrberg, N., 1981. Thermal fatigue behaviour of hotwork tool steels. Metals Technology 10, 376–381.
Persson, A., Hogmark, S., Bergström, J., 2004. Simulation and evaluation of ther-mal fatigue cracking of hot work tool steels. International Journal of Fatigue 26,1095–1107.
Russ, J.C., 1995. The Image Processing Handbook, 2nd ed. CRC Press, Boca Raton.Serra, J., 1982. Image Analysis and Mathematical Morphology. Academic Press, Lon-
don.Shorlin, K.A., de Bruyn, J.R., Graham, M., Morris, S.W., 2000. Development and geom-
etry of isotropic and directional shrinkage-crack patterns. Physical Review E 61,6950–6957.
Velde, B., 1999. Structure of surface cracks in soils and muds. Geoderma 93,101–124.
Vogel, H.J., Hoffmann, H., Roth, K., 2005. Studies of crack dynamics in clay soil. I:experimental methods, results, and morphological quantification. Geoderma125, 203–211.
Wang, W., 2006. Image analysis of particles by modified Ferret method—best-fitrectangle. Powder Technology 165, 1–10.
Wu, X., Xu, L., 2002. Computer aided evaluation of thermal fatigue cracks on hot-work tool steel. In: Proceedings of the 6th International Tooling Conference,The Use of Tool Steels: Experience and Research, Karlstadt University, Sweden,September 10–13, pp. 657–666.
Yan, A., Wu, K., Zhang, X., 2002. A quantitative study on the surface crack patternof concrete with high content of steel fiber. Cement and Concrete Research 32,1371–1375.
Zsoldos, I., Szasz, A., 1999. Appearance of collectivity in two-dimensional cellularstructures. Computation Materials Science 15, 441–448.