image fusion for improved detection of near-surface defects in ndt-ce using unsupervised clustering...
TRANSCRIPT

J Nondestruct EvalDOI 10.1007/s10921-014-0232-1
Image Fusion for Improved Detection of Near-Surface Defects inNDT-CE Using Unsupervised Clustering Methods
Patricia Cotic · Zvonko Jaglicic · Ernst Niederleithinger ·Markus Stoppel · Vlatko Bosiljkov
Received: 28 August 2013 / Accepted: 24 January 2014© Springer Science+Business Media New York 2014
Abstract The capabilities of non-destructive testing (NDT)methods for defect detection in civil engineering are charac-terized by their different penetration depth, resolution andsensitivity to material properties. Therefore, in many casesmulti-sensor NDT has to be performed, producing large datasets that require an efficient data evaluation framework. Inthis work an image fusion methodology is proposed based onunsupervised clustering methods. Their performance is eval-uated on ground penetrating radar and infrared thermographydata from laboratory concrete specimens with different sim-ulated near-surface defects. It is shown that clustering couldeffectively partition the data for further feature level-baseddata fusion by improving the detectability of defects simulat-ing delamination, voids and localized water. A comparisonwith supervised symbol level fusion shows that clustering-based fusion outperforms this, especially in situations withvery limited knowledge about the material properties anddepths of the defects. Additionally, clustering is successfullyapplied in a case study where a multi-sensor NDT data setwas automatically collected by a self-navigating mobile robotsystem.
Keywords Non-destructive testing · Concrete · Defectdetection · Data fusion · Cluster analysis
P. Cotic (B) · Z. JaglicicInstitute of Mathematics, Physics and Mechanics, Jadranska 19,1000 Ljubljana, Sloveniae-mail: [email protected]
P. Cotic · Z. Jaglicic · V. BosiljkovFaculty of Civil and Geodetic Engineering, University of Ljubljana,Jamova 2, 1000 Ljubljana, Slovenia
P. Cotic · E. Niederleithinger · M. StoppelBAM Federal Institute for Materials Research and Testing,Division VIII.2, Unter den Eichen 87, 12205 Berlin, Germany
1 Introduction
In civil engineering (CE), several non-destructive testing(NDT) methods such as ground penetrating radar (GPR),ultrasonic, impact echo and infrared (IR) thermography areused to image the internal structure and to detect defects suchas delamination, spalling, surface and subsurface cracks,reinforcement corrosion, the presence of small air voids,and moisture distribution [1–5]. However, these methods arecharacterized by different penetration depths, as well as dif-ferent sensitivity to the physical properties of the material[6–9]. Therefore, in order to fully characterize the objectsunder inspection and to increase the accuracy, several NDTtechniques should be applied simultaneously. Consequently,often a huge amount of data has to be processed and inter-preted efficiently. Currently data processing and interpreta-tion of the results are performed for each NDT techniqueindividually. This is both costly and time consuming anddoes not provide a reliable and straightforward evaluation ofthe structural condition. To overcome these constraints, datafusion techniques can be used.
To improve imaging results and defect characterization,image fusion has already been proposed for non-destructiveevaluation (NDE). Methods from Bayesian inference, theDempster–Shafer (D–S) theory of evidence, and waveletmulti-resolution analysis were used on eddy current and IRthermography images from composite and steel structures[10–13]. In NDT-CE applications, image fusion was per-formed on GPR data acquired at different frequencies andpolarizations, and on GPR and ultrasonic data on prestressedconcrete bridge beams and test specimens [8,14,15]. How-ever, the applied fusion techniques were restricted to simplearithmetical methods.
The present work deals with clustering-based imagefusion of NDT data acquired on concrete with defects in the
123

J Nondestruct Eval
near-surface region. For image fusion, clustering methodshave already been applied in medical imaging for patternrecognition (e.g. for the detection of cancerous cells frommagnetic resonance images [16] and mammograms [17]),as well as on spectroscopic spatial measurement results fromconcrete for cement identification [18]. Their main advantageis that they can work fully unsupervised. This is of partic-ular interest in implementing NDT in practice in terms ofautomated application by trained engineers and techniciansrather than scientists.
Data fusion should both improve the results where NDTmethods respond complementarily and put more weight uponthe method with better performance. Therefore, to assessthe effectiveness of mining data for the detection of near-surface defects in concrete structures, laboratory concretespecimens with simulated defects were studied by GPR andIR thermography, regarded as complementary methods in thenear-surface region. Defects in the form of variations in thematerial, shape and depth below the surface were taken intoaccount. Some preliminary results on data fusion from thisdata set have been presented in [19]. However, this paperdevelops a complete data fusion framework based on a quan-titative evaluation with respect to the sensitivity calculation.Based on the outcome of the fusion methodology derived forGPR and IR thermography data on concrete, we further applyclustering methods to a case study where a multi-sensor NDTdata set was automatically collected by a self-navigatingmobile robot system.
2 Image Fusion with Clustering
Image fusion is applied in many fields, including medicalimaging, microscopic imaging, remote sensing, computervision and robotics. It can be performed at different levels, i.e.at pixel, feature and symbol level. At pixel level, images arefused at each pixel individually without using pre-processingunits. Feature level fusion on the other hand tends to fuse fea-tures extracted by segmentation in the pre-processing stepusing clustering, neural networks (NN) and wavelet meth-ods, whereas symbol level fusion is in most cases based onsensor modelling [20]. Regardless of the level used, statisti-cal averaging, Bayesian, D–S, as well as fuzzy logic can beused for the fusion algorithm. One of the main restrictionsin using probabilistic methods for symbol level fusion is thecorrect assignment of the conditional and a priori probabil-ities as well as mass functions which govern the evaluation.Although many studies have proposed different approachesfor its calculation [12,21–23], none of the methods can workfully unsupervised. For feature level fusion on the other hand,wavelet analysis and NN require an appropriate wavelet fil-ter with definition of the decomposition level to be used andgood training data set, respectively [13]. In contrast, clus-tering methods require some sensitivity measures to be set,
which, however, do not affect the analysis significantly, butthey do not need a priori knowledge of the statistical data dis-tribution. This is especially promising in the field of NDT,where knowledge about sample composition is limited dueto the large diversity of specimens.
Clustering refers to the task of grouping a set of data(observations) into subsets (clusters, groups and classes) insuch a way that the members of a cluster are as similar aspossible, whereas members belonging to different clustersare as dissimilar as possible [24]. For objective-based clus-tering, starting with a random grouping of observations intoclusters, the observations are iteratively moved to the clusterwhose centre is the nearest to them until a convergence limitis reached. A common measure of similarity between twoobservations x1, x2 is the Euclidian distance d, which for Mvariables can be written as
d =(
M∑i=1
(x1i − x2i )2
)1/2
= ‖x1 − x2‖ . (1)
In partitioning an unlabelled data set X = {x1, x2, . . . , xN }into c clusters by iteratively assigning labels ui j to vectorsin X by the partition matrix Uc×N = [
ui j], the target is to
minimize an objective function J , which is the sum of the dis-tances of N observations to their respective cluster centre v:
Jm(U, V; X) =c∑
i=1
N∑j=1
umi j
∥∥x j − vi∥∥ 2
. (2)
With respect to the partition matrix, clustering algorithmscan be classified as hard (or crisp), fuzzy probabilistic orfuzzy possibilistic [24]. In contrast to hard clustering whereui j possess values of only 0 or 1(ui j ∈ {0, 1}), fuzzy prob-abilistic clustering is defined as soft partitioning, allowingobservations to belong to more than one cluster with a calcu-lated probability, i.e. ui j may possess any number between 0and 1 (ui j ∈ [0, 1]). This is especially promising in the caseof NDT data, where ui j could be regarded as the reliabilityof the NDT system. Moreover, since the hard k-means algo-rithm [25] was found to be particularly sensitive to initializa-tion [18], hard clustering was not considered in this paper.
The best known fuzzy probabilistic algorithm is the fuzzyc-means (FCM) algorithm [26]. Here ui j describes the mem-bership of observation x j in the i th cluster, which can beinterpreted as probability (hence “probabilistic clustering”).The “fuzzing” exponent or “fuzzifier” m, introduced in Eq.2, is a positive real number and is recommended to rangefrom 1.2 to 2 (in our calculation m was fixed to 2, the valuemost often recommended by other authors). To optimize J ,ui j and vi have to be updated in each iteration by
ui j = 1c∑
k=1(di j/dkj )2/(m−1)
, (3)
123

J Nondestruct Eval
vi =
N∑j=1
umi j · x j
N∑j=1
umi j
, (4)
with di j = ∥∥x j − vi∥∥ , 1 ≤ i ≤ c, 1 ≤ j ≤ N .
Due to the fact that the Euclidian distance is used, the FCMmethod is based on the assumption of spherical clusters andis sensitive to outliers and disturbances. To account for thefirst assumption, the Gustafson-Kessel (GK) algorithm [27],the adaptive fuzzy clustering (AFC) algorithm [28] or theGK algorithm with adaptive cluster volumes (GKA ρ) [29]could be used to detect clusters of different shapes in one dataset. All three algorithms employ an adaptive distance norm,which adapts the FCM functional as
Jm(U, V; X) =c∑
i=1
N∑j=1
umi j (x j − vi )
TAi (x j − vi ) , (5)
where Ai is the norm-inducing matrix of the i th cluster thatshould be calculated on the basis of the cluster volume ρi
and the fuzzy covariance matrix F [30].Since the AFC and GKA ρ algorithms were found to
produce poor partitions if little is known about the initialdetermination of the cluster volumes, we used the generalGK algorithm with cluster volumes fixed to ρi = 1 [29]. Toimprove the numerical performance of the GK algorithm (toaccount for the singularity problems of F), we used the algo-rithm proposed by Babuška et al. [30], where two additionalparameters (β and γ ) are introduced. As suggested by theauthors, parameter β (the parameter that limits the conditionnumber of F) was fixed to β = 1015, whereas parameter γ ∈[0,1] (i.e. the tuning parameter which constraints the clustersto have a more or less equal shape) was varied as discussedin Sect. 3.3. Additionally, we followed Kruse et al. [31] inusing the final FCM partition for the initialization of the GKalgorithm.
The sensitivity of the FCM algorithm to outliers can beovercome either by using noise clustering [32], where anadditional noise cluster is introduced, or by fuzzy possibilis-tic clustering algorithms (for some variants, refer to [33–36]).Among the latter, the possibilistic-fuzzy c-means (PFCM)algorithm [36] worked particularly well on our NDT data,where the following objective function should be minimized:
Jm,η(U, T, V; X, γ ) =c∑
i=1
N∑j=1
(aumi j + btηi j ) · ∥∥x j − vi
∥∥2
+c∑
i=1
γi
N∑j=1
(1 − ti j )η, (6)
where a > 0, b > 0, m > 1 and η > 1 are user-definedparameters and γi should be calculated as proposed in [33].To minimize J , the necessary conditions for membershipsui j , typicalities ti j and cluster centres have to be adapted aswell. In our version of the PFCM algorithm we used the finalFCM partition for initialization, as well as fixed parametervalues a = 1.4, b = 1.8, m = 2 and η = 1.8, which produced thebest partition among several other parameter combinations.The chosen combination of parameters also worked well inour previous studies on spectroscopic spatial clustering [18].
It should be noted that the number of clusters is a user-defined parameter. Although several validity indices havebeen proposed to automatically define the optimal number ofclusters, it was observed that this procedure does not delivera proper interpretation of the results in our case. As evidentthroughout our study, the number of clusters should ratherbe defined according to the suspected severity of the damageand the heterogeneity of the inspected material.
3 Development of an Image Fusion Framework Basedon Clustering
For the development of an image fusion framework based onclustering, GPR and IR thermography measurements werecarried out on laboratory concrete specimens with artificialdefects. The numerous factors that govern the performanceof these two methods such as material properties, type, shapeand the size of defects were taken into account.
3.1 Specimen Description
All concrete specimens have a size of 50 × 50 × 15 cm3
and were made from the same concrete. The specimens con-tain inbuilt anomalies varying in material (polystyrene, airand water) and depth below the surface (Fig. 1). The inbuiltcuboids in specimen S2 have a size of 8 × 8 × 6 cm3, whilethe size of S1 cuboids is 8 × 8 cm2 with varying thickness.Specimen S2 features reinforcement with different densities(horizontal distance between bars 5 or 10 cm), but a uniformconcrete cover of 2.5 cm. The polystyrene plates (simulatingdelamination) in specimen S3 have a thickness of 1 cm (a)and 2 cm (b), and the diameters of the plastic pipes are 1,1.5 and 2.5 cm (from left to right in Fig. 1, S3). The con-crete cover over all the defects in specimen S3 is between1.5 and 2 cm. Defect specifications for all the specimens aresummarized in Table 1.
3.2 Methods
3.2.1 Ground Penetrating Radar
GPR is based on the propagation and reflection of high fre-quency electromagnetic impulses produced by an antenna
123

J Nondestruct Eval
Fig. 1 Sketches of laboratoryconcrete test specimens withmarked inbuilt defects
Table 1 Material and concrete cover of simulated defects for specimensS1–S3
Defect Defect material Concrete cover (cm)
S1a Air 6
S1b Air 3
S1c Water 6
S1d Water 3
S2a,b Polystyrene 6.6
S2c,d Polystyrene 4.6
S3a,b Polystyrene 1.5–2
S3pipes Plastic 1.5–2
system, where reflections occur at the interfaces betweenmaterials with different dielectric properties. In the near-surface region, the analysis and interpretation of GPR datais often complicated by the influence of near-field antennacoupling/induction effects, which according to [37] range toa depth of 1.5 · λ, where λ is the wavelength of the elec-tromagnetic waves. For concrete with a dielectric constantof around 9 and an antenna with a central frequency of 1.6GHz, the wavelength is around 6.3 cm and the near-fieldregion extends up to a depth of almost 10 cm. Apart fromthe near-field effects the performance of GPR is also depen-dent on the resolution. For calculation of the depth resolution(defined as the ability to differentiate two adjacent signals intime), 0.25 · λ has been proposed [38].
The GPR data used for this study was obtained with equip-ment from MALÅ Geoscience, using a 1.6 GHz monostaticshielded antenna. A calibrated survey wheel was used andradargrams were collected in both directions with a line spac-ing of 5 cm and a point distance of 0.5 cm.
3.2.2 Square Pulse Thermography in the FrequencyDomain
IR thermography is based on recording the IR radiation fromthe previously heated surface of the specimen and allowsdetection of the presence of defects to within a depth ofapproximately 10 cm [39]. In order to enhance the detectabil-ity of thermal images, the use of the pulse phase thermog-
raphy technique was originally proposed by Maldague andMarinetti [40] and further adapted for the special require-ments of NDT-CE by Arndt [41] in terms of square pulsethermography (SPT) in the frequency domain. Here, thespecimen is square pulse heated [42] and analysis of therecorded temperature evolution versus time of each pixel isperformed in the frequency domain by fast Fourier transfor-mation, deriving amplitude and phase images. Phase imagesin particular exhibit higher depth penetration, higher resolu-tion and are less sensitive to non-uniform heating than ther-mal and amplitude images [43]. Arndt [41] additionally pro-posed a quantitative method where the depth z of a defect canbe expressed by the frequency fch of the maximum phase oramplitude contrast between the defect and the sound areathrough the following equation
z = kc ·√
α
fch, (7)
where kc is a correction factor and α is the thermal diffusivityof the investigated material.
The IR thermography data used for this study was acquiredwith a FLIR A320 IR camera, having a thermal sensitivityof 50 mK (at 30 ◦C), a spatial resolution of 1.36 mrad and afocal plane array with a resolution of 320 × 240 pixels and aspectral range of 7.5–13 µm. For heating the specimens, twoIR heaters (1.2 kW each) were moved parallel to the surface ata distance of about 45 cm. All thermal images were recordedat a frame rate of 0.2 Hz. The heating and cooling down timeswere adjusted with regard to the problem.
3.2.3 Image Fusion and Validation
GPR and IR thermography images were combined on a fea-ture level-based data fusion using fuzzy clustering methodsfor data segmentation and simple weighted averaging to fusethe derived memberships for each pixel according to
xU S(i, j) = u R,i xR + uT, j xT
u R,i + uT, j, (8)
where xR and xT refer to a specific pixel of GPR and IRimages and u R and uT are the associated membership val-
123
J Nondestruct Eval
ues. Index i marks that observation x,which is segmented tocluster i , should be weighted with its corresponding mem-bership to that cluster. Different indices (i, j) particularlyrefer to independent segmentation of GPR compared to IRthermography. For GPR C-scans were used, whereas for IRthermography phase images at particular frequencies servedas input data. Since the concrete test validation specimenscontained defects at known depths, the quantitative approachof SPT in the frequency domain with respect to the mater-ial properties of concrete and the defects was applied. As aresult, the phase contrast images could be regarded as depthslices, enabling a direct correlation with the GPR C-scans.Before fusion, data alignment was performed and a commonspatial reference was established. In addition, both data setswere globally normalized; amplitudes for GPR and phasecontrasts for IR thermography. In this paper we present theresults obtained using the FCM, GK and PFCM clusteringmethods performed for each depth separately. Noise cluster-ing, though normally extremely powerful in handling noisydata [18], failed in our case as signals of very high amplitude(detected defect) were classified as noise.
Based on ground truth reference, the results from fusion onconcrete were assessed both qualitatively and quantitatively.The quality of the resulting images was estimated by visualinspection, whereas quantitative evaluation was based on theknown area of the defects. Sensitivity and specificity values[44] were calculated from the number of true positive, truenegative, false positive and false negative calls by using
sens = T P
T P + F N, (9)
spec = T N
T N + F P, (10)
where positive and negative refer to an identified and arejected defect, respectively. Thus, a true positive call meansthat a pixel was correctly identified as a defect. A combinedsensitivity measure c_sens was further calculated by
c_sens = a · sens + b · spec
a + b, (11)
where weights a and b refer to the specimen’s correspondingdefect and non-defect area, respectively.
The clustering results were additionally compared withthe results obtained after applying supervised symbol levelfusion, based on the assignment of weights referring tothe probability of defect detection of the measurement sys-tem. Based on results from previous experiments on con-crete with the same measurement system, a recommenda-tion for weights of both NDT methods was given in accor-dance with the depth of defects through sensitivity curves[45]. In this study we refer to the sensitivity curve calculatedfor polystyrene defects since it covers the investigated depth
range. For the fusion algorithm, weighted averaging and theD–S rule of combination were used (we preferred the D–S toBayesian theory approaches, since the D–S does not assignbelief or disbelief to the fused image if there is insufficientknowledge). For our data sets, weighted averaging for eachpixel was calculated according to
xw = wR xR + wT xT
wR + wT, (12)
where wR and wT are the weights associated with the prob-ability of defect detection of the GPR and IR thermographymeasurement system and xR and xT refer to a specific pixelof GPR and IR images. Following Gros et al. [10] for theapplication of the D–S [46], we first introduce a frame ofdiscernment � as a set of mutually exclusive events a and b,where�= {a- GPR is true, b- thermography is true}. A powerset P(�) = {∅, a, b,�} is defined and for each element ofP(�) masses, associated with the probability of defect detec-tion of the GPR and IR thermography measurement system,are assigned. With the mass assignment, evidential intervalscould be determined for GPR and thermography images byapplying the D–S rule of combination [46], which can bemathematically expressed as
m R,T (z) = m R ⊕ mT (z) =∑
x∩y=zm R(x)mT (y)
1 − ∑x∩y=0
m R(x)mT (y),
(13)
where m R and mT are mass functions of GPR and IR ther-mography, respectively. In our case, m R,T (a) refers to theevidence that the information on the GPR image is correct,and the same is true for m R,T (b) referring to the evidencefor the IR image. To obtain a fused image, derived evidenceswere combined through weighted averaging
xDS = m R,T (a) xR + m R,T (b) xT
m R,T (a) + m R,T (b). (14)
3.3 Results and Discussion
The results of GPR and IR thermographic inspections areshown for the specimens S1 at the depth of 3 cm (Fig. 2),S2 at the depth of 4.6 cm (Fig. 3) and S3 at the depth of 1.5cm (Fig. 4) (results obtained at other depths are not takeninto account due to the suspected movement of defects dur-ing concreting). Red rectangles mark the known position ofthe defects, which served as a reference to evaluate the effec-tiveness of image fusion. For a qualitative evaluation, imagesresulting from both feature (based on the FCM clusteringalgorithm) and symbol (based on the supervised assignmentof weights) level fusion using weighted averaging are shownnext to images used as input data. For symbol level fusion,
123

J Nondestruct Eval
Fig. 2 Results from specimen S1 at the depth of 3 cm with markeddefects according to Table 1 [the upper defect refers to air (b), the lowerto water (d)]: GPR depth slice (a), IR phase contrast image at frequency
6.2 × 10⁻⁴ Hz (b), results from weighted averaging of images (a) and(b) using unsupervised feature level fusion (c) and supervised symbollevel fusion (d)
Fig. 3 Results from specimen S2 at the depth of 4.6 cm with markeddefects according to Table 1 (the right part of the images refers to thepart of the specimen with dense reinforcement): GPR depth slice (a),
IR phase contrast image at frequency 3.0 × 10⁻⁴ Hz (b), results fromweighted averaging of images (a) and (b) using unsupervised featurelevel fusion (c) and supervised symbol level fusion (d)
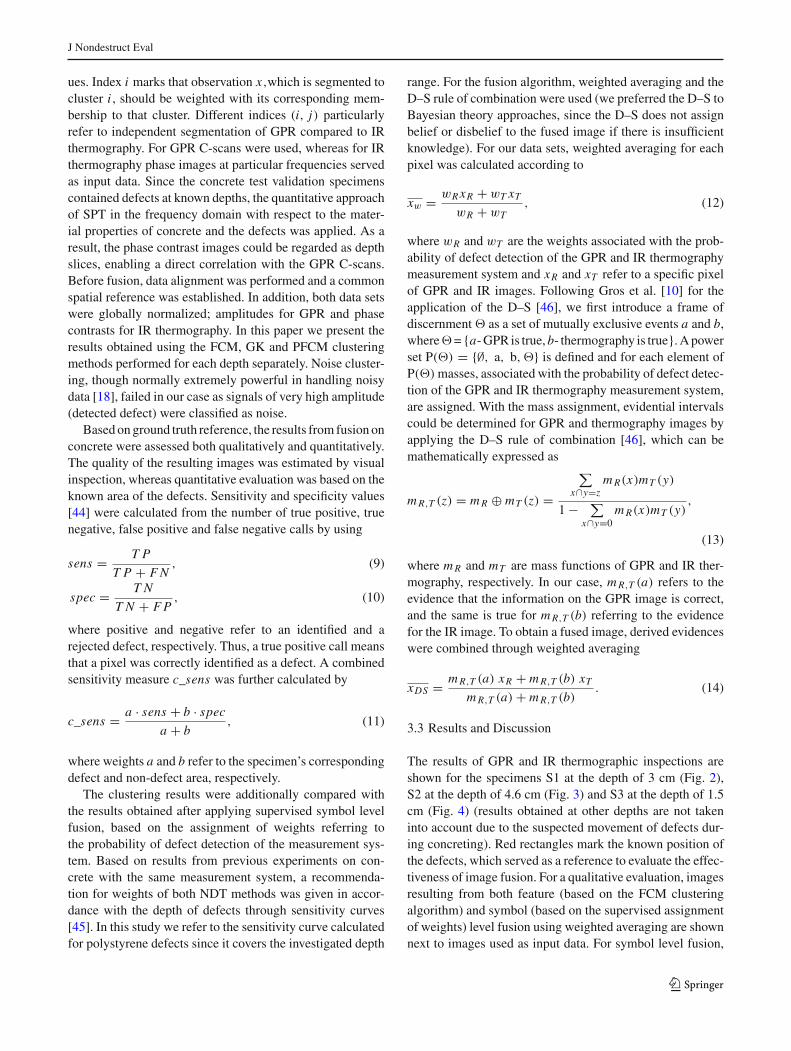
the weights used for the GPR/IR images were 0.88/0.89 forspecimen S1 at the depth of 3 cm, 0.89/0.89 for specimenS2 at the depth of 4.6 cm and 0.75/0.91 for specimen S3at the depth of 1.5 cm [45]. In Fig. 2 the lower rectanglerefers to the water (d) and the upper to the air (b) defect. Itcan be seen that due to the overlapping performance of thetwo NDT methods both unsupervised feature level (Fig. 2c)as well as supervised symbol level fusion (Fig. 2d) yieldedvery similar results. However, in the case of specimen S2,clustering-based image fusion helped particularly in identi-fying the defect below the more dense reinforcement as wellas in eliminating the reinforcement pattern detected by GPR(Fig. 3c). Although it was hoped that clustering would dif-ferentiate between the air and water defect when employinghigher cluster numbers, this was not the case since GPR couldnot derive any information about the phase at the depth of 3cm.
In contrast to specimens S1 and S2, the weights assignedin the case of specimen S3 at the depth of 1.5 cm tendedto assign much more knowledge to IR thermography (0.91for IR thermography compared to 0.75 for GPR). Conse-
quently, the shape of the plastic pipes, that were more accu-rately detected by IR thermography, could be well visualizedwhen using both supervised averaging and the D–S rule ofcombination, where a slightly higher contrast refers to D–S(Fig. 4e). However, it can be seen that the fusion with theFCM algorithm yielded an image with even higher contrast,where both plates and pipes could be well resolved (Fig. 4c).
To account for the drawback of the subjective visual evalu-ation of image fusion we further evaluated the results quanti-tatively. To perform the sensitivity calculation (in accordancewith Eq. 11) in regard to whether a defect was detected ornot, images were partitioned into two clusters. To providean objective comparison of the results and thus to avoid theassignment of a threshold value for the classification, thestandard FCM algorithm was employed, where the thresholdvalue is assigned automatically with respect to the conditionfor minimizing the functional J in Eq. 2 (we preferred theFCM to the hard k-means algorithm to avoid the k-meansinitialization problems as noted in Sect. 2). To obtain a hardassociation of the most probable cluster, only the cluster withthe highest membership degree was taken into account. Table
123
J Nondestruct Eval
Fig. 4 Results from specimen S3 at the depth of 1.5 cm with markedpolystyrene plates according to Table 1: GPR depth slice (a), IR phasecontrast image at frequency 3.7 × 10⁻³ Hz (b), results from weighted
averaging of images (a) and (b) using unsupervised feature level fusion(c) and supervised symbol level fusion (d), and results from D–S ofimages (a) and (b) using supervised symbol level fusion (e)
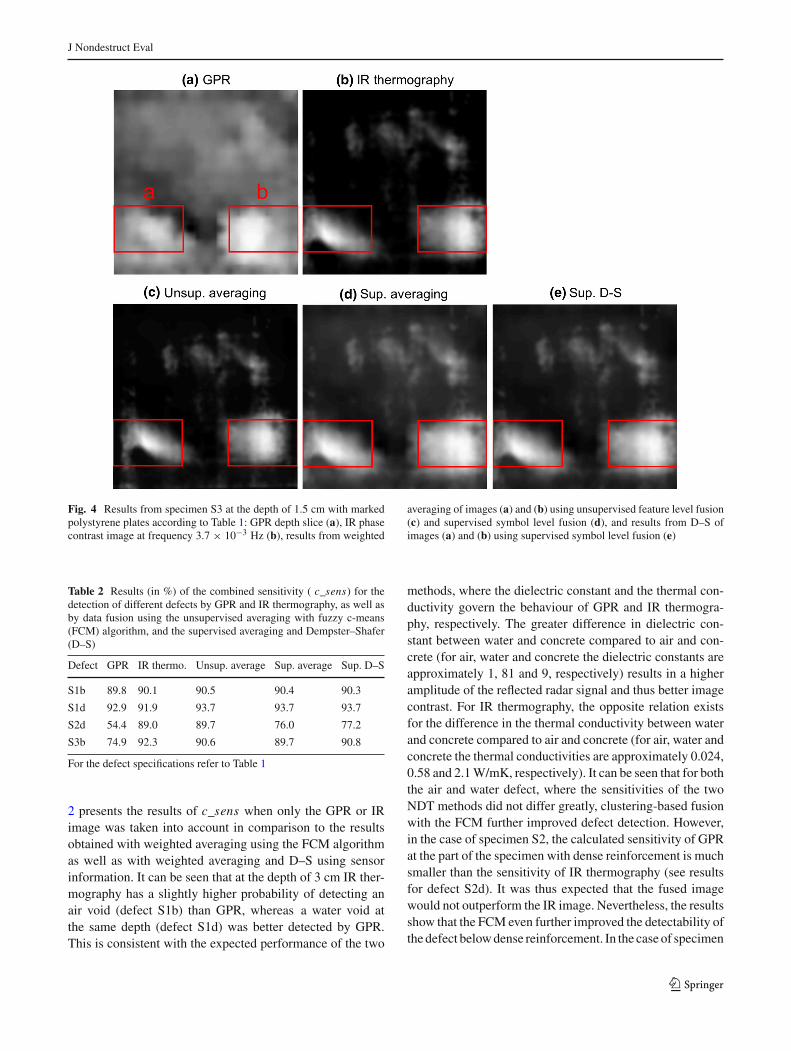
Table 2 Results (in %) of the combined sensitivity ( c_sens) for thedetection of different defects by GPR and IR thermography, as well asby data fusion using the unsupervised averaging with fuzzy c-means(FCM) algorithm, and the supervised averaging and Dempster–Shafer(D–S)
Defect GPR IR thermo. Unsup. average Sup. average Sup. D–S
S1b 89.8 90.1 90.5 90.4 90.3
S1d 92.9 91.9 93.7 93.7 93.7
S2d 54.4 89.0 89.7 76.0 77.2
S3b 74.9 92.3 90.6 89.7 90.8
For the defect specifications refer to Table 1
2 presents the results of c_sens when only the GPR or IRimage was taken into account in comparison to the resultsobtained with weighted averaging using the FCM algorithmas well as with weighted averaging and D–S using sensorinformation. It can be seen that at the depth of 3 cm IR ther-mography has a slightly higher probability of detecting anair void (defect S1b) than GPR, whereas a water void atthe same depth (defect S1d) was better detected by GPR.This is consistent with the expected performance of the two
methods, where the dielectric constant and the thermal con-ductivity govern the behaviour of GPR and IR thermogra-phy, respectively. The greater difference in dielectric con-stant between water and concrete compared to air and con-crete (for air, water and concrete the dielectric constants areapproximately 1, 81 and 9, respectively) results in a higheramplitude of the reflected radar signal and thus better imagecontrast. For IR thermography, the opposite relation existsfor the difference in the thermal conductivity between waterand concrete compared to air and concrete (for air, water andconcrete the thermal conductivities are approximately 0.024,0.58 and 2.1 W/mK, respectively). It can be seen that for boththe air and water defect, where the sensitivities of the twoNDT methods did not differ greatly, clustering-based fusionwith the FCM further improved defect detection. However,in the case of specimen S2, the calculated sensitivity of GPRat the part of the specimen with dense reinforcement is muchsmaller than the sensitivity of IR thermography (see resultsfor defect S2d). It was thus expected that the fused imagewould not outperform the IR image. Nevertheless, the resultsshow that the FCM even further improved the detectability ofthe defect below dense reinforcement. In the case of specimen
123

J Nondestruct Eval
S3, quantitative evaluation is presented only for the right (b)polystyrene plate (the left plate seems to have tilted duringconcreting and the exact position of the plastic pipes couldnot be assessed due to small movements during concreting).As already observed from visual inspection, the results showthat IR thermography detects the plate more accurately. Here,the FCM could not improve localization, but at the same timeworsened the sensitivity of IR thermography only to a smallextent.
Regarding the outcome from supervised averaging andD–S in Table 2, it is evident that in general both D–S andweighted averaging performed similarly. Moreover, whereremarkably higher weights were assigned to the system withbetter performance, it was suspected that both supervisedmethods would outperform clustering-based fusion. On thecontrary, only negligible improvement was obtained withD–S (see results for defect S3b). On the other hand, whereweights were not assigned according to the reliability of thetwo NDT methods (in the case of dense reinforcement), theperformance of both averaging and D–S deteriorated to aconsiderable extent (see results for defect S2d). This provesthat the operation of both methods depends greatly upon thea priori selected weights, which has already been argued in[10]. In contrast, clustering methods work unsupervised andcan handle various data sets without knowledge about thedata.
To derive an optimal clustering-based data fusion frame-work, we further compared the performance of differentfuzzy clustering algorithms for segmentation of the data.A qualitative comparison of the resulting classification ofspecimen S3 is given in Fig. 5, where the cluster colouris displayed according to the hard association of the mostprobable cluster (the cluster with the highest membershipdegree), whereas the factor of transparency takes into accountthe membership degree (e.g. ui j = 1: opaque, ui j = 0.5: 50% transparency). The results show that the GK algorithm(with parameter γ = 0) outperforms the FCM for the detec-tion of pipes, whereas for the PFCM no improvement fromthe FCM can be seen. The good performance of the GK isunderstandable since the method is able to detect clustersof various shapes, whereas the FCM and PFCM algorithmsare restricted to clusters of equal shape. However, it shouldbe noted that clustering methods treat each data point (pixelvalue) independently. Thus, the shape of clusters should notrefer to the geometrical shapes detected from the GPR and IRthermography images, but rather to the geometrical shapesobtained from data plots correlating the GPR and IR ther-mography data. For specimen S3, correlation plots betweenGPR and IR thermography data are shown in Fig. 6 using theFCM and GK (for γ = 0) algorithms. It can be seen that incontrast to the FCM, the GK yields an elongated black clus-ter (corresponding to the black (non-defect) data points inFig. 5c) with GPR extending over the whole dimension and
limiting IR thermography to the smallest values. This meansthat the GK is able to classify data points with respect to themore relevant (IR thermography) results while treating GPRdata as more noisy. That is in accordance with Fig. 4a, whereespecially in the region of the plastic pipes, GPR data exhibitpoor contrast.
To quantitatively prove the clustering results above, Table3 summarizes the outcome from sensitivity calculation forall the defects taken into account. The results show that thebehaviour of PFCM in general resembles the one of FCM.This suggests that noise does not appreciably restrict thedetection of defects in the case of our NDT data. However,this is contrary to the results of an eddy current inspection ofstainless steel cladding tubes [13], or spectroscopic measure-ment results on concrete [18] where noise played an impor-tant role. In addition, it can be seen that the GK performsdifferently with regards to the FCM when parameter γ doesnot additionally restrict the shape of clusters (for γ = 0).Although the GK with γ = 0 could best visualize the plas-tic pipes, its poor performance stands out particularly in thecase of defect S2d, where its localization deteriorated bymore than 10 % compared to the FCM. An explanation forthis could be derived from the GPR results in Fig. 3a. Due tothe detection of reinforcement, the cluster centres are closeto each other and the clusters are extremely long in one direc-tion, which has been reported to produce poor models [30].In contrast, by only slightly restricting the algorithm with γ
= 0.1, the GK performed similarly to the FCM while beingat the same time also sensitive to the detection of elongateddefects. To summarize, by taking into account both the robustperformance of the methods as well as the sensitivity to smallvariations, the modified GK (restricted by β and γ ) can beregarded as the most recommendable clustering algorithmfor the investigated NDT data sets.
4 Image Fusion Applied to a Case Study
As already mentioned in Sect. 1, one of the main tasks inderiving a generalized data fusion framework for NDE-CEapplications is to promote fast, efficient and reliable evalu-ation of large data sets. Examples of large area inspectioninclude parking garages and bridge decks suffering fromsevere corrosion of the reinforcement, which is reflected incracking, spalling and losses of the concrete cross section.In order to evaluate the extent of degradation adequately,investigation of surfaces of some thousand square metreswith a dense grid is necessary. To solve this problem, a self-navigating mobile robot system has been developed withinthe BetoScan project (www.betoscan.de). The key task ofthe BetoScan system is to divide the investigated structureinto zones with defined damage classes. Therefore, potentialmaps together with other parameters such as the distribution
123

J Nondestruct Eval
Fig. 5 Results from clustering of images Fig. 4a, b using the fuzzyc-means (FCM) (a), possibilistic-fuzzy c-means (PFCM) (b) andGustafson-Kessel (GK) with γ = 0 (c) algorithms. White cluster refers
to detected defects, black to non-defect area with the factor of trans-parency referring to the membership degree
Fig. 6 Correlation plots between GPR and IR thermography normal-ized data from specimen S3 using the fuzzy c-means (FCM) (a) andGustafson-Kessel (GK for γ = 0) (b) algorithms. White and black data
points refer to the white and black cluster in Fig. 5, whereas the redpoint marks the corresponding cluster centre
Table 3 Results (in %) of the combined sensitivity (c_sens) for thedetection of different defects with data fusion using the fuzzy c-means (FCM), possibilistic-fuzzy c-means (PFCM) and Gustafson-Kessel (GK) algorithms
Defect FCM PFCM GK (γ = 0) GK (γ = 0.1)
S1b 90.5 90.5 90.6 90.5
S1d 93.7 93.7 94.4 93.7
S2d 89.7 89.3 80.3 87.0
S3b 90.6 90.6 91.5 90.8
For the defect specifications refer to Table 1
of concrete cover and moisture have to be assessed simultane-ously. With the BetoScan system this is achieved by an auto-mated multi-sensor system comprising the following NDTmethods (Fig. 7):
– potential mapping (to assess the probability of active cor-rosion),
– eddy current + GPR (to assess the concrete cover abovethe reinforcement layer),
– ultrasonic (to assess the thickness of the investigatedstructure, the presence of voids and cracks),
– microwave (to assess the humidity distribution).
Except for ultrasonic, all the sensors can collect datacontactlessly, enabling a driving speed from 0.1 up to0.5 m/s (depending on the methods used). As well asthe methods given above, additional methods and deviceswith a digital interface may be included in the system.A more detailed description of a current multi-sensor sys-tem is given in [47]. Although the BetoScan system hasa fully automated data acquisition system, data analy-sis is currently performed manually by direct comparisonof the results. The development of an efficient and reli-able data fusion framework is therefore of major inter-est.
123

J Nondestruct Eval
Fig. 7 The BetoScan robotic system with NDT sensors
4.1 Methods
We tested our clustering-based data fusion methodology fordata segmentation on a BetoScan data set acquired from thereinforced concrete floor of a parking garage in Germany.The area inspected measured approximately 5 × 7 m2. Thespacing between tracks was around 20 cm, with about 1 cmbetween data points of each track. Before data fusion, nor-malization and alignment of the data was performed and acommon spatial reference with data interpolation was estab-lished.
Potential mapping, eddy current, as well as microwavemoisture sensors were used simultaneously. Potential map-ping is based on measurement of the electrochemical poten-tials of the reinforcement on the concrete surface by the useof a reference electrode known as a half-cell and a high-impedance voltmeter. A potential lower than –300 mV indi-cates a high probability of active corrosion. For the BetoScansystem, a Canin+ instrument from Proceq was used in com-bination with a copper/copper sulphate reference wheel elec-trode. For eddy current, which is based on electromagneticpulse induction to detect flaws in conductive materials, aProfometer 5+ from Proceq was used, which combines rebardetection and measurement of concrete cover. To measure therelative moisture distribution of the concrete, the microwave-based devices Moist RP (4 cm penetration) and Moist PP (20cm penetration) from HF-Sensor were used. The microwavemethod is based on the fact that with increase in moisturecontent of the material, microwaves lose more energy due toinduced oscillations of the electric field during transmission.
To support the results obtained by the BetoScan system,we additionally took into account the data obtained by a
radar-magnetic method—a relatively new technique still inthe state of development [48]. Here, the moisture and thesalinity of concrete are estimated by the real and imagi-nary parts of the dielectric constant of the concrete coveringthe reinforcement. Firstly, the static magnetic field of pre-magnetized rebars is measured. The depth of the rebars isobtained through a knowledge of the magnetic field com-ponents orthogonal to the rebar direction. The mathematicalapproximation was described by Krause et al. in [48]. Sec-ondly, the real (ε′
r ) and imaginary part (ε′′r ) of the dielectric
constant are calculated using the travel time tr and reflec-tion amplitude rtot measured by GPR, as well as the concretecover previously assessed by the magnetic method.
Measurements with the radar-magnetic method were per-formed with a system introduced by the same authors, apply-ing the GPR RAMAC system from MALÅ Geoscience witha 1 GHz monostatic antenna and a set of four GMR magne-tometers. The acquired data was aligned in accordance withthe scanned area by the BetoScan.
4.2 Results and Discussion
From the surface plot of the electrochemical potentials of theconcrete floor investigated, critical areas with a high prob-ability of corrosion could be identified by potentials lowerthan –300 mV (Fig. 8a). The main effects that induce corro-sion in concrete structures are carbonation and high chlorideconcentration [49]. In general, the probability of carbonationincreases with decreasing concrete cover above the reinforce-ment layer. The results show that at some parts of the surfacewhere the concrete cover was even less than 30 mm, the cor-rosion process was very intensive (compare the right side ofFig. 8a and Fig. 8b). However, it is hard to draw conclusionsfrom the moisture measurements alone. The data acquired bythe Moist RP sensor (with a penetration capability of up to4 cm depth) suggest a variable humidity distribution of thescanned area that cannot be correlated with either the poten-tial or concrete cover results (Fig. 8c). On the other hand, thehumidity distribution assessed by the Moist PP sensor sug-gests a relative humidity of more than 3 vol. % in parts withlow concrete cover (Fig. 8d). Therefore, the striking corro-sion on the right side of the floor is probably due to bothcarbonation and a high salinity concentration (by assuminga correlation between moisture and salinity concentration).
To support our assumption, we additionally present resultsby the radar-magnetic method. As shown from the results ofthe Moist RP sensor, the real part of the dielectric constantalso suggests a variable humidity distribution (Fig. 8e). Incontrast, the plot of the imaginary part of the dielectric con-stant ε′′
r is in good agreement with the results from potentialmapping and eddy current (Fig. 8f). Since ε′′
r refers to energylosses of the electromagnetic wave due to free charges in thematerial, a high value of ε′′
r refers to concrete with higher
123

J Nondestruct Eval
Fig. 8 Results from the BetoScan measurement of a concrete parkingdeck using potential mapping (a), eddy current (b), microwaves with aMoist RP sensor (c) and microwaves with a Moist PP sensor (d). Resultsfrom the radar-magnetic measurement with the real (e) and imaginary
(f) part of the dielectric constant (note that due to the chosen colourbar in Fig. 8f, the white area corresponds to values up till 0.35 of theimaginary part of the dielectric constant)
salinity. This demonstrates the information from salinity con-centration to be better correlated to corrosion than moisture.
The BetoScan data, as well as the data from the radar-magnetic measurement, show that estimation of the conditionof the structure is not straightforward. Each of the appliedNDT methods suffers from limited reliability in identify-ing certain parameters. The efficiency of using clusteringmethods to estimate zones with a different degree of degra-dation is demonstrated in Fig. 9. Only the results obtainedusing the GK algorithm with γ = 0.1 are presented whenusing three clusters. FCM produced an almost similar resultfor this data set. Regarding the correlation between data,the optimal solution would be to combine potential map-ping, eddy current and radar-magnetic measurement datawith the imaginary part of the dielectric constant (Fig. 9a)(for the correlation plot for this data set see Fig. 10). How-
ever, the resulting partitions show that for the combinationof potential mapping, eddy current and microwaves with theMoist PP sensor, zones with a higher probability of dam-age can also be clearly detected (Fig. 9b). Here, the redcluster could be identified with the zone of severe corro-sion, the black cluster with the area of either small concretecover or high salinity content (or both) where the corro-sion process is not yet observable, whereas the white areacould be characterized as undamaged (or minimally dam-aged) concrete as a result of higher concrete cover and goodconcrete quality. To prove the robustness of the clusteringmethods, we further evaluated the whole of the BetoScandata. In Fig. 9c it can be seen that although the data acquiredby microwave with the Moist RP sensor worsened the finalpartition, the most important damage zone can still be wellrecognized.
123

J Nondestruct Eval
Fig. 9 Results from image fusion using the Gustafson-Kessel (GK)clustering algorithm while taking into account different data sets: poten-tial mapping + eddy current + radar-magnetic method (Imε) (a), poten-tial mapping + eddy current + microwaves with sensor Moist PP (b)and potential mapping + eddy current + microwaves with sensors MoistPP and Moist RP (c). Red cluster could be identified with the area of
severe corrosion, the black one with the area of either small concretecover or high salinity content (or both) where the corrosion process isnot yet observable, whereas the white area could be characterized asundamaged (or minimally damaged). The factor of transparency refersto the cluster membership degree
Fig. 10 Correlation plots between potential mapping, eddy current andradar-magnetic method (Imε) normalized data using the Gustafson-Kessel (GK) clustering algorithm. Cluster colours refer to the coloursin Fig. 9a, whereas the yellow points mark the corresponding clustercentre
5 Conclusions
The use of clustering methods for image classificationof fused NDT-CE data sets was studied. The cluster-ing’s direct classification outcome as well as their use infeature-level fusion were taken into account. The meth-ods proved particularly helpful in detecting near-surfacedefects simulating delamination, voids and localized wateras well as in partitioning a reinforced concrete floor froma parking garage into damage zones, and thus provided
both defect localization as well as characterization of thedefects.
The use of fuzzy probabilistic clustering (employing theFCM and GK algorithms), as well as fuzzy possibilistic clus-tering (with the PFCM algorithm), was explored on con-crete validation specimens with GPR and IR thermographydata. Results from the sensitivity evaluation showed that thePFCM in general performed similarly as the FCM, whichsuggests that noise has only a minor effect on the resultingpartition. On the contrary, the use of the modified version ofthe GK method helped particularly to detect clusters of arbi-trary shape, since the algorithm is not restricted to sphericalclusters as are the FCM and PFCM. Elongated clusters wereproduced when the method took into account the relevanceof only one method, such as for the detection of plastic pipesand cracks. For best performance of the GK it is suggestedthat the parameter γ be set to 0.1.
The efficiency of using clustering for data classificationin feature level fusion was evaluated through comparisonwith supervised symbol level fusion using weighted averag-ing and D–S. The results showed that in the case where moreknowledge was assigned to the NDT system with better per-formance, only a negligible improvement was obtained withsupervised fusion using D–S compared to clustering-basedfusion. However, if weights were not assigned according tothe reliability of the respective NDT methods, the perfor-mance of both averaging and D–S deteriorated to a largeextent. The unsupervised clustering methods, on the otherhand, showed robust performance.
The use of clustering techniques to combine data fromGPR and IR thermography in general increased the reliabilityof NDT inspection in cases where the methods had a com-
123

J Nondestruct Eval
plementary penetration capability and sensitivity to differentphysical properties. Moreover, in cases where one methodgreatly dominated over the other, they worsened its perfor-mance only to a small extent. This shows clustering methodsto be robust in situations with very limited knowledge aboutthe material properties and depths of the defects, which wasadditionally proven by the BetoScan data set. Here, the use ofclustering also enabled characterization of the defects. More-over, it should be emphasized that for a multi-sensor systemsuch as the BetoScan, image fusion with clustering is of par-ticular importance since it delivers one final image that takesinto account the correlation between the various NDT meth-ods. In practice, displaying only one reliable image ratherthan multiple ones to the end-user is of the utmost impor-tance.
Acknowledgments The first author acknowledges the financial sup-port of the Slovenian Research Agency through grant 1000-10-310156and the Slovene Human Resources and Scholarship Fund through grant11012-13/2012. The authors wish to thank Dr. Hans-Joachim Krauseand colleagues for the radar-magnetic data set. Contributions and sup-port from Assoc. Prof. Violeta Bokan Bosiljkov, Primož Murn and Dr.Parisa Shokouhi are acknowledged.
References
1. McCann, D.M., Forde, M.C.: Review of NDT methods in theassessment of concrete and masonry structures. NDT E Int. 34,71–84 (2001)
2. Beutel, R., Reinhardt, H.W., Grosse, C.U., Glaubitt, A., Krause,M., Maierhofer, C., et al.: Comparative performance tests and val-idation of NDT methods for concrete testing. J. Nondestruct. Eval.27, 59–65 (2008)
3. Shokouhi, P., Wiggenhauser, H.: Multi-probe ultrasonic test-ing for detection of delamination in concrete bridge decks.TRB Annual Meeting Online (AMOnline). http://amonline.trb.org/1sl7d2/1 (2011). Accessed 5 January 2013
4. Maierhofer, C., Arndt, R., Röllig, M., Rieck, C., Walther, A.,Scheel, H., et al.: Application of impulse-thermography for non-destructive assessment of concrete structures. Cem. Concr. Com-pos. 28, 393–401 (2006)
5. Cotic, P., Jaglicic Z, Bosiljkov, V.: Validation of non-destructivecharacterization of the structure and seismic damage propagationof plaster and texture in multi-leaf stone masonry walls of cultural-artistic value. J. Cult. Herit. (2013). doi:10.1016/j.culher.2013.11.004
6. Cotic, P., Jaglicic, Z., Niederleithinger, E., Effner, U., Kruschwitz,S., Trela, C., et al.: Effect of moisture on the reliability of voiddetection in brickwork masonry using radar, ultrasonic and com-plex resistivity tomography. Mater. Struct. 46, 1723–1735 (2013).doi:10.1617/s11527-012-0011-3
7. Maierhofer, C., Wöstmann, J.: Investigation of dielectric propertiesof brick materials as a function of moisture and salt content usinga microwave impulse technique at very high frequencies. NDT EInt. 31(4), 259–263 (1998)
8. Maierhofer, C., Zacher, G., Kohl, C., Wöstmann, J.: Evaluationof radar and complementary echo methods for NDT of concreteelements. J. Nondestruct. Eval. 27, 47–57 (2008)
9. Wiggenhauser, H.: Advanced NDT methods for quality assur-ance of concrete structures. In: Proceedings NDTCE’09, Non-destructive testing in civil engineering. LCPC, Paris (2009)
10. Gros, X.E., Bousigue, J., Takahashi, K.: NDT data fusion at pixellevel. NDT E Int. 32, 283–292 (1999)
11. Gros, X.E., Liu, Z., Tsukada, K., Hanasaki, K.: Experimenting withpixel-level NDT data fusion techniques. IEEE T Instrum. Meas.49(5), 1083–1090 (2000)
12. Liu, Z., Forsyth, D.S., Safizadeh, M.S., Fahr, A.: A data-fusionscheme for quantitative image analysis by using locally weightedregression and Dempster–Shafer theory. IEEE T Instrum. Meas.57(11), 2554–2560 (2008)
13. Balakrishnan, S., Cacciola, M., Udpa, L., Rao, B.P., Jayakumar, T.,Raj, B.: Development of image fusion methodology using discretewavelet transform for eddy current images. NDT E Int. 51, 51–57(2012)
14. Kohl, C., Krause, M., Maierhofer, C., Wöstmann, J.: 2D-and 3D-visualisation of NDT-data using data fusion technique. Mater.Struct. 38, 817–826 (2005)
15. Cui, J., Huston, D.R., Arndt, R., Jalinoos, F.: Data fusion techniquesof multiple sensors nondestructive evaluation of a concrete bridgedeck. TRB Annual Meeting Online (AMOnline). http://amonline.trb.org/2vdh1b/2vdh1b/1 (2010). Accessed 11 February 2012
16. Bensaid, A.M., Hall, L.O., Bezdek, J.C., Clarke, L.P., Silbiger,M.L., Arrington, J.A., et al.: Validity-guided (re)clustering withapplications to image segmentation. IEEE T Fuzzy Syst. 4(2), 112–123 (1996)
17. Santoro, M., Prevete, R., Cavallo, L., Catanzariti, E.: Mass detec-tion in mammograms using gabor filters and fuzzy clustering. In:Bloch, I., Petrosino, A., Tettamanzi, A.G.B. (eds.) Fuzzy logicand applications. WILF 2005: Proceedings of the 6th internationalworkshop, pp. 334–343. Springer, Berlin (2006)
18. Cotic, P., Niederleithinger, E., Wilsch, G.: Unsupervised clusteringof spatially acquired laser-induced breakdown spectroscopy datafrom concrete. Cem. Concr. Res. (submitted)
19. Cotic, P., Niederleithinger, E., Bosiljkov, V., Jaglicic, Z.: NDT datafusion for the enhancement of defect visualization in concrete. KeyEng. Mater. 569–570, 175–182 (2013)
20. Liu, Z., Forsyth, D.S., Komorowski, J.P., Hanasaki, K., Kirubara-jan, T.: Survey: state of the art in NDE data fusion techniques. IEEET Instrum. Meas. 56, 2435–2451 (2007)
21. Kaftandjian, V., Zhu, Y.M., Dupuis, O., Babot, D.: The combineduse of the evidence theory and fuzzy logic for improving mul-timodal nondestructive testing systems. IEEE T Instrum. Meas.54(5), 1968–1977 (2005)
22. Bogaerta, P., Fasbender, D.: Bayesian data fusion in a spatial pre-diction context: a general formulation. Stoch Environ. Res. RiskAssess. 21, 695–709 (2007)
23. Li, G., Huang, P., Chen, P., Hou, D., Zhang, G., Zhou, Z. Appli-cation of multi-sensor data fusion in defects evaluation based onDempster–Shafer theory. IEEE Xplore Digital Library. http://ieeexplore.ieee.org/xpl/articleDetails.jsp?arnumber=5944335 (2011).Accessed 13 February 2012
24. Höppner, F., Klawonn, F., Kruse, R., Runkler, T.: Fuzzy clusteranalysis: methods for classification, data analysis and image recog-nition, 1st edn. Wiley, Chichester (1999)
25. MacQueen, J.B.: Some methods for classification and analysis ofmultivariate observations. Proceedings of the 5th Berkeley sympo-sium on mathematical statistics and probability, vol 1: Statistics,pp. 281–297. University of California Press, Berkeley (1967)
26. Bezdek, J.Z.: Pattern recognition with fuzzy objective functionalgorithms. Plenum Press, New York (1981)
27. Gustafson, D., Kessel, W.: Fuzzy clustering with a fuzzy covariancematrix. Proceedings of the 1978 IEEE conference on decision andcontrol including the 17th Symposium on adaptive processes, pp.761–766. IEEE Control Systems Society, San Diego (1979)
123

J Nondestruct Eval
28. Dave, R.N.: Use of the adaptive fuzzy clustering algorithm to detectlines in digital images. In: Casasent, D.P. (ed.) Intelligent robotsand computer vision VIII: algorithms and techniques, vol 1192.SPIE, pp. 600–611 (1990)
29. Krishnapuram, R., Kim, J.: A note on the Gustafson-Kessel andadaptive fuzzy clustering algorithms. IEEE T Fuzzy Syst. 7(4),453–461 (1999)
30. Babuška, R., van der Veen, P.J., Kaymak, U.: Improved covarianceestimation for Gustafson-Kessel clustering. In: Proceedings of the2002 IEEE international conference on fuzzy systems, vol 2. IEEE,pp. 1081–1085 (2002)
31. Kruse, R., Döring, C., Lesot, M.J.: Fundamentals of fuzzy clus-tering. In: Oliveira, J.V., Pedrycz, W. (eds.) Advances in fuzzyclustering and its applications, pp. 3–30. Wiley, Chichester (2007)
32. Dave, R.N.: Characterization and detection of noise in clustering.Pattern Recogn. Lett. 12(11), 657–664 (1991)
33. Krishnapuram, R., Keller, J.M.: The possibilistic c-means algo-rithm: insights and recommendations. IEEE Trans. Fuzzy Syst.4(3), 385–393 (1996)
34. Pal, N.R., Pal, K., Bezdek, J.C.: A mixed c-means clustering model.In: Proceedings of the 6th IEEE international conference on fuzzysystems, vol 1. IEEE, pp. 11–21 (1997)
35. Timm, H., Borgelt, C., Kruse, R.: Fuzzy cluster analysis withcluster repulsion. CiteSeerX
β . http://citeseerx.ist.psu.edu/viewdoc/summary?doi=10.1.1.100.9787 (2001). Accessed 16 November2012
36. Pal, N.R., Pal, K., Keller, J.M., Bezdek, J.C.: A possibilistic fuzzyc-means clustering algorithm. IEEE T Fuzzy Syst. 13(4), 517–530(2005)
37. Daniels, J.D. (ed.): Ground-penetrating radar, 2nd edn. The Insti-tution of Electrical Engineers, London (2004)
38. Jol, H. (ed.): Ground penetrating radar: theory and applications, 1stedn. Elsevier Science, Amsterdam, Oxford (2009)
39. Maierhofer, C., Röllig, M.: Application of active thermography tothe detection of safety relevant defects in civil engineering struc-tures. In: Proceedings OPTO 2009 & IRS2 2009. AMA, pp. 215–220 (2009)
40. Maldague, X.P., Marinetti, S.: Pulse phase infrared thermography.J. Appl. Phys. 79, 2694–2698 (1996)
41. Arndt, R.: Square pulse thermography in frequency domain.SPIE Digital Library. http://proceedings.spiedigitallibrary.org/proceeding.aspx?articleid=834339 (2008). Accessed 13 Septem-ber 2012
42. Vavilov, V., Burleigh, D.: Heat transfer. In: Maldague, X., Moore,P.O. (eds.) Nondestructive handbook, infrared and thermal testing,vol. 3, 3rd edn. ASNT Press, Columbus (2001)
43. Weritz, F., Arndt, R., Röllig, M., Maierhofer, C., Wiggenhauser, H.:Investigation of concrete structures with pulse phase thermography.Mater. Struct. 38, 843–849 (2005)
44. Altman, D.G., Bland, J.M.: Statistics notes: diagnostic tests 1: sen-sitivity and specificity. BMJ 308, 1552 (1994)
45. Cotic, P., Jaglicic, Z., Bosiljkov, V., Niederleithinger, E.: GPR andIR thermography for near-surface defect detection in building struc-tures. In: Grum, J. (ed.) Proceedings of the 12th international con-ference of the Slovenian society for non-destructive testing, Appli-cation of Contemporary Non-Destructive Testing in Engineering.Slovenian Society for Nondestructive testing, Ljubljana (2013)
46. Shafer, G.: A mathematical theory of evidence. Princeton Univer-sity Press, Princeton (1976)
47. Stoppel, M., Taffe, A., Wiggenhauser, H., Kurz, J.H., Boller, C.:Automated multi-sensor systems in civil engineering for conditionassessment of concrete structures. In: Grantham, M. (ed.) Proceed-ings of the 4th International Conference on Concrete Repair, pp.397–403. CRC Press, Boca Raton (2011)
48. Krause, H.J., Rath, E., Sawade, G., Dumat, F.: Radar-Magnet-Betontest: Eine neue Methode zur Bestimmung der Feuchte unddes Chloridgehalts von Brückenfahrbahnplatten aus Beton. Beton-und Stahlbetonbau 102(12), 825–834 (2007)
49. Reichling, K., Raupach, M., Wiggenhauser, H., Stoppel, M., Dob-mann, G., Kurz, J.: BETOSCAN: an instrumented mobile robotsystem for the diagnosis of reinforced concrete floors. Restor.Build. Monum. 15(4), 277–286 (2009)
123