image quality assessment of high-resolution satellite
TRANSCRIPT
Image Quality Assessment of High-resolution Satellite Images With MTF-based Fuzzy
Comprehensive Evaluation Method
Wu Zhaocong1, Luo Zhipeng1, Zhang Yi1,*, Guo Feifei1, He Lin1
1 School of Remote Sensing and Information Engineering, Wuhan University, Wuhan, China.
KEY WORDS: Image Quality Assessment, High-resolution Satellite Images, MTF, Fuzzy Comprehensive Evaluation.
ABSTRACT:
A Modulation Transfer Function (MTF)-based fuzzy comprehensive evaluation method was proposed in this paper for the purpose of
evaluating high-resolution satellite image quality. To establish the factor set, two MTF features and seven radiant features were
extracted from the knife-edge region of image patch, which included Nyquist, MTF0.5, entropy, peak signal to noise ratio (PSNR),
average difference, edge intensity, average gradient, contrast and ground spatial distance (GSD). After analyzing the statistical
distribution of above features, a fuzzy evaluation threshold table and fuzzy evaluation membership functions was established. The
experiments for comprehensive quality assessment of different natural and artificial objects was done with GF2 image patches. The
results showed that the calibration field image has the highest quality scores. The water image has closest image quality to the
calibration field, quality of building image is a little poor than water image, but much higher than farmland image. In order to test the
influence of different features on quality evaluation, the experiment with different weights were tested on GF2 and SPOT7 images.
The results showed that different weights correspond different evaluating effectiveness. In the case of setting up the weights of edge
features and GSD, the image quality of GF2 is better than SPOT7. However, when setting MTF and PSNR as main factor, the image
quality of SPOT7 is better than GF2.
1. INTRODUCTION
Image quality has great effects on applications of high-resolution
satellite data, like visual reconstruction, remote sensing
interpretation and production of digital orthophoto map (DOM)
(Li L, 2015). How to evaluate the quality of high-resolution
remote sensing image scientifically and effectively has become a
hot research direction.
Traditional image quality evaluation includes subjective
evaluation and objective evaluation. For the subjective
evaluation, relevant experts evaluate the satellite image quality
through observing the image and concluding the quality score
based on certain evaluation criteria. The most commonly used
subjective evaluation method is National Imagery Interpretability
Rating Scale (NIIRS) (Irvine J M, 1997). On the other hand,
objective quality evaluation is mostly achieved by analyzing
variable quality indicators of remote sensing image, including
noise (Wang Y, 2003), gray statistic, texture (Sun Z, 2010),
definition (Wang R B, 2015), MTF (Miao Z, 2014) and so on.
In particularly, MTF is an important indicator of the quality of
remote sensing image. It reflects the attenuation of image
frequency domain after imaging. The measurement of on-orbit
MTF is mostly based on the analysis of edges in the satellite
images. The edge based MTF extraction has been added to ISO
Standard 12233 (ISO, 2000). The edges are usually extracted
from two kinds of surface targets, like artificial architectures and
natural surfaces. For example, the MTF measurement of French
SPOT was based on the grassy field boundary (Leger D, 2003).
The MTF test for U.S. IKONOS was done by use of an artificial
checkerboard target and a target painted with black-and-white
bars as fringe objects (Choi T, 2002). In general, MTF is one of
the most practical and commonly used indexes for the quality
evaluation of remote sensing images. As the knife-edge area of
high-resolution remote sensing images is easier to be extracted,
MTF is very suitable for the quality evaluation of high resolution
images.
Compared to the middle and low spatial resolution images, high
spatial resolution satellite images contain more architectural
features of natural and artificial objects. The diverse and
heterogeneous terrain characteristics bring about challenges in
image quality feature extraction. Meanwhile, the haze and mist
near the surface results in the visual effect of a loss of contrast in
the subject, which could be a main factor of image quality
deterioration. In addition, the previous methods for satellite
image quality evaluation only use certain indices and lack the
comprehensive evaluation of the image spectral and imaging
quality. For examples, in the paper (Crespi M, 2009), the feature
parameters such as SGD, SNR, MTF were used to evaluate high
resolution image quality of Quickbird, WorldView-1 and
Cartosat-1 respectively. By using of statistical analysis method,
researchers evaluate the characteristics of imagery of IKONOS
(Pagnutti M, 2003), ZY-3 (Xu X, 2012), and ALOS (He Y H,
2008) satellites. However, the comprehensive quality evaluation
of high-resolution satellite image is rarely studied. Wang Rong
Lin proposed a comprehensive evaluation method to evaluate
image quality of Landsat TM (Wang R B, 2014). This method
used a fuzzy evaluation function to calculate a qualitative
The International Archives of the Photogrammetry, Remote Sensing and Spatial Information Sciences, Volume XLII-3, 2018 ISPRS TC III Mid-term Symposium “Developments, Technologies and Applications in Remote Sensing”, 7–10 May, Beijing, China
This contribution has been peer-reviewed. https://doi.org/10.5194/isprs-archives-XLII-3-1907-2018 | © Authors 2018. CC BY 4.0 License.
1907
evaluation score by fully considering feature indices of gray
distribution, information entropy, definition, resolution, noise,
cloud, and invalid pixel. The paper showed that fuzzy evaluation
can accurately evaluate the quality of remote sensing images with
good consistency with human eye evaluation.
In this study, we propose to assess the image quality of high-
resolution satellite images by using of an efficient fuzzy
comprehensive quality evaluation method, and we consider
image features like MTF, information entropy, PSNR, average
difference, the intensity of edge, average gradient, contrast and
GSD. Two experiments were carried out with GF2 and SPOT7
panchromatic images, the results show the robustness and
effectiveness of this method, and it can provide reliable reference
for quality evaluation of GF2 images.
This paper is structured as follows. Section 2 presents the MTF
and radiant features extracted from remote sensing images and
their impacts on image quality. Section 3 introduces the principle
of fuzzy comprehensive evaluation method and how to take use
of it to evaluate image quality. Section 4 gives the satellite image
information and describes the experimental process. Section 5
presents different experimental settings and results. Finally, the
analyses are tied together with conclusions for the proposed
MTF-based fuzzy comprehensive evaluation method.
2. MTF AND RADIANT FEATURES
The spatial and spectral image features are extracted from
remote sensing images. They are used to build the fuzzy set of
fuzzy comprehensive evaluation function. The MTF represents
the frequency characteristics of satellite image, and the radiation
features describe the statistics and the spatial variations of images.
All of these features reflect the imaging quality from different
aspects, and they are extracted from the knife-edge regions of
remote sensing image patches.
2.1 MTF Features
The value of the modulation transfer function represents the
ability of the optical imaging system to redistribute radiant
energy (Javan F D, 2013). During the process of satellite imaging,
the energy of surface reflection and radiation would attenuate
after across the satellite optical imaging system, while using
MTF can describe the attenuation of radiation energy from the
frequency domain.
In physical optics, the definition of MTF is the ratio of output and
input modulation, as Eq. (2-1) shows, 𝑀𝑖𝑛(𝑓) is the input
modulation and 𝑀𝑜𝑢𝑡(𝑓) is the output modulation, 𝑓 is the
frequency. The modulation expresses the brightness contrast of
image, as Eq. (2-2) shows. 𝑉𝑚𝑎𝑥 and 𝑉𝑚𝑖𝑛 are the maximum
and minimum signals brightness respectively. Since the output
modulation of the imaging system is always less than the input
modulation, the MTF value is between 0 and 1. The larger the
MTF, the smaller the difference between image and targets,
which means that the performance of the imaging system is
closer to perfect.
MTF(𝑓) =𝑀𝑜𝑢𝑡(𝑓)
𝑀𝑖𝑛(𝑓) (2-1)
M =𝑉𝑚𝑎𝑥−𝑉𝑚𝑖𝑛
𝑉𝑚𝑎𝑥+𝑉𝑚𝑖𝑛 (2-2)
However, it is difficult to calculate the input modulation, so the
researchers proposed several methods to measure the MTF
function indirectly, including the point source method (Leger D,
2003), the pulse method (Choi T, 2002), the knife-edge method
(Javan F D, 2013) and so on. The measurement of on-orbit MTF
is mostly based on the analysis of natural and artificial edges in
the satellite sensing images which is easier than other methods,
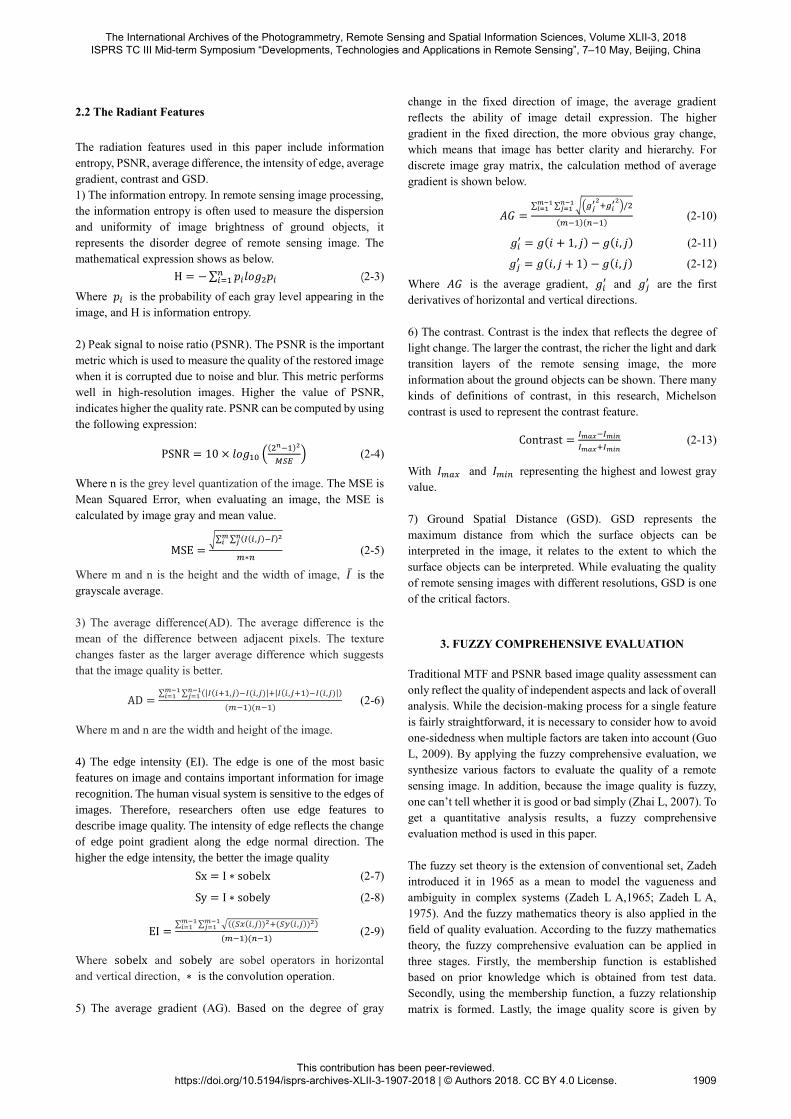
so we use the knife-edge method in this research. Firstly, a knife-
edge region should be chosen from the remote sensing image.
Then, the accurate edge location is estimated after taking a one-
dimensional derivative of each row data and finding the centroid
to a subpixel accuracy. Next, sub-pixel sampling the edge buffer
area. After projecting the sub-pixels onto the gradient direction
of the knife edge, the discrete Edge Spread Function (ESF) is
obtained. Then, the derivative of ESF yields the line spread
function(LSF). Finally, performing a discrete fourier transform,
and normalizing, the MTF over a range of horizontal spatial
frequencies beyond the Nyquist frequency can be estimated
(Maasaoka K, 2014). The calculation results on the calibration
field are shown in figure.1.
(a). GF2 edge region (b). ESF curve
(c) LSF curve (d) MTF curve
Figure 1. The process of MTF calculation
In addition, two image quality features based on MTF curves are
calculated. The first feature is Nyquist which is the MTF value
where normalized frequency is 0.5. It is often used as a parameter
for the design and performance evaluation of cameras. Otherwise,
Nyquist value also reflects the sharpness of the target image. The
second is MTF0.5. It is the frequency value where MTF is 0.5.
While the MTF0.5 is often shown in the lower frequency part in
practice, it reflects the contrast on the target image.
The International Archives of the Photogrammetry, Remote Sensing and Spatial Information Sciences, Volume XLII-3, 2018 ISPRS TC III Mid-term Symposium “Developments, Technologies and Applications in Remote Sensing”, 7–10 May, Beijing, China
This contribution has been peer-reviewed. https://doi.org/10.5194/isprs-archives-XLII-3-1907-2018 | © Authors 2018. CC BY 4.0 License.
1908
2.2 The Radiant Features
The radiation features used in this paper include information
entropy, PSNR, average difference, the intensity of edge, average
gradient, contrast and GSD.
1) The information entropy. In remote sensing image processing,
the information entropy is often used to measure the dispersion
and uniformity of image brightness of ground objects, it
represents the disorder degree of remote sensing image. The
mathematical expression shows as below.
H = − ∑ 𝑝𝑖𝑙𝑜𝑔2𝑝𝑖𝑛𝑖=1 (2-3)
Where 𝑝𝑖 is the probability of each gray level appearing in the
image, and H is information entropy.
2) Peak signal to noise ratio (PSNR). The PSNR is the important
metric which is used to measure the quality of the restored image
when it is corrupted due to noise and blur. This metric performs
well in high-resolution images. Higher the value of PSNR,
indicates higher the quality rate. PSNR can be computed by using
the following expression:
PSNR = 10 × 𝑙𝑜𝑔10 ((2𝑛−1)2
𝑀𝑆𝐸) (2-4)
Where n is the grey level quantization of the image. The MSE is
Mean Squared Error, when evaluating an image, the MSE is
calculated by image gray and mean value.
MSE =√∑ ∑ (𝐼(𝑖,𝑗)−𝐼)̅2𝑛
𝑗𝑚𝑖
𝑚∗𝑛 (2-5)
Where m and n is the height and the width of image, 𝐼 ̅ is the
grayscale average.
3) The average difference(AD). The average difference is the
mean of the difference between adjacent pixels. The texture
changes faster as the larger average difference which suggests
that the image quality is better.
AD =∑ ∑ (|𝐼(𝑖+1,𝑗)−𝐼(𝑖,𝑗)|+|𝐼(𝑖,𝑗+1)−𝐼(𝑖,𝑗)|)𝑛−1
𝑗=1𝑚−1𝑖=1
(𝑚−1)(𝑛−1) (2-6)
Where m and n are the width and height of the image.
4) The edge intensity (EI). The edge is one of the most basic
features on image and contains important information for image
recognition. The human visual system is sensitive to the edges of
images. Therefore, researchers often use edge features to
describe image quality. The intensity of edge reflects the change
of edge point gradient along the edge normal direction. The
higher the edge intensity, the better the image quality
Sx = I ∗ sobelx (2-7)
Sy = I ∗ sobely (2-8)
EI =∑ ∑ √((𝑆𝑥(𝑖,𝑗))2+(𝑆𝑦(𝑖,𝑗))2)𝑚−1
𝑗=1𝑚−1𝑖=1
(𝑚−1)(𝑛−1) (2-9)
Where sobelx and sobely are sobel operators in horizontal
and vertical direction, ∗ is the convolution operation.
5) The average gradient (AG). Based on the degree of gray
change in the fixed direction of image, the average gradient
reflects the ability of image detail expression. The higher
gradient in the fixed direction, the more obvious gray change,
which means that image has better clarity and hierarchy. For
discrete image gray matrix, the calculation method of average
gradient is shown below.
𝐴𝐺 =∑ ∑ √(𝑔𝑗
′2+𝑔𝑖
′2)/2𝑛−1
𝑗=1𝑚−1𝑖=1
(𝑚−1)(𝑛−1) (2-10)
𝑔𝑖′ = 𝑔(𝑖 + 1, 𝑗) − 𝑔(𝑖, 𝑗) (2-11)
𝑔𝑗′ = 𝑔(𝑖, 𝑗 + 1) − 𝑔(𝑖, 𝑗) (2-12)
Where 𝐴𝐺 is the average gradient, 𝑔𝑖′ and 𝑔𝑗
′ are the first
derivatives of horizontal and vertical directions.
6) The contrast. Contrast is the index that reflects the degree of
light change. The larger the contrast, the richer the light and dark
transition layers of the remote sensing image, the more
information about the ground objects can be shown. There many
kinds of definitions of contrast, in this research, Michelson
contrast is used to represent the contrast feature.
Contrast =𝐼𝑚𝑎𝑥−𝐼𝑚𝑖𝑛
𝐼𝑚𝑎𝑥+𝐼𝑚𝑖𝑛 (2-13)
With 𝐼𝑚𝑎𝑥 and 𝐼𝑚𝑖𝑛 representing the highest and lowest gray
value.
7) Ground Spatial Distance (GSD). GSD represents the
maximum distance from which the surface objects can be
interpreted in the image, it relates to the extent to which the
surface objects can be interpreted. While evaluating the quality
of remote sensing images with different resolutions, GSD is one
of the critical factors.
3. FUZZY COMPREHENSIVE EVALUATION
Traditional MTF and PSNR based image quality assessment can
only reflect the quality of independent aspects and lack of overall
analysis. While the decision-making process for a single feature
is fairly straightforward, it is necessary to consider how to avoid
one-sidedness when multiple factors are taken into account (Guo
L, 2009). By applying the fuzzy comprehensive evaluation, we
synthesize various factors to evaluate the quality of a remote
sensing image. In addition, because the image quality is fuzzy,
one can’t tell whether it is good or bad simply (Zhai L, 2007). To
get a quantitative analysis results, a fuzzy comprehensive
evaluation method is used in this paper.
The fuzzy set theory is the extension of conventional set, Zadeh
introduced it in 1965 as a mean to model the vagueness and
ambiguity in complex systems (Zadeh L A,1965; Zadeh L A,
1975). And the fuzzy mathematics theory is also applied in the
field of quality evaluation. According to the fuzzy mathematics
theory, the fuzzy comprehensive evaluation can be applied in
three stages. Firstly, the membership function is established
based on prior knowledge which is obtained from test data.
Secondly, using the membership function, a fuzzy relationship
matrix is formed. Lastly, the image quality score is given by
The International Archives of the Photogrammetry, Remote Sensing and Spatial Information Sciences, Volume XLII-3, 2018 ISPRS TC III Mid-term Symposium “Developments, Technologies and Applications in Remote Sensing”, 7–10 May, Beijing, China
This contribution has been peer-reviewed. https://doi.org/10.5194/isprs-archives-XLII-3-1907-2018 | © Authors 2018. CC BY 4.0 License.
1909
fuzzy comprehensive evaluation. The following is the principle
procedures of it.
3.1 The Factor Set
The factor set consists of various factors affecting the evaluation
objective. In this study, nine image features mentioned above
constitute a fuzzy set. Assuming that U = {𝑢1, 𝑢2, 𝑢3, ⋯ , 𝑢𝑚} is
the fuzzy set, each factor 𝑢𝑖 represents the evaluation feature
and 𝑢𝑖 can be divided further. Besides, five assessment grades
are determined: excellent (𝑣1), good (𝑣2), fair (𝑣3), poor (𝑣4),
very bad (𝑣5). The quality grades set V = {𝑣1, 𝑣2, 𝑣3, 𝑣4, 𝑣5} is
determined by the experimental subject.
The fuzzy set is calculated by the membership function and the
fuzzy relationship matrix is obtained. The element 𝑟𝑖𝑗 of fuzzy
relationship matrix R is the degree of membership on 𝑢𝑖 to 𝑣𝑗 .
R = (𝑟11 𝑟12 𝑟13 𝑟14 𝑟1𝑛𝑟21 𝑟22 𝑟23 𝑟24 𝑟2𝑛
⋮ ⋮ ⋮ ⋮ ⋮𝑟𝑚1 𝑟𝑚2 𝑟𝑚3 𝑟𝑚4 𝑟𝑚𝑛
) (3-1)
3.2 The Weight Set
In the fuzzy comprehensive evaluation, every evaluation feature
has different contribution to image quality. Thus, the weight
W = {𝑤1, 𝑤2, 𝑤3, ⋯ , 𝑤𝑚} represents the different influence
on the decision-making of every image features. The value of
weight W is obtained by prior experience and preliminary
experiments.
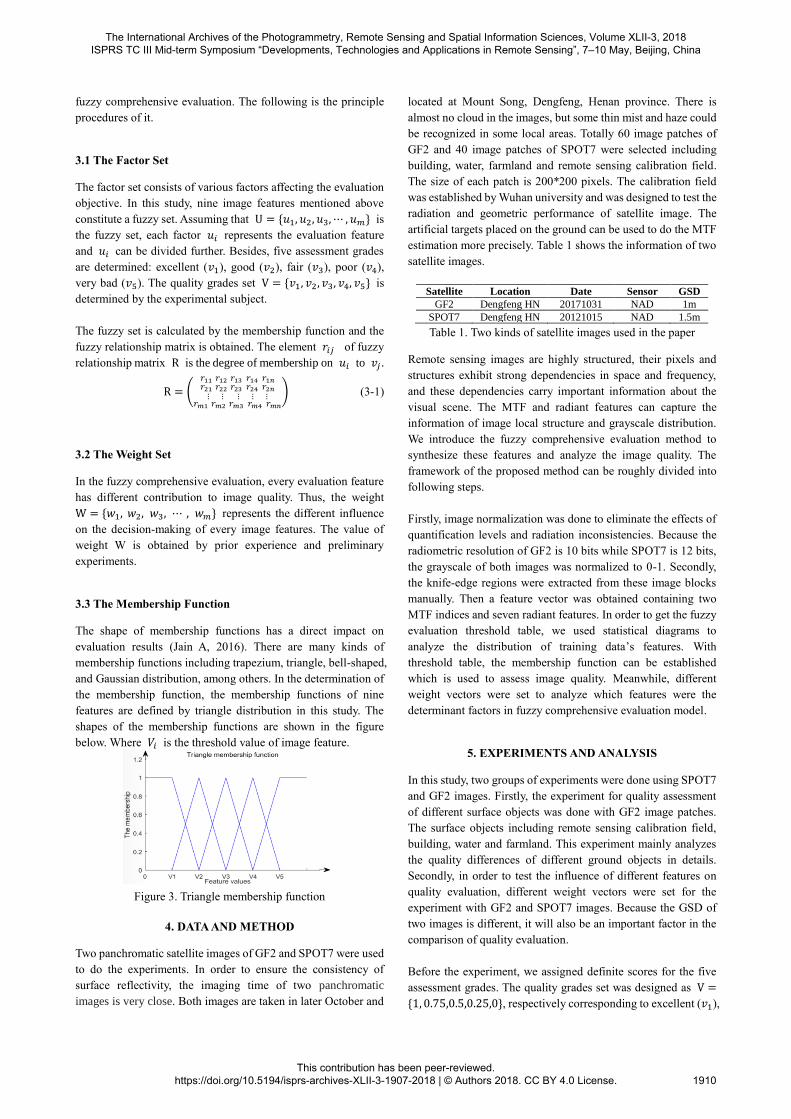
3.3 The Membership Function
The shape of membership functions has a direct impact on
evaluation results (Jain A, 2016). There are many kinds of
membership functions including trapezium, triangle, bell-shaped,
and Gaussian distribution, among others. In the determination of
the membership function, the membership functions of nine
features are defined by triangle distribution in this study. The
shapes of the membership functions are shown in the figure
below. Where 𝑉𝑖 is the threshold value of image feature.
Figure 3. Triangle membership function
4. DATA AND METHOD
Two panchromatic satellite images of GF2 and SPOT7 were used
to do the experiments. In order to ensure the consistency of
surface reflectivity, the imaging time of two panchromatic
images is very close. Both images are taken in later October and
located at Mount Song, Dengfeng, Henan province. There is
almost no cloud in the images, but some thin mist and haze could
be recognized in some local areas. Totally 60 image patches of
GF2 and 40 image patches of SPOT7 were selected including
building, water, farmland and remote sensing calibration field.
The size of each patch is 200*200 pixels. The calibration field
was established by Wuhan university and was designed to test the
radiation and geometric performance of satellite image. The
artificial targets placed on the ground can be used to do the MTF
estimation more precisely. Table 1 shows the information of two
satellite images.
Satellite Location Date Sensor GSD
GF2 Dengfeng HN 20171031 NAD 1m
SPOT7 Dengfeng HN 20121015 NAD 1.5m
Table 1. Two kinds of satellite images used in the paper
Remote sensing images are highly structured, their pixels and
structures exhibit strong dependencies in space and frequency,
and these dependencies carry important information about the
visual scene. The MTF and radiant features can capture the
information of image local structure and grayscale distribution.
We introduce the fuzzy comprehensive evaluation method to
synthesize these features and analyze the image quality. The
framework of the proposed method can be roughly divided into
following steps.
Firstly, image normalization was done to eliminate the effects of
quantification levels and radiation inconsistencies. Because the
radiometric resolution of GF2 is 10 bits while SPOT7 is 12 bits,
the grayscale of both images was normalized to 0-1. Secondly,
the knife-edge regions were extracted from these image blocks
manually. Then a feature vector was obtained containing two
MTF indices and seven radiant features. In order to get the fuzzy
evaluation threshold table, we used statistical diagrams to
analyze the distribution of training data’s features. With
threshold table, the membership function can be established
which is used to assess image quality. Meanwhile, different
weight vectors were set to analyze which features were the
determinant factors in fuzzy comprehensive evaluation model.
5. EXPERIMENTS AND ANALYSIS
In this study, two groups of experiments were done using SPOT7
and GF2 images. Firstly, the experiment for quality assessment
of different surface objects was done with GF2 image patches.
The surface objects including remote sensing calibration field,
building, water and farmland. This experiment mainly analyzes
the quality differences of different ground objects in details.
Secondly, in order to test the influence of different features on
quality evaluation, different weight vectors were set for the
experiment with GF2 and SPOT7 images. Because the GSD of
two images is different, it will also be an important factor in the
comparison of quality evaluation.
Before the experiment, we assigned definite scores for the five
assessment grades. The quality grades set was designed as V =
{1, 0.75,0.5,0.25,0}, respectively corresponding to excellent (𝑣1),
The International Archives of the Photogrammetry, Remote Sensing and Spatial Information Sciences, Volume XLII-3, 2018 ISPRS TC III Mid-term Symposium “Developments, Technologies and Applications in Remote Sensing”, 7–10 May, Beijing, China
This contribution has been peer-reviewed. https://doi.org/10.5194/isprs-archives-XLII-3-1907-2018 | © Authors 2018. CC BY 4.0 License.
1910
good (𝑣2), fair (𝑣3), poor (𝑣4) and very bad (𝑣5). Besides, the
fuzzy evaluation threshold table needs to be determined in
advance, it is a key component to construct the fuzzy membership
function. Twenty GF2 patches and twenty SPOT7 patches were
selected to make up the training set. And the training set contains
the above four types of ground objects. The feature vectors were
extracted from these patches. By statistical analysis of the feature
vectors, the fuzzy evaluation threshold table was obtained.
Features excellent good fair poor very bad
Nyquist 0.100 0.050 0.030 0.010 0.005
MTF0.5 0.300 0.240 0.198 0.120 0.005
Entropy 4.450 3.943 3.643 3.100 2.800
PSNR 38.80 32.98 30.84 23.10 15.00
AD 0.0200 0.0086 0.0074 0.0051 0.0044
EI 0.226 0.084 0.063 0.035 0.026
AG 0.0180 0.0077 0.0064 0.0045 0.0041
Contrast 0.532 0.379 0.307 0.187 0.148
GSD 1 3 10 30 100
Table 2. The fuzzy evaluation threshold table
As we can see from table 2, since the image grayscale was
normalized to 0-1, the feature values from the images with
different grayscale magnitudes are comparable.
A. GF2 Image Quality Comprehensive Evaluation
There are 30 GF2 image patches used in this quality
comprehensive evaluation experiment, which contain 10 patches
of building, 10 patches of farmland and 10 patches of water.
When extracting knife-edge regions, same patch is extracted
artificially four times repeatedly. The evaluation score was
obtained by putting the feature vector into the fuzzy membership
function. Finally, in order to reduce random error, the mean score
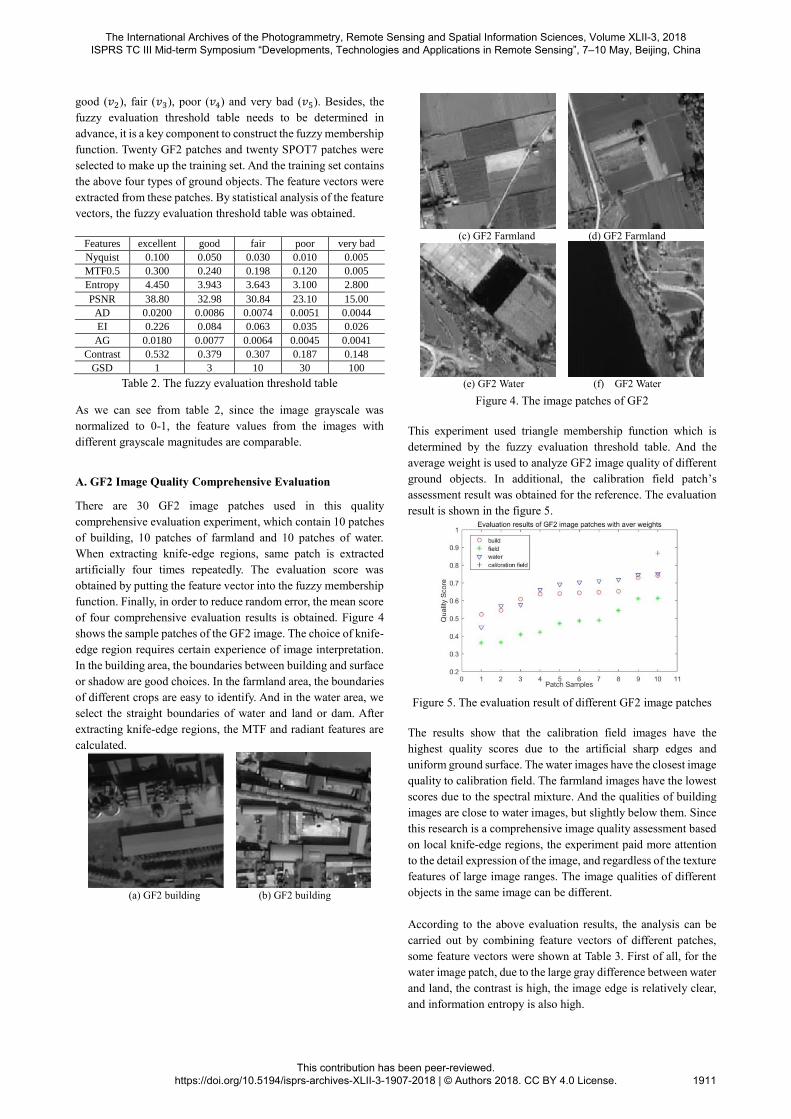
of four comprehensive evaluation results is obtained. Figure 4
shows the sample patches of the GF2 image. The choice of knife-
edge region requires certain experience of image interpretation.
In the building area, the boundaries between building and surface
or shadow are good choices. In the farmland area, the boundaries
of different crops are easy to identify. And in the water area, we
select the straight boundaries of water and land or dam. After
extracting knife-edge regions, the MTF and radiant features are
calculated.
(a) GF2 building (b) GF2 building
(c) GF2 Farmland (d) GF2 Farmland
(e) GF2 Water (f) GF2 Water
Figure 4. The image patches of GF2
This experiment used triangle membership function which is
determined by the fuzzy evaluation threshold table. And the
average weight is used to analyze GF2 image quality of different
ground objects. In additional, the calibration field patch’s
assessment result was obtained for the reference. The evaluation
result is shown in the figure 5.
Figure 5. The evaluation result of different GF2 image patches
The results show that the calibration field images have the
highest quality scores due to the artificial sharp edges and
uniform ground surface. The water images have the closest image
quality to calibration field. The farmland images have the lowest
scores due to the spectral mixture. And the qualities of building
images are close to water images, but slightly below them. Since
this research is a comprehensive image quality assessment based
on local knife-edge regions, the experiment paid more attention
to the detail expression of the image, and regardless of the texture
features of large image ranges. The image qualities of different
objects in the same image can be different.
According to the above evaluation results, the analysis can be
carried out by combining feature vectors of different patches,
some feature vectors were shown at Table 3. First of all, for the
water image patch, due to the large gray difference between water
and land, the contrast is high, the image edge is relatively clear,
and information entropy is also high.
The International Archives of the Photogrammetry, Remote Sensing and Spatial Information Sciences, Volume XLII-3, 2018 ISPRS TC III Mid-term Symposium “Developments, Technologies and Applications in Remote Sensing”, 7–10 May, Beijing, China
This contribution has been peer-reviewed. https://doi.org/10.5194/isprs-archives-XLII-3-1907-2018 | © Authors 2018. CC BY 4.0 License.
1911
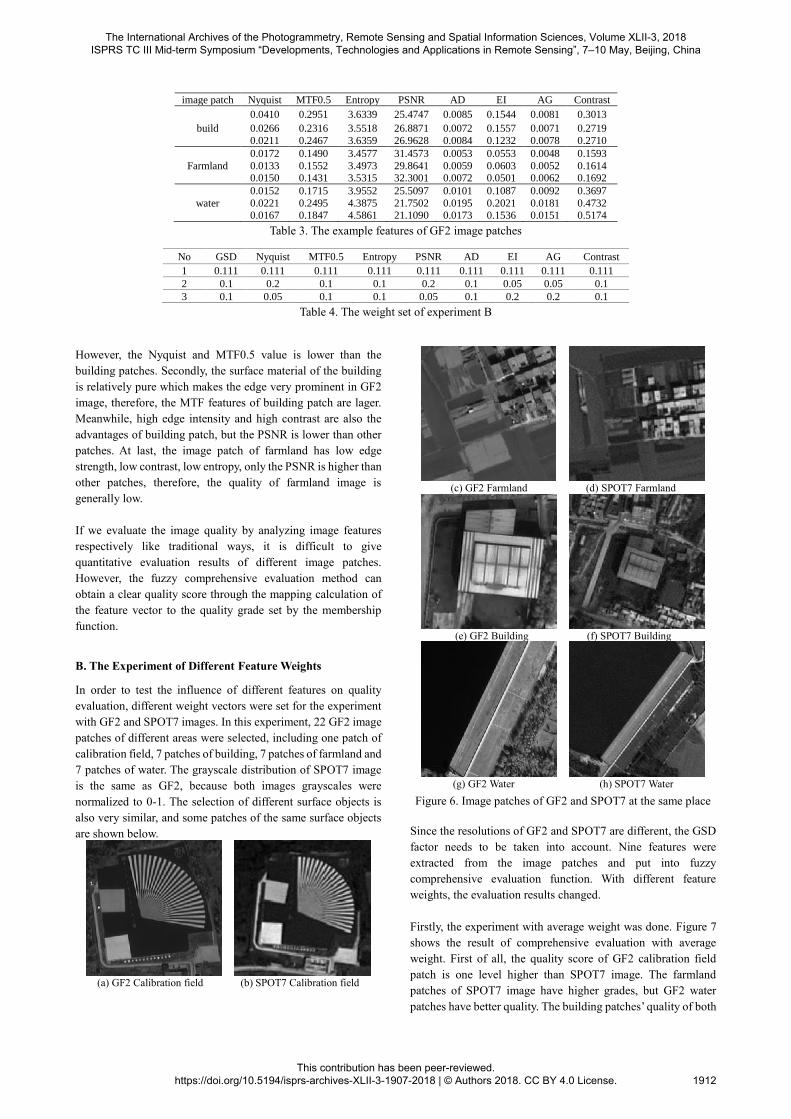
image patch Nyquist MTF0.5 Entropy PSNR AD EI AG Contrast
0.0410 0.2951 3.6339 25.4747 0.0085 0.1544 0.0081 0.3013
build 0.0266 0.2316 3.5518 26.8871 0.0072 0.1557 0.0071 0.2719
0.0211 0.2467 3.6359 26.9628 0.0084 0.1232 0.0078 0.2710
0.0172 0.1490 3.4577 31.4573 0.0053 0.0553 0.0048 0.1593
Farmland 0.0133 0.1552 3.4973 29.8641 0.0059 0.0603 0.0052 0.1614 0.0150 0.1431 3.5315 32.3001 0.0072 0.0501 0.0062 0.1692
0.0152 0.1715 3.9552 25.5097 0.0101 0.1087 0.0092 0.3697
water 0.0221 0.2495 4.3875 21.7502 0.0195 0.2021 0.0181 0.4732 0.0167 0.1847 4.5861 21.1090 0.0173 0.1536 0.0151 0.5174
Table 3. The example features of GF2 image patches
No GSD Nyquist MTF0.5 Entropy PSNR AD EI AG Contrast
1 0.111 0.111 0.111 0.111 0.111 0.111 0.111 0.111 0.111
2 0.1 0.2 0.1 0.1 0.2 0.1 0.05 0.05 0.1
3 0.1 0.05 0.1 0.1 0.05 0.1 0.2 0.2 0.1
Table 4. The weight set of experiment B
However, the Nyquist and MTF0.5 value is lower than the
building patches. Secondly, the surface material of the building
is relatively pure which makes the edge very prominent in GF2
image, therefore, the MTF features of building patch are lager.
Meanwhile, high edge intensity and high contrast are also the
advantages of building patch, but the PSNR is lower than other
patches. At last, the image patch of farmland has low edge
strength, low contrast, low entropy, only the PSNR is higher than
other patches, therefore, the quality of farmland image is
generally low.
If we evaluate the image quality by analyzing image features
respectively like traditional ways, it is difficult to give
quantitative evaluation results of different image patches.
However, the fuzzy comprehensive evaluation method can
obtain a clear quality score through the mapping calculation of
the feature vector to the quality grade set by the membership
function.
B. The Experiment of Different Feature Weights
In order to test the influence of different features on quality
evaluation, different weight vectors were set for the experiment
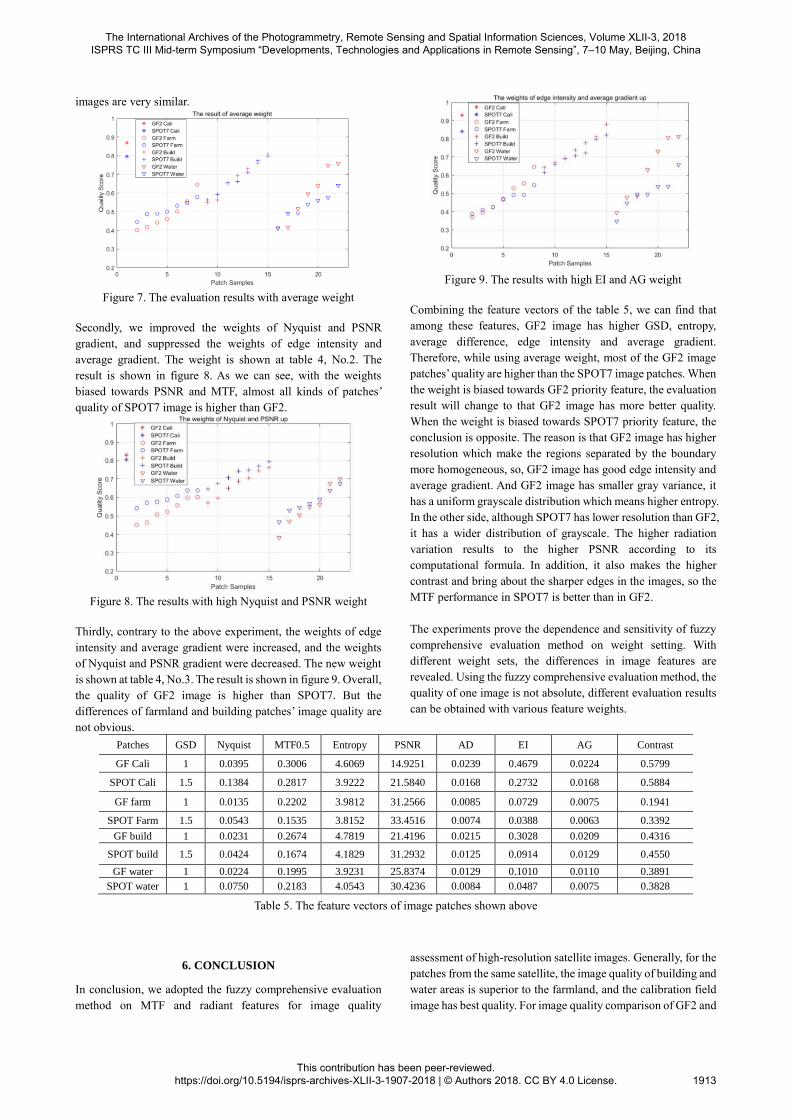
with GF2 and SPOT7 images. In this experiment, 22 GF2 image
patches of different areas were selected, including one patch of
calibration field, 7 patches of building, 7 patches of farmland and
7 patches of water. The grayscale distribution of SPOT7 image
is the same as GF2, because both images grayscales were
normalized to 0-1. The selection of different surface objects is
also very similar, and some patches of the same surface objects
are shown below.
(a) GF2 Calibration field (b) SPOT7 Calibration field
(c) GF2 Farmland (d) SPOT7 Farmland
(e) GF2 Building (f) SPOT7 Building
(g) GF2 Water (h) SPOT7 Water
Figure 6. Image patches of GF2 and SPOT7 at the same place
Since the resolutions of GF2 and SPOT7 are different, the GSD
factor needs to be taken into account. Nine features were
extracted from the image patches and put into fuzzy
comprehensive evaluation function. With different feature
weights, the evaluation results changed.
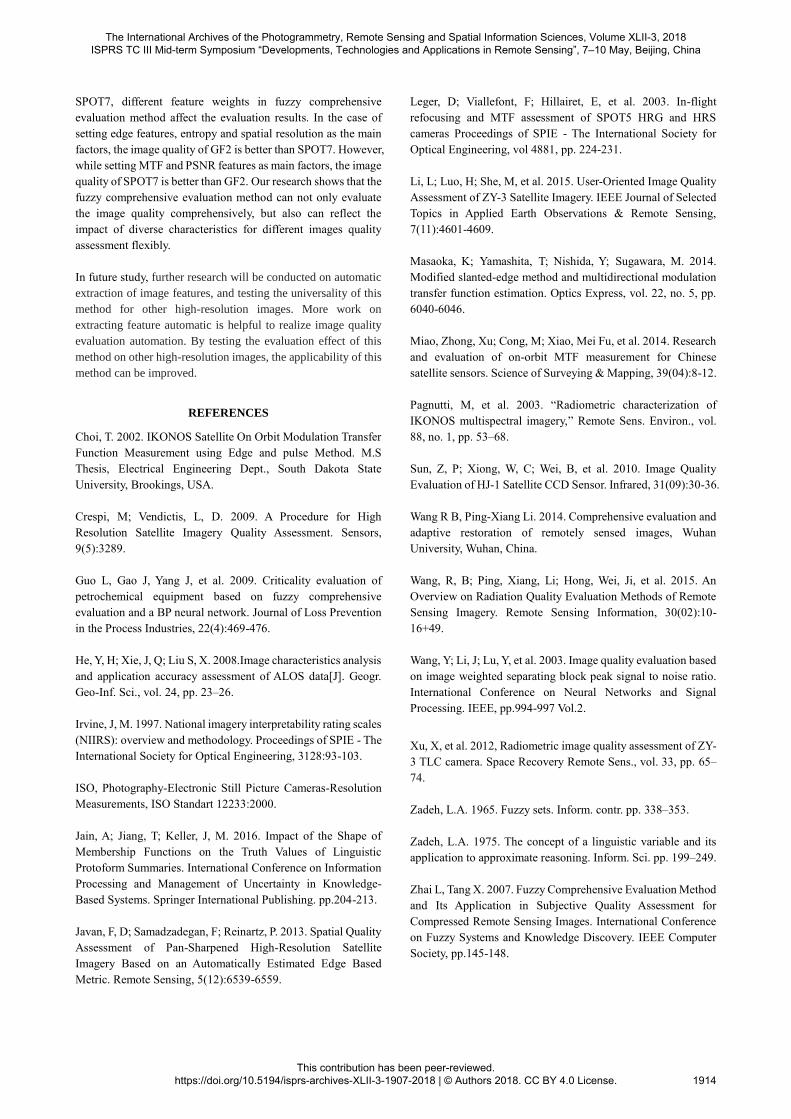
Firstly, the experiment with average weight was done. Figure 7
shows the result of comprehensive evaluation with average
weight. First of all, the quality score of GF2 calibration field
patch is one level higher than SPOT7 image. The farmland
patches of SPOT7 image have higher grades, but GF2 water
patches have better quality. The building patches’ quality of both
The International Archives of the Photogrammetry, Remote Sensing and Spatial Information Sciences, Volume XLII-3, 2018 ISPRS TC III Mid-term Symposium “Developments, Technologies and Applications in Remote Sensing”, 7–10 May, Beijing, China
This contribution has been peer-reviewed. https://doi.org/10.5194/isprs-archives-XLII-3-1907-2018 | © Authors 2018. CC BY 4.0 License.
1912
images are very similar.
Figure 7. The evaluation results with average weight
Secondly, we improved the weights of Nyquist and PSNR
gradient, and suppressed the weights of edge intensity and
average gradient. The weight is shown at table 4, No.2. The
result is shown in figure 8. As we can see, with the weights
biased towards PSNR and MTF, almost all kinds of patches’
quality of SPOT7 image is higher than GF2.
Figure 8. The results with high Nyquist and PSNR weight
Thirdly, contrary to the above experiment, the weights of edge
intensity and average gradient were increased, and the weights
of Nyquist and PSNR gradient were decreased. The new weight
is shown at table 4, No.3. The result is shown in figure 9. Overall,
the quality of GF2 image is higher than SPOT7. But the
differences of farmland and building patches’ image quality are
not obvious.
Figure 9. The results with high EI and AG weight
Combining the feature vectors of the table 5, we can find that
among these features, GF2 image has higher GSD, entropy,
average difference, edge intensity and average gradient.
Therefore, while using average weight, most of the GF2 image
patches’ quality are higher than the SPOT7 image patches. When
the weight is biased towards GF2 priority feature, the evaluation
result will change to that GF2 image has more better quality.
When the weight is biased towards SPOT7 priority feature, the
conclusion is opposite. The reason is that GF2 image has higher
resolution which make the regions separated by the boundary
more homogeneous, so, GF2 image has good edge intensity and
average gradient. And GF2 image has smaller gray variance, it
has a uniform grayscale distribution which means higher entropy.
In the other side, although SPOT7 has lower resolution than GF2,
it has a wider distribution of grayscale. The higher radiation
variation results to the higher PSNR according to its
computational formula. In addition, it also makes the higher
contrast and bring about the sharper edges in the images, so the
MTF performance in SPOT7 is better than in GF2.
The experiments prove the dependence and sensitivity of fuzzy
comprehensive evaluation method on weight setting. With
different weight sets, the differences in image features are
revealed. Using the fuzzy comprehensive evaluation method, the
quality of one image is not absolute, different evaluation results
can be obtained with various feature weights.
Patches GSD Nyquist MTF0.5 Entropy PSNR AD EI AG Contrast
GF Cali 1 0.0395 0.3006 4.6069 14.9251 0.0239 0.4679 0.0224 0.5799
SPOT Cali 1.5 0.1384 0.2817 3.9222 21.5840 0.0168 0.2732 0.0168 0.5884
GF farm 1 0.0135 0.2202 3.9812 31.2566 0.0085 0.0729 0.0075 0.1941
SPOT Farm 1.5 0.0543 0.1535 3.8152 33.4516 0.0074 0.0388 0.0063 0.3392
GF build 1 0.0231 0.2674 4.7819 21.4196 0.0215 0.3028 0.0209 0.4316
SPOT build 1.5 0.0424 0.1674 4.1829 31.2932 0.0125 0.0914 0.0129 0.4550
GF water 1 0.0224 0.1995 3.9231 25.8374 0.0129 0.1010 0.0110 0.3891
SPOT water 1 0.0750 0.2183 4.0543 30.4236 0.0084 0.0487 0.0075 0.3828
Table 5. The feature vectors of image patches shown above
6. CONCLUSION
In conclusion, we adopted the fuzzy comprehensive evaluation
method on MTF and radiant features for image quality
assessment of high-resolution satellite images. Generally, for the
patches from the same satellite, the image quality of building and
water areas is superior to the farmland, and the calibration field
image has best quality. For image quality comparison of GF2 and
The International Archives of the Photogrammetry, Remote Sensing and Spatial Information Sciences, Volume XLII-3, 2018 ISPRS TC III Mid-term Symposium “Developments, Technologies and Applications in Remote Sensing”, 7–10 May, Beijing, China
This contribution has been peer-reviewed. https://doi.org/10.5194/isprs-archives-XLII-3-1907-2018 | © Authors 2018. CC BY 4.0 License.
1913
SPOT7, different feature weights in fuzzy comprehensive
evaluation method affect the evaluation results. In the case of
setting edge features, entropy and spatial resolution as the main
factors, the image quality of GF2 is better than SPOT7. However,
while setting MTF and PSNR features as main factors, the image
quality of SPOT7 is better than GF2. Our research shows that the
fuzzy comprehensive evaluation method can not only evaluate
the image quality comprehensively, but also can reflect the
impact of diverse characteristics for different images quality
assessment flexibly.
In future study, further research will be conducted on automatic
extraction of image features, and testing the universality of this
method for other high-resolution images. More work on
extracting feature automatic is helpful to realize image quality
evaluation automation. By testing the evaluation effect of this
method on other high-resolution images, the applicability of this
method can be improved.
REFERENCES
Choi, T. 2002. IKONOS Satellite On Orbit Modulation Transfer
Function Measurement using Edge and pulse Method. M.S
Thesis, Electrical Engineering Dept., South Dakota State
University, Brookings, USA.
Crespi, M; Vendictis, L, D. 2009. A Procedure for High
Resolution Satellite Imagery Quality Assessment. Sensors,
9(5):3289.
Guo L, Gao J, Yang J, et al. 2009. Criticality evaluation of
petrochemical equipment based on fuzzy comprehensive
evaluation and a BP neural network. Journal of Loss Prevention
in the Process Industries, 22(4):469-476.
He, Y, H; Xie, J, Q; Liu S, X. 2008.Image characteristics analysis
and application accuracy assessment of ALOS data[J]. Geogr.
Geo-Inf. Sci., vol. 24, pp. 23–26.
Irvine, J, M. 1997. National imagery interpretability rating scales
(NIIRS): overview and methodology. Proceedings of SPIE - The
International Society for Optical Engineering, 3128:93-103.
ISO, Photography-Electronic Still Picture Cameras-Resolution
Measurements, ISO Standart 12233:2000.
Jain, A; Jiang, T; Keller, J, M. 2016. Impact of the Shape of
Membership Functions on the Truth Values of Linguistic
Protoform Summaries. International Conference on Information
Processing and Management of Uncertainty in Knowledge-
Based Systems. Springer International Publishing. pp.204-213.
Javan, F, D; Samadzadegan, F; Reinartz, P. 2013. Spatial Quality
Assessment of Pan-Sharpened High-Resolution Satellite
Imagery Based on an Automatically Estimated Edge Based
Metric. Remote Sensing, 5(12):6539-6559.
Leger, D; Viallefont, F; Hillairet, E, et al. 2003. In-flight
refocusing and MTF assessment of SPOT5 HRG and HRS
cameras Proceedings of SPIE - The International Society for
Optical Engineering, vol 4881, pp. 224-231.
Li, L; Luo, H; She, M, et al. 2015. User-Oriented Image Quality
Assessment of ZY-3 Satellite Imagery. IEEE Journal of Selected
Topics in Applied Earth Observations & Remote Sensing,
7(11):4601-4609.
Masaoka, K; Yamashita, T; Nishida, Y; Sugawara, M. 2014.
Modified slanted-edge method and multidirectional modulation
transfer function estimation. Optics Express, vol. 22, no. 5, pp.
6040-6046.
Miao, Zhong, Xu; Cong, M; Xiao, Mei Fu, et al. 2014. Research
and evaluation of on-orbit MTF measurement for Chinese
satellite sensors. Science of Surveying & Mapping, 39(04):8-12.
Pagnutti, M, et al. 2003. “Radiometric characterization of
IKONOS multispectral imagery,” Remote Sens. Environ., vol.
88, no. 1, pp. 53–68.
Sun, Z, P; Xiong, W, C; Wei, B, et al. 2010. Image Quality
Evaluation of HJ-1 Satellite CCD Sensor. Infrared, 31(09):30-36.
Wang R B, Ping-Xiang Li. 2014. Comprehensive evaluation and
adaptive restoration of remotely sensed images, Wuhan
University, Wuhan, China.
Wang, R, B; Ping, Xiang, Li; Hong, Wei, Ji, et al. 2015. An
Overview on Radiation Quality Evaluation Methods of Remote
Sensing Imagery. Remote Sensing Information, 30(02):10-
16+49.
Wang, Y; Li, J; Lu, Y, et al. 2003. Image quality evaluation based
on image weighted separating block peak signal to noise ratio.
International Conference on Neural Networks and Signal
Processing. IEEE, pp.994-997 Vol.2.
Xu, X, et al. 2012, Radiometric image quality assessment of ZY-
3 TLC camera. Space Recovery Remote Sens., vol. 33, pp. 65–
74.
Zadeh, L.A. 1965. Fuzzy sets. Inform. contr. pp. 338–353.
Zadeh, L.A. 1975. The concept of a linguistic variable and its
application to approximate reasoning. Inform. Sci. pp. 199–249.
Zhai L, Tang X. 2007. Fuzzy Comprehensive Evaluation Method
and Its Application in Subjective Quality Assessment for
Compressed Remote Sensing Images. International Conference
on Fuzzy Systems and Knowledge Discovery. IEEE Computer
Society, pp.145-148.
The International Archives of the Photogrammetry, Remote Sensing and Spatial Information Sciences, Volume XLII-3, 2018 ISPRS TC III Mid-term Symposium “Developments, Technologies and Applications in Remote Sensing”, 7–10 May, Beijing, China
This contribution has been peer-reviewed. https://doi.org/10.5194/isprs-archives-XLII-3-1907-2018 | © Authors 2018. CC BY 4.0 License.
1914