imagery is visible intelligence - esripress.esri.com · mount st. helens mount whitney grand canyon...
TRANSCRIPT

Something amazing and unexpected happened when humans ventured into outer space—we saw Earth for the very first time. In 1968, Apollo 8 astronauts observing the moon’s surface from lunar orbit turned their camera toward Earth and captured the first image of earthrise on the lunar horizon. They were awestruck as were millions of Americans watching the historic moment from their homes. In 1987, writer Frank White published The Overview Effect about the transformational impact of seeing Earth from space. White called it the “overview effect” —a sense of awe at Earth’s profound beauty, its borderless unity, and its fragile systems, protected and nourished by only a paper-thin atmosphere.
The exponential growth in the number of Earth-orbiting satellites provides us with remotely sensed views of Earth from space every hour of every day. These richly varied images, too, capture Earth’s extraordinary beauty in the reflected colors of the electromagnetic spectrum. With sensors detecting surface and atmospheric conditions, these images reveal the interconnected vulnerability of its many systems such as vegetation and climate. Finally, the absence of visible boundaries and borders provides a sense of unity that supersedes the differences that often divide us. Imagery deepens our understanding of past, present, and future phenomena because it continually expands our perspective with new insights into our world.
Imagery Is Visible IntelligenceA geographic Rosetta stone
01

4 Instructional Guide for The ArcGIS Imagery Book
Introductory activitiesVideo
Since videos motivate and inspire, as well as enhance discussion, go to the NASA: Best of “Earth As Art” video to see the top five Earth as Art images, as voted by the public. Landsat has been collecting data of the earth’s surface since 1972. Some of the images are visually striking, and the favorites have been selected for this collection.
To access the following videos go to video.esri.com.
Search for each video by the title.
NASA | Best of “Earth As Art” -- Top Five
NASA Goddard time=3.45 min
Counting down the Top Five Earth As Art images, as voted on by the public. Landsat has been collecting data of the Earth’s
http://www.youtube.com/watch?v=Tq88dRFokgg
NASA | Best of “Earth As Art” --Top Five

Chapter 1: Imagery Is Visible Intelligence 5
Activity 1.1 Show me my home!
2005: The human era of GIS begins
Location and place are two of the five themes of geography. Where is it located? What is it like there? These are the questions that organize space. With the availability of satellite and high- resolution aerial imagery, our perspective of location and place has never been greater. In this introductory activity, you will describe your location on Earth from three perspectives: your absolute location, your location within a regional boundary, and your location within a global boundary.

6 Instructional Guide for The ArcGIS Imagery Book
1. Click Imagery with Metadata.
2. Click Open in Map Viewer.
3. Click Content in the left panel.
4. Zoom all the way out to the world view of the map.
5. Examine the layers in the Contents pane. List the layers.
Notice that some of the layers are dimmed. Multiscale maps allow you to view geographic data across a range of scales, also known as zoom levels, from buildings to the entire globe. Specifying at what zoom levels content is drawn is known as setting the visible range.
You will use the Esri Eastern Africa office for an example of the procedure to follow to describe a location.
6. In the Search box in the upper-right corner, type Eastern Africa, Kilimanjaro Ave, Nairobi.
Q1 Write a description of the local area.
7. Zoom out until you can see the administrative boundary of Nairobi..

Chapter 1: Imagery Is Visible Intelligence 7
Q2 Write a description of the landscape features within the Nairobi administrative boundary.
8. Zoom out until you can see the administrative boundary of Kenya.
Q3 Write a description of Kenya.
9. Zoom out until you can see the continent of Africa.
Q4 Write a description of Africa.
10. Repeat the preceding steps with your local location.

8 Instructional Guide for The ArcGIS Imagery Book
1. Find the Three-dimensional scenes map in chapter 1 of The ArcGIS Imagery Book.
Scroll down to the section titled “Working together at last.”
2. Click the Map.
At the bottom, the app shows various locations on Earth. When you click on any of the locations, it opens within the scene viewer.
3. Navigate a scene. Use all the tools.
Activity 1.2 Three-dimensional scenes
Where and what?
ArcGIS OnlineSM 3D Scene Viewer allows users to explore the world in 3D. The scene viewer is an app built into the ArcGIS Online website for creating and interacting with 3D scenes. The scene viewer works with most modern browsers. Users can choose global or local views, switch basemaps, add layers, configure layers, capture slides, and save scenes. In this introductory activity, you will match a verbal description with a 3D scene.

Chapter 1: Imagery Is Visible Intelligence 9
4. Practice opening different views by clicking scenes at the bottom.
5. Learn to use the scene tools, paying attention to changing the basemaps.
Search and type a location into the search box
View layers.
Choose a basemap
Adjust daylight
Share the scene
Change settings

10 Instructional Guide for The ArcGIS Imagery Book
Location Region Description
Mount St. Helens
Mount Whitney
Grand Canyon
Bell Rock
Horseshoe Bend
Meteor Crater
Bowknot Bend
Devil’s Tower
Venice Lagoon
Mount Blanc
Mount Vesuvius
Ayres Rock
Diamond Head
The Badlands
Guitar Shaped
World’s Largest
Star Fort
Potash Ponds
Descriptions:
- Farm shaped like a guitar as tribute to wife who died
- Only active volcano in mainland Europe
- Butte composed of sedimentary rock
- Evaporation ponds near Moab
- Meteorite
- Fort built in a style during the age of gunpowder cannon battlefields
- Enclosed bay of the Adriatic Sea
- Dramatic landscapes inhabited by bison, bighorn sheep, and prairie dogs
- Massive sandstone monolith that is sacred to indigenous inhabitants
- Sector of the Green River canyon that doubles back on itself
- Caused by 277-mile river eroding
- Highest mountain in the Alps
- A hairpin turn in the Colorado River
- Highest summit in contiguous USA
- One-of-a-kind flat-topped volcanic formation
- Butte composed of sedimentary rock
- Name of a volcanic cone on the Island of Oahu
- Highest mountain in the Alps
6. Complete this chart by adding the region and selecting a description from the choices given.
Chapter 1: Imagery Is Visible Intelligence 11
1. Click the link to the Earth as Art link in the “Imagery Is beautiful” section of the first chapter of The ArcGIS Imagery Book.
2. Use the arrows to navigate through the site’s 42 photos.
3. Select your five favorite images from the collection and explain why each is a favorite by using descriptive words about at least three of these image elements: line, tone, shape, movement, contrast, and color.
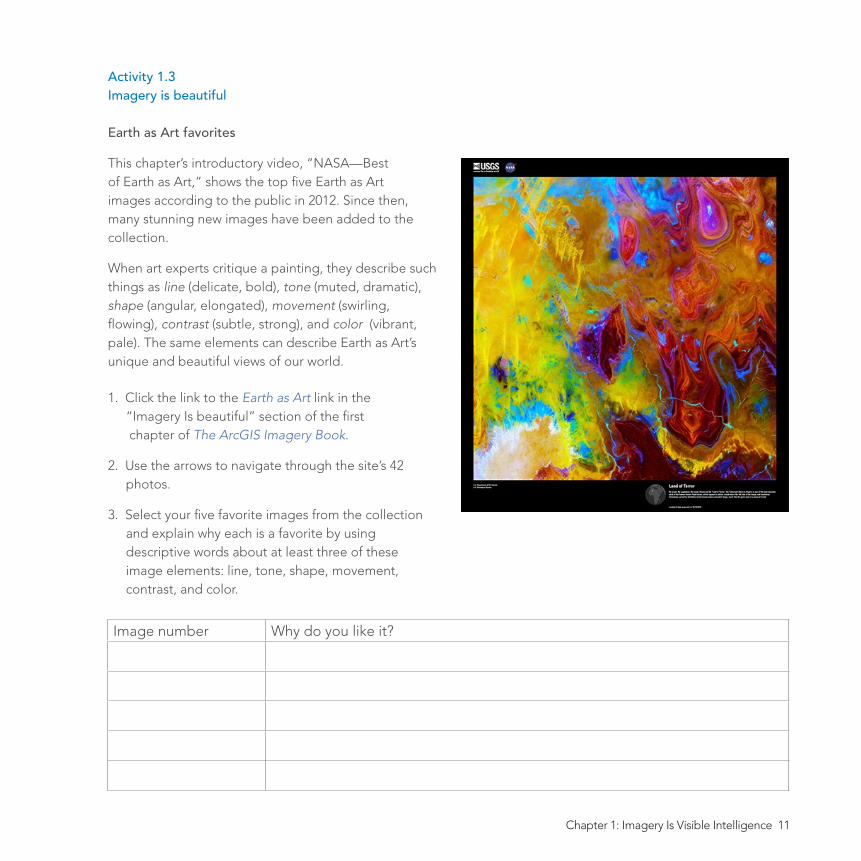
Activity 1.3Imagery is beautiful
Earth as Art favorites
This chapter’s introductory video, “NASA—Best of Earth as Art,” shows the top five Earth as Art images according to the public in 2012. Since then, many stunning new images have been added to the collection.
When art experts critique a painting, they describe such things as line (delicate, bold), tone (muted, dramatic), shape (angular, elongated), movement (swirling, flowing), contrast (subtle, strong), and color (vibrant, pale). The same elements can describe Earth as Art’s unique and beautiful views of our world.
Image number Why do you like it?

12 Instructional Guide for The ArcGIS Imagery Book
Remember, you can access ArcGIS Online for all the lessons in this guide, either with no sign- in to an organizational account required (the first set of lessons in each chapter) or by signing in to your organizational account (for the last set of lessons in each chapter).
Lesson 1–1: Obtaining information from imageryMeasuring the Rondônia rain forest
Acco
unt not req
uired
Satellite or aerial imagery can be described as a direct measurement or primary data source. Products derived from the primary source are considered secondary sources. Secondary sources can be derived by digitizing and obtaining vector information from imagery. With imagery serving as the basemap, you can use a mouse to perform manual digitizing, the process of converting geographic features on an analog map into digital format. As in any human procedure, errors can be introduced.
Build skills in these areas:
� Opening an existing online map
� Interpreting clear-cut forest regions
� Digitizing on screen
� Measuring on screen
� Calculating percentage
� Interpreting Landsat 8 (Moisture Index) imagery
� Visualizing derived moisture content imagery
What you need:
� Account not required
� Estimated time: 1 hour

Chapter 1: Imagery Is Visible Intelligence 13
Scenario
Deforestation is defined as the removal of a forest or stand of trees where the land is thereafter converted to a nonforest use. Clear-cutting is a type of deforestation logging practice in which most or all trees in an area are uniformly cut down. The practice of clear-cutting can be clearly seen from imagery in the state of Rondônia in Brazil. The deforestation in Rondônia is seen in a pattern that looks like a fish skeleton because the cutting fans out along the roads. You have been asked to provide a quick approximation of how much of Rondônia’s land has been affected by clear-cutting. You have access to both high-resolution imagery and a Landsat 8 image that shows dry and wet areas.
1. Click Imagery with Metadata.
2. Click Open in Map Viewer.
3. Click Content in the left panel.
4. Zoom all the way out to the world view of the map.

14 Instructional Guide for The ArcGIS Imagery Book
5. Search for Rondônia, Brazil.
Take a few minutes to zoom in and out and observe the fish-skeleton-like pattern of clear-cutting in Rondônia. As you zoom inward, you can see that the land is now agricultural.
6. Click Basemap on the left and change to Imagery with Labels.
Q1 What are the major cities in Rondônia?
Q2 Zoom into the city areas. Describe the urban areas.
To calculate the percentage of Rondônia that has been deforested by clear-cutting, you need to know two numbers: the total number of square miles of Rondônia and the number of square miles already clear-cut. Remember, at the beginning of the exercise, it was determined that this secondary information can be obtained from the primary image source.
7. Zoom out so the entire state of Rondônia is visible.
8. On the upper right, click Measure and then the Area icon. The unit is Sq Miles.

Chapter 1: Imagery Is Visible Intelligence 15
9. After clicking the Area icon, digitize around the country by selecting points and creating a polygon. When the polygon is complete, record the area.
Total area of Rondônia:_______________ sq miles.
10. Zoom in and digitize around the areas of Rondônia that have been deforested by clear- cutting. You need to digitize several polygons and add the areas together for a total.
Total area of deforestation: _________sq miles.
Total area of Rondônia/Total area of deforestation × 100 = _________of deforested land.
In the previous section, high-resolution aerial imagery was used to observe Rondônia. In the next section, a Landsat 8 Moisture Index image will be used. The moisture index has been derived from the most recent Landsat 8 imagery and is an estimated level of moisture in vegetation. Wetlands and other vegetated areas with high levels of moisture appear as blue, whereas deserts appear as tan to brown. The Normalized Difference Moisture Index (NDMI) is calculated by using the near infrared (band 5) and shortwave infrared (band 6). The map is updated daily, retaining the four most recent scenes for each path/row that has cloud coverage of less than 50 percent.
11. Open The Moisture Index: How wet or dry?

16 Instructional Guide for The ArcGIS Imagery Book
12. On the right panel at the bottom, click Data Source. This opens the Landsat 8 (Moisture Index).
13. Click Landsat 8 (Moisture Index) and then Open in Map Viewer.
14. In the upper-right search box, search for Rondônia, Brazil.
15. Below Details on the left, click Contents. That shows the two layers on the map. You can turn off the Landsat 8 (Moisture Index) to observe the outline of Rondônia.
Q3 Write a description of the deforested land using the Moisture Index legend.
16. Following the procedure explained in steps 8–10, digitize around the deforested region and perform the calculation for percentage of clear-cutting again. You may use the total area of Rondônia that you obtained previously.
Total area of Rondônia: ____________ sq miles.
Total area of deforestation: ________ sq miles.
Total area of Rondônia/total area of deforestation × 100 = _________of deforested land.
In this lesson, you have identified deforestation areas using both aerial and derived remote sensing imagery. You have used this imagery to obtain measurements to quantify the area of deforestation.

Chapter 1: Imagery Is Visible Intelligence 17
Lesson 1-2: Layering contemporary imagery with historical mapsIdentifying coordinates for historic locations in New York’s Central Park
Acco
unt required
Overlaying current satellite imagery with high-resolution historical map images (such as those in the David Rumsey Historical Map Collection) provides unique insights into the contemporary landscape.
In the past decade, the proliferation of mobile devices and apps has given birth to a revolutionary new genre in the world of tourism—mobile map tours. Using only your smartphone, you can take a campus tour of virtually any college or university, a walking tour of an urban historic district, or a guided tour of an art museum. The possibilities are endless.

18 Instructional Guide for The ArcGIS Imagery Book
1. Sign in to your ArcGIS Online organization account and click Map to open a new map.
2. Change the basemap to imagery.
3. Save your map as Central Park Tour. Give the map appropriate tags and provide a summary.
4. Find Central Park by typing it in the Find box.
5. Create a map note (Add Content to Map>>Add Map Notes) called Central Park by digitizing Central Park’s long rectangular shape from the Imagery basemap.
Build skills in these areas:
� Opening and saving a new map
� Changing the basemap
� Creating and symbolizing an area map note
� Adding new map layers from ArcGIS Online
� Identifying latitude and longitude coordinates of specific locations
� Creating and symbolizing point map notes
What you need:
� ArcGIS organizational account
� Note: If you do not have an ArcGIS organizational account, you can still create this map, but you cannot save it.
� Estimated time: 1 hour
Scenario
One of the largest arenas for mobile app development is tours of national, state, and local parks. You have been asked to work with an app tour developer to identify points of historic interest and importance in New York City’s Central Park based on a map of New York City in 1836. Central Park did not exist at that time, but your company is creating a walking tour app that will highlight the park’s history as well as its contemporary features. You will submit an ArcGIS Online map with selected 1836 historic locations noted so that a research team can develop appropriate text to go with them in the tour.

Chapter 1: Imagery Is Visible Intelligence 19
• Using the Area tool, click three of the park’s corners. Double-click the fourth corner to finish.
• Symbolize the area with a red outline and no fill.
• Click Edit when you are done.
6. Add New York City 1836 from the David Rumsey Historical Map Collection (Add Content to Map>>Search for Layers). Search for New York City 1836 in ArcGIS Online. When you find the David Rumsey map, click Add.
7. Turn on the 1836 map of New York City and move the Central Park map note above the historical map.
6. Save your map.
8. Zoom in to the map legend (Explanation) to learn what the map symbols represent

20 Instructional Guide for The ArcGIS Imagery Book
9. Zoom in to the area of Central Park as delineated by your Central Park map note. Using the legend symbology, make a list of area features from 1836 that later became Central Park.
10. Use the Measure tool to determine the coordinates of each of the following locations in the Central Park area in 1836. Simply click the Measure tool, the Location tool, and the appropriate location on the map to find its latitude and longitude.
• Powder House
• Fort Clinton
• Fort Fish
• The Receiving Reservoir
• Woods (one or more areas)
• An orchard (one or more areas)
• Marshland
11. Turn off the historical map layer, New York City 1836.
12. Create a map note for each of the locations in step 9. Use the following directions to create each map note:
• In the Find box, enter the latitude and longitude coordinates for the Powder House. Note: enter the longitude (-73.97315), followed by a comma, and then the latitude (40.768908).
• In the search results window, click Add to Map Notes
• Click the new blue Map Note symbol. Title it Powder House.
• To change the Map Note symbol, in the Shapes symbol, select the red star and change the size to 25 px.
• Click OK and click Close.
• Repeat these steps for each of the remaining locations on the list above. Give each an appropriate title (e.g., Powder House, Fort Clinton, and so on).
13. In the map contents, change the Map Notes layer name to Historical Locations.
Chapter 1: Imagery Is Visible Intelligence 21
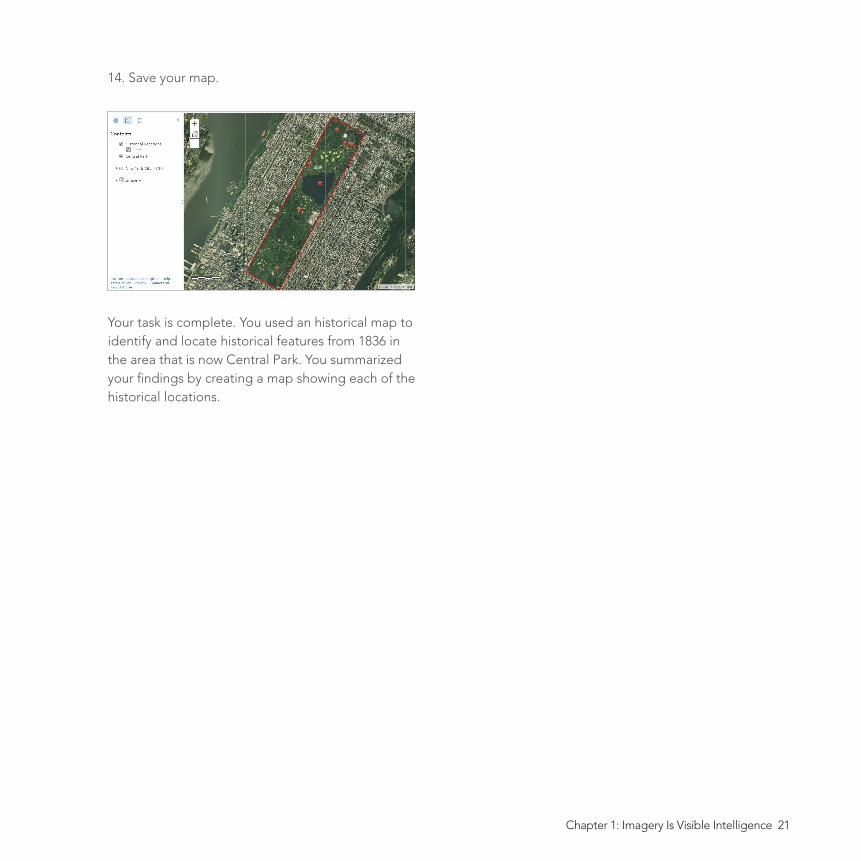
14. Save your map.
Your task is complete. You used an historical map to identify and locate historical features from 1836 in the area that is now Central Park. You summarized your findings by creating a map showing each of the historical locations.

22 Instructional Guide for The ArcGIS Imagery Book
Teachers can use the items in this section as an assignment, introduction, or assessment,tailored to the sophistication of learners. Some learners can read all the sections at one time, while others are more comfortable with small segments. The questions and tasks are designed to stimulate thought and discussion.
The ArcGIS Imagery Book, chapter 1Questions for reading comprehension, reflection, and discussion
1. What advances in the use of imagery for intelligence and reconnaissance were developed during World War II?
2. What can satellite imagery reveal that photography cannot?
3. Imagery has a wide range of uses and applications. What are some of the unique insights and capabilities that we derive from the use of imagery?
4. Imagery processing systems and GIS have common characteristics that allow them to work together today in ArcGIS. What are some of those shared characteristics?
5. Look at the various maps that are linked from this chapter in 01 Imagery Is Visible Intelligence. Identify and briefly describe uses of modern imagery that these maps reflect.

Chapter 1: Imagery Is Visible Intelligence 23
Oso Mudslide - Before and After
Creating an app with Web AppBuilder
Adding metadata
Get Started with ArcMap
Adding data to a map
Analyzing relationships between data
Digitizing features
Symbolizing and organizing data
Additional resourcesLearn ArcGIS: Guided lessons based on real-world problems
Get Started with ArcGIS Online
Adding layers to a map
Adding data stored as spreadsheet or file data to a map
Changing map symbols
Configuring pop-ups
Sharing the map as a web app