imaging facial physiology for the detection of deceit facial physiology for the detection of deceit...
TRANSCRIPT
International Journal of Computer Vision 71(2), 197–214, 2007
c© 2006 Springer Science + Business Media, LLC. Manufactured in the United States.
DOI: 10.1007/s11263-006-6106-y
Imaging Facial Physiology for the Detection of Deceit
P. TSIAMYRTZISDepartment of Statistics, Athens University of Economics and Business, 76 Patission Street, 104 34 Athens, Greece
J. DOWDALL, D. SHASTRI AND I.T. PAVLIDISDepartment of Computer Science, University of Houston, 501 Philip G. Hoffman Hall, Houston, TX 77204-3010
M.G. FRANKSchool of Informatics/Department of Communication, University of Buffalo, State University of New York,
Buffalo, NY [email protected]
P. EKMANDepartment of Psychiatry, UC San Francisco, San Francisco, CA-94143-0984
Received March 25, 2005; Revised August 21, 2005; Accepted November 8, 2005
First online version published in June, 2006
Abstract. Previous work has demonstrated the correlation of increased blood perfusion in the orbital musclesand stress levels for human beings. It has also been suggested that this periorbital perfusion can be quantifiedthrough the processing of thermal video. The idea has been based on the fact that skin temperature is heavilymodulated by superficial blood flow. Proof of this concept was established for two different types of stress inducingexperiments: startle experiments and mock-crime polygraph interrogations. However, the polygraph interrogationscenarios were simplistic and highly constrained. In the present paper, we report results derived from a large andrealistic mock-crime interrogation experiment. The interrogation is free flowing and no restrictions have been placedon the subjects. Additionally, we propose a new methodology to compute the mean periorbital temperature signal.The present approach addresses the deficiencies of the earlier methodology and is capable of coping with thechallenges posed by the realistic setting. Specifically, it features a tandem CONDENSATION tracker to registerthe periorbital area in the context of a moving face. It operates on the raw temperature signal and tries to improvethe information content by suppressing the noise level instead of amplifying the signal as a whole. Finally, apattern recognition method classifies stressful (Deceptive) from non-stressful (Non-Deceptive) subjects based ona comparative measure between the entire interrogation signal (baseline) and a critical subsection of it (transientresponse). The successful classification rate is 87.2% for 39 subjects. This is on par with the success rate achievedby highly trained psycho-physiological experts and opens the way for automating lie detection in realistic settings.
198 Tsiamyrtzis et al.
Keywords: deception detection, polygraph, thermography, facial tracking, contact-free physiological monitoring
1. Introduction
Stress has long been associated with deceptive behav-ior during interrogation. It emanates from a brain centerand manifests itself in the peripheral senses through avariety of physiological signatures, including perspira-tion, pulse, and breathing rate (Sokolov and Cacioppo,1997; Drummond and Lance, 1987). Polygraph ex-aminations are based exactly on this principle. How-ever, polygraph technology is based on contact sensorsand heuristic analysis of resultant signals by experts(Kleinmuntz and Szucko, 1984). A consequence of thisis that the comfort of subjects is compromised, which isvery important in psycho-physiology, as it is believed tocontaminate the experiment (Yankee, 1965). The anal-ysis of the results is slow because it is performed manu-ally by several experts who later have to reconcile theirfindings. The processing of a typical 10 min interro-gation session may take several hours. Finally, due tothe heuristic nature of the analysis the outcome cannotbe embraced with high confidence and always has asuggestive nature (Committee to Review the ScientificEvidence on the Polygraph, 2003).
Traditionally, polygraph examination is used by theU.S. Government to check periodically the veracityof employees that hold security clearances. It is alsofavored in some instances by private companies forscreening during the hiring process. This is primarilyfor potential employees who will assume sensitive po-sitions. Due to the problems of the existing polygraphtechnology, polygraph examinations are inadmissiblein court. In recent years and with the intensificationof anti-terrorism efforts, there has been a clear desireto improve or replace the polygraph technology withsomething better. There is a real need for administer-ing real-time, highly automated veracity tests insidethe country and around the globe, where human intel-ligence is being collected. At the same time, similartechnology may be useful for quick screening of po-tential suspects in ports of entry (Knight, 2004).
Pavlidis et al. have discovered a physiological sig-nature on the face directly associated with stress lev-els (Pavlidis et al., 2000). This physiological responsecould be considered to be part of the ‘fight or flight’syndrome triggered by the autonomic nervous system,whereby blood redistributes peripherally towards mus-culoskeletal tissue (Martini et al., 2001). Specifically,Pavlidis et al. demonstrated that during stress produced
by startle stimuli in the lab, subjects exhibited ele-vated blood perfusion in the orbital muscle area, whichresulted in localized elevated temperature. They furthersuggested that such a heat signature can be captured bya highly sensitive thermal imaging system and analyzedusing pattern recognition methods. Based on this prin-ciple, they have later developed an imaging system forquantifying stress during polygraph examinations. Thesystem was put into comparative test with traditionalpolygraphy in an experiment designed and imple-mented by the Department of Defense Polygraph Insti-tute (DOD PI). The accuracy of the two modalities wasfound to be equivalent (around 80%), thereby estab-lishing the feasibility of the idea (Pavlidis et al., 2002).
The DOD PI experiment was small in scale (20 sub-jects) and highly contrived. Questions were posed tosubjects multiple times and there were long pauses be-tween each question. The subjects were required to givea binary answer (‘yes/no’) to impose uniformity on thetime scale (Pavlidis and Levine, 2002). The subjectswere also instructed to stay as still as possible. Thisis quite apart from the natural interrogation scenariowhere there are no motion restrictions and the flow iscontinuous and non-uniform. Actually, in practice thepace of an interrogation typically accelerates or decel-erates at times to build up psychological pressure.
Recently, the Communication Lab at Rutgers Uni-versity designed and executed a large mock-crimeexperiment where all the aforementioned restrictionsduring the interrogations were removed. The Compu-tational Physiology Lab in the University of Houstonjoined this effort early in the data collection and col-lected facial thermal video along with audio for allthose subjects run over a consecutive 9 month period(the entire collection period was 19 months). The anal-ysis of the thermal imagery demonstrated the limita-tions of the earlier methodology proposed in the DODPI experiment. Then, the problem of signal fading wasaddressed through the transformation from the temper-ature to the blood perfusion domain via bioheat mod-eling. This magnified the scale of the phenomenon butalso amplified the noise levels.
In this paper, we propose an entirely differentmethodology, which addresses the issue of automaticdeception detection under the most realistic conditionsand for a statistically significant number of subjects.The only similarity between the present and past ap-proaches is that the periorbital region continues to be
Imaging Facial Physiology for the Detection of Deceit 199
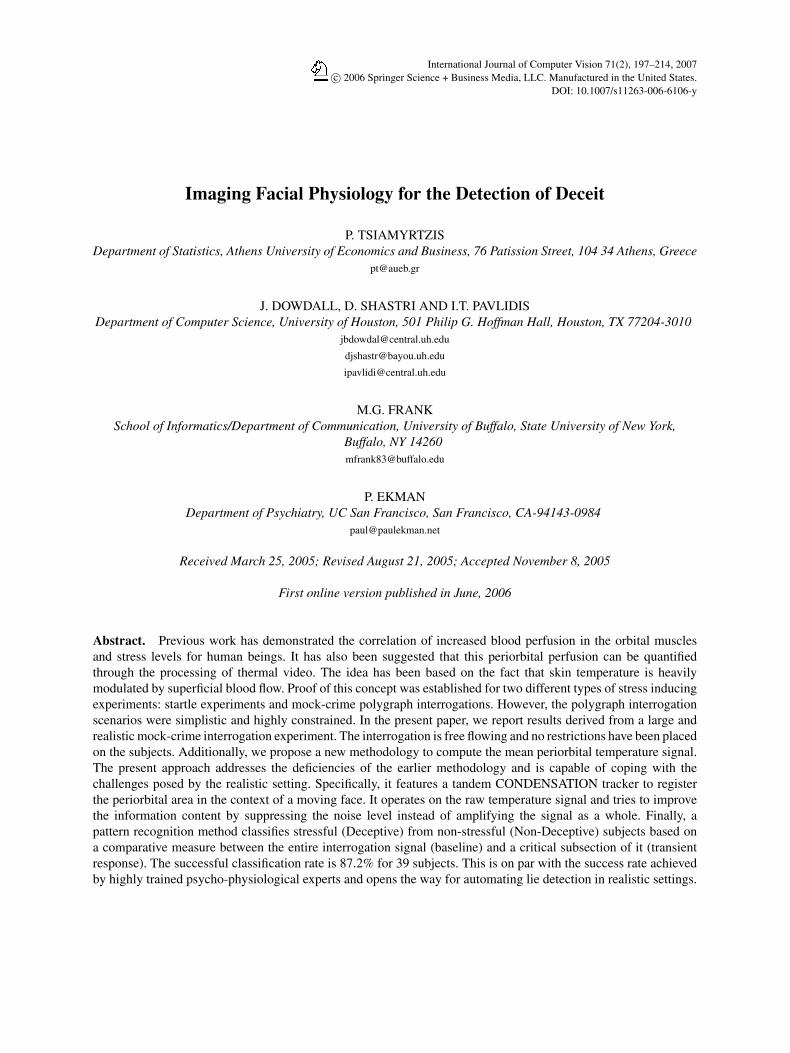
Figure 1. A comparison of extracted temperature signals over time from the periorbital region of a sample subject. The red (dark) signal was
extracted using a stationary rectangle. The green (light) signal was extracted using our proposed tracking method, tandem assisted tracking. Both
regions were selected from the subject’s periorbital region from the first frame of the measurement. Notice the high variability of the untracked
region’s extracted temperature signal, which would render it unacceptable for physiological interpretation.
the region of interest. Additionally, we employ a track-ing method to facilitate the extraction of the tempera-ture measurement from the periorbital region, withoutwhich any measurements taken would be marred bynoise to the point of being useless for physiologicalinterpretation (see Fig. 1).
In Section 2 we provide an overview of the experi-ment and the proposed imaging solution. In Section 3we describe the facial and periorbital tracking al-gorithm, which enables acquisition of temperaturesfrom the tissue of interest despite head motion. InSection 4 we describe the physiological measurementand our noise suppression methodology. In Section 5we present the pattern recognition algorithm that op-erates on the filtered temperature signal to perform thebinary classification (‘Deceptive’ or ‘Non-Deceptive’).In Section 6 we discuss the experimental design andresults and ponder the strong and weak points of ourapproach. We conclude the paper in Section 7.
2. Overview of Our Approach
Our objective is to extract the mean temperature sig-nal in the periorbital area of the subject through the
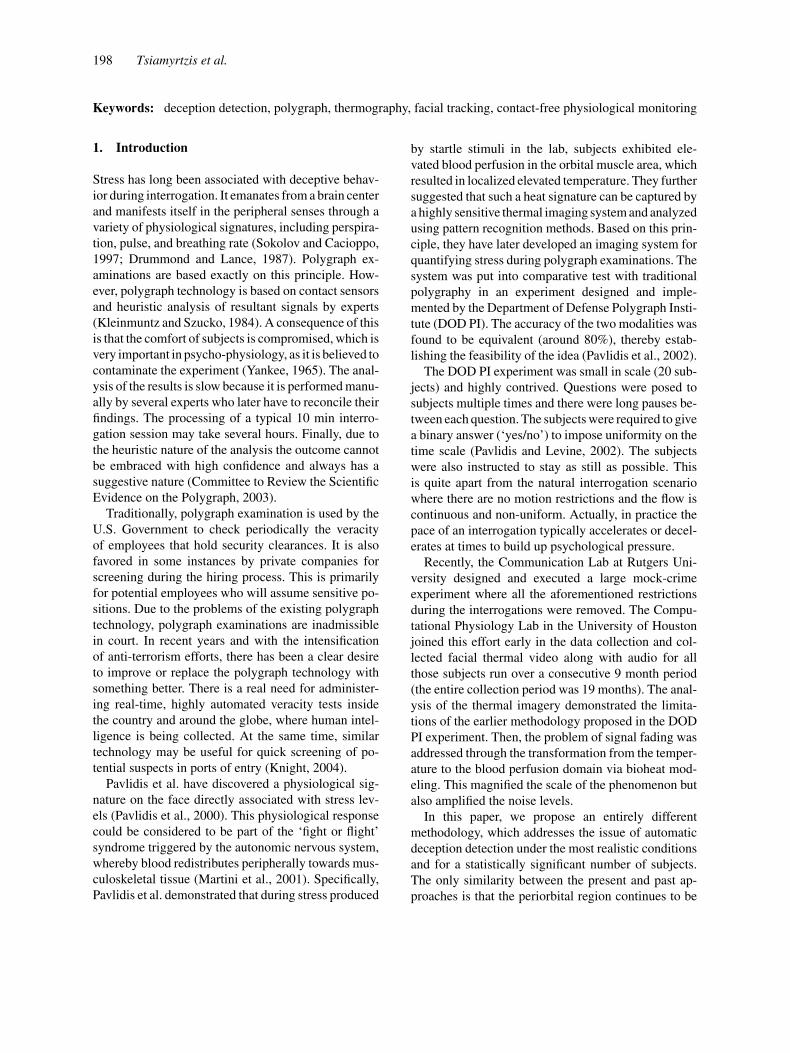
Figure 2. System architecture.
course of the interrogation. Fig. 2 depicts the sys-tem architecture that realizes this objective. Specifi-cally, we have a specialized tissue tracker that registersthe subject’s periorbital region despite the presence ofmotion.
Even with the tracking, the extracted temperaturesignal is still marred by noise. While some systemicnoise from the electronics of the thermal imagingsystem is present, the major source of noise stemsfrom imperfections in the tracker. Therefore, a noisesuppression algorithm (filter) is necessary to improvethe quality of the signal. Finally, we have a pat-tern recognition algorithm that compares the over-all outlook of the filtered signal (baseline) versusspecific instances of high psycho-physiological value(transient response). This comparison constitutes thebasis of a binary classification rule (‘Deceptive’ or‘Non-Deceptive’).
3. Tandem Facial Tracking
Sequential Monte Carlo methods have been employedfor tracking in computer vision applications for nearly
200 Tsiamyrtzis et al.
a decade (Doucet et al., 2001). The CONDENSA-TION algorithm (Isard and Blake, 1998a) formal-ized their introduction to the field, providing aneffective and easily implemented framework for track-ing. This work was followed by innovations that incor-porated information fusion (Isard and Blake, 1998b),reduced computational cost (MacCormick and Isard,2000), and facilitated multi-object tracking (Isard andMaccormick, 2001; Maccormick and Blake, 2000).The majority of research was concentrated on the prob-lem of tracking in the visible spectrum, but there hasalso been investigation into utilizing the thermal por-tion of the infrared spectrum (Eveland et al., 2003).
Typically, in the aforementioned methods, trackingaccuracy can fluctuate, and as long as it is regained
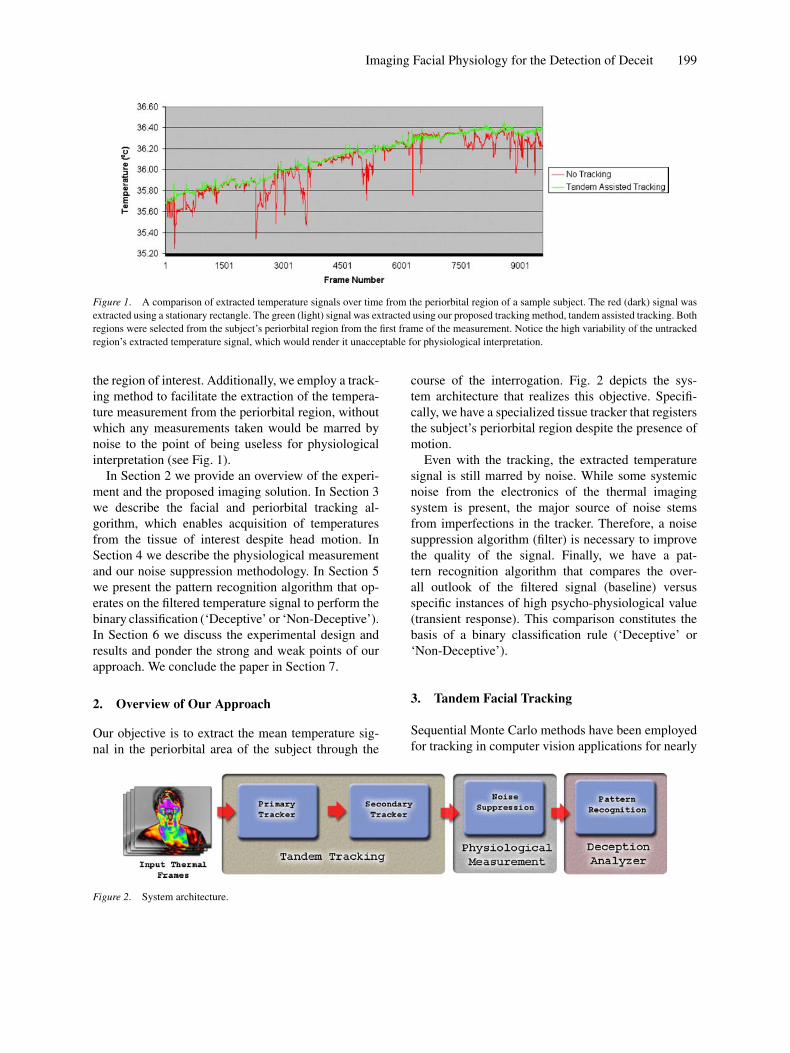
Figure 3. Out of plane rotation of the head.
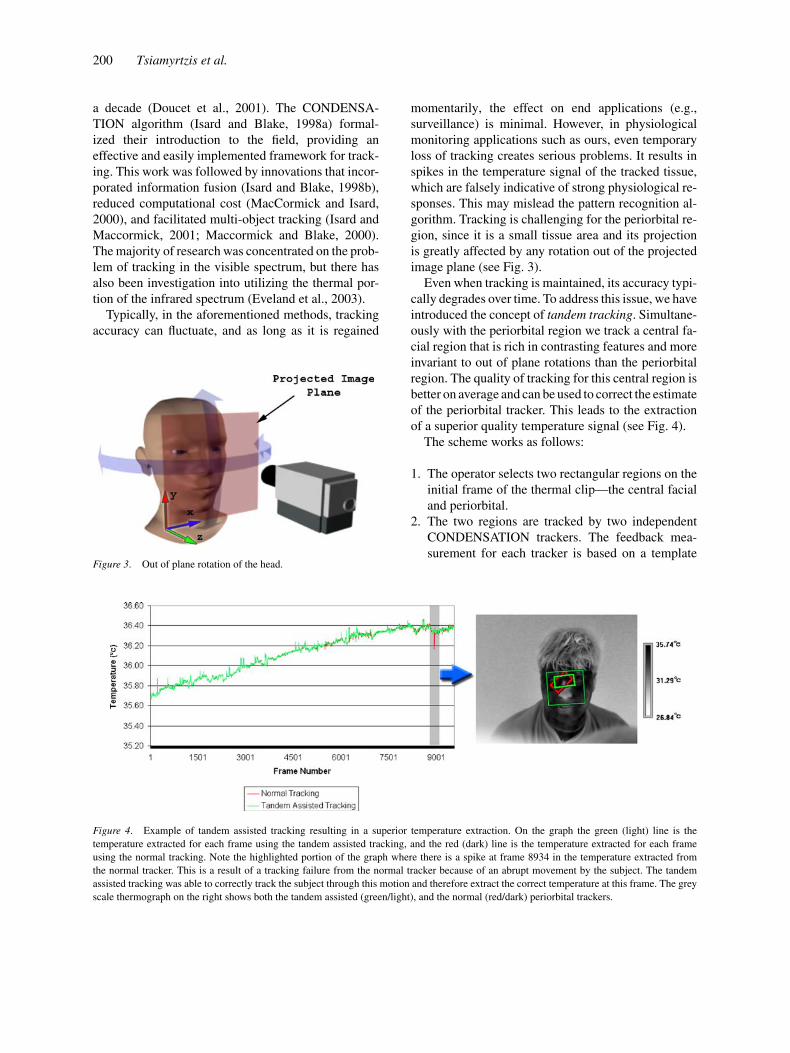
Figure 4. Example of tandem assisted tracking resulting in a superior temperature extraction. On the graph the green (light) line is the
temperature extracted for each frame using the tandem assisted tracking, and the red (dark) line is the temperature extracted for each frame
using the normal tracking. Note the highlighted portion of the graph where there is a spike at frame 8934 in the temperature extracted from
the normal tracker. This is a result of a tracking failure from the normal tracker because of an abrupt movement by the subject. The tandem
assisted tracking was able to correctly track the subject through this motion and therefore extract the correct temperature at this frame. The grey
scale thermograph on the right shows both the tandem assisted (green/light), and the normal (red/dark) periorbital trackers.
momentarily, the effect on end applications (e.g.,surveillance) is minimal. However, in physiologicalmonitoring applications such as ours, even temporaryloss of tracking creates serious problems. It results inspikes in the temperature signal of the tracked tissue,which are falsely indicative of strong physiological re-sponses. This may mislead the pattern recognition al-gorithm. Tracking is challenging for the periorbital re-gion, since it is a small tissue area and its projectionis greatly affected by any rotation out of the projectedimage plane (see Fig. 3).
Even when tracking is maintained, its accuracy typi-cally degrades over time. To address this issue, we haveintroduced the concept of tandem tracking. Simultane-ously with the periorbital region we track a central fa-cial region that is rich in contrasting features and moreinvariant to out of plane rotations than the periorbitalregion. The quality of tracking for this central region isbetter on average and can be used to correct the estimateof the periorbital tracker. This leads to the extractionof a superior quality temperature signal (see Fig. 4).
The scheme works as follows:
1. The operator selects two rectangular regions on theinitial frame of the thermal clip—the central facialand periorbital.
2. The two regions are tracked by two independentCONDENSATION trackers. The feedback mea-surement for each tracker is based on a template
Imaging Facial Physiology for the Detection of Deceit 201
extracted from the initial rectangular regions. Inessence, this is a sub-sampling of the rectangular re-gion of interest. We have determined experimentallythat a surprisingly small sub-sample of the originalarea produces the same tracking result as the fullarea.
3. The relative spatial position of the central and peri-orbital regions is established in the initial frame.
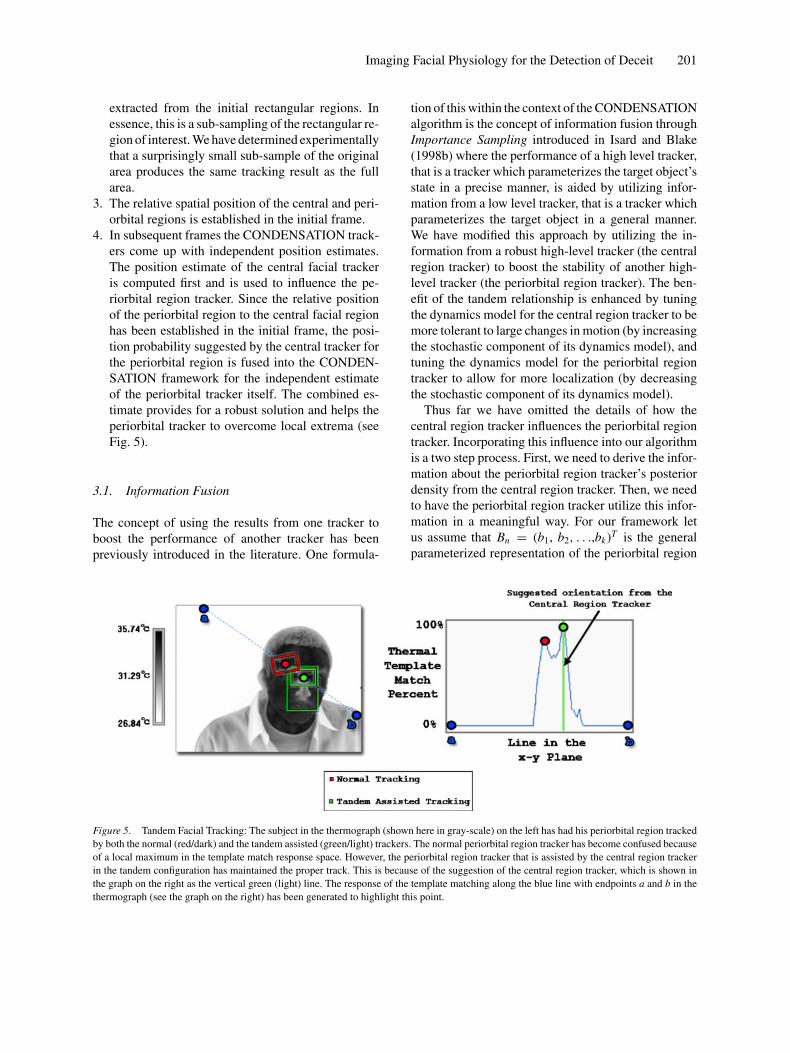
4. In subsequent frames the CONDENSATION track-ers come up with independent position estimates.The position estimate of the central facial trackeris computed first and is used to influence the pe-riorbital region tracker. Since the relative positionof the periorbital region to the central facial regionhas been established in the initial frame, the posi-tion probability suggested by the central tracker forthe periorbital region is fused into the CONDEN-SATION framework for the independent estimateof the periorbital tracker itself. The combined es-timate provides for a robust solution and helps theperiorbital tracker to overcome local extrema (seeFig. 5).
3.1. Information Fusion
The concept of using the results from one tracker toboost the performance of another tracker has beenpreviously introduced in the literature. One formula-
Figure 5. Tandem Facial Tracking: The subject in the thermograph (shown here in gray-scale) on the left has had his periorbital region tracked
by both the normal (red/dark) and the tandem assisted (green/light) trackers. The normal periorbital region tracker has become confused because
of a local maximum in the template match response space. However, the periorbital region tracker that is assisted by the central region tracker
in the tandem configuration has maintained the proper track. This is because of the suggestion of the central region tracker, which is shown in
the graph on the right as the vertical green (light) line. The response of the template matching along the blue line with endpoints a and b in the
thermograph (see the graph on the right) has been generated to highlight this point.
tion of this within the context of the CONDENSATIONalgorithm is the concept of information fusion throughImportance Sampling introduced in Isard and Blake(1998b) where the performance of a high level tracker,that is a tracker which parameterizes the target object’sstate in a precise manner, is aided by utilizing infor-mation from a low level tracker, that is a tracker whichparameterizes the target object in a general manner.We have modified this approach by utilizing the in-formation from a robust high-level tracker (the centralregion tracker) to boost the stability of another high-level tracker (the periorbital region tracker). The ben-efit of the tandem relationship is enhanced by tuningthe dynamics model for the central region tracker to bemore tolerant to large changes in motion (by increasingthe stochastic component of its dynamics model), andtuning the dynamics model for the periorbital regiontracker to allow for more localization (by decreasingthe stochastic component of its dynamics model).
Thus far we have omitted the details of how thecentral region tracker influences the periorbital regiontracker. Incorporating this influence into our algorithmis a two step process. First, we need to derive the infor-mation about the periorbital region tracker’s posteriordensity from the central region tracker. Then, we needto have the periorbital region tracker utilize this infor-mation in a meaningful way. For our framework letus assume that Bn = (b1, b2, . . .,bk)T is the generalparameterized representation of the periorbital region
202 Tsiamyrtzis et al.
tracker at frame n, for parameters b1, b2, . . .,bk , wherek can be as large as necessary to describe the tracker fora given representation. Similarly, let us assume that Cn
= (c1, c2,. . .,ck)T represents the central region trackerat frame n. In our representation we model the trackedregions by their center of mass positions and orienta-tions. The state space S for these is given in Eq. (1).
S = {(x, y, θ ) | x, y ∈ R, θ ∈ [0, 2π )} (1)
Where x and y are the coordinates of the center of massof the tracked region, and θ is the angle of the trackedregion with respect to the x-axis of the image coordi-nate system. The central region tracker uses its currentstate, Cn , coupled with information derived during ini-tialization, C0 and B0, to derive the information aboutthe possible state of the periorbital region tracker Bn
(see Eq. (2)).
Bn = Cn + (B0 − C0) (2)
Where Bn represents the projected current state of theperiorbital tracker based on the current state of thecentral region tracker. Bn is generated from the max-imum likelihood sample of the central region tracker.We use the maximum likelihood sample instead of thek-highest weighted samples in order to exert all the in-fluence of the tandem tracker in one location. Thus, weexplore the parameterization space around Bn to the
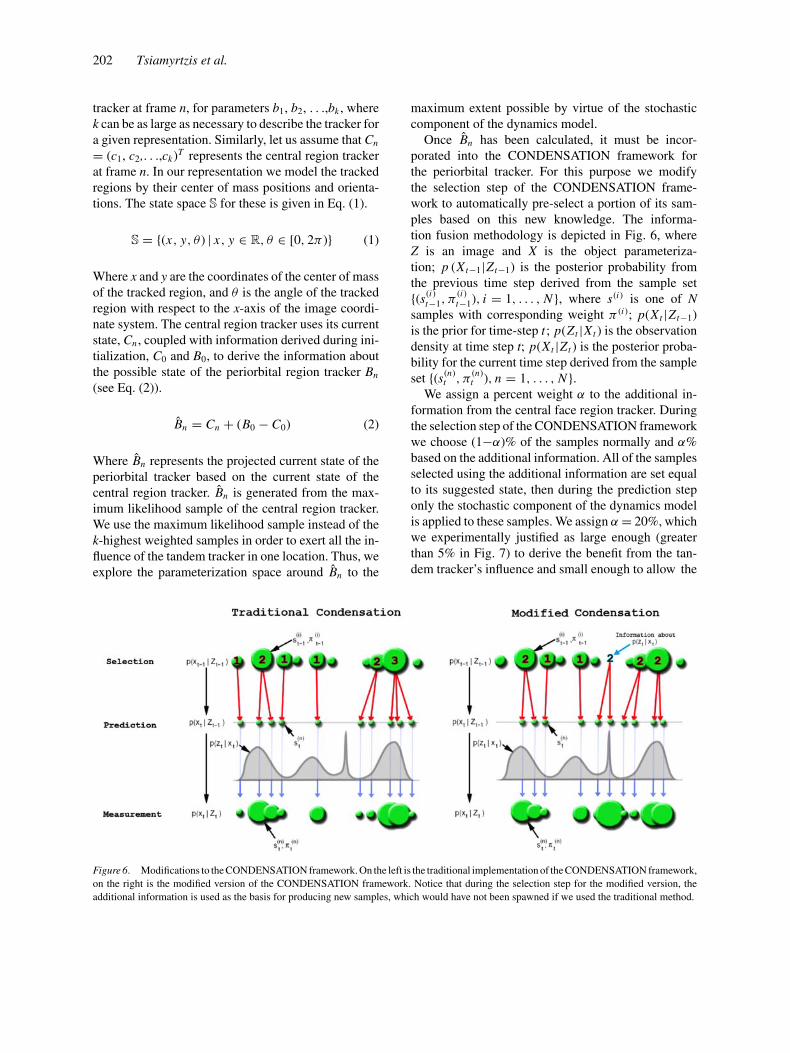
Figure 6. Modifications to the CONDENSATION framework. On the left is the traditional implementation of the CONDENSATION framework,
on the right is the modified version of the CONDENSATION framework. Notice that during the selection step for the modified version, the
additional information is used as the basis for producing new samples, which would have not been spawned if we used the traditional method.
maximum extent possible by virtue of the stochasticcomponent of the dynamics model.
Once Bn has been calculated, it must be incor-porated into the CONDENSATION framework forthe periorbital tracker. For this purpose we modifythe selection step of the CONDENSATION frame-work to automatically pre-select a portion of its sam-ples based on this new knowledge. The informa-tion fusion methodology is depicted in Fig. 6, whereZ is an image and X is the object parameteriza-tion; p (Xt−1|Zt−1) is the posterior probability fromthe previous time step derived from the sample set{(s(i)
t−1, π(i)t−1), i = 1, . . . , N }, where s(i) is one of N
samples with corresponding weight π (i); p(Xt |Zt−1)is the prior for time-step t ; p(Zt |Xt ) is the observationdensity at time step t; p(Xt |Zt ) is the posterior proba-bility for the current time step derived from the sampleset {(s(n)
t , π(n)t ), n = 1, . . . , N }.
We assign a percent weight α to the additional in-formation from the central face region tracker. Duringthe selection step of the CONDENSATION frameworkwe choose (1−α)% of the samples normally and α%based on the additional information. All of the samplesselected using the additional information are set equalto its suggested state, then during the prediction steponly the stochastic component of the dynamics modelis applied to these samples. We assign α = 20%, whichwe experimentally justified as large enough (greaterthan 5% in Fig. 7) to derive the benefit from the tan-dem tracker’s influence and small enough to allow the
Imaging Facial Physiology for the Detection of Deceit 203
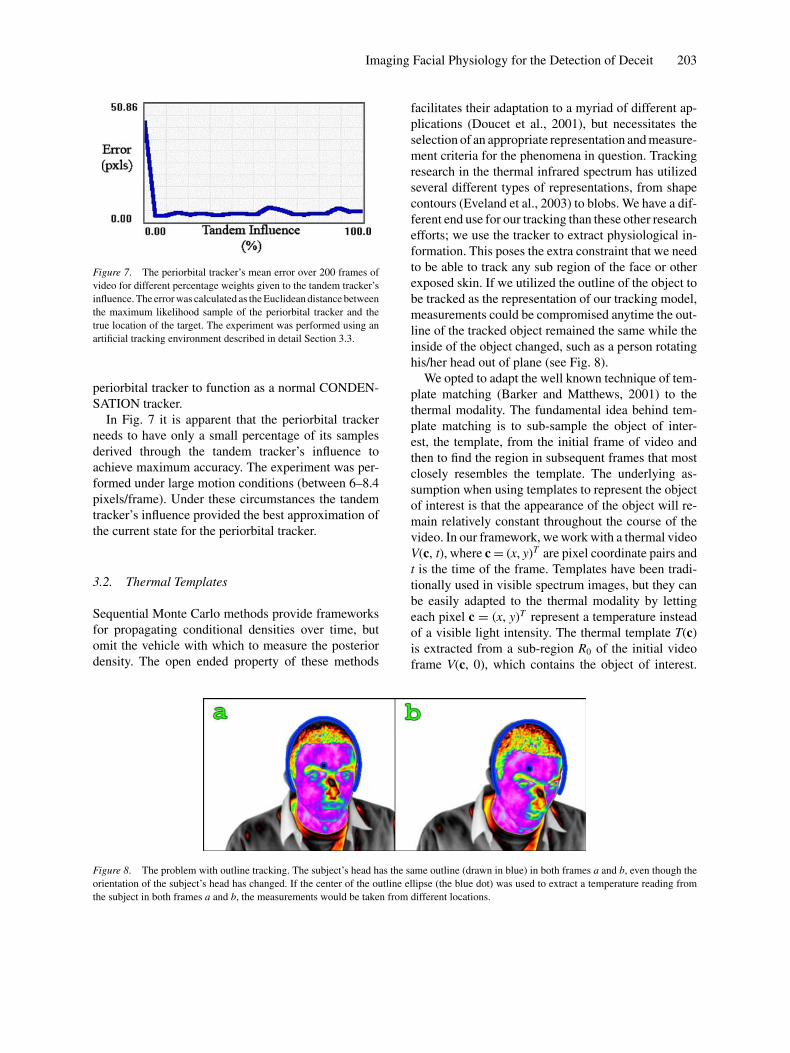
Figure 7. The periorbital tracker’s mean error over 200 frames of
video for different percentage weights given to the tandem tracker’s
influence. The error was calculated as the Euclidean distance between
the maximum likelihood sample of the periorbital tracker and the
true location of the target. The experiment was performed using an
artificial tracking environment described in detail Section 3.3.
periorbital tracker to function as a normal CONDEN-SATION tracker.
In Fig. 7 it is apparent that the periorbital trackerneeds to have only a small percentage of its samplesderived through the tandem tracker’s influence toachieve maximum accuracy. The experiment was per-formed under large motion conditions (between 6–8.4pixels/frame). Under these circumstances the tandemtracker’s influence provided the best approximation ofthe current state for the periorbital tracker.
3.2. Thermal Templates
Sequential Monte Carlo methods provide frameworksfor propagating conditional densities over time, butomit the vehicle with which to measure the posteriordensity. The open ended property of these methods
Figure 8. The problem with outline tracking. The subject’s head has the same outline (drawn in blue) in both frames a and b, even though the
orientation of the subject’s head has changed. If the center of the outline ellipse (the blue dot) was used to extract a temperature reading from
the subject in both frames a and b, the measurements would be taken from different locations.
facilitates their adaptation to a myriad of different ap-plications (Doucet et al., 2001), but necessitates theselection of an appropriate representation and measure-ment criteria for the phenomena in question. Trackingresearch in the thermal infrared spectrum has utilizedseveral different types of representations, from shapecontours (Eveland et al., 2003) to blobs. We have a dif-ferent end use for our tracking than these other researchefforts; we use the tracker to extract physiological in-formation. This poses the extra constraint that we needto be able to track any sub region of the face or otherexposed skin. If we utilized the outline of the object tobe tracked as the representation of our tracking model,measurements could be compromised anytime the out-line of the tracked object remained the same while theinside of the object changed, such as a person rotatinghis/her head out of plane (see Fig. 8).
We opted to adapt the well known technique of tem-plate matching (Barker and Matthews, 2001) to thethermal modality. The fundamental idea behind tem-plate matching is to sub-sample the object of inter-est, the template, from the initial frame of video andthen to find the region in subsequent frames that mostclosely resembles the template. The underlying as-sumption when using templates to represent the objectof interest is that the appearance of the object will re-main relatively constant throughout the course of thevideo. In our framework, we work with a thermal videoV(c, t), where c = (x, y)T are pixel coordinate pairs andt is the time of the frame. Templates have been tradi-tionally used in visible spectrum images, but they canbe easily adapted to the thermal modality by lettingeach pixel c = (x, y)T represent a temperature insteadof a visible light intensity. The thermal template T(c)is extracted from a sub-region R0 of the initial videoframe V(c, 0), which contains the object of interest.
204 Tsiamyrtzis et al.
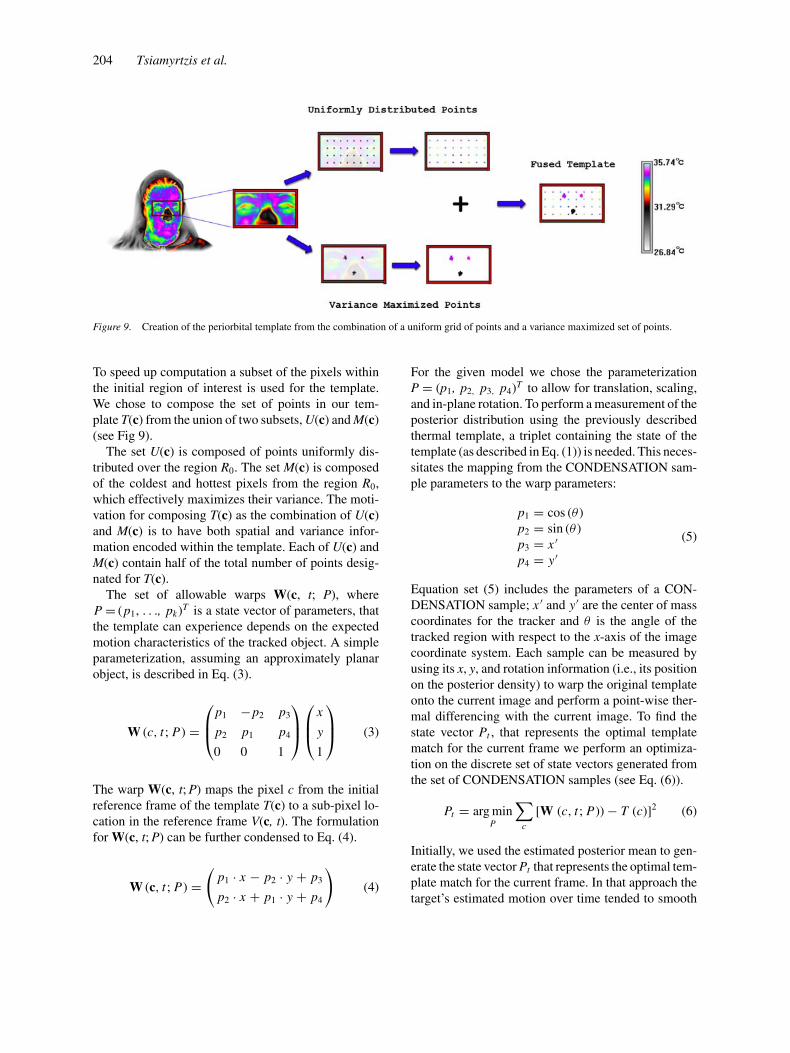
Figure 9. Creation of the periorbital template from the combination of a uniform grid of points and a variance maximized set of points.
To speed up computation a subset of the pixels withinthe initial region of interest is used for the template.We chose to compose the set of points in our tem-plate T(c) from the union of two subsets, U(c) and M(c)(see Fig 9).
The set U(c) is composed of points uniformly dis-tributed over the region R0. The set M(c) is composedof the coldest and hottest pixels from the region R0,which effectively maximizes their variance. The moti-vation for composing T(c) as the combination of U(c)and M(c) is to have both spatial and variance infor-mation encoded within the template. Each of U(c) andM(c) contain half of the total number of points desig-nated for T(c).
The set of allowable warps W(c, t; P), whereP = (p1, . . ., pk)T is a state vector of parameters, thatthe template can experience depends on the expectedmotion characteristics of the tracked object. A simpleparameterization, assuming an approximately planarobject, is described in Eq. (3).
W (c, t ; P) =
⎛⎜⎝p1 −p2 p3
p2 p1 p4
0 0 1
⎞⎟⎠⎛⎜⎝ x
y
1
⎞⎟⎠ (3)
The warp W(c, t; P) maps the pixel c from the initialreference frame of the template T(c) to a sub-pixel lo-cation in the reference frame V(c, t). The formulationfor W(c, t; P) can be further condensed to Eq. (4).
W (c, t ; P) =(
p1 · x − p2 · y + p3
p2 · x + p1 · y + p4
)(4)
For the given model we chose the parameterizationP = (p1, p2, p3, p4)T to allow for translation, scaling,and in-plane rotation. To perform a measurement of theposterior distribution using the previously describedthermal template, a triplet containing the state of thetemplate (as described in Eq. (1)) is needed. This neces-sitates the mapping from the CONDENSATION sam-ple parameters to the warp parameters:
p1 = cos (θ )p2 = sin (θ )p3 = x ′
p4 = y′(5)
Equation set (5) includes the parameters of a CON-DENSATION sample; x ′ and y′ are the center of masscoordinates for the tracker and θ is the angle of thetracked region with respect to the x-axis of the imagecoordinate system. Each sample can be measured byusing its x, y, and rotation information (i.e., its positionon the posterior density) to warp the original templateonto the current image and perform a point-wise ther-mal differencing with the current image. To find thestate vector Pt , that represents the optimal templatematch for the current frame we perform an optimiza-tion on the discrete set of state vectors generated fromthe set of CONDENSATION samples (see Eq. (6)).
Pt = arg minP
∑c
[W (c, t ; P)) − T (c)]2 (6)
Initially, we used the estimated posterior mean to gen-erate the state vector Pt that represents the optimal tem-plate match for the current frame. In that approach thetarget’s estimated motion over time tended to smooth
Imaging Facial Physiology for the Detection of Deceit 205
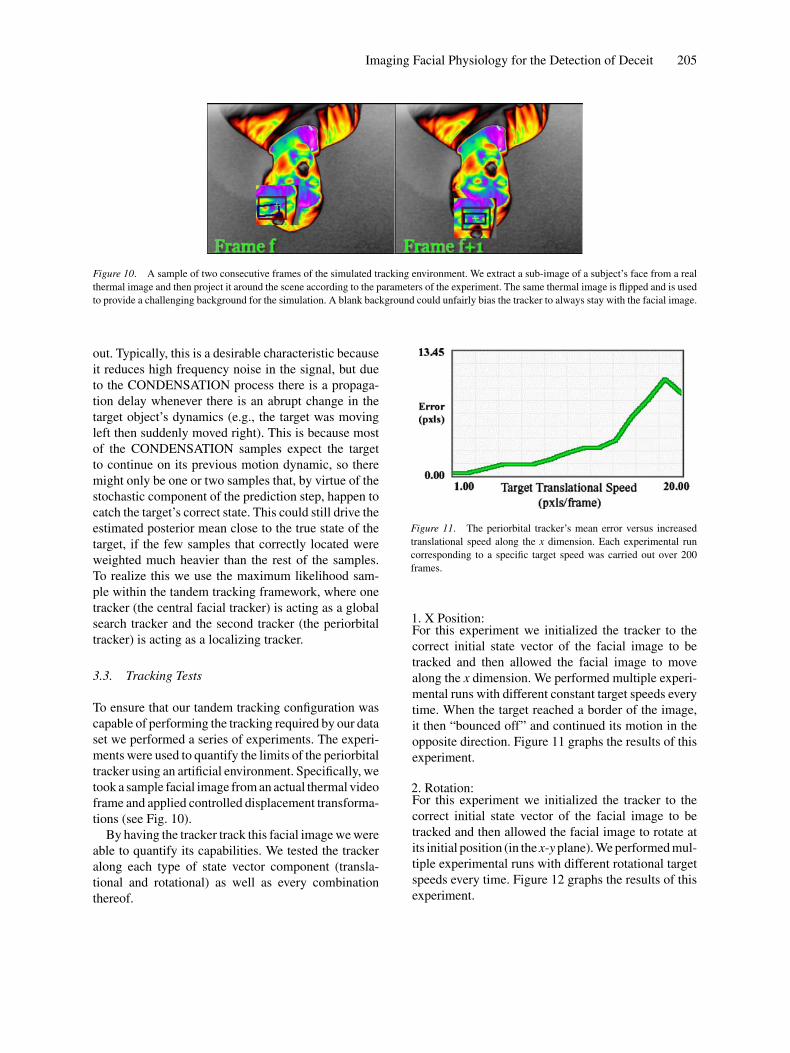
Figure 10. A sample of two consecutive frames of the simulated tracking environment. We extract a sub-image of a subject’s face from a real
thermal image and then project it around the scene according to the parameters of the experiment. The same thermal image is flipped and is used
to provide a challenging background for the simulation. A blank background could unfairly bias the tracker to always stay with the facial image.
out. Typically, this is a desirable characteristic becauseit reduces high frequency noise in the signal, but dueto the CONDENSATION process there is a propaga-tion delay whenever there is an abrupt change in thetarget object’s dynamics (e.g., the target was movingleft then suddenly moved right). This is because mostof the CONDENSATION samples expect the targetto continue on its previous motion dynamic, so theremight only be one or two samples that, by virtue of thestochastic component of the prediction step, happen tocatch the target’s correct state. This could still drive theestimated posterior mean close to the true state of thetarget, if the few samples that correctly located wereweighted much heavier than the rest of the samples.To realize this we use the maximum likelihood sam-ple within the tandem tracking framework, where onetracker (the central facial tracker) is acting as a globalsearch tracker and the second tracker (the periorbitaltracker) is acting as a localizing tracker.
3.3. Tracking Tests
To ensure that our tandem tracking configuration wascapable of performing the tracking required by our dataset we performed a series of experiments. The experi-ments were used to quantify the limits of the periorbitaltracker using an artificial environment. Specifically, wetook a sample facial image from an actual thermal videoframe and applied controlled displacement transforma-tions (see Fig. 10).
By having the tracker track this facial image we wereable to quantify its capabilities. We tested the trackeralong each type of state vector component (transla-tional and rotational) as well as every combinationthereof.
Figure 11. The periorbital tracker’s mean error versus increased
translational speed along the x dimension. Each experimental run
corresponding to a specific target speed was carried out over 200
frames.
1. X Position:For this experiment we initialized the tracker to thecorrect initial state vector of the facial image to betracked and then allowed the facial image to movealong the x dimension. We performed multiple experi-mental runs with different constant target speeds everytime. When the target reached a border of the image,it then “bounced off” and continued its motion in theopposite direction. Figure 11 graphs the results of thisexperiment.
2. Rotation:For this experiment we initialized the tracker to thecorrect initial state vector of the facial image to betracked and then allowed the facial image to rotate atits initial position (in the x-y plane). We performed mul-tiple experimental runs with different rotational targetspeeds every time. Figure 12 graphs the results of thisexperiment.
206 Tsiamyrtzis et al.
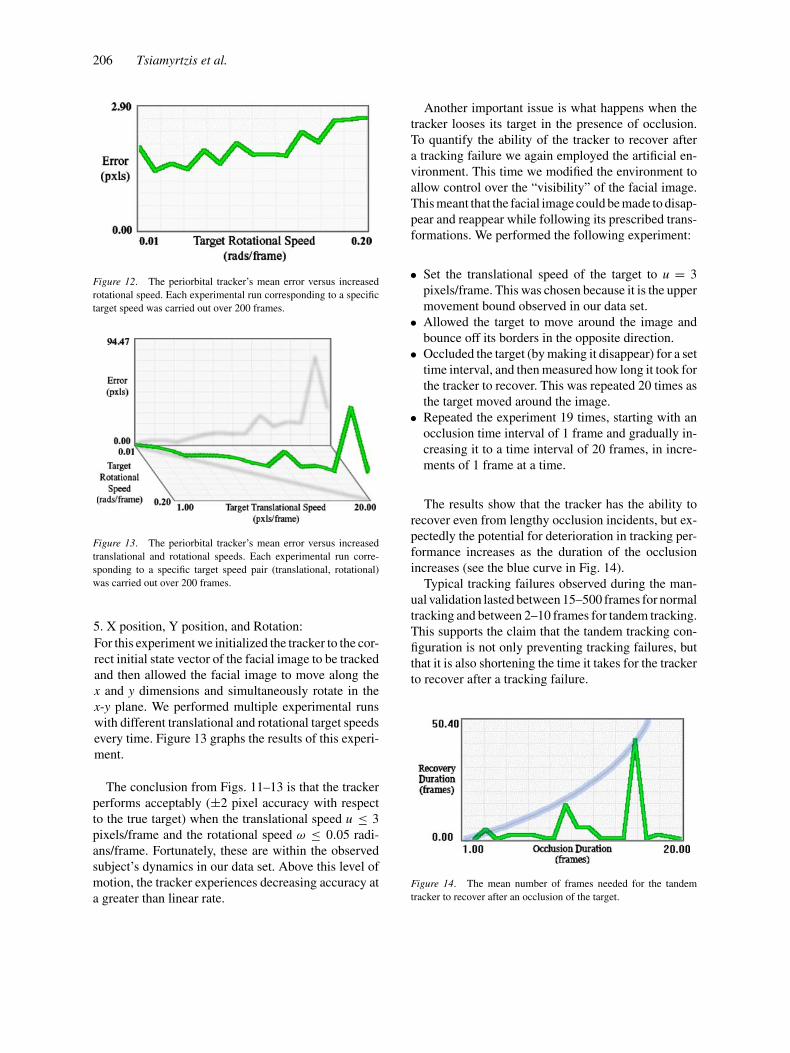
Figure 12. The periorbital tracker’s mean error versus increased
rotational speed. Each experimental run corresponding to a specific
target speed was carried out over 200 frames.
Figure 13. The periorbital tracker’s mean error versus increased
translational and rotational speeds. Each experimental run corre-
sponding to a specific target speed pair (translational, rotational)
was carried out over 200 frames.
5. X position, Y position, and Rotation:
For this experiment we initialized the tracker to the cor-rect initial state vector of the facial image to be trackedand then allowed the facial image to move along thex and y dimensions and simultaneously rotate in thex-y plane. We performed multiple experimental runswith different translational and rotational target speedsevery time. Figure 13 graphs the results of this experi-ment.
The conclusion from Figs. 11–13 is that the trackerperforms acceptably (±2 pixel accuracy with respectto the true target) when the translational speed u ≤ 3pixels/frame and the rotational speed ω ≤ 0.05 radi-ans/frame. Fortunately, these are within the observedsubject’s dynamics in our data set. Above this level ofmotion, the tracker experiences decreasing accuracy ata greater than linear rate.
Another important issue is what happens when thetracker looses its target in the presence of occlusion.To quantify the ability of the tracker to recover aftera tracking failure we again employed the artificial en-vironment. This time we modified the environment toallow control over the “visibility” of the facial image.This meant that the facial image could be made to disap-pear and reappear while following its prescribed trans-formations. We performed the following experiment:
• Set the translational speed of the target to u = 3pixels/frame. This was chosen because it is the uppermovement bound observed in our data set.
• Allowed the target to move around the image andbounce off its borders in the opposite direction.
• Occluded the target (by making it disappear) for a settime interval, and then measured how long it took forthe tracker to recover. This was repeated 20 times asthe target moved around the image.
• Repeated the experiment 19 times, starting with anocclusion time interval of 1 frame and gradually in-creasing it to a time interval of 20 frames, in incre-ments of 1 frame at a time.
The results show that the tracker has the ability torecover even from lengthy occlusion incidents, but ex-pectedly the potential for deterioration in tracking per-formance increases as the duration of the occlusionincreases (see the blue curve in Fig. 14).
Typical tracking failures observed during the man-ual validation lasted between 15–500 frames for normaltracking and between 2–10 frames for tandem tracking.This supports the claim that the tandem tracking con-figuration is not only preventing tracking failures, butthat it is also shortening the time it takes for the trackerto recover after a tracking failure.
Figure 14. The mean number of frames needed for the tandem
tracker to recover after an occlusion of the target.
Imaging Facial Physiology for the Detection of Deceit 207
3.4. Tracking Results
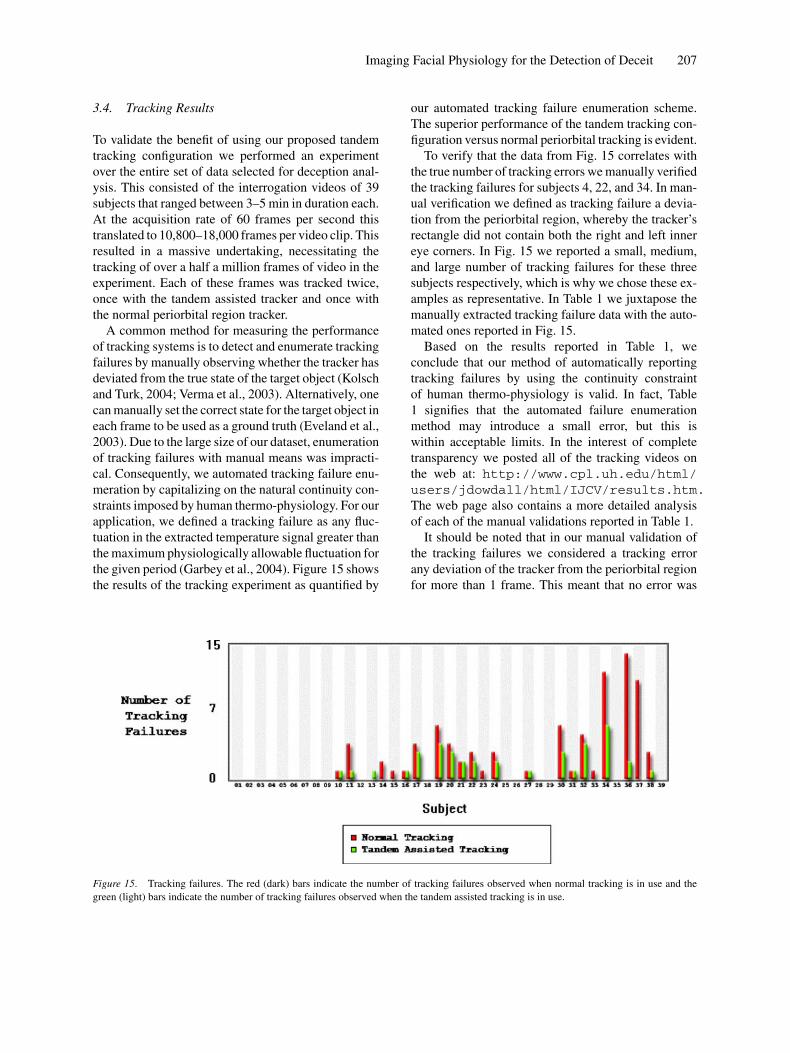
To validate the benefit of using our proposed tandemtracking configuration we performed an experimentover the entire set of data selected for deception anal-ysis. This consisted of the interrogation videos of 39subjects that ranged between 3–5 min in duration each.At the acquisition rate of 60 frames per second thistranslated to 10,800–18,000 frames per video clip. Thisresulted in a massive undertaking, necessitating thetracking of over a half a million frames of video in theexperiment. Each of these frames was tracked twice,once with the tandem assisted tracker and once withthe normal periorbital region tracker.
A common method for measuring the performanceof tracking systems is to detect and enumerate trackingfailures by manually observing whether the tracker hasdeviated from the true state of the target object (Kolschand Turk, 2004; Verma et al., 2003). Alternatively, onecan manually set the correct state for the target object ineach frame to be used as a ground truth (Eveland et al.,2003). Due to the large size of our dataset, enumerationof tracking failures with manual means was impracti-cal. Consequently, we automated tracking failure enu-meration by capitalizing on the natural continuity con-straints imposed by human thermo-physiology. For ourapplication, we defined a tracking failure as any fluc-tuation in the extracted temperature signal greater thanthe maximum physiologically allowable fluctuation forthe given period (Garbey et al., 2004). Figure 15 showsthe results of the tracking experiment as quantified by
Figure 15. Tracking failures. The red (dark) bars indicate the number of tracking failures observed when normal tracking is in use and the
green (light) bars indicate the number of tracking failures observed when the tandem assisted tracking is in use.
our automated tracking failure enumeration scheme.The superior performance of the tandem tracking con-figuration versus normal periorbital tracking is evident.
To verify that the data from Fig. 15 correlates withthe true number of tracking errors we manually verifiedthe tracking failures for subjects 4, 22, and 34. In man-ual verification we defined as tracking failure a devia-tion from the periorbital region, whereby the tracker’srectangle did not contain both the right and left innereye corners. In Fig. 15 we reported a small, medium,and large number of tracking failures for these threesubjects respectively, which is why we chose these ex-amples as representative. In Table 1 we juxtapose themanually extracted tracking failure data with the auto-mated ones reported in Fig. 15.
Based on the results reported in Table 1, weconclude that our method of automatically reportingtracking failures by using the continuity constraintof human thermo-physiology is valid. In fact, Table1 signifies that the automated failure enumerationmethod may introduce a small error, but this iswithin acceptable limits. In the interest of completetransparency we posted all of the tracking videos onthe web at: http://www.cpl.uh.edu/html/users/jdowdall/html/IJCV/results.htm.The web page also contains a more detailed analysisof each of the manual validations reported in Table 1.
It should be noted that in our manual validation ofthe tracking failures we considered a tracking errorany deviation of the tracker from the periorbital regionfor more than 1 frame. This meant that no error was
208 Tsiamyrtzis et al.
Table 1. Manual validation of tracking errors.
Number of Number of Number of single frame
tracking failures tracking failures tracking failures
reported in recorded ignored in manual
Figure 15 manually Discrepancy validation
Normal Tandem Normal Tandem Normal Tandem Normal Tandem
Subject 4 0 0 0 0 0 0 0 0
Subject 22 3 2 8 2 5 0 1 0
Subject 34 12 6 14 5 2 −1 2 6
recorded if the tracker recovered to the correct orienta-tion the subsequent frame after a tracking failure (seethe last column of Table 1). We defined tracking failuresthis way because the high frequency noise in temper-ature extraction resulting from single frame trackingfailures was easily removed by the noise suppressionalgorithm.
We found three main causes for the tracking failuresthat we observed within our data set:
1. Out-of-plane rotation of the target2. Occlusion of the target3. Frames dropped in the video sequence during
recording
Surprisingly, by far the most common cause of thetracking failures was due to dropped frames (1 or moreframes) in the video. This issue occurred in a few ofthe video clips because of a hard drive fragmentationproblem during the recording of the interrogations.
Subjects wearing glasses were excluded from ourdata set because temperature extraction around the pe-riorbital region would be impaired by the lenses of
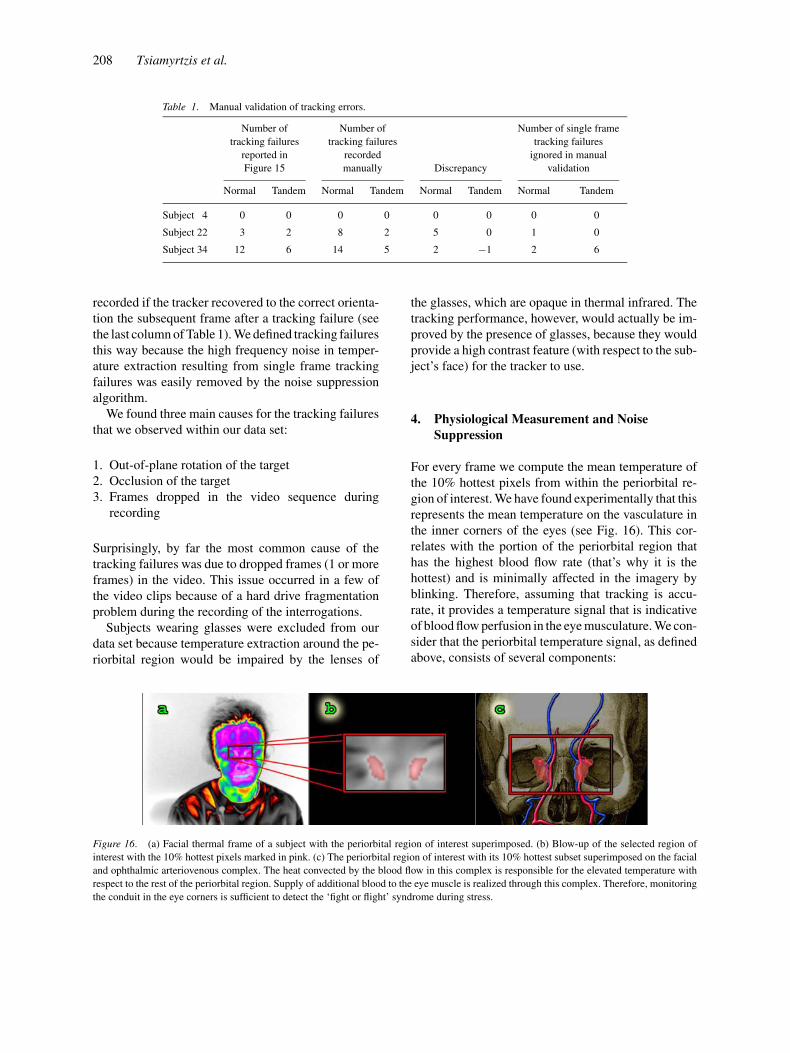
Figure 16. (a) Facial thermal frame of a subject with the periorbital region of interest superimposed. (b) Blow-up of the selected region of
interest with the 10% hottest pixels marked in pink. (c) The periorbital region of interest with its 10% hottest subset superimposed on the facial
and ophthalmic arteriovenous complex. The heat convected by the blood flow in this complex is responsible for the elevated temperature with
respect to the rest of the periorbital region. Supply of additional blood to the eye muscle is realized through this complex. Therefore, monitoring
the conduit in the eye corners is sufficient to detect the ‘fight or flight’ syndrome during stress.
the glasses, which are opaque in thermal infrared. Thetracking performance, however, would actually be im-proved by the presence of glasses, because they wouldprovide a high contrast feature (with respect to the sub-ject’s face) for the tracker to use.
4. Physiological Measurement and NoiseSuppression
For every frame we compute the mean temperature ofthe 10% hottest pixels from within the periorbital re-gion of interest. We have found experimentally that thisrepresents the mean temperature on the vasculature inthe inner corners of the eyes (see Fig. 16). This cor-relates with the portion of the periorbital region thathas the highest blood flow rate (that’s why it is thehottest) and is minimally affected in the imagery byblinking. Therefore, assuming that tracking is accu-rate, it provides a temperature signal that is indicativeof blood flow perfusion in the eye musculature. We con-sider that the periorbital temperature signal, as definedabove, consists of several components:
Imaging Facial Physiology for the Detection of Deceit 209
1. A low varying component indicative of the longterm trend of blood flow levels, which is of highinformation value.
2. A mid frequency component, which is associatedwith temporary disturbances in blood flow causedby stress in specific Question and Answer (Q&A)sessions. This is also of high information value.
3. A high frequency component caused primarily bytracker instability and systemic noise.
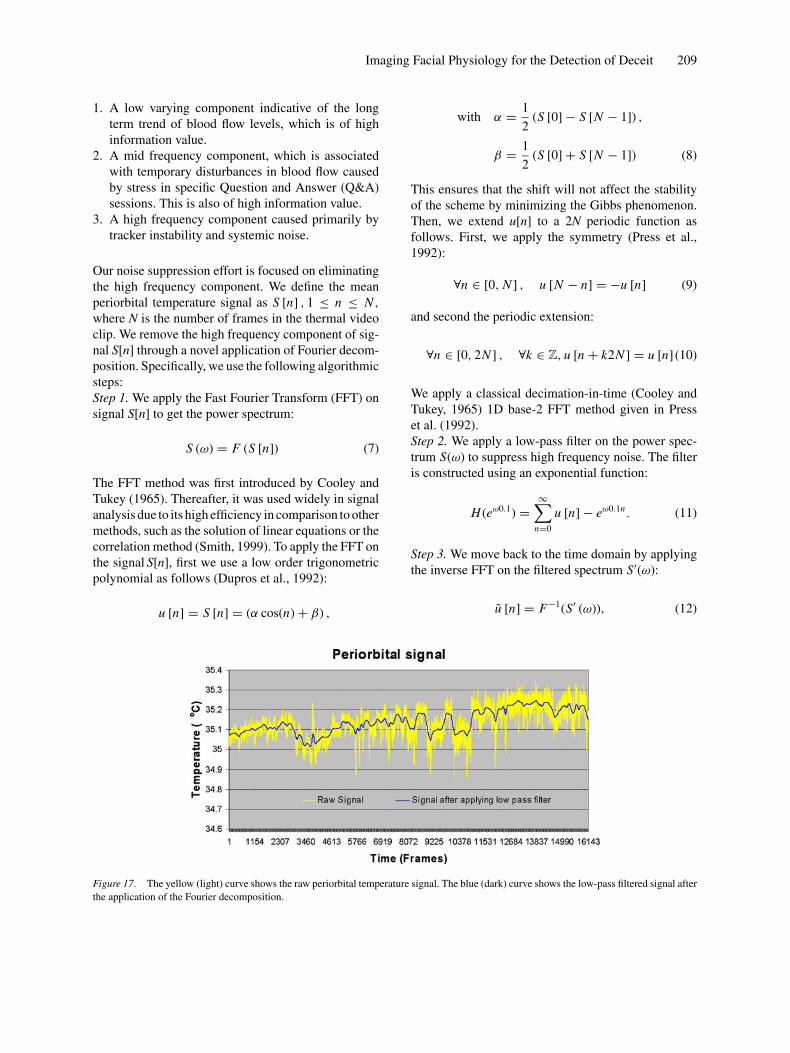
Our noise suppression effort is focused on eliminatingthe high frequency component. We define the meanperiorbital temperature signal as S [n] , 1 ≤ n ≤ N ,
where N is the number of frames in the thermal videoclip. We remove the high frequency component of sig-nal S[n] through a novel application of Fourier decom-position. Specifically, we use the following algorithmicsteps:Step 1. We apply the Fast Fourier Transform (FFT) onsignal S[n] to get the power spectrum:
S (ω) = F (S [n]) (7)
The FFT method was first introduced by Cooley andTukey (1965). Thereafter, it was used widely in signalanalysis due to its high efficiency in comparison to othermethods, such as the solution of linear equations or thecorrelation method (Smith, 1999). To apply the FFT onthe signal S[n], first we use a low order trigonometricpolynomial as follows (Dupros et al., 1992):
u [n] = S [n] = (α cos(n) + β) ,
Figure 17. The yellow (light) curve shows the raw periorbital temperature signal. The blue (dark) curve shows the low-pass filtered signal after
the application of the Fourier decomposition.
with α = 1
2(S [0] − S [N − 1]) ,
β = 1
2(S [0] + S [N − 1]) (8)
This ensures that the shift will not affect the stabilityof the scheme by minimizing the Gibbs phenomenon.Then, we extend u[n] to a 2N periodic function asfollows. First, we apply the symmetry (Press et al.,1992):
∀n ∈ [0, N ] , u [N − n] = −u [n] (9)
and second the periodic extension:
∀n ∈ [0, 2N ] , ∀k ∈ Z, u [n + k2N ] = u [n] (10)
We apply a classical decimation-in-time (Cooley andTukey, 1965) 1D base-2 FFT method given in Presset al. (1992).Step 2. We apply a low-pass filter on the power spec-trum S(ω) to suppress high frequency noise. The filteris constructed using an exponential function:
H (eω0.1) =∞∑
n=0
u [n] − eω0.1n. (11)
Step 3. We move back to the time domain by applyingthe inverse FFT on the filtered spectrum S′(ω):
u [n] = F−1(S′ (ω)), (12)
210 Tsiamyrtzis et al.
followed by re-normalization:
s [n] = u [n] + (α cos [n] + β) . (13)
The low-pass filtered signal s [n], 1 ≤ n ≤ N (seeFigure 17) is fed to the pattern recognition module.
Additionally, an explicit mechanism within our sig-nal processing framework could be employed to ig-nore the temperature measurements whenever a serioustracking failure occurs. Such a failure could be ascer-tained by monitoring an appropriately defined fitnessfunction. Because the recovery time of tracking fail-ures in our present data set was generally very small,we chose not to employ such a method. In the future,however, it may prove advantageous as a first level de-noising step to directly segment the temperature sig-nal into “correctly tracked” and “incorrectly tracked”sections. Depending on the extent and criticality of theincorrectly tracked sections, they can either be ignored,or the entire signal declared corrupt and no predictionis being attempted.
5. Pattern Recognition
We were interested in deriving a decision scheme,which could separate the Deceptive (D) subjects fromthe Non-Deceptive (ND) subjects, based on the noise-cleaned temperature signals. Our previous research in-dicated that elevated levels of stress are associatedwith elevated periorbital perfusion and temperatures(Pavlidis et al., 2000; Pavlidis et al., 2002). However,the degree of temperature elevation depends not only onthe intensity of stress but also on the psycho-physiologyof the subject. Different subjects react with different in-tensity to the same stress stimuli (Pavlidis and Levine,2002). Therefore, an effective decision scheme has tonormalize inter-individual variability through an intra-individual measure. We compute the slope Di of thefiltered temperature signal s[n] that corresponds to theentire length of the interrogation for each subject i. Thisrepresents the trend or baseline response of the subjectto the experiment. We also compute the slope di 4 ofthe portion of the signal that corresponds to the Q&Asession with the highest impact factor. We define asthe impact factor, the level of perceived psychologicalstress a question has per unit time. In other words, fora question to have a high impact factor it is not onlynecessary to be ‘tough,’ but also short and feature anexperimentally confirmable lie. It should also be pre-ceded by a series of questions that slowly build pressure
on a subject up to a culmination point. In our interro-gation scheme, question 4 qualifies as such a question.In the computation of di 4 we consider the signal fromthe beginning of question 4 to the beginning of the re-spective answer. Per the psycho-physiological theorythis is the interval of interest in a Q&A session.
Our decision scheme is based on the comparison ofslope di 4 with Di for subject i:
di4 − Di →{
>0 subject i is D,
≤0 subject i is ND.(14)
In other words, if the physiological change in the crit-ical question is greater than the baseline change, thenthe subject is classified as deceptive. This binary clas-sification rule can be relaxed by establishing a third‘indecision’ class when di 4−Di is very close to 0.
6. Experimental Setup and Results
The current psychological experiment builds upon themethodology outlined in Frank and Ekman (1997) byDr. M.G. Frank et al. It is based on the psychologicaltheory of lying developed by Dr. P. Ekman over the lastthirty years (Ekman, 1986; Ekman and Maureen, 1991;Ekman, 1996; Ekman, 2001). The experiment was de-signed by the Communication Lab of Professor M.G.Frank in Rutgers University (currently at Universityof Buffalo, SUNY). Subjects were a sub-sample of 39(19 males, 20 females) taken randomly from a largerpopulation of 250 developed by Frank & Ekman. Theywere all members of politically active groups both onand off campus. The subjects responded to either faceto face or e-mail enquiries to participate in a commu-nication skills experiment. When they appeared in thelaboratory, they were told that deception is a part ofcommunication, and that is the skill under examinationfor this experiment. They then completed a number ofdemographic and personality inventories. Afterward,they were presented with their specific instructions forthe deception situation. They were told that there was acheck in an envelope hidden down the hall. This checkwas made out to a group that the subject adamantlyopposed (e.g., pro-life subject, check made out to pro-choice group, and vice versa). The subject was told tofind the check, and then decide whether or not to ‘steal’it. If they stole it, they were to put it in their pocket.Whether or not they took the check, they then returnedto the experimenter. The subject was then interrogatedby a person whom they believe belongs to (or is a strongsupporter of) a group they oppose (e.g., the subject who
Imaging Facial Physiology for the Detection of Deceit 211
is pro-life will be interrogated by a person whom theybelieve is pro-choice). This means that a subject whostole the check lied about it under interrogation. If theyfooled the interrogator, they were able to tear up thecheck (thus depriving their hated group of money), andthey obtained $75 for themselves and this $100 wouldgo to their group instead. If they failed to convince theinterrogator of their innocence (i.e., caught lying), the$100 check would go to the group that the subject de-spised, the subject and their group would get no money,and the subject must withstand 30 min of loud, startlingblasts of noise delivered via headphones. If the subjectdid not take the money, and they were judged truth-ful, they received $25 for themselves and $25 for theirgroup, and the despised group would not get $100 buta smaller sum instead. If the subject was mistakenlyjudged as lying, then neither they nor their group gotany money, the despised group got less money, and thesubject was to face the loud startling blasts of noise.Note that no subjects were actually punished with theloud startling blasts of noise and all received at leastsome money for participation. What was important wasfor subjects to feel there was a punishment for not beingseen as truthful.
The interrogation questions were derived by a panelof homicide and counter-terrorism professionals inconjunction with behavioral scientists. Two of the ques-tions specifically tested the ideas around a popular in-terrogation technique called the Reid technique (Inbauet al., 2001), whereas the others were designed to elicitmaximum useful nonverbal behaviors. In particular, theinterrogation was composed of the following questions:
1. Describe in detail everything you saw down thehall.
2. Describe your actions while you were down thehall.
3. What was going through your mind regardingwhether to take or leave the check?
4. Did you remove the check from the envelope?5. Is there anything else you wish to tell me about the
check or what you did?6. Is everything you have told me about the check the
truth?7. What would you say if later I determined you lied
to me about the check?8. Where did you put the check?9. What should happen to a person who took a check
like this?10. Have you ever told a lie to get out of serious
trouble?
11. I know who that check was made out to. It is veryunderstandable that you would not want to seemoney going to that organization. If I were in yourshoes, I probably would have done anything in mypower to avoid having money go to this organiza-tion. Now tell me the truth, did you take that checkor not?
12. If you were to take a polygraph (lie detector ma-chine) test, what do you think the results of thistest would be?
13. Why do you think that someone would take thischeck?
The experiments were conducted through the courseof 19 months in a standard room. Three different envi-ronmental conditions were realized through the courseof the experiments, each spanning several months induration. Initially, the subjects were illuminated witha strong photographic light, which caused significantelevation of the facial temperature. The setting simu-lated to a certain degree outdoor conditions, where thesubject would have been exposed to the sun. This initialbatch of subjects is marked as Tape I in Table 2. Midwayin the course of the experiments the photographic lightwas removed and the room was heated (winter time) toa typical indoor temperature (25◦C) while the subjectswere dressed moderately. This is marked as Tape II inTable 2. Towards the end of the experiment the roomwas maintained to a typical indoor temperature (27◦C)without heating (spring time) and the subjects werelightly dressed. This is marked as Tape III in Table 2.
In essence, our experiment created a “high stakes”situation for the subjects. Other mock-crime scenariosare much milder and it is questionable how stronglythey motivate the subjects (Pavlidis and Levine, 2002).For example, a typical scenario is for the subject toget $10 if he/she gets caught lying and $20 if he/sheis successfully evasive. This is void of any ideologi-cal content and with only a small amount of moneyat stake. The difference between the two psychologi-cal designs is obvious even to a layperson. The othercharacteristic that set our experiment apart is that itallowed subjects to respond freely; questioning hap-pened only once, and proceeded at a natural speed. Intraditional mock crime scenarios binary answers areenforced (‘yes’ or ‘no’) and the exact same question-ing is repeated three times in fixed intervals. Therefore,“high stakes” coupled with a much more natural inter-rogation scheme made our experiment quite realistic.This removes to a large degree the perennial criticism
212 Tsiamyrtzis et al.
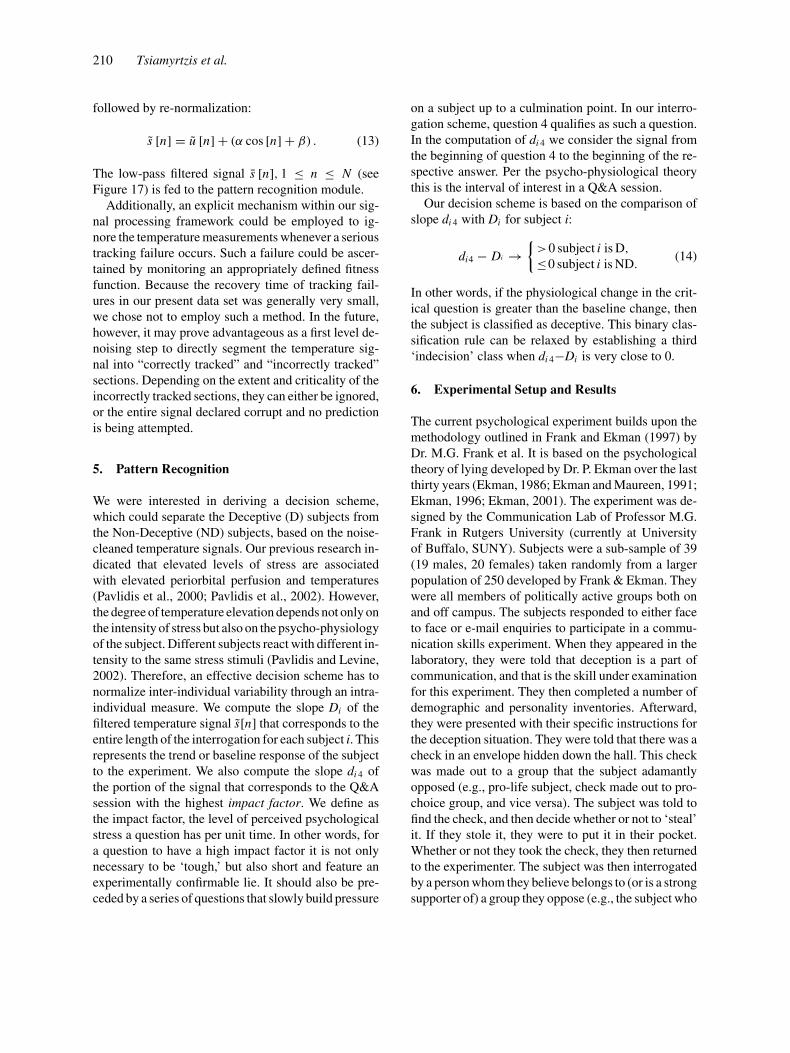
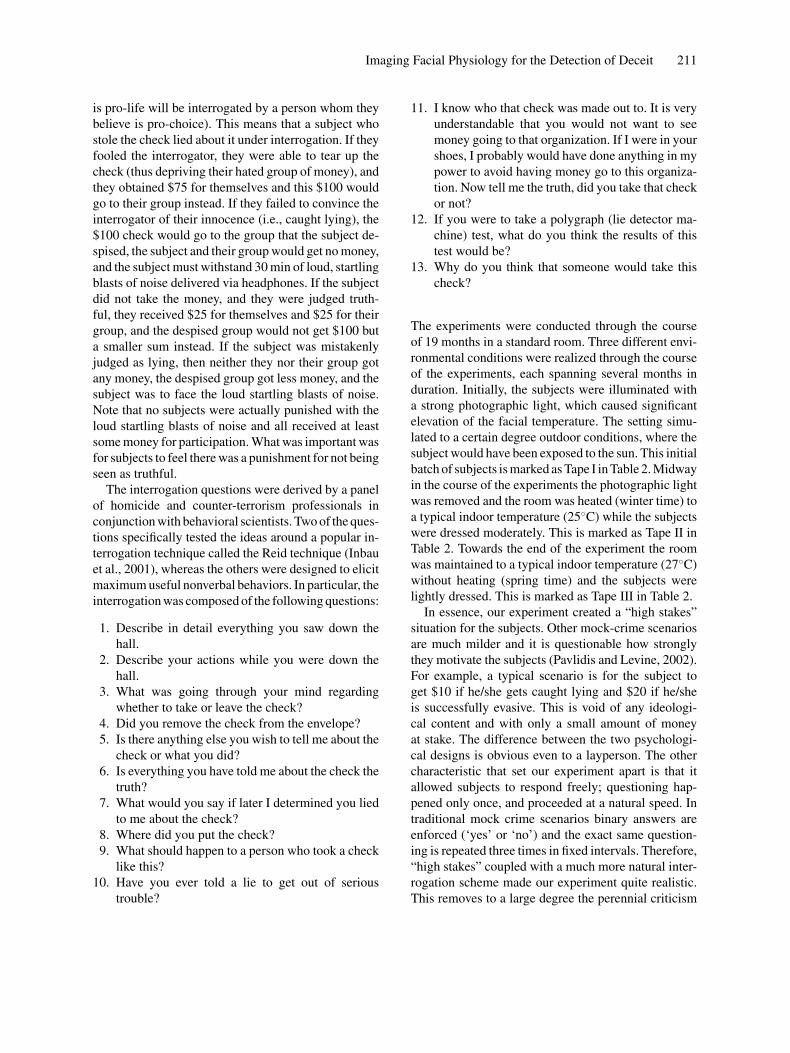
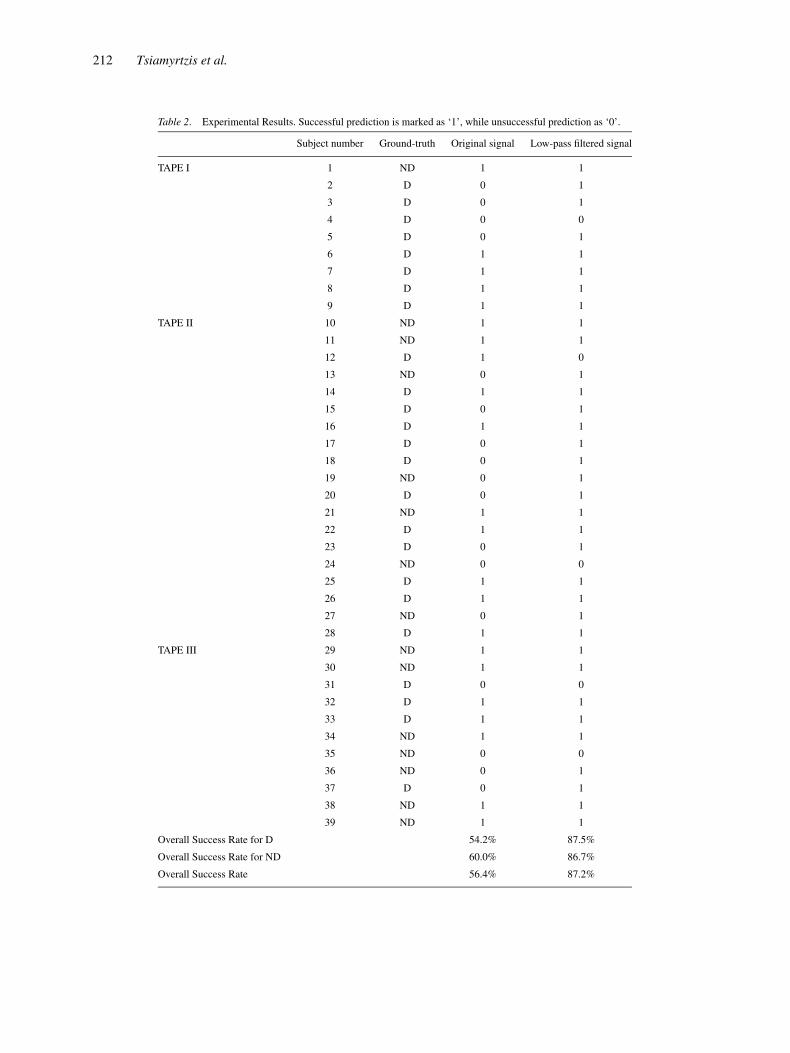
Table 2. Experimental Results. Successful prediction is marked as ‘1’, while unsuccessful prediction as ‘0’.
Subject number Ground-truth Original signal Low-pass filtered signal
TAPE I 1 ND 1 1
2 D 0 1
3 D 0 1
4 D 0 0
5 D 0 1
6 D 1 1
7 D 1 1
8 D 1 1
9 D 1 1
TAPE II 10 ND 1 1
11 ND 1 1
12 D 1 0
13 ND 0 1
14 D 1 1
15 D 0 1
16 D 1 1
17 D 0 1
18 D 0 1
19 ND 0 1
20 D 0 1
21 ND 1 1
22 D 1 1
23 D 0 1
24 ND 0 0
25 D 1 1
26 D 1 1
27 ND 0 1
28 D 1 1
TAPE III 29 ND 1 1
30 ND 1 1
31 D 0 0
32 D 1 1
33 D 1 1
34 ND 1 1
35 ND 0 0
36 ND 0 1
37 D 0 1
38 ND 1 1
39 ND 1 1
Overall Success Rate for D 54.2% 87.5%
Overall Success Rate for ND 60.0% 86.7%
Overall Success Rate 56.4% 87.2%
Imaging Facial Physiology for the Detection of Deceit 213
that such experiments have very little to do with decep-tive behavior in the real world.
The interrogations were recorded with the Univer-sity of Houston’s specialized thermal imaging systemalong with a separate synchronized voice channel.The recorded thermal clips were processed using themethodology outlined in Sections 3–5. The voice chan-nel was used to delineate the interrogation and thecritical question 4 interval in the frame sequences.The decisions supported by our scheme were comparedagainst the ground-truth released by the Communica-tion Lab of Professor M.G. Frank. The detailed classi-fication results are shown in Table 2. The results clearlydemonstrate the beneficial role of the low-pass filteringalgorithm. It is also interesting to note that the methodis more successful in detecting Deceptive (D) ratherthan Non-Deceptive (ND) subjects.
Based on the trend exhibited by the current experi-mental results, it is reasonable to expect that the perfor-mance of the method can improve simply by improvingthe accuracy of the tracking algorithm and the qualityof the thermal imaging system.
7. Conclusions
We have presented a new methodology for recoveringthe periorbital signal from thermal facial sequences. Ituses tandem tracking and noise suppression. Tandemtracking ensures that the periorbital region of interestis tracked accurately by weighing in feedback fromthe central facial region tracker. Noise suppression re-moves the high frequency components from the peri-orbital signal, which are due to tracking imperfectionsand electronic interference. The filtered signal is clas-sified as Deceptive (D) or Non-Deceptive (ND) basedon the slope differential between the entire curve andportions thereof (question 4 in our case). Subjects whoexhibit higher change in critical moments with respectto their interrogation baseline are classified as D. Ourmethod scored an 87.2% accurate prediction rate on39 subjects interrogated by the Communication Lab atRutgers University per the designed mock-crime pro-tocol. This is on par with the performance exhibited byseasoned interrogation experts.
This work follows up on the authors’ previously re-ported methodology and results by the way of the DODPI experiments (Pavlidis and Levine, 2002). This timethe sample was double in size (39 versus 20 subjects)and the conditions were quite realistic. The old methodof amplifying the signal through transformation from
the temperature to the blood flow domain was aban-doned in favor of a noise suppression method. The peri-orbital region of interest has been more clearly definedas the inner corner of the eyes, where the facial andophthalmic arteriovenous complex is supplying bloodflow to the eye musculature. The importance of tissuetracking to cope with motor and fidgeting motion hasbeen brought to the forefront.
Our research further demonstrates the efficacy of au-tomated lie detection by shedding more light into theassociated physiological mechanism and coping withincreasingly more realistic experiments.
A number of extensions to this work could be made.To improve the performance of the tracking algo-rithm, the information fusion between the central re-gion tracker and the periorbital region tracker could beextended to be bi-directional. Also, the thermal tem-plate could be updated over time (Matthews et al., 2004)to conform more closely to the dynamic perfusion ofthe subject, resulting in better tracking. Additionally,we could extend the parameterization of the tracker tofull affine transformations to better represent out-of-plane rotations. In the future, we plan on processingmore subjects to ensure that the method continues toscale up in larger data sets and is adaptable to diverseinterrogation scenarios.
There are still a number of limitations to this tech-nology. For example, eyeglasses were an impermeableobstacle to the thermal signal and thus subjects withglasses could not be analyzed. However, this studyclearly shows that our system and method have a greatdeal of promise in applied lie catching situations.
Acknowledgments
This research was supported by DARPA/ONR grant#N00014-03-1-0622 (‘Thermal Imaging Experimenta-tion and Analysis for Deception Detection’) and bythe University of Houston start-up funds of ProfessorIoannis T. Pavlidis. Additional support was providedby DARPA/ONR grant #N00014-02-1-0709 (‘RobustFace Recognition from a High Stakes Paradigm’) toProfessors Mark G. Frank and Paul Ekman, DARPA/ONR grant #N00014-03-1-0847 (‘Remote Measures inthe Detection of Deception in a Counter-Terror Situa-tion’), and HSARPA grant # ITT-180120 (“ExaminingDeception in a Counter-Terror Paradigm) to ProfessorMark G. Frank. The views expressed in this paperdo not necessarily reflect the views of the fundingAgencies. We would like to express our gratitude
214 Tsiamyrtzis et al.
to Dr. Ralph Chatham (DARPA Program Manager),Dr. Jonathon Philips (DARPA Program Manager),Dr. Thomas McKenna (ONR Program Manager), LarryWillis (HSARPA Program Manager), and Dr. AndrewRyan (DOD PI) for their support. We would alsolike to thank Dr. Arcangelo Merla (University G.D’Annunzio), Amy Marie Keller, Sinuk Kang (RutgersUniversity), and Professor Marc Garbey (University ofHouston) for their valuable help.
References
Baker, S. and Matthews, I. 2001. Equivalence and efficiency of image
alignment algorithms. In Proceedings of the 2001 IEEE Confer-ence on Computer Vision and Pattern Recognition, Vol. 1, pp.
1090–1097.
Cooley, J.W. and Tukey, J.W. 1965. An algorithm for the machine cal-
culation of complex Fourier series. Mathematics of Computation,
19:297–301.
Committee to Review the Scientific Evidence on the Polygraph—
Board on Behavioral, Cognitive, and Sensory Sciences and Com-
mittee on National Statistics—Division of Behavioral and Social
Sciences and Education – National Research Council of the Na-
tional Academies. 2003. The Polygraph and Lie Detection, Na-
tional Academies Press, Washington D.C.,
Doucet, A., DeFreitas, N., and Gordon, N. (Eds.) 2001. SequentialMonte Carlo Methods in Practice. Springer-Verlag.
Drummond, P. and Lance, J. 1987. Facial flushing and sweating
mediated by the sympathetic nervous system. Brain, 110:793–
803.
Dupros, F., Fitzgibbon, W.E., and Garbey, M. 2004. A filtering tech-nique for system of reaction diffusion equations. Technical Report
UH-CS-04-02, Department of Computer Science, University of
Houston.
Ekman, P. 1986. Telling Lies. Berkeley Publishing Group.
Ekman, P. and Maureen, O. 1991. Who can catch a liar? AmericanPsychologist, 46(9):913–20.
Ekman, P. 1996. Why don’t we catch liars? Social Research,
63(3):801–17.
Ekman, P. 2001. Telling Lies: Clues to Deceit in the Marketplace,Politics, and Marriage, 2nd ed, W.W. Norton and Company.
Eveland, C., Socolinsky, D., and Wolff, L. July 2003. Tracking human
faces in infrared video. Image and Vision Computing, 21:578–
590.
Frank, M.G. and Ekman, P. 1997. The ability to detect deceit gen-
eralizes across different types of high-stake lies. Personality andSocial Psychology, 72:1429–1439.
Garbey, M., Merla, A., and Pavlidis, I. 2004. Estimation of blood flow
speed and vessel location from thermal video. In Proceedings ofthe 2004 IEEE Computer Vision and Pattern Recognition, Vol. 1,
pp. 356–63.
Inbau, F.E., Reid, J.E., Buckley, J.P., and Jayne, B.C. 2001. CriminalInterrogations and Confessions. Aspen Publishers, 4th edn.
Isard, M. and Black, A. 1998a. Condensation—conditional density
propagation for visual tracking. International Journal of ComputerVision, 19(1):5–28.
Isard, M. and Blake, A. June 1998b. ICONDENSATION: Unifying
low-level and high-level tracking in a stochastic framework. In
Proceedings of the 5th European Conference on Computer Vision,
Freiburg, Germany, Vol. 1, pp. 893–908.
Isard, M. and MacCormick, J. 2001. BraMBle: A Bayesian multiple-
blob tracker. In Proceedings of the 8th International Conferenceon Computer Vision, Vol. 2, pp. 34–41.
Kleinmuntz, B. and Szucko, J.J. 1984. Lie detection in ancient and
modern times. American Psychologist, 39:766–776.
Knight, J. April 15 2004. The truth about lying. Nature, 428:692–94.
Kolsch, M. and Turk, M. 2004. Fast 2D hand tracking with flocks
of features and multi-cue integration. In Proceedings of the 2004IEEE Conference on Computer Vision and Pattern Recognition,
Vol. 10, pp. 158–164.
MacCormick, J. and Isard, M. 2000. Partitioned sampling, articulated
objects, and interface-quality hand tracking. In Lecture Notes inComputer Science, Springer-Verlag, London, U.K., Vol. 1843, pp.
3–19.
MacCormick, J. and Blake, A. 2000. A probabilistic exclusion prin-
ciple for tracking multiple objects. International Journal of Com-puter Vision, 39(1):57–71.
Martini, F.H., Ober, W.C., Garrison C.W., Welch, K., and Hutchings,
R.T. 2001. Fundamentals of Anatomy and Physiology, PrenticeHall, 5th edn, Upper Saddle River, New Jersey.
Matthews, I., Ishikawa, T., and Baker, S. June 2004. The template
update problem. IEEE Transactions on Pattern Analysis and Ma-chine Intelligence, 26(6):810–815.
Pavlidis, I., Levine, J., and Baukol, P. June 16 2000. Thermal imaging
for anxiety detection. In Proceedings of the 2000 IEEE Workshopon Computer Vision Beyond the Visible Spectrum: Methods andApplications, Hilton Head Island, South Carolina, pp. 104–109.
Pavlidis, I., Eberhardt, N.L., and Levine, J. January 3 2002. Hu-
man behavior: Seeing through the face of deception. Nature,
415(6867):35.
Pavlidis, I. and Levine, J. November/December 2002. Thermal image
analysis for polygraph testing. IEEE Engineering in Medicine andBiology Magazine, 21(6):56–64.
Press, W.H., Teukolsky, S.A., Vetterling, W.T., and Flannery, B.F.
1992. Numerical Recipes in C. 2nd edn. Cambridge University
Press, New York, New York,
Smith, S.W. 1999. The Scientist’s and Engineer’s Guide to DigitalSignal Processing. 2nd edn. California Technical Publishing, San
Diego, California.
Sokolov, E.N. and Cacioppo, J.T. 1997. Orienting and defense re-
flexes: Vector coding the cardiac response. In Attention and Ori-enting: Sensory and Motivational Processes, P.J. Lang, and R.F.
Simons, (Ed.) Lawrence Erlbaum Associates, Mahwah, New Jer-
sey, pp. 1–22.
Verma, R., Schmid, C., and Mikolajczyk, K. October 2003. Face
detection and tracking in a video by propagating detection proba-
bilities, IEEE Transactions on Pattern Analysis and Machine In-telligence, 25(10):1215–28.
Yankee, W.J. 1965. An investigation of sphygmomanometer discom-
fort thresholds in polygraph examinations. Police, 9:12–18.