imaging ion-molecule reactions: charge transfer and halide...
TRANSCRIPT

Imaging Ion-Molecule Reactions:
Charge Transfer and Halide Transfer Reactions of O+ with CH3Cl, CH3Br, and CH3I
Linsen Pei and James M. Farrar*
Department of Chemistry University of Rochester
Rochester NY 14627
Abstract
Velocity map images have been recorded for the charge transfer reactions of
O+(4S) with CH3Cl, CH3Br, and CH3I at collision energies near 4 eV. The production of
methyl halide cations occurs for all systems, with relative abundances ranging from 10 to
15% of the total reaction yield. In addition, small yields of the dissociative charge transfer
products Br+ and I+ are observed. The velocity space images show that charge transfer is
energy resonant, and occurs by long range electron transfer. The predominant product in all
three systems is CH3+, which may form by dissociation of the nascent CH3X+ product on a
quartet potential energy surface, or by halide ion abstraction from CH3X by O+ following a
spin-changing transition from the initial quartet surface to a doublet surface. The kinetic
energy distributions for CH3+ formation show both a sharp low energy feature that appears to
describe the formation of CH3+ + O(3P) + X(2P), in addition to a higher energy component
that describes the more exoergic channel forming CH3+ + XO(2Π). The relative intensity of
this high energy feature increases as the halogen atom X changes from Cl to Br to I, a
progression that correlates with the strength of the halogen atom spin-orbit splitting. This
observation supports the conclusion that the formation of the CH3+ products via the most
exoergic channels, i.e., CH3+ + XO(2Π), does occur through spin-changing collisions from
quartet to doublet state surfaces that are mediated by spin-orbit coupling.
Corresponding author. email:[email protected]
2
Introduction
The reactions of atomic oxygen cations have been the subject of many fundamental
studies of gas phase ion chemistry. From the perspective of initiating a diverse range of
chemical processes, the oxygen atomic cation is a particularly important species. With a
recombination energy of 13.6 eV, charge transfer reactions occur with many stable atoms and
molecules, often leading to subsequent dissociation and the production of energized
fragments. The contributions of oxygen cation reactions in the F2 region of the ionosphere
have been well-documented [1], as well as in the chemically complex environments of
hydrocarbon flames [2] and semiconductor processing plasmas [3]. The reactivity of O+ ions
in the technologically important O2/SiF4 discharge employed in silicon etching is particularly
well-established [4].
Despite the importance of this species in many chemical environments, studies of its
chemistry with molecular systems are limited in number, both from the point of view of rates
and reaction dynamics. Reactions of O+ with molecular hydrogen and its isotopomers have
provided important examples of direct [5] and collision complex-mediated processes [6],
have revealed the distinctive dynamical signature of sequential impulse interactions [7], and
have demonstrated the value of molecular orbital and electronic state correlations in
establishing reactive pathways in simple chemical systems [8,9]. Nevertheless, the scope of
general reactivity patterns that O+ exhibits with more complex collision partners remains
quite limited.
Selected ion flow tube (SIFT) measurements of rates and branching ratios of O+ with
halogenated molecules at thermal energies are few in number but have revealed interesting
reactivity patterns. The reactions of O+ with methyl halides are of particular interest, given

3
the significant atmospheric concentrations of these neutral species and their anthropogenic
origins.[10-12] An early study by Mayhew et al.[13] of the O+ + CH3Br system showed that
CH3+ is the major product, but that the charge transfer products CH3Br+ and CH2Br+
represented approximately one-fourth of the total product yield. More recently, Nichols et
al.[14] reported SIFT measurements of rates and branching ratios for O+ reactions with a
series of methyl halides and perfluorinated compounds. Consistent with Mayhew et al., this
study confirmed that the dominant product with CH3Br at thermal energies is CH3+, although
no evidence for the formation of CH3Br+ or CH2Br+ by charge transfer was found. This
investigation confirmed that CH3+ is also the dominant product with CH3Cl and CH3I
reactants, although C-O bond formation to produce HCO+ and H2CO+ was reported with
CH3Cl, along with C-I bond cleavage in CH3I to form I+.
The dominance of the CH3+ product channel raises interesting questions concerning
the role of electron spin: if CH3+ is formed by charge transfer followed by C-X bond
cleavage, then it is accessible from the initially formed CH3X+ species without a change in
spin. However, if CH3+ is formed by halide abstraction in concert with the production of a
ground state XO radical, the system must cross from the initial quartet surface to a doublet
surface. The experimental data reported in [14] did not allow a distinction between these two
mechanisms for CH3+ formation. The authors reported the results of ab initio quantum
chemical calculations on the CH3Cl system on both doublet and quartet surfaces that
rationalized the formation of CH3+ as well as reaction channels producing C-O bonds both on
doublet and quartet surfaces.
Given the importance of the O+ ion in the ionosphere, and the well-established
presence in the atmosphere of methyl halides from anthropogenic sources, the rate

4
determination is particularly significant. Experimental methods that provide dynamical
information [15], such as energy and angular momentum partitioning and product angular
distributions, complement rate measurements and have the capability to address questions
that rate measurements cannot probe. In particular, velocity map ion imaging methods
[16,17] that determine product velocity vector distributions for the primary CH3X+ charge
transfer products and for secondary production of CH3+, have the potential to determine if
CH3+ and X+ products arise from unimolecular decay of the nascent parent ions or from spin-
changing bimolecular collisions of the primary O+ and CH3X reactants.
In this study, we report velocity space imaging results for the reaction products of O+
with the methyl halides CH3Cl, CH3Br, and CH3I at hyperthermal collision energies near 4
eV. The distribution of reaction products at this collision energy, particularly the observation
of non-dissociative charge transfer products, is significantly different from those reported at
300K; however, the study confirms that CH3+ is the predominant reaction product at both
energies. The velocity space images for the CH3+ products appear to provide insight into the
mechanism of their formation.
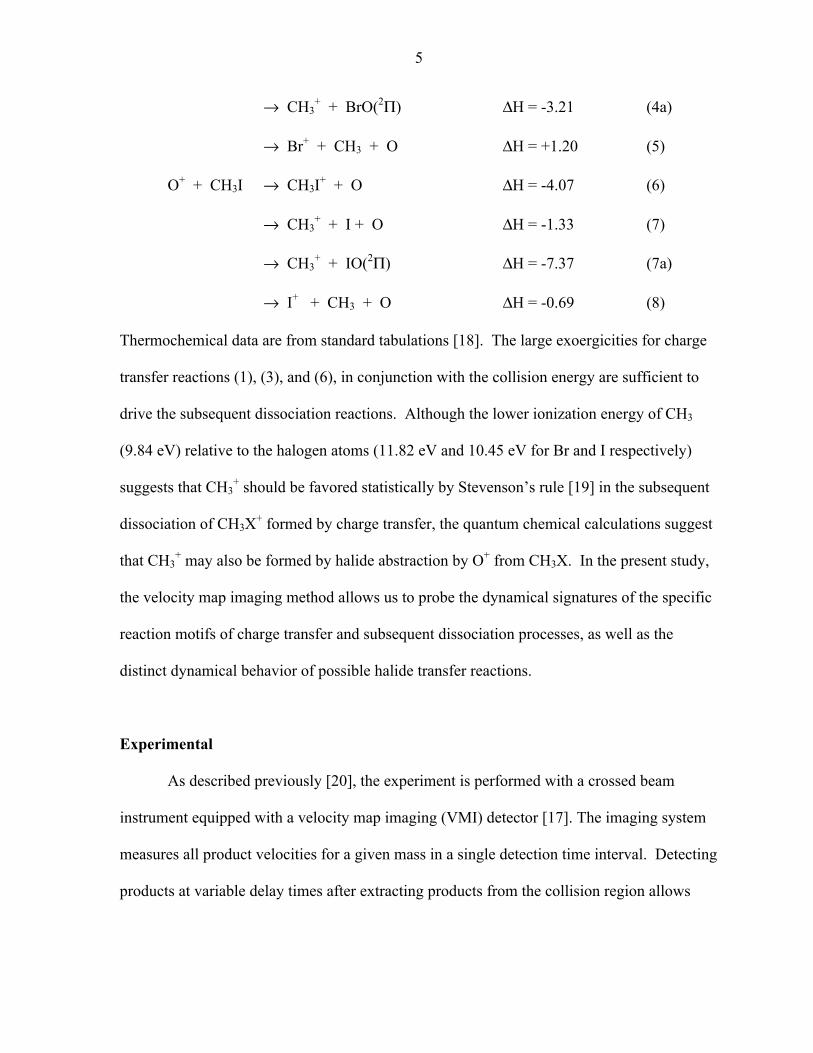
The reactions we have addressed by velocity map imaging methods are listed below.
The reactions include simple electron transfer, dissociative charge transfer to form halide
cations, and the formation of CH3+ in concert with a bound or dissociated OX molecule.
O+ + CH3Cl → CH3Cl+ + O ΔH = -2.35 eV (1)
→ CH3+ + Cl + O ΔH = -0.16 (2)
→ CH3+ + ClO(2Π) ΔH = -2.95 (2a)
O+ + CH3Br → CH3Br+ + O ΔH = -3.07 (3)
→ CH3+ + Br + O ΔH = -0.77 (4)
5
→ CH3+ + BrO(2Π) ΔH = -3.21 (4a)
→ Br+ + CH3 + O ΔH = +1.20 (5)
O+ + CH3I → CH3I+ + O ΔH = -4.07 (6)
→ CH3+ + I + O ΔH = -1.33 (7)
→ CH3+ + IO(2Π) ΔH = -7.37 (7a)
→ I+ + CH3 + O ΔH = -0.69 (8)
Thermochemical data are from standard tabulations [18]. The large exoergicities for charge
transfer reactions (1), (3), and (6), in conjunction with the collision energy are sufficient to
drive the subsequent dissociation reactions. Although the lower ionization energy of CH3
(9.84 eV) relative to the halogen atoms (11.82 eV and 10.45 eV for Br and I respectively)
suggests that CH3+ should be favored statistically by Stevenson’s rule [19] in the subsequent
dissociation of CH3X+ formed by charge transfer, the quantum chemical calculations suggest
that CH3+ may also be formed by halide abstraction by O+ from CH3X. In the present study,
the velocity map imaging method allows us to probe the dynamical signatures of the specific
reaction motifs of charge transfer and subsequent dissociation processes, as well as the
distinct dynamical behavior of possible halide transfer reactions.
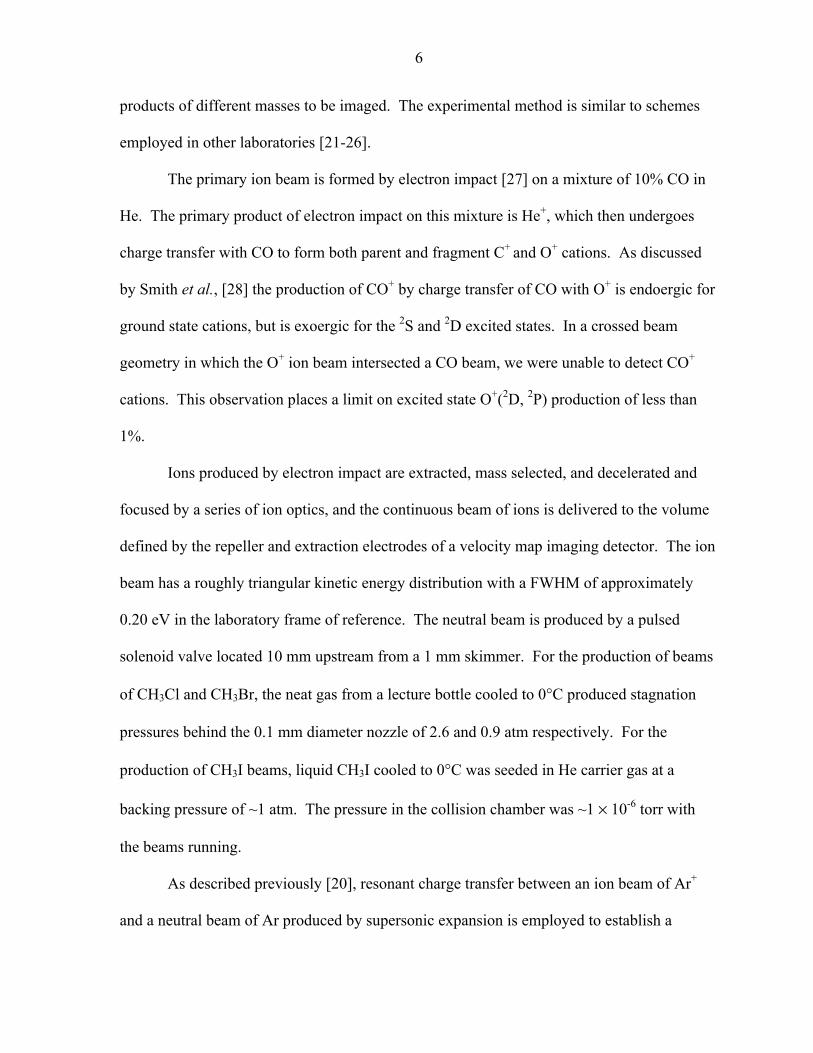
Experimental
As described previously [20], the experiment is performed with a crossed beam
instrument equipped with a velocity map imaging (VMI) detector [17]. The imaging system
measures all product velocities for a given mass in a single detection time interval. Detecting
products at variable delay times after extracting products from the collision region allows
6
products of different masses to be imaged. The experimental method is similar to schemes
employed in other laboratories [21-26].
The primary ion beam is formed by electron impact [27] on a mixture of 10% CO in
He. The primary product of electron impact on this mixture is He+, which then undergoes
charge transfer with CO to form both parent and fragment C+ and O+ cations. As discussed
by Smith et al., [28] the production of CO+ by charge transfer of CO with O+ is endoergic for
ground state cations, but is exoergic for the 2S and 2D excited states. In a crossed beam
geometry in which the O+ ion beam intersected a CO beam, we were unable to detect CO+
cations. This observation places a limit on excited state O+(2D, 2P) production of less than
1%.
Ions produced by electron impact are extracted, mass selected, and decelerated and
focused by a series of ion optics, and the continuous beam of ions is delivered to the volume
defined by the repeller and extraction electrodes of a velocity map imaging detector. The ion
beam has a roughly triangular kinetic energy distribution with a FWHM of approximately
0.20 eV in the laboratory frame of reference. The neutral beam is produced by a pulsed
solenoid valve located 10 mm upstream from a 1 mm skimmer. For the production of beams
of CH3Cl and CH3Br, the neat gas from a lecture bottle cooled to 0°C produced stagnation
pressures behind the 0.1 mm diameter nozzle of 2.6 and 0.9 atm respectively. For the
production of CH3I beams, liquid CH3I cooled to 0°C was seeded in He carrier gas at a
backing pressure of ~1 atm. The pressure in the collision chamber was ~1 × 10⁻⁶ torr with
the beams running.
As described previously [20], resonant charge transfer between an ion beam of Ar+
and a neutral beam of Ar produced by supersonic expansion is employed to establish a

7
velocity marker at thermal velocity, corresponding to a lab energy of 0.064 eV. Coupled
with direct measurement of the ion beam energy distribution with an electrostatic energy
analyzer, these measurements result in a velocity scale that is accurate to ± 0.2 × 10² m s-1.
Although the beam energy spreads make a significant contribution to the overall
detector resolution, the primary experimental contribution comes from the finite thickness of
the collision center. Reaction products formed at various depths within the collision volume
are accelerated to different extents and therefore do not satisfy a unique velocity-mapping
condition.
Results and Discussion
A. General dynamical signatures: velocity map images
In this presentation of the experimental results, we first focus on the general shapes of
the velocity space images and the qualitative dynamical classifications that these images
reveal.
1. Charge transfer
In contrast to the thermal energy flow tube results, the hyperthermal crossed beam
experiments provide direct evidence for the formation of methyl halide cations by charge
transfer, with relative abundances ranging from 10 to 15%. The relative intensity data are
summarized in Table I. Figure 1 shows the images for CH3Cl+, CH3Br+ and CH3I+ product
formation superimposed on the Newton diagrams describing the directions of the ion and
neutral beam velocity vectors and the centroid vectors C, all referenced to the laboratory
origin. The circles denote the locus of points corresponding to the maximum values of the
8
center of mass speeds for the charge transfer products allowed by energy conservation. The
images show that the charge transfer products appear near the tip of the neutral velocity
vector, and follow the locus expected for elastic scattering of the reaction products in the exit
channel. This behavior is precisely what is expected for energy resonant charge transfer, in
which the kinetic energies of the molecular precursors and the charge transfer products are
unchanged.
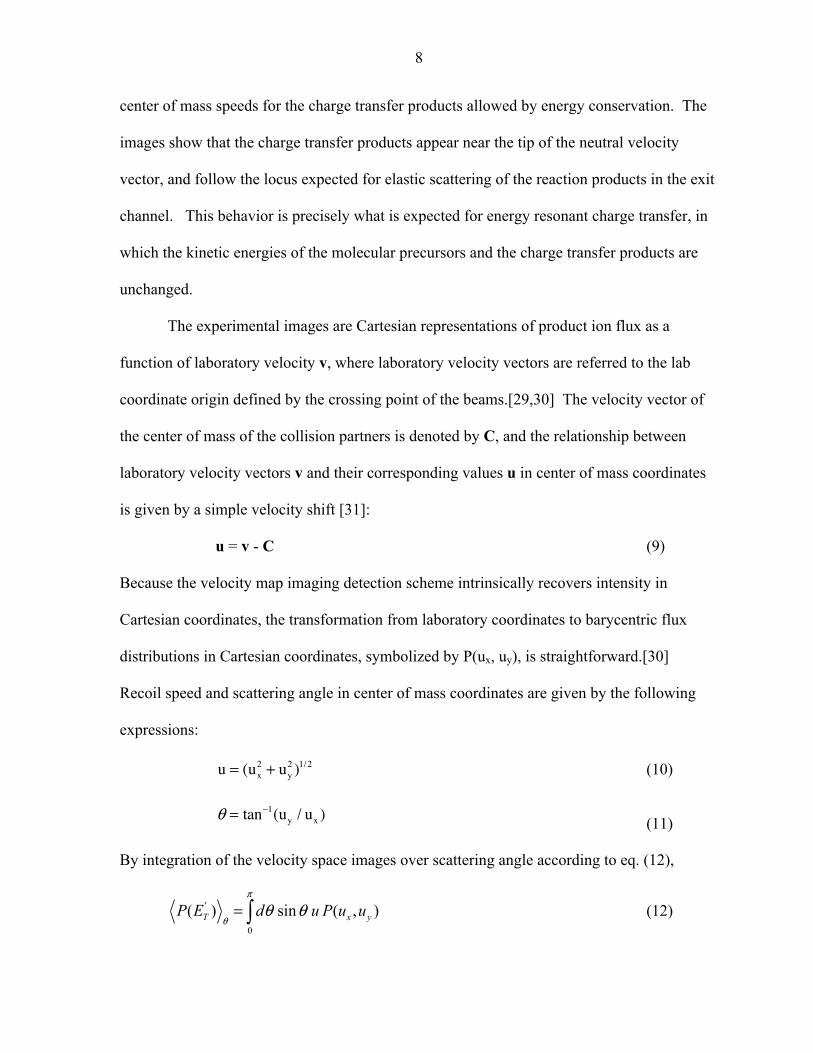
The experimental images are Cartesian representations of product ion flux as a
function of laboratory velocity v, where laboratory velocity vectors are referred to the lab
coordinate origin defined by the crossing point of the beams.[29,30] The velocity vector of
the center of mass of the collision partners is denoted by C, and the relationship between
laboratory velocity vectors v and their corresponding values u in center of mass coordinates
is given by a simple velocity shift [31]:
u = v - C (9)
Because the velocity map imaging detection scheme intrinsically recovers intensity in
Cartesian coordinates, the transformation from laboratory coordinates to barycentric flux
distributions in Cartesian coordinates, symbolized by P(ux, uy), is straightforward.[30]
Recoil speed and scattering angle in center of mass coordinates are given by the following
expressions:
u = (ux2 + uy
2 )1/2 (10)
θ = tan−1(uy / ux ) (11)
By integration of the velocity space images over scattering angle according to eq. (12),
'
0
( ) sin ( , )π
θθ θ= ∫T x yP E d u P u u (12)
9
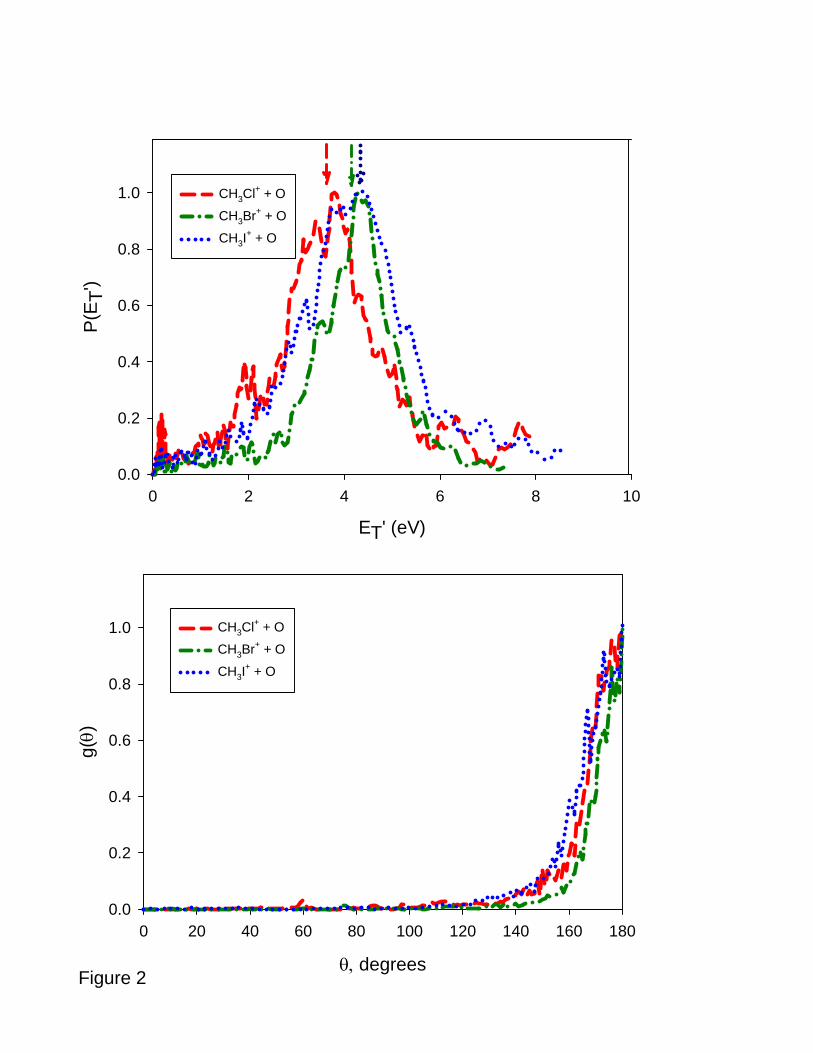
the product kinetic energy distribution for charge transfer may be obtained, and these results
are shown in the top panel of Figure 2. Immediately obvious is the fact that the distributions
peak at the collision energy of the experiments, indicative of energy resonant charge transfer
in which the kinetic energies of the reactants and products are equal. As noted in our other
publications [20,32,33], the kinetic energy distributions in charge transfer mirror the
distributions of internal states consistent with the Franck-Condon factors connecting the
neutral reactant and its ion [34,35]. The low energy photoelectron spectra of methyl halides
provide some insight on this point: the spectra generally show a weakly structured band near
threshold, consistent with Franck-Condon activity in the C-X stretch of the methyl halide
[36].
The product angular distributions obtained by integrating the velocity space
distributions over recoil speed may be calculated according to eq. (13),
2
0
( ) ( , )θ∞
= ∫ x yug du u P u u (13)
and as shown in the bottom panel of Figure 2, are sharply peaked at 180° in the center of
mass system, consistent with the negligible change in momentum of the methyl halide cation
relative to its neutral precursor. Energy and angular distributions like those shown in Figure
2 are a signature of long range resonant charge transfer.
2. Dissociative charge transfer: Br+ and I+ formation
The mass resolution of the imaging method precludes the measurement of images
resulting from hydrogen atom loss from nascent methyl halide cations formed by direct
charge transfer. However, methyl halide cations may also dissociate to the methyl cation and
a halogen atom, or to a halogen cation and a methyl radical. The lower ionization energy of
10
CH3 relative to the halogen atoms makes the former the favored dissociation product. At the
thermal energies of the flow tube experiments, only cleavage of the weak C-I bond occurs to
produce I+.[14] However, at the hyperthermal collision energies of the present experiments,
the reaction thermochemistry allows both Br+ and I+ to be formed from CH3Br and CH3I
respectively. The velocity space images for these products are shown in Figure 3. As was
the case with the methyl halide cations, the images show that the products are also centered
on the tip of corresponding neutral beam vectors, and support the claim that these species are
formed by dissociative ionization of the methyl halide.
The product relative translational energy of the three-body systems X+ + CH3 + O is
given as the sum of the relative translational energy between O and the center of mass of the
fragments CH3 + X+, plus the relative translational energy of the separating fragments. We
expect the CH3 + X+ products to follow the velocity vector of the precursor methyl halide
cation product. Although the Br+ and I+ images are perceptibly broader than those associated
with the methyl halide products, they are reasonably sharp, and justify an analysis based on
the collision-activated dissociation of polyatomic ions [37-39]. This method sets the center of
mass velocity vector u for the detected product Br+ or I+ equal to the CH3Br+ or CH3I+
velocity determined by momentum matching to the accompanying O atom product, i.e., |u| =
3+ +≈
X CH Xu u . The final relative translational energy of the products is computed from the
center of mass speed of the detected fragment through the relationship
3' 212
= CH XT
O
mE Mu
m (14)
where M is the total mass of the collision system and u is the center of mass speed of the
detected fragment ion.
11
The results of this approximate kinematic analysis may be employed to produce
product kinetic energy distributions and angular distributions for the Br+ and I+ products and
are shown in Figure 4. The similarities of these plots to the kinetic energy and angular
distributions for the primary methyl halide products in Figure 2 provide reasonable
confirmation that these halogen cation products are the result of dissociative charge transfer.
Perhaps a subtle distinction, the picture of dissociative charge transfer that emerges from the
data is that the process occurs as the primary charge transfer product CH3X+ undergoes C-X
bond cleavage to form CH3 + X+, rather than by a single step collision-induced dissociation
process.
3. CH3+ formation
The crossed beam studies show that the formation of CH3+ is the dominant reaction
process, ranging from 64% of the total product yield for CH3I to ~90% for CH3Br and CH3Cl.
Although the relative intensities of the CH3+ products in the hyperthermal energy range of the
present experiments are quantitatively different than the results at 300K, this product is the
dominant one in both energy regimes. The results are shown in Table I.
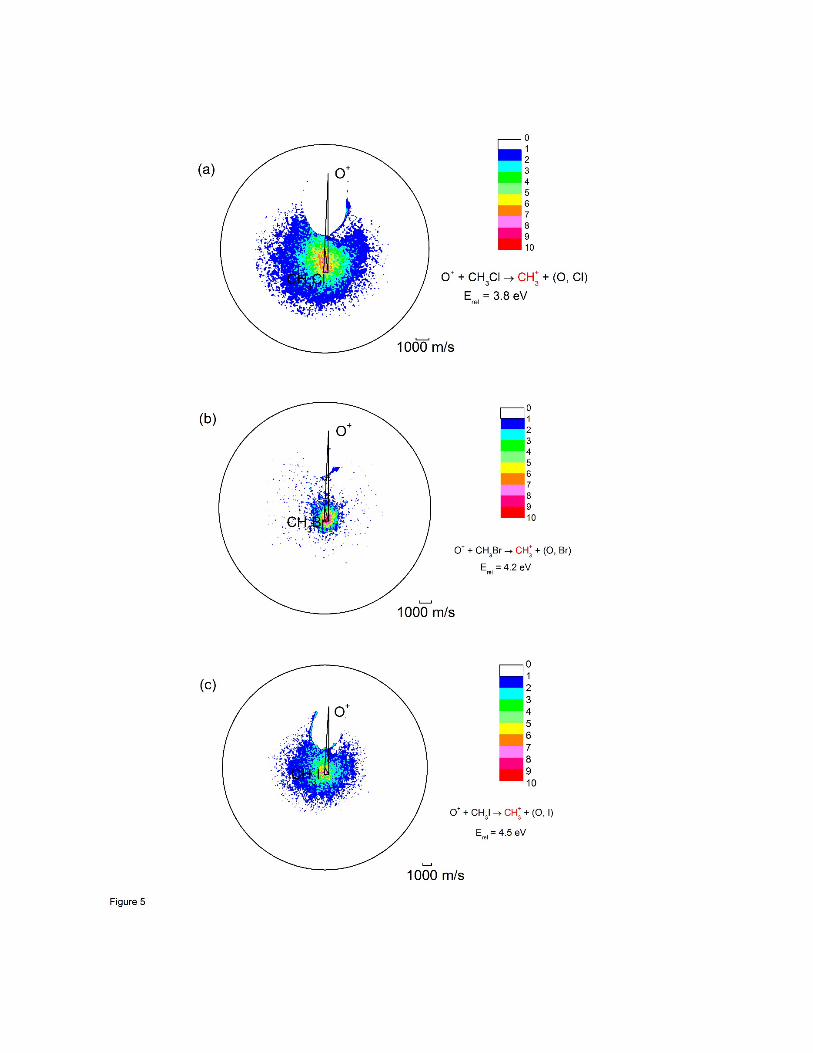
Based on prior observations that the products of dissociative charge transfer have
energy distributions that mimic those of the parent ions [33], a comparison of the velocity
space images for CH3+ formation with those of the CH3X+ precursors is instructive. Those
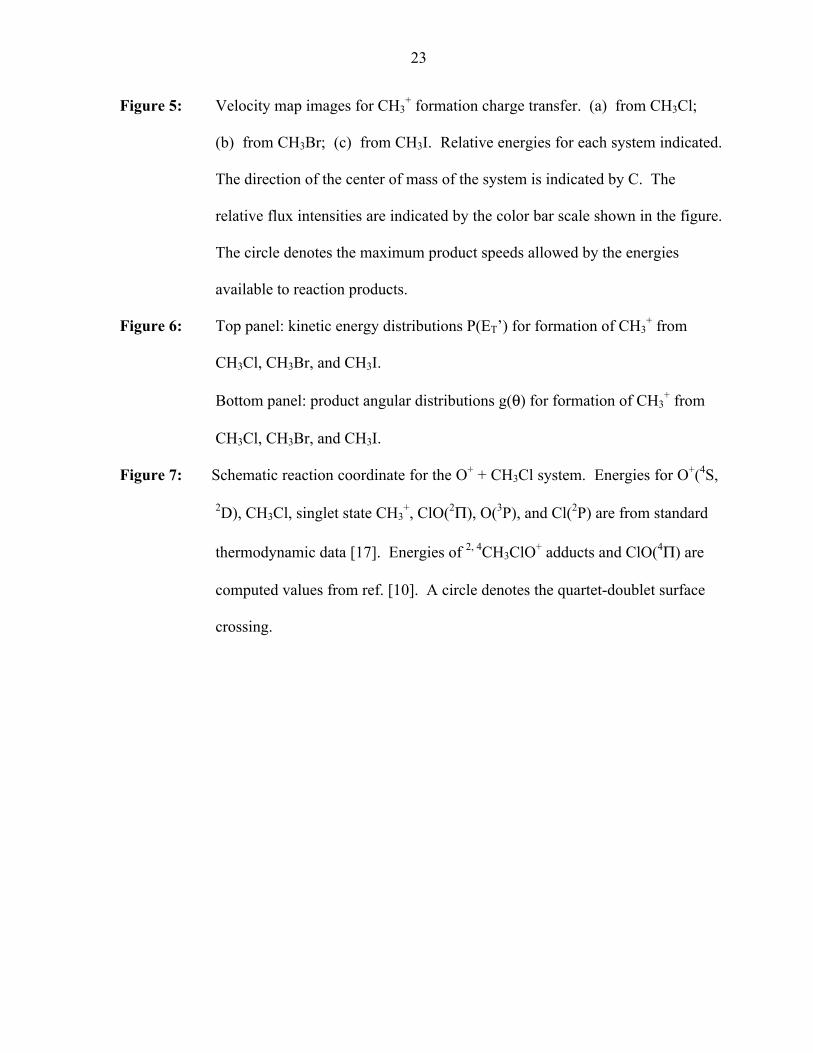
images are shown in Figure 5, and the comparison is quite striking. The CH3+ images cover
a much broader region of velocity space than those for CH3X, and are not centered on the tip
of the neutral beam velocity vector as would be expected for products formed by dissociative
12
charge transfer, but instead are centered on the relative velocity vector and are displaced
toward the system centroid.
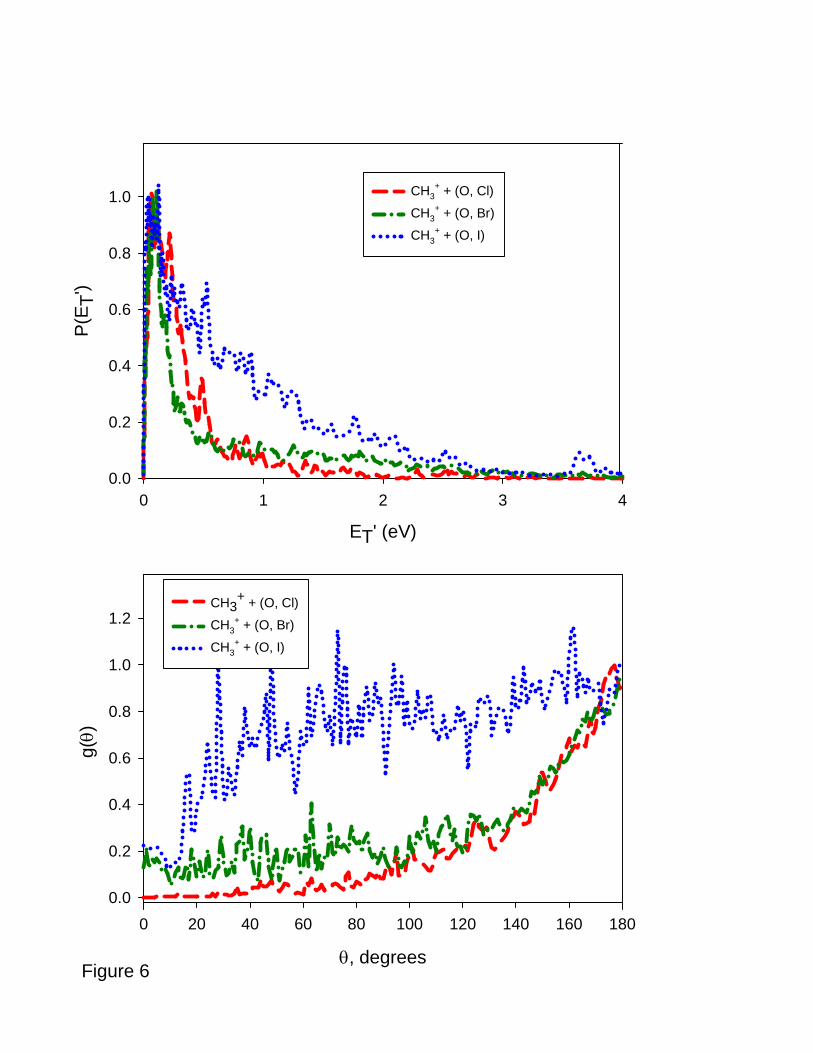
A closer look at the product kinetic energy and angular distributions provides more
insight into the dynamical implications of these clear deviations from the dissociative charge
transfer picture. In the top panel of Figure 6, we plot the kinetic energy distributions for
CH3+ formation from CH3Cl, CH3Br, and CH3I. The energies available to these reaction
products correspond to the sum of collision energy, approximately 4 eV in each case, and the
reaction ΔH values, and are significantly larger than the maximum values of the kinetic
energies that are observed. In the CH3Cl case, the kinetic energy distribution consists of a
single dominant peak at low energy, and a weak tail that extends out to ~ 2 eV. There is
negligible product intensity beyond 2 eV. In contrast to the kinetic energy release for CH3+
from CH3Cl, the energy distribution for CH3+ from CH3Br shows a low energy peak but also
a very broad tail that extends out to beyond 3 eV, suggestive of a two channel decay
mechanism. The product intensity in this tail is approximately one-quarter of the total
product intensity. The kinetic energy distribution of CH3+ from CH3I rises rapidly from zero
and has a very significant tail to high energy that extends to 3 eV and dominates the
distribution. Approximately 75% of the CH3+ flux appears in this tail.
Although the mass ratio of the CH3+ product relative to the momentum-matched
(O, X) fragments decreases as the halogen mass increases, the kinematic resolution of the
experiment is not affected by this small velocity space compression. The two-component
character of the energy distributions is not a kinematic artifact. Integration of the velocity
space distributions with eq. (12) separately over the angular ranges 0 ≤ θ ≤ 90° (forward
hemisphere) and 90° ≤ θ ≤ 180° (backward hemisphere) shows that the broad high energy

13
feature is angle independent, while the sharp low energy peak appears to be concentrated in
the forward hemisphere. Both of these observations support the conclusion that two separate
pathways produce CH3+, and a consideration of the features of the doublet and quartet
potential energy surfaces is necessary to provide additional insight into those pathways.
The angular distributions for CH3+ formation, obtained by integrating the velocity
space flux distributions over recoil speed according to eq. (13), are shown in the bottom
panel of Figure 6, and indicate that the products are distributed over a broad angular range.
The distributions for CH3+ + (O, Cl) and CH3
+ + (O, Br) products, where the (O, X) notation
represents both bound and unbound XO products, are similar, exhibiting backward scattered
peaks reminiscent of the distributions that characterize charge transfer, but are significantly
broader. The (O, Br) distribution has a significant component that extends into the forward
hemisphere. Particularly interesting is the angular distribution for the CH3+ + (O, I) products,
which displays a plateau that falls off very slowly from its maximum value at 180° and
extends well into the forward direction. This angular distribution is consistent with product
formation occurring on a timescale comparable to the rotational period of the CH3OI+ adduct
[40].
The energy and angular distributions for CH3+ formation suggest that more than one
collision pathway is implicated in the formation of this species. As noted previously by
Nichols et al.[14], a consideration of electron spin shows that the production of CH3+ by
simple bond cleavage of the C-X bond in the methyl halide cation to form CH3+ + X + O
products is spin-allowed. In contrast, the two-body reactions between O+(4S) and CH3X to
form CH3+ + OX (X2Π) by halide abstraction, reactions (4a) and (7a), are spin-forbidden and
are thus affected strongly by the identity of the halogen atom in CH3X. The energy
14
accessible to CH3+ and the dissociated OX molecule via a spin-allowed pathway is clearly
less than that available for CH3+ formed in concert with a bound OX molecule via a spin-
forbidden path. Consequently, the strong effect of halogen identity on the intensity of the
high energy component of the CH3+ velocity distributions is consistent with the claim that a
significant fraction of those products are formed along a pathway in which reactants evolving
initially on a quartet surface undergo a transition to a doublet state facilitated by spin-orbit
coupling.
B. Potential energy surfaces
The quantum chemical calculations reported by Nichols et al. [14] provide a useful
starting point for understanding the relative energetics of reactive intermediates on the
doublet and quartet surfaces in the O+ + CH3X systems. These calculations, carried out on
the CH3Cl system at the CCSD(T)/aug-cc-pVDZ level of theory, are qualitative only, but do
provide insight into reaction pathways on surfaces of different multiplicities, and the general
relationships among reactants, products, and intermediates can be extended to the O+ +
CH3Br and CH3I systems. Because the calculations do not reproduce known energetics for
enthalpies of formation for the reaction products or excited state reactants, we use tabulated
thermochemical data [18] in conjunction with the calculations to produce a reaction
coordinate diagram. The principal objective of constructing this diagram is to understand the
role that spin-changing collisions play in directing the distinct pathways for the formation of
the dominant reaction product, CH3+.
The qualitative reaction coordinate diagram for the O+ + CH3Cl system is shown in
Figure 7. Approach of the O+(4S) reactant to CH3Cl leads to ground state charge transfer
15
products O(3P) + CH3Cl+ lying 2.36 eV below the reactants. Standard thermochemical data
[18] show that the dissociation of the C-Cl bond in CH3Cl+ to form singlet state 1CH3+ +
Cl(2P) requires 2.19 eV. Figure 7 thus indicates that the formation of 1CH3+ + O(3P) + Cl(2P)
occurs on a single potential energy surface of quartet multiplicity. Similarly, the quartet state
CH3OCl+ adduct accessible from the ground state reactants lying nearly 3 eV below the
reactants may dissociate to CH3+ + ClO(4Π).
Figure 7 also shows the same quartet-doublet interaction reported in [14] that
mediates spin-changing collisions in the entrance channel. Such collisions provide access to
a doublet state adduct of CH3OCl+, which serves a precursor to halide abstraction by O+ from
the CH3Cl reactant to form 1CH3+ + ClO(2Π). Figure 7 shows clearly that reactive collisions
evolving initially on the quartet surface generated by the approach of O+(4S) to CH3Cl may
cross to a doublet state originating from the O+(2D) excited state reactants. This surface leads
to a doublet CH3ClO+ intermediate that forms the halide ion abstraction products 1CH3+ +
ClO(2Π).
The structure of the energy level diagram of reactants, products, and intermediates
differs in detail for CH3Br and CH3I reactants, but has the same general appearance. The
important feature relevant to the kinetic energy distributions that characterize 1CH3+
formation is that the relative contribution to the highest kinetic energy component of the
distribution is controlled by the spin-orbit interaction that directs collisions to doublet state
CH3XO+ intermediates. Similarly, low recoil energy CH3+ products formed in concert with
Cl(2P) and O(3P) atomic products may remain on the initial quartet surface. The
experimental data presented in this paper for CH3+ formation are consistent with this picture.
16
Conclusions
Crossed beam studies of the chemical reactions displayed by ground state O+(4S) with
the methyl halides CH3Cl, CH3Br, and CH3I have provided dynamical insights into these
important systems for which rate and branching ratios at room temperature have been
reported only recently [14]. Velocity map imaging studies of energy disposal for charge
transfer have shown that long range electron transfer is responsible for the production of
methyl halide cations, with the products exhibiting the velocity space motif typical for the
process. Formation of Br+ and I+ exhibit the same motif, therefore establishing their
production as a dissociative charge transfer process.
Measurement of product kinetic energy distributions for CH3+ formation have
established that there are two routes to this product: in the first, CH3+ is formed by C-X bond
cleavage in the nascent CH3X+ charge transfer product. This process occurs without a
change in spin. The second route forms products with significantly larger kinetic energy
release, consistent with their formation in concert with a bound XO molecular product. The
systematic increase in intensity of this feature in the kinetic energy distributions as the
halogen varies from chlorine to bromine to iodine supports the claim that the second
mechanism for CH3+ formation proceeds by halide abstraction on a doublet potential energy
surface, requiring a spin-changing collision facilitated by spin-orbit coupling.
The chemistry of the O+ cation is diverse, with the potential to reveal many
interesting lessons about chemical reaction dynamics. We look forward to additional
contributions in this important area of gas phase ion chemistry.
17
Acknowledgements
The authors acknowledge support for this work under National Science Foundation
grants CHE-1012303 and CHE-1265406.
18
References
[1] E.E. Ferguson, F. Arnold, Acc. Chem. Res. 14 (1981) 327.
[2] J.M. Goodings, D.K. Bohme, C.W. Ng, Combust. Flame 36 (1979) 27.
[3] P.B. Armentrout, Adv. At. Mol. Opt. Phys. 43 (2000) 187.
[4] E.R. Fisher, P.B. Armentrout, J. Phys. Chem. 95 (1991) 6118.
[5] K.T. Gillen, B.H. Mahan, J.S. Winn, J. Chem. Phys. 59 (1973) 6380.
[6] K.T. Gillen, B.H. Mahan, J.S. Winn, J. Chem. Phys. 58 (1973) 5373.
[7] K.T. Gillen, B.H. Mahan, J.S. Winn, Chem. Phys. Lett. 22 (1973) 344.
[8] B.H. Mahan, J. Chem. Phys. 55 (1971) 1436.
[9] B.H. Mahan, Acc. Chem. Res. 8 (1975) 55.
[10] E. Blei, M.R. Heal, Atmos. Env. 45 (2011) 1543.
[11] K.R. Redeker, N.Y. Wang, J.C. Low, A. McMillan, S.C. Tyler, R.J. Cicerone,
Science 290 (2000) 966.
[12] R.C. Rhew, J. Geophys. Res. -Biogeosciences 116 (2011).
[13] C.A. Mayhew, R. Thomas, P. Watts, Int. J. Mass Spectrom. 223 (2003) 91.
[14] C.M. Nichols, Z.B. Yang, B.B. Worker, D.R. Hager, N.M.M. Nibbering, V.M.
Bierbaum, Phys. Chem. Chem. Phys. 15 (2013) 561.
[15] J.M. Farrar, in: J.M. Farrar, W.H. Saunders, Jr. (Eds.), Techniques for the Study of
Ion-Molecule Reactions, Wiley, New York, 1988, p. 325.
[16] A.G. Suits, R.E. Continetti (Eds.), Imaging in Chemical Dynamics. American
Chemical Society, Washington DC, 2001.
[17] A. Eppink, D.H. Parker, Rev. Sci. Instrum. 68 (1997) 3477.
19
[18] S.G. Lias, NIST Chemistry WebBook in P.J. Linstrom, W.G. Mallard (Eds.), NIST
Standard Reference Database No. 69. National Institute of Standards and Technology,
Gaithersburg, MD, 2005.
[19] D.P. Stevenson, Disc. Faraday Soc. (1951) 35.
[20] L. Pei, J.M. Farrar, J. Chem. Phys. 136 (2012) 204305.
[21] E.L. Reichert, S.S. Yi, J.C. Weisshaar, Int. J. Mass Spectrom. 196 (2000) 55.
[22] E.L. Reichert, G. Thurau, J.C. Weisshaar, J. Chem. Phys. 117 (2002) 653.
[23] E.L. Reichert, J.C. Weisshaar, J. Phys. Chem. A 106 (2002) 5563.
[24] J. Mikosch, U. Fruhling, S. Trippel, D. Schwalm, M. Weidemuller, R. Wester, Phys.
Chem. Chem. Phys. 8 (2006) 2990.
[25] J. Mikosch, S. Trippel, C. Eichhorn, R. Otto, U. Lourderaj, J.X. Zhang, W.L. Hase, M.
Weidemuller, R. Wester, Science 319 (2008) 183.
[26] J.X. Zhang, J. Mikosch, S. Trippel, R. Otto, M. Weidemuller, R. Wester, W.L. Hase,
J. Phys. Chem. Lett. 1 (2010) 2747.
[27] H. Udseth, C.F. Giese, W.R. Gentry, Phys. Rev. A 8 (1973) 2483.
[28] D. Smith, P. Spanel, C.A. Mayhew, Int. J. Mass Spectom. Ion Process. 117 (1992)
457.
[29] R. Wolfgang, R.J. Cross, J. Phys. Chem. 73 (1969) 743.
[30] B. Friedrich, Z. Herman, Collect. Czech. Chem. Commun. 49 (1984) 570.
[31] J.M. Farrar, in: P.B. Armentrout (Ed.), The Encyclopedia of Mass Spectrometry,
Elsevier, Amsterdam, 2003, p. 158.
[32] L. Pei, J.M. Farrar, J. Chem. Phys. 137 (2012) 154312.
[33] L. Pei, J.M. Farrar, J. Chem. Phys. 138 (2013) 124304.

20
[34] V.G. Anicich, J.B. Laudenslager, W.T. Huntress, J.H. Futrell, J. Chem. Phys. 67
(1977) 4340.
[35] J.B. Laudenslager, W.T. Huntress, M.T. Bowers, J. Chem. Phys. 61 (1974) 4600.
[36] D.W. Turner, Phil. Trans. R. Soc. A 268 (1970) 7.
[37] Z. Herman, J.H. Futrell, B. Friedrich, Int. J. Mass Spectrom. Ion Proc. 58 (1984) 181.
[38] A.K. Shukla, K.G. Qian, S.L. Howard, S.G. Anderson, K.W. Sohlberg, J.H. Futrell,
Int. J. Mass Spectom. Ion Process. 92 (1989) 147.
[39] A.K. Shukla, K. Qian, S. Anderson, J.H. Futrell, J. Am. Soc. Mass Spectrom. 1
(1990) 6.
[40] M.K. Bullitt, C.H. Fisher, J.L. Kinsey, J. Chem. Phys. 60 (1974) 478.

21
Table I: Product branching ratios
Reactants Products Branching fraction Branching fraction
(this work) (Ref. 10)
O+ + CH3Cl CH3Cl+ 0.1 ± 0.02 0
CH3
+ 0.9± 0.02 0.88
HCO+, H2CO+ 0 0.12
O+ + CH3Br CH3Br+ 0.09± 0.02 0
CH3
+ 0.89± 0.02 1
Br+ 0.02± 0.01 0
O+ + CH3I CH3I+ 0.15± 0.02 0
CH3
+ 0.64± 0.02 0.94
I+ 0.21± 0.02 0.06

22
Figure Captions
Figure 1: Velocity map images for charge transfer. (a) CH3Cl+; (b) CH3Br+; (c)
CH3I+. Relative energies for each system indicated. As shown in the inset,
the direction of the center of mass of the system is indicated by C. The
relative flux intensities are indicated by the color bar scale shown in the figure.
The circle denotes the maximum product speeds allowed by the energies
available to reaction products.
Figure 2: Top panel: kinetic energy distributions P(ET’) for formation of CH3Cl+,
CH3Br+, and CH3I+. Vertical arrows denote mean collision energies for the
corresponding distributions.
Bottom panel: product angular distributions g(θ) for formation of CH3Cl+,
CH3Br+, and CH3I+
Figure 3: Velocity map images for dissociative charge transfer. (a) Br+; (b) I+.
Relative energies for each system indicated. The direction of the center of
mass of the system is indicated by C. The relative flux intensities are
indicated by the color bar scale shown in the figure. The circle denotes the
maximum product speeds allowed by the energies available to reaction
products.
Figure 4: Top panel: kinetic energy distributions P(ET’) for formation of Br+ and I+.
Vertical arrows denote mean collision energies for the corresponding
distributions.
Bottom panel: product angular distributions g(θ) for formation of Br+ and I+.
23
Figure 5: Velocity map images for CH3+ formation charge transfer. (a) from CH3Cl;
(b) from CH3Br; (c) from CH3I. Relative energies for each system indicated.
The direction of the center of mass of the system is indicated by C. The
relative flux intensities are indicated by the color bar scale shown in the figure.
The circle denotes the maximum product speeds allowed by the energies
available to reaction products.
Figure 6: Top panel: kinetic energy distributions P(ET’) for formation of CH3+ from
CH3Cl, CH3Br, and CH3I.
Bottom panel: product angular distributions g(θ) for formation of CH3+ from
CH3Cl, CH3Br, and CH3I.
Figure 7: Schematic reaction coordinate for the O+ + CH3Cl system. Energies for O+(4S,
2D), CH3Cl, singlet state CH3+, ClO(2Π), O(3P), and Cl(2P) are from standard
thermodynamic data [17]. Energies of 2, 4CH3ClO+ adducts and ClO(4Π) are
computed values from ref. [10]. A circle denotes the quartet-doublet surface
crossing.
degrees
0 20 40 60 80 100 120 140 160 180
g(
)
0.0
0.2
0.4
0.6
0.8
1.0 CH3Cl+ + O
CH3Br+ + O
CH3I+ + O
ET' (eV)
0 2 4 6 8 10
P(E
T')
0.0
0.2
0.4
0.6
0.8
1.0 CH3Cl+ + O
CH3Br+ + O
CH3I+ + O
Figure 2


degrees
0 20 40 60 80 100 120 140 160 180
g(
)
0.0
0.2
0.4
0.6
0.8
1.0
Br+ + CH3 + O
I+ + CH3 + O
ET' (eV)
0 5 10 15 20
P(E
T')
0.0
0.2
0.4
0.6
0.8
1.0 Br+ + CH3 + O
I+ + CH3 + O
Figure 4
, degrees
0 20 40 60 80 100 120 140 160 180
g(
)
0.0
0.2
0.4
0.6
0.8
1.0
1.2CH3
+ + (O, Cl)
CH3+ + (O, Br)
CH3+ + (O, I)
ET' (eV)
0 1 2 3 4
P(E
T')
0.0
0.2
0.4
0.6
0.8
1.0 CH3+ + (O, Cl)
CH3+ + (O, Br)
CH3+ + (O, I)
Figure 6
