imaging of the pancreas: technique and clinical...
TRANSCRIPT

Clinical • Abdominal Imaging MAGNETOM Flash (69) 3/2017www.siemens.com/magnetom-world
2
Imaging of the Pancreas: Technique and Clinical ApplicationsGiovanni Morana1; Alex Faccinetto1; Alberto Dorigo1; Pierluigi Ciet2; Silvia Venturini1; Michele Fusaro1
1 Department of Radiology, General Hospital Ca’ Foncello, Treviso, Italy 2 Department of Radiology, Erasmus Medical Center, Rotterdam, the Netherlands
1. Introduction MRI has assumed a leading role in imaging of the pancreas thanks to recent technical innovations with either breath-hold T1- and T2-weighted images or respiratory-triggered T2-weighted images. It also owes its success in this field to dynamic imaging with contrast media and secretin, as these techniques offer greater scope for noninvasive exploration of the pancreatic ducts and pancreatic parenchyma, and imaging of the pancreatic vessels.
2. MR technique MR imaging of the pancreas requires high-field magnets, powerful and fast gradients, phased array surface coils, parallel imaging technology, and adapted sequences. Pancreas examinations are performed in both T2- and T1-weighted sequences, and in axial and coronal planes. MR imaging can provide multiple types of information on pancreatic diseases, such as morphology, vascularization, and water diffusion, as well as ductal imaging with functional information after secretin injection. With state-of-the-art MR equipment, a complete study of the pancreas takes about 30 to 40 minutes.
2.a T2-weighted sequences2.a.1 Fast spin-echo sequence (HASTE, RARE)
These are axial and coronal single-shot, turbo spin-echo sequences with half k-space acquisition, a short echo time (40–80 ms) and a long echo time. Each slice is acquired in approximately one second. The main feature of this sequence is its low sensitivity to movement artifacts, which makes it suitable for uncooperative patients. Moreover, it is also highly sensitive to fluids, which appear as hyperintense in the pancreas (pancreatic duct, cystic lesions) and the peripancreatic area (stomach and duodenal content, peripancreatic fluid collections). Its
main disadvantages are that the signal-to-noise ratio is lower than in fast multi-shot spin-echo sequences, and that it leads to slight blurring, which reduces its sensitivity in detecting small, low-contrast solid lesions. The signal of the normal pancreas is equal to or higher than that of the liver, whereas the ducts (biliary and pancreatic) appear strongly hyperintense.
2.a.2 Conventional T2-weighted fast spin-echo sequence
The latest sequences are acquired with fat suppression and respiratory compensation. They clearly show liquid infiltration in acute pancreatitis, but they are not particularly useful in studying focal solid or cystic pancreatic lesions.
2.b T1-weighted sequences2.b.1 GRE T1-weighted 2D sequence with fat saturation
When using unenhanced imaging, this is the best sequence for differentiating between a normal and a diseased pancreas. A normal pancreas appears as homogeneously hyperintense. This is attributed to the presence of large quantities of aqueous protein in the acini of the pancreas, the abundance of endoplasmic reticulum in the acinar cells, and the paramagnetic ion-rich content, notably manganese [1, 2]. Fatty infiltration and fibrosis reduce the pancreas’ high signal intensity. Focal or diffuse pancreatic diseases appear as hypointense areas. Thus, this sequence can be considered as very sensitive to pancreatic diseases, but with a low capacity for differentiating between lesions.
2.b.2 GRE T1-weighted 3D sequence with small flip angle, interpolation, and fat saturation
This sequence can be used for dynamic imaging after injection of gadolinium chelates. Its excellent contrast after bolus injection, combined with thin slices, makes it possible to reconstruct the vessels with maximum intensity projection (MIP) or volume rendering (VR) techniques. This

MAGNETOM Flash (69) 3/2017www.siemens.com/magnetom-world
Abdominal Imaging • Clinical
3
technique can be used as a way of combining parenchymal and vascular imaging.
Dynamic imaging of the pancreas is necessary for studying solid or cystic pancreatic lesions. After administering a test bolus to identify the correct acquisition timing, the operator consecutively acquires arterial, pancreatic (late arterial), venous, and delayed sequences. The arterial phase (15-20 seconds after injection of contrast medium) is useful in postprocessing to evaluate the arterial tree in the pancreatic region, and for evaluating solid hyper-vascular lesions. In this phase, pancreatic enhancement is stronger than liver enhancement. The pancreatic phase is usually obtained about 15 seconds after the peak bolus in the abdominal aorta [3] and is useful for identifying solid pancreatic lesions. The venous phase is acquired 45 seconds after contrast medium injection. When searching for delayed enhancement (such as in paraduo-denal pancreatitis or autoimmune pancreatitis), a late sequence (180 seconds) can be added after injection [4].
2.b.3 Dynamic, multiphase contrast-enhanced MRI
FREEZEit TWIST-VIBE or CAIPIRINHA Dixon TWIST-VIBE is a novel, contrast-enhanced T1w-3D-fs-GRE sequence that makes it possible to acquire multiple arterial subphases during a single breath-hold. TWIST-VIBE facilitates the timing of the arterial phase and generates additional
dynamic information on the vascular status of focal lesions [5]. Although research has primarily focused on hypervascular focal liver lesions [6], in pancreatic pathology TWIST-VIBE can be very useful for detecting small hypervascular lesions, such as neuroendocrine tumors (Fig. 1).
2.c Diffusion-weighted imaging (DWI) DWI measures changes in the microscopic diffusion of water due to Brownian motion. DW images are acquired with the single-shot echoplanar technique (SE-EPI-SSh). When using this sequence, it is also possible to select a bipolar version that allows shorter TE – e.g., a spin-echo sequence to which two additional equal gradients with opposing directions are added immediately before and after the 180° impulse with diffusion sensitizing gradients. The breadth and duration of the diffusion gradients influences the diffusion weighting of the sequence, defined by the b-value and expressed in seconds per millimeters squared (s/mm2) [7]. The sequence is generally repeated for various b-values, resulting in the acquisition of different diffusion weights for each section of the image. Finally, the different DW images are used to obtain the respective apparent diffusion coefficient maps (ADC maps) which allow a quantitative analysis of the signal by positioning a region of interest (ROI) on the structure being studied.
Figure 1A-F: PNET. Twist-VIBE can acquire up to six arterial phases and thus clearly visualize a hypervascular PNET.
1A
1D
1B
1E
1C
1F

MAGNETOM Flash (69) 3/2017www.siemens.com/magnetom-world
Clinical • Abdominal Imaging
4
DWI has been proposed as a diagnostic tool in neoplastic diseases because malignant lesions have a denser cellularity, a larger volume, and less extracellular space, which restricts the free movement of water molecules. This results in a lower ADC value and hyperintensity on diffusion-weighted (DW) images with high b-values. By contrast, benign lesions (such as benign tumors or inflammatory lesions) have more extracellular space, which preserves the diffusion of water molecules and results in high ADC values and hypointensity on DW images with high b-values.
Until recently, DWI of the pancreas and upper abdomen was of limited use due to major physiological motions. The long acquisition time meant that respiratory movements, bowel peristalsis, and blood flow all hindered the application of the sequence. The recent introduction of parallel imaging and respiratory triggering has allowed upper-abdomen DWI to become routine in state-of-the-art MR equipment [8].
However, some drawbacks remain: With low b-values (0–50), the long TR of the acquisition gives the sequence a T2-weighted appearance. This tends to decline with higher b-values (> 400) but can remain significant and therefore give a high water signal even in unrestricted diffusion conditions (T2 shine through).
Moreover, with low b-values, the signal is also sensitive to capillary perfusion, while the importance of water diffusion increases with high b-values [7]. Thus, ADC represents the microcirculation of blood (perfusion) and the molecular diffusion of water. Some authors suggest calculating ADC with lower b-values of ≥ 150 s/mm2 and with an upper b-value of ≥ 700 s/mm2 to avoid contamination by capillary perfusion [9]. With DWI, a normal pancreas has a signal intensity similar to that of the liver for the various b-values. The ADC value of a normal pancreas has been reported to be higher than in cases of pancreatic cancer and mass-forming pancreatitis [10]. A b-value of 1,500 s/mm2 can improve the delineation of pancreatic adenocarcinomas at 3T [11].
Figure 2: Pancreatic colloid adenocarcinoma. A small hypodense lesion is visible in the uncinate process on a CT image (2A), and appears slightly hyperdense on T2w (2B) and remains hypovascular on contrast-enhanced MRI (2C). With DWI (b = 800), the lesion is hyperintense (2D), but the ADC map (2E) does not show restricted diffusion (1.2) due to colloid content. With IVIM, the lesion has a low perfusion fraction (10%), consistent with pancreatic carcinoma (2F).
2A
2D
2B
2E
2C
2F

MAGNETOM Flash (69) 3/2017www.siemens.com/magnetom-world
Abdominal Imaging • Clinical
5
Intravoxel incoherent motion (IVIM) imaging is a method based on DWI with multiple b-values. It offers scope for separately analyzing pure molecular diffusion and microcirculation (or perfusion) with the IVIM-derived parameters of pure molecular diffusion coefficient (Dslow), perfusion fraction (f), and perfusion-related diffusion coefficient (Dfast) [12]. According to recent studies, the perfusion-related parameters f and Dfast are more helpful than ADC or Dslow in characterizing pancreatic diseases [13, 14] (Fig. 2).
IVIM models are based on the assumption that the probability displacement function of the water molecules follows a Gaussian distribution. However, studies show that this assumption is not valid when the acquisition is performed with b-values of > 1000 s/mm2. This is due to the interaction of water molecules with membranes and other microstructural components, which in turn reduces the actual diffusion distance compared to free water.
Diffusion kurtosis imaging (DKI)1 is an advanced DWI model that quantifies non-Gaussian behavior of diffusion and provides both a corrected ADC and the excess kurtosis of tissue (a measure of the extent to which tissue diffusion deviates from a Gaussian pattern). However, it is techni-cally demanding, as it requires acquisition of b-values of > 1000 s/mm2 [15]. Following some studies in different organs, only two papers have so far been published on the clinical application of DKI. One focused on pancreatic cancer [16], and showed that DKI had the highest area under the curve (AUC) when it came to differentiating tumorous from non-tumorous pancreatic parenchyma. The other focused on HbA1c levels in patients with suspected pancreatic disease. It showed that the mean Kurtosis measurement on DKI of the pancreas could be a potential biomarker for assessing HbA1c levels [17].
2.d T1 mapping T1 mapping has been successfully used in a number of cardiac conditions, including myocardial fibrosis and myocardial deposition disease. Commercially available fast volumetric T1 mapping techniques then facilitated its application in other organs, such as in the liver to detect and quantify liver fibrosis [18]. Very recently, T1 mapping has also been used to detect early fibrotic changes in mild chronic pancreatitis (CP). It can differentiate patients with normal pancreas from those with mild CP and is thus a promising solution for the early diagnosis of CP [19].
2.e MR cholangiopancreatography (MRCP)Heavily T2-weighted sequences render static fluid or slow-flow structures very hyperintense with a very low signal from solid structures. Different and complementary approaches are used: 2D T2w single-shot fast spin echo, thick and/or thin multislice sequences, and 3D T2w (e.g., SPACE from Siemens Healthineers, and CUBE from GE).
A 2D T2w thick-slab sequence usually has a slice thickness of 40–70 mm so that it covers the whole pancreatic duct. It can be obtained in all planes, although it is generally acquired in the coronal plane, and requires breath-hold times of less than 3 seconds. The sequence provides excellent biliary and pancreatic mapping with no respiratory artifacts, few susceptibility artifacts, and good planar resolution.
3D T2w techniques have been implemented with respiratory triggering and free breathing. This provides a very high spatial resolution and isotropic voxels, allowing the acquired datasets to be reconstructed in different planes using maximum intensity projection postprocessing techniques. Images are of superior quality and achieve better delineation of pancreaticobiliary anatomy than conventional 2D images [20]. However, in the case of uncooperative patients, a 2D approach is more feasible and can obtain better results.
High image quality is obtained by orally administering contrast material that significantly decreases the signal of fluid contained in the stomach and duodenum – for instance, certain fruit juices (pineapple, blueberry, cranberry, etc.) or commercial oral superparamagnetic contrast agents based on iron oxide, such as Ferumoxil.
The IV administration of paramagnetic contrast agent prior to MRCP gives a superior image quality. This is thanks to the T2* effect of gadolinium, which suppresses the overlapping vessel signals and the signal from liquids in the interstitial compartment of the pancreatic gland, and does not affect the signal from the ducts [21].
2.f Secretin MRCP (S-MRCP)Administering secretin stimulates the production of fluid and bicarbonate by the exocrine pancreas and increases the pancreas’ flow rate almost immediately and for a few minutes after administration. At the same time, an increase in tension in the sphincter of Oddi (SO) is noted. In normal subjects, an increase in the main duct pressure is observed after one minute with an almost complete return to baseline values after five minutes and reversion of SO contraction [22]. The rise in the fluid volume of the main pancreatic duct (MPD) provides a clearer visualization of the duct in MRCP.
1 DKI postprocessing of standard DWI data is WIP, the product is currently under development and is not for sale in the US and in other countries. Its future availability cannot be ensured.

MAGNETOM Flash (69) 3/2017www.siemens.com/magnetom-world
Clinical • Abdominal Imaging
6
Serial acquisition of the pancreatic duct with a 2D thick-slab sequence and a time interval of 30–60 seconds for 10–15 minutes after IV administration of 1 mL/kg bodyweight of secretin provides a dynamic visualization of the pancreatic response to secretin [23–26].
The advantages of secretin-enhanced MRCP are therefore both morphological and functional:
• Morphological benefits: Better visualization of the MPD; easier detection of anatomical variants such as pancreas divisum; clear depiction of obstruction, stenosis, dilatation, and irregular contours of the duct. Overall, secretin-enhanced MRCP increases the negative predictive value of MR imaging of the pancreas [27].
• Functional benefits: Visualization of side branches at body/tail after secretin is a sign of early chronic pancreatitis; an abnormally prolonged dilatation of the MPD (> 3 mm 10 min after secretin injection) indicates a deficit of pancreatic juice outflow; the parenchymogram (parenchymal enhancement) is a sign of recurrent acute pancreatitis; reduced duodenal filling suggests a decrease in pancreatic exocrine reserve [26].
Secretin-stimulated MRCP images are in many ways better than those achieved with standard MRCP. They could help in diagnosing and making clinical decisions for patients with acute, acute recurrent, or chronic pancreatitis, and could improve the identification of
patients in need of therapeutic endoscopic retrograde cholangiopancreato-graphy (ERCP) [28].
3. Clinical applications
3.a Acute pancreatitisThe robustness and availability of CT make it the most important technique in cases of acute pancreatitis (AP). CT is used to diagnose and stage AP, and has greatly improved and changed the clinical management of this condition. However, because it involves ionizing radiation and potentially nephrotoxic contrast agents, its use is subject to limitations in young patients and in patients with impaired renal function [29].
Given the critical conditions of these patients, MR protocols need to be adapted so that they become faster and require less cooperation from the patient.
Axial and coronal T2w HASTE sequences can usually provide sufficient information about the condition of the pancreatic gland and the presence and extent of peripancreatic fluid collections (Fig. 3) in the acute phase, and of pancreatic pseudocyst in the late phase. T2w HASTE sequences are also useful in detecting the small intrabiliary calculi that are most often the cause of AP (Fig. 4).
T1w GRE fat-saturated sequences can easily detect small hemorrhagic foci (Fig. 5), while contrast-enhanced MRI is essential in cases of suspected severe pancreatitis, where non-enhancing areas are defined as necrotic (Fig. 3).
3A 3B
Figure 3: Peripancreatic fluid collection, recent severe pancreatitis. With HASTE T2w (3A), a large collection with debris is visible in the tail of the pancreas. After Gd injection (3B), a peripheral enhancement can be appreciated, while the internal debris does not show any significant enhancement.

MAGNETOM Flash (69) 3/2017www.siemens.com/magnetom-world
Abdominal Imaging • Clinical
7
4A 4B
4C
Figure 4: Biliary calculi. With coronal HASTE T2w (4A), multiple calculi in the gallbladder can be appreciated. A small calculus is also visible in the intrapancreatic choledocus (arrow). The calculus cannot be seen in the MIP reformatted 3D MRCP images (4B), as it is obscured by the bile signal. It can only be seen in a sub-MIP reformatted image (4C).
5A 5B
Figure 5: Acute pancreatitis. With T2w (5A), an enlarged pancreatic gland is visible in the body-tail, with edema of the parenchyma. On T1w GRE fat-sat (5B), the pancreatic gland is hypointense due to the edema. Small hyperintense foci are also visible, due to small hemorrhagic changes.

MAGNETOM Flash (69) 3/2017www.siemens.com/magnetom-world
Clinical • Abdominal Imaging
8
6A 6B
Figure 6: MRCP. On precontrast MRCP in a patient with recent edematous pancreatitis (6A), the duct of Wirsung is obscured by the edema of the gland. Three minutes after injecting a Gd-based contrast agent (6B), the edema has disappeared due to the T2* effect of the gadolinium in the interstitium, which results in better visualization of the duct.
7A
7C
7B
7D
Figure 7: Pancreatic fistula. CT (7A) shows a large peripancreatic fluid collection in a patient with severe acute pancreatitis. After 3 months, the fluid has almost disappeared on HASTE T2w (7B) and slight dilatation of the duct of Wirsung is visible in the tail of the pancreas due to rupture of the duct (arrows). Axial MRCP (7C) confirms chronic obstructive pancreatitis in the tail (arrows). After secretin injection (7D), pancreatic juice can be appreciated at the level of the duct rupture (arrows).
MAGNETOM Flash (69) 3/2017www.siemens.com/magnetom-world
Abdominal Imaging • Clinical
9
8A
8C
8B
8D
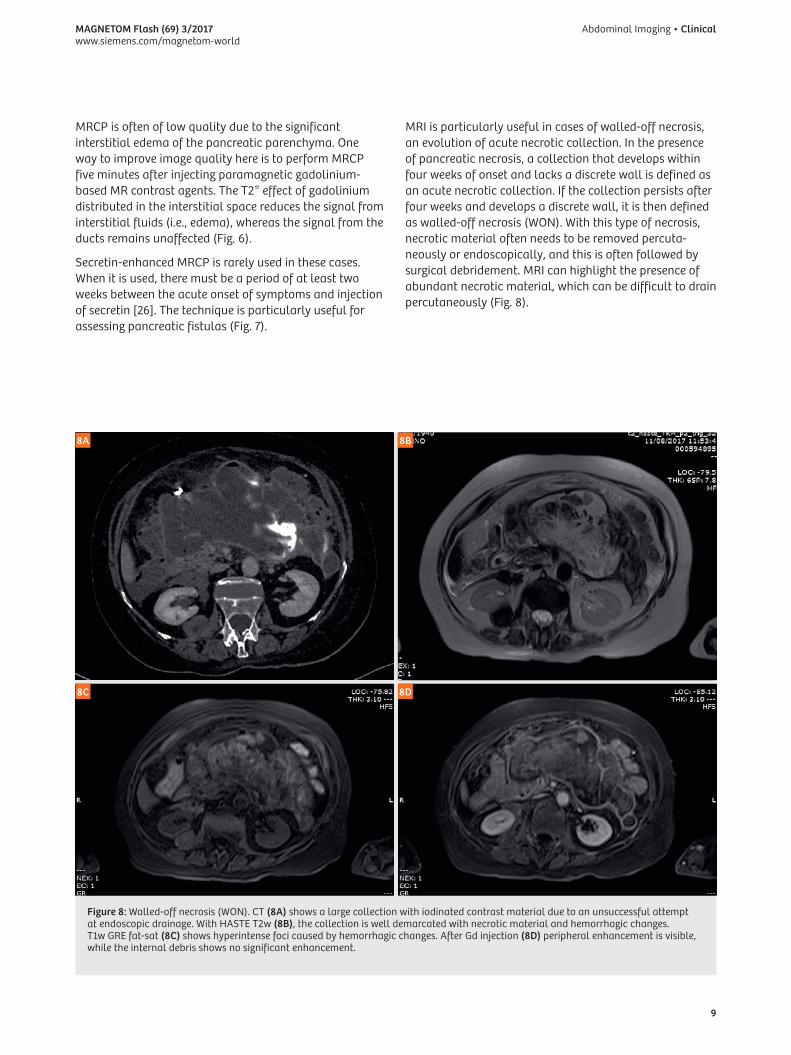
Figure 8: Walled-off necrosis (WON). CT (8A) shows a large collection with iodinated contrast material due to an unsuccessful attempt at endoscopic drainage. With HASTE T2w (8B), the collection is well demarcated with necrotic material and hemorrhagic changes. T1w GRE fat-sat (8C) shows hyperintense foci caused by hemorrhagic changes. After Gd injection (8D) peripheral enhancement is visible, while the internal debris shows no significant enhancement.
MRI is particularly useful in cases of walled-off necrosis, an evolution of acute necrotic collection. In the presence of pancreatic necrosis, a collection that develops within four weeks of onset and lacks a discrete wall is defined as an acute necrotic collection. If the collection persists after four weeks and develops a discrete wall, it is then defined as walled-off necrosis (WON). With this type of necrosis, necrotic material often needs to be removed percuta-neously or endoscopically, and this is often followed by surgical debridement. MRI can highlight the presence of abundant necrotic material, which can be difficult to drain percutaneously (Fig. 8).
MRCP is often of low quality due to the significant interstitial edema of the pancreatic parenchyma. One way to improve image quality here is to perform MRCP five minutes after injecting paramagnetic gadolinium-based MR contrast agents. The T2* effect of gadolinium distributed in the interstitial space reduces the signal from interstitial fluids (i.e., edema), whereas the signal from the ducts remains unaffected (Fig. 6).
Secretin-enhanced MRCP is rarely used in these cases. When it is used, there must be a period of at least two weeks between the acute onset of symptoms and injection of secretin [26]. The technique is particularly useful for assessing pancreatic fistulas (Fig. 7).

MAGNETOM Flash (69) 3/2017www.siemens.com/magnetom-world
Clinical • Abdominal Imaging
10
3.b Recurrent acute pancreatitis (RAP)Recurrent acute pancreatitis (RAP) is defined as the occurrence of two or more episodes of acute pancreatitis without concurrent clinical or imaging evidence of chronic pancreatitis. Irrespective of the etiology, RAP is independently associated with the development of chronic pancreatitis [32]. RAP can be caused by a variety of etiologies, including common bile duct stones or sludge, sphincter of Oddi dysfunction, pancreas divisum, anomalous pancreaticobiliary junction, genetic mutations, and alcohol-related issues. In approximately 30% of patients, the etiology of RAP is unclear and the term ‘idiopathic’ is used.
A standard MRI approach to RAP is used to detect the anatomical causes of the condition. However, secretin-enhanced MRCP also often plays a key role in diagnosing and managing RAP patients.
Secretin-enhanced MRCP is superior to conventional MRCP when it comes to detecting ductal abnormalities in RAP patients, particularly for findings related to early chronic pancreatitis. In addition, secretin-enhanced MRCP shows a reduction in exocrine function in up to one-third of RAP patients [33].
Moreover, these patients show a higher frequency of ‘acinarization’ (parenchymal blush), which is defined as a progressive increased signal intensity on T2-weighted images of the parenchyma on either side of the pancreatic duct in response to secretin-enhanced MRCP (Fig. 9) [33]. Acinarization probably occurs in patients with a propen-sity for increased pancreatic ductal pressure (i.e., patients with divisum, elevated basal pancreatic sphincter pressure, or an ampullary tumor) and adequate exocrine function (absence of severe chronic pancreatitis).
10A 10B 10C
Figure 10: Recurrent acute pancreatitis, Sphincter of Oddi dysfunction (SOD). Patient with recurrent episodes of pain and increase of pancreatic enzymes. Presecretin MRCP (10A) shows a slight dilatation of the pancreatic duct. A further increase in the diameter of the pancreatic duct can be seen in the first few minutes after secretin injection (2 minutes: 10B) and persists into the last phase of the study (8 minutes: 10C).
9A 9B 9C
Figure 9: Recurrent acute pancreatitis, parenchymal blush. Patient with recurrent episodes of pain and increase of pancreatic enzymes. Presecretin MRCP (9A) shows no significant changes. Just 2 minutes after secretin injection (9B), an increase in signal intensity of the parenchyma can be observed and persists for the full 17 minutes of the exam (9C). This phase shows a good passage of pancreatic juice in the duodenum due to adequate exocrine function.

MAGNETOM Flash (69) 3/2017www.siemens.com/magnetom-world
Abdominal Imaging • Clinical
11
Sphincter of Oddi dysfunction as a cause of idiopathic RAP remains controversial. In idiopathic RAP with nondilated ducts, an MRCP-S-guided approach achieved a diagnostic accuracy comparable to ERCP with regard to morphological lesions. The technique can be used as an alternative to ERCP and thus avoid ERCP-related complications in the diagnostic phase. The MRCP-S-guided approach provides details of the morphology of the pancreaticobiliary ductal system and permits indirect evaluation of sphincter of Oddi motility (Fig. 10). It is thus an alternative to more invasive tests such as manometry. However, the secretin test is less sensitive than manometry for intermittent sphincter motility disorders such as type II and III sphincter of Oddi dysfunction [34]. Therefore, a negative MRCP-S should be followed by manometry if clinically suspicions.
3.c Chronic pancreatitisChronic pancreatitis (CP) is a progressive inflammatory disease of the pancreas. It causes irreversible mor-phological changes and fibrotic replacement of the gland, and leads to gradual loss of exocrine and endocrine function [35].
Morphologically, CP is characterized by irregular sclerosis associated with the destruction and permanent loss of the exocrine parenchyma, which may be either focal, segmental, or diffuse. CP can involve various anatomical abnormalities of the pancreas, including atrophy or enlargement of the organ, ductal dilatation, and calcifications. The disease can be caused by alcohol abuse, smoking, gene mutations, autoimmune syndromes, metabolic disturbances, environmental conditions, and anatomical abnormalities. Most patients are found in industrialized countries, and approximately 80% suffer from alcoholism.
The pathology of CP was previously considered to be uniform, but now tends to be seen as varying according to the etiology of the disease. The rather vague term of ‘chronic sclerosing pancreatitis’ should be replaced by etiologically derived terms such as ‘alcoholic chronic pancreatitis’, ‘hereditary chronic pancreatitis’, ‘obstructive chronic pancreatitis’, ‘autoimmune pancreatitis’, and ‘paraduodenal pancreatitis’ (groove pancreatitis, cystic dystrophy of heterotopic pancreas) [36].
Imaging techniques are useful in both diagnosing CP (especially in the early stages) and classifying the disease. They can be used either to grade it, explain the etiology (even for rare forms), and differentiate the focal mass from ductal adenocarcinoma. CT, MRI, and ERCP each have a specific role to play in assessing CP, as each of the three techniques examines the pancreatic gland in different ways.
A recent meta-analysis showed that endoscopic ultra-sound (EUS), ERCP, MRI, and CT all have comparably high diagnostic accuracy in the initial diagnosis of CP, although EUS and ERCP performed better than the rest [37]. However, the robustness and noninvasive nature of MRI means that it can compete with ERCP, which actually plays a more interventional role in cases of obstructive CP.
MRI with MRCP-S can detect early signs of CP. This is because MRCP-S can replicate the ERCP findings as set out in the Cambridge classification [38], with small ductal changes suggesting early CP (Fig. 11).
Very recently, T1 mapping has also been applied to detect early fibrotic changes in mild CP. In 98 patients who were grouped as having normal (n = 53) or mild CP (n = 45) – according to their history, presenting symptoms, and respective findings from MRCP-S and ERCP – inline T1 maps were acquired using a dual flip-angle 3D gradient echo technique and Siemens MapIt software to evaluate data for all patients. The mean T1 relaxation times of the pancreas differed significantly between the control (mean = 797 ms) and mild CP groups (mean = 1,099 ms). Using the area under the ROC curve analysis, a T1 relaxation time threshold value of 900 ms revealed 80% sensitivity and 69% specificity for the diagnosis of mild CP (area under the curve = 0.81). There was substantial interobserver agreement (kappa = 0.74, 95% CI: 0.65–0.82) between the two radiologists regarding the measurement of T1 relaxation times [19].
As CP progresses, parenchymal fibrosis reduces pancreatic function. The exocrine component can be viewed after secretin injection (Fig. 12). A decrease in pancreatic exocrine function can be visualized as a reduction in duodenal filling [39] and quantified by measuring changes in small-bowel water volume [40]. Parenchymal fibrosis also decreases the signal on T1 fat sat images. A strong correlation exists between MRI/MRCP-S findings and the histopathology of noncalcific CP [41].
In advanced stages, a diffuse dilatation of the duct of Wirsung can be observed, while ductal calcifications can be appreciated as a defect inside the duct (Fig. 13).
CP increases the risk of pancreatic cancer [42]. This is especially true for patients with hereditary pancreatitis, whose standardized incidence ratio is 67–87 [43]. These patients should therefore be subject to a long-term follow-up in order to detect the cancer in its earliest phase [43].
Moreover, some imaging manifestations of CP can simulate a pancreatic carcinoma. Differential diagnosis is therefore important in order to avoid unnecessary resections.
MAGNETOM Flash (69) 3/2017www.siemens.com/magnetom-world
Clinical • Abdominal Imaging
12
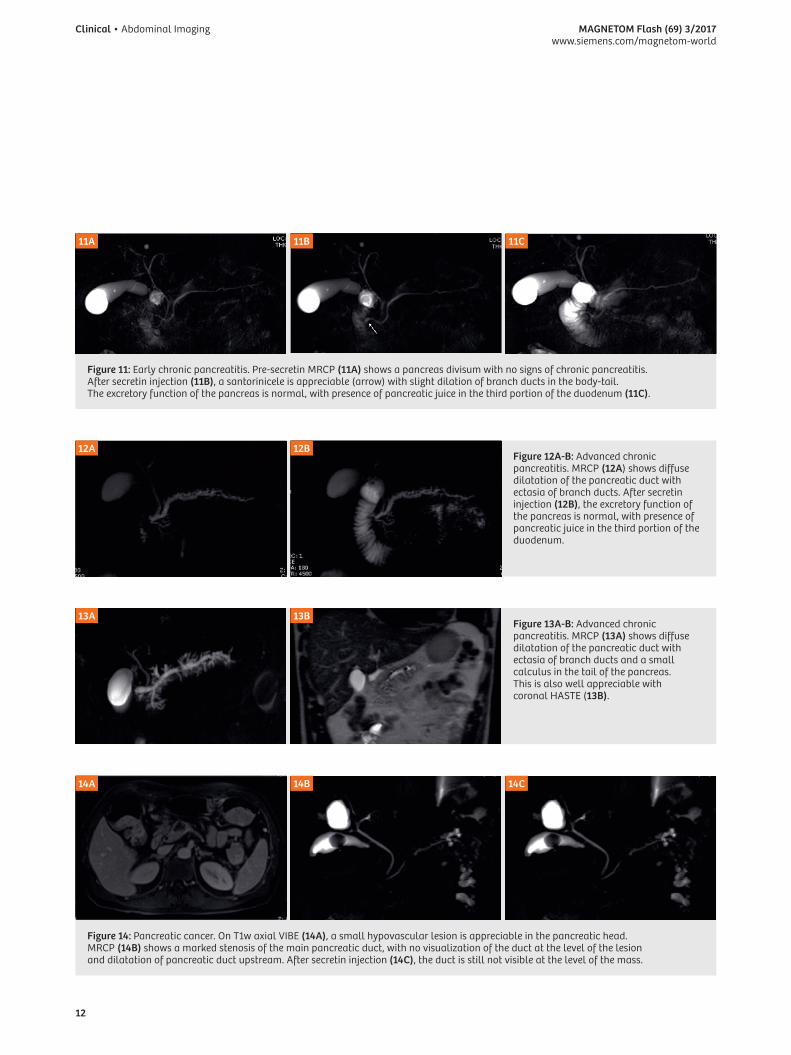
13A 13BFigure 13A-B: Advanced chronic pancreatitis. MRCP (13A) shows diffuse dilatation of the pancreatic duct with ectasia of branch ducts and a small calculus in the tail of the pancreas. This is also well appreciable with coronal HASTE (13B).
14A 14B 14C
Figure 14: Pancreatic cancer. On T1w axial VIBE (14A), a small hypovascular lesion is appreciable in the pancreatic head. MRCP (14B) shows a marked stenosis of the main pancreatic duct, with no visualization of the duct at the level of the lesion and dilatation of pancreatic duct upstream. After secretin injection (14C), the duct is still not visible at the level of the mass.
12A 12BFigure 12A-B: Advanced chronic pancreatitis. MRCP (12A) shows diffuse dilatation of the pancreatic duct with ectasia of branch ducts. After secretin injection (12B), the excretory function of the pancreas is normal, with presence of pancreatic juice in the third portion of the duodenum.
11A 11B 11C
Figure 11: Early chronic pancreatitis. Pre-secretin MRCP (11A) shows a pancreas divisum with no signs of chronic pancreatitis. After secretin injection (11B), a santorinicele is appreciable (arrow) with slight dilation of branch ducts in the body-tail. The excretory function of the pancreas is normal, with presence of pancreatic juice in the third portion of the duodenum (11C).

MAGNETOM Flash (69) 3/2017www.siemens.com/magnetom-world
Abdominal Imaging • Clinical
13
3.c.1 Focal chronic pancreatitis
Approximately 20% of patients with chronic pancreatitis develop a focal inflammatory mass [44] which may closely mimic pancreatic cancer. The two may be virtually indistinguishable on the basis of morphological features or the enhancement pattern in MRI. Both will show hypointensity on unenhanced T1-weighted fat-suppressed images, hypovascularity in pancreatic arterial phase, and delayed enhancement with isointensity in venous and equilibrium phases. This is because an abundant fibrous stroma is present in both adenocarcinoma and focal pancreatitis [45].
MRCP is an important tool for differentiating most of these pancreatic lesions. Morphological changes in the main pancreatic duct may be one of the most useful ways of distinguishing focal chronic pancreatitis from adenocarcinoma. The most characteristic findings for cancer are complete obstruction of the main pancreatic duct and upstream dilatation of the duct (Fig. 14). A nonobstructed main pancreatic duct penetrates the mass more frequently in focal chronic pancreatitis (‘duct-penetrating sign’, Fig. 15) [46]. With a secretin injection, the best way of differentiating mass-forming pancreatitis from pancreatic carcinoma is via stenosis resolution, which was observed in 88.6% of mass-forming pancreatitis cases and in 0% of pancreatic carcinoma cases [47] (Fig. 15). This finding is not observed in malignant duct stenosis (Fig. 14).
DWI sequences do not seem to provide additional value in the differential diagnosis of pancreatic carcinoma and mass-forming chronic pancreatitis, with no significant differences in the signal intensity of DW images or ADC [48, 49]. However, the perfusion-related parameters f and Dfast are helpful in characterizing pancreatic diseases [13, 14].
3.c.2 Paraduodenal pancreatitis (PP)
Paraduodenal pancreatitis (PP) is a form of chronic pancreatitis involving the duodenal wall in the region of the minor papilla. It is considered a distinct entity with specific pathological findings.
Histologically, there is a thickening and scarring of the duodenal wall (particularly in the area corresponding to the minor papilla) that extends to the adjacent pancreatic tissue, and/or cystic changes in the duodenal wall. The cysts contain clear fluid, although granular white material and even stones can be present. Occasionally, some of the cysts may reach up to several centimeters in diameter. The fibrotic tissue that develops in the duodenal wall and also involves the groove between the duodenum and the pancreatic head might compress and indent the common bile duct [50].
The clinical profile of PP is middle-aged men who are heavy drinkers and smokers. They suffer from painful pancreatitis that is associated with vomiting and weight loss due to duodenal stenosis and impaired motility [51].
Although alcohol abuse appears to be an important risk factor, the location of the inflammatory process – the duodenal submucosa, the duodenal wall, and the adjacent pancreatic tissue – suggests that some anatomical variation in the region of the minor papilla makes this area particularly susceptible to alcohol injury. It is conceivable that the fluid outflow may be obstructed at the level of the minor papilla, as is the case in some instances of pancreas divisum. The frequent presence of heterotopic pancreatic tissue in the duodenal wall may reflect the incomplete involution of the dorsal pancreas in this region, and might contribute to an obstruction of the outflow in this area [36].
15A 15BFigure 15: Benign duct stenosis. MRCP (15A) shows stenosis of the duct of Wirsung. After secretin injection (15B), the stenosis is no longer recognizable.
MAGNETOM Flash (69) 3/2017www.siemens.com/magnetom-world
Clinical • Abdominal Imaging
14
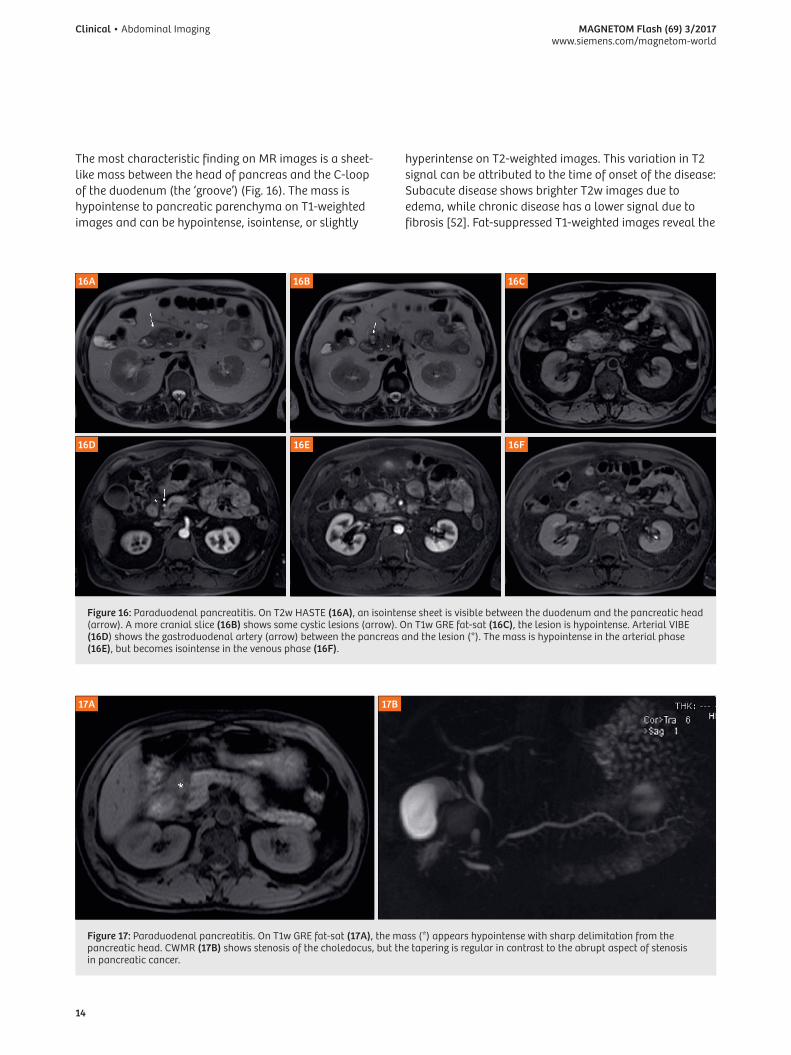
Figure 17: Paraduodenal pancreatitis. On T1w GRE fat-sat (17A), the mass (*) appears hypointense with sharp delimitation from the pancreatic head. CWMR (17B) shows stenosis of the choledocus, but the tapering is regular in contrast to the abrupt aspect of stenosis in pancreatic cancer.
17A 17B
The most characteristic finding on MR images is a sheet-like mass between the head of pancreas and the C-loop of the duodenum (the ‘groove’) (Fig. 16). The mass is hypointense to pancreatic parenchyma on T1-weighted images and can be hypointense, isointense, or slightly
hyperintense on T2-weighted images. This variation in T2 signal can be attributed to the time of onset of the disease: Subacute disease shows brighter T2w images due to edema, while chronic disease has a lower signal due to fibrosis [52]. Fat-suppressed T1-weighted images reveal the
Figure 16: Paraduodenal pancreatitis. On T2w HASTE (16A), an isointense sheet is visible between the duodenum and the pancreatic head (arrow). A more cranial slice (16B) shows some cystic lesions (arrow). On T1w GRE fat-sat (16C), the lesion is hypointense. Arterial VIBE (16D) shows the gastroduodenal artery (arrow) between the pancreas and the lesion (*). The mass is hypointense in the arterial phase (16E), but becomes isointense in the venous phase (16F).
16A
16D
16B
16E
16C
16F
MAGNETOM Flash (69) 3/2017www.siemens.com/magnetom-world
Abdominal Imaging • Clinical
15
best delineation of the pancreatic head (normal hyperintensity if the pancreatic head is spared as in the pure form) from the hypointense mass in the pancreatico-duodenal groove [53]. Contrast-enhanced dynamic images show a delayed and progressive enhancement in the late phase that reflects the fibrous nature of the tissue (Fig. 16F). In the early stages, the main pancreatic duct is normal. An important differentiator is the absence of vascular encasement in groove pancreatitis, with leftward vascular (gastroduodenal artery) displacement without obstruction (Fig. 16D). The pancreatic carcinoma extending to the groove or duodenal wall invades along peripancreatic vessels [53].
Cystic lesions are well depicted in the groove or in the duodenal wall, especially in T2-weighted images (Fig. 16B). MRCP helps to show the relationship between the ductal system and the cystic changes.
In advanced cases, the pancreatic head or entire gland are involved and show hypointensity on T1-weighted images. A ductal dilatation with secondary duct ectasia is observed in some patients.
The duodenal wall is usually thickened and so the images should be evaluated carefully as it is not commonly associated with tumors in the pancreatic head.
Sometimes the common bile duct appears stenotic, but the tapering is regular, unlike the abruptness of stenosis in pancreatic cancer (Fig. 17) [52].
3.c.3 Autoimmune pancreatitis (AIP)
Autoimmune pancreatitis (AIP) is a relatively new condition and is increasingly being recognized. It accounts for 1–6% of cases of chronic pancreatitis [54]. Most of the affected patients are between 40 and 60 years old, with a strong male prevalence. AIP is associated with other autoimmune disorders such as Crohn’s disease, Sjögren’s syndrome, rheumatoid arthritis, primary sclerosing cholangitis, primary biliary cirrhosis, ulcerative colitis, systemic lupus erythematous, and retroperitoneal fibrosis [55].
By international consensus, AIP has been subdivided into two forms: Type 1 (> 60 years of age with male prevalence: 77%) and type 2 (40 years of age, no gender prevalence) [56]. However, more recent studies suggest that the natural history, diagnostic criteria, and treatment approach of the two conditions differ significantly. This has led to proposals for the term ‘autoimmune pancreatitis’ to be restricted to describing the clinical phenotype represented by lymphoplasmacytic sclerosing pancreatitis (LPSP), currently called type 1 AIP, and for type 2 AIP to be described as idiopathic duct-centric chronic pancreatitis (IDCP) [57].
LPSP is characterized by a systemic IgG4-associated disorder with elevated IgG4-positive cells in serology, the pancreas, and other organs (salivary glands, kidneys, and bile ducts). It is the most common form worldwide, accounting for almost all cases in Japan and Korea, and more than 80% of cases in Europe and the United States.
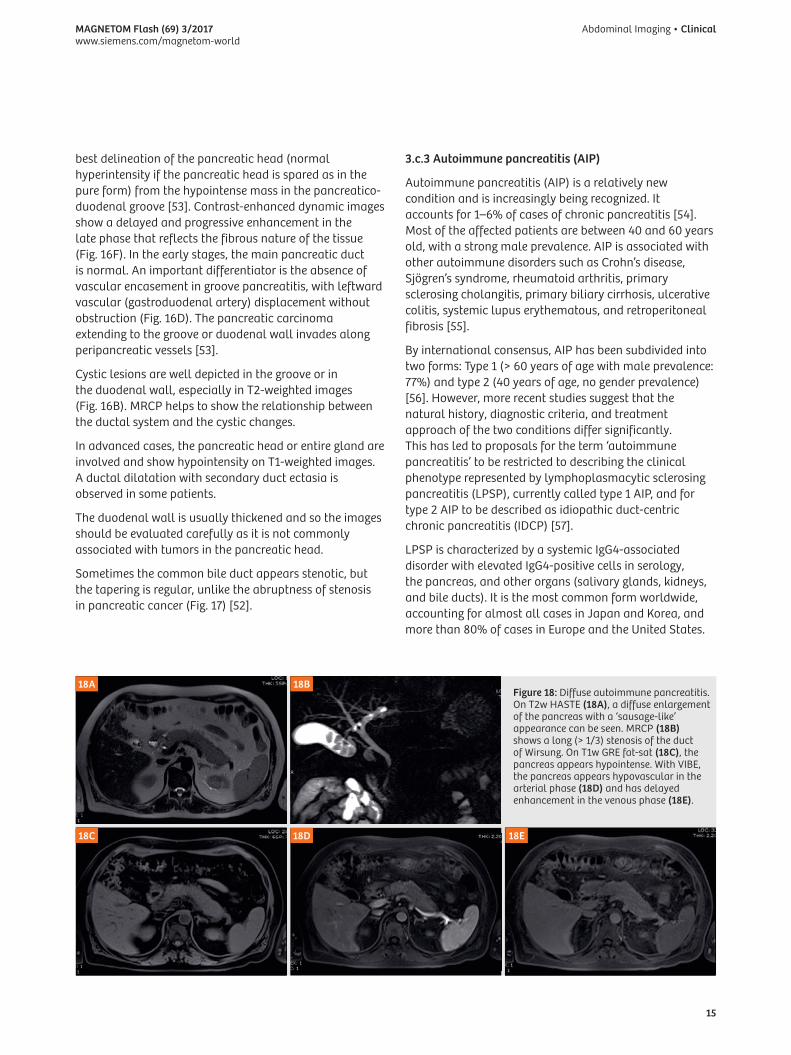
Figure 18: Diffuse autoimmune pancreatitis. On T2w HASTE (18A), a diffuse enlargement of the pancreas with a ‘sausage-like’ appearance can be seen. MRCP (18B) shows a long (> 1/3) stenosis of the duct of Wirsung. On T1w GRE fat-sat (18C), the pancreas appears hypointense. With VIBE, the pancreas appears hypovascular in the arterial phase (18D) and has delayed enhancement in the venous phase (18E).
18A
18C
18B
18D 18E
MAGNETOM Flash (69) 3/2017www.siemens.com/magnetom-world
Clinical • Abdominal Imaging
16
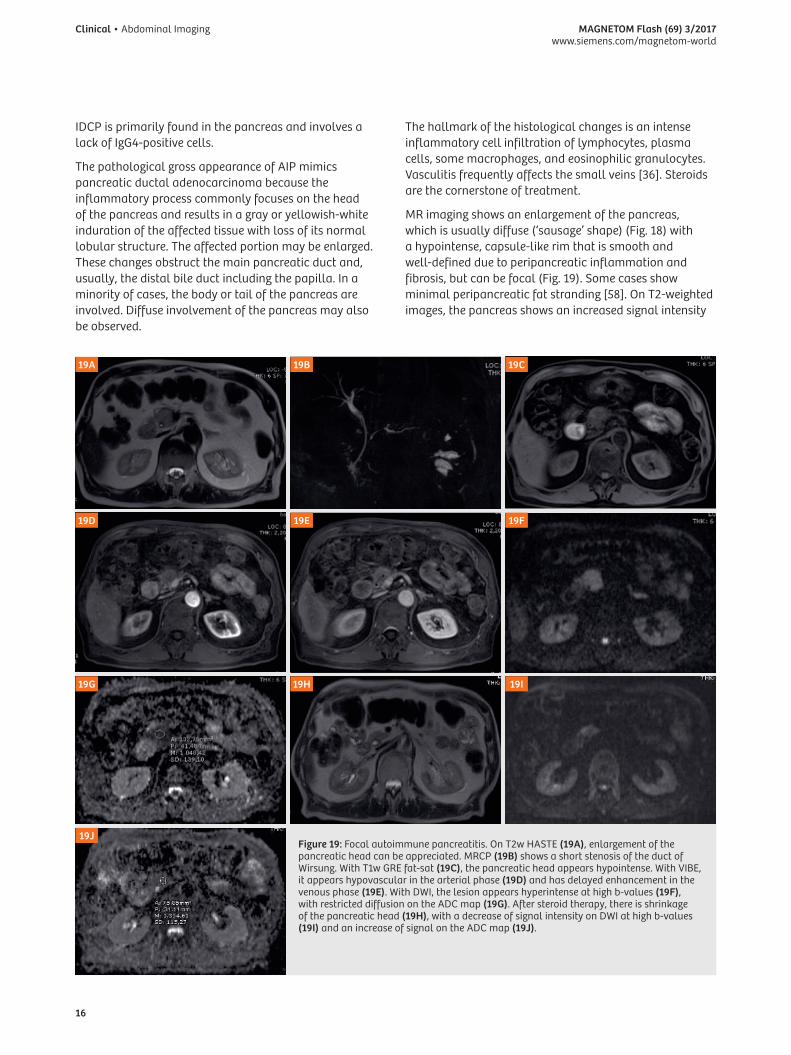
IDCP is primarily found in the pancreas and involves a lack of IgG4-positive cells.
The pathological gross appearance of AIP mimics pancreatic ductal adenocarcinoma because the inflammatory process commonly focuses on the head of the pancreas and results in a gray or yellowish-white induration of the affected tissue with loss of its normal lobular structure. The affected portion may be enlarged. These changes obstruct the main pancreatic duct and, usually, the distal bile duct including the papilla. In a minority of cases, the body or tail of the pancreas are involved. Diffuse involvement of the pancreas may also be observed.
The hallmark of the histological changes is an intense inflammatory cell infiltration of lymphocytes, plasma cells, some macrophages, and eosinophilic granulocytes. Vasculitis frequently affects the small veins [36]. Steroids are the cornerstone of treatment.
MR imaging shows an enlargement of the pancreas, which is usually diffuse (‘sausage’ shape) (Fig. 18) with a hypointense, capsule-like rim that is smooth and well-defined due to peripancreatic inflammation and fibrosis, but can be focal (Fig. 19). Some cases show minimal peripancreatic fat stranding [58]. On T2-weighted images, the pancreas shows an increased signal intensity
Figure 19: Focal autoimmune pancreatitis. On T2w HASTE (19A), enlargement of the pancreatic head can be appreciated. MRCP (19B) shows a short stenosis of the duct of Wirsung. With T1w GRE fat-sat (19C), the pancreatic head appears hypointense. With VIBE, it appears hypovascular in the arterial phase (19D) and has delayed enhancement in the venous phase (19E). With DWI, the lesion appears hyperintense at high b-values (19F), with restricted diffusion on the ADC map (19G). After steroid therapy, there is shrinkage of the pancreatic head (19H), with a decrease of signal intensity on DWI at high b-values (19I) and an increase of signal on the ADC map (19J).
19A
19D
19G
19J
19B
19E
19H
19C
19F
19I
MAGNETOM Flash (69) 3/2017www.siemens.com/magnetom-world
Abdominal Imaging • Clinical
17
(Figs. 18A, 19A) compared with the signal intensity of the liver, with the hypointense capsule-like rim usually depicted best. The main pancreatic duct shows diffuse (Fig. 18B) or focal stenosis (Fig. 19B), where narrowing is usually longer than the stenosis of the main pancreatic duct in pancreatic cancer. Mild dilatation of the duct upstream of the affected area may occur (Fig. 19B).
On T1-weighted images, the affected pancreas shows decreased signal intensity compared with the signal intensity of the liver due to pancreatic fibrosis, with a distinctive reduction in signal on fat-saturated sequences (Figs. 18C, 19C). Contrast enhancement of the affected pancreatic parenchyma is usually reduced, with a delayed contrast enhancement (Figs. 18D-E, 19D-E) or a capsule-like rim [59]. Vessel invasion, vascular encasement, mass effect, and fluid collections are absent [58].
After steroid therapy, abnormal signal intensity of the pancreas improves to isointensity with that of the liver in both T1- and T2-weighted images. The pancreas returns to normal size or becomes atrophic (Fig. 19H), the capsule-like rim disappears, and stenosis of the lower common bile duct improves with subsequent decompression of the biliary tree and pancreatic duct [59].
Some studies suggest that DWI is helpful for differential diagnosis and control after steroid treatment. AIP shows DWI signal intensity and ADC values that are well correlated with the active symptoms of AIP patients, suggesting that DWI may be an objective biomarker for determining the indication for steroid therapy (Figs. 19F, G) [60]. Signal intensity decreases after therapy, thus reflecting disease activity (Figs. 19I, J) [61].
ADC values are significantly lower in AIP than in pancreatic cancer, and an ADC cut-off value may be useful for distinguishing AIP from pancreatic cancer [62, 63]. However, the DWI signal and ADC maps are similar to pancreatic carcinoma, making the differential diagnosis difficult. Although differentiating mass-forming AIP from pancreatic cancer is challenging, combining MRI findings (including contrast-enhanced dynamic images, MRCP, and DWI) can be helpful [64].
Finally, the IVIM parameter f is helpful in differentiating between AIP and pancreatic cancer, and could serve as an imaging biomarker during steroid treatment [65].
20A
20D
20B
20E
20C
20F
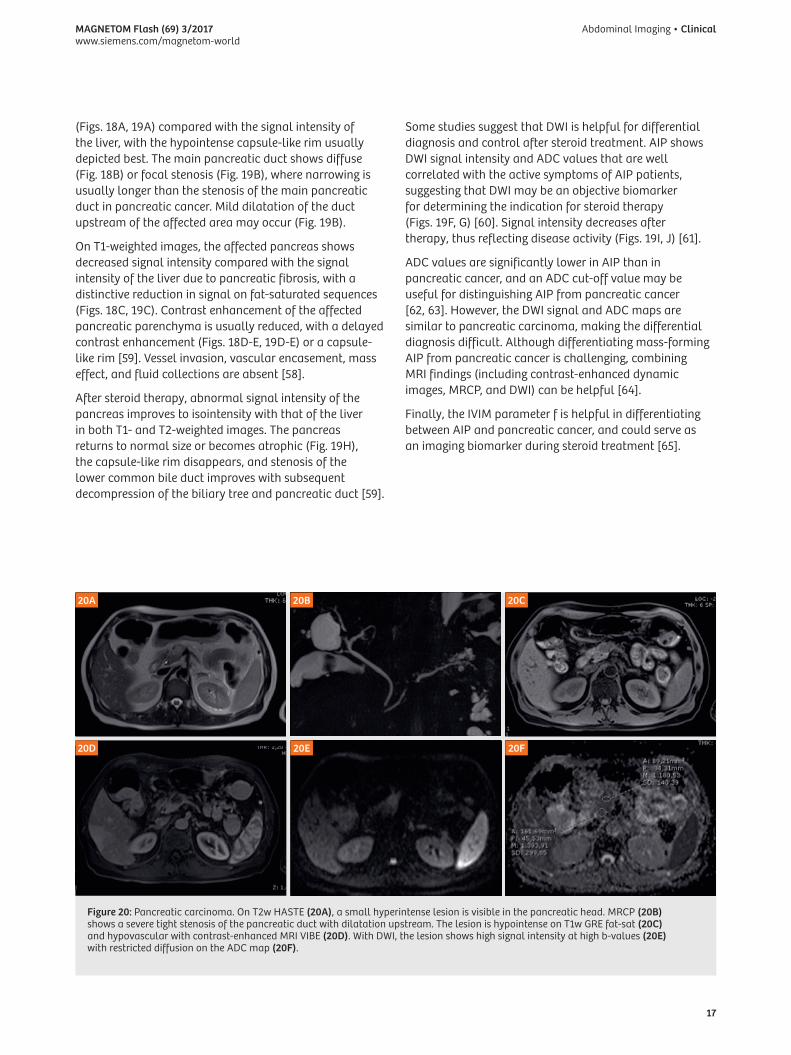
Figure 20: Pancreatic carcinoma. On T2w HASTE (20A), a small hyperintense lesion is visible in the pancreatic head. MRCP (20B) shows a severe tight stenosis of the pancreatic duct with dilatation upstream. The lesion is hypointense on T1w GRE fat-sat (20C) and hypovascular with contrast-enhanced MRI VIBE (20D). With DWI, the lesion shows high signal intensity at high b-values (20E) with restricted diffusion on the ADC map (20F).

MAGNETOM Flash (69) 3/2017www.siemens.com/magnetom-world
Clinical • Abdominal Imaging
18
3.d Pancreatic carcinomaPancreatic carcinoma is the fourth most common cause of cancer death in the USA. The five-year survival rate is less than 5% [66]. About 60% of tumors occur in the head of the pancreas, 15% occur in the body, 5% occur in the tail, and 20% involve the pancreas diffusely [67]. At the time of diagnosis, tumors located in the head are usually smaller (2.5 to 3 cm) than those in the body-tail (5 to 7 cm) because of their earlier clinical manifestation due to the close contiguity with the choledochus.
The gross pathological features of pancreatic carcinoma are a mass with irregular, ill-defined contours and a sig-nificant fibrous component, and (less frequently) necrotic changes. The lack of a capsule is responsible for the early spread of the lesion to the surrounding structures, and particularly for vascular and neural invasion.
On unenhanced MR imaging (Fig. 20), pancreatic carci-noma shows a slightly different signal on T2w images from the surrounding pancreas, ranging from minimally hypointense to isointense to slightly hyperintense (Fig. 20A). This makes it difficult to identify the mass when it is small. Necrotic or cystic degeneration of the lesion can be easily identified by the hyperintensity on T2w images [68]. T2w images with fat saturation are considered useful in staging the lesion, and for evaluating the lymph node and peritoneal or hepatic metastases [69], where MRI is considered more sensitive than multidetector computed tomography [44]. The obstruction of the MPD is respon-sible for the dilatation of the duct upstream (Fig. 20B).
On T1w images, pancreatic carcinoma usually appears as a mass of lower signal than the normal pancreas (Fig. 20C). However, small tumors can show a late enhancement. Moreover, the obstruction of the main pancreatic duct is responsible for the dilatation of the duct with chronic obstructive pancreatitis of the pancreatic gland upstream. Since this has the same low signal on T1w images, it disguises the true extent of the tumor and makes it indiscernible from the pancreatic tumor on T2w and especially on T1w images [2]. Later, the obstruction of the main pancreatic duct causes the pancreatic gland upstream to atrophy (Fig. 21).
On dynamic imaging after injection of paramagnetic contrast agent, the presence of an abundant fibrous stroma within the tumor makes the tumor hypovascular and causes it to appear hypointense to the surrounding parenchyma (Fig. 20D). It can, however, be responsible for a delayed enhancement with secondary isointensity of the lesion (Fig. 21D) [45]. Isointensity of the tumor to the surrounding parenchyma, and coexisting or secondary chronic pancreatitis upstream can make it hard to identify the tumor and differentiate it from chronic pancreatitis [70].
In terms of DWI, most papers find that pancreatic carcinoma shows a restricted diffusion of free water with high b-values (> 500), which makes it appear hyperintense on diffusion-weighted images at high b-values (Fig. 20E). ADC maps show lower values for the tumor than for normal pancreatic parenchyma (Fig. 20F) [71]. However, similar findings have also been described with benign inflammatory lesions. The low ADC value of pancreatic cancer and mass-forming pancreatitis may stem from high cellularity and abundant fibrosis, which are common histopathological features of both pancreatic cancer and mass-forming pancreatitis. In chronic pancreatitis, fibrosis and chronic inflammation lead to the destruction and permanent loss of exocrine pancreatic tissue, and to the replacement of normal pancreatic parenchyma with fibrous tissue which may reduce the diffusion of tissue water and result in lower ADCs [72]. In autoimmune pancreatitis, the lymphocytic infiltration of the pancreatic gland restricts the movement of free water, with a DWI signal and ADC map similar to those of pancreatic carcinoma [61].
Although the DWI signal and ADC map are similar to those in pancreatic carcinoma and thus make the differential diagnosis difficult, combining MRI findings (including contrast-enhanced dynamic images, MRCP, and DWI) can be helpful [64]. ADC values are significantly lower in autoimmune pancreatitis (AIP) than in pancreatic cancer, and an ADC cut-off value may be useful for distinguishing AIP from pancreatic cancer [62, 63]. The IVIM parameters f and Dfast are also helpful in characterizing pancreatic diseases [13, 14].
With MRCP, stenosis of the main pancreatic duct can be easily identified with dilation upstream (Figs. 20B, 21B) [73]. In the case of a tumor in the head of the pancreas, stenosis of the intrapancreatic biliary duct can be seen, with dilation upstream and stenosis of both the biliary and pancreatic ducts (double duct sign) (Fig. 22), although it is not a specific sign of pancreatic carcinoma [74]. Stenosis of the biliary duct and main pancreatic duct are also visible in cases of chronic pancreatitis or inflammatory duodenal lesions [23]. An abrupt stenosis with sharp margins indicates malignant stenosis, while an irregular shape with beaded appearance is more indicative of chronic inflammation of the pancreas.
Some patients are at a high risk of developing pancreatic cancer [75]. According to preliminary studies, an MRI-based protocol for examining individuals at risk of pancreatic cancer seems to detect cancer or premalignant lesions with good accuracy. Compared with protocols based on more aggressive methods, using MRI exclusively can reduce costs, increase availability, and guarantee the safety of the individuals being examined [76].

MAGNETOM Flash (69) 3/2017www.siemens.com/magnetom-world
Abdominal Imaging • Clinical
19
21A
21C
21B
21D
Figure 21: Pancreatic carcinoma. With T2w HASTE (21A), a small hyper-intense lesion is visible in the tail of the pancreas, with upstream dilatation of the duct of Wirsung and atrophy of the parenchyma. MRCP (21B) shows a severe tight stenosis of the pancreatic duct with dilatation upstream. The lesion is hypovascular on contrast-enhanced MRI VIBE during the arterial phase (21C) and shows contrast uptake in the late phase (21D).
22
Figure 22: Pancreatic carcinoma. MRCP shows dilatation of the choledocus and the duct of Wirsung (double duct sign), which is caused by a carcinoma in the pancreatic head.
Figure 23: Neuroendocrine tumor G1. On T2w HASTE (23A), a small, slightly hyperintense lesion is visible in the tail of the pancreas (arrow). The lesion is hypointense on T1 GRE fat-sat (23B) and appears hypervascular in the arterial phase (23C), with washout in the venous phase (23D) and delayed phase (23E). On DWI, the lesion shows high signal intensity at high b-values (23F) and appears hypointense on the ADC map (23G).
23A
23D
23G
23B
23E
23C
23F
MAGNETOM Flash (69) 3/2017www.siemens.com/magnetom-world
Clinical • Abdominal Imaging
20
3.e Neuroendocrine tumorsPancreatic neuroendocrine tumors (PNETs) are relatively uncommon neoplasms. They account for 2% or fewer of all pancreatic neoplasms, with an estimated incidence of less than 1 per 100,000 people per year worldwide [77, 78]. PNETs can occur in people of all ages, with a peak incidence at between 30 and 60 years. Most PNETs are sporadic, but nearly 25% can occur in the context of genetic syndromes such as multiple endocrine neoplasia type 1 (MEN-1), Von Hippel-Lindau disease (VHL), neurofibromatosis type 1 (NF-1), and tuberous sclerosis [79, 80]. These tumors have a wide range of clinical, biological, morphological, and molecular features.
Compared with the other solid pancreatic neoplasms, PNETs take an overall more indolent course. Nonetheless, the biological behavior is extremely variable, ranging from more benign to highly malignant [81]. The revised World Health Organization (WHO) classification based on mitotic index and Ki-67 proliferation divides PNETs into three classes: Well-differentiated endocrine tumor or carcinoids (grade I, benign or uncertain behavior); well-differentiated endocrine carcinoma (grade II, low-grade malignant behavior); poorly differentiated endocrine carcinoma (grade III, high-grade malignant behavior) [77]. A Ki-67 index of less than 2%, between 3% and 20%, and above 20%, is characteristic of low-, intermediate-, and high-grade PNET respectively. WHO tumor grade is an independent prognostic factor of survival in patients with PNETs [77, 82, 83].
Nearly all well-differentiated PNETs secrete hormones, but most patients do not show a clinically apparent endocrinopathy as the hormones are produced in small quantities or are functionally inactive. Clinically, PNETs can be divided into hyperfunctioning (HF-PNET) and non-hyperfunctioning (NF-PNET) according to the presence or absence of a paraneoplastic endocrinopathy caused by uncontrolled hormone secretion.
HF-PNET is almost always diagnosed biochemically, and imaging is used to establish the location and extent of the primary tumor, assess potential metastatic spread, and plan surgery. Non-invasive techniques such as CT and MRI combined with nuclear medicine approaches are helpful here. Insulinomas and gastrinomas are the most common functional PNETs. Insulinomas are usually benign (in about 90% of cases) and small, whereas gastrinomas are larger and malignant in nearly 60% of cases. Nowadays, nearly 85% of PNETs are NF-PNETs and it is thought that their incidence has been increasing over recent years due to more frequent incidental detection [84–86]. Non-functional tumors tend to be symptomatic due to their large mass or to metastatic disease, and are malignant in most cases [87].
Morphologically, most PNETs have a predominantly intraparenchymal pattern of growth, presenting as a single lesion when sporadic, and ranging from 0.5 to 5 cm in size at diagnosis [83]. CT and MRI are typically the first choice of imaging modalities for evaluating most patients with suspected PNET. The appearance of PNETs can vary considerably and differs depending on whether the tumor is functional or non-functional. Like normal endocrine tissue, endocrine tumors often have a dense capillary network, and tumor growth is highly dependent on the development of a vascular supply. This high vascular density results in the characteristic enhancement feature of classic HF-PNETs: A uniformly hypervascular and well-defined lesion that is most prominent on arterial phases of contrast enhancement (Fig. 23).
However, while traditionally described as hypervascular solid masses, NF-PNETs vary considerably in terms of enhancement pattern and imaging appearance. Digital subtraction of late arterial phase with the unenhanced phase improves the detection and characterization of PNETs [88]. Recent data show how the majority of NF-PNETs are well defined or encapsulated, and predominantly solid and hypovascular in more than 50% of cases compared to the normal pancreas on late arterial and venous portal phases in CT and MRI [89]. However, no correlation was found between WHO grade and enhancement pattern [81, 90]. A strong correlation has been established between lesion size and tumor grade [91].
Generally, imaging characteristics are related to lesion size [92]. Smaller lesions tend to be more homogeneous, and larger lesions are more likely to demonstrate heterogeneous enhancement (Fig. 24), areas of cystic degeneration (Fig. 25), necrosis, fibrosis, and calcification (calcifications are seen in about 20% of NF-PNETs). NF-PNETs with an essentially completely cystic, unilocular appearance can also be observed. In these cases, a ring-like enhancing pseudocapsule is present and a similar-looking lesion in the pancreas raises the possibility of a diagnosis of NF-PNET [93]. On MRI, PNETs generally appear as relatively hypointense on T1-weighted images, and most have a signal intensity that is much higher than that of a normal pancreas on T2-weighted images. An abundance of intratumoral fibrosis accounts for the iso/hypointense T2-weighted images seen in some NF-PNETs. Main pancreatic duct dilatation is not a common finding, but it is possible. This, combined with a heterogeneous or non-classic enhancement pattern make PNET diagnosis more complex. Moreover, main pancreatic duct dilatation shows high specificity and positive predictive value for predicting PNETs of uncertain or malignant behavior [94].

MAGNETOM Flash (69) 3/2017www.siemens.com/magnetom-world
Abdominal Imaging • Clinical
21
24A
24E
24B
24F
24C
24G
24D
Figure 24: Neuroendocrine tumor. On T2w HASTE (24A, B), a round inhomogeneous lesion is appreciable at the level of the body of the pancreas. On T1 GRE fat-sat (24C), the lesion is inhomogeneously hypointense. After Gd injection (24D, E), the lesion shows inhomogeneous enhancement, which is more marked in the venous phase (24E). On DWI, the lesion shows areas of high signal intensity at high b-values (24F), and appears hypointense on the ADC map (24G).
25A
25D
25B
25E
25C
25F
Figure 25: Neuroendocrine tumor. T2w HASTE (25A, B) shows a cystic lesion with a nodule in the tail of the pancreas. After contrast injection (25B-D), the lesion shows inhomogeneous enhancement, starting from the nodule and with progressive enhancement of the cystic component. With DWI, the lesion shows areas of high signal intensity at high b-values (25E) and appears hypointense on the ADC map (25F).

MAGNETOM Flash (69) 3/2017www.siemens.com/magnetom-world
Clinical • Abdominal Imaging
22
With DWI, PNETs usually show high signal intensity at high b-values and low ADC maps (Fig. 23F) [95]. Some studies show an inverse correlation between tumor grade and ADC map [91, 96, 97].
It has been suggested that the fusion of high b-value DWI and T2-weighted MR images can bring added value to the detection of pancreatic neuroendocrine tumors [98].
Histological diagnosis is mandatory in all cases and is usually obtained via surgical or endoscopic biopsies, or via ultrasound-guided liver biopsies. Endoscopic ultrasound-guided fine-needle aspiration (EUS-FNA) is effective for preoperatively determining Ki-67 expression, which is an important prognostic factor for PNET. EUS-FNA is highly accurate for neuroendocrine tumors, with a sensitivity above 90%, which means it is helpful for making a diagnosis [99].
3.f Cystic lesions (PCL)With advances in diagnostic imaging, pancreatic cystic lesions (PCLs) are being detected with increasing frequency. At some referral centers, up to 30% of pancreatic resections are performed for cystic tumors [100]. It is important to accurately identify cystic tumors because they require different treatments according to their histological type and differentiation. However, the frequent lack of specific clinical and laboratory signs, and the overlap of imaging findings between different cystic tumors and between non-neoplastic and neoplastic cystic lesions of the pancreas mean that managing these patients is complex.
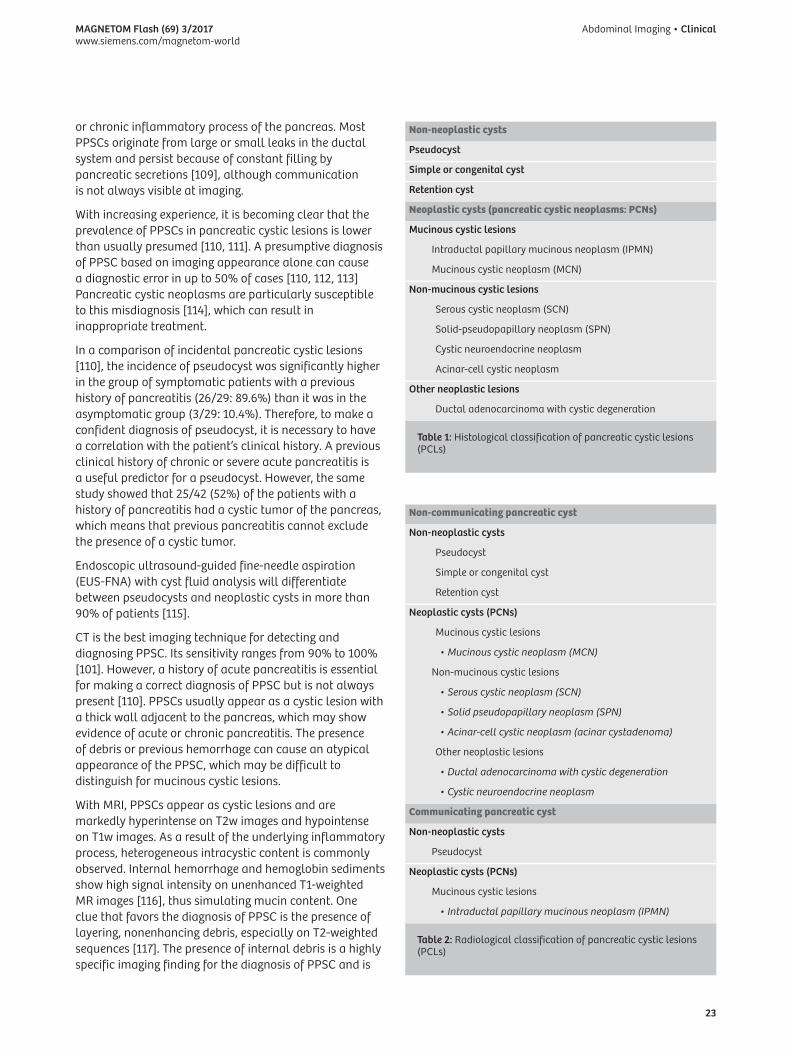
PCLs can be simply classified into two main groups: Non-neoplastic cysts and neoplastic cysts, which are commonly known as pancreatic cystic neoplasms (PCNs) (Tab. 1). Neoplastic cysts can be divided in non-mucinous
and mucinous, with the latter considered premalignant lesions. In reality, non-mucinous neoplastic cysts also have lesions which need to be resected (Tab. 1). In general, non-neoplastic cysts account for up to 80% of all PCLs [101].
Although all pancreatic tumors, including ductal adenocarcinoma, may appear as cystic lesions, degenerative changes [102] mean that the classic cystic neoplasms of the pancreas are lined with a different epithelium whose morphology is the main diagnostic criterion and provides the prognostic value. Their macroscopic appearance (shape, volume, etc.), however, has no importance [103].
When dealing with a PCL, it is important to confirm or exclude communication between the cystic lesion and the main pancreatic duct. Radiologically, PCLs can be subdivided into non-communicating and communicating (Tab. 2). This section will only discuss the most frequent lesions.
In the differential diagnosis of benign and malignant pancreatic cystic neoplasms, MRI with MRCP has a sensitivity and specificity of 94% and 75% respectively [104], an accuracy of 73–81% [105, 106], and AUROC values of 0.73–0.91 [104–108]. MRI can exclude the malignancy of pancreatic cystic neoplasms with a negative predictive value (NPV) of 74–96% [105, 106].
3.f.1 Pancreatic pseudocyst (PPSC)
Pancreatic pseudocysts (PPSCs) are defined as a cystic cavity bound to the pancreas by inflammatory tissue and containing pancreatic juice or amylase-rich fluid. Typically, the wall of the pancreatic pseudocyst is fibrous and lacks an epithelial lining, making it different from a true pancreatic cyst. PPSCs are usually related to an acute
26A 26B
26C 26D
Figure 26: Pancreatic pseudocyst. On T2w HASTE (26A), a large inhomogeneous cyst is appreciable in the pancreatic head. The duct of Wirsung is dilated, with signs of chronic pancreatitis. MRCP (26B) clearly shows the morphological changes involved in chronic pancreatitis. On T1w GRE fat-sat (26C), the content of the cyst is inhomogeneous due to the presence of internal debris, which appears hyperintense and does not enhance after contrast administration (26D).
MAGNETOM Flash (69) 3/2017www.siemens.com/magnetom-world
Abdominal Imaging • Clinical
23
Non-neoplastic cysts
Pseudocyst
Simple or congenital cyst
Retention cyst
Neoplastic cysts (pancreatic cystic neoplasms: PCNs)
Mucinous cystic lesions
Intraductal papillary mucinous neoplasm (IPMN)
Mucinous cystic neoplasm (MCN)
Non-mucinous cystic lesions
Serous cystic neoplasm (SCN)
Solid-pseudopapillary neoplasm (SPN)
Cystic neuroendocrine neoplasm
Acinar-cell cystic neoplasm
Other neoplastic lesions
Ductal adenocarcinoma with cystic degeneration
Table 1: Histological classification of pancreatic cystic lesions (PCLs)
Non-communicating pancreatic cyst
Non-neoplastic cysts
Pseudocyst
Simple or congenital cyst
Retention cyst
Neoplastic cysts (PCNs)
Mucinous cystic lesions
• Mucinous cystic neoplasm (MCN)
Non-mucinous cystic lesions
• Serous cystic neoplasm (SCN)
• Solid pseudopapillary neoplasm (SPN)
• Acinar-cell cystic neoplasm (acinar cystadenoma)
Other neoplastic lesions
• Ductal adenocarcinoma with cystic degeneration
• Cystic neuroendocrine neoplasm
Communicating pancreatic cyst
Non-neoplastic cysts
Pseudocyst
Neoplastic cysts (PCNs)
Mucinous cystic lesions
• Intraductal papillary mucinous neoplasm (IPMN)
Table 2: Radiological classification of pancreatic cystic lesions (PCLs)
or chronic inflammatory process of the pancreas. Most PPSCs originate from large or small leaks in the ductal system and persist because of constant filling by pancreatic secretions [109], although communication is not always visible at imaging.
With increasing experience, it is becoming clear that the prevalence of PPSCs in pancreatic cystic lesions is lower than usually presumed [110, 111]. A presumptive diagnosis of PPSC based on imaging appearance alone can cause a diagnostic error in up to 50% of cases [110, 112, 113] Pancreatic cystic neoplasms are particularly susceptible to this misdiagnosis [114], which can result in inappropriate treatment.
In a comparison of incidental pancreatic cystic lesions [110], the incidence of pseudocyst was significantly higher in the group of symptomatic patients with a previous history of pancreatitis (26/29: 89.6%) than it was in the asymptomatic group (3/29: 10.4%). Therefore, to make a confident diagnosis of pseudocyst, it is necessary to have a correlation with the patient’s clinical history. A previous clinical history of chronic or severe acute pancreatitis is a useful predictor for a pseudocyst. However, the same study showed that 25/42 (52%) of the patients with a history of pancreatitis had a cystic tumor of the pancreas, which means that previous pancreatitis cannot exclude the presence of a cystic tumor.
Endoscopic ultrasound-guided fine-needle aspiration (EUS-FNA) with cyst fluid analysis will differentiate between pseudocysts and neoplastic cysts in more than 90% of patients [115].
CT is the best imaging technique for detecting and diagnosing PPSC. Its sensitivity ranges from 90% to 100% [101]. However, a history of acute pancreatitis is essential for making a correct diagnosis of PPSC but is not always present [110]. PPSCs usually appear as a cystic lesion with a thick wall adjacent to the pancreas, which may show evidence of acute or chronic pancreatitis. The presence of debris or previous hemorrhage can cause an atypical appearance of the PPSC, which may be difficult to distinguish for mucinous cystic lesions.
With MRI, PPSCs appear as cystic lesions and are markedly hyperintense on T2w images and hypointense on T1w images. As a result of the underlying inflammatory process, heterogeneous intracystic content is commonly observed. Internal hemorrhage and hemoglobin sediments show high signal intensity on unenhanced T1-weighted MR images [116], thus simulating mucin content. One clue that favors the diagnosis of PPSC is the presence of layering, nonenhancing debris, especially on T2-weighted sequences [117]. The presence of internal debris is a highly specific imaging finding for the diagnosis of PPSC and is
MAGNETOM Flash (69) 3/2017www.siemens.com/magnetom-world
Clinical • Abdominal Imaging
24
related to necrotic portions of peripancreatic and pancreatic tissue that remain in the cyst cavity after cyst formation. Internal debris does not show enhancement after gadolinium injection and, when present, is a highly specific MR finding for the diagnosis of PPSC [117] (Fig. 26).
MRCP with secretin injection may be helpful before planning the therapeutic approach, as it can exclude communication between the PPSC and pancreatic duct, which is associated with an increased risk of treatment failure [118] (Fig. 27).
3.f.2 Serous cystadenoma (SCA)
Serous cystadenomas (SCA) represent around 1–2% of pancreatic neoplasms and 10–15% of cystic pancreatic lesions [119].
SCAs occur primarily in female patients in their fifties. They mainly affect the head of the pancreas, although they can be found in every part of the gland [120]. Histologically, SCAs are composed of multiple cysts formed by glycogen-rich, PAS-positive epithelial cells. They are benign lesions, and very few cases of serous cystadenocarcinoma have been published [121].
It is important to obtain a definite diagnosis of SCA noninvasively because if the lesion is asymptomatic, it can be left unresected and then followed up [120]. In a multinational review of 2,622 patients with SCA, the related mortality was almost nil, whereas operative mortality is not, which suggests conservative treatment for SCA [122]. A large lesion can cause obstructive chronic pancreatitis, and will thus need surgical resection [123]. In 15–30% of the cases, SCA is associated with Von Hippel-Lindau (VHL) disease [124].
Imaging findings of SCAs depend heavily on the macroscopic appearance. Typically, SCAs have three morphological patterns: Microcystic (or polycystic), honeycomb, and macrocystic (or oligocystic) [125].
A microcystic pattern is composed of multiple cysts mea-suring 2 cm or smaller and separated by fibrous septa that can coalesce into a central stellate scar that may calcify [126] (Fig. 28). In rare cases, some larger cysts (> 2 cm) can be observed in peripheral locations (mixed type).
The honeycomb pattern is characterized by numerous subcentimeter cysts that cannot be individually distin-guished and thus appear as well-marginated lesions with soft-tissue or mixed attenuation, especially in CT. With MRI, the cystic content of the lesion is easily distinguishable with T2w sequences (Fig. 29).
The macrocystic pattern is characterized by a small number of cysts of > 2 cm which lack a central scar and are often indistinguishable from other cystic masses of
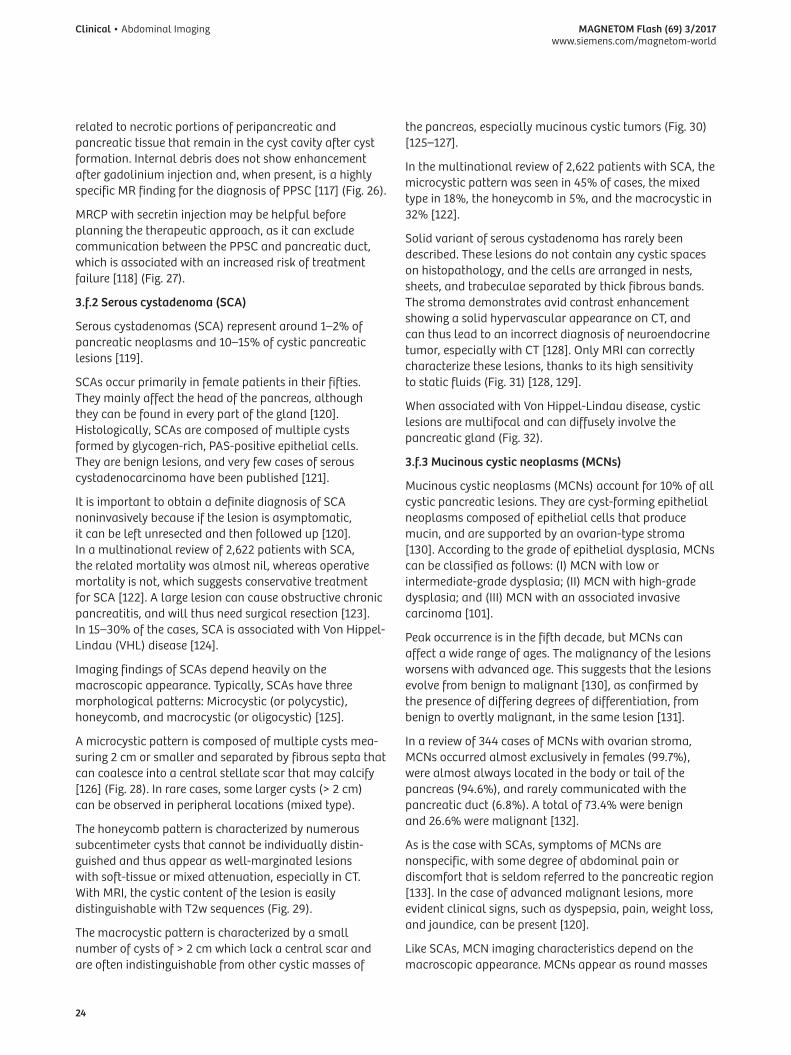
the pancreas, especially mucinous cystic tumors (Fig. 30) [125–127].
In the multinational review of 2,622 patients with SCA, the microcystic pattern was seen in 45% of cases, the mixed type in 18%, the honeycomb in 5%, and the macrocystic in 32% [122].
Solid variant of serous cystadenoma has rarely been described. These lesions do not contain any cystic spaces on histopathology, and the cells are arranged in nests, sheets, and trabeculae separated by thick fibrous bands. The stroma demonstrates avid contrast enhancement showing a solid hypervascular appearance on CT, and can thus lead to an incorrect diagnosis of neuroendocrine tumor, especially with CT [128]. Only MRI can correctly characterize these lesions, thanks to its high sensitivity to static fluids (Fig. 31) [128, 129].
When associated with Von Hippel-Lindau disease, cystic lesions are multifocal and can diffusely involve the pancreatic gland (Fig. 32).
3.f.3 Mucinous cystic neoplasms (MCNs)
Mucinous cystic neoplasms (MCNs) account for 10% of all cystic pancreatic lesions. They are cyst-forming epithelial neoplasms composed of epithelial cells that produce mucin, and are supported by an ovarian-type stroma [130]. According to the grade of epithelial dysplasia, MCNs can be classified as follows: (I) MCN with low or intermediate-grade dysplasia; (II) MCN with high-grade dysplasia; and (III) MCN with an associated invasive carcinoma [101].
Peak occurrence is in the fifth decade, but MCNs can affect a wide range of ages. The malignancy of the lesions worsens with advanced age. This suggests that the lesions evolve from benign to malignant [130], as confirmed by the presence of differing degrees of differentiation, from benign to overtly malignant, in the same lesion [131].
In a review of 344 cases of MCNs with ovarian stroma, MCNs occurred almost exclusively in females (99.7%), were almost always located in the body or tail of the pancreas (94.6%), and rarely communicated with the pancreatic duct (6.8%). A total of 73.4% were benign and 26.6% were malignant [132].
As is the case with SCAs, symptoms of MCNs are nonspecific, with some degree of abdominal pain or discomfort that is seldom referred to the pancreatic region [133]. In the case of advanced malignant lesions, more evident clinical signs, such as dyspepsia, pain, weight loss, and jaundice, can be present [120].
Like SCAs, MCN imaging characteristics depend on the macroscopic appearance. MCNs appear as round masses

MAGNETOM Flash (69) 3/2017www.siemens.com/magnetom-world
Abdominal Imaging • Clinical
25
27A 28A
27B 29B28B
27C
29C
28C
28D
Figure 27: Pancreatic pseudocyst. T2w HASTE (27A) shows a fluid collection in the neck of the pancreas in a patient who previously had severe pancreatitis. MRCP (27B) shows the duct of Wirsung dilated upstream of the fluid collection. Soon after secretin injection (27C), the fluid collection increases due to the passage of pancreatic juice in the pseudocyst.
Figure 28: Serous cystadenoma, microcystic pattern. On T2w HASTE (28A), several small (< 1 cm) cysts are visible in the uncinate process. On MRCP (28B), the duct of Wirsung appears slight dilated upstream, with initial signs of chronic obstructive pancreatitis. After Gd injection, VIBE (28C) shows a slight enhancement in the fibrous septa. Unenhanced CT (28D) shows calcification in the central scar.
Figure 29: Serous cystadenoma, honeycomb pattern. On T2w HASTE (29A), a large cyst with indistin-guishable small cysts and some larger cysts at the periphery is visible in the pancreatic head. On MRCP (29B), the duct of Wirsung upstream appears normal. After Gd injection, VIBE (29C) shows a slight enhancement in the fibrous septa.
29A
MAGNETOM Flash (69) 3/2017www.siemens.com/magnetom-world
Clinical • Abdominal Imaging
26
Figure 30: Serous cystadenoma, macrocystic pattern. On T2w HASTE (30A), a 2.5-cm cyst with lobulated margins is visible in the neck of the pancreas. It is clearer on MRCP (30B). The duct of Wirsung upstream appears normal. After Gd injection, VIBE (30C) shows no significant enhancement.
30A 30B 30C
31A
33A
33C
31B
33B
33D
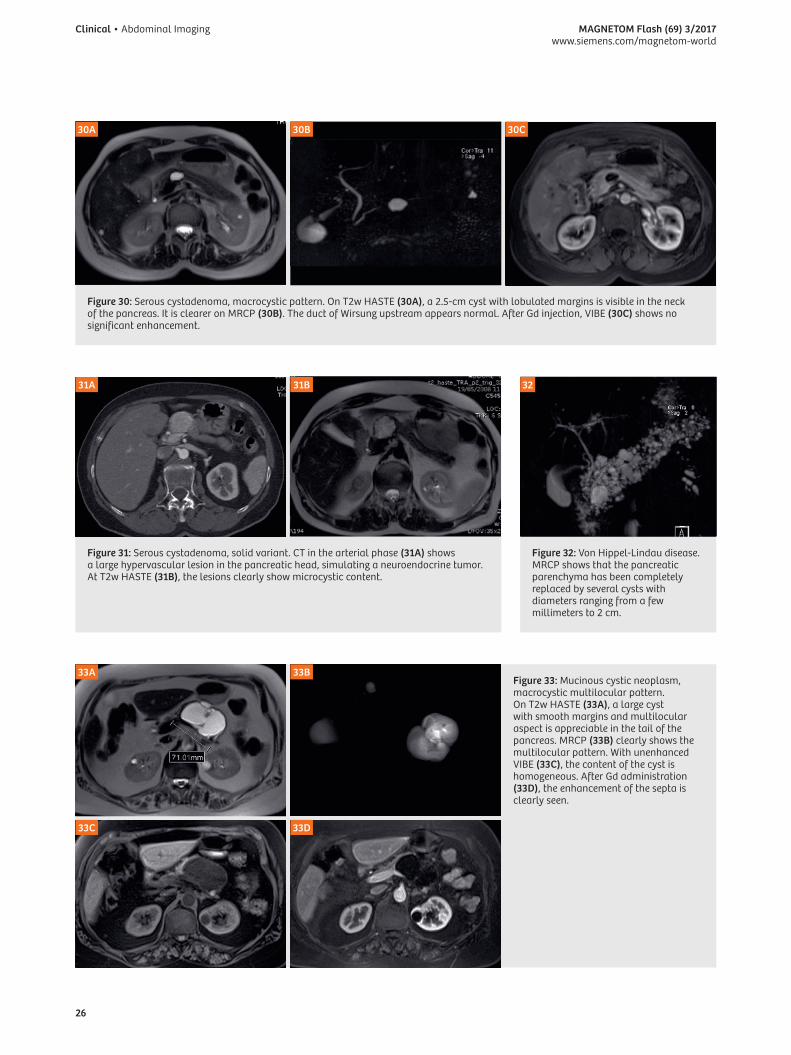
Figure 31: Serous cystadenoma, solid variant. CT in the arterial phase (31A) shows a large hypervascular lesion in the pancreatic head, simulating a neuroendocrine tumor. At T2w HASTE (31B), the lesions clearly show microcystic content.
Figure 33: Mucinous cystic neoplasm, macrocystic multilocular pattern. On T2w HASTE (33A), a large cyst with smooth margins and multilocular aspect is appreciable in the tail of the pancreas. MRCP (33B) clearly shows the multilocular pattern. With unenhanced VIBE (33C), the content of the cyst is homogeneous. After Gd administration (33D), the enhancement of the septa is clearly seen.
32
Figure 32: Von Hippel-Lindau disease. MRCP shows that the pancreatic parenchyma has been completely replaced by several cysts with diameters ranging from a few millimeters to 2 cm.

MAGNETOM Flash (69) 3/2017www.siemens.com/magnetom-world
Abdominal Imaging • Clinical
27
of adjacent vessels or organs; and metastases. The best cut-off value to differentiate MCAs from mucinous cystadenocarcinoma was the presence of three features, with an accuracy of 91% [138].
3.f.4 Intraductal papillary mucinous neoplasm
Intraductal papillary mucinous neoplasms (IPMNs) are a group of exocrine mucin-producing tumors, diagnosed at a mean age of 60 years, with a male prevalence [139].
Improvements in imaging techniques have increased the incidental detection of IPMNs. In several studies, the prevalence of incidental cystic pancreatic lesions can be observed in up to 19.6% of imaging studies, with MR being the most sensitive [111]. The involvement or the communication of the cystic pancreatic lesion with the main pancreatic duct is crucial for the appropriate diagnosis of IPMN [140].
Three types of IPMNs have been described [141]: The main duct type (MD-IPMN), the branch duct type (BD-IPMN), and the mixed type, which meet the criteria for both MD-IPMN and BD-IPMN.
IPMNs arise from the epithelium of the pancreatic ductal system and can display the full spectrum of histologic dysplasia, including hyperplasia, adenoma, borderline tumor, and in situ or invasive carcinoma [142]. There are significant differences in frequencies of malignancy in
with sharp margins and two main patterns: Unilocular or multilocular macrocysts [134]. A macrocystic multilocular pattern is the most typical and common of the two (Fig. 33) [135], while a unilocular appearance (Fig. 34) is similar to many other cystic lesions.
Multicystic MCNs appear as a cystic mass with sharp margins. The wall varies in thickness, with mural vegetation or parietal calcifications [136]. Thick septa and/or papillary proliferations are suggestive of the malignant degeneration of the MCN [136]. MRI with heavily T2-weighted sequences allows for better identification of the thin septa than CT does (Fig. 33). However, it is less sensitive when it comes to identifying the calcifications. MRCP can easily demonstrate a lack of communication between the MCN and the main pancreatic duct and thus exclude an intraductal origin of the neoplasia [137]. The signal intensity of MCN on T1w images can be high due to hemorrhage or mucin content [136].
In a retrospective study of 65 patients with mucinous cystic adenoma (n = 43) and mucinous cystic adenocarcinoma (n = 22), a statistically significant difference was observed in some features: Size > 7 cm; septa and wall thickness > 3 mm; number of loculations > 4; nodules; hyperintensity of the cystic content on T1-weighted images; compression and/or infiltration
34A 35A
34B
36B
35B
Figure 34: Mucinous cystic neoplasm, unilocular pattern. On T2w (34A), a large unilocular cyst can be appreciated in the tail of the pancreas. It does not show any significant enhancement after Gd injection (34B).
Figure 35: Diffuse MD-IPMN. T2w HASTE (35A) shows a diffuse dilatation of the main pancreatic duct with severe atrophy of the pancreatic parenchyma. MRCP (35B) shows the entire length of the dilated duct.
Figure 36: Segmental MD-IPMN. On T2w HASTE (36A), a segmental dilatation of the main pancreatic duct is visible; pancreatic parenchyma is normal. MRCP (36B) provides a clearer image of the segmental dilated duct.
36A

MAGNETOM Flash (69) 3/2017www.siemens.com/magnetom-world
Clinical • Abdominal Imaging
28
present as an aspecific segmental dilation of the main pancreatic duct without any clear cause of obstruction or previous pancreatitis which can lead to a post-inflammatory stenosis. The affected segment tends to enlarge with dilation of the collateral ducts. When the lesion is localized in the head of the pancreas, there is a dilation of the main pancreatic duct upstream, secondary to the obstruction of the outflow of pancreatic juice, which simulates a diffuse IPMN [147]. In MD-IPMNs, ductal dilation is common and may be along the entire length of the duct (Fig. 33) or segmental (Fig. 36), and be with or without intraductal hypointense masses [139]. In advanced MD-IPMNs, adjacent parenchymal atrophy is frequently seen (Fig. 35) [144]. Mucin usually has the same pattern of pancreatic juice with the different imaging techniques, so it is not possible to differentiate mucin from pancreatic juice.
BD-IPMNs can present as unilocular (Fig. 37) or multilocular (Fig. 38) communicating cystic lesions with grapelike clusters that have a variable diameter ranging from a few millimeters to a few centimeters, and are unifocal (Fig. 37) or multifocal (Fig. 39). The cysts are separated by thin septa, which usually enhance after contrast media administration. For a correct diagnosis of BD-IPMN, communication with the main pancreatic duct must be demonstrated (Fig. 37) [148].
IPMNs depending on the morphological type. They are higher for MD-IPMNs (mean 61.6%) and lower for BD-IPMNs (25.5%) [141].
Due to the widespread use of non-invasive imaging of the abdomen (US, CT, MRI), IPMNs are now mostly detected incidentally when imaging is performed for unrelated indications [143]. Therefore, many patients with IPMNs are asymptomatic and incidentally identified. In other cases, the impaired outflow of pancreatic juice induced by the hypersecretion of mucin [144] may cause pain and produces the laboratory test abnormalities of pancreatitis, such as hyperamylasemia [145]. Thus, IPMNs can be discovered after an episode of pancreatitis. More severe symptoms such as jaundice, severe abdominal pain, weight loss, anorexia, and diabetes are more likely associated with malignant behavior.
The location and type of an IPMN determine its imaging appearance. IPMNs appear with a cystic dilation of the involved segment – either the main duct or branch duct. The production of mucin is the main cause of the dilation of the ducts.
MD-IPMN of the main pancreatic duct can present as segmental or diffuse. When diffused to the entire duct, this tumor can be confused with chronic pancreatitis [146]. Segmental IPMNs are very difficult to diagnose, as they
38A
38C
38B
38D
Figure 38: BD-IPMN with nodule. MRCP (38A) shows a multilocular BD-IPMN in the uncinate process with a small defect (arrow). This corresponds to a solid nodule visible with T2w HASTE (38B), which enhances after Gd administration (38C) and shows high signal intensity at DWI at high b-values (38D), due to restricted diffusion.
37
Figure 37: BD-IPMN. MRCP clearly shows a finger-type unilocular branch duct ectasia.

MAGNETOM Flash (69) 3/2017www.siemens.com/magnetom-world
Abdominal Imaging • Clinical
29
39A
39C
39B
39D
Figure 39: BD-IPMN with pseudonodule. MRCP (39A) shows a multifocal BD-IPMN in the body-tail of the pancreas. The largest cyst has a small defect, which corresponds to a solid nodule visible on T2w HASTE (39B). It does not enhance after Gd administration (39C) and does not show high signal intensity at DWI at high b-values (39D), due to unrestricted diffusion.
In mixed IPMNs, there is evidence of dilatation of the main pancreatic duct and branch ducts along its course (Fig. 42) [146]. However, in cases of BD-IPMNs where dilation of the main pancreatic duct is due to the overproduction of mucin by the tumor and not to the involvement of the main pancreatic duct, the differential diagnosis of mixed IPMNs can be difficult (Fig. 4) [146].
Clearly differentiating between IPMN lesions with different pathological expressions can be challenging unless clear evidence of malignancy is present [149]. However, some imaging findings can be suggestive of aggressive behavior of the IPMN.
According to international consensus guidelines, ‘high-risk stigmata’ and ‘worrisome features’ are useful imaging findings for lesion classification [141].
High-risk stigmata indicate a high possibility that the lesion is malignant, which means surgical resection is necessary if the patient is fit. The criteria for high-risk stigmata are as follows: Main duct diameter > 10 mm for MD-IPMN (Fig. 35); the presence of solid enhancing nodules within the cyst in BD-IPMN; obstructive jaundice in the presence of a cystic lesion of the pancreatic head. Proliferating nodules are characterized by the capacity to enhance after contrast media administration (Fig. 38C). With DWI sequences, the restricted diffusion of water molecules means that enhancing nodules appear as a focus of high signal intensity within the cystic lesions at high b-values (Fig. 38D). Non-enhancing nodules can be caused by dense mucin plugs, and do not show signal intensity with DWI (Fig. 39).
Worrisome features suggest the possibility that the lesion could become malignant, which would require further workup by EUS for better risk-stratification of the lesion, and a strict follow-up. The criteria for worrisome features are as follows: cyst > 3 cm; thickened and enhanced cyst walls; main pancreatic duct measuring 5–9 mm (Fig. 36); non-enhancing mural nodules (Fig. 39); abrupt change in the main pancreatic duct caliber with distal pancreatic atrophy; lymphadenopathy.
The management of IPMNs is mainly based on the location (MD and mixed IPMN versus BD-IPMN), the size of the largest cyst in BD-IPMN, and the presence of high-risk stigmata or worrisome features. Moreover, risk stratification for age and fitness for surgery must be considered [141].
Patients with BD-IPMN, cysts of > 3 cm, and no worrisome features can also be considered for EUS to verify the absence of thickened walls or mural nodules, particularly if the patient is elderly. If a patient is young and fit for surgery, then surgery should be strongly considered.
Patients with BD-IPMN, cysts of < 3 cm, and no worrisome features should be considered for observation according to size stratification.
MD-IPMNs with main pancreatic duct dilation of 5–9 mm can also be considered as a worrisome feature. The recom-mendation here is evaluation, but no immediate resection.
MR with MRCP has a sensitivity, specificity, and accuracy of 70%, 92% and 80% respectively in the diagnosis of benign vs. malignant IPMNs based on certain worrisome
MAGNETOM Flash (69) 3/2017www.siemens.com/magnetom-world
Clinical • Abdominal Imaging
30
features (nodules, main pancreatic duct > 10 mm, thick septa, calcifications) [150].
In patients with IPMN, pancreatic ductal carcinoma may develop independently in the pancreatic duct [151].
There have been rare reports of atypical appearances of complicated IPMNs with intraductal hemorrhage, perforation, and fistula formation [152]. Intraductal hemorrhage shows up as high signal intensity on T1 with fat saturation.
In some patients with BD-IPMN, follow-up can show a reduction in lesion size. This is due to the opening of the communication channel between the lesion and the main pancreatic duct, which was previously blocked by thick mucin. In such cases, the passage of mucin from the lesion to the main pancreatic duct reduces the pressure inside the lesion, causing it to shrink.
MD-IPMNs must be differentiated by the main duct dilation seen in chronic pancreatitis [146]. IPMNs affect patients in their 60s and 70s, with an equal distribution between men and women, while chronic pancreatitis is more frequent during one’s 40s [153]. In a comparative study of IPMNs and chronic pancreatitis, specific findings for IPMNs were duct dilatation without stricture, bulging ampulla, nodule in a duct, grape-like secondary duct dilatation, and nodule in a cyst. Specific findings for chronic pancreatitis were duct dilatation with strictures, the presence of a stone, and side-branch ectasia with noncystic appearance.
3.f.5 Solid pseudopapillary tumors
Solid pseudopapillary tumors (SPTs) are the least frequent cystic tumors of the pancreas, and their origin is still uncertain. They have a low malignant potential and a favorable prognosis. They can occur in people of any age, but most often they affect women in their 30s [154]. In clinical terms, they are quite unspecific, with abdominal pain as the main symptom, sometimes together with a palpable mass. The low malignant potential of the lesion can account for its large size at the time of diagnosis [155]. The tumor appears as a round, well-encapsulated mass. The content of the lesion is solid with a variable amount of necrosis or hemorrhage, which is responsible for its frequently cystic appearance. In a group of 56 patients with SPT, calcifications were found in 29% of the cases [156]. After contrast agent administration, the solid component of the tumor appears well vascularized with all imaging techniques. When fresh hemorrhage is present, it is clearly visible on MR images, with high signal intensity on T1-weighted sequences and fluid-debris level [156]. When large cystic changes are present, SPTs appear as macrocystic unilocular or multilocular lesions, similar to mucinous cystic neoplasms; in this situation, the young age of the patient helps in the differential diagnosis.
6. ConclusionImaging of the pancreas represents a diagnostic challenge for both radiologists and clinicians because of overlapping clinical, radiological, and pathological features.
The wide pathological range of both solid and cystic lesions requires an in-depth knowledge of the pathology, and the application of the best imaging techniques in order to arrive at the correct diagnosis. The multiparametricity of MRI makes it possible to obtain morphological and functional images, which are useful in addressing most pathological conditions of the pancreas.
Contact
Giovanni Morana, M.D.Radiology DepartmentGeneral Hospital Ca’ Foncello
31100 TrevisoItalyPhone: +39-0422-322253Fax: [email protected]

MAGNETOM Flash (69) 3/2017www.siemens.com/magnetom-world
Abdominal Imaging • Clinical
31
References
1 Pamuklar E, Semelka RC. MR imaging of the pancreas. Magn Reson Imaging Clin N Am. 2005 May;13(2):313-30. doi:10.1016/j.mric.2005.03.012.
2 Hakimé A, Giraud M, Vullierme MP, Vilgrain V. [MR imaging of the pancreas]. J Radiol. 2007 Jan;88(1 Pt 1):11-25. doi:10.1016/S0221-0363(07)89785-X.
3 Kanematsu M, Shiratori Y, Hoshi H, Kondo H, Matsuo M, Moriwaki H. Pancreas and peripancreatic vessels: effect of imaging delay on gadolinium enhancement at dynamic gradient-recalled-echo MR imaging. Radiology. 2000 Apr;215(1):95-102. doi:10.1148/radiology.215.1.r00ap1395.
4 Kalb B, Martin DR, Sarmiento JM, Erickson SH, Gober D, Tapper EB, et al. Paraduodenal pancreatitis: clinical performance of MR imaging in distinguishing from carcinoma. Radiology. 2013 Nov;269(2):475-81. doi:10.1148/radiol.13112056. Epub 2013 Jul 11.
5 Michaely HJ, Morelli JN, Budjan J, Riffel P, Nickel D, Kroeker R, et al. CAIPIRINHA-Dixon-TWIST (CDT)-volume-interpolated breath-hold examination (VIBE): a new technique for fast time-resolved dynamic 3-dimensional imaging of the abdomen with high spatial resolution. Invest Radiol. 2013 Aug;48(8):590-7. doi:10.1097/RLI.0b013e318289a70b.
6 Qu J, Han S, Zhang H, Liu H, Wang Z, Kamel IR, et al. Improved Detection of Recurrent Hepatocellular Carcinomas in Arterial Phase With CAIPIRINHA-Dixon-TWIST-Volumetric Interpolated Breath-Hold Examination. Invest Radiol. 2016 Oct;51(10):602-8. doi:10.1097/RLI.0000000000000281.
7 Colagrande S, Belli G, Politi LS, Mannelli L, Pasquinelli F, Villari N. The influence of diffusion- and relaxation-related factors on signal intensity: an introductive guide to magnetic resonance diffusion-weighted imaging studies. J Comput Assist Tomogr. 2008 May-Jun;32(3):463-74. doi:10.1097/RCT.0b013e31811ec6d4.
8 Kartalis N, Lindholm TL, Aspelin P, Permert J, Albiin N. Diffusion-weighted magnetic resonance imaging of pancreas tumours. Eur Radiol. 2009 Aug;19(8):1981-90. doi:10.1007/s00330-009-1384-8. Epub 2009 Mar 24.
9 Kallehauge JF, Tanderup K, Haack S, Nielsen T, Muren LP, Fokdal L, et al. Apparent Diffusion Coefficient (ADC) as a quantitative parameter in diffusion weighted MR imaging in gynecologic cancer: Dependence on b-values used. Acta Oncol. 2010 Oct;49(7):1017-22. doi:10.3109/0284186X.2010.500305.
10 Matsuki M, Inada Y, Nakai G, Tatsugami F, Tanikake M, Narabayashi I, et al. Diffusion-weighed MR imaging of pancreatic carcinoma. Abdom Imaging. 2007 Jul-Aug;32(4):481-3. doi:10.1007/s00261-007-9192-6.
11 Fukukura Y, Shindo T, Hakamada H, Takumi K, Umanodan T, Nakajo M, et al. Diffusion-weighted MR imaging of the pancreas: optimizing b-value for visualization of pancreatic adenocarcinoma. Eur Radiol. 2016 Oct;26(10):3419-27. doi:10.1007/s00330-015-4174-5. Epub 2016 Jan 6.
12 Koh D.M., Collins D.J. Diffusion-weighted MRI in the body: applications and challenges in oncology. AJR Am. J. Roentgenol. 2007 Jun;188(6):1622–35. doi:10.2214/AJR.06.1403.
13 Kang KM, Lee JM, Yoon JH, Kiefer B, Han JK, Choi BI. Intravoxel incoherent motion diffusion-weighted MR imaging for characterization of focal pancreatic lesions. Radiology. 2014 Feb;270(2):444-53. doi:10.1148/radiol.13122712. Epub 2013 Oct 28.
14 Kim B, Lee SS, Sung YS, Cheong H, Byun JH, Kim HJ, et al. Intravoxel incoherent motion diffusion-weighted imaging of the pancreas: Characterization of benign and malignant pancreatic pathologies. J Magn Reson Imaging. 2017 Jan;45(1):260-269. doi:10.1002/jmri.25334. Epub 2016 Jun 7.
15 Jensen JH, Helpern JA, Ramani A, Lu H, Kaczynski K. Diffusional kurtosis imaging: the quantification of non-gaussian water diffusion by means of magnetic resonance imaging. Magn Reson Med. 2005 Jun;53(6):1432-40. doi:10.1002/mrm.20508.
16 Kartalis N, Manikis GC, Loizou L, Albiin N, Zöllner FG, Del Chiaro M, et al. Diffusion-weighted MR imaging of pancreatic cancer: A comparison of mono-exponential, bi-exponential and non-Gaussian kurtosis models. Eur J Radiol Open. 2016 Apr 27;3:79-85. eCollection 2016. doi:10.1016/j.ejro.2016.04.002.
17 Noda Y, Kanematsu M, Goshima S, Horikawa Y, Takeda J, Kondo H, et al. Diffusion kurtosis imaging of the pancreas for the assessment of HbA1c levels. J Magn Reson Imaging. 2016 Jan;43(1):159-65. doi:10.1002/jmri.24982. Epub 2015 Jun 12.
18 Kim KA, Park MS, Kim IS, Kiefer B, Chung WS, Kim MJ, et al. Quantitative evaluation of liver cirrhosis using T1 relaxation time with 3 tesla MRI before and after oxygen inhalation. J Magn Reson Imaging 2012 Aug;36(2):405–10. doi:10.1002/jmri.23620. Epub 2012 Mar 5.
19 Tirkes T, Lin C, Fogel EL, Sherman SS, Wang Q, Sandrasegaran K. T1 mapping for diagnosis of mild chronic pancreatitis. J Magn Reson Imaging. 2017 Apr;45(4):1171-1176. doi:10.1002/jmri.25428. Epub 2016 Aug 13.
20 Zhang J, Israel GM, Hecht EM, Krinsky GA, Babb JS, Lee VS. Isotropic 3D T2-weighted MR cholangiopancreatography with parallel imaging: feasibility study. AJR Am J Roentgenol. 2006 Dec;187(6):1564-70. doi:10.2214/AJR.05.1032.
21 Takahashi S, Kim T, Murakami T, Okada A, Hori M, Narumi Y, et al. Influence of paramagnetic contrast on single-shot MRCP image quality. Abdom Imaging. 2000 Sep-Oct;25(5):511-3.
22 Matos C, Cappeliez O, Winant C, Coppens E, Devière J, Metens T. MR imaging of the pancreas: a pictorial tour. Radiographics. 2002 Jan-Feb;22(1):e2. doi:10.1148/radiographics.22.1.g02jae2e2.
23 Manfredi R, Costamagna G, Brizi MG, Maresca G, Vecchioli A, Colagrande C, et al. Severe chronic pancreatitis versus suspected pancreatic disease: dynamic MR cholangiopancreatography after secretin stimulation. Radiology. 2000 Mar;214(3): 849-55. doi:10.1148/radiology.214.3.r00mr24849.
24 Akisik MF, Sandrasegaran K, Aisen AA, Maglinte DD, Sherman S, Lehman GA. Dynamic secretin-enhanced MR cholangio-pancreatography. Radiographics. 2006 May-Jun;26(3):665-77. doi:10.1148/rg.263055077.
25 Manfredi R, Pozzi Mucelli R. Secretin-enhanced MR Imaging of the Pancreas. Radiology. 2016 Apr;279(1):29-43. doi:10.1148/radiol.2015140622.
26 Madzak A, Olesen SS, Wathle GK, Haldorsen IS, Drewes AM, Frøkjær JB. Secretin-Stimulated Magnetic Resonance Imaging Assessment of the Benign Pancreatic Disorders: Systematic Review and Proposal for a Standardized Protocol. Pancreas. 2016 Sep;45(8):1092-103. doi:10.1097/MPA.0000000000000606.
27 Hellerhoff KJ, Helmberger H 3rd, Rösch T, Settles MR, Link TM, Rummeny EJ. Dynamic MR pancreatography after secretin administration: image quality and diagnostic accuracy. AJR Am J Roentgenol. 2002 Jul;179(1):121-9. doi:10.2214/ajr.179.1.1790121.
28 Sherman S, Freeman ML, Tarnasky PR, Wilcox CM, Kulkarni A, Aisen AM, et al. Administration of secretin (RG1068) increases the sensitivity of detection of duct abnormalities by magnetic resonance cholangiopancreatography in patients with pancreatitis. Gastroenterology. 2014 Sep;147(3):646-654.e2. doi:10.1053/j.gastro.2014.05.035. Epub 2014 Jun 4.
29 Manikkavasakar S, AlObaidy M, Busireddy KK, Ramalho M, Nilmini V, Alagiyawanna M, et al. Magnetic resonance imaging of pancreatitis: an update. World J Gastroenterol. 2014 Oct 28;20(40):14760-77. doi:10.3748/wjg.v20.i40.14760.
30 Thoeni RF. Imaging of Acute Pancreatitis. Radiol Clin North Am. 2015 Nov;53(6):1189-208. doi:10.1016/j.rcl.2015.06.006. Epub 2015 Aug 5.
31 Shyu JY, Sainani NI, Sahni VA, Chick JF, Chauhan NR, Conwell DL, et al. Necrotizing pancreatitis: diagnosis, imaging, and intervention. Radiographics. 2014 Sep-Oct;34(5):1218-39. doi:10.1148/rg.345130012.
32 Md PS, Md UN. Role of ERCP in Patients With Idiopathic Recurrent Acute Pancreatitis. Curr Treat Options Gastroenterol. 2016 Sep;14(3):327-39. doi:10.1007/s11938-016-0096-9.
33 Sandrasegaran K, Tahir B, Barad U, Fogel E, Akisik F, Tirkes T, et al. The Value of Secretin-Enhanced MRCP in Patients With Recurrent Acute Pancreatitis. AJR Am J Roentgenol. 2017 Feb;208(2):315-321. doi:10.2214/AJR.16.16566. Epub 2016 Nov 8.
34 Testoni PA. Acute recurrent pancreatitis: Etiopathogenesis, diagnosis and treatment. World J Gastroenterol. 2014 Dec

MAGNETOM Flash (69) 3/2017www.siemens.com/magnetom-world
Clinical • Abdominal Imaging
32
7;20(45):16891-901. doi:10.3748/wjg.v20.i45.16891. 35 Brock C, Nielsen LM, Lelic D, Drewes AM. Pathophysiology of
chronic pancreatitis. World J Gastroenterol. 2013 Nov 14;19(42):7231-40. doi:10.3748/wjg.v19.i42.7231.
36 Klöppel G. Chronic pancreatitis, pseudotumors and other tumor-like lesions. Mod Pathol. 2007 Feb;20 Suppl 1:S113-31. doi:10.1038/modpathol.3800690.
37 Issa Y, Kempeneers MA, van Santvoort HC, Bollen TL, Bipat S, Boermeester MA. Diagnostic performance of imaging modalities in chronic pancreatitis: a systematic review and meta-analysis. Eur Radiol. 2017 Sep;27(9):3820-3844. doi:10.1007/s00330-016-4720-9. Epub 2017 Jan 27.
38 Anaizi A, Hart PA, Conwell DL. Diagnosing Chronic Pancreatitis. Dig Dis Sci. 2017 Jul;62(7):1713-1720. doi:10.1007/s10620-017-4493-2. Epub 2017 Mar 17.
39 Cappeliez O, Delhaye M, Devière J, Le Moine O, Metens T, Nicaise N, et al. Chronic pancreatitis: evaluation of pancreatic exocrine function with MR pancreatography after secretin stimulation. Radiology. 2000 May;215(2):358-64. doi:10.1148/radiology.215.2.r00ma10358.
40 Gillams AR, Lees WR. Quantitative secretin MRCP (MRCPQ): results in 215 patients with known or suspected pancreatic pathology. Eur Radiol. 2007 Nov;17(11):2984-90. doi:10.1007/s00330-007-0708-9. Epub 2007 Jul 10.
41 Trikudanathan G, Walker SP, Munigala S, Spilseth B, Malli A, Han Y, et al. Diagnostic Performance of Contrast-Enhanced MRI With Secretin-Stimulated MRCP for Non-Calcific Chronic Pancreatitis: A Comparison With Histopathology. Am J Gastroenterol. 2015 Nov;110(11):1598-606. doi:10.1038/ajg.2015.297. Epub 2015 Sep 15.
42 Kirkegård J, Mortensen FV, Cronin-Fenton D. Chronic Pancreatitis and Pancreatic Cancer Risk: A Systematic Review and Meta-analysis. Am J Gastroenterol. 2017 Aug 1. doi:10.1038/ajg.2017.218. Epub ahead of print.
43 Raphael KL, Willingham FF. Hereditary pancreatitis: current perspectives. Clin Exp Gastroenterol. 2016 Jul 26;9:197-207. doi:10.2147/CEG.S84358. eCollection 2016.
44 Schima W, Ba-Ssalamah A, Kölblinger C, Kulinna-Cosentini C, Puespoek A, Götzinger P. Pancreatic adenocarcinoma. Eur Radiol. 2007 Mar;17(3):638-49. doi:10.1007/s00330-006-0435-7. Epub 2006 Oct 5.
45 Miller FH, Rini NJ, Keppke AL. MRI of adenocarcinoma of the pancreas. AJR Am J Roentgenol. 2006 Oct;187(4):W365-74. doi:10.2214/AJR.05.0875.
46 Ichikawa T, Sou H, Araki T, Arbab AS, Yoshikawa T, Ishigame K, et al. Duct-penetrating sign at MRCP: usefulness for differentiating inflammatory pancreatic mass from pancreatic carcinomas. Radiology. 2001 Oct;221(1):107-16. doi:10.1148/radiol.2211001157.
47 Boninsegna E, Manfredi R, Negrelli R, Avesani G, Mehrabi S, Pozzi Mucelli R. Pancreatic duct stenosis: Differential diagnosis between malignant and benign conditions at secretin-enhanced MRCP. Clin Imaging. 2017 Jan-Feb;41:137-143. doi:10.1016/j.clinimag.2016.10.020. Epub 2016 Oct 29.
48 Sandrasegaran K, Nutakki K, Tahir B, Dhanabal A, Tann M, Cote GA. Use of diffusion-weighted MRI to differentiate chronic pancreatitis from pancreatic cancer. AJR Am J Roentgenol. 2013 Nov;201(5):1002-8. doi:10.2214/AJR.12.10170.
49 Wiggermann P, Grützmann R, Weissenböck A, Kamusella P, Dittert DD, Stroszczynski C. Apparent diffusion coefficient measurements of the pancreas, pancreas carcinoma, and mass-forming focal pancreatitis. Acta Radiol. 2012 Mar 1;53(2):135-9. doi:10.1258/ar.2011.100252. Epub 2012 Jan 19.
50 Adsay NV, Zamboni G. Paraduodenal pancreatitis: a clinico-pathologically distinct entity unifying “cystic dystrophy of heterotopic pancreas”, “para-duodenal wall cyst”, and “groove pancreatitis”. Semin Diagn Pathol. 2004 Nov;21(4):247-254.
51 de Pretis N, Capuano F, Amodio A, Pellicciari M, Casetti L, Manfredi R et al. Clinical and Morphological Features of Paraduodenal Pancreatitis: An Italian Experience With 120 Patients. Pancreas. 2017 Apr;46(4):489-495. doi:10.1097/
MPA.0000000000000781. 52 Blasbalg R, Baroni RH, Costa DN, Machado MC.
MRI features of groove pancreatitis. AJR Am J Roentgenol. 2007 Jul;189(1):73-80. doi:10.2214/AJR.06.1244.
53 Castell-Monsalve FJ, Sousa-Martin JM, Carranza-Carranza A. Groove pancreatitis: MRI and pathologic findings. Abdom Imaging. 2008 May-Jun;33(3):342-8. doi:10.1007/s00261-007-9245-x.
54 Pearson RK, Longnecker DS, Chari ST, Smyrk TC, Okazaki K, Frulloni L, et al. Controversies in clinical pancreatology: autoimmune pancreatitis: does it exist? Pancreas. 2003 Jul;27(1):1-13.
55 Okazaki K, Chiba T. (2002) Autoimmune related pancreatitis. Gut. 2002 Jul;51(1):1-4.
56 Zhang L, Chari S, Smyrk TC, Deshpande V, Klöppel G, Kojima M, et al. Autoimmune pancreatitis (AIP) type 1 and type 2: an international consensus study on histopathologic diagnostic criteria. Pancreas. 2011 Nov;40(8):1172-9. doi: 10.1097/MPA.0b013e318233bec5.
57 Majumder S, Takahashi N, Chari ST. Autoimmune Pancreatitis. Dig Dis Sci. 2017 Jul;62(7):1762-1769. doi:10.1007/s10620-017-4541-y. Epub 2017 Apr 1.
58 Sahani DV, Kalva SP, Farrell J, Maher MM, Saini S, Mueller PR, et al. Autoimmune pancreatitis: imaging features. Radiology. 2004 Nov;233(2):345-52. doi:10.1148/radiol.2332031436.
59 Manfredi R, Frulloni L, Mantovani W, Bonatti M, Graziani R, Pozzi Mucelli R. Autoimmune pancreatitis: pancreatic and extrapancreatic MR imaging-MR cholangiopancreatography findings at diagnosis, after steroid therapy, and at recurrence. Radiology. 2011 Aug;260(2):428-36. doi:10.1148/radiol.11101729. Epub 2011 May 25.
60 Oki H, Hayashida Y, Oki H, Kakeda S, Aoki T, Taguchi M, et al. DWI findings of autoimmune pancreatitis: comparison between symptomatic and asymptomatic patients. J Magn Reson Imaging. 2015 Jan;41(1):125-31. doi:10.1002/jmri.24508. Epub 2013 Nov 22.
61 Taniguchi T, Kobayashi H, Nishikawa K, Iida E, Michigami Y, Morimoto E, et al. Diffusion-weighted magnetic resonance imaging in autoimmune pancreatitis. Jpn J Radiol. 2009 Apr;27(3):138-42. doi:10.1007/s11604-008-0311-2. Epub 2009 May 3.
62 Kamisawa T, Takuma K, Anjiki H, Egawa N, Hata T, Kurata M, et al. Differentiation of autoimmune pancreatitis from pancreatic cancer by diffusion-weighted MRI. Am J Gastroenterol. 2010 Aug;105(8):1870-5. doi:10.1038/ajg.2010.87. Epub 2010 Mar 9.
63 Choi SY, Kim SH, Kang TW, Song KD, Park HJ, Choi YH. Differentiating Mass-Forming Autoimmune Pancreatitis From Pancreatic Ductal Adenocarcinoma on the Basis of Contrast-Enhanced MRI and DWI Findings. AJR Am J Roentgenol. 2016 Feb;206(2):291-300. doi:10.2214/AJR.15.14974.
64 Hur BY, Lee JM, Lee JE, Park JY, Kim SJ, Joo I et al. Magnetic resonance imaging findings of the mass-forming type of autoimmune pancreatitis: comparison with pancreatic adenocarcinoma. J Magn Reson Imaging. 2012 Jul;36(1):188-97. doi:10.1002/jmri.23609. Epub 2012 Feb 27.
65 Klauß M, Maier-Hein K, Tjaden C, Hackert T, Grenacher L, Stieltjes B. IVIM DW-MRI of autoimmune pancreatitis: therapy monitoring and differentiation from pancreatic cancer. Eur Radiol. 2016 Jul;26(7):2099-106. doi:10.1007/s00330-015-4041-4. Epub 2015 Oct 8.
66 Jemal A, Siegel R, Ward E, Murray T, Xu J, Smigal C et al. Cancer statistics 2006. CA Cancer J Clin. 2006 Mar-Apr;56(2):106–130.
67 Zamboni G, Capelli P, Pesci A, Beghelli S, Lüttges J, Klöppel G. Pancreatic head mass: what can be done? Classification: the pathological point of view. JOP. 2000 Sep;1(3 Suppl):77-84.
68 Balci NC, Semelka RC. Radiologic diagnosis and staging of pancreatic ductal adenocarcinoma. Eur J Radiol. 2001 May;38(2):105-12.
69 Zhong L. Magnetic resonance imaging in the detection of pancreatic neoplasms. J Dig Dis. 2007 Aug;8(3):128-32. doi:10.1111/j.1443-9573.2007.00297.x.
70 Zins M, Petit E, Boulay-Coletta I, Balaton A, Marty O, Berrod JL.
MAGNETOM Flash (69) 3/2017www.siemens.com/magnetom-world
Abdominal Imaging • Clinical
33
[Imaging of pancreatic adenocarcinoma] [Article in French]. J Radiol. 2005 Jun;86(6 Pt 2):759-79; quiz 779-80.
71 Fattahi R, Balci NC, Perman WH, Hsueh EC, Alkaade S, Havlioglu N, et al. Pancreatic diffusion-weighted imaging (DWI): comparison between mass-forming focal pancreatitis (FP), pancreatic cancer (PC), and normal pancreas. J Magn Reson Imaging. 2009 Feb;29(2):350-6. doi:10.1002/jmri.21651.
72 Akisik MF, Aisen AM, Sandrasegaran K, Jennings SG, Lin C, Sherman S, et al. Assessment of chronic pancreatitis: utility of diffusion-weighted MR imaging with secretin enhancement. Radiology. 2009 Jan;250(1):103-9. doi: 10.1148/radiol.2493080160. Epub 2008 Nov 10.
73 Sahani DV, Shah ZK, Catalano OA, Boland GW, Brugge WR. Radiology of pancreatic adenocarcinoma: current status of imaging. J Gastroenterol Hepatol. 2008 Jan;23(1):23-33. doi: 10.1111/j.1440-1746.2007.05117.x.
74 Oterdoom LH, van Weyenberg SJ, de Boer NK. Double-duct sign: do not forget the gallstones. J Gastrointestin Liver Dis. 2013 Dec;22(4):447-50.
75 Del Chiaro M, Zerbi A, Falconi M, Bertacca L, Polese M, Sartori N, et al. Cancer risk among the relatives of patients with pancreatic ductal adenocarcinoma. Pancreatology. 2007;7(5-6):459-69. doi:10.1159/000108963. Epub 2007 Oct 1.
76 Del Chiaro M, Verbeke CS, Kartalis N, Pozzi Mucelli R, Gustafsson P, Hansson J, et al. Short-term Results of a Magnetic Resonance Imaging-Based Swedish Screening Program for Individuals at Risk for Pancreatic Cancer. JAMA Surg. 2015 Jun;150(6):512-8. doi:10.1001/jamasurg.2014.3852.
77 Niederle MB, Hackl M, Kaserer K, Niederle B. Gastroenteropancreatic neuroendocrine tumours: the current incidence and staging based on the WHO and European Neuroendocrine Tumour Society classification: an analysis based on prospectively collected parameters. Endocr Relat Cancer. 2010 Oct 5;17(4):909–918. doi:10.1677/ERC-10-0152. Print 2010 Dec.
78 Klimstra DS, Arnold R, Capella C, et al. Neuroendocrine neoplasms of the pancreas. In: Bosman F, Carneiro F, Hruban RH, Theise N, editors. WHO Classification of Tumours of the Digestive System. Lyon: IARC Press; 2010. p. 322-6.
79 Oberg K. Pancreatic endocrine tumors. Semin Oncol. 2010 Dec;37(6):594-618. doi:10.1053/j.seminoncol.2010.10.014.
80 Horton KM, Hruban RH, Yeo C, Fishman EK. Multi-detector row CT of pancreatic islet cell tumors. Radiographics 2006 Mar-April;26(2):453-464. doi:10.1148/rg.262055056
81 Manfredi R, Bonatti M, Mantovani W, Graziani R, Segala D, Capelli P, et al. Non-hyperfunctioning neuroendocrine tumours of the pancreas: MR imaging appearance and correlation with their biological behavior. Eur Radiol. 2013 Nov;23(11):3029-39. doi:10.1007/s00330-013-2929-4. Epub 2013 Jun 21.
82 Pape UF, Jann H, Müller-Nordhorn J, Bockelbrink A, Berndt U, Willich SN, et al. Prognostic relevance of a novel TNM classification system for upper gastroenteropancreatic neuroendocrine tumors. Cancer 2008 Jul 15;113(2):256-65. doi:10.1002/cncr.23549.
83 Jann H, Roll S, Couvelard A, Hentic O, Pavel M, Müller-Nordhorn J, et al. Neuroendocrine tumors of midgut and hindgut origin: tumor-node-metastasis classification determines clinical outcome. Cancer. 2011 Aug 1;117(15):3332–41. doi:10.1002/cncr.25855. Epub 2011 Jan 18.
84 Rha SE, Jung SE, Lee KH, Ku YM, Byun JY, Lee JM. CT and MR imaging findings of endocrine tumor of the pancreas according to WHO classification. Eur J Radiol. 2007 Jun;62(3):371-7. doi:10.1016/j.ejrad.2007.02.036. Epub 2007 Apr 11.
85 Falconi M, Bartsch DK, Eriksson B, Klöppel G, Lopes JM, O’Connor JM, et al. ENETS Consensus Guidelines for the management of patients with digestive neuroendocrine neoplasms of the digestive system: well-differentiated pancreatic non-functioning tumors. Neuroendocrinology. 2012;95(2):120-34. doi:10.1159/000335587. Epub 2012 Feb 15.
86 Hruban RH, Pitman MB, Klimstra DS. Endocrine Neoplasms. In: Hruban RH, Pitman MB, Klimstra DS, editors. Tumors of the Pancreas: Afip Atlas of Tumor Pathology, Fourth Series.
Washington DC: American Registry of Pathology; 2007. p. 251-304.
87 Tamm EP, Bhosale P, Lee JH, Rohren E. State-of-the-art Imaging of Pancreatic Neuroendocrine Tumors. Surg Oncol Clin N Am. 2016 Apr;25(2):375-400. doi:10.1016/j.soc.2015.11.007.
88 De Robertis R , Tinazzi Martini P, Cingarlini S, Ortolani S, Butturini G, Regi P, et al. Digital Subtraction of Magnetic Resonance Images Improves Detection and Characterization of Pancreatic Neuroendocrine Neoplasms. J Comput Assist Tomogr. 2017 Jul/Aug;41(4):614-618. doi: 10.1097/RCT.0000000000000552.
89 Humphrey PE, Alessandrino F, Bellizzi AM, Mortele KJ. Non-hyperfunctioning pancreatic endocrine tumors: multimodality imaging features with histopathological correlation. Abdom Imaging. 2015 Oct;40(7):2398-410. doi:10.1007/s00261-015-0458-0.
90 Manfredi R, Bonatti M, Mantovani W, Graziani R, Segala, D, Capelli P, et al. Non-hyperfunctioning neuroendocrine tumours of the pancreas: MR imaging appearance and correlation with their biological behaviour. Eur Radiol. 2013 Nov;23(11):3029-39. doi:10.1007/s00330-013-2929-4.
91 Lotfalizadeh E, Ronot M, Wagner M, Cros J, Couvelard A, Vullierme MP, et al. Prediction of pancreatic neuroendocrine tumour grade with MR imaging features: added value of diffusion-weighted imaging. Eur Radiol. 2017 Apr;27(4):1748-1759. doi: 10.1007/s00330-016-4539-4. Epub 2016 Aug 19.
92 Lewis RB, Lattin GE Jr, Paal E. Pancreatic endocrine tumors: radiologic-clinicopathologic correlation. Radiographics. 2010 Oct;30(6):1445-64. doi:10.1148/rg.306105523.
93 Bordeianou L, Vagefi PA, Sahani D, Deshpande V, Rakhlin E, Warshaw AL, et al. Cystic pancreatic endocrine neoplasms: a distinct tumor type? J Am Coll Surg. 2008 Jun;206(6):1154-8. doi:10.1016/j.jamcollsurg.2007.12.040. Epub 2008 Apr 14.
94 Gallotti A, Johnston RP, Bonaffini PA, Ingkakul T, Deshpande V, Fernández-del Castillo C, et al. Incidental neuroendocrine tumors of the pancreas: MDCT findings and features of malignancy. AJR Am J Roentgenol. 2013 Feb;200(2):355-62. doi:10.2214/AJR.11.8037.
95 Barral M, Taouli B, Guiu B, Koh DM, Luciani A, Manfredi R, et al. Diffusion-weighted MR imaging of the pancreas: current status and recommendations. Radiology. 2015 Jan;274(1):45-63. doi:10.1148/radiol.14130778.
96 Pereira JA, Rosado E, Bali M, Metens T, Chao SL. Pancreatic neuroendocrine tumors: correlation between histogram analysis of apparent diffusion coefficient maps and tumor grade. Abdom Imaging. 2015 Oct;40(8):3122-8. doi:10.1007/s00261-015-0524-7.
97 Woo S, Cho JY, Kim SY, Kim SH. Histogram analysis of apparent diffusion coefficient map of diffusion-weighted MRI in endometrial cancer: a preliminary correlation study with histological grade. Acta Radiol. 2014 Dec;55(10):1270-7.doi: 10.1177/0284185113514967. Epub 2013 Dec 6.
98 Brenner R, Metens T, Bali M, Demetter P, Matos C. Pancreatic neuroendocrine tumor: added value of fusion of T2-weighted imaging and high b-value diffusion-weighted imaging for tumor detection. Eur J Radiol. 2012 May;81(5):e746-9. doi: 10.1016/j.ejrad.2012.01.032. Epub 2012 Mar 3.
99 Nelsen EM, Buehler D, Soni AV, Gopal DV. Endoscopic ultrasound in the evaluation of pancreatic neoplasms-solid and cystic: A review. World J Gastrointest Endosc. 2015 Apr 16;7(4):318-27. doi:10.4253/wjge.v7.i4.318.
100 Salvia R, Festa L, Butturini G, Tonsi A, Sartori N, Biasutti T, et al. Pancreatic cystic tumors. Minerva Chir. 2004 Apr;59(2):185-207.
101 Brugge WR. Diagnosis and management of cystic lesions of the pancreas. J Gastrointest Oncol. 2015 Aug;6(4):375-88. doi: 10.3978/j.issn.2078-6891.2015.057.
102 Adsay NV, Klimstra DS. Cystic forms of typically solid pancreatic tumors. Semin Diagn Pathol. 2000; 17(1):81-8.
103 Klöppel G, Longnecker D, Capella C, Sobin L. Histological typing of tumours of the exocrine pancreas. Berlin: Springer-Verlag; 1996.
104 Kim JH, Eun HW, Park HJ, Hong SS, Kim YJ. Diagnostic

MAGNETOM Flash (69) 3/2017www.siemens.com/magnetom-world
Clinical • Abdominal Imaging
34
performance of MRI and EUS in the differentiation of benign from malignant pancreatic cyst and cyst communication with the main duct. Eur J Radiol. 2012 Nov;81(11):2927-35. doi:10.1016/j.ejrad.2011.12.019. Epub 2012 Jan 5.
105 Sainani NI, Saokar A, Deshpande V, Fernández-del Castillo C, Hahn P, Sahani DV. Comparative performance of MDCT and MRI with MR cholangiopancreatography in characterizing small pancreatic cysts. AJR Am J Roentgenol. 2009 Sep;193(3):722-31. doi:10.2214/AJR.08.1253.
106 Lee HJ, Kim MJ, Choi JY, Hong HS, Kim KA. Relative accuracy of CT and MRI in the differentiation of benign from malignant pancreatic cystic lesions. Clin Radiol. 2011 Apr;66(4):315-21. doi:10.1016/j.crad.2010.06.019. Epub 2011 Jan 8.
107 Visser BC, Yeh BM, Qayyum A, Way LW, McCulloch CE, Coakley FV. Characterization of cystic pancreatic masses: relative accuracy of CT and MRI. AJR Am J Roentgenol. 2007 Sep;189(3):648-56. doi:10.2214/AJR.07.2365.
108 Kim YC, Choi JY, Chung YE, Bang S, Kim MJ, Park MS, et al. Comparison of MRI and endoscopic ultrasound in the characterization of pancreatic cystic lesions. AJR Am J Roentgenol. 2010 Oct;195(4):947-52. doi:10.2214/AJR.09.3985.
109 Brun A, Agarwal N, Pitchumoni CS. Fluid collections in and around the pancreas in acute pancreatitis. J Clin Gastroenterol. 2011 Aug;45(7):614-25. doi:10.1097/MCG.0b013e318213ef3e.
110 Fernandez-del Castillo C, Targarona J, Thayer SP, Rattner DW, Brugge WR, Warshaw AL. Incidental pancreatic cysts: clinicopathologic characteristics and comparison with symptomatic patients. Arch Surg. 2003 Apr;138(4):427-3; discussion 433-424. doi:10.1001/archsurg.138.4.427.
111 Zhang XM, Mitchell DG, Dohke M, Holland GA, Parker L. Pancreatic cysts: depiction on single-shot fast spin-echo MR images. Radiology. 2002 May;223(2):547-53. doi:10.1148/radiol.2232010815
112 Lumsden A, Bradley EL, 3rd. Pseudocyst or cystic neoplasm? Differential diagnosis and initial management of cystic pancreatic lesions. Hepatogastroenterology. 1989 Dec;36(6):462-6.
113 Warshaw AL, Compton CC, Lewandrowski K, Cardenosa G, Mueller PR. Cystic tumors of the pancreas. New clinical, radiologic, and pathologic observations in 67 patients. Ann Surg. 1990 Oct; 212(4):432-43; discussion 444-5.
114 Le Borgne J, de Calan L, Partensky C. Cystadenomas and cystadenocarcinomas of the pancreas: a multiinstitutional retrospective study of 398 cases. French Surgical Association. Ann Surg. 1999 Aug; 230(2):152-61.
115 Brugge WR. Approaches to the drainage of pancreatic pseudocysts. Curr Opin Gastroenterol. 2004 Sep;20(5):488-92.
116 Barral M, Soyer P, Dohan A, Laurent V, Hoeffel C, Fishman EK, et al. Magnetic resonance imaging of cystic pancreatic lesions in adults: an update in current diagnostic features and management. Abdom Imaging. 2014 Feb;39(1):48-65. doi:10.1007/s00261-013-0048-y.
117 Macari M, Finn ME, Bennett GL, Cho KC, Newman E, Hajdu CH, et al. Differentiating pancreatic cystic neoplasms from pancreatic pseudocysts at MR imaging: value of perceived internal debris. Radiology. 2009 Apr;251(1):77-84. doi:10.1148/radiol.2511081286.
118 Arvanitakis M, Delhaye M, De Maertelaere V, Bali M, Winant C, Coppens E, et al. Computed tomography and magnetic resonance imaging in the assessment of acute pancreatitis. Gastroenterology. 2004 Mar;126(3):715-23.
119 Horvath KD, Chabot JA. An aggressive resectional approach to cystic neoplasms of the pancreas. Am J Surg. 1999 Oct;178(4):269-74.
120 Bassi C, Salvia R, Molinari E, Biasutti C, Falconi M, Pederzoli P. Management of 100 consecutive cases of pancreatic serous cystadenoma: wait for symptoms and see at imaging or vice versa? World J Surg 2003 Mar;27(3):319-23. Epub 2003 Feb 27.
121 Eriguchi N, Aoyagi S, Nakayama T, Hara M, Miyazaki T, Kutami R, et al. Serous cystadenocarcinoma of the pancreas with liver metastases. J Hepatobiliary Pancreat Surg 1998;5:467-70.
122 Jais B, Rebours V, Malleo G, Salvia R, Fontana M, Maggino L, et al. Serous cystic neoplasm of the pancreas: a multinational study of 2622 patients under the auspices of the International Association of Pancreatology and European Pancreatic Club (European Study Group on Cystic Tumors of the Pancreas). Gut. 2016 Feb;65(2)305-12. doi:10.1136/gutjnl-2015-309638. Epub 2015 Jun 4.
123 Tseng JF, Warshaw AL, Sahani DV, Lauwers GY, Rattner DW, Fernandez-del Castillo C. Serous cystadenoma of the pancreas: tumor growth rates and recommendations for treatment. Ann Surg. 2005 Sep;242(3):413-9; discussion 419-21.
124 Neumann HP, Dinkel E, Brambs H, Wimmer B, Friedburg H, Volk B, et al. Pancreatic lesions in the von Hippel-Lindau syndrome. Gastroenterology 1991 Aug;101(2):465-71.
125 Choi JY, Kim MJ, Lee JY, Lim JS, Chung JJ, Kim KW, et al. Typical and atypical manifestations of serous cystadenoma of the pancreas: imaging findings with pathologic correlation. AJR Am J Roentgenol. 2009 Jul;193(1):136-42. doi:10.2214/AJR.08.1309.
126 Procacci C, Graziani R, Bicego E, et al. Serous cystadenoma of the pancreas: report of 30 cases with emphasis on the imaging findings. J Comput Assist Tomogr. 1997; 21:373-382.
127 Procacci C, Biasiutti C, Carbognin G, Accordini S, Bicego E, Guarise A, et al. Characterization of cystic tumors of the pancreas: CT accuracy. J Comput Assist Tomogr. 1999 Nov-Dec;23(6):906-12.
128 Park HS, Kim SY, Hong SM, Park SH, Lee SS, Byun JH, et al. Hypervascular solid-appearing serous cystic neoplasms of the pancreas: Differential diagnosis with neuroendocrine tumours. Eur Radiol. 2016 May;26(5):1348-58. doi:10.1007/s00330-015-3961-3. Epub 2015 Sep 2.
129 Chu LC, Singhi AD, Haroun RR, Hruban RH, Fishman EK. The many faces of pancreatic serous cystadenoma: Radiologic and pathologic correlation. Diagn Interv Imaging. 2017 Mar;98(3):191-202. doi:10.1016/j.diii.2016.08.005. Epub 2016 Sep 7.
130 Zamboni G, Scarpa A, Bogina G, Iacono C, Bassi C, Talamini G, et al. Mucinous cystic tumors of the pancreas: clinicopathological features, prognosis, and relationship to other mucinous cystic tumors. Am J Surg Pathol. 1999 Apr;23(4):410-22.
131 Furukawa T, Takahashi T, Kobari M, Matsuno S. The mucus-hypersecreting tumor of the pancreas. Development and extension visualized by three-dimensional computerized mapping. Cancer. 1992 Sep 15;70(6):1505-13.

MAGNETOM Flash (69) 3/2017www.siemens.com/magnetom-world
Abdominal Imaging • Clinical
35
132 Goh BK, Tan YM, Chung YF, Chow PK, Cheow PC, Wong WK, et al. A review of mucinous cystic neoplasms of the pancreas defined by ovarian-type stroma: clinicopathological features of 344 patients. World J Surg. 2006 Dec;30(12):2236-45.
133 Bassi C, Molinari E, Falconi M, Pederzoli P. Clinical Manifestations and Therapeutic Management. In: Procacci C, Megibow AJ, editors. Imaging of the Pancreas. Cystic and Rare Tumors. Berlin: Springer; 2003. pp. 3-8.
134 Sperti C, Cappellazzo F, Pasquali C, Militello C, Catalini S, Bonadimani B, et al. Cystic neoplasms of the pancreas: problems in differential diagnosis. Am Surg. 1993 Nov;59(11):740-5.
135 Biasiutti C, Fornasa F, Venturini S, Pagnotta N, Schenal G, Procacci C. Mucinous Cystic Tumors. In: Procacci C, Megibow A, editors. Imaging of the Pancreas. Cystic and Rare Tumors. Berlin: Springer; 2003. pp. 57-74.
136 Buetow PC, Rao P, Thompson LD. From the Archives of the AFIP. Mucinous cystic neoplasms of the pancreas: radiologic-pathologic correlation. Radiographics. 1998 Mar-April;18(2):433-49. doi:10.1148/radiographics.18.2.9536488.
137 Koito K, Namieno T, Ichimura T, Yama N, Hareyama M, Morita K, et al. Mucin-producing pancreatic tumors: comparison of MR cholangiopancreatography with endoscopic retrograde cholangiopancreatography. Radiology. 1998 Jul;208(1):231-7. doi:10.1148/radiology.208.1.9646818.
138 Di Paola V, Manfredi R, Mehrabi S, Cardobi N, Demozzi E, Belluardo S, et al. Pancreatic mucinous cystoadenomas and cystoadenocarcinomas: differential diagnosis by means of MRI. Br J Radiol. 2016;89(1057):20150536. doi: 10.1259/bjr.20150536. Epub 2015 Nov 3.
139 Kim YH, Saini S, Sahani D, Hahn PF, Mueller PR, Auh YH. Imaging diagnosis of cystic pancreatic lesions: pseudocyst versus nonpseudocyst. Radiographics. 2005 May-Jun;25(3):671-85. doi:10.1148/rg.253045104.
140 Lewin M, Hoeffel C, Azizi L, Lacombe C, Monnier-Cholley L, Raynal M, et al. [Imaging of incidental cystic lesions of the pancreas]. [Article in French]. J Radiol. 2008 Feb;89(2):197-207.
141 Tanaka M, Fernandez-del Castillo C, Adsay V, Chari S, Falconi M, Jang JY, et al. International consensus guidelines 2012 for the management of IPMN and MCN of the pancreas. Pancreatology 2012 May-Jun;12(3):183-97. doi:10.1016/j.pan.2012.04.004. Epub 2012 Apr 16.
142 Ishida M, Egawa S, Aoki T, Sakata N, Mikami Y, Motoi F, et al. Characteristic clinicopathological features of the types of intraductal papillary-mucinous neoplasms of the pancreas. Pancreas. 2007 Nov;35(4):348-52. doi:10.1097/mpa.0b013e31806da090.
143 Berland LL, Silverman SG, Gore RM, Mayo-Smith WW, Megibow AJ, Yee J, et al. Managing incidental findings on abdominal CT: white paper of the ACR incidental findings committee. J Am Coll Radiol. 2010 Oct;7(10):754-73. doi:10.1016/j.jacr.2010.06.013.
144 Lim JH, Lee G, Oh YL. Radiologic spectrum of intraductal papillary mucinous tumor of the pancreas. Radiographics. 2001 Mar-Apr;21(2):323-37; discussion 337-40. doi:10.1148/radiographics.21.2.g01mr01323.
145 Procacci C, Graziani R, Bicego E, Bergamo-Andreis IA, Mainardi P, Zamboni G, et al. Intraductal mucin-producing tumors of the pancreas: imaging findings. Radiology. 1996 Jan;198(1):249-57. doi:10.1148/radiology.198.1.8539388
146 Procacci C, Megibow AJ, Carbognin G, Guarise A, Spoto E, Biasiutti C, et al. Intraductal papillary mucinous tumor of the pancreas: a pictorial essay. Radiographics. 1999 Nov-Dec;19(6):1447-63. doi:10.1148/radiographics.19.6.g99no011447.
147 Procacci C, Carbognin G, Biasiutti C, Guarise A, Ghirardi C, Schenal G. Intraductal papillary mucinous tumors of the pancreas: spectrum of CT and MR findings with pathologic correlation. Eur Radiol. 2001;11:1939-51. doi:10.1007/s003300100823.
148 Pilleul F, Rochette A, Partensky C, Scoazec JY, Bernard P, Valette PJ. Preoperative evaluation of intraductal papillary mucinous tumors performed by pancreatic magnetic resonance imaging and correlated with surgical and histopathologic findings. J Magn Reson Imaging. 2005 Mar;21(3):237-244. doi:10.1002/jmri.20254.
149 Campbell F, Azadeh B. Cystic neoplasms of the exocrine pancreas. Histopathology. 2008 Apr;52(5):539-51. doi:10.1111/j.1365-2559.2007.02856.x. Epub 2007 Sep 28.
150 Sahani DV, Kadavigere R, Blake M, Fernandez-Del Castillo C, Lauwers GY, Hahn PF. Intraductal papillary mucinous neoplasm of pancreas: multi-detector row CT with 2D curved reformations--correlation with MRCP. Radiology. 2006 Feb;238(2):560-9. doi:10.1148/radiol.2382041463.
151 Yamaguchi K, Kanemitsu S, Hatori T, Maguchi H, Shimizu Y, Tada M, et al. Pancreatic ductal adenocarcinoma derived from IPMN and pancreatic ductal adenocarcinoma concomitant with IPMN. Pancreas. 2011 May;40(4):571-80. doi: 10.1097/MPA.0b013e318215010c.
152 Yamada Y, Mori H, Hijiya N, Matsumoto S, Takaji R, Ohta M, et al. Intraductal papillary mucinous neoplasms of the pancreas complicated with intraductal hemorrhage, perforation, and fistula formation: CT and MR imaging findings with pathologic correlation. Abdom Imaging. 2012 Feb;37(1):100-9. doi: 10.1007/s00261-011-9723-z.
153 Cavallini G, Frulloni L, Pederzoli P, Talamini G, Bovo P, Bassi C, et al. Long-term follow-up of patients with chronic pancreatitis in Italy. Scand J Gastroenterol. 1998 Aug;33(8):880-9.
154 Klöppel G, Morohoshi T, John HD, Oehmichen W, Opitz K, Angelkort A, et al. Solid and cystic acinar cell tumour of the pancreas. A tumour in young women with favourable prognosis. Virchows Arch A Pathol Anat Histol. 1981;392(2):171-183.
155 Megibow AJ, Francis IR. Unusual Pancreatic Neoplasms: Imaging. In: Procacci C, Megibow AJ, editors. Imaging of the Pancreas. Cystic and Rare Tumors. Berlin: Springer; 2003. pp. 249-65.
156 Buetow PC, Buck JL, Pantongrag-Brown L, Beck KG, Ros PR, Adair CF. Solid and papillary epithelial neoplasm of the pancreas: imaging-pathologic correlation on 56 cases. Radiology. 1996; Jun;199(3):707-11. doi:10.1148/radiology.199.3.8637992.