imf country report no. 12/127 trinidad and tobago · ©2012 international monetary fund imf country...
TRANSCRIPT

©2012 International Monetary Fund
IMF Country Report No. 12/127
TRINIDAD AND TOBAGO 2011 ARTICLE IV CONSULTATION
Under Article IV of the IMF’s Articles of Agreement, the IMF holds bilateral discussions with members, usually every year. In the context of the 2011 Article IV consultation with Trinidad and Tobago the following documents have been released and are included in this package: Staff Report for the 2011 Article IV consultation, prepared by a staff team of the IMF, following discussions that ended on February 10, 2012, with the officials of Trinidad and Tobago on economic developments and policies. Based on information available at the time of these discussions, the staff report was completed on March 14, 2012. The views expressed in the staff report are those of the staff team and do not necessarily reflect the views of the Executive Board of the IMF.
Informational Annex prepared by the IMF.
Public Information Notice (PIN)
Statement by the Executive Director
The policy of publication of staff reports and other documents allows for the deletion of market-sensitive information.
Copies of this report are available to the public from
International Monetary Fund Publication Services 700 19th Street, N.W. Washington, D.C. 20431
Telephone: (202) 623-7430 Telefax: (202) 623-7201 E-mail: [email protected] Internet: http://www.imf.org
International Monetary Fund Washington, D.C.
June 2012

TRINIDAD AND TOBAGO STAFF REPORT FOR THE 2011 ARTICLE IV CONSULTATION
KEY ISSUES Supporting a Recovery: The economy is turning the corner and growth is expected to resume in 2012. The recovery comes after an extended slowdown lasting three years. Supportive fiscal and monetary policies and restoring financial confidence are essential.
Implementing Fiscal Stimulus: Notwithstanding an overall balance in 2010/11, the deterioration in the non-energy balance implied a substantial fiscal stimulus. The near-term priority is to sustain the stimulus by implementing the investment program in the 2011/12 budget and developing new state enterprise investment plans.
Saving Energy Wealth: In the medium term, a major shift in the fiscal trajectory is needed to resume net saving for future generations in view of the country’s diminishing energy reserves while maintaining public investment to support growth. The adjustment strategy should focus on rolling back transfers and subsidies to pre-boom levels while better targeting social benefits to vulnerable groups and strengthening the tax effort.
Containing Financial Vulnerabilities: Given the remaining financial vulnerabilities, continued intensified surveillance of the financial system is warranted. Although banks are well capitalized, profitable, and liquid, their NPLs have increased moderately. Non-banks have also come under stress. The authorities’ actions, including support to credit unions and other non-bank institutions, have reduced vulnerabilities. Completing the resolution of a failed insurance company, CLICO, will help to improve confidence.
Encouraging Growth: Adapting the investment framework and fiscal regime for the energy sector to changing circumstances will be crucial, given the prospective depletion of energy reserves and competition from shale gas. Promoting diversification will require developing a national consensus on key priorities, fostering a more vigorous private sector and continuing efforts to improve the business environment. It will also be important to strengthen public administration and the public service, to ensure effective and efficient delivery of public goods and services.
March 14, 2012

2011 ARTICLE IV STAFF REPORT TRINIDAD AND TOBAGO
2 INTERNATIONAL MONETARY FUND
Approved By David Vegara (WHD) and David Marston (SPR)
The mission, comprising J. Gold (Head), H. Monroe, M. Mansilla, M. Narita, and J. Okwuokei (all WHD) visited Port of Spain during February 1–10, 2012. Mr. Finch (OED) joined the mission. The mission conducted outreach meetings with parliamentarians, trade and labor unions.
CONTENTS RECENT DEVELOPMENTS AND OUTLOOK _______________________________________________________3 POLICY DISCUSSIONS ____________________________________________________________________________6 A. Fiscal Policy _____________________________________________________________________________________6 B. Monetary, Financial Sector, and Exchange Rate Policies ________________________________________9 C. Growth and Diversification ____________________________________________________________________ 11 STAFF APPRAISAL ______________________________________________________________________________ 13 TABLES 1. Selected Economic Indicators _________________________________________________________________ 28 2. Summary Balance of Payments _______________________________________________________________ 28 3. Summary of the Central Government Operations _____________________________________________ 29 4. Consolidated Nonfinancial Public Sector ______________________________________________________ 30 5. Monetary Survey ______________________________________________________________________________ 31 6. Indicators of External and Financial Vulnerability _____________________________________________ 32 7. Public Sector Debt Sustainability Framework, 2007–2017 _____________________________________ 33 FIGURES 1. Key Economic Developments _________________________________________________________________ 21 2. Comparative Macroeconomic Performance ___________________________________________________ 22 3. Monetary Developments ______________________________________________________________________ 23 4. Fiscal Sector Developments ___________________________________________________________________ 24 5. External Sector Developments ________________________________________________________________ 25 6. Public Debt Sustainability _____________________________________________________________________ 26 BOXES 1. Upward Bias in the Inflation Index _____________________________________________________________ 15 2. The 2011/12 Budget ___________________________________________________________________________ 16 3. Fiscal Sustainability ____________________________________________________________________________ 17 4. Implementation of the 2011 FSSA's Key Recommendations ___________________________________ 18 5. Assessment of Reserve Adequacy _____________________________________________________________ 19 6. Tourism in Tobago: Developments, Prospects and Challenges ________________________________ 20 APPENDIX I. External Stability Assessment __________________________________________________________________ 34

TRINIDAD AND TOBAGO 2011 ARTICLE IV STAFF REPORT
INTERNATIONAL MONETARY FUND 3
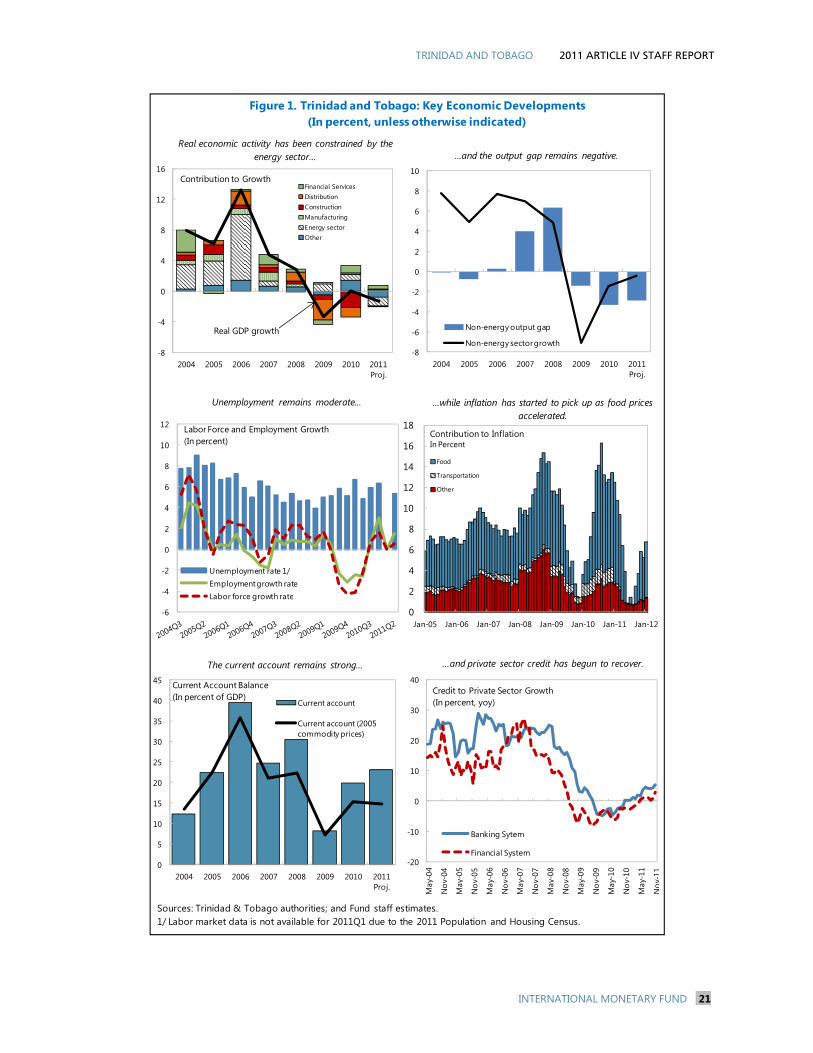
RECENT DEVELOPMENTS AND OUTLOOK 1. The economy is turning the corner and growth is expected to resume in 2012. A range of indicators point to a broad turnaround in the non-energy sector beginning in the second half of 2011. Commercial bank credit, particularly to the business sector, has expanded steadily since mid-2011 (Figure 1), construction activity grew in September 2011 for the first time since early 2010, and retail sales increased by 6.4 percent through the third quarter of 2011. The recovery comes after an extended slowdown lasting three years in which ample buffers have provided room for maneuver, accommodating an expansionary fiscal stance in 2010/11, and resources to deal with the collapse of a systemic insurance company (CLICO).
2. Weaker than anticipated energy sector activity contributed to a decline in 2011. Real GDP is estimated to have contracted by 1.3 percent in 2011 mainly reflecting unscheduled maintenance and technical disruptions in the energy sector and a lackluster performance in the non-energy
sector (see chart).1 The latter is the result of delays in public capital spending, the weak regional and global economy, and uncertainty related to CLICO. Inflation has picked up, rising from a historic low of 0.6 percent in August 2011 to 6.8 percent in January 2012, as food prices increased by double digits following adverse weather. However, as discussed in the 2010 Article IV staff report, the CPI methodology creates a significant upward bias in food price inflation (Box 1). Core inflation, which excludes the impact of food prices, remained low at 1.8 percent in January. Industrial relations remain divisive, as some segments of the public workforce with outstanding wage negotiations demand higher wage increases in the face of the 5 percent government offer (2-1-2) covering the 2008–10 period. Unemployment has remained moderate in part due to government work programs, falling to 5.8 percent in mid-2011.
3. In the 2010/11 fiscal year (October-September), the central government’s finances were nearly balanced. The better than expected outturn reflects strong revenue performance as a result of higher energy prices, a tax amnesty, and improved compliance following the introduction of a new IT platform, factors which more than offset VAT refunds. Current and capital spending was also lower than planned. Nevertheless, the deterioration in the structural primary balance (adjusted for the output gap, energy prices, and a lag in highway contract implementation) implied a 1 For additional information, see the Selected Issues Paper Chapter II: “Recent Developments and Prospects in the Energy Sector.”
-10
-8
-6
-4
-2
0
2
4
6
8
10
2008Q3 2009Q1 2009Q3 2010Q1 2010Q3 2011Q1 2011Q3
Real GDP Growth(In Percent, yoy)
Energy
Non-Energy
Total
2011 ARTICLE IV STAFF REPORT TRINIDAD AND TOBAGO
4 INTERNATIONAL MONETARY FUND
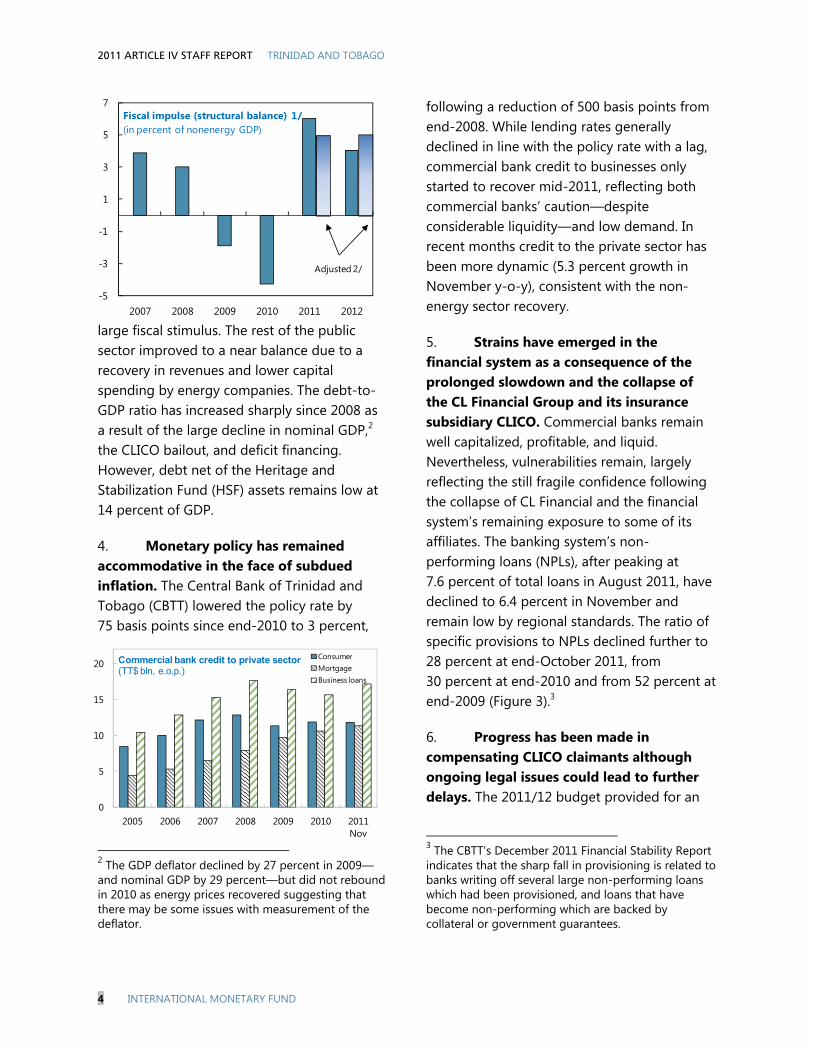
large fiscal stimulus. The rest of the public sector improved to a near balance due to a recovery in revenues and lower capital spending by energy companies. The debt-to-GDP ratio has increased sharply since 2008 as a result of the large decline in nominal GDP,2 the CLICO bailout, and deficit financing. However, debt net of the Heritage and Stabilization Fund (HSF) assets remains low at 14 percent of GDP.
4. Monetary policy has remained accommodative in the face of subdued inflation. The Central Bank of Trinidad and Tobago (CBTT) lowered the policy rate by 75 basis points since end-2010 to 3 percent,
2 The GDP deflator declined by 27 percent in 2009—and nominal GDP by 29 percent—but did not rebound in 2010 as energy prices recovered suggesting that there may be some issues with measurement of the deflator.
following a reduction of 500 basis points from end-2008. While lending rates generally declined in line with the policy rate with a lag, commercial bank credit to businesses only started to recover mid-2011, reflecting both commercial banks’ caution—despite considerable liquidity—and low demand. In recent months credit to the private sector has been more dynamic (5.3 percent growth in November y-o-y), consistent with the non-energy sector recovery.
5. Strains have emerged in the financial system as a consequence of the prolonged slowdown and the collapse of the CL Financial Group and its insurance subsidiary CLICO. Commercial banks remain well capitalized, profitable, and liquid. Nevertheless, vulnerabilities remain, largely reflecting the still fragile confidence following the collapse of CL Financial and the financial system’s remaining exposure to some of its affiliates. The banking system’s non-performing loans (NPLs), after peaking at 7.6 percent of total loans in August 2011, have declined to 6.4 percent in November and remain low by regional standards. The ratio of specific provisions to NPLs declined further to 28 percent at end-October 2011, from 30 percent at end-2010 and from 52 percent at end-2009 (Figure 3).3
6. Progress has been made in compensating CLICO claimants although ongoing legal issues could lead to further delays. The 2011/12 budget provided for an
3 The CBTT’s December 2011 Financial Stability Report indicates that the sharp fall in provisioning is related to banks writing off several large non-performing loans which had been provisioned, and loans that have become non-performing which are backed by collateral or government guarantees.
-5
-3
-1
1
3
5
7
2007 2008 2009 2010 2011 2012
Fiscal impulse (structural balance) 1/(in percent of nonenergy GDP)
Adjusted 2/
0
5
10
15
20
2005 2006 2007 2008 2009 2010 2011 Nov
ConsumerMortgageBusiness loans
Commercial bank credit to private sector(TT$ bln, e.o.p.)

TRINIDAD AND TOBAGO 2011 ARTICLE IV STAFF REPORT
INTERNATIONAL MONETARY FUND 5
enhanced treatment for CLICO claims over the threshold paid in cash (TT$75,000 or about US$12,000) that were to be repaid with up-to 20-year zero-coupon bonds. Bonds maturing in years 1–10 can be sold to banks at a discount of at most 20 percent, and, under the enhanced treatment, bonds due in years 11–20 may be swapped for equity in a trust that will mainly hold shares in Republic Bank taken from the balance sheet of CLICO. Thus far, only a small proportion of bonds for years 1–10 have been cashed in. If the share transfer overcomes legal hurdles and is completed as envisaged, the gross fiscal cost of the government’s intervention and the associated debt burden could be reduced by as much as 3.3 percent of GDP, or about one-quarter of the total estimated cost of the bailout. Parliament has passed an amendment to the Central Bank Act that would prevent CLICO claimants from suing to enforce their claims, which has provided some space to proceed with the workout.
7. The external accounts rebounded strongly in 2010. The current account surplus increased to 20 percent of GDP in 2010 and an estimated 21 percent in 2011 up from 8 percent in 2009, stemming mainly from the improvement in energy prices and a recovery in non-energy exports. Gross official reserves grew to US$9.8 billion (over 13 months of imports) at end-2011 from US$9.1 billion at end-2010.
8. The economic outlook has improved in the short term. Real economic activity is expected to increase by 1.7 percent in 2012 as the energy sector resumes normal operations later in the year, and the non-energy sector picks up momentum with the acceleration of public investment and the restructuring of CLICO liabilities. Inflation is expected to remain
moderate. Medium-term growth is expected to rise to 2.5 percent, significantly less than in the years preceding the crisis, in part due to the weak outlook for the energy sector, while non-energy growth is expected to reach its potential of 3.5 percent.
9. Nevertheless, there are significant downside risks. Domestically, these stem from the pace of implementation of public investment, ongoing legal challenges to the CLICO restructuring, and continued technical disruptions in oil and gas production. There is also the potential for external spillovers from lower prices for oil and gas and growing competition from shale gas, and other global developments, including any further weakness in demand for the country’s exports, from the Caribbean. Commercial banks do not depend on external funding and therefore are less prone to spillovers on the liability side, and there are some limited risks from lending to the rest of the Caribbean.4
10. The governing People’s Partnership took office in May 2010 with a five-year term. The key priorities of the coalition government have been to restore economic stability, to improve governance, and to address the high level of crime. A state of emergency imposed in August 2011 after a spike in crime expired in December.
11. The authorities implemented many of the key policy recommendations in the 2010 Article IV consultation. These include providing fiscal support for a recovery; undertaking further policy rate reductions;
4 Some financial institutions headquartered in Trinidad and Tobago operate throughout the region, raising the risk of outward spillovers to other countries in the Caribbean.
2011 ARTICLE IV STAFF REPORT TRINIDAD AND TOBAGO
6 INTERNATIONAL MONETARY FUND
implementing the FSSA recommendations; and finalizing the CLICO restructuring while providing more favorable treatment to credit unions. The authorities set forth their medium-term policy plans in the 2011/12 budget,
without specifying a medium-term fiscal trajectory and the measures to achieve it. They are working to extend supervision to the non-bank sector and have acted to reduce vulnerabilities in the sector.
POLICY DISCUSSIONS Notwithstanding the weak economic performance, ample buffers have provided room for maneuver. However, a major shift in the fiscal trajectory is needed in the medium term to put the fiscal framework on a sound footing. Discussions focused on how to support the recovery in the short term while returning to sustainable fiscal path going forward consistent with the prospective depletion of energy resources, and on addressing financial vulnerabilities and promoting diversification.
A. Fiscal Policy
12. The 2011/12 budget, if implemented as envisaged, will appropriately provide stimulus to support the recovery (Box 2). The central government budget deficit is projected to be 5 percent of GDP assuming conservative energy prices (oil price of US$75/barrel). The staff project a deficit of 2.5 percent of GDP based on WEO prices (oil price of US$105/barrel) and lower interest payments. The staff welcomed the supportive fiscal stance while emphasizing the need for timely execution of capital spending and development of new investment plans in the rest of the public sector to replace the ones
that are near completion. At the same time, staff cautioned against further increases in recurrent central government spending, pointing to the growth of transfers and subsidies from 9 percent of GDP in 2002/03 to 17 percent in 2010/11. The authorities agreed with staff on the need to address implementation delays, including by strengthening the execution unit within the Ministry of Finance, but noted that filling vacancies, even in key ministries, is complicated by the inflexible public service administration, leading to growing reliance on contractual staff.
0
50
100
150
200
250
2004 2006 2008 2010 2012 2014 2016
(in billions of TT$)
Nominal GDP
2008 Staff Report
Current Projection
CG Expenditure
2008 Staff Report
Current Projection
22
24
26
28
30
32
34
36
38
2004 2006 2008 2010 2012 2014 2016
Revenue
Expenditure
(in percent of GDP)

TRINIDAD AND TOBAGO 2011 ARTICLE IV STAFF REPORT
INTERNATIONAL MONETARY FUND 7
13. The government is seeking to improve the efficiency and buoyancy of revenue collection. The government plans to undertake its first major review of the tax system since the 1980s when the VAT was introduced. Following the tax amnesty in 2011, which collected TT$2 billion (1.4 percent of GDP), Inland Revenue is intensifying enforcement with its improved technology infrastructure. The staff welcomed this initiative but also noted that serious staffing shortages could limit the benefits of the new IT platform. Broadening the tax authority’s legal power to better utilize the new technology is also essential to further increase compliance.
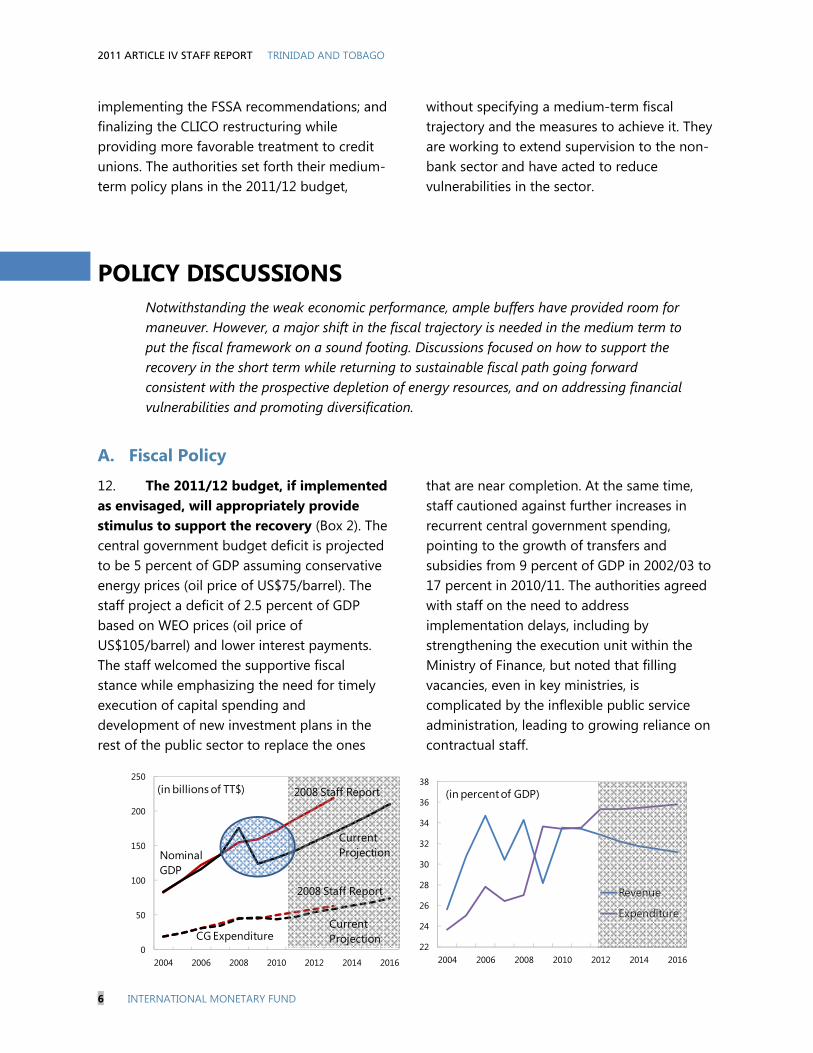
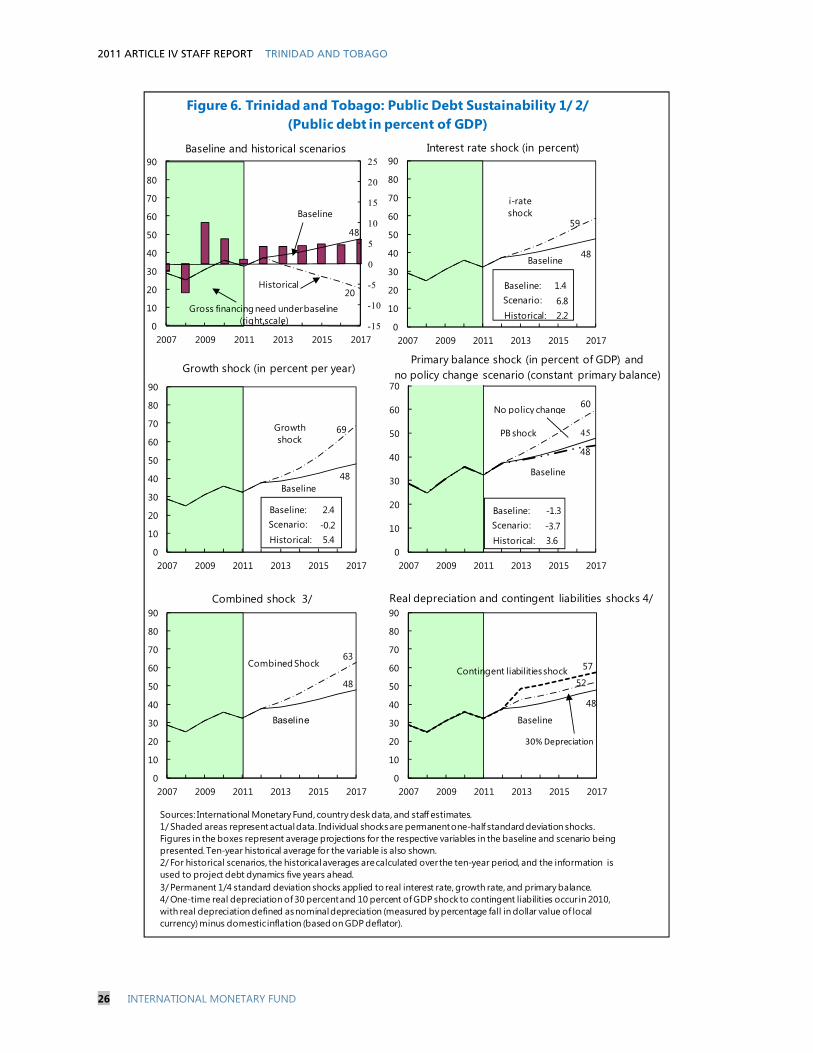
14. Over the medium-term, a major shift in the fiscal trajectory is needed to return the fiscal framework to a sustainable path. An even larger adjustment will be needed to resume savings for future generations. The large 2009 decline in nominal GDP put the
economy on a lower trajectory. However, central government spending has remained on the same pre-crisis path (see charts). Expenditures are significantly higher relative to GDP, but revenues have not recovered. The prospective decline in energy output and related revenues will further undermine public finances eventually requiring an abrupt adjustment (Box 3). In a passive scenario, the overall deficit is projected to drift upward to over 5 percent of GDP by 2016/17 even if noninterest expenditure is held constant as a share of GDP. The fiscal deterioration is driven by slower-than-GDP energy revenue and increasing interest payments. Under this scenario, the debt-to-GDP ratio would rise from 32 percent of GDP in 2010/11 to 48 percent by 2016/17, and as high as 69 percent in case of a growth shock. The authorities’ medium-term passive fiscal projection point to a similar deterioration.
(In percent of GDP, unless specified otherwise)
Prel.2009 2010 2011 2012 2013 2014 2015 2016 2017
Real GDP (in percent) -3.3 0.0 -1.3 1.7 2.4 2.5 2.5 2.5 2.6Energy 2.5 2.0 -2.5 1.0 1.4 1.4 1.2 1.2 1.4Non-energy -7.1 -1.5 -0.4 2.3 3.1 3.2 3.4 3.4 3.4
Inflation (end of period) 1.3 13.4 5.3 4.0 4.0 4.0 4.0 4.0 4.0
Revenue 1/ 28.2 33.5 33.2 32.6 32.0 31.5 31.0 30.7 30.4of which Energy 14.1 17.7 19.4 18.0 17.1 16.1 15.2 14.3 13.5
Expenditure 33.7 33.4 33.3 35.1 35.1 35.2 35.3 35.5 36.0Current 27.5 28.6 28.7 30.1 30.1 30.2 30.4 30.6 31.0Capital expenditures and net lending 6.2 4.9 4.5 5.0 5.0 5.0 5.0 5.0 5.0Overall fiscal balance -5.5 0.1 -0.1 -2.5 -3.1 -3.7 -4.3 -4.9 -5.5Overall fiscal non-energy balance -19.6 -17.6 -19.6 -20.5 -20.2 -19.8 -19.4 -19.1 -19.0
External current account balance 8.2 19.9 21.2 20.0 18.1 16.3 14.4 12.1 9.9
Public sector debt 2/ 30.8 35.9 32.4 37.3 38.6 40.5 42.9 45.4 47.7Net of HSF deposits 17.2 18.4 14.1 19.8 21.7 24.1 27.0 30.0 32.7
Gross official reserves (in US$ millions) 8,652 9,070 9,823 10,028 10,474 10,767 11,117 11,700 12,407In months of imports 14.1 15.8 13.4 13.5 13.5 13.5 13.5 13.5 13.5Sources: Ministry of Finance; and Fund staff estimates and projections.
Medium-Term Macroeconomic Framework (Passive)
Projections
2/ Excluding debt issued for sterilization. 1/ Fiscal data is central government unless otherwise specified and refers to the fiscal year ending in September.

2011 ARTICLE IV STAFF REPORT TRINIDAD AND TOBAGO
8 INTERNATIONAL MONETARY FUND
15. The mission recommended setting forth a credible medium-term framework that smoothes consumption and accommodates investment to support development and diversification. The active scenario, which illustrates a possible strategy, would imply a diminishing annual adjustment from 1 percentage point in 2012/13 to 0.6 percentage points by 2016/17. The strategy is based on (i) holding transfers and subsidies constant in nominal terms (thereby rolling back some of the large increases in the past decade), (ii) allowing other non-interest components of current spending to grow in line with GDP, and (iii) strengthening non-energy revenues by improving tax administration and broadening the tax base, including by reducing exemptions under the VAT and reforming property taxes. The negative fiscal impulse implicit in this scenario could reduce somewhat the real growth of the non-energy sector, but improved confidence in the sustainability of the fiscal framework may largely mitigate this risk.5
16. In the view of the authorities, sustainability in a small-open economy is
5 The active scenario makes the same macroeconomic assumptions as in the passive scenario.
related to resilience and buffers rather than a return of public finance to surpluses. In particular, they pointed to high international reserves, savings in the HSF, and moderate debt which provided space to respond to exogenous shocks, and they noted that there was no explicit strategy to return to surpluses, in the absence of credible signs of a return to a sustainable growth trajectory. At the same time, they indicated that planned reforms to eliminate wasteful expenditure and strengthen the tax revenue efforts will restore public finances back to a balance position or even surpluses while providing room for investment in infrastructure and other activities to promote diversification. These reforms include a Public Offerings Program which will streamline the state enterprise sector and reduce subsidies; a review of the social safety net to improve targeting and increase efficiency; measures to prevent illegal fuel exports which will reduce the fuel subsidy; a planned tax review; and investment in Gasoline Optimization to produce a higher quality and quantity of gasoline for export and to augment energy sector revenues.
17. The 50 percent increase in pension benefits announced with the 2011/12 budget could affect the sustainability of the public pension scheme. The minimum
(In percent of GDP, unless specified otherwise)Prel.
2009 2010 2011 2012 2013 2014 2015 2016 2017
Revenue 1/ 28.2 33.5 33.2 32.6 32.3 32.4 32.2 31.9 31.7of which Energy 14.1 17.7 19.4 18.0 17.1 16.1 15.2 14.3 13.5
Expenditure 33.7 33.4 33.3 35.1 33.8 32.6 31.5 30.5 29.8Current 27.5 28.6 28.7 30.1 28.8 27.7 26.6 25.6 24.8Capital expenditures and net lending 6.2 4.9 4.5 5.0 5.0 5.0 5.0 5.0 5.0
Overall balance -5.5 0.1 -0.1 -2.5 -1.5 -0.3 0.7 1.4 1.9Overall nonenergy balance -19.6 -17.6 -19.6 -20.5 -18.6 -16.4 -14.5 -12.9 -11.5
(as a share of nonenergy GDP) -33.5 -30.4 -35.3 -37.5 -33.3 -28.6 -24.3 -20.9 -18.1
Public sector debt 30.8 35.9 32.4 37.3 37.0 35.6 34.1 32.4 30.1Net of HSF deposits 17.2 18.4 14.1 19.8 20.1 19.2 17.5 14.9 11.2
Sources: Trinidad and Tobago authorities; and Fund staff estimates and projections.
1/ Fiscal data is central government unless otherwise specified and refers to the fiscal year ending in September.
Illustrative (Active) Macroeconomic Framework
Projections

TRINIDAD AND TOBAGO 2011 ARTICLE IV STAFF REPORT
INTERNATIONAL MONETARY FUND 9
pension from the National Insurance Scheme (NIS) will increase from TT$2,000 to TT$3,000 per month, in line with the increase in civil service pensions and the Senior Citizens Grant last year. The authorities indicated that the increase would be broadly offset by a shift toward contributions based on a flat percentage rather than on income brackets, and the incorporation of the self-employed, while the actuarial assessment due to be completed in June 2012 will identify any further adjustments that may be needed to ensure sustainability of the public pension scheme.
18. Since its creation in 2007, the Heritage and Stabilization Fund (HSF) has performed well despite adverse global economic conditions and financial market volatility. In view of the broad political and social consensus to safeguard and to increase savings in the HSF, there is scope, in the forthcoming review mandated by the HSF Act, to clarify the HSF’s objectives by giving greater emphasis to savings.6 This, together with the large accumulation since 2007 suggests raising the minimum balance and tightening
6 For additional information, see the Selected Issues Paper Chapter I: “The Heritage and Stabilization Fund: Key Issues for the 2012 Review.”
withdrawal rules. The existing rules allow withdrawals of up to 25 percent of the HSF balance for stabilization purposes when energy revenue falls below the budget forecast. There is also scope to clarify the procedure for setting the budget energy prices and transfers into the HSF. Staff underscored the importance of an integrated approach to managing the sovereign balance sheet taking into account government borrowing, savings into the HSF, and reserve accumulation. Sustained borrowing to save into the HSF would not be advisable. The authorities agreed that there was a strong consensus to increase savings into the HSF and that clarifying the objectives and operating framework of the HSF is essential.
B. Monetary, Financial Sector, and Exchange Rate Policies
19. The accommodative monetary policy stance is warranted to support the revival of private sector activity. Although the effectiveness of monetary policy is limited by the de facto stabilized exchange rate arrangement, the policy rate serves as a signaling device. In view of the nascent recovery and the still low core inflation rate, staff supports maintaining this stance. At the same time, the CLICO resolution as enhanced could have a positive wealth effect and increase demand for foreign exchange as the frozen claims on CLICO become available to the policy holders. The CBTT will need to remain vigilant and address these developments, including by increasing FX sales if necessary. The CBTT noted that thus far, there was no sign of increased demand for foreign exchange attributing this to the low interest rates and volatility in foreign markets.
0
50
100
150
200
250
300
Senior Citizens Grant(Central Government budget)
Retirement pension(National Insurance Scheme)
Pension benefit levels in real terms(1999=100)

2011 ARTICLE IV STAFF REPORT TRINIDAD AND TOBAGO
10 INTERNATIONAL MONETARY FUND
20. Given financial vulnerabilities, continued intensified monitoring and surveillance of the financial system is warranted. The high level of nonperforming loans, while moderate compared to the rest of the region and recently declining, may nevertheless reflect different positions across institutions, and the CBTT should continue with frequent on-site inspections and the stress testing of individual banks. The CBTT noted that the level of NPLs was not a major concern as it related to a few large loans that are well collateralized or have government guarantees. Furthermore, some of these were recently restructured and are now current, but they remain classified as substandard. They underscored that full provisions were made for the unsecured portion of all large non-performing loans and in cases where the value of the collateral was subject to volatility, the value was deeply discounted and provisions were made for the balance. The mission welcomed progress with implementing consolidated supervision and underscored the urgency of implementing other key recommendations from the 2011 Financial System Stability Assessment (FSSA) (Box 4). These include improving regional crisis management, developing an enhanced resolution framework for failed institutions, and implementing the new legislative framework once it is in place. In view of the regional presence of domestic banks and the increased financial integration in the Caribbean, the mission also welcomed the initial steps to coordinate supervision in the region.
21. The non-bank financial system, particularly mutual funds and credit unions, has experienced some stress, including from exposure to CLICO. Credit from this sector has fallen more steeply than from the
banking system, and continues to contract, in part due to more intense competition from banks. In line with the 2011 FSSA recommendations, the mission urged the rapid enactment and implementation of legislation to strengthen regulation and supervision of the insurance, credit unions, and securities industries. The draft Insurance Act before the Parliament seeks to address the weaknesses that led to the collapse of CLICO and to implement risk-based regulation and supervision, while draft credit unions legislation would bring them under central bank supervision. The revised draft Securities Act, which would improve regulatory cooperation and provide for on-site inspections, should also be quickly enacted. The authorities emphasized that their actions, including special treatment for credit unions in the CLICO restructuring and support for other non-bank institutions, have reduced vulnerabilities, and they agreed to the staff’s proposal to bring systemic non-bank institutions under central bank supervision. They noted that this would require some legislative changes to permit the CBTT greater supervisory powers.
22. The foreign exchange market would benefit from added flexibility. Additional steps are needed to increase the market’s efficiency and avoid periods of hoarding and temporary scarcity. The CBTT is a key player in the market as it intermediates the foreign exchange paid by energy companies in royalties and taxes to the government. As such, the CBTT’s sales are critical to balance the market. However, uncertainty regarding these sales, as well as inadequate timing and volume may lead to temporary scarcity and queuing. The central bank stopped collecting data on queues in 2011, given reliability issues. Discussions with market participants indicate

TRINIDAD AND TOBAGO 2011 ARTICLE IV STAFF REPORT
INTERNATIONAL MONETARY FUND 11
that the scarcity perceived at end-2010 has substantially diminished—in part reflecting the increase in frequency of CBTT FX sales—and on balance, while the staff considers that the system has drawbacks, it finds no concrete evidence that would suggest that at present there are undue delays that would constitute Article VIII restrictions. Nevertheless there are structural issues that hamper the market operations and queues could easily reemerge. Some greater exchange rate flexibility—through a wider band for exchange rate fluctuation—would allow pricing to play a bigger role in equilibrating the market. A greater role for the private sector in the market could also improve its efficiency, but could require measures to stimulate competition and limit open FX positions. The authorities expressed the concern that greater flexibility could lead to an appreciation of the currency and undermine diversification efforts. They also noted that the CBTT has not been successful in its efforts to create an FX interbank market, given the one-sided nature of the demand for foreign exchange. The staff continues discussion with the authorities on how to improve the operations of the FX market. There is also an urgent need to address AML/CFT deficiencies.
23. Trinidad and Tobago’s external position remains strong while the exchange rate is broadly in line with fundamentals. The current account surplus has rebounded with the increase in energy prices and a recovery in non-energy exports. International reserves have continued to rise, and are significantly more than adequate according to various measures (Box 5). The REER has appreciated by 32 percent since 2005, mainly
reflecting high inflation,7 and remains broadly in line with fundamentals according to the equilibrium real exchange rate and the macroeconomic balance approaches for resource-exporting countries (see Appendix I). However, the external sustainability approach, which explicitly takes into account the temporary nature of energy revenue, points to a tendency for overvaluation, underscoring the need to intensify structural reforms to improve the competitiveness of the non-energy sector over the medium term. The high dependency on energy exports and exposure to energy price fluctuations are a source of external vulnerabilities, compounded by uncertainty in energy markets.
C. Growth and Diversification
24. The key challenges in the energy sector are the projected depletion of oil and natural gas reserves and the falling gas prices in the United States. The industry has been successful in redirecting gas exports from the United States, where prices have plummeted as a result of the increase in shale gas production. However, there has been limited exploration activity and investment in recent years. Although this may reflect the adverse global economic climate, adapting the sector’s investment framework and the fiscal regime to ensure its competitiveness will be essential.
25. The country has been grappling with the conundrum of diversification for many years, with few tangible results other than the successful move into the downstream energy sector. These have included a wide range of programs to develop
7See Box 1 regarding the upward bias in inflation.

2011 ARTICLE IV STAFF REPORT TRINIDAD AND TOBAGO
12 INTERNATIONAL MONETARY FUND
entrepreneurship, to finance early stage enterprises, to promote promising sectors, and to attract investment. An earlier major initiative, to establish the country as a financial center, foundered in the face of the financial crisis. The staff urged a stock taking to identify which programs have been successful and then to mold these into a coherent strategy while phasing out the remainder. They welcomed measures in the 2011/12 budget to improve physical and technological infrastructure, foster downstream manufacturing, strengthen the business environment, and invigorate the private sector including through public offerings and public/private partnerships.
26. Notwithstanding progress in improving competitiveness the country is lagging in a number of important areas. Trinidad and Tobago’s relative position in the Global Competitiveness survey has improved since 2008 by 11 positions to 81st of 142 countries, but ranks lower in a number of key areas such as labor market efficiency and quality of institutions. In particular, it would be important to strengthen public administration and the public service to ensure effective and
efficient delivery of public goods and services. The survey also indicates that the most problematic factor for doing business is the high level of crime and theft. The mission underscored the importance of taking full advantage of the country’s natural strengths, for instance, by developing further downstream energy industries, revitalizing tourism (Box 6), and using more fully its strong skills base.
27. Although data is broadly adequate for surveillance, it urgently needs to be improved to provide a firmer basis for policy making. Progress has been limited in addressing methodological weaknesses with the CPI and the GDP deflator. In particular, a recent STA/CARTAC TA confirms the large overestimation of the inflation. Plans to create an independent statistical entity are welcome, but there is a need in the interim to better resource and staff the existing entity to improve the quality and availability of data. The authorities agreed that better statistics are urgently needed. They confirmed their intention to subscribe to the Special Data Dissemination Standard, which will be an important step forward.
2010-2011 2011-2012
GDP per capita in current USD, 2010 15,581 16,078 14,326 7,843 7,593 8,883 6,008GCI Global Competitiveness Index 84 81 42 61 49 72 55
Macroeconomic environment 70 57 126 109 41 18 16Infrastructure 45 53 22 83 38 82 73Institutions 68 82 18 53 75 94 68Health and primary education 61 60 17 39 79 85 105
Efficiency enhancers 77 79 49 61 57 76 77Labor market efficiency 82 87 35 55 115 21 14Financial market development 43 49 29 91 27 121 94
Innovation and sophistication factors 78 76 47 36 54 114 67
Sources: World Economic Forum, WEO and WDI.
1/ Rankings in 2010-2011 out of 139 countries and in 2011-2012 out of 142 countries.
Global Competitiveness Index 2011-2012: Selected Countries 1/
Trinidad and Tobago Barbados Costa Rica KazakhstanPanama Azerbaijan

TRINIDAD AND TOBAGO 2011 ARTICLE IV STAFF REPORT
INTERNATIONAL MONETARY FUND 13
STAFF APPRAISAL 28. Trinidad and Tobago is exiting a difficult period. The global crisis, sharp decline in energy prices, and collapse of CLICO represented significant shocks. However, policy responses and ample buffers contributed to maintaining stability and containing the negative spillovers. The challenges looking forward will be to support the nascent recovery through appropriate fiscal and monetary policies, setting forth a medium-term framework to resume savings of energy wealth, taking steps to cement financial stability and pursue growth and diversification.
29. There is concrete evidence that the economy is turning the corner and that economic growth will resume in 2012. Real economic activity is projected to increase 1.7 percent, as private sector credit expansion gains momentum, the resolution of CLICO proceeds, and the faster pace of government investment continues. There are downside risks stemming from possible delays in public investment or the CLICO restructuring, further technical disruptions in the energy sector, and global developments, including uncertainty over natural gas prices.
30. The fiscal stimulus has supported the economy. The public sector finances were balanced in 2010/11 as a result of higher energy prices and improved tax collection, as well as lower than planned spending. Nevertheless, a larger non-energy deficit provided significant stimulus. The focus now should be on implementing the 2011/12 budget by overcoming execution hurdles and on developing new investment plans for public enterprises as the pipeline of existing projects winds down. The authorities should
take advantage of the actuarial review of the public pension scheme to identify measures needed to ensure its sustainability following the recent substantial increase in benefits.
31. The key strategic decision facing the country is to determine the appropriate balance of consuming, saving, and investing energy wealth. The staff’s active scenario emphasizes a gradual return to surpluses, by containing current spending and strengthening the tax effort, while providing for investments to support diversification. This is broadly consistent with the authorities’ strategy, which gives greater emphasis to eliminating wasteful expenditures, broadening the tax base, maintaining buffers and accommodating an ambitious investment program in support of diversification.
32. The review being undertaken of the HSF is timely. Since its creation in 2007, the HSF has performed well despite adverse global economic conditions and financial market volatility. Its growth even during a difficult period demonstrates a revealed preference to use the HSF for savings rather than stabilization and underscores the need to clarify its objectives and operating framework.
33. The authorities have actively worked to manage financial vulnerabilities. The financial system has not been immune to the prolonged economic slowdown. Although banks remain strong, there has been some deterioration in asset quality and continued intensified surveillance and monitoring is warranted. The staff welcomes efforts to complete the resolution of CLICO, steps to

2011 ARTICLE IV STAFF REPORT TRINIDAD AND TOBAGO
14 INTERNATIONAL MONETARY FUND
bring additional non-banks within the regulatory perimeter of the Central Bank, and progress with the implementation of FSSA recommendations. They urged accelerating the enactment of legislation on insurance, credit unions, and securities. The staff concurs with the accommodative monetary stance to support the revival of private sector credit.
34. There remain some concerns with the operation of the foreign exchange system. The scarcity of FX evident at end-2010 appears to have substantially diminished but structural issues hamper the market’s operations and queues could reemerge. The staff see some scope for a wider band to allow pricing to play a bigger role in clearing the foreign exchange market together with an increase in the participation of the private sector.
35. Trinidad and Tobago’s external position remains strong and the exchange rate is broadly in line with fundamentals, but maintaining competitiveness in the medium term will be important. The current account surplus has rebounded with the increase in energy prices and recovery in non-energy exports. Two of the three CGER approaches indicate that the real effective exchange rate is close to its equilibrium level. However, given that the external sustainability approach points to a tendency for overvaluation, the authorities could usefully intensify structural reforms to improve
competitiveness of the non-energy sector in the medium term.
36. Depleting energy reserves and growing shale gas production in the U.S. represent significant challenges to the energy sector. The country has been successful in redirecting its gas exports to new markets. Looking forward, it will be essential to ensure that the investment framework and fiscal regime adapt to the evolving landscape to facilitate new exploration and development and finding new markets.
37. Diversification represents a major challenge for an economy that has long benefited from energy rents. The staff welcome the government’s focus on improving the regulatory and administrative framework for private sector activity, and fostering investment, including the planned public offerings and public/private partnership programs. It will also be important to strengthen public administration and public service.
38. The quality of statistics is an obstacle to informed policy making and requires urgent attention. The authorities’ commitment to improving and reforming the statistical infrastructure is welcome.
39. The next Article IV consultation is expected to be held on the standard 12-month cycle.

TRINIDAD AND TOBAGO 2011 ARTICLE IV STAFF REPORT
INTERNATIONAL MONETARY FUND 15
Box 1. Upward Bias in the Inflation Index The methodology used in Trinidad and Tobago to estimate inflation leads to a substantial upward bias, primarily in the food component. The cause of this is arithmetic averaging of price changes for certain sub-components yielding a Carli index, which is not transitive—in other words, a price increase in one period that is reversed in the next nevertheless increases inflation. The upward bias is greater when prices are volatile or exhibit seasonal variations—a prominent feature of food prices in Trinidad and Tobago in light of frequent weather damage—and chained over many periods. According to the International Labor Organization CPI manual of 2004, the Carli index “…has serious disadvantages…” and “Chained Carli indices may be subject to a significant upward bias.”1
The authorities plan in 2012 to update the methodology together with a revision to the consumption basket on the basis of the 2008/2009 Household Budget Survey (HBS). Notwithstanding the implied upward bias in historical inflation data, the staff assessment of the macroeconomic environment and government policies remains broadly unchanged. The staff and the authorities were aware of issues with the measurement of food inflation, as flagged in the 2010 Article IV Consultation report. As a result, policy discussion and analysis focused on core inflation, which has been at its historic low in line with the lagging economic activity. Lower inflation would imply that the real appreciation of the exchange rate has been more modest than estimated. 1 ILO/IMF/OECD/UNECE/Eurostat/The World Bank, “Consumer Price Index Manual: Theory and Practice” (Geneva: International Labor Office, 2004, revised 2008), Chapter 9. See also the 2009 Article IV Consultation Report for Kenya (Country Report 10/26) discussion on that country’s correction to the methodology for a similar problem.
Illustration of the upward bias of the Carli Index
t t+1 t+2 Pt+1/Pt Pt+2/Pt+1
Price
Item a 10 20 10 2.0 0.5
Item b 20 10 20 0.5 2.0
Indexes
Carli 1/ 100 125 125 25.0 0.0
Chained 100 125 156 25.0 25.0
Jevons 2/ 100 100 100 0.0 0.0
Chained 100 100 100 0.0 0.0
Source: IMF Staff Calculations
1/ Defined as the arithmetic average of price ratios
2/ Defined as the geometric average of price ratios
(Base t=100) (Percent change)
(TT Dollars) (Ratio)

2011 ARTICLE IV STAFF REPORT TRINIDAD AND TOBAGO
16 INTERNATIONAL MONETARY FUND
Box 2. The 2011/12 Budget
The 2011/12 budget, entitled “From Steady Foundation to Economic Transformation,” reflects the shift in emphasis from addressing legacy issues toward implementing the government’s policy priorities. The key themes are safety, jobs, and investment.
The focus on safety came in the context of the state of emergency. The budget provides for making law enforcement more effective through improved technology and training; a stronger legislative framework; and intensified controls at the borders. These will include measures to address large-scale smuggling of subsidized fuel out of the country.
The budget also sets forth a strategy for economic transformation, recognizing that despite diversification efforts, the structure of the economy has not changed beyond the shift from an oil- to a gas-based economy. Policies will focus on:
Changing the structure of the economy. This includes the creation of a National Infrastructure Bank (with IFC assistance) to leverage long-term private financing, development of a tourism action plan, and sales of shares in a state-owned bank, two state mortgage entities to be merged, and in the industrial port.
Modernizing the state. Reforms aim at modernizing the public administration and public financial management, including improved efficiency of the civil service, creation of a Public Financial Management Modernization Unit, and better medium-term planning, debt management, public procurement, statistics, and technology. Customs will be computerized (ASYCUDA), and VAT refunds will be paid on a timely basis now that arrears have been cleared.
Targeting basic needs. The budget includes measures to promote home ownership, improved health coverage, and using tuition grants to address skills shortages. It sets the objective of reducing the poverty rate, now 17 percent, by 2 percentage points per year.
TRINIDAD AND TOBAGO 2011 ARTICLE IV STAFF REPORT
INTERNATIONAL MONETARY FUND 17
Box 3. Fiscal Sustainability
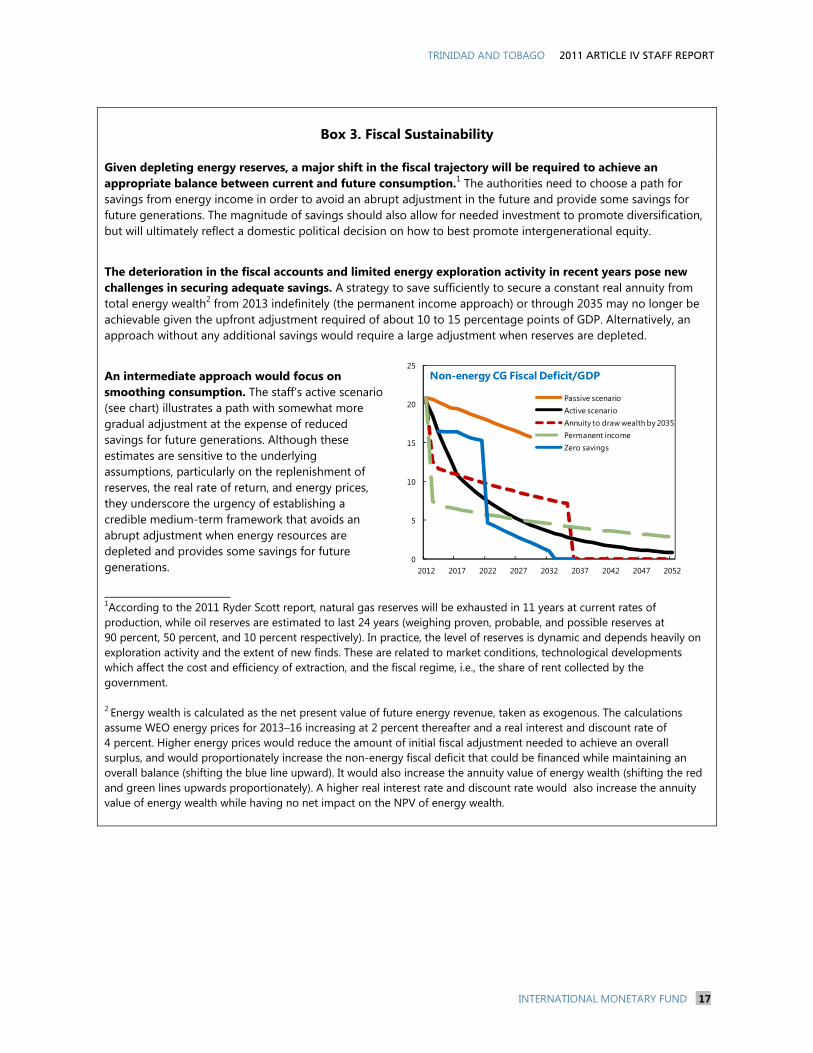
Given depleting energy reserves, a major shift in the fiscal trajectory will be required to achieve an appropriate balance between current and future consumption.1 The authorities need to choose a path for savings from energy income in order to avoid an abrupt adjustment in the future and provide some savings for future generations. The magnitude of savings should also allow for needed investment to promote diversification, but will ultimately reflect a domestic political decision on how to best promote intergenerational equity.
The deterioration in the fiscal accounts and limited energy exploration activity in recent years pose new challenges in securing adequate savings. A strategy to save sufficiently to secure a constant real annuity from total energy wealth2 from 2013 indefinitely (the permanent income approach) or through 2035 may no longer be achievable given the upfront adjustment required of about 10 to 15 percentage points of GDP. Alternatively, an approach without any additional savings would require a large adjustment when reserves are depleted.
An intermediate approach would focus on smoothing consumption. The staff’s active scenario (see chart) illustrates a path with somewhat more gradual adjustment at the expense of reduced savings for future generations. Although these estimates are sensitive to the underlying assumptions, particularly on the replenishment of reserves, the real rate of return, and energy prices, they underscore the urgency of establishing a credible medium-term framework that avoids an abrupt adjustment when energy resources are depleted and provides some savings for future generations.
________________________ 1According to the 2011 Ryder Scott report, natural gas reserves will be exhausted in 11 years at current rates of production, while oil reserves are estimated to last 24 years (weighing proven, probable, and possible reserves at 90 percent, 50 percent, and 10 percent respectively). In practice, the level of reserves is dynamic and depends heavily on exploration activity and the extent of new finds. These are related to market conditions, technological developments which affect the cost and efficiency of extraction, and the fiscal regime, i.e., the share of rent collected by the government. 2 Energy wealth is calculated as the net present value of future energy revenue, taken as exogenous. The calculations assume WEO energy prices for 2013–16 increasing at 2 percent thereafter and a real interest and discount rate of 4 percent. Higher energy prices would reduce the amount of initial fiscal adjustment needed to achieve an overall surplus, and would proportionately increase the non-energy fiscal deficit that could be financed while maintaining an overall balance (shifting the blue line upward). It would also increase the annuity value of energy wealth (shifting the red and green lines upwards proportionately). A higher real interest rate and discount rate would also increase the annuity value of energy wealth while having no net impact on the NPV of energy wealth.
0
5
10
15
20
25
2012 2017 2022 2027 2032 2037 2042 2047 2052
Non-energy CG Fiscal Deficit/GDP
Passive scenarioActive scenarioAnnuity to draw wealth by 2035Permanent income Zero savings

2011 ARTICLE IV STAFF REPORT TRINIDAD AND TOBAGO
18 INTERNATIONAL MONETARY FUND
Box 4. Trinidad and Tobago: Implementation of the 2011 FSSA’s Key Recommendations
There has been significant progress in implementing the FSSA’s recommendations.
Banking. The Central Bank is reviewing the regulatory framework for financial institutions (the Financial Institutions Act 2008, Financial Institutions Regulations 1994, and the Financial Institutions Order) including measures to strengthen capital (incorporating charges against capital for operational and market risks), liquidity risk management standards, and information requirements. In 2011, a circular informed the industry of a new framework that allows bank supervisors to levy administrative fines, although the new powers remain largely untested. Starting in 2012 supervisors will apply consolidated supervision criteria in assessing banks.
Insurance. A new Insurance Bill has been tabled in Parliament and will be debated shortly. The new law introduces risk-based capital, overlapping the statutory fund requirements which are intended to be phased out in three years. Regulations have been prepared for implementation, including on capital adequacy, asset management, consumer protection (motor liability insurance), and insurance intermediaries. New CBTT guidelines for valuation of insurance liabilities are also in preparation.
Central Bank. Revision to the Financial Institutions Act are being considered to broaden the regulatory perimeter of the CBTT (to incorporate credit unions), to enhance compliance and enforcement (including through fines), and Basel III prudential criteria for the definition of regulatory capital and risk-based capital requirements. Separately, a draft Credit Union Bill strengthening the regulatory and supervisory framework is also in the consultation stage.
Capacity. The CBTT has moved to strengthen its capacity particularly in the area of insurance.
Looking forward, Trinidad and Tobago should continue to support efforts to improve regional crisis management under the auspices of the Caribbean Group of Banking Supervisors. There is a need to develop an improved resolution framework for failed institutions and to consider whether to adopt measures to contain the impact of the failure of systemically important institutions. Once new legislation on insurance and credit unions is in place, the challenge will be to implement the new framework.
TRINIDAD AND TOBAGO 2011 ARTICLE IV STAFF REPORT
INTERNATIONAL MONETARY FUND 19
Box 5. Assessment of Reserve Adequacy
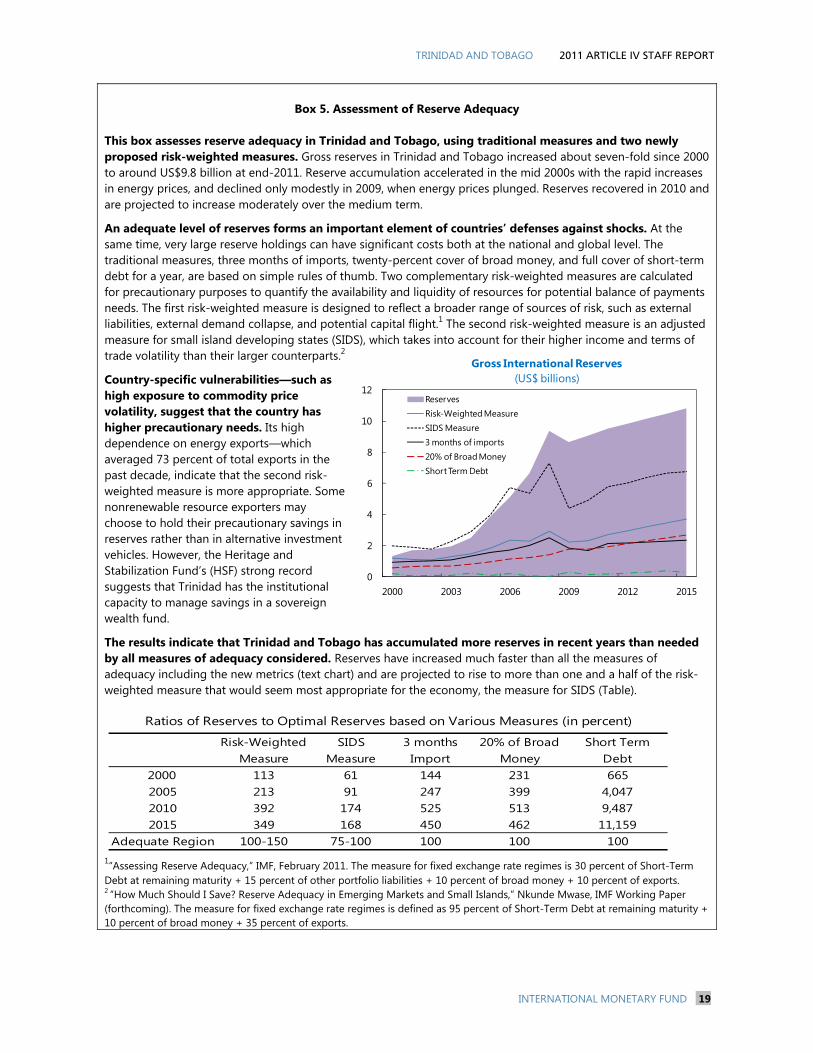
This box assesses reserve adequacy in Trinidad and Tobago, using traditional measures and two newly proposed risk-weighted measures. Gross reserves in Trinidad and Tobago increased about seven-fold since 2000 to around US$9.8 billion at end-2011. Reserve accumulation accelerated in the mid 2000s with the rapid increases in energy prices, and declined only modestly in 2009, when energy prices plunged. Reserves recovered in 2010 and are projected to increase moderately over the medium term.
An adequate level of reserves forms an important element of countries’ defenses against shocks. At the same time, very large reserve holdings can have significant costs both at the national and global level. The traditional measures, three months of imports, twenty-percent cover of broad money, and full cover of short-term debt for a year, are based on simple rules of thumb. Two complementary risk-weighted measures are calculated for precautionary purposes to quantify the availability and liquidity of resources for potential balance of payments needs. The first risk-weighted measure is designed to reflect a broader range of sources of risk, such as external liabilities, external demand collapse, and potential capital flight.1 The second risk-weighted measure is an adjusted measure for small island developing states (SIDS), which takes into account for their higher income and terms of trade volatility than their larger counterparts.2
Country-specific vulnerabilities—such as high exposure to commodity price volatility, suggest that the country has higher precautionary needs. Its high dependence on energy exports—which averaged 73 percent of total exports in the past decade, indicate that the second risk-weighted measure is more appropriate. Some nonrenewable resource exporters may choose to hold their precautionary savings in reserves rather than in alternative investment vehicles. However, the Heritage and Stabilization Fund’s (HSF) strong record suggests that Trinidad has the institutional capacity to manage savings in a sovereign wealth fund.
The results indicate that Trinidad and Tobago has accumulated more reserves in recent years than needed by all measures of adequacy considered. Reserves have increased much faster than all the measures of adequacy including the new metrics (text chart) and are projected to rise to more than one and a half of the risk-weighted measure that would seem most appropriate for the economy, the measure for SIDS (Table).
1“Assessing Reserve Adequacy,” IMF, February 2011. The measure for fixed exchange rate regimes is 30 percent of Short-Term Debt at remaining maturity + 15 percent of other portfolio liabilities + 10 percent of broad money + 10 percent of exports. 2 “How Much Should I Save? Reserve Adequacy in Emerging Markets and Small Islands,” Nkunde Mwase, IMF Working Paper (forthcoming). The measure for fixed exchange rate regimes is defined as 95 percent of Short-Term Debt at remaining maturity + 10 percent of broad money + 35 percent of exports.
Risk-Weighted Measure
SIDS Measure
3 months Import
20% of Broad Money
Short Term Debt
2000 113 61 144 231 6652005 213 91 247 399 4,0472010 392 174 525 513 9,4872015 349 168 450 462 11,159
Adequate Region 100-150 75-100 100 100 100
Ratios of Reserves to Optimal Reserves based on Various Measures (in percent)
0
2
4
6
8
10
12
2000 2003 2006 2009 2012 2015
Gross International Reserves(US$ billions)
ReservesRisk-Weighted MeasureSIDS Measure3 months of imports20% of Broad MoneyShort Term Debt

2011 ARTICLE IV STAFF REPORT TRINIDAD AND TOBAGO
20 INTERNATIONAL MONETARY FUND
Box 6. Tourism in Tobago: Developments, Prospects and Challenges
Tourism is the major non-governmental economic activity in Tobago. Tobago is the smaller of the two islands, with a population of about 54,000 out of the country’s total of 1.3 million, and a land area of 300 km2 out of the total of 5,128 km2. In 2009, tourism contributed 37 percent of the island’s GDP, generated 48 percent of the island’s employment, and accounted for 98 percent of its exports. For the country as a whole, tourism contributed 11 percent to the country’s GDP, and 15 percent to total employment. The island has had the weakest tourism performance in an already badly hit region. Real growth declined by 6 percent in 2009, as the continued fall-off in tourist arrivals was worsened by the global crisis. Arrivals were already on a downward trajectory before the onset of the crisis, and the drop of about 27 percent between 2005 and 2007 suggests that the island’s tourism sector is grappling with fundamental challenges. Over the medium term, the outlook for a turnaround is not encouraging. Nevertheless, Tobago has a rich natural and cultural heritage, and has the potential for substantial growth in tourism. Beside the conventional beach resort-type product, it can offer ecotourism, adventure and water sports. Its annual Carnival and heritage festival draw significant number of tourists from source markets accounting for about 10 percent of the island’s annual tourist arrivals. However, there appears to be no well-defined target market for Tobago’s tourism products, while the potential benefits for the local economy are not fully appreciated. Europe is the main source market. In 2009, it accounted for over 90 percent of stay-over arrivals, of which 73 percent came from the UK, while arrivals from the US accounted for 6 percent. However, critical challenges hinder tourism development on the island. A 2005 study by the World Travel and Tourism Council highlighted the lack of development planning, inadequate human capital, limited accommodation stock of international standard, and inadequate airport facilities. These are compounded by a negative perception of the importance of tourism, low public expenditure per visitor on advertising and promotion, and competition for skilled labor by the local government authority, which employs about half of the labor force. Regulation and monitoring of the sector seems weak, which is reflected in inconsistent service delivery. Crime is also a significant issue. There is not a special security force to deal with tourism-related crime unlike in some other tourism-dependent islands, and security personnel are few and not properly equipped. In addition to existing development plans, the 2011/12 budget proposes initiatives to address these challenges under the umbrella of a 15-month Tourism Action Plan. A Tourism Development Fund of TT$100 million will provide government guarantees to support improvement and development in existing and new tourist properties. There are also plans for major institutional and governance reforms, investment in enhancing human capital and increasing local autonomy. The authorities would need to move quickly with the implementation of these programs to put Tobago’s tourism sector on a firm path to recovery. There is also a need to engage in research to better target development efforts while putting in place an improved mechanism for dialogue between the local authority and the central government.
Tobago: Tourism Expenditure under the Public Sector Investment Program(Millions of TT$)
2008 2009 2010 2011 2012Budget
Tourism Expenditure 13.1 17.1 12.1 45.3 73.3Total Expenditure 514.7 681.9 750.5 829.7 644.8% of Total 2.5 2.5 1.6 5.5 11.4Sources: Ministries of Finance, and Planning and Economy, Trinidad and Tobago
-60
-40
-20
0
20
40
60
80
100
2001 2002 2003 2004 2005 2006 2007 2008 2009 2010Q2
Tobago
ECCU, excl St.Kitts
BHS
BRB
JAM
Trinidad
Tourist arrivals growth rate(in percent)
Sources: The Caribbean Tourism Organisation, the Authorities and Fund Staff calculations.
TRINIDAD AND TOBAGO 2011 ARTICLE IV STAFF REPORT
INTERNATIONAL MONETARY FUND 21
Figure 1. Trinidad and Tobago: Key Economic Developments(In percent, unless otherwise indicated)
Sources: Trinidad & Tobago authorities; and Fund staff estimates.1/ Labor market data is not available for 2011Q1 due to the 2011 Population and Housing Census.
-8
-4
0
4
8
12
16
2004 2005 2006 2007 2008 2009 2010 2011 Proj.
Contribution to GrowthFinancial ServicesDistributionConstructionManufacturingEnergy sectorOther
Real GDP growth
0
2
4
6
8
10
12
14
16
18
Jan-05 Jan-06 Jan-07 Jan-08 Jan-09 Jan-10 Jan-11 Jan-12
Contribution to InflationIn Percent
Food
Transportation
Other
Real economic activity has been constrained by the energy sector...
Unemployment remains moderate... ...while inflation has started to pick up as food prices accelerated.
-8
-6
-4
-2
0
2
4
6
8
10
2004 2005 2006 2007 2008 2009 2010 2011 Proj.
Non-energy output gap
Non-energy sector growth
...and the output gap remains negative.
-6
-4
-2
0
2
4
6
8
10
12
Unemployment rate 1/Employment growth rateLabor force growth rate
Labor Force and Employment Growth(In percent)
-20
-10
0
10
20
30
40
May
-04
Nov
-04
Ma y
-05
Nov
-05
May
-06
Nov
-06
Ma y
-07
Nov
-07
Ma y
-08
Nov
-08
May
-09
Nov
-09
Ma y
-10
Nov
-10
May
-11
Nov
-11
Banking Sytem
Financial System
Credit to Private Sector Growth(In percent, yoy)
…and private sector credit has begun to recover.
0
5
10
15
20
25
30
35
40
45
2004 2005 2006 2007 2008 2009 2010 2011 Proj.
Current account
Current account (2005 commodity prices)
Current Account Balance(In percent of GDP)
The current account remains strong...

2011 ARTICLE IV STAFF REPORT TRINIDAD AND TOBAGO
22 INTERNATIONAL MONETARY FUND
Figure 2. Trinidad and Tobago: Comparative Macroeconomic Performance 1/
Sources: Trinidad & Tobago authorities; IMF/WEO; and Fund staff calculations.
1/ TTO stands for Trinidad & Tobago, VEN for Venezuela, RUS for Russia, and GCC for Gulf Cooperation Council.
80
100
120
140
160
180
2004 2005 2006 2007 2008 2009 2010 2011 Proj.
Real GDP(index: 2002= 100)
TTO
VEN
RUS
GCC
0
20
40
60
80
100
120
0
5
10
15
20
25
30
35
40
45
50
2004 2005 2006 2007 2008 2009 2010 2011 Proj.
TTORUS
VEN
GCC
Current Account Balance(In percent of GDP)
Oil price(USD/bbl, right scale)
0
10
20
30
40
50
2004 2005 2006 2007 2008 2009 2010 2011 Proj.
TTO RUS
VEN GCC
Public Debt(In percent of GDP)
-70
-60
-50
-40
-30
-20
-10
0
10
20
2004 2005 2006 2007 2008 2009 2010 2011 Proj.
Non-Energy Balance(In percent of GDP)
TTORUS
VEN
GCC
Trinidad and Tobago's growth has lagged behind in recent years...
...while its non-energy balance has deteriorated broadly in line with most other energy exporters.
The current account is recovering more rapidly...
...and the rise in public debt has moderated in 2011.

TRINIDAD AND TOBAGO 2011 ARTICLE IV STAFF REPORT
INTERNATIONAL MONETARY FUND 23
Figure 3. Trinidad & Tobago: Monetary Developments
Sources: Trinidad & Tobago authorities; and Fund staff estimates.
0
5
10
15
20
25
30
-60
-40
-20
0
20
40
60
80
2005 2006 2007 2008 2009 2010 2011
Central Bank Balance Sheet (In TT$, billions)
Reserve money (RHS)
Official reserves
Net credit to public sector
0
2
4
6
8
10
12
14
16
18
Dec-05 Dec-06 Dec-07 Dec-08 Dec-09 Dec-10 Dec-11
Nominal Interest rates(In percent)
Repo
Prime Lending
Cash reserve requirement
3-month t-bill spread vs. US
Continued rapid growth in reserve money reflected the increase in excess reserves.
Credit to the private sector has started increasing... ...while banks remain very liquid.
...banks remain well capitalized and profitable.While asset quality and provisioning for NPLs have
been deteriorating...
The prime lending rate fell in line with the reduction in the policy repo rate.
0
20
40
60
80
100
120
140
0
1
2
3
4
5
6
7
8
9
10
NPLs to total loansProvisions to NPLs (RHS)
Non-Performing Loans(In percent)
0
5
10
15
20
25
30
35Capital adequacy ratio
Return on equity
Capital Adequacy(In percent)
-5
5
15
25
35
45
55
65
2005 2006 2007 2008 2009 2010 2011 Nov
Rest of financial systemCommercial banks
Credit to Private Sector (In TT$, billions)
10
12
14
16
18
20
22
24
26
28
0
1,000
2,000
3,000
4,000
5,000
6,000
Dec-05 Dec-06 Dec-07 Dec-08 Dec-09 Dec-10 Dec-11
Liquid assets to total assets (RHS)
Excess Reserves
Excess Reserves(In TT$, millions)

2011 ARTICLE IV STAFF REPORT TRINIDAD AND TOBAGO
24 INTERNATIONAL MONETARY FUND
Figure 4. Trinidad & Tobago: Fiscal Sector Developments 1/
Sources: Trinidad & Tobago Authorities; and Fund staff calculations.1/ Central government only unless otherwise specified. Panel 1 excludes PetroTrin and the National Gas Company.
-12
-7
-2
3
8
2006/07 2007/08 2008/09 2009/10 2010/11 2011/12
Overall balance Structural Primary Balance
Fiscal Balance (NFPS)(In TT$ bn)
0
5
10
15
20
25
30
35
40
45
50
2006/07 2007/08 2008/09 2009/10 2010/11 2011/12
Public debt
Heritage and Stabilization Fund Savings
Public Debt and Heritage and Stabilization Fund (In TT$ bn)
The fiscal stance has become supportive in 2010/11 and 2011/12. Revenue performance is strengthening...
...while expenditure has grown rapidly. The public debt is rising.
0
50
100
150
200
250
300
0
10
20
30
40
50
60
2006/07 2007/08 2008/09 2009/10 2010/11 2011/12
EnergyNon-energyCrude Oil price (2005=100, RHS)Natural Gas price (2005=100, RHS)
Revenue (In TT$ bn)
0
10
20
30
40
50
60
2006/07 2007/08 2008/09 2009/10 2010/11 2011/12
Wages and salaries Goods and services
Interest Transfers
Capital and net lending
Expenditure (In TT$ bn)

TRINIDAD AND TOBAGO 2011 ARTICLE IV STAFF REPORT
INTERNATIONAL MONETARY FUND 25
Figure 5. Trinidad & Tobago: External Sector Developments
Sources: Trinidad & Tobago authorities, Fund staff estimates.
-6
-4
-2
0
2
4
6
8
10
12
14
2004 2005 2006 2007 2008 2009 2010 2011 Proj.
Energy
Non-energy
CA balance
Trade balance
Current Account(In US$ Billions)
0
50
100
150
200
250
0
2
4
6
8
10
12
14
16
18
20
2004 2005 2006 2007 2008 2009 2010 2011 Proj.
OtherPetroleum and GasPetrochemicals
Exports of Goods(In US$ Billions)
Oil price (2005=100, RHS)
Gas price (2005=100, RHS)
-30
-20
-10
0
10
20
30
40
50
-6
-4
-2
0
2
4
6
8
10
2004 2005 2006 2007 2008 2009 2010 2011 Proj.
Non-energy
Energy
Import Prices (Percentage Change)
Imports of Goods(In US$ Billions)
-12
-10
-8
-6
-4
-2
0
2
2004 2005 2006 2007 2008 2009 2010 2011 Proj.
Banks and FDI
Official, change in assets and SDR
Other private capital
Financial account balance
Financial Account(In US$ Billions)
The current account surplus continued its recovery in 2011...
...together with exports, reflecting stronger fuel prices.
After a steep fall, imports are recovering...
...and financial outflows increased.
0
2
4
6
8
10
12
14
16
18
0
1
2
3
4
5
6
7
8
9
10
2004 2005 2006 2007 2008 2009 2010 2011 Proj.
NIR (billions of USD)
NIR in months of imports (RHS)
Reserves increased moderately...
0
2
4
6
8
10
12
14
16
18
20
-
0.5
1.0
1.5
2.0
2.5
3.0
3.5
4.0
4.5
2004 2005 2006 2007 2008 2009 2010 2011 Proj.
External debt (bln USD)
HSF (bln USD)
External debt (% GDP, RHS)
HSF (% GDP, RHS)
...and the net foreign asset position is improving.
2011 ARTICLE IV STAFF REPORT TRINIDAD AND TOBAGO
26 INTERNATIONAL MONETARY FUND
Growth shock
69
Baseline48
0
10
20
30
40
50
60
70
80
90
2007 2009 2011 2013 2015 2017
Growth shock (in percent per year)
PB shock
60
Baseline
48
45
0
10
20
30
40
50
60
70
2007 2009 2011 2013 2015 2017
i-rate shock
59
Baseline48
0
10
20
30
40
50
60
70
80
90
2007 2009 2011 2013 2015 2017
Interest rate shock (in percent)
Figure 6. Trinidad and Tobago: Public Debt Sustainability 1/ 2/ (Public debt in percent of GDP)
Sources: International Monetary Fund, country desk data, and staff estimates.1/ Shaded areas represent actual data. Individual shocks are permanent one-half standard deviation shocks. Figures in the boxes represent average projections for the respective variables in the baseline and scenario being presented. Ten-year historical average for the variable is also shown.2/ For historical scenarios, the historical averages are calculated over the ten-year period, and the information is used to project debt dynamics five years ahead.3/ Permanent 1/4 standard deviation shocks applied to real interest rate, growth rate, and primary balance.4/ One-time real depreciation of 30 percent and 10 percent of GDP shock to contingent liabilities occur in 2010, with real depreciation defined as nominal depreciation (measured by percentage fall in dollar value of local currency) minus domestic inflation (based on GDP deflator).
Historical20
Baseline
48
-15
-10
-5
0
5
10
15
20
25
0
10
20
30
40
50
60
70
80
90
2007 2009 2011 2013 2015 2017
Baseline and historical scenarios
63
Baseline
48
0
10
20
30
40
50
60
70
80
90
2007 2009 2011 2013 2015 2017
Combined shock 3/
Combined Shock
52
Baseline
48
57
0
10
20
30
40
50
60
70
80
90
2007 2009 2011 2013 2015 2017
Contingent liabilities shock
30% Depreciation
Real depreciation and contingent liabilities shocks 4/
Gross financing need under baseline(right scale)
Primary balance shock (in percent of GDP) andno policy change scenario (constant primary balance)
No policy change
Baseline: -1.3Scenario: -3.7Historical: 3.6
Baseline: 2.4Scenario: -0.2Historical: 5.4
Baseline: 1.4Scenario: 6.8Historical: 2.2

TRINIDAD AND TOBAGO 2011 ARTICLE IV STAFF REPORT
INTERNATIONAL MONETARY FUND 27
GDP per capita (U.S. dollars, 2010) 15,931 Adult literacy rate (2010) 98.7Population (millions, 2010 est.) 1.3 Gini index (2010) 40.3Life expectancy at birth (years, 2011) 70 Unemployment rate (2011Q2) 5.8Under 5 mortality rate (per thousand, 2009) 35 HDI Ranking (2011, of 187 countries) 62
Est.2007 2008 2009 2010 2011 2012
Output and pricesReal GDP 4.8 2.7 -3.3 0.0 -1.3 1.7
Energy 1.7 -0.3 2.5 2.0 -2.5 1.0Non-energy 1/ 7.0 4.8 -7.1 -1.5 -0.4 2.3
GDP deflator 12.8 24.5 -26.6 6.9 10.2 6.6Consumer prices (headline)
End-of-period 7.6 14.5 1.3 13.4 5.3 4.0Average 7.9 12.0 7.0 10.5 5.1 5.4
Unemployment rate 2/ 5.6 4.6 5.3 5.9 5.8 ...Real effective exchange rate (2005=100) 3/ 106.6 113.6 123.7 130.7 128.2 ...
Nonfinancial public sector (NFPS) 4/Central government overall balance, excluding CLICO support 4.0 7.3 -5.5 0.1 -0.1 -2.5
CLICO support 5/ … … -1.4 -2.6 -0.6 -3.3Of which: non-energy balance 6/ -14.7 -13.4 -19.6 -17.6 -19.6 -20.5Budgetary revenue 30.4 34.3 28.2 33.5 33.2 32.6Budgetary expenditure 26.4 27.0 33.7 33.4 33.3 35.1
Of which : interest expenditure 2.0 1.8 2.6 2.5 1.9 2.2Of which : capital expenditure 5.9 5.8 6.2 4.9 4.5 5.0
Overall statutory bodies balance 0.3 -0.3 0.0 0.6 0.5 0.4Overall public enterprises balance -0.7 1.0 -3.4 -4.5 -0.1 -0.8Overall NFPS balance 3.6 8.0 -8.9 -3.8 0.3 -2.9Overall NFPS balance including CLICO 3.6 8.0 -10.3 -6.4 -0.3 -6.2Central government debt 7/ 16.2 14.4 15.3 18.6 17.3 21.8Gross NFPS debt 7/ 28.9 24.9 30.8 35.9 32.4 37.3Heritage and Stabilization Fund 8.5 11.0 13.6 17.4 18.2 17.6
External sectorCurrent account balance 24.8 30.6 8.2 19.9 21.2 20.0
Of whichExports of goods 61.9 67.0 46.7 53.7 60.8 57.2Imports of goods 35.4 34.5 35.5 31.2 37.5 35.1
External public sector debt 6.1 5.3 7.6 6.8 6.8 7.4Gross official reserves (in US$ million) 6,674 9,380 8,652 9,070 9,823 10,028
In months of goods and NFS imports 10.0 11.3 14.1 15.8 13.4 13.5In percent of M3 108.9 134.3 96.1 102.1 102.7 104.4
Money and creditNet foreign assets 29.7 67.6 -2.2 6.0 14.8 4.3Net domestic assets -22.3 -53.1 30.3 -6.2 -7.2 -3.9
Of which: credit to the private sector 17.6 12.6 -4.0 0.3 3.9 4.6Broad money (M3) 7.4 14.4 28.1 -0.2 7.7 0.4M3 velocity 3.5 4.0 2.2 2.3 2.4 2.6
Memorandum items:Nominal GDP (in billions of TT$) 137.0 175.3 124.4 133.0 144.6 156.8Public expenditure (in percent of non-energy GDP) 52.6 54.7 54.7 57.9 60.1 63.4Exchange rate (TT$/US$, end of period)/ 6.31 6.34 6.30 6.42 6.40 ...Crude oil price (US$/barrel) 71.1 97.0 61.8 79.0 103.9 105.7Natural gas price (US$ per mmbtu) 8/ 7.0 8.9 4.2 4.9 6.5 6.6
Sources: Trinidad and Tobago authorities; UN Human Development Report, WEO, and Fund staff estimates and projections.
1/ Includes VAT and Financial Intermediation Services Indirectly Measured (FISIM).2/ For 2011, as of Q2.3/ For 2011, as of end-October.4/ The data refer to fiscal year October-September. 5/ In 2011/12, assumes half of CLICO claims are swapped for government equity in Republic Bank. 6/ Defined as non-energy revenue minus expenditure of the central government.
8/ Before 2009, Henry Hub price in Louisiana. From 2009, the average of Henry Hub and Asian LNG prices.7/ Excluding debt issued for sterilization. Does not include arrears on the fuel subsidy in 2011/12.
Proj.
Table 1. Trinidad and Tobago: Selected Economic Indicators
(In percent of GDP, unless otherwise indicated)
(Percentage changes in relation to beginning-of-period M3)
(Annual percentage changes, unless otherwise indicated)
(In percent of fiscal year GDP, unless otherwise indicated)
II. Selected Economic and Financial Indicators
I. Social and Demographic Indicators

2011 ARTICLE IV STAFF REPORT TRINIDAD AND TOBAGO
28 INTERNATIONAL MONETARY FUND
Prel.2006 2007 2008 2009 2010 2011 2012 2013 2014 2015 2016 2017
Current account balance 7,271 5,364 8,518 1,614 4,146 4,811 4,914 4,845 4,684 4,469 4,046 3,576
Trade balance 7,700 5,721 9,064 2,202 4,701 5,308 5,435 5,381 5,213 4,994 4,610 4,177
Exports 14,217 13,391 18,686 9,175 11,205 13,814 14,087 14,388 14,471 14,552 14,675 14,858Petroleum crude and refined 5,961 3,891 7,211 3,114 4,820 5,129 5,263 5,153 4,978 4,866 4,803 4,775Natural gas 4,870 4,987 5,864 3,845 2,069 3,654 3,753 3,998 4,138 4,232 4,326 4,429Petrochemicals 2,124 2,763 3,407 880 2,392 2,771 3,034 3,140 3,180 3,204 3,240 3,288Other 1,262 1,751 2,204 1,336 1,924 2,259 2,037 2,097 2,175 2,251 2,307 2,366
Imports 6,517 7,670 9,622 6,973 6,504 8,505 8,652 9,007 9,258 9,558 10,065 10,682Fuel imports 2,282 2,569 4,130 2,843 2,665 3,906 3,739 3,742 3,694 3,690 3,722 3,782Capital 1,741 1,919 2,322 1,924 1,686 2,286 2,451 2,565 2,681 2,660 2,780 2,913Other 2,494 3,182 3,170 2,206 2,153 2,313 2,462 2,700 2,882 3,207 3,563 3,987
Services and transfers (net) -429 -357 -546 -588 -555 -498 -520 -536 -529 -526 -564 -601Nonfactor services (net) 451 546 609 382 488 350 343 335 328 319 288 257
Receipts 814 924 936 765 889 638 638 638 641 643 623 604Payments 363 378 327 383 401 288 294 303 313 324 335 346
Factor income (net) -936 -964 -1,202 -997 -1,072 -878 -894 -902 -888 -877 -885 -892Heritage and Stabilization Fund 23 267 310 132 155 178 190 198 207 217 212 215Other -959 -1,231 -1,512 -1,129 -1,227 -1,056 -1,084 -1,100 -1,096 -1,093 -1,097 -1,106
Current transfers (net) 56 61 47 27 29 30 30 31 31 32 33 33
Capital and financial account (net) 1/ -6,152 -4,149 -5,813 -2,327 -3,728 -4,058 -4,709 -4,399 -4,391 -4,120 -3,463 -2,869
Official, medium- and long-term (net) -65 148 115 -50 178 237 292 347 434 529 639 670Disbursements 182 210 181 290 250 356 397 447 540 631 739 767Amortization -247 -62 -66 -340 -72 -119 -106 -99 -106 -102 -100 -98
Change in assets, including HSF -526 -392 -1,108 -101 -472 -451 0 0 0 0 0 0Direct investment (net) 513 830 2,100 709 549 685 782 823 864 904 945 988
Inward 883 830 2,800 709 549 685 782 823 864 904 945 988Outward 370 0 700 0 0 0 0 0 0 0 0 0
Commercial banks (net) -742 88 -353 -675 493 -702 -697 -695 -695 -694 -693 -694Regional bond issues -200 -252 -82 -120 0 -114 -79 -78 -68 -85 -77 -77Other private sector capital (net) 1/ -5,132 -4,571 -6,485 -2,090 -4,476 -3,713 -5,007 -4,795 -4,927 -4,774 -4,276 -3,756
Of which: net errors and omissions -603 -326 -492 234 0 0 0 0 0 0 0 0
Overall balance 1,119 1,541 2,705 -713 418 753 205 446 293 349 583 707
Change in gross official reserves (increase -) -1,119 -1,541 -2,705 713 -418 -753 -205 -446 -293 -349 -583 -707
Memorandum items:Current account balance 39.6 24.8 30.6 8.2 19.9 21.2 20.0 18.1 16.3 14.4 12.1 9.9
Energy 2/ 58.1 41.9 44.3 25.4 31.7 33.7 33.8 31.9 29.9 27.8 25.9 24.2Exports of goods 77.4 61.9 67.0 46.7 53.7 60.8 57.2 53.7 50.2 46.9 44.0 41.3Imports of goods 35.5 35.4 34.5 35.5 31.2 37.5 35.1 33.6 32.1 30.8 30.2 29.7Gross international reserves 3/ 5,120 6,674 9,380 8,652 9,070 9,823 10,028 10,474 10,767 11,117 11,700 12,407
In months of goods and NFS imports 8.9 10.0 11.3 14.1 15.8 13.4 13.5 13.5 13.5 13.5 13.5 13.5Heritage and Stabilization Fund 3/ 1,485 2,044 2,899 3,088 3,679 4,078 4,263 4,457 4,660 4,872 5,094 5,208Crude oil price (US$/barrel) 4/ 64.3 71.1 97.0 61.8 79.0 103.9 105.7 102.4 98.0 94.8 92.7 91.2Natural gas price (US$ per mmbtu) 5/ 6.7 7.0 8.9 4.2 4.9 6.5 6.6 7.0 7.1 7.3 7.4 7.5Central government external debt (in millions of US$) 1,258 1,313 1,488 1,494 1,415 1,549 1,833 2,118 2,485 2,941 3,498 3,822GDP (in billions of US$) 18.4 21.6 27.9 19.7 20.9 22.7 24.6 26.8 28.8 31.0 33.4 36.0Real GDP growth (in percent) 13.2 4.8 2.8 -3.3 0.0 -1.3 1.7 2.4 2.5 2.5 2.5 2.6
Sources: Central Bank of Trinidad and Tobago, Central Statistical Office and Fund staff estimates and projections.
1/ Includes net errors and omissions. 2/ Consists of petroleum, natural gas and petrochemical exports less fuel imports. 3/ In millions of US$, end of period. 4/ WEO simple average of three spot prices: Dated Brent, West Texas Intermediate, and Dubai Fateh. 5/ Before 2009, Henry Hub price in Louisiana. From 2009, the average of Henry Hub and Asian LNG prices.
(In millions of U.S. dollars unless otherwise indicated)
(In percent of GDP, unless otherwise specified)
Table 2. Trinidad and Tobago: Summary Balance of Payments
Projections

TRINIDAD AND TOBAGO 2011 ARTICLE IV STAFF REPORT
INTERNATIONAL MONETARY FUND 29
2005/06 2006/07 2007/08 2008/09 2009/10 2010/11 Budget Proj.
Revenue 38,911 40,064 56,848 38,611 43,863 46,972 46,960 50,057Energy 25,503 24,605 34,364 19,312 23,126 27,514 24,771 27,638Non-energy 13,408 15,460 22,484 19,298 20,737 19,459 22,189 22,419
Expenditure 31,198 34,773 44,715 46,153 43,705 47,164 54,600 53,919Current 26,602 27,011 35,106 37,646 37,347 40,729 46,986 46,305
Wages and salaries 5,456 6,221 6,947 6,657 6,711 7,205 8,482 8,482Goods and services 3,811 4,284 5,002 6,001 6,441 6,496 9,092 9,092Interest payments 2,453 2,698 2,967 3,521 3,290 2,685 4,129 3,413Transfers and subsidies 14,882 13,808 20,190 21,466 20,904 24,342 25,318 25,318
Capital expenditure and net lending 4,596 7,762 9,609 8,507 6,358 6,435 7,614 7,614
Non-energy balance -17,790 -19,313 -22,231 -26,854 -22,968 -27,705 -32,411 -31,500Overall balance 7,713 5,291 12,133 -7,542 158 -191 -7,640 -3,862CLICO financial support 1,900 3,400 848 … 5,100Overall balance including CLICO -9,442 -3,242 -1,039 -7,640 -8,962Total financing including CLICO -7,713 -5,291 -12,133 9,442 3,242 1,039 7,640 8,962Foreign financing -306 690 702 33 -1,056 51 3,667 1,854Domestic financing -7,407 -5,982 -12,835 9,409 4,297 988 3,973 7,108
Transfers to Heritage and Stabilization Fund -3,160 -2,030 -6,588 0 -3,027 -2,890 … …Implied financing need (residual) -4,247 -3,951 -6,247 9,409 7,324 3,878 … …
Revenue 34.7 30.4 34.3 28.2 33.5 33.2 30.2 32.6Energy 22.7 18.7 20.7 14.1 17.7 19.4 15.9 18.0Non-energy 12.0 11.7 13.6 14.1 15.9 13.7 14.3 14.6
Expenditure 27.8 26.4 27.0 33.7 33.4 33.3 35.1 35.1Current 23.7 20.5 21.2 27.5 28.6 28.7 30.2 30.1
Wages and salaries 4.9 4.7 4.2 4.9 5.1 5.1 5.5 5.5Goods and services 3.4 3.3 3.0 4.4 4.9 4.6 5.9 5.9Interest payments 2.2 2.0 1.8 2.6 2.5 1.9 2.7 2.2Transfers and subsidies 13.3 10.5 12.2 15.7 16.0 17.2 16.3 16.5
Capital expenditure and net lending 4.1 5.9 5.8 6.2 4.9 4.5 4.9 5.0
Non-energy balance -15.9 -14.7 -13.4 -19.6 -17.6 -19.6 -20.9 -20.5Non-energy balance in percent of non-energy GDP -29.8 -26.9 -26.6 -33.5 -30.4 -35.3 -38.6 -37.5
CLICO financial support 1.4 2.6 0.6 … 3.3Overall balance 6.9 4.0 7.3 -5.5 0.1 -0.1 -4.9 -2.5Overall balance including CLICO -6.9 -2.5 -0.7 -4.9 -5.8
Memorandum items:Central government debt (in percent of GDP) 2/ 17.2 16.2 14.4 15.3 18.6 17.3 … 21.8Gross NFPS Public sector debt (in percent of GDP) 2/ 32.6 28.9 24.9 30.8 35.9 32.4 … 37.3Net public sector debtCrude oil price (US$/barrel) 3/ 63.4 64.0 104.9 56.9 76.5 99.6 … 105.1Natural gas (US$ per mmbtu, Henry Hub) 3/ 7.3 6.9 8.4 5.3 4.9 6.0 … 6.6Budget oil price (US$/barrel) 44.9 45.0 50.0 55.0 55.0 … 75.0 …Budget natural gas price (US$ per mmbtu, netback) … … … 3.3 2.8 … 2.8 …Nominal GDP (in billions of TT$, FY) 112.1 131.7 165.7 137.1 130.8 141.7 155.4 153.8
Sources: Trinidad and Tobago authorities; and Fund staff estimates and projections.
1/ Fiscal year data from October to September.
3/ Before 2009, Henry Hub price in Louisiana. From 2009, the average of Henry Hub and Asian LNG prices.2/ Excluding debt issued for sterilization. Does not include arrears on the fuel subsidy in 2011/12.
(In percent of GDP)
Table 3. Trinidad and Tobago: Summary of the Central Government Operations 1/
2011/12
(In millions of Trinidad and Tobago dollars)

2011 ARTICLE IV STAFF REPORT TRINIDAD AND TOBAGO
30 INTERNATIONAL MONETARY FUND
2005/06 2006/07 2007/08 2008/09 2009/10 2010/11 2011/12
Current balance 13.0 11.4 16.2 1.6 4.4 6.3 4.7Capital revenue and transfers 4.3 3.7 3.0 3.2 3.1 3.6 3.2Capital expenditure and net lending 11.1 11.5 11.2 13.6 11.3 9.6 10.8
Overall balance 6.1 3.6 8.0 -8.9 -3.8 0.3 -2.9Overall balance including CLICO 6.1 3.6 8.0 -10.3 -6.4 -0.3 -6.2
Public sector debt 1/ 32.6 28.9 24.9 30.8 35.9 32.4 37.3
Current balance 11.0 9.9 13.1 0.7 5.0 4.2 2.2Current revenue 34.7 30.4 34.3 28.2 33.5 32.9 32.3Current expenditure 23.7 20.5 21.2 27.5 28.6 28.7 30.1
Capital revenue and grants 0.0 0.0 0.0 0.0 0.0 0.2 0.2Capital expenditure and net lending 4.1 5.9 5.8 6.2 4.9 4.5 5.0
Non-energy balance -15.9 -14.7 -13.4 -19.6 -17.6 -19.6 -20.5
Overall balance 6.9 4.0 7.3 -5.5 0.1 -0.1 -2.5Overall balance including CLICO 6.9 4.0 7.3 -6.9 -2.5 -0.7 -5.8
Central government debt 1/ 17.2 16.2 14.4 15.3 18.6 17.3 21.8
Current balance -0.6 -0.8 -0.8 -0.8 -0.9 -1.1 -0.9Current revenue 2.3 2.3 2.1 2.6 3.0 2.8 2.8Current expenditure 2.9 3.1 2.9 3.4 3.8 3.9 3.7
Capital revenue and transfers 1.9 1.6 1.3 1.7 2.1 2.0 1.8Capital expenditure and net lending 0.4 0.5 0.8 0.9 0.5 0.4 0.4
Overall balance 1.0 0.3 -0.3 0.0 0.6 0.5 0.4
Debt 3/ 7.5 6.9 6.1 7.6 7.6 7.9 7.8
Current balance 2.6 2.3 3.9 1.7 0.4 3.2 3.4Current revenue 38.6 33.5 38.7 29.9 32.6 41.6 41.7Current expenditure 36.1 31.2 34.8 28.3 32.2 38.4 38.2
Capital revenue and transfers 2.4 2.1 1.7 1.5 1.0 1.4 1.2Capital expenditure and net lending 6.7 5.1 4.7 6.5 5.9 4.6 5.4
Overall balance -1.7 -0.7 1.0 -3.4 -4.5 -0.1 -0.8
Debt 3/ 7.9 5.8 4.4 7.8 9.6 7.1 7.4
Memorandum item:Nominal GDP (in TT$ billion, FY) 112.1 131.7 165.7 137.1 130.8 141.7 153.8
Sources: Trinidad and Tobago authorities; and Fund staff estimates and projections.
1/ Refers to gross debt, including BOLT and leases.2/ Includes the Public Transport Company, Electricity Company, Water Authority, Airport Authority and Port Authority.3/ Refers to gross debt, and includes government guaranteed debt and letters of comfort.4/ Includes CARONI, MTS, NFM, NHSL, NPMC, NQCL, NGC, PETROTRIN, PLIPDECO, SWMCOL, TTMF, TTST, and UDECOTT.Excludes Caribbean Airlines.
IV. Public Enterprises 4/
I. Nonfinancial Public Sector
II. Central Government
III. Statutory Bodies 2/
Table 4. Trinidad and Tobago: Consolidated Nonfinancial Public Sector (In percent of GDP)

TRINIDAD AND TOBAGO 2011 ARTICLE IV STAFF REPORT
INTERNATIONAL MONETARY FUND 31
2006 2007 2008 2009 2010 2011 2012
(In millions of Trinidad and Tobago dollars)
Net foreign assets 48,925 59,617 85,772 84,808 88,192 96,599 99,199Official net foreign assets 40,777 53,084 76,606 71,252 77,682 85,453 87,942Commercial banks net foreign assets 8,149 6,534 9,166 13,556 10,511 11,146 11,257
Net domestic assets -12,881 -20,917 -41,484 -28,069 -31,579 -35,639 -37,987Net credit to public sector -26,545 -35,029 -54,278 -38,383 -36,863 -41,144 -42,683
Central government -24,603 -32,257 -49,984 -35,086 -36,728 -41,004 -42,542Rest of the public sector -1,942 -2,771 -4,294 -3,297 -135 -140 -141
Of whichStatutory bodies and public utilities -689 -443 -518 -711 -815 -849 -857Public enterprises -907 -2,155 -3,422 -2,286 1,160 1,208 1,220
Credit to private sector 29,225 35,574 40,452 38,689 38,887 41,079 43,863Other items (net) -15,561 -21,462 -27,659 -28,375 -33,603 -35,573 -39,167
Liabilities to private sector (M3) 36,044 38,700 44,288 56,739 56,613 60,960 61,212Currency in circulation 2,654 3,183 3,434 3,850 4,242 4,888 4,908Demand deposits 9,943 10,622 12,722 15,339 15,297 17,855 17,929Time deposits 5,832 6,360 7,901 10,695 9,760 10,347 10,390Savings deposits 15,220 16,856 19,051 25,689 27,227 32,363 32,497Fund-raising instruments 1/ 2,395 1,680 1,180 1,167 87 84 84
(Changes in percent of beginning-of-period M3)
Net foreign assets 52.6 29.7 67.6 -2.2 6.0 14.8 4.3
Net domestic assets -34.9 -22.3 -53.1 30.3 -6.2 -7.2 -3.9Net credit to public sector -33.5 -23.5 -49.7 35.9 2.7 -7.6 -2.5
Of which : central government -25.0 -21.2 -45.8 33.6 -2.9 -7.6 -2.5Credit to private sector 14.9 17.6 12.6 -4.0 0.3 3.9 4.6
Other items (net) -16.3 -16.4 -16.0 -1.6 -9.2 -3.5 -5.9
Liabilities to private sector (M3) 17.7 7.4 14.4 28.1 -0.2 7.7 0.4
Memorandum items:Credit to private sector (12-month increase) 18.5 21.7 13.7 -4.4 0.5 5.6 6.8M3 Velocity 3.2 3.5 4.0 2.2 2.3 2.4 2.6
Source: Central Bank of Trinidad and Tobago.1/ Include investment note certificates, secured commercial paper, and other asset-backed instruments.
Projections
Table 5. Trinidad and Tobago: Monetary Survey

2011 ARTICLE IV STAFF REPORT TRINIDAD AND TOBAGO
32 INTERNATIONAL MONETARY FUND
Proj.
2006 2007 2008 2009 2010 2011
External indicatorsExports (percent change, 12-month basis in US$) 47.0 -5.8 39.5 -50.9 22.1 23.3Imports (percent change, 12-month basis in US$) 13.8 17.7 25.4 -27.5 -6.7 30.8Terms of trade (WEO, percent change) -1.9 -0.9 -0.9 1.9 -1.7 -1.2Current account balance (in percent of GDP) 39.6 24.8 30.6 8.2 19.9 21.2Capital and financial account balance (in percent of GDP) -33.5 -17.7 -20.9 -11.8 -17.9 -17.9
Gross official reserves (in US$ millions) 5,120 6,674 9,380 8,652 9,070 9,823Official reserves in months of goods and NFS imports 8.9 10.0 11.3 14.1 15.8 13.4Ratio of reserves to broad money 89.6 108.9 134.3 96.1 100.9 101.5
Ratio of total public sector external debt to exports of goods and services 8.4 9.2 7.6 15.0 11.7 10.7
Ratio of public sector external interest payments to exports of goods and services 0.6 0.7 0.5 0.8 0.5 0.6
Public sector debt service to exports of goods and services 2.3 1.1 0.9 4.2 1.1 1.4
REER appreciation CPI-based (percent change) 3.9 2.6 6.6 8.9 5.6 …
Foreign currency debt rating, (Moody's, end of period) Baa1 Baa1 Baa1 Baa1 Baa1 Baa1Foreign currency debt rating, (Standard & Poor's, end of period) A- A- A A A A
Financial indicators 1/90-day treasury bill, average discount rate 6.1 6.9 7.0 2.7 0.8 0.690-day treasury bill, real rate -2.2 -1.0 -5.0 -4.5 -9.7 -6.7Foreign currency loans-to-total loans 22.9 21.4 23.0 22.8 18.7 19.6Net open position in foreign exchange-to-capital -3.5 -12.1 0.5 5.3 2.2 …Foreign exchange deposits (in percent of total deposits) 25.8 25.9 29.4 31.6 26.7 26.0Foreign exchange deposits (in percent of gross international reserves) 35.1 30.4 28.6 42.1 33.1 30.5Capital adequacy Regulatory capital to risk-weighted assets 18.0 19.1 18.8 20.5 24.2 24.8 Regulatory Tier I capital to risk-weighted assets 16.2 17.0 15.5 18.5 21.7 22.1 Regulatory Tier II capital-to-risk-weighted assets 1.9 2.1 3.2 2.0 2.5 2.7Banking sector asset quality Nonperforming loans-to-gross loans 1.4 0.7 1.0 4.6 6.8 6.4 Nonperforming loans (net of provisions)-to-capital 2.3 -0.3 1.1 7.8 15.5 15.4 Specific provisions-to-impaired assets 60.9 109.7 72.4 52.3 30.0 27.7 Specific provisions-to-gross lending 0.8 0.8 0.7 2.4 2.1 1.8Banking sector earnings and profitability Return on equity 27.7 27.3 25.9 20.2 17.2 16.8 Return on assets 3.4 3.4 3.5 2.7 2.3 2.3 Interest margin-to-gross income 61.7 61.4 65.2 66.6 67.0 64.7 Spread between average lending and deposit rates 7.4 7.9 8.3 10.1 9.1 8.2Banking sector liquidity Liquid assets-to-total assets 20.1 17.0 22.1 25.0 24.3 25.8 Liquid assets-to-total short-term liabilities 26.9 22.6 30.0 32.5 31.9 34.1 Foreign currency liabilities-to-total liabilities 34.6 33.8 32.7 33.1 27.5 27.4
Sources: Central Bank of Trinidad and Tobago, Standard and Poor's, Trinidad and Tobago Stock Exchange; and Fund staff estimates and projections.
1/ For commercial banks only. The 2011 data refer to November 2011 with the exception of banking sector profitability and earnings (September 2011).
Table 6. Trinidad and Tobago: Indicators of External and Financial Vulnerability(In percent, unless otherwise indicated)

Projections2007 2008 2009 2010 2011 2012 2013 2014 2015 2016 2017 Debt-stabilizing
primarybalance 9/
Baseline: Public sector debt 1/ 28.9 24.9 30.8 35.9 32.4 37.3 38.6 40.5 42.9 45.4 47.7 -0.2o/w foreign-currency denominated 6.3 5.8 7.3 7.0 6.8 7.5 7.9 8.6 9.4 10.4 11.5
Change in public sector debt -3.7 -4.0 5.9 5.1 -3.5 5.0 1.3 1.8 2.4 2.6 2.3Identified debt-creating flows (4+7+12) -8.5 -14.0 14.1 5.3 -3.1 0.4 0.1 0.6 1.0 0.8 1.8
Primary deficit -5.7 -9.8 6.3 1.3 -2.2 0.7 0.8 1.1 1.4 1.2 1.9Revenue and grants 33.2 38.9 30.3 34.0 36.6 36.1 35.4 34.8 34.2 34.1 33.1Primary (noninterest) expenditure 27.5 29.0 36.6 35.3 34.4 36.8 36.3 35.9 35.5 35.3 35.0
Automatic debt dynamics 2/ -2.8 -4.2 7.8 4.0 -0.9 -0.3 -0.7 -0.5 -0.4 -0.4 -0.2Contribution from interest rate/growth differential 3/ -2.8 -4.1 7.8 4.0 -0.9 -0.3 -0.7 -0.5 -0.4 -0.4 -0.2
Of which contribution from real interest rate -0.9 -3.4 7.2 3.7 -1.2 0.0 0.0 0.4 0.5 0.6 0.9Of which contribution from real GDP growth -1.9 -0.7 0.5 0.3 0.3 -0.3 -0.8 -0.9 -0.9 -1.0 -1.1
Contribution from exchange rate depreciation 4/ 0.0 0.0 0.0 0.0 0.0 ... ... ... ... ... ...Other identified debt-creating flows 0.0 0.0 0.0 0.0 0.0 0.0 0.0 0.0 0.0 0.0 0.0
Privatization receipts (negative) 0.0 0.0 0.0 0.0 0.0 0.0 0.0 0.0 0.0 0.0 0.0Recognition of implicit or contingent liabilities 0.0 0.0 0.0 0.0 0.0 0.0 0.0 0.0 0.0 0.0 0.0Other (specify, e.g. bank recapitalization) 0.0 0.0 0.0 0.0 0.0 0.0 0.0 0.0 0.0 0.0 0.0
Residual, including asset changes (2-3) 5/ 4.8 10.0 -8.2 -0.2 -0.5 4.6 1.2 1.2 1.5 1.8 0.5
Public sector debt-to-revenue ratio 1/ 86.8 64.0 101.8 105.4 88.3 103.5 109.0 116.3 125.5 133.2 144.1
Gross financing need 6/ -1.7 -7.0 10.0 6.2 1.1 4.2 4.2 4.5 4.9 4.8 5.9in billions of U.S. dollars -0.4 -1.8 2.2 1.3 0.2 1.0 1.1 1.3 1.5 1.6 2.1
Scenario with key variables at their historical averages 7/ 37.3 33.7 30.2 27.0 24.2 20.2 -0.6Scenario with no policy change (constant primary balance) in 2012-2017 37.3 38.5 39.9 41.7 43.8 44.8 -0.1
Key Macroeconomic and Fiscal Assumptions Underlying Baseline
Real GDP growth (in percent) 6.7 3.2 -1.8 -0.9 -1.0 1.0 2.2 2.4 2.5 2.5 2.6Average nominal interest rate on public debt (in percent) 8/ 7.4 7.8 8.5 7.8 5.7 7.4 6.5 6.5 6.6 6.7 7.4Average real interest rate (nominal rate minus change in GDP deflator, in percent) -2.7 -14.1 24.3 11.5 -3.7 0.0 0.2 1.2 1.5 1.7 2.4Nominal appreciation (increase in US dollar value of local currency, in percent) -0.2 0.4 0.0 0.0 0.0 ... ... ... ... ... ...Inflation rate (GDP deflator, in percent) 10.1 21.9 -15.7 -3.7 9.4 7.5 6.3 5.3 5.1 5.0 5.0Growth of real primary spending (deflated by GDP deflator, in percent) -1.9 8.9 23.9 -4.4 -3.4 7.7 0.8 1.3 1.5 1.7 1.9Primary deficit -5.7 -9.8 6.3 1.3 -2.2 0.7 0.8 1.1 1.4 1.2 1.9
1/ Nonfinancial public sector debt. Excluding debt issued for sterilization. Does not include arrears on the fuel subsidy in 2011/12. 2/ Derived as [(r - p(1+g) - g + ae(1+r)]/(1+g+p+gp)) times previous period debt ratio, with r = interest rate; p = growth rate of GDP deflator; g = real GDP growth rate; a = share of foreign-currency denominated debt; and e = nominal exchange rate depreciation (measured by increase in local currency value of U.S. dollar).3/ The real interest rate contribution is derived from the denominator in footnote 2/ as r - π (1+g) and the real growth contribution as -g.4/ The exchange rate contribution is derived from the numerator in footnote 2/ as ae(1+r). 5/ For projections, this line includes exchange rate changes.6/ Defined as public sector deficit, plus amortization of medium and long-term public sector debt, plus short-term debt at end of previous period. 7/ The key variables include real GDP growth; real interest rate; and primary balance in percent of GDP.8/ Derived as nominal interest expenditure divided by previous period debt stock.9/ Assumes that key variables (real GDP growth, real interest rate, and other identified debt-creating flows) remain at the level of the last projection year.
Actual
Table 7. Trinidad and Tobago: Public Sector Debt Sustainability Framework, 2007-2017(In percent of GDP, unless otherwise indicated)
2011A
RTIC
LEIV
STAFF
REPO
RT
TRIN
IDA
DA
ND
TOB
AG
O
33 IN
TERNATIO
NAL M
ON
ETARY FUN
D

34 INTERNATIONAL MONETARY FUND
APPENDIX I. EXTERNAL STABILITY ASSESSMENT Trinidad and Tobago’s external position remains strong given a large current account surplus and a high level of international reserves. The exchange rate is broadly in line with fundamentals, but the external sustainability approach, which takes into account the temporary nature of non-renewable energy income, suggests a need for exchange rate flexibility over the medium term to help rebalance the economy towards the non-energy sector. The high dependency on energy exports and the high exposure to energy price fluctuations are external vulnerabilities. Over the longer term, there is uncertainty in natural gas prices in light of growing competition from shale gas extraction in the United States and elsewhere.
1. Trinidad and Tobago’s external position remains strong given a large current account surplus and a high level of international reserves. The current account surplus is projected to be 21 percent of GDP in 2011, reflecting strong fuel prices and a recovery in non-energy sector exports. The gross official reserves amounted to US$ 9.8 billion at the end of December 2011, which represents 13 months of imports of goods and services.
2. The real exchange rate has appreciated reflecting high inflation. The REER has appreciated by 32 percent since 2005, mainly reflecting the high inflation rates in 2008 and 2010. The nominal effective exchange rate (NEER) closely followed the REER trend until 2005, when it began to
diverge owing to higher inflation.
3. The equilibrium real exchange rate approach suggests that REER lies in the confidence interval (10 percent) of the predicted equilibrium rate over the medium term. The equilibrium rates are estimated in a regression model tailored to oil exporting countries.1 Among explanatory variables, commodity terms of trade contribute the most to the estimated equilibrium rate. Over the medium term, the REER is projected to remain in line with its fundamentals.
1 Bems and Carvalho Filho (2009) “Exchange Rate Assessments: Methodologies for Oil Exporting Countries,” IMF WP/09/281. The regression is based on annual data of 17 oil producing countries, including Trinidad and Tobago, from 1980 to 2007. 80
90
100
110
120
130
140
80
90
100
110
120
130
140
Jan-00 Jan-02 Jan-04 Jan-06 Jan-08 Jan-10
Real and Nominal Effective Exchange Rates(Index, 2005=100 increase in index represents an appreciation)
REER
NEER
-40
-30
-20
-10
0
10
20
30
40
10
30
50
70
90
110
130
150
170
2001 2003 2005 2007 2009 2011 2013 2015
Actual and Equilibrium Real Effective Exchange Rates(REER index 2005=100)
Percentage Deviation of Actual from Predicted
Actual REER
Predicted REER
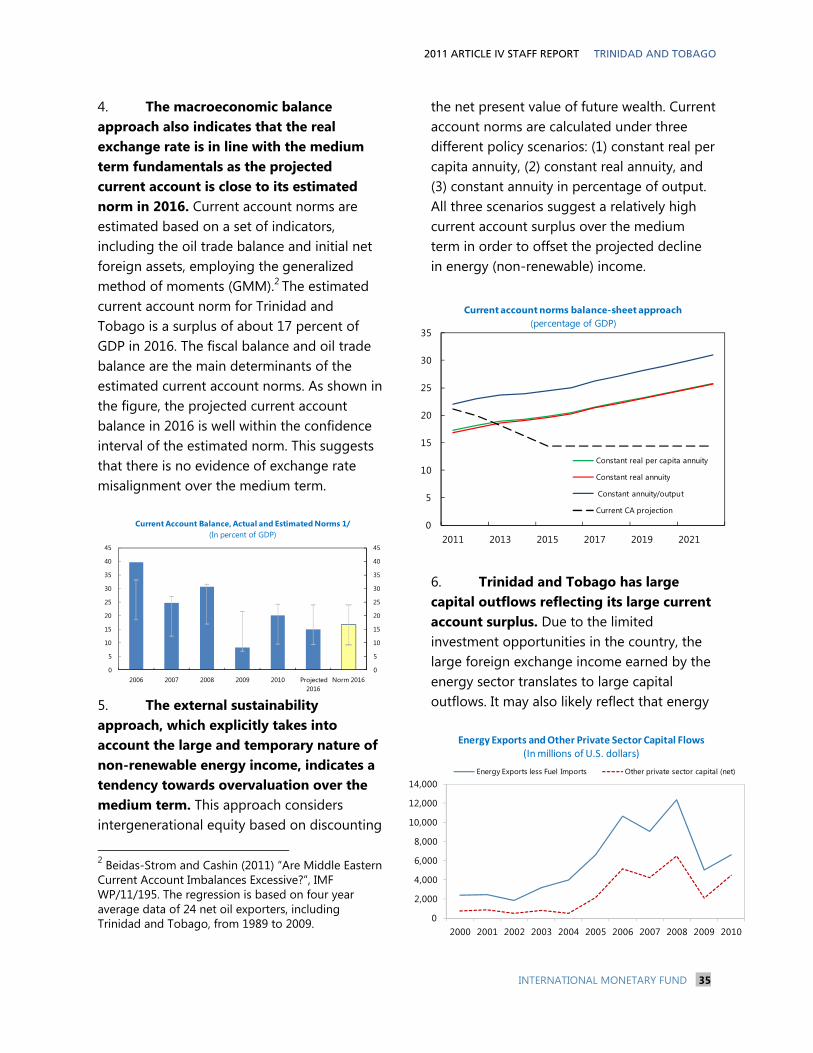
2011 ARTICLE IV STAFF REPORT TRINIDAD AND TOBAGO
INTERNATIONAL MONETARY FUND 35
4. The macroeconomic balance approach also indicates that the real exchange rate is in line with the medium term fundamentals as the projected current account is close to its estimated norm in 2016. Current account norms are estimated based on a set of indicators, including the oil trade balance and initial net foreign assets, employing the generalized method of moments (GMM).2 The estimated current account norm for Trinidad and Tobago is a surplus of about 17 percent of GDP in 2016. The fiscal balance and oil trade balance are the main determinants of the estimated current account norms. As shown in the figure, the projected current account balance in 2016 is well within the confidence interval of the estimated norm. This suggests that there is no evidence of exchange rate misalignment over the medium term.
5. The external sustainability approach, which explicitly takes into account the large and temporary nature of non-renewable energy income, indicates a tendency towards overvaluation over the medium term. This approach considers intergenerational equity based on discounting
2 Beidas-Strom and Cashin (2011) “Are Middle Eastern Current Account Imbalances Excessive?”, IMF WP/11/195. The regression is based on four year average data of 24 net oil exporters, including Trinidad and Tobago, from 1989 to 2009.
the net present value of future wealth. Current account norms are calculated under three different policy scenarios: (1) constant real per capita annuity, (2) constant real annuity, and (3) constant annuity in percentage of output. All three scenarios suggest a relatively high current account surplus over the medium term in order to offset the projected decline in energy (non-renewable) income.
6. Trinidad and Tobago has large capital outflows reflecting its large current account surplus. Due to the limited investment opportunities in the country, the large foreign exchange income earned by the energy sector translates to large capital outflows. It may also likely reflect that energy
0
5
10
15
20
25
30
35
40
45
0
5
10
15
20
25
30
35
40
45
2006 2007 2008 2009 2010 Projected 2016
Norm 2016
Current Account Balance, Actual and Estimated Norms 1/(In percent of GDP)
0
5
10
15
20
25
30
35
2011 2013 2015 2017 2019 2021
Current account norms balance-sheet approach(percentage of GDP)
Constant real per capita annuity
Constant real annuity
Constant annuity/output
Current CA projection
0
2,000
4,000
6,000
8,000
10,000
12,000
14,000
2000 2001 2002 2003 2004 2005 2006 2007 2008 2009 2010
Energy Exports less Fuel Imports Other private sector capital (net)
Energy Exports and Other Private Sector Capital Flows(In millions of U.S. dollars)

2011 ARTICLE IV STAFF REPORT TRINIDAD AND TOBAGO
36 INTERNATIONAL MONETARY FUND
companies hold a portion of their export proceeds overseas (above and beyond the repatriation of reported profits) bringing onshore only amounts needed to cover local expenses and taxes. A STA’s TA mission in Feb 2011 indentified some misclassification of the financial account and the authorities are taking actions based on the work program provided by the mission.
7. Information from alternative indicators broadly support the above assessment. Relative to the other CARICOM countries, Trinidad and Tobago’s non-commodity exports have grown more rapidly in the past decade than the other CARICOM countries (12 percent compared to the an average of 3 percent for the region). However, to sustain growth, the country will need to
expand to other markets. The share of the region’s tourism arrival has been in a secular decline, but this is not related to price competitiveness, and could be difficult to correct. As noted above, the country’s ranking in the Global Competitiveness Index has improved.
8. There are downside risks to the external accounts due to uncertainty in natural gas prices in light of the increased shale gas extraction. U.S. gas prices have fallen as its shale gas production increased, but Trinidad and Tobago has successfully been diversifying gas export destinations to other higher price markets. Nevertheless, in the longer term, increased supply of shale gas worldwide could affect global gas prices.

tress
TRINIDAD AND TOBAGO STAFF REPORT FOR THE 2011 ARTICLE IV CONSULTATION—INFORMATIONAL ANNEX
Prepared By
Western Hemisphere Department
I. FUND RELATIONS __________________________________________________________________ 2
II. RELATIONS WITH THE WORLD BANK ____________________________________________ 4
III. RELATIONS WITH THE INTER-AMERICAN DEVELOPMENT BANK (IDB) ________ 6
IV. STATISTICAL ISSUES _______________________________________________________________ 8
CONTENTS
March 14, 2012

2011 ARTICLE IV REPORT—INFORMATIONAL ANNEX TRINIDAD AND TOBAGO
2 INTERNATIONAL MONETARY FUND
I. ANNEX I. FUND RELATIONS (As of January 31, 2012)
Membership Status: Joined: September 16, 1963; Article VIII.
General Resources Account:
SDR Million Percent Quota
Quota 335.60 100.00 Fund holdings of currency 231.28 68.91 Reserve position in Fund 104.33 31.09
SDR Department: SDR Million Allocation Net cumulative allocation 321.13 100.00 Holdings 275.52 85.80
Outstanding Purchases and Loans: None.
Latest Financial Arrangements: In millions of SDRs
Type Approval
Date Expiration
Date Amount
Approved Amount Drawn
Stand-by 04/20/90 03/31/91 85.00 85.00 Stand-by 01/13/89 02/28/90 99.00 99.00
Projected Obligations to Fund: (SDR Million; based on existing use of resources and present holdings of SDRs):
Forthcoming
2011 2012 2013 2014 Principal -- -- -- -- Charges/Interest 0.07 0.07 0.07 0.07 Total 0.07 0.07 0.07 0.07
Exchange Arrangements: Trinidad and Tobago has accepted the obligations of Article VIII, Sections 2, 3, and 4. It maintains an exchange system that is free of multiple currency practices and of restrictions on the making of payments and transfers for current international transactions. The system, a de jure managed float, is classified as a stabilized arrangement under the Fund’s revised methodology. Last Article IV Consultation and Recent Contacts: The 2010 Article IV mission was conducted on October 27–November 8, 2010 and a staff visit took place on November 30-December 8, 2011.

TRINIDAD AND TOBAGO 2011 ARTICLE IV REPORT—INFORMATIONAL ANNEX
INTERNATIONAL MONETARY FUND 3
Technical Assistance CARTAC: CARTAC has fielded a wide range of missions including on macroeconomic programming and analysis; tax auditing; debt recording; results-based budgeting; public finance management; chart of accounts reform; stress-testing for banks; establishing risk-based capital standards for insurance companies; and on statistics including quarterly GDP, CPI and PPI. Department Dates Purpose
STA March 2012 Monetary and balance of payments statistics
STA February 2012
Consumer and producer price statistics
MCM June 2010, September 2010, March 2011, and June 2011
Insurance supervision
MCM December 2010 and April 2011
Public debt management, funding and medium term debt management strategies
STA February 2011 Assistance on the compilation of an IIP and the financial account in the balance of payments as part of the requirements for the prospective Special Data Dissemination Standard (SDDS)
STA December 2009 Multi-topic mission and assistance on subscription to the Special Data Dissemination Standard (SDDS)
STA January 2008 Standardizing monetary and financial statistics
FAD January 2008. Setting up institutional arrangements for a Medium-Term Fiscal Framework
MCM 2007-2008 Two resident experts for insurance supervision in the CBTT
STA July 2007 Review of national accounts statistics methodology
FAD February 2007 Establishment of revenue authority and review domestic tax and customs systems and procedures
STA January 2007 Assistance to update export-import price indices

2011 ARTICLE IV REPORT—INFORMATIONAL ANNEX TRINIDAD AND TOBAGO
4 INTERNATIONAL MONETARY FUND
II. ANNEX II. RELATIONS WITH THE WORLD BANK (As of January 2012)
The World Bank’s last Country Assistance Strategy for Trinidad and Tobago was discussed at the Board in 1999 and covered the period 1999–2001. The current World Bank program includes a fee-based services program with five components and a program of non-lending technical assistance. The trust fund supporting the Nariva ecosystem restoration and carbon sequestration ended in December 2011. Fee-based program Fee-Based Services Program: The fee-based services agreement with the Government of Trinidad and Tobago covers five areas: (i) Performance-Informed Budgeting (PIB); (ii) Pension Systems Harmonization; (iii) Public Debt and Cash Management; (iv) Doing Business Reform; and (v) Investment Promotion and Special Economic Zones. Discussions between the Bank and the Government were initiated during the Annual Meetings of 2009. Since then, the Government has also asked the International Finance Corporation (IFC) to look at improving the environment for public-private partnerships. This work to be carried out by the World Bank Group could serve as a model for other countries as the areas covered are necessary for improving government performance and sustainable and equitable growth. Technical Assistance Nariva Ecosystem Restoration and Carbon Sequestration: The program supported an ongoing project in Trinidad and Tobago which
is funded under the World Bank’s BioCarbon Fund (BioCF). The development objective was to contribute to efforts to restore and conserve the Nariva wetlands on the eastern shore of Trinidad, through the recognition of the services it provides as a carbon sink and a biodiverse ecosystem. This objective was achieved through actions designed to restore and conserve about 1160 hectares of its associated forest stands. The Bank’s support to this project in Trinidad and Tobago under this Trust Fund was for US$50,000. Report on the Observance of Standards and Codes - Accounting and Auditing (ROSC): In September 2010, the Bank encouraged Trinidad and Tobago to carry out a ROSC. The study would be highly beneficial for the development of accounting and auditing standards in the private sector, State-Owned Enterprises and also the financial sector. A coordinator was appointed in the Ministry of Finance to liaise with the World Bank’s ROSC team. Supporting Economic Management in the Caribbean (SEMCAR): A CIDA financed program coordinated by the Bank, focuses on identifying the key changes in institutional reforms, improvements in business processes and actual work practices that need to take place in tax, customs, and PFM areas. The first phase (April 2011 – December 2013) covers 3 years at a budget of US$18.3 million. Trinidad and Tobago is one of the first countries in the region to benefit from this program.
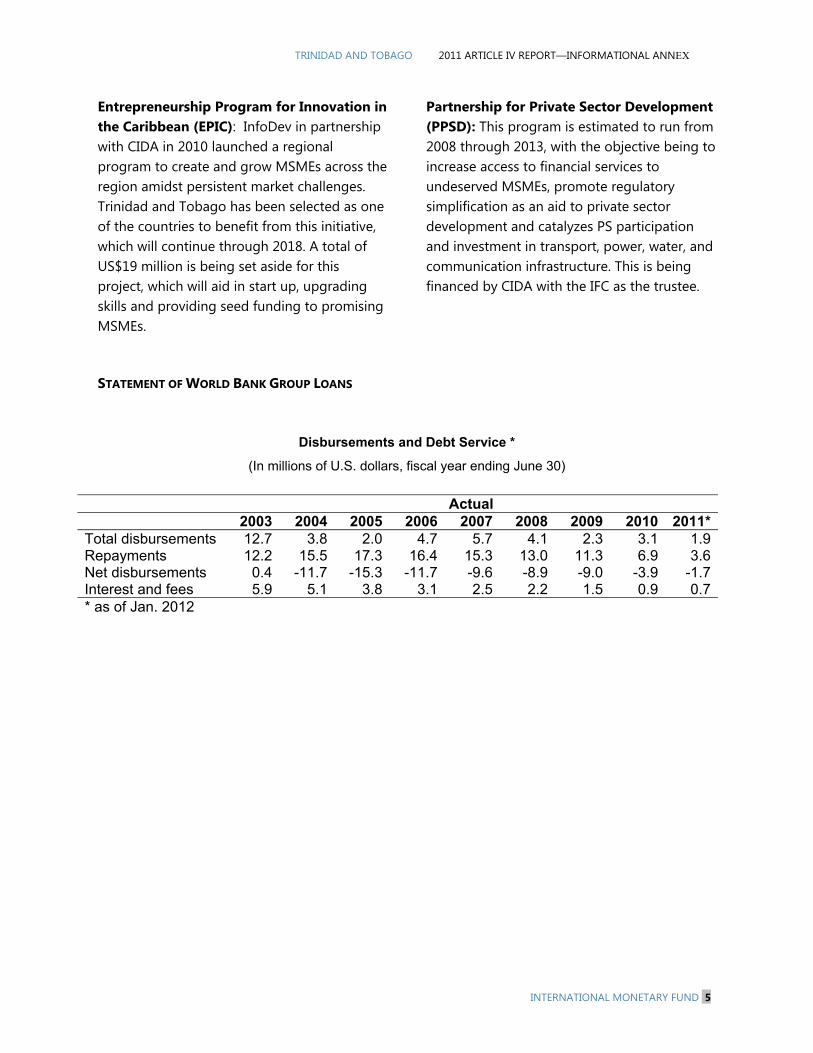
TRINIDAD AND TOBAGO 2011 ARTICLE IV REPORT—INFORMATIONAL ANNEX
INTERNATIONAL MONETARY FUND 5
Entrepreneurship Program for Innovation in the Caribbean (EPIC): InfoDev in partnership with CIDA in 2010 launched a regional program to create and grow MSMEs across the region amidst persistent market challenges. Trinidad and Tobago has been selected as one of the countries to benefit from this initiative, which will continue through 2018. A total of US$19 million is being set aside for this project, which will aid in start up, upgrading skills and providing seed funding to promising MSMEs.
Partnership for Private Sector Development (PPSD): This program is estimated to run from 2008 through 2013, with the objective being to increase access to financial services to undeserved MSMEs, promote regulatory simplification as an aid to private sector development and catalyzes PS participation and investment in transport, power, water, and communication infrastructure. This is being financed by CIDA with the IFC as the trustee.
STATEMENT OF WORLD BANK GROUP LOANS
Disbursements and Debt Service *
(In millions of U.S. dollars, fiscal year ending June 30)
Actual 2003 2004 2005 2006 2007 2008 2009 2010 2011* Total disbursements 12.7 3.8 2.0 4.7 5.7 4.1 2.3 3.1 1.9 Repayments 12.2 15.5 17.3 16.4 15.3 13.0 11.3 6.9 3.6 Net disbursements 0.4 -11.7 -15.3 -11.7 -9.6 -8.9 -9.0 -3.9 -1.7 Interest and fees 5.9 5.1 3.8 3.1 2.5 2.2 1.5 0.9 0.7 * as of Jan. 2012
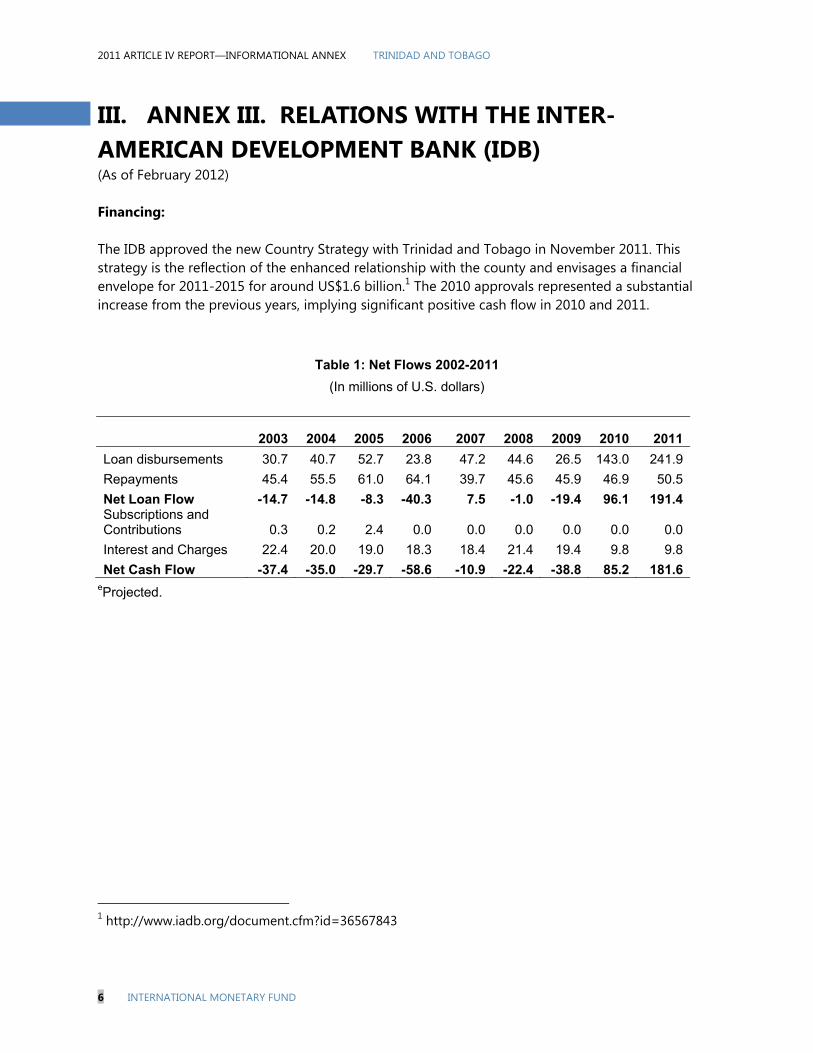
2011 ARTICLE IV REPORT—INFORMATIONAL ANNEX TRINIDAD AND TOBAGO
6 INTERNATIONAL MONETARY FUND
III. ANNEX III. RELATIONS WITH THE INTER-AMERICAN DEVELOPMENT BANK (IDB) (As of February 2012) Financing: The IDB approved the new Country Strategy with Trinidad and Tobago in November 2011. This strategy is the reflection of the enhanced relationship with the county and envisages a financial envelope for 2011-2015 for around US$1.6 billion.1 The 2010 approvals represented a substantial increase from the previous years, implying significant positive cash flow in 2010 and 2011.
Table 1: Net Flows 2002-2011
(In millions of U.S. dollars)
2003 2004 2005 2006 2007 2008 2009 2010 2011
Loan disbursements 30.7 40.7 52.7 23.8 47.2 44.6 26.5 143.0 241.9
Repayments 45.4 55.5 61.0 64.1 39.7 45.6 45.9 46.9 50.5
Net Loan Flow -14.7 -14.8 -8.3 -40.3 7.5 -1.0 -19.4 96.1 191.4Subscriptions and Contributions 0.3 0.2 2.4 0.0 0.0 0.0 0.0 0.0 0.0
Interest and Charges 22.4 20.0 19.0 18.3 18.4 21.4 19.4 9.8 9.8
Net Cash Flow -37.4 -35.0 -29.7 -58.6 -10.9 -22.4 -38.8 85.2 181.6eProjected.
1 http://www.iadb.org/document.cfm?id=36567843
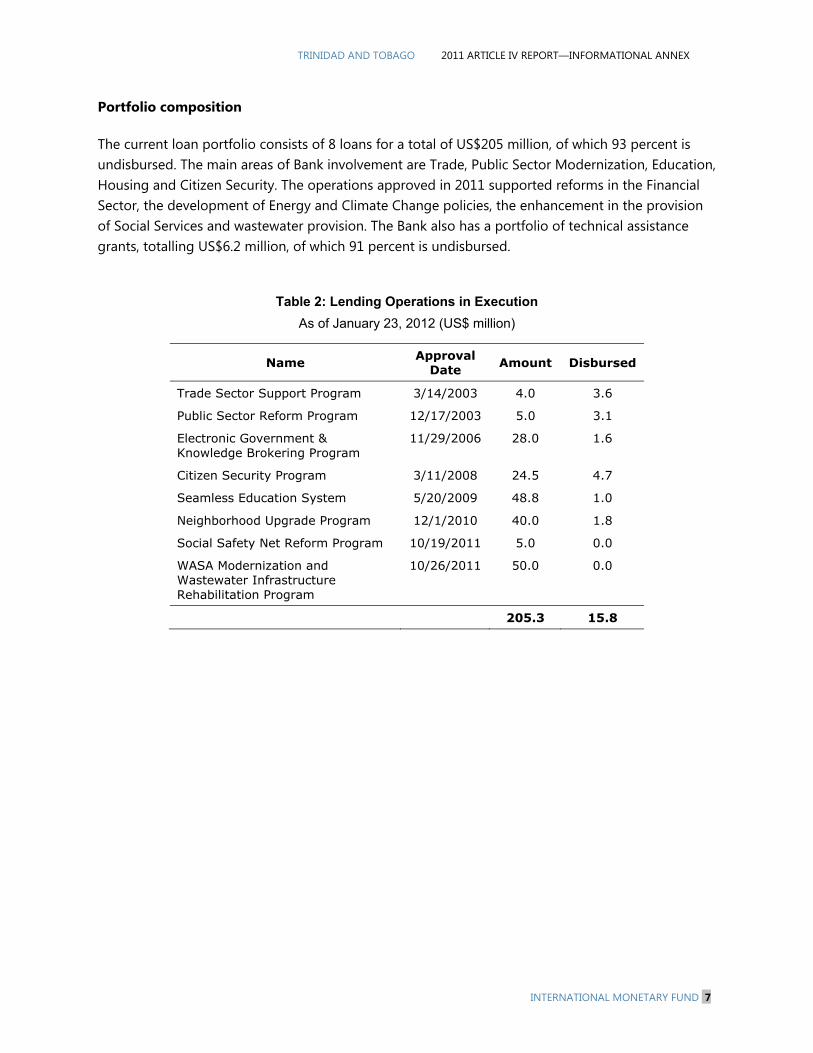
TRINIDAD AND TOBAGO 2011 ARTICLE IV REPORT—INFORMATIONAL ANNEX
INTERNATIONAL MONETARY FUND 7
Portfolio composition The current loan portfolio consists of 8 loans for a total of US$205 million, of which 93 percent is undisbursed. The main areas of Bank involvement are Trade, Public Sector Modernization, Education, Housing and Citizen Security. The operations approved in 2011 supported reforms in the Financial Sector, the development of Energy and Climate Change policies, the enhancement in the provision of Social Services and wastewater provision. The Bank also has a portfolio of technical assistance grants, totalling US$6.2 million, of which 91 percent is undisbursed.
Table 2: Lending Operations in Execution
As of January 23, 2012 (US$ million)
Name Approval Date Amount Disbursed
Trade Sector Support Program 3/14/2003 4.0 3.6
Public Sector Reform Program 12/17/2003 5.0 3.1
Electronic Government & Knowledge Brokering Program
11/29/2006 28.0 1.6
Citizen Security Program 3/11/2008 24.5 4.7
Seamless Education System 5/20/2009 48.8 1.0
Neighborhood Upgrade Program 12/1/2010 40.0 1.8
Social Safety Net Reform Program 10/19/2011 5.0 0.0
WASA Modernization and Wastewater Infrastructure Rehabilitation Program
10/26/2011 50.0 0.0
205.3 15.8
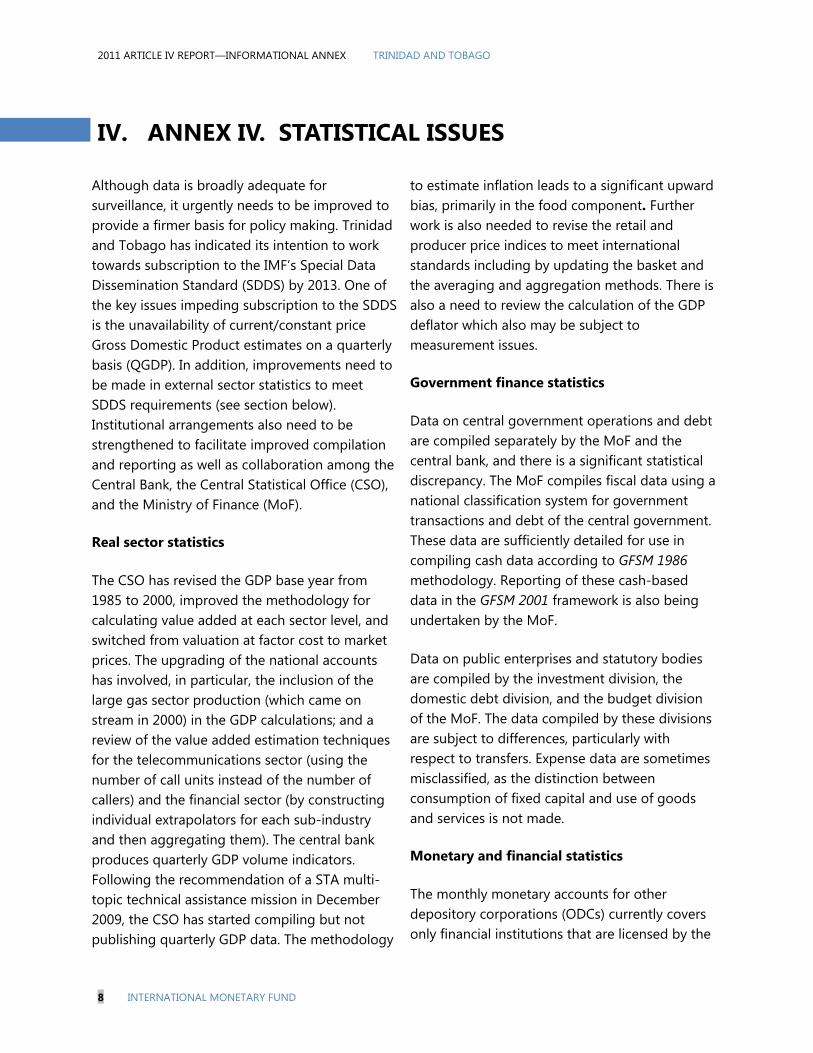
2011 ARTICLE IV REPORT—INFORMATIONAL ANNEX TRINIDAD AND TOBAGO
8 INTERNATIONAL MONETARY FUND
IV. ANNEX IV. STATISTICAL ISSUES
Although data is broadly adequate for surveillance, it urgently needs to be improved to provide a firmer basis for policy making. Trinidad and Tobago has indicated its intention to work towards subscription to the IMF’s Special Data Dissemination Standard (SDDS) by 2013. One of the key issues impeding subscription to the SDDS is the unavailability of current/constant price Gross Domestic Product estimates on a quarterly basis (QGDP). In addition, improvements need to be made in external sector statistics to meet SDDS requirements (see section below). Institutional arrangements also need to be strengthened to facilitate improved compilation and reporting as well as collaboration among the Central Bank, the Central Statistical Office (CSO), and the Ministry of Finance (MoF). Real sector statistics The CSO has revised the GDP base year from 1985 to 2000, improved the methodology for calculating value added at each sector level, and switched from valuation at factor cost to market prices. The upgrading of the national accounts has involved, in particular, the inclusion of the large gas sector production (which came on stream in 2000) in the GDP calculations; and a review of the value added estimation techniques for the telecommunications sector (using the number of call units instead of the number of callers) and the financial sector (by constructing individual extrapolators for each sub-industry and then aggregating them). The central bank produces quarterly GDP volume indicators. Following the recommendation of a STA multi-topic technical assistance mission in December 2009, the CSO has started compiling but not publishing quarterly GDP data. The methodology
to estimate inflation leads to a significant upward bias, primarily in the food component. Further work is also needed to revise the retail and producer price indices to meet international standards including by updating the basket and the averaging and aggregation methods. There is also a need to review the calculation of the GDP deflator which also may be subject to measurement issues. Government finance statistics Data on central government operations and debt are compiled separately by the MoF and the central bank, and there is a significant statistical discrepancy. The MoF compiles fiscal data using a national classification system for government transactions and debt of the central government. These data are sufficiently detailed for use in compiling cash data according to GFSM 1986 methodology. Reporting of these cash-based data in the GFSM 2001 framework is also being undertaken by the MoF. Data on public enterprises and statutory bodies are compiled by the investment division, the domestic debt division, and the budget division of the MoF. The data compiled by these divisions are subject to differences, particularly with respect to transfers. Expense data are sometimes misclassified, as the distinction between consumption of fixed capital and use of goods and services is not made. Monetary and financial statistics The monthly monetary accounts for other depository corporations (ODCs) currently covers only financial institutions that are licensed by the

TRINIDAD AND TOBAGO 2011 ARTICLE IV REPORT—INFORMATIONAL ANNEX
INTERNATIONAL MONETARY FUND 9
central bank under the 1993 Financial Institutions Act. ODCs not licensed only report voluntarily on a quarterly basis. No data are reported by credit unions. The lack of these data has prevented the compilation of a more comprehensive Depository Corporation Survey. The authorities should also consider developing systems for reporting balance sheet accounts for the mutual funds, with a view to compiling a more comprehensive financial survey in the future. Trinidad and Tobago has not yet migrated to the standardized report forms (SRFs) for the submission of monetary statistics. A mission in the near future will assist the authorities in producing the SRF for the central bank. External sector statistics Quarterly aggregate balance of payments estimates and annual balance of payments data are disseminated by the central bank in its national publications.
Annual balance of payments data are also sent to STA, although with considerable delay. The SDDS assessment mission in December 2009 found that the financial account does not follow a financial instrument classification in line with the Balance of Payments Manual fifth edition. A TA mission in balance of payments statistics in February 2011 provided assistance on the issue, on the compilation of the International Investment Position, and on the other required improvements for the prospective subscription on the SDDS and implementation of the Balance of Payments Manual sixth edition. A follow up mission on these matters is planned in the near term. The Central Bank should expand its current debt reporting system to include comprehensive coverage of external loans and debt of the entire public sector, as well as publicly guaranteed debt. The country could be in a position to meet SDDS requirements in this area in 2013.
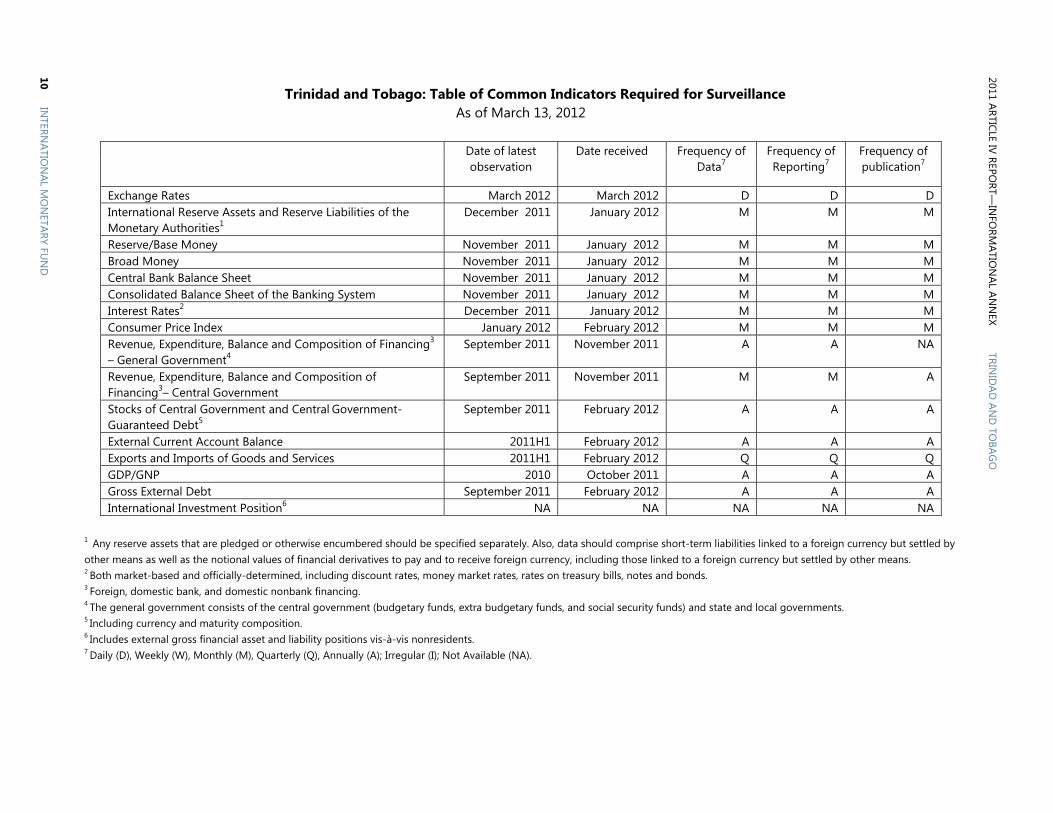
Trinidad and Tobago: Table of Common Indicators Required for Surveillance As of March 13, 2012
Date of latest
observation Date received Frequency of
Data7 Frequency of Reporting7
Frequency of publication7
Exchange Rates March 2012 March 2012 D D D International Reserve Assets and Reserve Liabilities of the Monetary Authorities1
December 2011 January 2012 M M M
Reserve/Base Money November 2011 January 2012 M M M Broad Money November 2011 January 2012 M M M Central Bank Balance Sheet November 2011 January 2012 M M M Consolidated Balance Sheet of the Banking System November 2011 January 2012 M M M Interest Rates2 December 2011 January 2012 M M M Consumer Price Index January 2012 February 2012 M M M Revenue, Expenditure, Balance and Composition of Financing3 – General Government4
September 2011 November 2011 A A NA
Revenue, Expenditure, Balance and Composition of Financing3– Central Government
September 2011 November 2011 M M A
Stocks of Central Government and Central Government-Guaranteed Debt5
September 2011 February 2012 A A A
External Current Account Balance 2011H1 February 2012 A A A Exports and Imports of Goods and Services 2011H1 February 2012 Q Q Q GDP/GNP 2010 October 2011 A A A Gross External Debt September 2011 February 2012 A A A International Investment Position6 NA NA NA NA NA
1 Any reserve assets that are pledged or otherwise encumbered should be specified separately. Also, data should comprise short-term liabilities linked to a foreign currency but settled by other means as well as the notional values of financial derivatives to pay and to receive foreign currency, including those linked to a foreign currency but settled by other means. 2 Both market-based and officially-determined, including discount rates, money market rates, rates on treasury bills, notes and bonds. 3 Foreign, domestic bank, and domestic nonbank financing. 4 The general government consists of the central government (budgetary funds, extra budgetary funds, and social security funds) and state and local governments. 5 Including currency and maturity composition. 6 Includes external gross financial asset and liability positions vis-à-vis nonresidents. 7 Daily (D), Weekly (W), Monthly (M), Quarterly (Q), Annually (A); Irregular (I); Not Available (NA).
2011 ARTICLE IV REPORT—
INFO
RMATIO
NAL AN
NEX
TRINID
AD AN
D TO
BAGO
10 IN
TERNATIO
NAL M
ON
ETARY FUN
D

Public Information Notice (PIN) No. 12/40
FOR IMMEDIATE RELEASE
April 27, 2012
IMF Executive Board Concludes 2011 Article IV Consultation Discussions with Trinidad and Tobago
On March 28, 2012, the Executive Board of the International Monetary Fund (IMF) concluded the 2011 Article IV consultation discussions with Trinidad and Tobago.1
Background
The economy of Trinidad and Tobago is turning the corner and growth is expected to resume in 2012 after an extended slowdown lasting three years. A range of indicators point to a broad turnaround in the non-energy sector beginning in the second half of 2011. Real GDP is estimated to have contracted by 1.3 percent in 2011 mainly reflecting production disruptions in the energy sector and a lackluster performance in the non-energy sector. Inflation has picked up, rising from a historic low of 0.6 percent in August 2011 to 6.8 percent in January 2012, as food prices increased. However, core inflation, remained low at 1.8 percent in January. Unemployment has remained moderate 5.8 percent in mid-2011. The current account surplus rebounded strongly to 20 percent of GDP in 2010 and an estimated 21 percent in 2011 from 8 percent in 2009, stemming mainly from the improvement in oil prices and a recovery in non-energy exports. Gross official reserves reached US$9.8 billion (over 13 months of imports) at end-December 2011.
1 Under Article IV of the IMF's Articles of Agreement, the IMF holds bilateral discussions with members, usually every year. A staff team visits the country, collects economic and financial information, and discusses with officials the country's economic developments and policies. On return to headquarters, the staff prepares a report, which forms the basis for discussion by the Executive Board. At the conclusion of the discussion, the Managing Director, as Chairman of the Board, summarizes the views of Executive Directors, and this summary is transmitted to the country's authorities. An explanation of any qualifiers used in summings up can be found here: http://www.imf.org/external/np/sec/misc/qualifiers.htm.
International Monetary Fund
700 19th Street, NW
Washington, D. C. 20431 USA
2
In the 2010/11 fiscal year, the central government’s finances were nearly balanced thanks to a strong revenue performance and lower than planned current and capital spending. Nevertheless, the deterioration in the non-energy balance implied a large fiscal stimulus. The debt-to-GDP ratio has significantly risen from 25 percent of GDP in 2008 to 33 percent in 2011.
In the face of subdued inflation, the Central Bank of Trinidad and Tobago (CBTT) has maintained an accommodative monetary policy lowering the policy rate by 75 basis points since end-2010 to 3 percent. After a decline that lasted 20 months, commercial bank credit to the private sector has been noticeably more dynamic since mid-2011 (5.3 percent growth in November y-o-y), consistent with the non-energy sector recovery. Commercial banks remain well capitalized, profitable, and liquid. The banking system’s non-performing loans (NPLs), after peaking at 7.6 percent of total loans in August 2011, have declined to 6.4 percent in November and remain low by regional standards. Following the collapse of the CL Financial Group and its insurance subsidiary, CLICO, significant progress has been made in compensating CLICO claimants. Nevertheless, vulnerabilities remain.
Real economic activity is expected to increase by 1.7 percent in 2012 as the non-energy sector picks up momentum with the acceleration of government investment and the restructuring of CLICO liabilities and as the energy sector resumes normal operations later in the year. Inflation is expected to remain moderate.
Executive Board Assessment
Executive Directors welcomed the signs of economic recovery following a prolonged slowdown, and commended the authorities for implementing supportive policies, aided by ample buffers, which had helped maintain stability. The immediate challenges are to support the recovery and to address remaining financial vulnerabilities. Enhancing competitiveness and promoting economic diversification continue to be important medium-term objectives for Trinidad and Tobago.
Directors supported the 2011/12 budget, which provides stimulus through a timely execution of the budgeted investment programs, while emphasizing the need to contain current spending and improve the targeting of social programs.
Directors recommended developing a medium-term fiscal framework that strikes an appropriate balance between consuming, saving, and investing energy revenue, with a view to resuming net savings of energy wealth for future generations. Containing real increases in transfers and subsidies, strengthening tax collection efforts, and broadening the tax base would facilitate a gradual return to fiscal surpluses and further improve policy buffers. Directors saw scope for clarifying the objectives and operating framework of the Heritage and Stabilization Fund to reflect the preference for savings while maintaining the stabilization component in view of volatile energy prices.

3
Directors supported maintaining the current low interest rate policy to sustain the nascent economic recovery. They stressed the need for continued strong surveillance of the financial sector. Directors welcomed the intense monitoring and supervision of banks, including through credit reviews and stress testing, and progress toward consolidated supervision. They encouraged further efforts to strengthen the regulatory environment of non-bank institutions and to implement the recommendations of the Financial System Stability Assessment. Directors welcomed the progress toward the resolution of the failed insurance company, and looked forward to its swift completion.
Most Directors supported the staff’s call for further steps to improve the functioning of the foreign exchange market. A few Directors acknowledged the authorities’ concern about greater exchange rate flexibility and its potential impact on competitiveness in the short term. Given depleting energy resources, it will be important to press ahead with structural reform to support diversification by boosting competitiveness in the non-energy sector, fostering a more vigorous private sector, and further enhancing the business environment. Improving the performance of the public administration and delivery of public services will be essential in this regard.
Directors highlighted the urgency of improving the quality and timeliness of statistics. They welcomed the authorities’ plans to create an independent statistical agency and to subscribe to the Special Data Dissemination Standard.
Public Information Notices (PINs) form part of the IMF's efforts to promote transparency of the IMF's views and analysis of economic developments and policies. With the consent of the country (or countries) concerned, PINs are issued after Executive Board discussions of Article IV consultations with member countries, of its surveillance of developments at the regional level, of post-program monitoring, and of ex post assessments of member countries with longer-term program engagements. PINs are also issued after Executive Board discussions of general policy matters, unless otherwise decided by the Executive Board in a particular case.
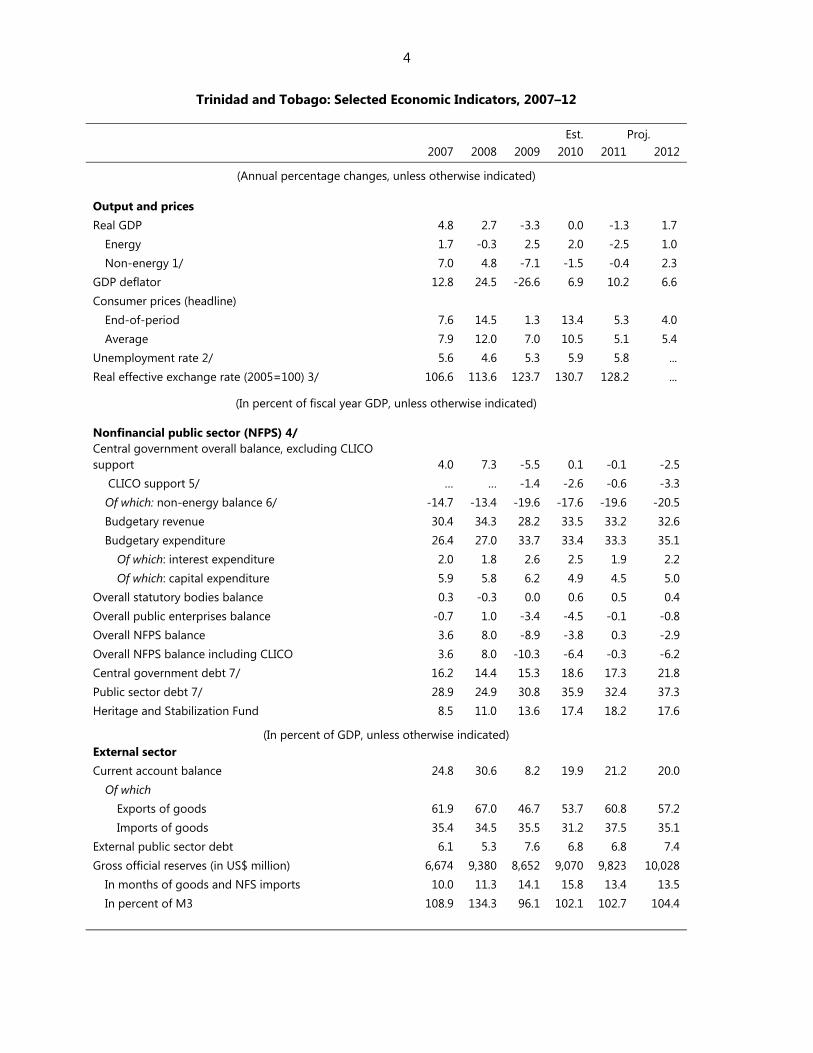
4
Trinidad and Tobago: Selected Economic Indicators, 2007–12 Est. Proj.
2007 2008 2009 2010 2011 2012
(Annual percentage changes, unless otherwise indicated)
Output and prices Real GDP 4.8 2.7 -3.3 0.0 -1.3 1.7
Energy 1.7 -0.3 2.5 2.0 -2.5 1.0 Non-energy 1/ 7.0 4.8 -7.1 -1.5 -0.4 2.3
GDP deflator 12.8 24.5 -26.6 6.9 10.2 6.6 Consumer prices (headline)
End-of-period 7.6 14.5 1.3 13.4 5.3 4.0 Average 7.9 12.0 7.0 10.5 5.1 5.4
Unemployment rate 2/ 5.6 4.6 5.3 5.9 5.8 ... Real effective exchange rate (2005=100) 3/ 106.6 113.6 123.7 130.7 128.2 ...
(In percent of fiscal year GDP, unless otherwise indicated)
Nonfinancial public sector (NFPS) 4/ Central government overall balance, excluding CLICO support 4.0 7.3 -5.5 0.1 -0.1 -2.5
CLICO support 5/ … … -1.4 -2.6 -0.6 -3.3 Of which: non-energy balance 6/ -14.7 -13.4 -19.6 -17.6 -19.6 -20.5 Budgetary revenue 30.4 34.3 28.2 33.5 33.2 32.6 Budgetary expenditure 26.4 27.0 33.7 33.4 33.3 35.1
Of which: interest expenditure 2.0 1.8 2.6 2.5 1.9 2.2 Of which: capital expenditure 5.9 5.8 6.2 4.9 4.5 5.0
Overall statutory bodies balance 0.3 -0.3 0.0 0.6 0.5 0.4 Overall public enterprises balance -0.7 1.0 -3.4 -4.5 -0.1 -0.8 Overall NFPS balance 3.6 8.0 -8.9 -3.8 0.3 -2.9 Overall NFPS balance including CLICO 3.6 8.0 -10.3 -6.4 -0.3 -6.2 Central government debt 7/ 16.2 14.4 15.3 18.6 17.3 21.8 Public sector debt 7/ 28.9 24.9 30.8 35.9 32.4 37.3 Heritage and Stabilization Fund 8.5 11.0 13.6 17.4 18.2 17.6
(In percent of GDP, unless otherwise indicated) External sector Current account balance 24.8 30.6 8.2 19.9 21.2 20.0
Of which Exports of goods 61.9 67.0 46.7 53.7 60.8 57.2 Imports of goods 35.4 34.5 35.5 31.2 37.5 35.1
External public sector debt 6.1 5.3 7.6 6.8 6.8 7.4 Gross official reserves (in US$ million) 6,674 9,380 8,652 9,070 9,823 10,028
In months of goods and NFS imports 10.0 11.3 14.1 15.8 13.4 13.5 In percent of M3 108.9 134.3 96.1 102.1 102.7 104.4

5
(Percentage changes in relation to beginning-of-period M3)
Money and credit Net foreign assets 29.7 67.6 -2.2 6.0 14.8 4.3 Net domestic assets -22.3 -53.1 30.3 -6.2 -7.2 -3.9
Of which: credit to the private sector 17.6 12.6 -4.0 0.3 3.9 4.6 Broad money (M3) 7.4 14.4 28.1 -0.2 7.7 0.4 M3 velocity 3.5 4.0 2.2 2.3 2.4 2.6
Memorandum items: Nominal GDP (in billions of TT$) 137.0 175.3 124.4 133.0 144.6 156.8 Public expenditure (in percent of non-energy GDP) 52.6 54.7 54.7 57.9 60.1 63.4 Exchange rate (TT$/US$, end of period) 6.31 6.34 6.30 6.42 6.40 ... Crude oil price (US$/barrel) 71.1 97.0 61.8 79.0 103.9 105.7 Natural gas price (US$ per mmbtu) 8/ 7.0 8.9 4.2 4.9 6.5 6.6
Sources: Trinidad and Tobago authorities, WEO, and Fund staff estimates and projections. 1/ Includes VAT and Financial Intermediation Services Indirectly Measured (FISIM). 2/ For 2011, as of Q2. 3/ For 2011, as of end-October. 4/ The data refer to fiscal year October-September. 5/ In 2011/12, assumes half of CLICO claims are swapped for government equity in Republic Bank. 6/ Defined as non-energy revenue minus expenditure of the central government. 7/ Excluding debt issued for sterilization. Does not include arrears on the fuel subsidy in 2011/12. 8/ Before 2009, Henry Hub price in Louisiana. From 2009, the average of Henry Hub and Asian LNG prices.
Statement by Paulo Nogueira Batista, Executive Director for Trinidad and Tobago and Kevin Finch, Advisor to the Executive Director
March 28, 2012
1. The authorities of Trinidad and Tobago wish to express their appreciation to Mrs. Gold and her team for the depth of analysis, the open-minded approach to the national development agenda and the identification of possible risks. The 2011 Article IV Consultation noted that the economy of Trinidad and Tobago is at a point of inflexion after successfully navigating an array of domestic and external challenges. Domestic private sector confidence is returning and significant foreign direct investment flows are scheduled to resume in the short run. Recent Economic Developments 2. In 2011, real GDP was estimated to have declined by 1.3 percent, with the energy and non-energy sectors contracting by 2.5 percent and 0.4 percent, respectively. The energy sector contracted in 2011 on account of an upgrade program undertaken by key producers. The maintenance and upgrade operations have continued into 2012, but production levels should normalize by mid-2012. In the non-energy sector, there are signs of incipient growth. Non-energy sector activity picked up during the second half of 2011 with a revival of the construction sector, increased agricultural production and buoyant retail sales. The nationwide State of Emergency declared on August 2011 adversely affected the number of hours worked in a few industries, but its overall impact on economic activity has not been fully determined since its termination in December 2011. 3. Evidence suggests that the labor market withstood the fallout from the global economic crisis relatively well. The rate of unemployment peaked at 6.7 percent during the first quarter of 2010 and has since fallen to 5.8 per cent in the second quarter of 2011. Despite a marginal decline in the labor force participation rate during this period, the number of persons employed expanded, particularly in the services sector where an additional 19,000 jobs were created. 4. Inflationary pressures were modest despite a pickup towards the end of 2011 and in early 2012. After reaching a low of 0.6 per cent in the twelve months to August 2011, headline inflation rose to 6.8 percent at end-January 2012 on account of a sharp pickup in food prices in the wake of adverse weather conditions experienced during the fourth quarter of 2011. Core inflation remained relatively contained at under 2 percent for much of 2011. 5. The external sector continued its strong performance. The external current account balance improved to an estimated 21.2 percent of GDP in 2011 on account of buoyant energy
2
prices and improved non-energy exports. Gross official reserves were US$9.8 billion at end-December 2011, representing just over 13 months of import cover. Fiscal, Monetary and Exchange Rate Policies 6. The outturn for fiscal 2011 (October 2010 – September 2011) was better an originally envisaged. The central government deficit (including support for CLICO) declined to 0.7 per cent of GDP compared with 2.5 percent of GDP the previous fiscal year. This was partly due to improved tax compliance on account of an upgraded IT tax system, inflows of TT$1.9 billion from a tax amnesty and supplemental tax payments from energy companies as a result of a more rigorous audit process. On the expenditure side, administrative delays hampered capital spending while current spending remained mostly in line with the budget. Capital spending is expected to quicken in 2012 as several government infrastructure projects take-off. Public sector debt (excluding debt issued for sterilization) was 32.4 percent of GDP at end-September 2011. 7. The authorities maintained an accommodative monetary stance for much of 2011. The repo rate, the main policy rate, was reduced on three occasions during 2011 and stood at a historic low of 3 percent at the end of 2011. A persistent liquidity overhang caused Treasury bill and deposit interest rates to fall sharply. Stock market performance excelled as the Composite Price Index increased by 21.2 percent in 2011. Private sector credit showed some signs of revival from mid-2011, with business credit growing for the first time in almost two years. 8. The operation of the foreign exchange market is a perennial concern of the Mission which believes that greater flexibility is required in the system. The authorities are of the view that the exchange rate regime is appropriate in the current economic environment. A free-float is more than likely to lead to an appreciation of the exchange rate, which could run counter to the government’s efforts to support diversification, including through the promotion of non-energy exports. It should be noted that the Central Bank, which accounts for roughly a quarter of total foreign exchange sales, does acknowledge that some distributional issues exist. However, discussions with authorized dealers aimed at smoothening flows via the establishment of a foreign exchange inter-bank market have so far not borne fruit. Nevertheless, the majority of market participants have expressed their satisfaction with the operation of the existing foreign exchange system. In fact, most authorized dealers have reduced their short positions, signaling growing confidence in the market’s ability to meet demand. The market is cognizant that the supply of foreign exchange is highly dependent on inflows from the energy sector, most of which coincide with energy tax payments to the government on a quarterly basis.

3
Economic Outlook 9. After three years of depressed economic activity, the economy is poised for growth in 2012. The positive outlook is buoyed by the onshore discovery of oil and natural gas resources in March 2012. Production potential from the reservoir was projected at 1,000 barrels of oil per day. Real GDP is projected to expand by 1.7 percent driven by a recovery in energy output and acceleration in the execution of the Public Sector Investment Program. The authorities intend to provide appropriate support to economic activity through a fiscal stimulus of 4.9 percent of GDP in 2012. The authorities are of the view that measures geared at medium-term fiscal consolidation, as recommended by staff, could only be enacted once economic growth is sufficiently rekindled. 10. The authorities acknowledge that there are downside risks. Externally, further delays in the economic recovery of Trinidad and Tobago’s main trading partners could hamper export growth. The change in the structure of the natural gas trade could also pose a challenge if early steps are not taken to solidify marketing arrangements. Domestically, heightened inflationary pressures are always a concern given the susceptibility of the agriculture sector to weather-related shocks. However, the authorities are confident that the introduction of an Agricultural Incentive Program would help build resilience in the agriculture sector. Going forward, the authorities also plan to comprehensively address an implementation deficit in the public sector which affects the pace of project execution. Financial Sector Developments 11. The rise in non-performing loans (NPLs) in the financial system is not pervasive and is mainly confined to a small portion of the loan portfolio of a few institutions. NPLs peaked at 7.6 percent at end-August 2011 before falling to 6.4 percent at end-November 2011 primarily because of a few large real-estate loans, two of which were fully backed by government guarantees. These loans were also heavily collateralized, with specific provisions made on the basis of the difference between the outstanding loan amounts and the net present value of the properties secured. The loans in question have since been restructured. Commercial banks have adopted a conservative approach (the Canadian banking model) and have retained the restructured loans in their NPL portfolio. If these large restructured loans are removed, NPLs would fall to around 5 percent of total loans and the ratio of provisions to NPLs would increase. The Central Bank continues to perform credit reviews every year and is assisting commercial banks with the incorporation of stress tests as part of their risk management toolkit. 12. The authorities are of the view that the concerns raised about the shrinkage in the balance sheet of the non-bank financial sector are somewhat exaggerated. Non-bank financial institutions (NBFIs) are undergoing a structural change. Some larger NBFIs are shifting focus away from merchant banking transactions to more trust and capital market activities.
4
As a result, commercial banks assumed a large proportion of the loan portfolios of their subsidiary-NBFIs. 13. The lengthy chapter on CL Financial\CLICO is nearing closure. The government’s new offer to policyholders with investments greater than TT$75,000 will see an upfront cash payout of TT$75,000 and the issuance of 20-year bonds for the remainder. The 1 to10-year bonds could be discounted at an average of 80 cents on the dollar at participating financial institutions. Meanwhile, the 11-20 year bonds could be exchanged for units in an Investment Trust which will hold suitable assets. CLICO has also repaid all of its outstanding loans to commercial banks. A new insurance company, focusing on traditional insurance business, will soon be formed. This new company is projected to become profitable after just one year of operation. The Government is also seeking to reclaim monies which it provided to subsidiaries of CL Financial Limited and will do so in a manner consistent with the Memorandum of Understanding. 14. Financial sector reforms continue apace. Procedures are now in place to allow the Central Bank to levy administrative fines and the regulators are contemplating revisions to the Financial Institutions Act, including the adoption of Basel III prudential criteria. A new Insurance Bill is currently before Parliament, awaiting a date for debate. Some recommendations from the 2005 FSAP have been integrated into the Bill. A draft Credit Union Bill is out for stakeholder comments with a deadline of May 2012. A main element of the proposed new regulations is the creation of a mandatory credit union insurance protection fund. Meanwhile, a new Securities Bill will be laid in Parliament in time to meet the International Organization of Securities Commissions (IOSCO) deadline of January 1, 2013 for compliance by all securities commissions. A key provision of the Bill is the ability to conduct on-site inspections without a court order. The Central Bank is also spearheading work on the development of a National Financial Crisis Management Plan for the banking sector. Structural Reforms and Statistical Issues 15. The authorities are aware of the challenges in public service administration and they are moving to address them comprehensively. A job evaluation exercise for the civil service, ultimately aimed at improving the delivery efficiency of public services, will commence during the second quarter of 2012. This exercise is also intended to address the anomaly of a sizeable contractual workforce co-existing with significant vacancies for permanent positions on the establishment. 16. Under the umbrella of public financial management reform, there is a move towards performance-based budgeting and the automation of the budget process with the assistance of the World Bank. To complement this exercise, Cabinet approved the establishment of a special unit in the Ministry of Finance to monitor the implementation of budget measures.
5
With the assistance of the International Finance Corporation (IFC), this unit is also expected to manage public-private partnership modules and guide the process for the public offering of some state-owned enterprises. 17. Measures to augment the tax effort are underway. The passage of the Data Protection Act and the Electronic Transactions Act in 2011 has enabled the Board of Inland Revenue (BIR) to advance measures that would facilitate the electronic submission of tax returns. In addition, the BIR has transitioned to a risk-based auditing approach in order to improve the efficiency of the auditing process. The European Union is also assisting the BIR with an electronic tax invoicing system. 18. Pursuant to the concerns raised by staff about a possible upward bias in the calculation of the Index of Retail Prices (RPI) in the 2010 Staff Report, a STA/CARTAC TA report completed in February 2012 identified a flaw in the methodology which led to an overestimation of changes in the Food and Non-Alcoholic Beverages sub-index. The Central Statistical Office (CSO) has acknowledged the findings and has moved to speedily correct the deficiencies in the existing RPI ahead of the completion of a more substantive rebasing exercise. Based on the results of the 2009 Household Budgetary Survey, the consumption basket underlying the RPI is in the process of being updated and is scheduled for completion by June 2012.