imf country report no. 14/110 republic of palau · imf country report no. 14/110 republic of palau...
TRANSCRIPT

©2014 International Monetary Fund
IMF Country Report No. 14/110
REPUBLIC OF PALAU 2014 ARTICLE IV CONSULTATION—STAFF REPORT; PRESS RELEASE; AND STATEMENT BY THE EXECUTIVE DIRECTOR FOR THE REPUBLIC OF PALAU
Under Article IV of the IMF’s Articles of Agreement, the IMF holds bilateral discussions with members, usually every year. In the context of the 2014 Article IV consultation with the Republic of Palau, the following documents have been released and are included in this package: The Staff Report prepared by a staff team of the IMF for the Executive Board’s
consideration on April 23, 2014, following discussions that ended on February 27, 2014, with the officials of Palau on economic developments and policies. Based on information available at the time of these discussions, the staff report was completed on April 7, 2014.
An Informational Annex prepared by the IMF.
A Press Release summarizing the views of the Executive Board as expressed during its April 23, 2014 consideration of the staff report that concluded the Article IV consultation with Palau.
A Statement by the Executive Director for the Republic of Palau.
The following document has been or will be separately released Selected Issues Paper
The publication policy for staff reports and other documents allows for the deletion of market-sensitive information.
Copies of this report are available to the public from
International Monetary Fund Publication Services PO Box 92780 Washington, D.C. 20090
Telephone: (202) 623-7430 Fax: (202) 623-7201 E-mail: [email protected] Web: http://www.imf.org
Price: $18.00 per printed copy
International Monetary Fund Washington, D.C.
May 2014
REPUBLIC OF PALAU STAFF REPORT FOR THE 2014 ARTICLE IV CONSULTATION
KEY ISSUES Context. After two years of strong performance, growth slowed down in FY2013 due to declines in construction and tourism, while inflation moderated thanks to stable international food and fuel prices. The outlook points to a modest recovery, but Palau’s heavy reliance on tourism, grants, and food and fuel imports carries downside risks. Without substantial fiscal consolidation over the medium term, Palau’s fiscal position will be unsustainable when the Compact grants expire in 2024. Discussions focused on:
Managing fiscal adjustments to ensure fiscal and debt sustainability.
In the near term, replenish the fiscal buffers that were allocated for typhoon-related expenses by containing current spending and saving any additional revenue gains that are expected from recent revenue efforts.
Strengthen fiscal consolidation over the medium term through comprehensive tax reform and expenditure reform to achieve fiscal self sufficiency when the Compact grants expire.
Improve public finance management to strengthen the budget framework and ensure debt sustainability. Continue reforming public entities to contain fiscal risks and reduce government subsidies.
Promoting private sector development and financial stability to sustain growth.
Intensify efforts to diversify the economy, improve the investment climate, and address infrastructure bottlenecks in order to enhance economic resilience and growth potential.
Preserve financial stability by strengthening and broadening financial regulation and supervision.
April 7, 2014
REPUBLIC OF PALAU
2 INTERNATIONAL MONETARY FUND
Approved By Stephan Danninger and Masato Miyasaki
Discussions took place during February 12–27, 2014. The mission team comprised Mr. Feridhanusetyawan (head, APD), Mr. Dall'Orto (SEC), Ms. Hussiada (APD), Ms. Pan (World Bank), and Mr. Usui and Ms. Koshiba (Asian Development Bank). Mr. Yoon and Mr. Remengesau III (OED) also participated. The team met with President Remengesau Jr.; Minister of Finance Sadang; Minister of Natural Resource, Environment, and Tourism Sengebau; Minister of Health Ngirmang; congress members; other senior officials; and representatives of the private sector and donor community. The mission made a presentation on regional outlook and Palau’s prospects and policy priorities in the Palau National Congress. The mission’s Concluding Statement is published.
CONTENTS
OUTLOOK AND RISK _________________________________________________________________________________ 3
ENSURING FISCAL AND DEBT SUSTAINABILITY ___________________________________________________ 4
RAISING GROWTH POTENTIAL _____________________________________________________________________ 7
STAFF APPRAISAL ___________________________________________________________________________________ 11 BOX 1. Palau: Promoting Tourism and Growth ______________________________________________________________9 FIGURES 1. Real Sector Developments and Outlook __________________________________________________________ 13 2. External Sector Developments and Outlook ______________________________________________________ 14 3. Fiscal Sector Developments and Outlook _________________________________________________________ 15 4. Comparison with Other Pacific Island Countries __________________________________________________ 16 TABLES 1. Selected Economic Indicators, 2008/09–2014/15 _________________________________________________ 17 2. Medium-term Projections, 2010/11–2018/19 _____________________________________________________ 18 3. Balance of Payments, 2008/09–2017/18 __________________________________________________________ 19 4. Statement of Government Operations, 2008/09–2014/15 ________________________________________ 20 ANNEXES I. Risk Assessment Matrix ____________________________________________________________________________ 21 II. Long-Term Fiscal Sustainability Analysis __________________________________________________________ 22 III. Public Sector Debt Sustainability Analysis ________________________________________________________ 25
REPUBLIC OF PALAU
INTERNATIONAL MONETARY FUND 3
OUTLOOK AND RISK 1. Growth. After two years of strong expansion, growth is estimated at around zero in FY2013, lower than other Pacific Island Countries (PICs), owing to declines in construction and tourism (Figures 1 and 4, Table 1). Construction activities slowed down due to delayed capital grants and lower capital spending during the change in administration in early FY2013. Contributing factors to the decline in tourism include the cessation of some flights from Asia, the increase in tourism-related fees, and the U.S. dollar appreciation. Typhoon Haiyan last November had minimal impact on growth, which is projected to increase to 1¾ percent in FY2014 and to 2¼–2½ percent over the medium term. The sources of growth include the recovery in tourism driven by new hotel developments and resumption of direct flights, and infrastructure developments financed by foreign loans and grants (Table 2).1
2. Inflation and credit growth. Inflation declined to 2¾ percent (annual average) in FY2013 thanks to stable international food and fuel prices, and it is expected to stay around 3 percent in FY2014 and increase slightly during FY2015–16 due to the expected implementation of a value-added tax (VAT). Bank credit increased 11½ percent in 2013, while the nonperforming loan ratio remained broadly flat at 3¾ percent.
3. External stability. The current account deficit deteriorated slightly last fiscal year due to lower tourist arrivals and large reconstruction imports associated with typhoon Bopha, but tourism recovery and moderating food and fuel prices are expected to reduce the deficit in FY2014–15 (Figure 2, Table 3). After worsening slightly in FY2016–18 due to imports related to infrastructure projects, the deficit would narrow to 5½ percent of GDP over the medium term and remain fully funded by grants, loans, and FDI. Palau’s food and fuel imports partly depend on tourism receipts, and this serves as an automatic stabilizer to the current account. The real effective exchange rate increased 4½ percent (y/y average) in FY2013 owing to the U.S. dollar appreciation, but it is in line with the PIC average, and the exchange rate assessment provides little evidence of fundamental misalignment. However, heavy reliance on tourists from a few economies would remain a vulnerability, and weaknesses in infrastructure and investment climate could hinder development of tourism-related businesses. Therefore, strengthening fiscal consolidation and improving competitiveness by improving infrastructure and the business climate are essential for maintaining
1 A new Asian Development Bank loan of US$29 million (12 percent of FY2013 GDP) to finance water and sanitation projects would be mostly disbursed during FY2015–19.
Norm Projection Average Range
Macroeconomic balance -4.7 -6.2 4.0 (-3.8, 14.4)
Equilibrium real exchange rate … … 5.5 (1.7, 7.0)
External sustainability -4.2 -6.5 6.1 …
Source: Fund staff estimates.
Current account (percent of GDP)
Exchange rate overvaluation (percent)
Palau: Real Exchange Rate Assessments 1/
1/ These assessments are subject to large measurement errors given data limitation and Palau's specific circumstances such as heavy reliance on tourism and grants.
Consultative Group on Exchange Rate (CGER) Methodology
REPUBLIC OF PALAU
4 INTERNATIONAL MONETARY FUND
external stability going forward. The use of the U.S. dollar as Palau’s legal tender remains appropriate.2
4. Risks, spillovers, and policy responses. Palau’s modest outlook is subject to downside risks. Financial market volatility and growth slowdown in Asia, U.S. dollar appreciation, and natural disasters, including those related to climate change, could hurt tourism and growth, weakening external and fiscal positions (Annex I). Palau’s heavy reliance on food and fuel imports also makes it susceptible to commodity price volatility. Given the absence of monetary and exchange rate policies, Palau will continue to rely on fiscal measures and structural reforms to address these risks. Successful fiscal consolidation is needed to build adequate fiscal buffers and ensure long-term fiscal sustainability and external stability. Improving investment and business climate would help diversify the economy, reduce economic vulnerability, and support growth.
5. The authorities’ views. The authorities shared the staff’s views on the economic outlook, risks, and policy responses. They indicated that the decline in construction played a more important role than tourism in explaining last year’s growth slowdown. They noted that the priority is not increasing the quantity but the quality of tourists in order to preserve Palau’s pristine environment, while at the same time raise tourist spending. The authorities considered that natural disasters constitute the main risk, pointing to the recent typhoons.
ENSURING FISCAL AND DEBT SUSTAINABILITY 6. Context. Without substantial consolidation, Palau’s fiscal position will become unsustainable after the Compact grants expire in FY2024.3 Revenue collection relies heavily on tourism, contributing to volatility and vulnerability, and the disbursement of infrastructure loans in the next few years would raise the debt burden.
7. Developments and near-term outlook. Fiscal consolidation slowed in FY2013 partly due to natural disasters, but the authorities intend to put the fiscal adjustment back on track this year.
The current fiscal deficit excluding grants (fiscal anchor) is estimated to have remained unchanged at 12¼ percent of GDP in FY2013 (Figure 3, Table 4). Despite the slowdown in tourism, tax revenue continued rising thanks to increases in tourism-related taxes, higher prices in the tourism industry, as well as improvements in tax compliance. However, current spending was also larger than budgeted due to typhoon Bopha in December 2012. The cash buffers, excluding
2 The U.S. dollar has provided an important nominal anchor. Palau maintains close financial and trade linkages with the United States and, as a small state, has limited capacity to conduct its own monetary and exchange rate policy. 3 The 2010 agreement following the Compact of Free Association with the United States that will provide US$229 million in grants during 2011-24 is pending ratification by the U.S. congress, but Palau has continued to receive advances and to withdraw from the Compact Trust Fund (CTF).
REPUBLIC OF PALAU
INTERNATIONAL MONETARY FUND 5
the CTF, increased to 5 percent of GDP and the domestic accounts payables declined to 11 percent of GDP. 4
The FY2014 budget reflects the authorities’ commitment to fiscal consolidation by maintaining prudent spending and creating a reserve fund to build fiscal buffers. After typhoon Haiyan hit the country in November 2013, the authorities reallocated the planned savings of about ½ percent of GDP for reconstruction expenses. Staff supported the authorities’ intention to replenish the reserve fund by containing spending and saving additional revenue gains that are expected with the adoption of a new IT system in customs, the recent increase in the tobacco tax, and the recovery of tourism. In view of these, the current fiscal deficit (excluding grants) is projected to narrow by 1½ percent of GDP, putting the fiscal consolidation back on track.
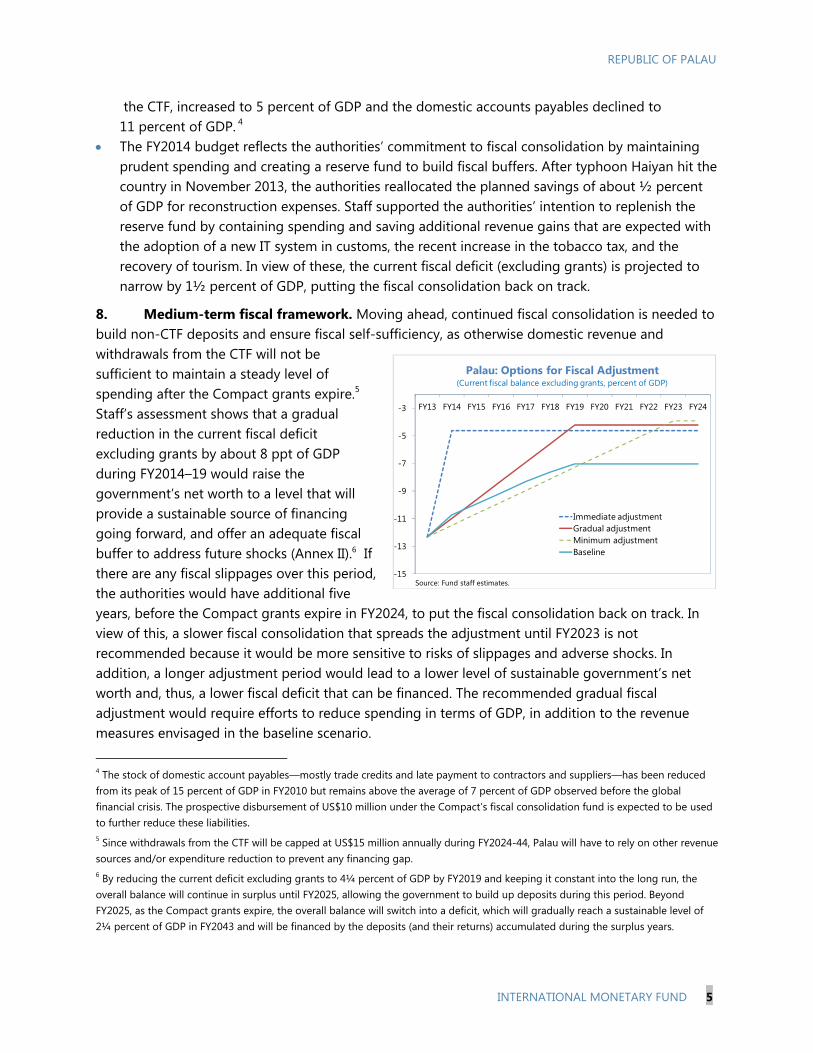
8. Medium-term fiscal framework. Moving ahead, continued fiscal consolidation is needed to build non-CTF deposits and ensure fiscal self-sufficiency, as otherwise domestic revenue and withdrawals from the CTF will not be sufficient to maintain a steady level of spending after the Compact grants expire.5 Staff’s assessment shows that a gradual reduction in the current fiscal deficit excluding grants by about 8 ppt of GDP during FY2014–19 would raise the government’s net worth to a level that will provide a sustainable source of financing going forward, and offer an adequate fiscal buffer to address future shocks (Annex II).6 If there are any fiscal slippages over this period, the authorities would have additional five years, before the Compact grants expire in FY2024, to put the fiscal consolidation back on track. In view of this, a slower fiscal consolidation that spreads the adjustment until FY2023 is not recommended because it would be more sensitive to risks of slippages and adverse shocks. In addition, a longer adjustment period would lead to a lower level of sustainable government’s net worth and, thus, a lower fiscal deficit that can be financed. The recommended gradual fiscal adjustment would require efforts to reduce spending in terms of GDP, in addition to the revenue measures envisaged in the baseline scenario.
4 The stock of domestic account payables—mostly trade credits and late payment to contractors and suppliers—has been reduced from its peak of 15 percent of GDP in FY2010 but remains above the average of 7 percent of GDP observed before the global financial crisis. The prospective disbursement of US$10 million under the Compact’s fiscal consolidation fund is expected to be used to further reduce these liabilities. 5 Since withdrawals from the CTF will be capped at US$15 million annually during FY2024-44, Palau will have to rely on other revenue sources and/or expenditure reduction to prevent any financing gap. 6 By reducing the current deficit excluding grants to 4¼ percent of GDP by FY2019 and keeping it constant into the long run, the overall balance will continue in surplus until FY2025, allowing the government to build up deposits during this period. Beyond FY2025, as the Compact grants expire, the overall balance will switch into a deficit, which will gradually reach a sustainable level of 2¼ percent of GDP in FY2043 and will be financed by the deposits (and their returns) accumulated during the surplus years.
-15
-13
-11
-9
-7
-5
-3 FY13 FY14 FY15 FY16 FY17 FY18 FY19 FY20 FY21 FY22 FY23 FY24
Immediate adjustmentGradual adjustmentMinimum adjustmentBaseline
Palau: Options for Fiscal Adjustment (Current fiscal balance excluding grants, percent of GDP)
Source: Fund staff estimates.

REPUBLIC OF PALAU
6 INTERNATIONAL MONETARY FUND
9. Comprehensive tax reform. The authorities are committed to a comprehensive tax reform aimed at simplifying the tax framework, increasing its fairness, and raising revenue capacity over the medium term. They have conducted intensive public consultations in all states, and expect to pass the tax reform bill in congress by April/May 2014 and have it implemented over the subsequent year. Implementing all components as recommended by IMF/PFTAC technical assistance (TA) is critical: (1) move to c.i.f. (cost, insurance and freight) valuation for imports for tax purposes; (2) replace the gross revenue tax (GRT) with a single rate VAT with no exemptions except for exports; (3) reduce the wage and salary tax rates for low income household to offset any price increases from VAT adoption; and (4) raise the net income tax (NIT) for financial institutions, and expand it to all VAT-registered business. If the passage of tax reform bill is delayed, staff recommended adopting c.i.f. valuation, removing import tax exemptions, broadening excise taxes, and raising the NIT for financial institutions as intermediate actions. Staff also noted the importance of communicating all aspects of the reform package to engage stakeholders and improving revenue administration capacity to support this major reform. In view of the authorities’ strong commitment to implement the comprehensive tax reform, domestic revenue is projected to increase by about 4 ppt of GDP during FY2014–19 under the baseline scenario.7
10. Expenditure reform. Medium-term fiscal adjustment also requires containing current spending while ensuring adequate public services. Since the wage bill represents about half of current spending, controlling its growth continues to be the top priority. Staff estimated that containing the increase in wage bill below the inflation rate, complemented by civil service reforms, could reduce current spending by 4 ppt of GDP during FY2014–19. By implementing both expenditure and revenue reforms under the gradual adjustment scenario, Palau would be able secure long-term fiscal sustainability.8
11. Public finance management. Given the disbursement of new infrastructure loans, sound management of public debt and strong governance of loan-funded infrastructure projects would help ensure debt sustainability and minimize fiscal risks. The debt sustainability analysis indicates that Palau’s public debt risk remains low after the disbursement of Asian Development Bank (AsDB) water and sanitation loans. However, continued fiscal consolidation is needed to place the debt on a downward path (Annex III). Staff advised the authorities to continue directing external loans and
7 These potential revenue gains are achievable compared to the impact of VAT implementation in other countries and considering the fact that Palau’s income tax and goods and services tax in terms of GDP are currently among the lowest in the region 8 The impact of current spending reduction on growth is estimated to be small, at -¼ percent annually during the adjustment period (Table 2).
Baseline(Revenue)
RevenueTax reforms, including Value Added Tax and Net Income Tax
3.5 3.5
Improvement in nontax administration
0.5 0.5
ExpenseCivil service reforms 1.3 4.0
Total 5.3 8.0Source: Fund staff estimates.
(Measures)Scenario Gradual Adjustment
(Revenue and Expenditure)
The Impact of Fiscal Reforms, FY2014–19 (ppt. of GDP)
REPUBLIC OF PALAU
INTERNATIONAL MONETARY FUND 7
grants to infrastructure projects that will promote tourism and growth. Staff also encouraged the authorities to implement the medium-term budget framework, supported by AsDB TA, and continue improving budget execution and planning and strengthening cash management. Prudent management of the newly established reserve fund would also help safeguard fiscal buffers.
12. Reforming public entities. Staff welcomed recent reforms to make the Civil Service Pension Fund (CSPF) and Social Security Fund (SSF) more sustainable, including by replacing the 30-year service mandatory retirement with a mandatory retirement age for civil servants, increasing the social security entitlement age, and adjusting benefit structures. The authorities made further progress in clearing government arrears to these funds and improving contribution compliance. The upcoming actuarial valuations should assess the impact of the recent measures on the funds’ financial positions.9 The merger of Palau Public Utilities Company and Palau Water and Sewer Corporation was completed in June 2013. The new public utility company is mandated to improve water and sewer services and raise tariffs accordingly in order to reach full cost recovery of water and sewer operations in 2016. Nonetheless, electricity operation will continue to rely on subsidies, grants, and/or loans to finance capital spending. Staff encouraged the authorities to continue reforming the utility company to achieve full cost recovery in all operations.
13. The authorities’ views. The authorities reiterated their commitment to fiscal consolidation and prudent debt management, and confirmed that staff’s recommendations are broadly in line with their medium-term budget framework. They appreciated the IMF/PFTAC TA in designing the tax reform, and remained cautiously optimistic that the tax reform bill, including a value added tax, would be passed. The reform is also expected to raise the NIT for financial institutions and expand its coverage to all-VAT registered business, but the authorities indicated that this would be done in stages given capacity consideration and the need to build ownership among stakeholders to support the reform. The authorities agreed with staff’s advice to contain the wage bill growth but noted that the priority at this stage is to pass the tax reform bill. Looking forward, potential measures for civil service reforms could include enforcing mandatory retirement, upgrading the work ladder to attract better qualified candidates, aligning salaries with performance, reducing temporary workers, and retraining of public servant to prevent new hiring. The authorities plan to further strengthen the CSPF by switching it from a defined-benefit to a defined-contribution framework and expanding it to include the private sector. They also shared staff’s assessment that the risk of debt distress remains low, but it is sensitive to fiscal slippages and a growth slowdown.
RAISING GROWTH POTENTIAL 14. Context. Palau faces a number of structural constraints common to small islands: a narrow economic base, remote location, small population, insufficient infrastructure, and weaknesses in investment climate. The banking system remains sound, but the National Development Bank of Palau
9 The CSPF and SSF are not part of Palau’s central government. The 2011 actuarial estimates, calculated as the difference between the present values of accrued liabilities and trust assets, are US$104 million in CSPF and US$91 million in SSF. A large part of CSPF’s unfunded liabilities are the result of the 30-year service mandatory retirement that was abolished recently.
REPUBLIC OF PALAU
8 INTERNATIONAL MONETARY FUND
(NDBP) remains outside the Financial Institution Commission’s (FIC) supervision.10 Commercial banks continue to provide limited credit and place most of their assets abroad due to credit risks and narrow domestic investment opportunities.
15. Private sector development. Fiscal adjustment to preserve macroeconomic stability should work jointly with structural reforms to raise competitiveness, promote private sector development, and sustain growth. In this context, diversifying the economy, addressing infrastructure bottlenecks, and improving business and investment climate remain key priorities.
Diversifying the sources of growth. Since tourism will remain the main source of growth, promoting diversification within and outside the tourism industry could improve economic resilience (Box 1).
Addressing infrastructure bottlenecks. Expansion of basic infrastructure, such as water and sanitation system, is needed to promote development of new hotels and raise tourism growth. Although Palau compares favorably to peers, further improvements in the road network, aviation connectivity, and telecommunication infrastructure would support economic diversification and enhance growth potential.
Improving business and investment climates. Adopting a new foreign investment regime to simplify investment approval and open all business activities to foreign investment through joint ventures, continue to be the priorities.11 The recent establishment of the Economic Advisory Group comprising representatives of the government, congress, and the private sector would strengthen coordination between the private and public sectors and improve policy formulation and planning. The authorities’ plan to pass labor reforms aimed at guaranteeing fair compensations, safer working conditions, and steadfast resolution of labor disputes, should help protect employees and improve business climate. The initiative to improve foreign workers’ flexibility to switch jobs would also improve productivity and promote inclusive growth.
10 The NDBP is a development finance organization, 100 percent government owned. Its loan portfolio amounts to about US$25 million (10 percent of FY2013 GDP) and it is directed mainly to commercial (tourism, retail stores, etc.) and housing loans, and a small amount to agriculture and fishing. Audited financial statements are publicly available, but the bank is exempt from FIC’s regulation and oversight. 11 Palau’s rank in the 2014 World Bank’s doing business indicators improved from 114 to 100, but there is ample room to strengthen investor protection, contract enforcement, and business-startup procedures.

REPUBLIC OF PALAU
INTERNATIONAL MONETARY FUND 9
Box 1. Palau: Promoting Tourism and Growth
Tourism plays an important role in Palau’s economy. As a world class diving destination, Palau receives tourists more than five times of its population every year. In the recent years, tourism has contributed about three quarters of GDP growth, more than 80 percent of exports of goods and services, 15 percent of total tax revenue, and 40 percent of total employment. Cross-country data indicate that Palau fares well compared to its peers in terms of tourism’s contribution to the economy, although the availability of hotel rooms is more limited.
Palau’s heavy reliance on tourism contributes to economic volatility and vulnerability. Tourism is susceptible to global economic and financial conditions, and the reliance on tourists and direct flights from only a few Asian economies leads to tourism volatility. In addition, a limited number of hotel rooms, partly due to infrastructure bottlenecks, hamper tourism and GDP growth. Meanwhile, spending per tourist has remained flat for the past decade, suggesting limited increase in higher-income tourists. In addition, heavy reliance on food and fuel imports makes Palau vulnerable to sharp fluctuations in global commodity prices.
Developing the private sector by promoting economic diversification would strengthen economic resilience and enhance growth potential. Diversification within the tourism industry includes developing new tourist attractions (for example, golf courses, aquatic sports), increasing flight connectivity with more countries, and attracting a larger number of higher-income tourists to increase tourists’ spending. Diversification outside the tourism industry could entail developing agriculture and aquaculture (for example, fish or clam farming) to supply the tourism industry with domestic products and expanding the service industry. Moreover, the domestic value added would be greater if a larger share of the supply chain of tourism-related operations such as production and marketing of products and services was based in Palau instead of overseas. In this context, Palau’s efforts to diversify the economy and promote private sector development should be underpinned by structural reforms that open up the restrictive foreign investment regime and solve pressing infrastructure bottlenecks, such as deficient water and sewer system and limited internet connectivity.
Sources: Country authorities; World Travel and Tourism Council, Country Reports; The Compendium of Tourism Statistics, World Tourism Organization; and Fund
staff calculations. For Palau some data are from the 2012 Statistical Yearbook.
0
10
20
30
40
50
2009 2010 2011 2012 2013
Palau Maldives Fiji Vanuatu Tonga
Travel and Tourism Activities in the Economy(In percent of GDP)
Note: For Palau, it assumes GDP in trade, transport and storage, accommodation and food services, and half of construction and utilities. 0
10
20
30
40
50
60
70
80
90
2009 2010 2011 2012 2013
Palau Maldives Fiji Vanuatu Tonga
Travel Exports(In percent of total exports of goods and services)
0
10
20
30
40
50
60
2009 2010 2011 2012 2013
Palau Maldives Fiji Vanuatu Tonga
Travel and Tourism Employment(In percent of total employment)
Note: For Palau, it assumes employment in trade, transport and storage, accommodation and food services.
1.0
1.2
1.4
1.6
1.8
2.0
2009 2010 2011 2012 2013
PalauMaldivesFiji
Number of Hotel and Motel Rooms(In percent of tourist arrivals)
REPUBLIC OF PALAU
10 INTERNATIONAL MONETARY FUND
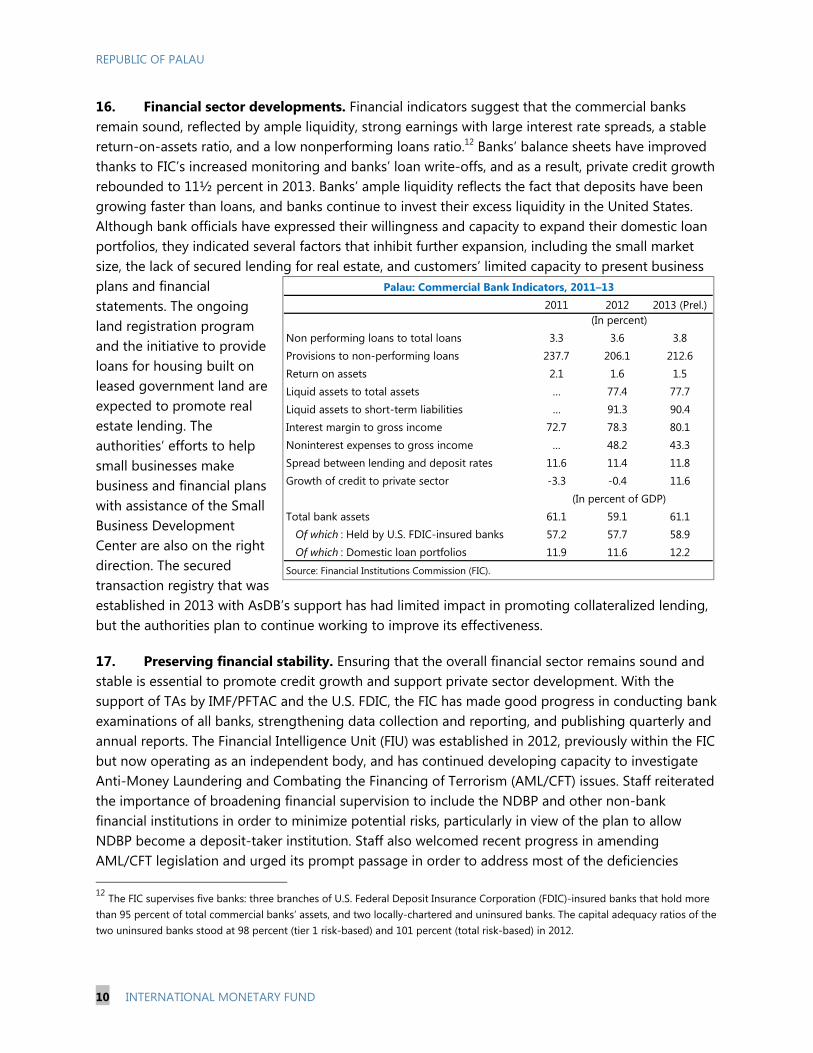
16. Financial sector developments. Financial indicators suggest that the commercial banks remain sound, reflected by ample liquidity, strong earnings with large interest rate spreads, a stable return-on-assets ratio, and a low nonperforming loans ratio.12 Banks’ balance sheets have improved thanks to FIC’s increased monitoring and banks’ loan write-offs, and as a result, private credit growth rebounded to 11½ percent in 2013. Banks’ ample liquidity reflects the fact that deposits have been growing faster than loans, and banks continue to invest their excess liquidity in the United States. Although bank officials have expressed their willingness and capacity to expand their domestic loan portfolios, they indicated several factors that inhibit further expansion, including the small market size, the lack of secured lending for real estate, and customers’ limited capacity to present business plans and financial statements. The ongoing land registration program and the initiative to provide loans for housing built on leased government land are expected to promote real estate lending. The authorities’ efforts to help small businesses make business and financial plans with assistance of the Small Business Development Center are also on the right direction. The secured transaction registry that was established in 2013 with AsDB’s support has had limited impact in promoting collateralized lending, but the authorities plan to continue working to improve its effectiveness.
17. Preserving financial stability. Ensuring that the overall financial sector remains sound and stable is essential to promote credit growth and support private sector development. With the support of TAs by IMF/PFTAC and the U.S. FDIC, the FIC has made good progress in conducting bank examinations of all banks, strengthening data collection and reporting, and publishing quarterly and annual reports. The Financial Intelligence Unit (FIU) was established in 2012, previously within the FIC but now operating as an independent body, and has continued developing capacity to investigate Anti-Money Laundering and Combating the Financing of Terrorism (AML/CFT) issues. Staff reiterated the importance of broadening financial supervision to include the NDBP and other non-bank financial institutions in order to minimize potential risks, particularly in view of the plan to allow NDBP become a deposit-taker institution. Staff also welcomed recent progress in amending AML/CFT legislation and urged its prompt passage in order to address most of the deficiencies 12 The FIC supervises five banks: three branches of U.S. Federal Deposit Insurance Corporation (FDIC)-insured banks that hold more than 95 percent of total commercial banks’ assets, and two locally-chartered and uninsured banks. The capital adequacy ratios of the two uninsured banks stood at 98 percent (tier 1 risk-based) and 101 percent (total risk-based) in 2012.
2011 2012 2013 (Prel.)
Non performing loans to total loans 3.3 3.6 3.8Provisions to non-performing loans 237.7 206.1 212.6Return on assets 2.1 1.6 1.5Liquid assets to total assets … 77.4 77.7Liquid assets to short-term liabilities … 91.3 90.4Interest margin to gross income 72.7 78.3 80.1Noninterest expenses to gross income … 48.2 43.3Spread between lending and deposit rates 11.6 11.4 11.8Growth of credit to private sector -3.3 -0.4 11.6
Total bank assets 61.1 59.1 61.1Of which : Held by U.S. FDIC-insured banks 57.2 57.7 58.9Of which : Domestic loan portfolios 11.9 11.6 12.2
Source: Financial Institutions Commission (FIC).
Palau: Commercial Bank Indicators, 2011–13
(In percent)
(In percent of GDP)

REPUBLIC OF PALAU
INTERNATIONAL MONETARY FUND 11
identified by the Asia/Pacific Group on Money Laundering. Strengthening the FIU’s capacity is also important to implement its mandate.
18. Statistics. Better data statistics would facilitate policy formulation and decision making by the private sector. Data statistics are now broadly adequate for surveillance thanks to substantial improvements over the past two years as a result of effective TA provided by IMF/PFTAC and other donors as well as hiring of new staff in the Office of Planning and Statistics (OPS). Further areas for improvement include broadening the coverage and providing more frequent reporting. Continued efforts to strengthen OPS’s capacity also remain critical in order to continue implementing TA recommendations going forward and reduce reliance on external assistance.
19. The authorities’ views. The authorities agreed that promoting private sector development and diversifying the economy are essential to support growth. They emphasized the importance of preserving a pristine environment in order to promote sustainable development. The establishment of the Bureau of Tourism, whose mandate is to ensure compliance with regulations, maintain and set standards in the tourism industry, and safeguard the quality of services, is expected to improve the quality of tourism. The authorities also indicated that the expansion of the water and sanitation systems would help address infrastructure bottlenecks which are hampering the development of new hotels. They are also making efforts to promote aquaculture and agriculture, which are outside the tourism industry, but could form part of its supply chain. The authorities agreed with the inclusion of NDBP under the FIC’s oversight and indicated the importance of improving NDBP’s capacity to comply with FIC’s requirements, including through undertaking a preliminary on-site examination before the bank becomes a deposit-taker institution.
STAFF APPRAISAL 20. Economic outlook. Growth is projected to rebound driven by tourism recovery and infrastructure developments over the medium term, and inflation is expected to remain low thanks to moderating international food and fuel prices. The external balance is stable as the current account deficit would be fully financed by official grants, loans, and FDI, and the real effective exchange rate is broadly in line with fundamentals.
21. Risks and policy responses. Palau’s modest outlook is subject to downside risks from financial market volatility and growth slowdown in Asia, a U.S. dollar appreciation, natural disasters, and the heavy reliance on food and fuel imports. In the absence of monetary and exchange rate polices, Palau will continue to depend on fiscal measures to preserve macroeconomic stability and on structural reforms to diversify the economy and promote private sector development.
22. Fiscal consolidation. The authorities’ commitment to substantial fiscal adjustment over the medium term and passing a comprehensive tax reform bill this year are welcome. Staff emphasize that all components of the tax reform are critical and improvements in revenue administration capacity is needed to support this major reform. Since tax reform alone is not sufficient to ensure long-term fiscal sustainability, staff also recommend expenditure reform to contain current spending growth and support the fiscal consolidation.

REPUBLIC OF PALAU
12 INTERNATIONAL MONETARY FUND
23. Structural fiscal reforms. Strengthening public financial management would support fiscal consolidation and improve fiscal discipline and transparency. Sound management of public debt and strong governance of loan-funded infrastructure projects would ensure debt sustainability and minimize fiscal risks. Staff encourage the authorities to continue strengthening the pension and social security systems and reforming the public utility company to achieve full cost recovery.
24. Private sector development. Promoting diversification within and outside the tourism industry would improve economic resilience. Further improvements in infrastructure and structural reforms to strengthen investment climate, including by reforming the foreign investment regime, would support economic diversification, enhance growth potential, and promote inclusive growth.
25. Financial sector. The financial sector remains sound, and continued progress in strengthening financial supervision is welcome. Broadening financial supervision to include the NDBP and other non-bank financial institutions is crucial to preserve the sector’s stability going forward.
26. It is recommended that the next Article IV consultation take place on a 24-month consultation cycle. Staff support the authorities’ request that Fund surveillance missions take place during the budget preparation in the second half of the fiscal year.

REPUBLIC OF PALAU
INTERNATIONAL MONETARY FUND 13
Figure 1. Palau: Real Sector Developments and Outlook After strong performance in FY2010–12, growth slowed down in FY2013 due to declines in construction and tourism.
Tourist arrivals from Taiwan Province of China, Japan, and Korea declined sharply, while those from China increased.
Growth is projected to rebound this year thanks to tourism recovery.
However, Palau’s growth remains volatile and vulnerable to external shocks, given its heavy reliance on tourism and grants.
Inflation declined in FY2013 and is projected to remain low thanks to moderating international food and fuel prices.
Loan write-offs led to a decline in the loan-to-GDP and NPL ratios, but banks continue to invest overseas due to credit risks and limited domestic opportunities.
Sources: Country authorities; and Fund staff estimates and projections.
-15
-10
-5
0
5
10
15
-15
-10
-5
0
5
10
15
FY06 FY07 FY08 FY09 FY10 FY11 FY12 FY13
Tourism-related (hotel, restaurant, transport etc.)Public administration, education, healthConstructionOthersReal GDP growth
Contribution to GDP Growth(In percent)
-20
-15
-10
-5
0
5
10
15
20
25
30
-20
-15
-10
-5
0
5
10
15
20
25
30
FY06 FY07 FY08 FY09 FY10 FY11 FY12 FY13
OtherTaiwan Province of ChinaKoreaJapanChina
Contribution to Tourism Growth(Growth of tourist arrivals by country of origin, in percent)
-15
-10
-5
0
5
10
15
20
25
30
-30
-15
0
15
30
45
60
FY06 FY07 FY08 FY09 FY10 FY11 FY12 FY13 FY14
GDP growth (RHS)
Tourist arrivals
Pacific Island Countries (PIC) avg. GDP growth (RHS)
Real GDP and Tourist Arrivals( Year-on-year percent change)
-15
-10
-5
0
5
10
15
-15
-10
-5
0
5
10
15
Solo
mon
Isla
nds
Pala
u
Vanu
atu
Sam
oa
Kirib
ati
Tuva
lu
Tong
a
Mic
rone
sia
Mar
shal
l Isl
ands Fiji
Papu
a N
ew G
uine
a
Volatility of GDP Growth, 2000-2013(In percent)
(minimum, quartile 1, median, quartile 3, maximum)
-20
-10
0
10
20
30
40
-20
-10
0
10
20
30
40
FY06 FY07 FY08 FY09 FY10 FY11 FY12 FY13 FY14
Headline (RHS)
WEO food prices
PIC avg. headline (RHS)
Inflation(Year-on-year percent change)
0
10
20
30
40
50
60
70
80
0
10
20
30
40
50
60
70
80
2009 2010 2011 2012 2013 (Prel.)
Banks' other assets Banks' domestic loans NPL ratio
Banks Assets (In percent of GDP)
REPUBLIC OF PALAU
14 INTERNATIONAL MONETARY FUND
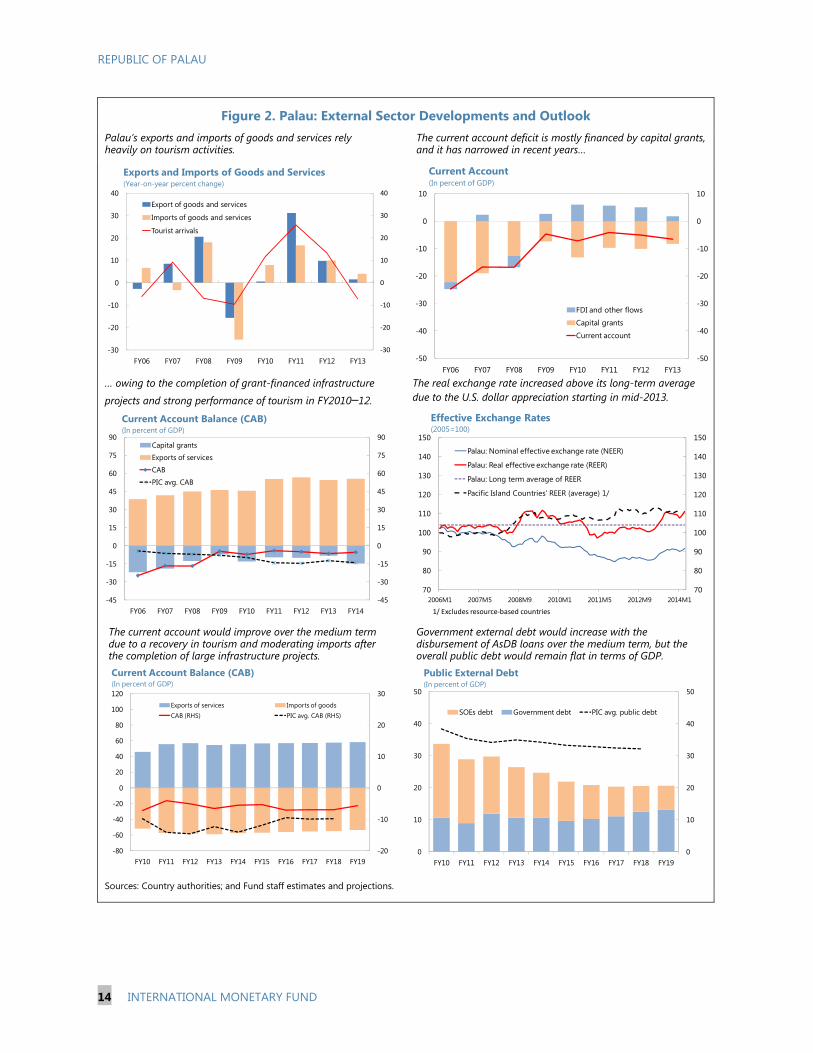
Figure 2. Palau: External Sector Developments and Outlook Palau’s exports and imports of goods and services rely heavily on tourism activities.
The current account deficit is mostly financed by capital grants, and it has narrowed in recent years…
… owing to the completion of grant-financed infrastructure
projects and strong performance of tourism in FY2010–12.
The real exchange rate increased above its long-term average due to the U.S. dollar appreciation starting in mid-2013.
The current account would improve over the medium term due to a recovery in tourism and moderating imports after the completion of large infrastructure projects.
Government external debt would increase with the disbursement of AsDB loans over the medium term, but the overall public debt would remain flat in terms of GDP.
Sources: Country authorities; and Fund staff estimates and projections.
‐30
-20
-10
0
10
20
30
40
-30
-20
-10
0
10
20
30
40
FY06 FY07 FY08 FY09 FY10 FY11 FY12 FY13
Export of goods and services
Imports of goods and services
Tourist arrivals
Exports and Imports of Goods and Services(Year-on-year percent change)
-50
-40
-30
-20
-10
0
10
-50
-40
-30
-20
-10
0
10
FY06 FY07 FY08 FY09 FY10 FY11 FY12 FY13
FDI and other flows
Capital grants
Current account
Current Account(In percent of GDP)
-45
-30
-15
0
15
30
45
60
75
90
-45
-30
-15
0
15
30
45
60
75
90
FY06 FY07 FY08 FY09 FY10 FY11 FY12 FY13 FY14
Capital grants
Exports of services
CAB
PIC avg. CAB
Current Account Balance (CAB)(In percent of GDP)
70
80
90
100
110
120
130
140
150
70
80
90
100
110
120
130
140
150
2006M1 2007M5 2008M9 2010M1 2011M5 2012M9 2014M1
Palau: Nominal effective exchange rate (NEER)
Palau: Real effective exchange rate (REER)
Palau: Long term average of REER
Pacific Island Countries' REER (average) 1/
Effective Exchange Rates(2005=100)
1/ Excludes resource-based countries
-20
-10
0
10
20
30
-80
-60
-40
-20
0
20
40
60
80
100
120
FY10 FY11 FY12 FY13 FY14 FY15 FY16 FY17 FY18 FY19
Exports of services Imports of goodsCAB (RHS) PIC avg. CAB (RHS)
Current Account Balance (CAB)(In percent of GDP)
0
10
20
30
40
50
0
10
20
30
40
50
FY10 FY11 FY12 FY13 FY14 FY15 FY16 FY17 FY18 FY19
SOEs debt Government debt PIC avg. public debt
Public External Debt(In percent of GDP)

REPUBLIC OF PALAU
INTERNATIONAL MONETARY FUND 15
Figure 3. Palau: Fiscal Sector Developments and Outlook Despite the decline in tourism in FY2013, revenue collection continued to increase thanks to higher tax rates and improved tax compliance.
However, current spending in FY2013 was larger-than-budgeted mainly due to reconstruction expenses caused by typhoon Bopha.
In addition, Palau’s wage bill increased last year due to a cost-of-living adjustment and remains high compared with peers, providing scope for spending reforms.
As a result, after three years of improvement driven by robust tourism and economic buoyancy, the pace of fiscal consolidation slowed in FY2013.
Comprehensive tax and spending reforms would help sustain fiscal consolidation over the medium term…
…and increase government savings to achieve fiscal self sufficiency after the Compact grants expire.
Sources: Country authorities; and Fund staff estimates.
0
10
20
30
0
10
20
30
FY06 FY07 FY08 FY09 FY10 FY11 FY12 FY13 FY14
Tax revenue Other revenue PIC average
Domestic Revenue(In percent of GDP)
0
10
20
30
40
50
0
10
20
30
40
50
FY06 FY07 FY08 FY09 FY10 FY11 FY12 FY13 FY14
Goods and services Other expenses Wage bill
Current Spending(In percent of GDP)
20
30
40
50
20
30
40
50
2006 2007 2008 2009 2010 2011 2012 2013
Wage bill / Revenue (Palau)Wage bill / Revenue (PIC average)Wage bill / Expenditure (Palau)Wage bill / Expenditure (PIC average)
Wage Bill(In percent)
-30
-15
0
15
30
45
-45
-30
-15
0
15
30
45
60
75
FY06 FY07 FY08 FY09 FY10 FY11 FY12 FY13 FY14
Domestic revenuesCurrent expendituresCurrent grantsOverall balance (RHS)Current balance (RHS)PIC avg. overall balance (RHS)
Fiscal Balance(In percent of GDP)
-40
-30
-20
-10
0
10
20
30
40
50
-40
-30
-20
-10
0
10
20
30
40
50
FY10 FY11 FY12 FY13 FY14 FY15 FY16 FY17 FY18 FY19
Domestic revenuesCurrent expenditures, baseline scenarioCurrent expenditures, adjustment scenarioCurrent balance, baseline scenarioCurrent balance, adjustment scenario
Medium Term Fiscal Framework(In percent of GDP)
0
5
10
15
20
0
5
10
15
20
FY10 FY11 FY12 FY13 FY14 FY15 FY16 FY17 FY18 FY19
Baseline scenario (only revenue reforms)
Adjustment scenario (revenue and spending reforms)
Government Currency and Deposits (In percent of GDP)
REPUBLIC OF PALAU
16 INTERNATIONAL MONETARY FUND
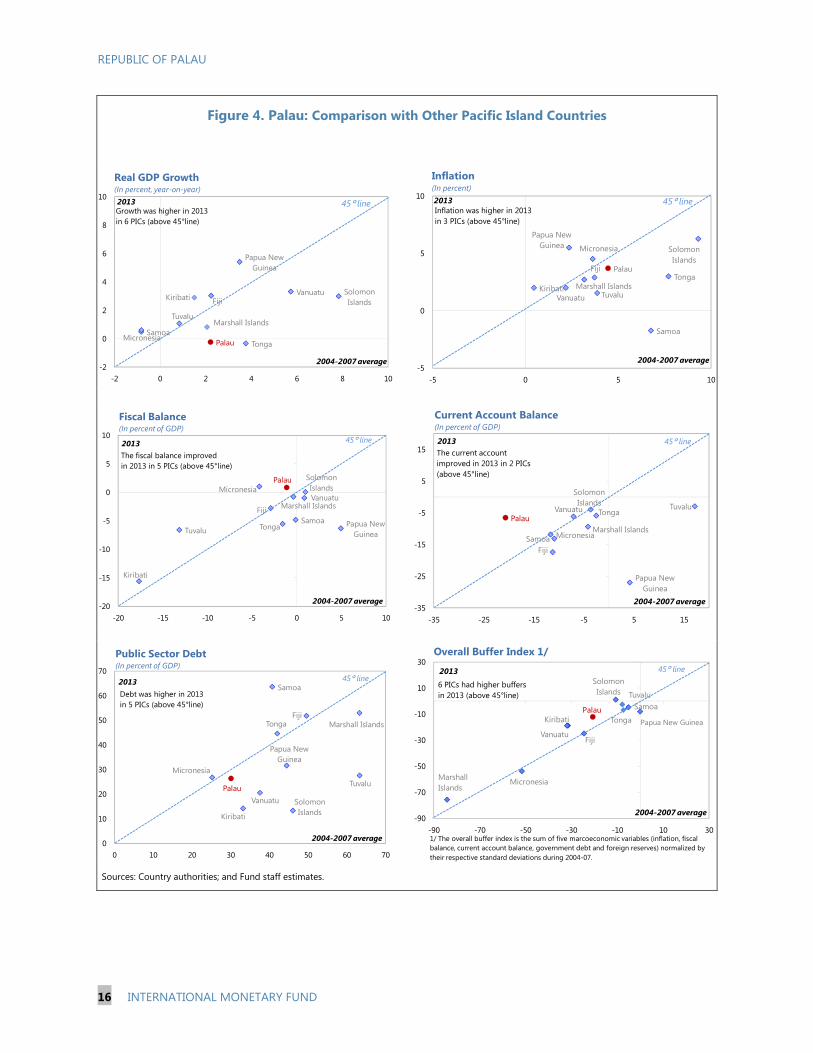
Figure 4. Palau: Comparison with Other Pacific Island Countries
Sources: Country authorities; and Fund staff estimates.
Palau
Solomon IslandsFijiKiribati
Vanuatu
Papua New Guinea
SamoaTonga
Marshall Islands
Micronesia
Tuvalu
-2
0
2
4
6
8
10
-2 0 2 4 6 8 10
2013 45° line
2004-2007 average
Growth was higher in 2013 in 6 PICs (above 45°line)
Real GDP Growth(In percent, year-on-year)
Palau
Solomon Islands
Fiji
KiribatiVanuatu
Papua New Guinea
Samoa
TongaMarshall Islands
Micronesia
Tuvalu
-5
0
5
10
-5 0 5 10
2013 45° line
2004-2007 average
Inflation was higher in 2013in 3 PICs (above 45°line)
Inflation(In percent)
Palau Solomon Islands
Fiji
Kiribati
Vanuatu
Papua New Guinea
SamoaTonga
Marshall Islands
Micronesia
Tuvalu
-20
-15
-10
-5
0
5
10
-20 -15 -10 -5 0 5 10
2013 45° line
2004-2007 average
The fiscal balance improvedin 2013 in 5 PICs (above 45°line)
Fiscal Balance(In percent of GDP)
Palau
Solomon Islands
Fiji
Vanuatu
Papua New Guinea
Samoa
Tonga
Marshall IslandsMicronesia
Tuvalu
-35
-25
-15
-5
5
15
-35 -25 -15 -5 5 15
2013 45° line
2004-2007 average
The current account improved in 2013 in 2 PICs (above 45°line)
Current Account Balance(In percent of GDP)
Palau
Solomon Islands
Fiji
Kiribati
Vanuatu
Papua New Guinea
Samoa
Tonga Marshall Islands
Micronesia
Tuvalu
0
10
20
30
40
50
60
70
0 10 20 30 40 50 60 70
2013 45° line
2004-2007 average
Debt was higher in 2013 in 5 PICs (above 45°line)
Public Sector Debt(In percent of GDP)
Solomon Islands
Fiji
Kiribati
Vanuatu
Samoa
Tonga
Micronesia
Tuvalu
-90
-70
-50
-30
-10
10
30
-90 -70 -50 -30 -10 10 30
2013 45° line
2004-2007 average
6 PICs had higher buffers in 2013 (above 45°line)
Overall Buffer Index 1/
1/ The overall buffer index is the sum of five marcoeconomic variables (inflation, fiscal balance, current account balance, government debt and foreign reserves) normalized by their respective standard deviations during 2004-07.
Marshall Islands
Papua New Guinea
Palau
REPUBLIC OF PALAU
INTERNATIONAL MONETARY FUND 17
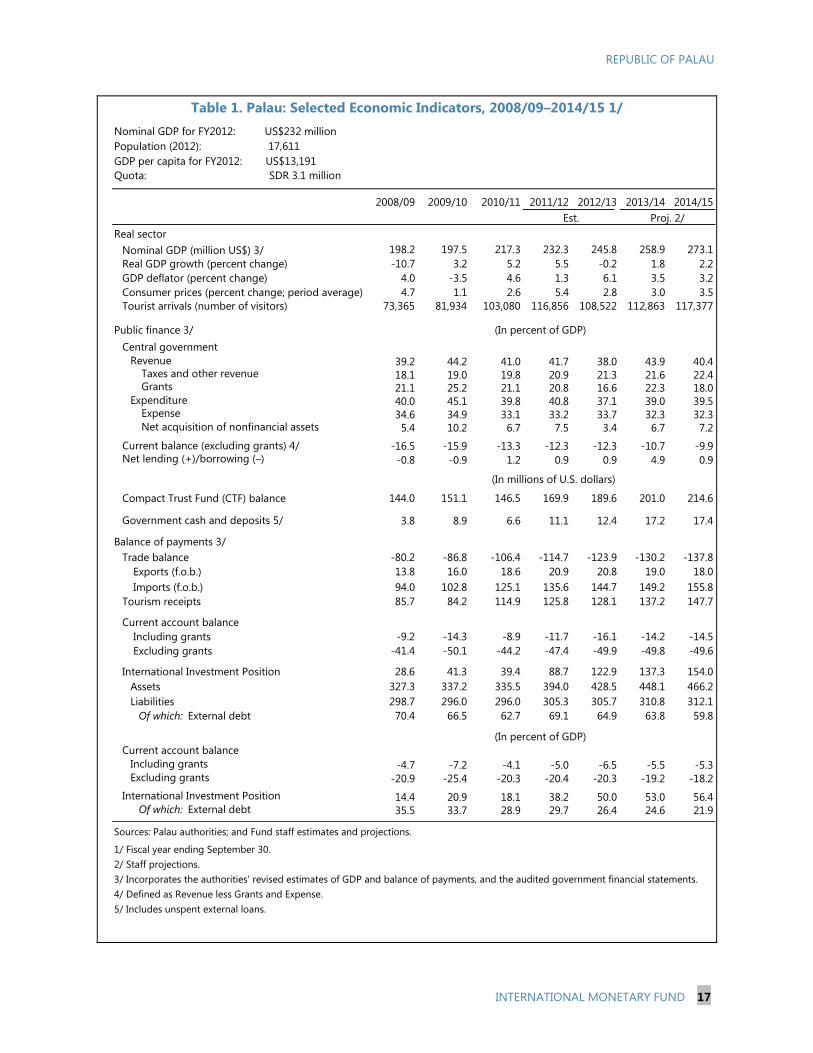
Nominal GDP for FY2012: US$232 million Population (2012): 17,611GDP per capita for FY2012: US$13,191Quota: SDR 3.1 million
2008/09 2009/10 2010/11 2011/12 2012/13 2013/14 2014/15
Real sectorNominal GDP (million US$) 3/ 198.2 197.5 217.3 232.3 245.8 258.9 273.1Real GDP growth (percent change) -10.7 3.2 5.2 5.5 -0.2 1.8 2.2GDP deflator (percent change) 4.0 -3.5 4.6 1.3 6.1 3.5 3.2Consumer prices (percent change; period average) 4.7 1.1 2.6 5.4 2.8 3.0 3.5Tourist arrivals (number of visitors) 73,365 81,934 103,080 116,856 108,522 112,863 117,377
Public finance 3/Central government
Revenue 39.2 44.2 41.0 41.7 38.0 43.9 40.4 Taxes and other revenue 18.1 19.0 19.8 20.9 21.3 21.6 22.4 Grants 21.1 25.2 21.1 20.8 16.6 22.3 18.0
Expenditure 40.0 45.1 39.8 40.8 37.1 39.0 39.5 Expense 34.6 34.9 33.1 33.2 33.7 32.3 32.3 Net acquisition of nonfinancial assets 5.4 10.2 6.7 7.5 3.4 6.7 7.2
Current balance (excluding grants) 4/ -16.5 -15.9 -13.3 -12.3 -12.3 -10.7 -9.9Net lending (+)/borrowing (–) -0.8 -0.9 1.2 0.9 0.9 4.9 0.9
Compact Trust Fund (CTF) balance 144.0 151.1 146.5 169.9 189.6 201.0 214.6
Government cash and deposits 5/ 3.8 8.9 6.6 11.1 12.4 17.2 17.4
Balance of payments 3/Trade balance -80.2 -86.8 -106.4 -114.7 -123.9 -130.2 -137.8
Exports (f.o.b.) 13.8 16.0 18.6 20.9 20.8 19.0 18.0 Imports (f.o.b.) 94.0 102.8 125.1 135.6 144.7 149.2 155.8
Tourism receipts 85.7 84.2 114.9 125.8 128.1 137.2 147.7
Current account balance Including grants -9.2 -14.3 -8.9 -11.7 -16.1 -14.2 -14.5 Excluding grants -41.4 -50.1 -44.2 -47.4 -49.9 -49.8 -49.6
International Investment Position 28.6 41.3 39.4 88.7 122.9 137.3 154.0Assets 327.3 337.2 335.5 394.0 428.5 448.1 466.2Liabilities 298.7 296.0 296.0 305.3 305.7 310.8 312.1
Of which: External debt 70.4 66.5 62.7 69.1 64.9 63.8 59.8
Current account balance Including grants -4.7 -7.2 -4.1 -5.0 -6.5 -5.5 -5.3Excluding grants -20.9 -25.4 -20.3 -20.4 -20.3 -19.2 -18.2
International Investment Position 14.4 20.9 18.1 38.2 50.0 53.0 56.4Of which: External debt 35.5 33.7 28.9 29.7 26.4 24.6 21.9
Sources: Palau authorities; and Fund staff estimates and projections.
1/ Fiscal year ending September 30.2/ Staff projections.3/ Incorporates the authorities' revised estimates of GDP and balance of payments, and the audited government financial statements.4/ Defined as Revenue less Grants and Expense.5/ Includes unspent external loans.
(In percent of GDP)
(In millions of U.S. dollars)
(In percent of GDP)
Proj. 2/Est.
Table 1. Palau: Selected Economic Indicators, 2008/09–2014/15 1/
REPUBLIC OF PALAU
18 INTERNATIONAL MONETARY FUND
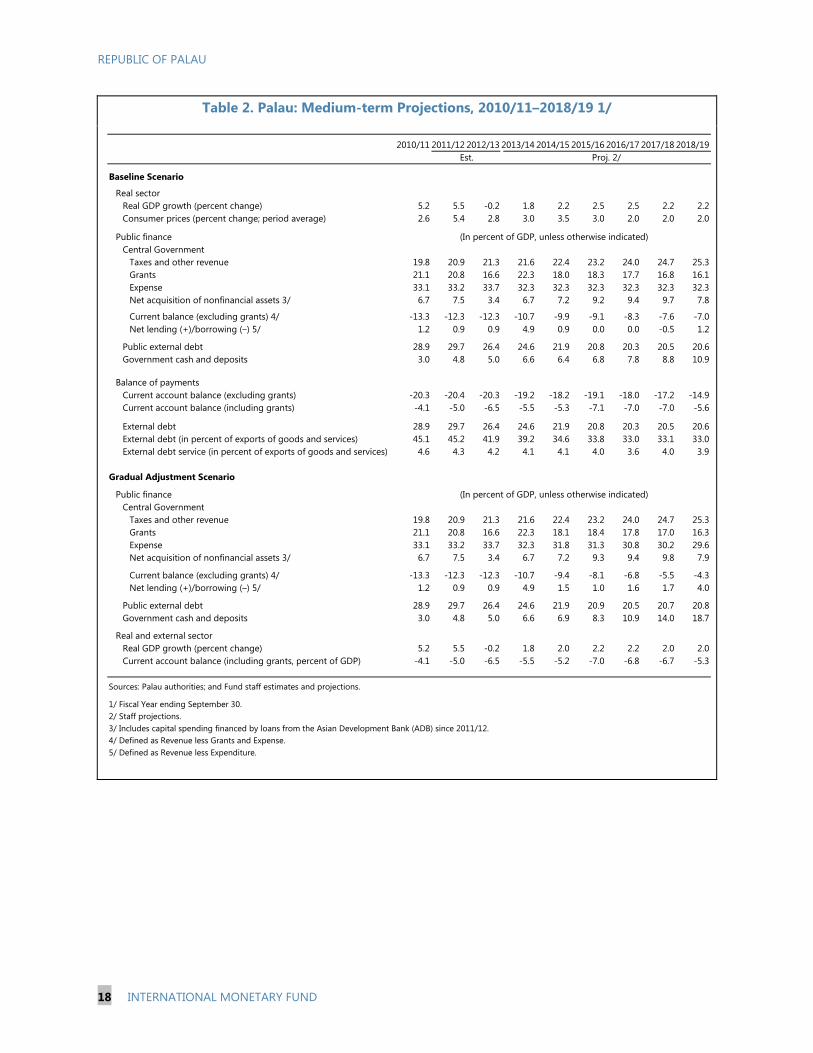
Table 2. Palau: Medium-term Projections, 2010/11–2018/19 1/
2010/11 2011/12 2012/13 2013/14 2014/15 2015/16 2016/17 2017/18 2018/19
Baseline Scenario
Real sectorReal GDP growth (percent change) 5.2 5.5 -0.2 1.8 2.2 2.5 2.5 2.2 2.2Consumer prices (percent change; period average) 2.6 5.4 2.8 3.0 3.5 3.0 2.0 2.0 2.0
Public financeCentral Government
Taxes and other revenue 19.8 20.9 21.3 21.6 22.4 23.2 24.0 24.7 25.3Grants 21.1 20.8 16.6 22.3 18.0 18.3 17.7 16.8 16.1Expense 33.1 33.2 33.7 32.3 32.3 32.3 32.3 32.3 32.3Net acquisition of nonfinancial assets 3/ 6.7 7.5 3.4 6.7 7.2 9.2 9.4 9.7 7.8
Current balance (excluding grants) 4/ -13.3 -12.3 -12.3 -10.7 -9.9 -9.1 -8.3 -7.6 -7.0Net lending (+)/borrowing (–) 5/ 1.2 0.9 0.9 4.9 0.9 0.0 0.0 -0.5 1.2
Public external debt 28.9 29.7 26.4 24.6 21.9 20.8 20.3 20.5 20.6Government cash and deposits 3.0 4.8 5.0 6.6 6.4 6.8 7.8 8.8 10.9
Balance of paymentsCurrent account balance (excluding grants) -20.3 -20.4 -20.3 -19.2 -18.2 -19.1 -18.0 -17.2 -14.9Current account balance (including grants) -4.1 -5.0 -6.5 -5.5 -5.3 -7.1 -7.0 -7.0 -5.6
External debt 28.9 29.7 26.4 24.6 21.9 20.8 20.3 20.5 20.6External debt (in percent of exports of goods and services) 45.1 45.2 41.9 39.2 34.6 33.8 33.0 33.1 33.0External debt service (in percent of exports of goods and services) 4.6 4.3 4.2 4.1 4.1 4.0 3.6 4.0 3.9
Gradual Adjustment Scenario
Public financeCentral Government
Taxes and other revenue 19.8 20.9 21.3 21.6 22.4 23.2 24.0 24.7 25.3Grants 21.1 20.8 16.6 22.3 18.1 18.4 17.8 17.0 16.3Expense 33.1 33.2 33.7 32.3 31.8 31.3 30.8 30.2 29.6Net acquisition of nonfinancial assets 3/ 6.7 7.5 3.4 6.7 7.2 9.3 9.4 9.8 7.9
Current balance (excluding grants) 4/ -13.3 -12.3 -12.3 -10.7 -9.4 -8.1 -6.8 -5.5 -4.3Net lending (+)/borrowing (–) 5/ 1.2 0.9 0.9 4.9 1.5 1.0 1.6 1.7 4.0
Public external debt 28.9 29.7 26.4 24.6 21.9 20.9 20.5 20.7 20.8Government cash and deposits 3.0 4.8 5.0 6.6 6.9 8.3 10.9 14.0 18.7
Real and external sectorReal GDP growth (percent change) 5.2 5.5 -0.2 1.8 2.0 2.2 2.2 2.0 2.0Current account balance (including grants, percent of GDP) -4.1 -5.0 -6.5 -5.5 -5.2 -7.0 -6.8 -6.7 -5.3
Sources: Palau authorities; and Fund staff estimates and projections.
1/ Fiscal Year ending September 30.2/ Staff projections.3/ Includes capital spending financed by loans from the Asian Development Bank (ADB) since 2011/12.4/ Defined as Revenue less Grants and Expense.5/ Defined as Revenue less Expenditure.
Proj. 2/Est.
(In percent of GDP, unless otherwise indicated)
(In percent of GDP, unless otherwise indicated)
REPUBLIC OF PALAU
INTERNATIONAL MONETARY FUND 19
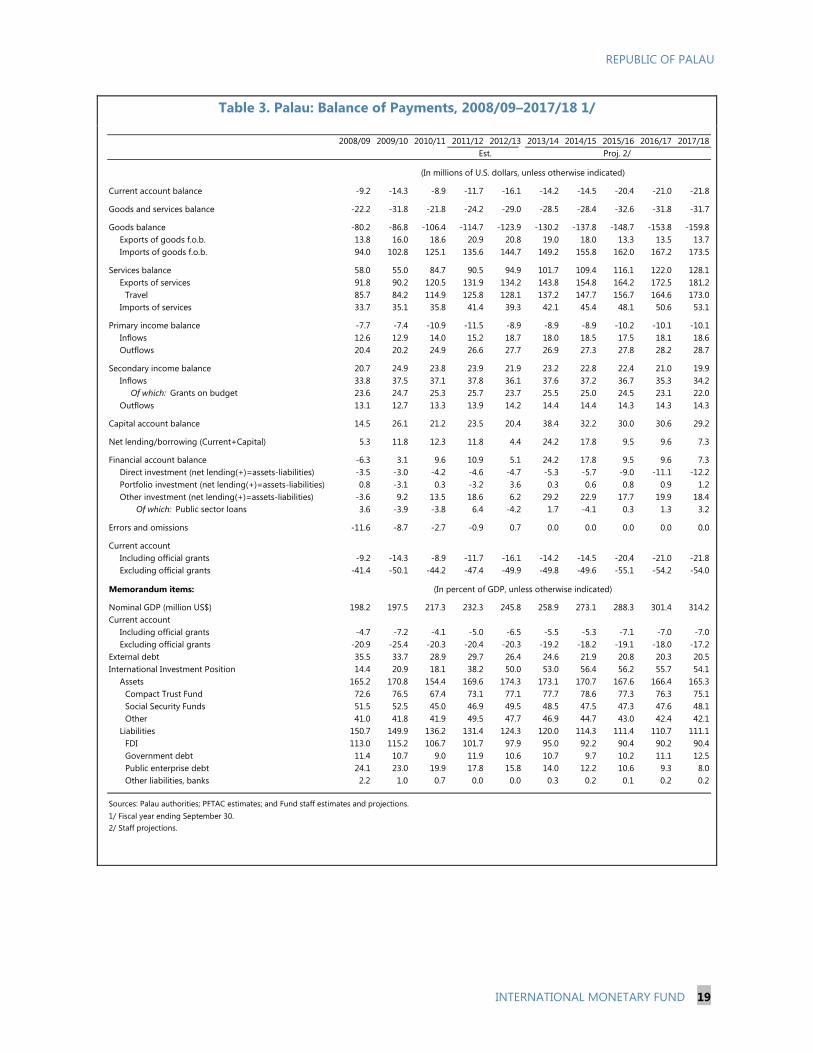
2008/09 2009/10 2010/11 2011/12 2012/13 2013/14 2014/15 2015/16 2016/17 2017/18
Current account balance -9.2 -14.3 -8.9 -11.7 -16.1 -14.2 -14.5 -20.4 -21.0 -21.8
Goods and services balance -22.2 -31.8 -21.8 -24.2 -29.0 -28.5 -28.4 -32.6 -31.8 -31.7
Goods balance -80.2 -86.8 -106.4 -114.7 -123.9 -130.2 -137.8 -148.7 -153.8 -159.8Exports of goods f.o.b. 13.8 16.0 18.6 20.9 20.8 19.0 18.0 13.3 13.5 13.7Imports of goods f.o.b. 94.0 102.8 125.1 135.6 144.7 149.2 155.8 162.0 167.2 173.5
Services balance 58.0 55.0 84.7 90.5 94.9 101.7 109.4 116.1 122.0 128.1Exports of services 91.8 90.2 120.5 131.9 134.2 143.8 154.8 164.2 172.5 181.2
Travel 85.7 84.2 114.9 125.8 128.1 137.2 147.7 156.7 164.6 173.0Imports of services 33.7 35.1 35.8 41.4 39.3 42.1 45.4 48.1 50.6 53.1
Primary income balance -7.7 -7.4 -10.9 -11.5 -8.9 -8.9 -8.9 -10.2 -10.1 -10.1Inflows 12.6 12.9 14.0 15.2 18.7 18.0 18.5 17.5 18.1 18.6Outflows 20.4 20.2 24.9 26.6 27.7 26.9 27.3 27.8 28.2 28.7
Secondary income balance 20.7 24.9 23.8 23.9 21.9 23.2 22.8 22.4 21.0 19.9Inflows 33.8 37.5 37.1 37.8 36.1 37.6 37.2 36.7 35.3 34.2
Of which: Grants on budget 23.6 24.7 25.3 25.7 23.7 25.5 25.0 24.5 23.1 22.0Outflows 13.1 12.7 13.3 13.9 14.2 14.4 14.4 14.3 14.3 14.3
Capital account balance 14.5 26.1 21.2 23.5 20.4 38.4 32.2 30.0 30.6 29.2
Net lending/borrowing (Current+Capital) 5.3 11.8 12.3 11.8 4.4 24.2 17.8 9.5 9.6 7.3
Financial account balance -6.3 3.1 9.6 10.9 5.1 24.2 17.8 9.5 9.6 7.3Direct investment (net lending(+)=assets-liabilities) -3.5 -3.0 -4.2 -4.6 -4.7 -5.3 -5.7 -9.0 -11.1 -12.2Portfolio investment (net lending(+)=assets-liabilities) 0.8 -3.1 0.3 -3.2 3.6 0.3 0.6 0.8 0.9 1.2Other investment (net lending(+)=assets-liabilities) -3.6 9.2 13.5 18.6 6.2 29.2 22.9 17.7 19.9 18.4
Of which: Public sector loans 3.6 -3.9 -3.8 6.4 -4.2 1.7 -4.1 0.3 1.3 3.2
Errors and omissions -11.6 -8.7 -2.7 -0.9 0.7 0.0 0.0 0.0 0.0 0.0
Current accountIncluding official grants -9.2 -14.3 -8.9 -11.7 -16.1 -14.2 -14.5 -20.4 -21.0 -21.8Excluding official grants -41.4 -50.1 -44.2 -47.4 -49.9 -49.8 -49.6 -55.1 -54.2 -54.0
Memorandum items:
Nominal GDP (million US$) 198.2 197.5 217.3 232.3 245.8 258.9 273.1 288.3 301.4 314.2Current account
Including official grants -4.7 -7.2 -4.1 -5.0 -6.5 -5.5 -5.3 -7.1 -7.0 -7.0Excluding official grants -20.9 -25.4 -20.3 -20.4 -20.3 -19.2 -18.2 -19.1 -18.0 -17.2
External debt 35.5 33.7 28.9 29.7 26.4 24.6 21.9 20.8 20.3 20.5International Investment Position 14.4 20.9 18.1 38.2 50.0 53.0 56.4 56.2 55.7 54.1
Assets 165.2 170.8 154.4 169.6 174.3 173.1 170.7 167.6 166.4 165.3Compact Trust Fund 72.6 76.5 67.4 73.1 77.1 77.7 78.6 77.3 76.3 75.1Social Security Funds 51.5 52.5 45.0 46.9 49.5 48.5 47.5 47.3 47.6 48.1Other 41.0 41.8 41.9 49.5 47.7 46.9 44.7 43.0 42.4 42.1
Liabilities 150.7 149.9 136.2 131.4 124.3 120.0 114.3 111.4 110.7 111.1FDI 113.0 115.2 106.7 101.7 97.9 95.0 92.2 90.4 90.2 90.4Government debt 11.4 10.7 9.0 11.9 10.6 10.7 9.7 10.2 11.1 12.5Public enterprise debt 24.1 23.0 19.9 17.8 15.8 14.0 12.2 10.6 9.3 8.0Other liabilities, banks 2.2 1.0 0.7 0.0 0.0 0.3 0.2 0.1 0.2 0.2
Sources: Palau authorities; PFTAC estimates; and Fund staff estimates and projections.1/ Fiscal year ending September 30.2/ Staff projections.
(In percent of GDP, unless otherwise indicated)
(In millions of U.S. dollars, unless otherwise indicated)
Proj. 2/Est.
Table 3. Palau: Balance of Payments, 2008/09–2017/18 1/

REPUBLIC OF PALAU
20 INTERNATIONAL MONETARY FUND
2008/09 2009/10 2010/11 2011/12 2014/15Est. Budget 2/ Est. Budget 2/ Proj. 3/ Proj. 3/
Revenue 77.7 87.2 89.0 96.8 91.2 93.4 106.5 113.7 110.4Taxes 29.2 31.1 35.4 38.6 36.3 42.3 42.7 44.9 49.3
Taxes on income, profits and capital gains 6.6 6.7 7.1 7.1 … 7.6 … 8.1 8.8Taxes on goods and services 12.6 12.5 15.3 16.6 … 17.9 … 19.0 20.8Taxes on international trade and transactions 7.5 7.8 7.4 9.5 … 9.9 … 10.5 11.5Other taxes 2.5 4.1 5.6 5.4 … 7.0 … 7.4 8.1
Grants 4/ 41.9 49.8 46.0 48.3 40.5 40.9 55.9 57.7 49.3Current 28.6 29.7 30.3 30.7 28.7 28.7 28.7 30.5 30.5
U.S. Compact 13.1 13.1 13.1 13.1 13.1 13.1 12.3 13.1 13.4Drawdown from Compact Trust Fund 5.0 5.0 5.0 5.0 5.0 5.0 5.0 5.0 5.5U.S. non-Compact 8.8 10.9 10.3 10.6 9.0 9.0 9.9 9.9 10.0Other country 1.6 0.6 1.8 2.0 1.6 1.6 1.5 2.4 1.7
Capital 11.0 20.1 15.7 17.6 11.8 11.8 27.3 27.3 18.8Of which : U.S. Compact … … … … … … 11.0 11.0 3.0
Other revenue 6.6 6.3 7.7 10.0 14.3 10.2 7.8 11.0 11.9
Expenditure 79.3 89.0 86.5 94.7 92.8 91.3 94.4 101.0 107.9Expense 68.6 68.9 72.0 77.2 81.0 82.8 77.1 83.7 88.3
Of which: Compensation of employees 35.3 34.5 35.6 36.1 … 37.4 … 38.2 38.9Of which: Use of goods and services 19.6 19.8 20.9 22.7 … 26.5 … 26.8 28.3
Net acquisition of nonfinancial assets 5/ 10.7 20.1 14.5 17.4 11.8 8.5 17.3 17.3 19.6
Current balance (excluding grants) 6/ -32.8 -31.5 -28.9 -28.7 -30.4 -30.3 -26.6 -27.8 -27.1Net lending (+)/borrowing (–) 7/ -1.6 -1.8 2.5 2.2 -1.6 2.1 12.1 12.7 2.6
Net acquisition of financial assets -3.0 7.1 -3.8 10.1 2.3 -0.2 -2.0 4.8 0.3Net incurrence of liabilities -1.4 8.9 -6.3 8.0 3.9 -2.3 -14.1 -7.9 -2.3Net financing -1.6 -1.8 2.5 2.2 -1.6 2.1 12.1 12.7 2.6Statistical discrepancy 0 0 0 0 0 0 0 0 0
Revenue 39.2 44.2 41.0 41.7 36.7 38.0 41.1 43.9 40.4Taxes 14.7 15.8 16.3 16.6 14.6 17.2 16.5 17.4 18.1Grants 21.1 25.2 21.1 20.8 16.5 16.6 21.6 22.3 18.0Other revenue 3.3 3.2 3.5 4.3 5.6 4.1 3.0 4.2 4.3
Expenditure 40.0 45.1 39.8 40.8 36.9 37.1 36.5 39.0 39.5Expense 34.6 34.9 33.1 33.2 32.1 33.7 29.8 32.3 32.3Net acquisition of nonfinancial assets 5.4 10.2 6.7 7.5 4.8 3.4 6.7 6.7 7.2
Current balance (excluding grants) -16.5 -15.9 -13.3 -12.3 -13.3 -12.3 -13.3 -10.7 -9.9Net lending (+)/borrowing (–) -0.8 -0.9 1.2 0.9 -0.3 0.9 4.7 4.9 0.9
Memorandum Item:Nominal GDP (million US$) 198.2 197.5 217.3 232.3 245.8 245.8 258.9 258.9 273.1Government cash and deposits (in percent of GDP) 1.9 4.5 3.0 4.8 6.7 5.0 4.0 6.6 6.4Domestic accounts payable (in percent of GDP) 9.5 14.9 11.3 11.2 11.1 11.1 5.8 5.8 5.2
Sources: Palau authorities; and Fund staff estimates and projections.
7/ Defined as Revenue less Expenditure.
(In percent of GDP)
(In millions of U.S. dollars)
1/ Fiscal year ending September 30.2/ Based on the Budget Law, Supplemental Budget, and Bopha Relief.3/ Staff projections.
5/ Includes capital spending financed by loans from the Asian Development Bank.6/ Defined as Revenue less Grants and Expense.
2012/13 2013/14
4/ Grants for the Compact Road and the Palau-Japan Friendship Bridge are treated off-budget.
Table 4. Palau: Statement of Government Operations, 2008/09–2014/15 1/

REPUBLIC OF PALAU
INTERNATIONAL MONETARY FUND 21
Annex I. Risk Assessment Matrix (RAM) 1
Source and likelihood Transmission channel and potential impact Policy responses
Surges in global financial market volatility (High).
The exit from unconventional monetary policies could trigger capital outflows from Asian emerging markets. Slowdown in Asian growth and depreciation of Asian currencies could hurt Palau's tourism, reducing tourism receipts and growth (High).
Sharp growth slowdown in China (Medium).
Slowdown in China's growth could reduce tourist arrivals from China (direct effect) and from other Asian countries (indirect effect through potentially lower Asian growth) (High).
Natural disasters (Medium).
Natural disasters, including those related to climate change, would affect the environment and tourism, lowering growth prospects (Medium).
Reprioritizing public spending to address natural disasters, and mobilizing external assistance.
Delayed ratification of Compact agreement (Medium).
Delayed disbursement of Compact grants could lower growth and jeopardize long-term fiscal sustainability (Medium).
Adjusting fiscal policy gradually to create more savings.
1/ It shows events that could materially alter the baseline path. The RAM reflects staff's views on the source of risks and overall level of concerns as of the time of discussions with the authorities.
Building fiscal buffers to address the adverse impact of external shocks on growth. Raising growth potential and strengthening economic resilience by improving business and investment climate and addressing infrastructure bottleneck in order to diversify the economy, promote private sector development, and attract foreign investment.
REPUBLIC OF PALAU
22 INTERNATIONAL MONETARY FUND
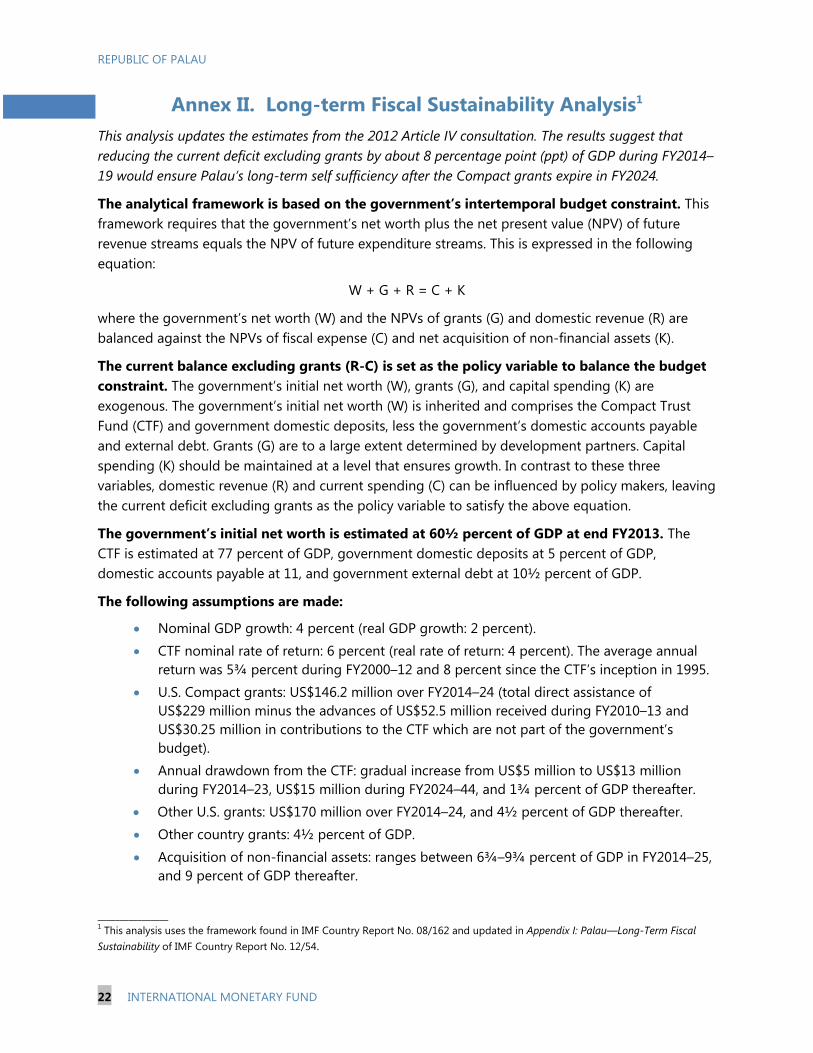
Annex II. Long-term Fiscal Sustainability Analysis1
This analysis updates the estimates from the 2012 Article IV consultation. The results suggest that reducing the current deficit excluding grants by about 8 percentage point (ppt) of GDP during FY2014–19 would ensure Palau’s long-term self sufficiency after the Compact grants expire in FY2024.
The analytical framework is based on the government’s intertemporal budget constraint. This framework requires that the government’s net worth plus the net present value (NPV) of future revenue streams equals the NPV of future expenditure streams. This is expressed in the following equation:
W + G + R = C + K
where the government’s net worth (W) and the NPVs of grants (G) and domestic revenue (R) are balanced against the NPVs of fiscal expense (C) and net acquisition of non-financial assets (K).
The current balance excluding grants (R-C) is set as the policy variable to balance the budget constraint. The government’s initial net worth (W), grants (G), and capital spending (K) are exogenous. The government’s initial net worth (W) is inherited and comprises the Compact Trust Fund (CTF) and government domestic deposits, less the government’s domestic accounts payable and external debt. Grants (G) are to a large extent determined by development partners. Capital spending (K) should be maintained at a level that ensures growth. In contrast to these three variables, domestic revenue (R) and current spending (C) can be influenced by policy makers, leaving the current deficit excluding grants as the policy variable to satisfy the above equation.
The government’s initial net worth is estimated at 60½ percent of GDP at end FY2013. The CTF is estimated at 77 percent of GDP, government domestic deposits at 5 percent of GDP, domestic accounts payable at 11, and government external debt at 10½ percent of GDP.
The following assumptions are made:
Nominal GDP growth: 4 percent (real GDP growth: 2 percent). CTF nominal rate of return: 6 percent (real rate of return: 4 percent). The average annual
return was 5¾ percent during FY2000–12 and 8 percent since the CTF’s inception in 1995. U.S. Compact grants: US$146.2 million over FY2014–24 (total direct assistance of
US$229 million minus the advances of US$52.5 million received during FY2010–13 and US$30.25 million in contributions to the CTF which are not part of the government’s budget).
Annual drawdown from the CTF: gradual increase from US$5 million to US$13 million during FY2014–23, US$15 million during FY2024–44, and 1¾ percent of GDP thereafter.
Other U.S. grants: US$170 million over FY2014–24, and 4½ percent of GDP thereafter. Other country grants: 4½ percent of GDP. Acquisition of non-financial assets: ranges between 6¾–9¾ percent of GDP in FY2014–25,
and 9 percent of GDP thereafter.
________________ 1 This analysis uses the framework found in IMF Country Report No. 08/162 and updated in Appendix I: Palau—Long-Term Fiscal Sustainability of IMF Country Report No. 12/54.

REPUBLIC OF PALAU
INTERNATIONAL MONETARY FUND 23
The results show that reducing the current deficit excluding grants by 7¾–8½ ppt of GDP would ensure Palau’s fiscal sustainability. This adjustment should take place between FY2014 and FY2023, and it would increase the government’s net worth to a level that will generate sufficient income to finance a sustainable deficit over the long term. However, there is a trade-off between the speed of adjustment and the level of net worth that can be achieved: the longer the adjustment period, the lower the net worth that can be achieved (hence, the lower the sustainable deficit that can be financed).
A gradual reduction of the current deficit excluding grants by 8.1 ppt of GDP during FY2014–19 is recommended. Three possible adjustment scenarios (immediate, gradual, minimum) are presented for illustration. The total reduction in the current deficit excluding grants is too large to be implemented by an immediate adjustment in one year. On the other hand, the minimum adjustment that spreads the adjustment until FY2023, just before the Compact grants expire, would be more sensitive to risks of slippages and adverse shocks like typhoon Bopha in early FY2013, which prevented Palau from continuing on the needed adjustment path. Therefore, gradually reducing the current balance excluding grants by 8.1 ppt of GDP during 2014–19 (1.35 ppt annually on average) is more appropriate. This gradual approach will leave the government with extra years in case the needed consolidation is not achieved as planned. Since the fiscal adjustment in FY2014 is projected to be 1½ ppt of GDP, the adjustment in FY2015–19 should be about 1¼ ppt a year on average. The path of medium-term fiscal consolidation and long-term fiscal sustainability is illustrated in Annex 2 Figure 1.
The above result is fairly robust to different parameter assumptions. Lower rates of return and lower valuations of the government’s initial net worth (for example, to reflect new external debt and/or to include public enterprise debt) increase the required annual fiscal adjustment. Higher real GDP growth rates and inflation also increase the needed adjustment. Overall, however, reasonable variations in these parameters have fairly small impacts on the estimated annual adjustment of 1.35.
1 2 3 1 2 3 1 2 3
2 1.50 1.70 1.80 1 1.00 1.16 1.35 0 1.43 1.54 1.67
3 1.33 1.54 1.75 2 1.16 1.35 1.57 15 1.34 1.48 1.64
4 1.16 1.35 1.58 3 1.35 1.57 1.77 30 1.29 1.45 1.62
5 0.99 1.15 1.37 4 1.58 1.77 1.85 60 1.16 1.35 1.57
Sensitivity Analysis under Gradual Adjustment
Source: Fund staff estimates
Real GDP Growth (in percent)
Real GDP Growth (in percent)
Real GDP Growth (in percent)
RealRate ofReturn
(in percent)
Inflation (in
percent)
Govt InitialNet
Worth (percent
GDP)
Immediate Gradual Minimum
FY2014 FY2014-19 FY2014-23
Years of adjustment 1 6 10
Total reduction in R-C (ppt of GDP) 7.7 8.1 8.4
Annual reduction in R-C (ppt of GDP) 7.70 1.35 0.84
Sustainable R-C (percent of GDP) 4.6 4.2 3.9
Sustainable overall deficit by FY2043 (percent of GDP) 2.6 2.3 2.0
Sustainable net worth (W) by FY2043 (percent of GDP) 139.3 120.1 104.2
Source: Fund staff estimates
Scenarios of Adjustment in Current Fiscal Balance Excluding Grants (R-C)

REPUBLIC OF PALAU
24 INTERNATIONAL MONETARY FUND
Annex II. Figure 1. Palau: Long-Term Fiscal Sustainability, FY2010–40
Sources: Country authorities and Fund staff estimates and projections.
0
20
40
60
80
0
10
20
30
40
50
60
FY10 FY13 FY16 FY19 FY22 FY25 FY28 FY31 FY34 FY37 FY40
Compact grants, capitalCompact grants, current + CTF drawdownNon-compact grantsDomestic revenue: Non-taxDomestic revenue: Tax
Fiscal Revenue(In percent of GDP)
0
10
20
30
40
50
60
0
10
20
30
40
50
60
FY10 FY13 FY16 FY19 FY22 FY25 FY28 FY31 FY34 FY37 FY40
Wage billGoods and servicesOtherNet acquisition of non-financial assets
Fiscal Expenditure(In percent of GDP)
-20
-10
0
10
20
30
-50
-25
0
25
50
75
FY10 FY13 FY16 FY19 FY22 FY25 FY28 FY31 FY34 FY37 FY40
Domestic revenueCurrent expenditureOverall balance (RHS)Current balance excluding grants (RHS)
Fiscal Balance(In percent of GDP)
-20
-10
0
10
20
-20
-10
0
10
20
FY10 FY13 FY16 FY19 FY22 FY25 FY28 FY31 FY34 FY37 FY40
Foreign liabilitiesDomestic liabilitiesForeign assetsDomestic assetsCurrent balance ex. grantsOverall balance
Deficit Financing(In percent of GDP)
-30
0
30
60
90
120
150
-30
0
30
60
90
120
150
FY10 FY13 FY16 FY19 FY22 FY25 FY28 FY31 FY34 FY37 FY40
Compact Trust Fund (CTF)
Other assets net, including debt
Net worth
Government's Net Worth(In percent of GDP)
0
10
20
30
40
50
0
10
20
30
40
50
FY10 FY13 FY16 FY19 FY22 FY25 FY28 FY31 FY34 FY37 FY40
Gov. ext. debt SOEs' debt Gov. accounts payable
Public Debt(In percent of GDP)

REPUBLIC OF PALAU
INTERNATIONAL MONETARY FUND 25
Annex III. Public Sector Debt Sustainability Analysis
As of February 18, 20142/ 2012 2013 2014 2015 2016 2017 2018 2019
Nominal gross public debt 37.6 37.9 34.5 29.7 27.3 26.6 26.8 27.5 27.7 Sovereign SpreadsPublic gross financing needs 1.6 -0.2 -0.2 -4.2 0.1 2.3 1.9 2.3 0.2 5Y CDS (bp) n.a.
Real GDP growth (in percent) 0.1 5.5 -0.2 1.8 2.2 2.5 2.5 2.2 2.2 Ratings Foreign LocalInflation (GDP deflator, in percent) 2.9 1.3 6.1 3.5 3.2 3.0 2.0 2.0 2.0 Moody's n.a. n.a.Nominal GDP growth (in percent) 2.9 6.9 5.8 5.3 5.5 5.6 4.5 4.2 4.2 S&Ps n.a. n.a.Effective interest rate (in percent) 4/ 2.0 1.5 1.1 1.2 1.3 1.3 1.2 1.1 1.0 Fitch n.a. n.a.
2012 2013 2014 2015 2016 2017 2018 2019 cumulativeChange in gross public sector debt 0.0 0.7 -3.4 -4.8 -2.4 -0.7 0.1 0.8 0.2 -6.8
Identified debt-creating flows 0.6 -1.1 -2.2 -4.5 -2.1 -0.5 0.3 0.9 0.3 -5.6Primary deficit 0.7 -1.2 -1.0 -5.0 -1.1 -0.1 -0.1 0.4 -1.3 -7.2
Primary (noninterest) revenue and gra40.9 41.7 37.9 43.8 40.4 41.5 41.6 41.5 41.3 250.1Primary (noninterest) expenditure 41.6 40.5 36.9 38.8 39.3 41.4 41.5 41.9 40.0 242.9
Automatic debt dynamics 5/ -0.3 -1.9 -1.7 -1.3 -1.2 -1.1 -0.9 -0.8 -0.9 -6.1Interest rate/growth differential 6/ -0.3 -1.9 -1.7 -1.3 -1.2 -1.1 -0.9 -0.8 -0.9 -6.1
Of which: real interest rate -0.3 0.0 -1.8 -0.8 -0.6 -0.5 -0.2 -0.2 -0.3 -2.5Of which: real GDP growth 0.0 -1.9 0.1 -0.6 -0.6 -0.6 -0.6 -0.6 -0.6 -3.6
Exchange rate depreciation 7/ 0.0 0.0 0.0 … … … … … … …Other identified debt-creating flows 0.2 1.9 0.5 1.8 0.1 0.7 1.3 1.4 2.5 7.8
Drawdown in Government Domestic 0.2 1.9 0.5 1.8 0.1 0.7 1.3 1.4 2.5 7.8Contingent liabilities 0.0 0.0 0.0 0.0 0.0 0.0 0.0 0.0 0.0 0.0Other debt flows (incl. ESM and Euro 0.0 0.0 0.0 0.0 0.0 0.0 0.0 0.0 0.0 0.0
Residual, including asset changes 8/ -0.6 1.8 -1.2 -0.2 -0.2 -0.2 -0.2 -0.2 -0.2 -1.2
Source: IMF staff.1/ Public sector is defined as central government and includes public guarantees, defined as SOE debt.
2/ Based on available data.
3/ Long-term bond spread over German bonds.
4/ Defined as interest payments divided by debt stock (excluding guarantees) at the end of previous year.5/ Derived as [(r - π(1+g) - g + ae(1+r)]/(1+g+π+gπ)) times previous period debt ratio, with r = interest rate; π = growth rate of GDP deflator; g = real GDP growth rate;
a = share of foreign-currency denominated debt; and e = nominal exchange rate depreciation (measured by increase in local currency value of U.S. dollar).
6/ The real interest rate contribution is derived from the numerator in footnote 5 as r - π (1+g) and the real growth contribution as -g.
7/ The exchange rate contribution is derived from the numerator in footnote 5 as ae(1+r). 8/ Includes changes in the stock of guarantees, asset changes, and interest revenues (if any). For projections, includes exchange rate changes during the projection period.
9/ Assumes that key variables (real GDP growth, real interest rate, and other identified debt-creating flows) remain at the level of the last projection year.
Palau Public Sector Debt Sustainability Analysis (DSA) - Baseline Scenario
1.6balance 9/
primary
(in percent of GDP unless otherwise indicated)
Debt, Economic and Market Indicators 1/
2003-2011Actual
Projections
Contribution to Changes in Public DebtProjections
2003-2011Actual
debt-stabilizing
-10
-8
-6
-4
-2
0
2
4
6
8
10
2003 2004 2005 2006 2007 2008 2009 2010 2011 2012 2013 2014 2015 2016 2017 2018 2019
Debt-Creating Flows
Primary deficit Real GDP growth Real interest rate Exchange rate depreciation Other debt-creating flows ResidualChange in gross public sector debt
projection
(in percent of GDP)
-20
-15
-10
-5
0
5
10
cumulative
REPUBLIC OF PALAU
26 INTERNATIONAL MONETARY FUND
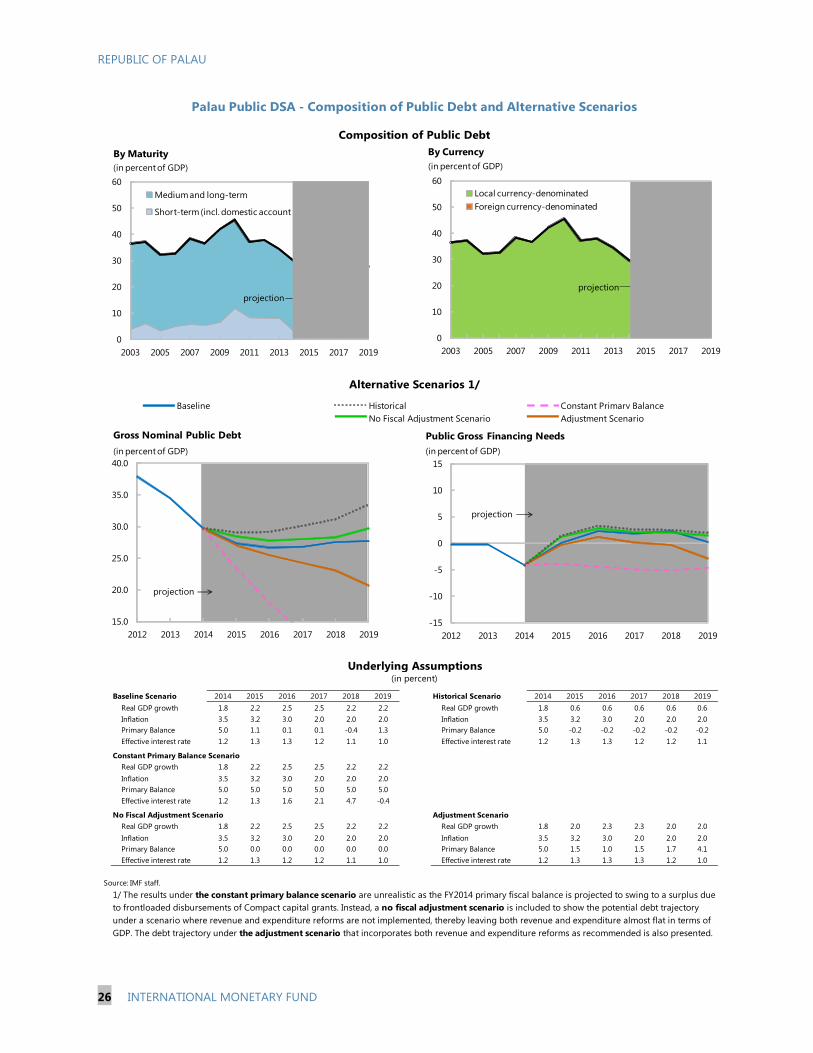
Baseline Scenario 2014 2015 2016 2017 2018 2019 Historical Scenario 2014 2015 2016 2017 2018 2019Real GDP growth 1.8 2.2 2.5 2.5 2.2 2.2 Real GDP growth 1.8 0.6 0.6 0.6 0.6 0.6Inflation 3.5 3.2 3.0 2.0 2.0 2.0 Inflation 3.5 3.2 3.0 2.0 2.0 2.0Primary Balance 5.0 1.1 0.1 0.1 -0.4 1.3 Primary Balance 5.0 -0.2 -0.2 -0.2 -0.2 -0.2Effective interest rate 1.2 1.3 1.3 1.2 1.1 1.0 Effective interest rate 1.2 1.3 1.3 1.2 1.2 1.1
Constant Primary Balance ScenarioReal GDP growth 1.8 2.2 2.5 2.5 2.2 2.2Inflation 3.5 3.2 3.0 2.0 2.0 2.0Primary Balance 5.0 5.0 5.0 5.0 5.0 5.0Effective interest rate 1.2 1.3 1.6 2.1 4.7 -0.4
No Fiscal Adjustment Scenario Adjustment ScenarioReal GDP growth 1.8 2.2 2.5 2.5 2.2 2.2 Real GDP growth 1.8 2.0 2.3 2.3 2.0 2.0Inflation 3.5 3.2 3.0 2.0 2.0 2.0 Inflation 3.5 3.2 3.0 2.0 2.0 2.0Primary Balance 5.0 0.0 0.0 0.0 0.0 0.0 Primary Balance 5.0 1.5 1.0 1.5 1.7 4.1Effective interest rate 1.2 1.3 1.2 1.2 1.1 1.0 Effective interest rate 1.2 1.3 1.3 1.3 1.2 1.0
Source: IMF staff.
1/ The results under the constant primary balance scenario are unrealistic as the FY2014 primary fiscal balance is projected to swing to a surplus due to frontloaded disbursements of Compact capital grants. Instead, a no fiscal adjustment scenario is included to show the potential debt trajectory under a scenario where revenue and expenditure reforms are not implemented, thereby leaving both revenue and expenditure almost flat in terms of GDP. The debt trajectory under the adjustment scenario that incorporates both revenue and expenditure reforms as recommended is also presented.
Underlying Assumptions(in percent)
Palau Public DSA - Composition of Public Debt and Alternative Scenarios
Alternative Scenarios 1/
Composition of Public Debt
No Fiscal Adjustment Scenario Adjustment ScenarioBaseline Historical Constant Primary Balance
15.0
20.0
25.0
30.0
35.0
40.0
2012 2013 2014 2015 2016 2017 2018 2019
Gross Nominal Public Debt(in percent of GDP)
projection
-15
-10
-5
0
5
10
15
2012 2013 2014 2015 2016 2017 2018 2019
Public Gross Financing Needs(in percent of GDP)
projection
0
10
20
30
40
50
60
2003 2005 2007 2009 2011 2013 2015 2017 2019
By Maturity
Medium and long-term
Short-term (incl. domestic account payables)
projection
(in percent of GDP)
0
10
20
30
40
50
60
2003 2005 2007 2009 2011 2013 2015 2017 2019
By Currency
Local currency-denominatedForeign currency-denominated
projection
(in percent of GDP)
REPUBLIC OF PALAU STAFF REPORT FOR THE 2014 ARTICLE IV CONSULTATION—INFORMATIONAL ANNEX
Prepared By
Asia and Pacific Department (In consultation with other Departments)
FUND RELATIONS _____________________________________________________________________ 2
IMF–WORLD BANK COLLABORATION _______________________________________________ 3
RELATIONS WITH THE ASIAN DEVELOPMENT BANK _______________________________ 5
RELATIONS WITH THE PACIFIC FINANCIAL TECHNICAL ASSISTANCE CENTRE
(PFTAC) _________________________________________________________________________________ 8
STATISTICAL ISSUES __________________________________________________________________ 10
CONTENTS
April 7, 2014
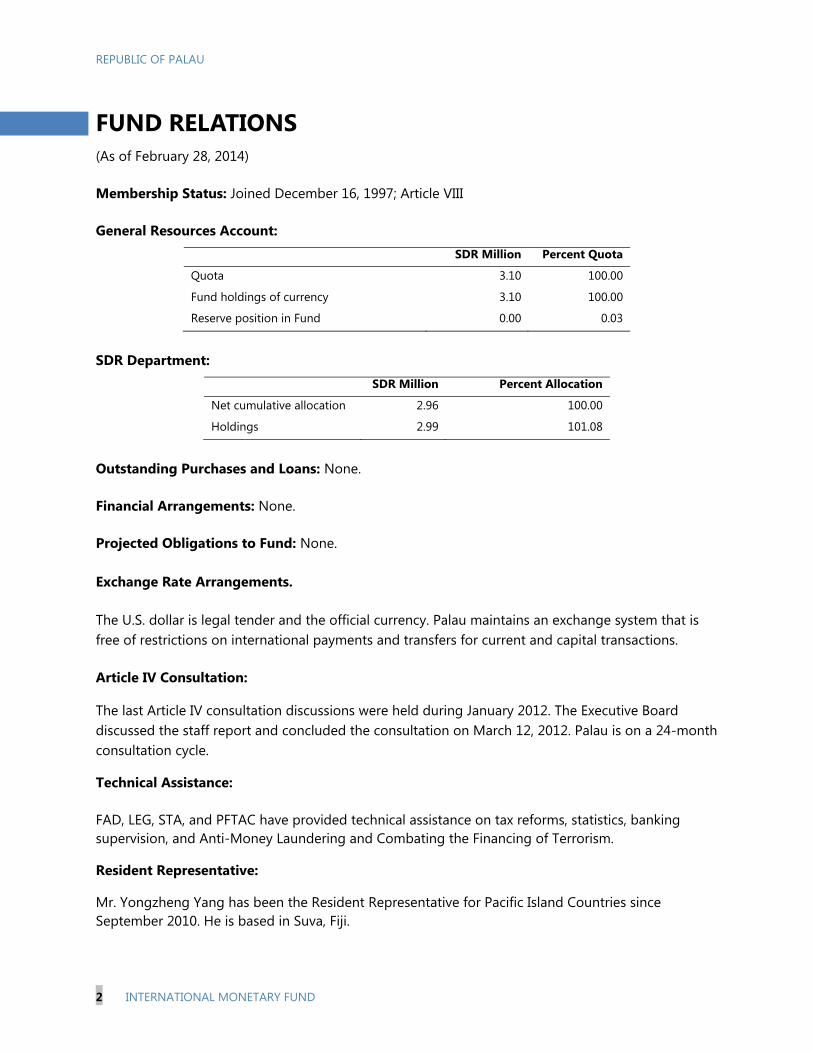
REPUBLIC OF PALAU
2 INTERNATIONAL MONETARY FUND
FUND RELATIONS (As of February 28, 2014) Membership Status: Joined December 16, 1997; Article VIII General Resources Account:
SDR Million Percent Quota
Quota 3.10 100.00
Fund holdings of currency 3.10 100.00
Reserve position in Fund 0.00 0.03
SDR Department:
SDR Million Percent Allocation
Net cumulative allocation 2.96 100.00
Holdings 2.99 101.08
Outstanding Purchases and Loans: None. Financial Arrangements: None. Projected Obligations to Fund: None. Exchange Rate Arrangements. The U.S. dollar is legal tender and the official currency. Palau maintains an exchange system that is free of restrictions on international payments and transfers for current and capital transactions. Article IV Consultation: The last Article IV consultation discussions were held during January 2012. The Executive Board discussed the staff report and concluded the consultation on March 12, 2012. Palau is on a 24-month consultation cycle. Technical Assistance: FAD, LEG, STA, and PFTAC have provided technical assistance on tax reforms, statistics, banking supervision, and Anti-Money Laundering and Combating the Financing of Terrorism. Resident Representative: Mr. Yongzheng Yang has been the Resident Representative for Pacific Island Countries since September 2010. He is based in Suva, Fiji.

REPUBLIC OF PALAU
INTERNATIONAL MONETARY FUND 3
IMF–WORLD BANK COLLABORATION (February 2014)
The World Bank and IMF teams for the Republic of Palau led by Mr. Robert Utz (Lead Economist, EASPN) and Mr. Tubagus Feridhanusetyawan (IMF Mission Chief for Palau) maintain a close working relationship and dialogue on macroeconomic and structural issues.
The teams agreed that Palau’s key macroeconomic challenges are to achieve fiscal self-sufficiency and to enhance growth potential in view of declining external assistance in the future. Based on this shared assessment, the teams identified key areas for reforms as follows:
Fiscal reforms
Continued fiscal consolidation over the medium term is critical to achieve fiscal self-sufficiency when the Compact grants expire in 2024. The implementation of the authorities’ comprehensive tax reform could raise revenue collection over the medium term. This would need to be complemented by spending reduction, particularly in the wage bill, to ensure long-term sustainability.
Strengthening public financial management by implementing a medium-term budget framework, sound management of the newly-established budget reserve fund, prudent fiscal and debt management, and better budget execution and cash management. Continue reforming the pension and social security systems is important to address longstanding unfunded future liabilities.
Continued progress in reforming the public utility company would also improve public services and reduce government subsidies. A key challenge will be to balance commercial viability, including by raising utility tariffs, with the need to ensure access to vulnerable groups.
Enhancing growth potential
Given Palau’s unique context, improving the investment climate and diversifying the economy are critical to promote private sector development and growth. This includes promoting tourist arrivals from new countries and developing business activities outside the tourism sector. Strengthening and broadening financial regulation and supervision are also needed to preserve financial sector stability.
The teams agreed on close cooperation going forward.
The World Bank is currently supporting the government of Palau in undertaking reforms and investments aimed at improving access to Information and Communications Technology (ICT). A Technical Assistance Grant, signed in September 2013, provides advisory support and capacity-building needed to support ICT sector reform and liberalization in Palau. Furthermore, under Phase II of the Pacific Regional Connectivity Program, an investment in telecommunications infrastructure is under preparation. This could entail support for a fiber-optic submarine cable in order to increase the availability and reduce the cost of international bandwidth and hence facilitate the rollout of faster-cheaper broadband Internet. The two operations are expected to

REPUBLIC OF PALAU
4 INTERNATIONAL MONETARY FUND
increase the availability and quality of ICT infrastructure and enable more widespread application of ICT services. Improved availability and affordability of broadband is expected to contribute to economic and social development and improved service delivery in Palau.
The IMF will continue discussing economic and financial policies in surveillance context and providing technical assistance, including through PFTAC, in various areas.
Palau: Bank and Fund Planned Activities 2014–15
Title Products Provisional Timing of Missions
Expected Delivery Date
1. World Bank Work Program
ICT Technical Assistance Proposed investment for undersea cable between Palau and Federated States of Micronesia.
February 2014 February 2014
FY2014 Ongoing
2. IMF Work Program
IMF/PFTAC technical assistance on statistics (national accounts, balance of payments, government finance), public financial management, tax reforms, and banking supervision.
Ongoing
Several missions a year
Article IV consultation. February 2014 April 2014
3. Joint Work Program
Mutual update on work program developments and information sharing.
Semi-annual Ongoing
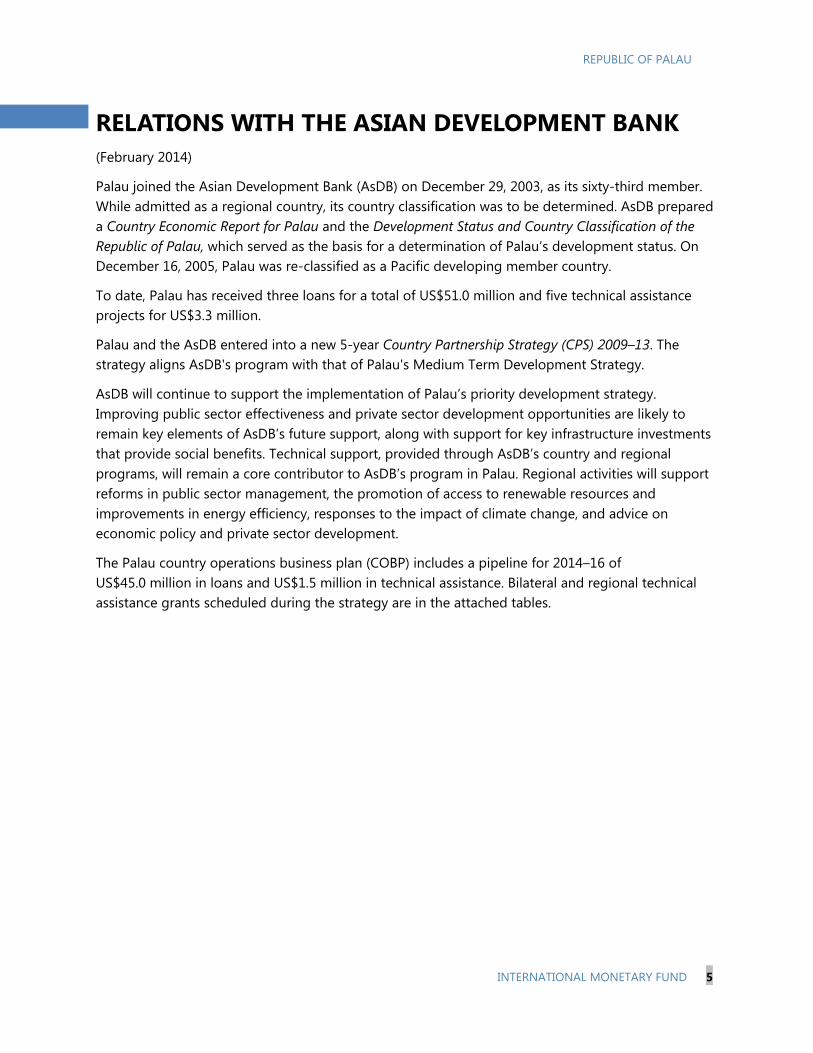
REPUBLIC OF PALAU
INTERNATIONAL MONETARY FUND 5
RELATIONS WITH THE ASIAN DEVELOPMENT BANK (February 2014)
Palau joined the Asian Development Bank (AsDB) on December 29, 2003, as its sixty-third member. While admitted as a regional country, its country classification was to be determined. AsDB prepared a Country Economic Report for Palau and the Development Status and Country Classification of the Republic of Palau, which served as the basis for a determination of Palau’s development status. On December 16, 2005, Palau was re-classified as a Pacific developing member country.
To date, Palau has received three loans for a total of US$51.0 million and five technical assistance projects for US$3.3 million.
Palau and the AsDB entered into a new 5-year Country Partnership Strategy (CPS) 2009–13. The strategy aligns AsDB's program with that of Palau's Medium Term Development Strategy.
AsDB will continue to support the implementation of Palau’s priority development strategy. Improving public sector effectiveness and private sector development opportunities are likely to remain key elements of AsDB’s future support, along with support for key infrastructure investments that provide social benefits. Technical support, provided through AsDB’s country and regional programs, will remain a core contributor to AsDB’s program in Palau. Regional activities will support reforms in public sector management, the promotion of access to renewable resources and improvements in energy efficiency, responses to the impact of climate change, and advice on economic policy and private sector development.
The Palau country operations business plan (COBP) includes a pipeline for 2014–16 of US$45.0 million in loans and US$1.5 million in technical assistance. Bilateral and regional technical assistance grants scheduled during the strategy are in the attached tables.

6 IN
TERNATIO
NAL M
ON
ETARY FUN
D
REPUBLIC O
F PALAU
Indicative Assistance Pipeline for Lending Products, 2014–16
Project/Program
Name Sector
Targeting
Classifi-
cation
Primary
Theme Division
Year
of
PPTA
Cost (US$ million)
Total
AsDB
Gov’t
Co-
finance OCR
ADF
Total Loans Grants
2014
Micronesian Fiber
Optic Cable Project
TCT TI-M PSD PAUS 2013 45.00 2.38 5.53a 0.0 7.71 0.0 37.09
Total 45.00 2.38 5.53 0.0 7.71 0.0 37.09
2015
None
2016
None
AsDB = Asian Development Bank, ADF = Asian Development Fund, Gov’t = government, OCR = ordinary capital resources, PAUS = Urban, Social Development, and Public
Management Division, PPTA = Project preparatory technical assistance, PSD = private sector development, TCT = transport and information and communication technology,
TI-M = Targeted intervention—Millennium Development Goals. a
Includes US$2.0 million ADF subregional funds.
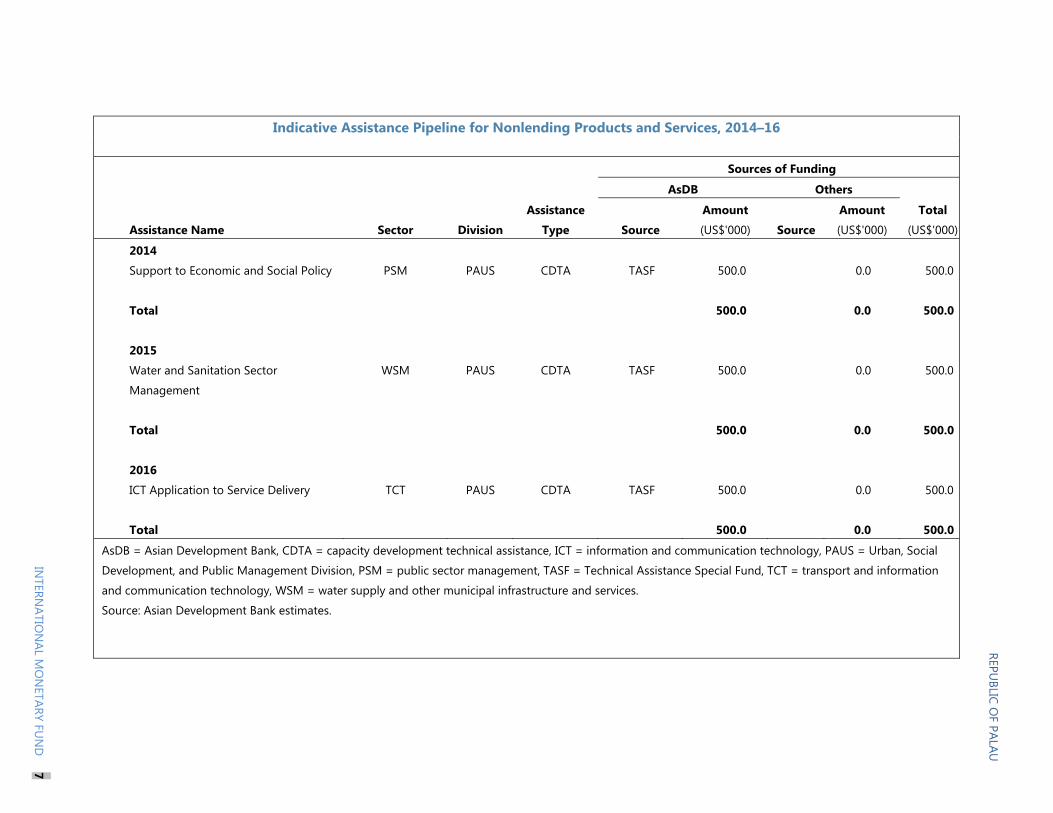
REPUBLIC O
F PALAU
Indicative Assistance Pipeline for Nonlending Products and Services, 2014–16
Assistance Name Sector Division
Assistance
Type
Sources of Funding
AsDB Others
Total
(US$'000)Source
Amount
(US$'000) Source
Amount
(US$'000)
2014
Support to Economic and Social Policy PSM PAUS CDTA TASF 500.0 0.0 500.0
Total 500.0 0.0 500.0
2015
Water and Sanitation Sector
Management
WSM PAUS CDTA TASF 500.0 0.0 500.0
Total 500.0 0.0 500.0
2016
ICT Application to Service Delivery TCT PAUS CDTA TASF 500.0 0.0 500.0
Total 500.0 0.0 500.0
AsDB = Asian Development Bank, CDTA = capacity development technical assistance, ICT = information and communication technology, PAUS = Urban, Social
Development, and Public Management Division, PSM = public sector management, TASF = Technical Assistance Special Fund, TCT = transport and information
and communication technology, WSM = water supply and other municipal infrastructure and services.
Source: Asian Development Bank estimates.
INTERN
ATION
AL MO
NETARY FU
ND
7
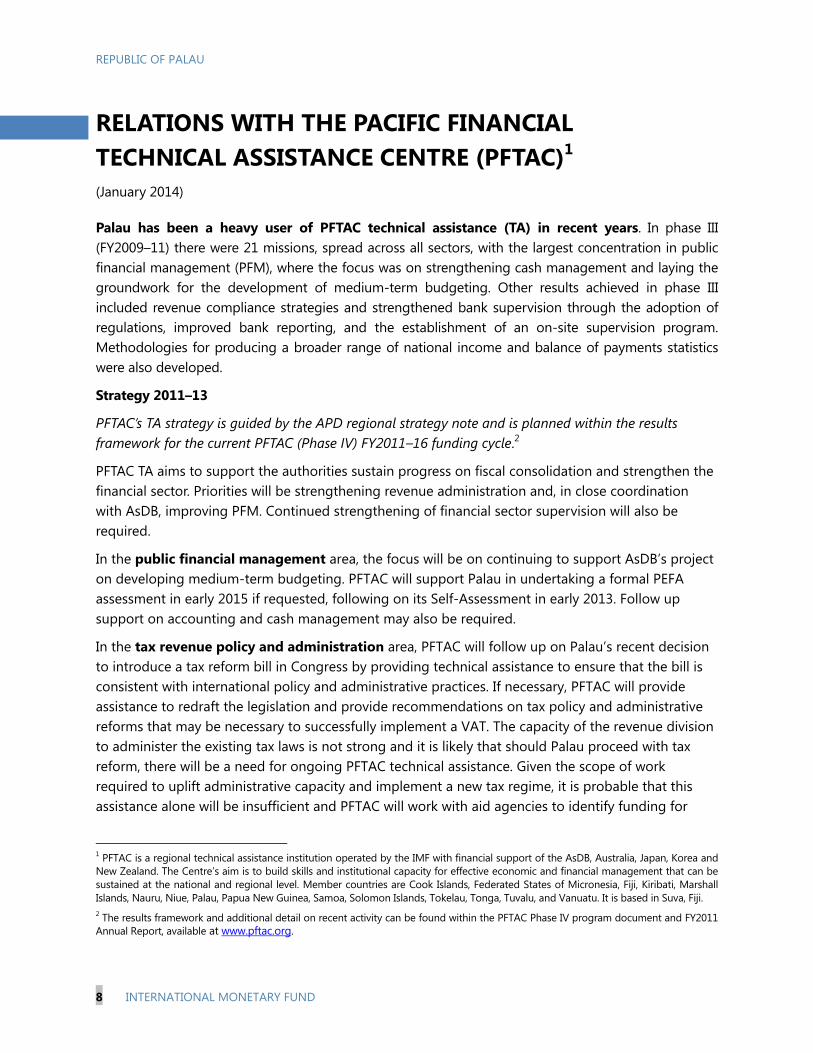
REPUBLIC OF PALAU
8 INTERNATIONAL MONETARY FUND
RELATIONS WITH THE PACIFIC FINANCIAL TECHNICAL ASSISTANCE CENTRE (PFTAC)1 (January 2014)
Palau has been a heavy user of PFTAC technical assistance (TA) in recent years. In phase III (FY2009–11) there were 21 missions, spread across all sectors, with the largest concentration in public financial management (PFM), where the focus was on strengthening cash management and laying the groundwork for the development of medium-term budgeting. Other results achieved in phase III included revenue compliance strategies and strengthened bank supervision through the adoption of regulations, improved bank reporting, and the establishment of an on-site supervision program. Methodologies for producing a broader range of national income and balance of payments statistics were also developed.
Strategy 2011–13
PFTAC’s TA strategy is guided by the APD regional strategy note and is planned within the results framework for the current PFTAC (Phase IV) FY2011–16 funding cycle.2
PFTAC TA aims to support the authorities sustain progress on fiscal consolidation and strengthen the financial sector. Priorities will be strengthening revenue administration and, in close coordination with AsDB, improving PFM. Continued strengthening of financial sector supervision will also be required.
In the public financial management area, the focus will be on continuing to support AsDB’s project on developing medium-term budgeting. PFTAC will support Palau in undertaking a formal PEFA assessment in early 2015 if requested, following on its Self-Assessment in early 2013. Follow up support on accounting and cash management may also be required.
In the tax revenue policy and administration area, PFTAC will follow up on Palau’s recent decision to introduce a tax reform bill in Congress by providing technical assistance to ensure that the bill is consistent with international policy and administrative practices. If necessary, PFTAC will provide assistance to redraft the legislation and provide recommendations on tax policy and administrative reforms that may be necessary to successfully implement a VAT. The capacity of the revenue division to administer the existing tax laws is not strong and it is likely that should Palau proceed with tax reform, there will be a need for ongoing PFTAC technical assistance. Given the scope of work required to uplift administrative capacity and implement a new tax regime, it is probable that this assistance alone will be insufficient and PFTAC will work with aid agencies to identify funding for
1 PFTAC is a regional technical assistance institution operated by the IMF with financial support of the AsDB, Australia, Japan, Korea and New Zealand. The Centre’s aim is to build skills and institutional capacity for effective economic and financial management that can be sustained at the national and regional level. Member countries are Cook Islands, Federated States of Micronesia, Fiji, Kiribati, Marshall Islands, Nauru, Niue, Palau, Papua New Guinea, Samoa, Solomon Islands, Tokelau, Tonga, Tuvalu, and Vanuatu. It is based in Suva, Fiji. 2 The results framework and additional detail on recent activity can be found within the PFTAC Phase IV program document and FY2011 Annual Report, available at www.pftac.org.
REPUBLIC OF PALAU
INTERNATIONAL MONETARY FUND 9
a resident tax adviser. PFTAC has previously provided assistance to develop an IT strategic plan and, if tax reform proceeds, the implementation of this plan and identification of donors to fund the IT development will also be a priority.
In the financial sector supervision area, prudential returns are now implemented, and Palau is in line for the integration of the Financial Sector Information System (FSIS) developed by the Reserve Bank of New Zealand to be performed in late 2014. A regional on-site examination training workshop will be held for the staff in mid 2014. Capacity building in risk based banking supervision will continue including workshops for management on how to manage in a risk based environment.
In economic statistics, PFTAC will continue to provide technical assistance for the development of GDP estimates by expenditure and will assist with capacity building in national accounts statistics (RBM code 4.1). IMF HQ will provide resources to produce better current and capital accounts of the balance of payments (RBM codes 4.6-4.8) and government finance statistics.
In the macroeconomic analysis and frameworks area, PFTAC will provide TA on developing the methodology used to forecast revenues focusing on planned tax reform measures. In addition, TA will also be provided to develop capacity to assess alternative fiscal consolidation options for preserving fiscal / debt sustainability when the Compact grants expire in 2023.
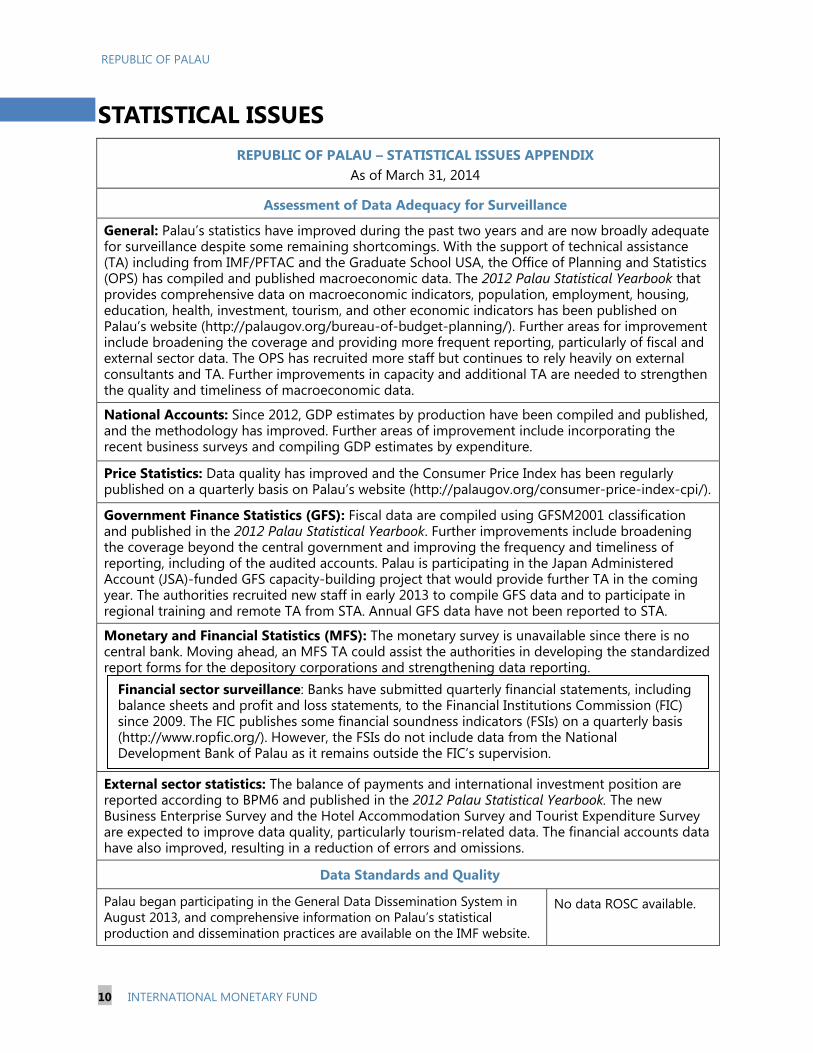
REPUBLIC OF PALAU
10 INTERNATIONAL MONETARY FUND
STATISTICAL ISSUES REPUBLIC OF PALAU – STATISTICAL ISSUES APPENDIX
As of March 31, 2014
Assessment of Data Adequacy for Surveillance
General: Palau’s statistics have improved during the past two years and are now broadly adequate for surveillance despite some remaining shortcomings. With the support of technical assistance (TA) including from IMF/PFTAC and the Graduate School USA, the Office of Planning and Statistics (OPS) has compiled and published macroeconomic data. The 2012 Palau Statistical Yearbook that provides comprehensive data on macroeconomic indicators, population, employment, housing, education, health, investment, tourism, and other economic indicators has been published on Palau’s website (http://palaugov.org/bureau-of-budget-planning/). Further areas for improvement include broadening the coverage and providing more frequent reporting, particularly of fiscal and external sector data. The OPS has recruited more staff but continues to rely heavily on external consultants and TA. Further improvements in capacity and additional TA are needed to strengthen the quality and timeliness of macroeconomic data.
National Accounts: Since 2012, GDP estimates by production have been compiled and published, and the methodology has improved. Further areas of improvement include incorporating the recent business surveys and compiling GDP estimates by expenditure.
Price Statistics: Data quality has improved and the Consumer Price Index has been regularly published on a quarterly basis on Palau’s website (http://palaugov.org/consumer-price-index-cpi/).
Government Finance Statistics (GFS): Fiscal data are compiled using GFSM2001 classification and published in the 2012 Palau Statistical Yearbook. Further improvements include broadening the coverage beyond the central government and improving the frequency and timeliness of reporting, including of the audited accounts. Palau is participating in the Japan Administered Account (JSA)-funded GFS capacity-building project that would provide further TA in the coming year. The authorities recruited new staff in early 2013 to compile GFS data and to participate in regional training and remote TA from STA. Annual GFS data have not been reported to STA.
Monetary and Financial Statistics (MFS): The monetary survey is unavailable since there is no central bank. Moving ahead, an MFS TA could assist the authorities in developing the standardized report forms for the depository corporations and strengthening data reporting.
External sector statistics: The balance of payments and international investment position are reported according to BPM6 and published in the 2012 Palau Statistical Yearbook. The new Business Enterprise Survey and the Hotel Accommodation Survey and Tourist Expenditure Survey are expected to improve data quality, particularly tourism-related data. The financial accounts data have also improved, resulting in a reduction of errors and omissions.
Data Standards and Quality
Palau began participating in the General Data Dissemination System in August 2013, and comprehensive information on Palau’s statistical production and dissemination practices are available on the IMF website.
No data ROSC available.
Financial sector surveillance: Banks have submitted quarterly financial statements, including balance sheets and profit and loss statements, to the Financial Institutions Commission (FIC) since 2009. The FIC publishes some financial soundness indicators (FSIs) on a quarterly basis (http://www.ropfic.org/). However, the FSIs do not include data from the National Development Bank of Palau as it remains outside the FIC’s supervision.
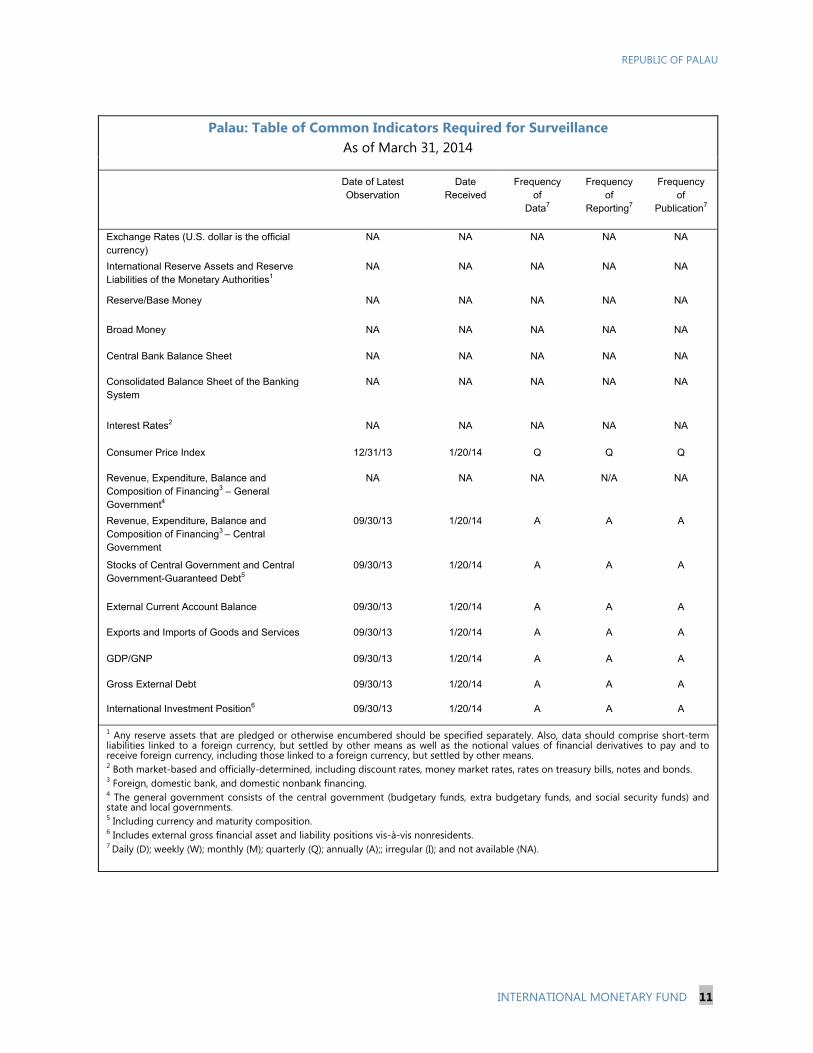
REPUBLIC OF PALAU
INTERNATIONAL MONETARY FUND 11
Palau: Table of Common Indicators Required for Surveillance
As of March 31, 2014
Date of Latest Observation
Date Received
Frequency of
Data7
Frequency of
Reporting7
Frequency of
Publication7
Exchange Rates (U.S. dollar is the official currency)
NA NA NA NA NA
International Reserve Assets and Reserve Liabilities of the Monetary Authorities1
NA NA NA NA NA
Reserve/Base Money
NA NA NA NA NA
Broad Money NA NA NA NA NA
Central Bank Balance Sheet NA NA NA NA NA
Consolidated Balance Sheet of the Banking System
NA NA NA NA NA
Interest Rates2 NA NA NA NA NA
Consumer Price Index 12/31/13 1/20/14 Q Q Q
Revenue, Expenditure, Balance and Composition of Financing3 – General Government4
NA NA NA N/A NA
Revenue, Expenditure, Balance and Composition of Financing3 – Central Government
09/30/13 1/20/14 A A A
Stocks of Central Government and Central Government-Guaranteed Debt5
09/30/13 1/20/14 A A A
External Current Account Balance 09/30/13 1/20/14 A A A
Exports and Imports of Goods and Services 09/30/13 1/20/14 A A A
GDP/GNP 09/30/13 1/20/14 A A A
Gross External Debt 09/30/13 1/20/14 A A A
International Investment Position6 09/30/13 1/20/14 A A A
1 Any reserve assets that are pledged or otherwise encumbered should be specified separately. Also, data should comprise short-term liabilities linked to a foreign currency, but settled by other means as well as the notional values of financial derivatives to pay and to receive foreign currency, including those linked to a foreign currency, but settled by other means. 2 Both market-based and officially-determined, including discount rates, money market rates, rates on treasury bills, notes and bonds. 3 Foreign, domestic bank, and domestic nonbank financing. 4 The general government consists of the central government (budgetary funds, extra budgetary funds, and social security funds) and state and local governments. 5 Including currency and maturity composition. 6 Includes external gross financial asset and liability positions vis-à-vis nonresidents. 7 Daily (D); weekly (W); monthly (M); quarterly (Q); annually (A);; irregular (I); and not available (NA).

Press Release No. 14/200
FOR IMMEDIATE RELEASE
May 6, 2014
IMF Executive Board Concludes 2014 Article IV Consultation with the Republic of Palau
On April 23, 2014, the Executive Board of the International Monetary Fund (IMF) concluded the
Article IV consultation with the Republic of Palau.1
After two years of strong expansion, growth is estimated at around zero in fiscal year 2013
(FY2013, ending in September) owing to declines in construction and tourism. Inflation
moderated to 2¾ percent (annual average) in FY2013 thanks to stable international food and fuel
prices, and it is expected to stay around 3 percent in FY2014. Growth is projected to increase to
1¾ percent in FY2014 and to 2¼–2½ percent over the medium term driven by the recovery in
tourism and infrastructure developments. This modest outlook is subject to downside risks from
financial market volatility and growth slowdown in Asia, a U.S. dollar appreciation, natural
disasters, and the heavy reliance on food and fuel imports.
The current account deficit deteriorated slightly in FY2013 due to lower tourist arrivals and large
reconstruction imports associated with typhoon Bopha, but tourism recovery and moderating
food and fuel prices are expected to reduce the deficit in FY2014–15. After worsening slightly in
FY2016–18 due to imports related to infrastructure projects, the deficit would narrow to
5½ percent of GDP over the medium term and remain fully funded by grants, loans, and FDI.
The current fiscal deficit excluding grants (fiscal anchor) is estimated to have remained
unchanged at 12¼ percent of GDP in FY2013. Tax revenue continued to rise thanks to increases
in tourism-related taxes, higher prices in the tourism industry, and improvement in tax
compliance, but current spending was larger than budgeted due to natural disasters. In view of
the authorities’ intention to contain spending and save additional revenue gains from the recent
revenue measures, the current fiscal deficit excluding grants is projected to narrow by 1½ percent
of GDP in FY2014, putting the fiscal consolidation back on track. In view of the expiration of
Compact grants in FY2024, substantial fiscal adjustment over the medium term is needed to
build adequate government deposits and to ensure long-term fiscal sustainability.
1 Under Article IV of the IMF's Articles of Agreement, the IMF holds bilateral discussions with members, usually
every year. A staff team visits the country, collects economic and financial information, and discusses with officials
the country's economic developments and policies. On return to headquarters, the staff prepares a report, which
forms the basis for discussion by the Executive Board.
International Monetary Fund
700 19th
Street, NW
Washington, D. C. 20431 USA

2
Executive Board Assessment
Executive Directors noted that Palau’s near-term outlook is generally favorable but exposed to
the risks inherent to the geography and narrow production base of a small island economy. With
full dollarization ruling out recourse to monetary and exchange rate policies against adverse
shocks, Directors encouraged the authorities to build up fiscal buffers and step up reforms to
diversify the economy and develop the private sector.
Directors welcomed the authorities’ commitment to a sustained fiscal adjustment to secure sound
public finances once grants under the Compact of Free Association expire in 2024. They
supported plans to enact soon a comprehensive tax reform bill which, if complemented by
improvements in revenue administration, promises a significant increase in budgetary resources
over the medium term. Directors also recommended reforms to contain the growth of current
spending as a key element of the consolidation strategy. More broadly, Directors agreed that
fiscal adjustment should be accompanied by further steps to improve public financial
management, strengthen the pension and social security systems, and ensure that the public
utility company achieves full cost recovery in its operations.
Directors considered that promoting private sector development and economic diversification
would bolster Palau’s resilience to shocks. Additional improvements in infrastructure, and
reforms to strengthen the investment climate, including a more flexible foreign investment
regime, would also lift long-term prospects and promote more inclusive growth.
Directors welcomed progress in strengthening financial supervision and preserving the
soundness of the financial sector. They noted that broadening financial supervision to include the
national development bank and other non-bank financial institutions is essential to preserve the
sector’s stability. Directors also encouraged the authorities to further improve their regime
against money-laundering and the financing of terrorism.

3
Palau: Selected Economic Indicators, 2008/09–2014/15 1/
Nominal GDP for FY2012: US$232 million Population (2012): 17,611 GDP per capita for FY2012: US$13,191 Quota: SDR 3.1 million
2008/09 2009/10 2010/11 2011/12 2012/13 2013/14 2014/15
Est. Proj. 2/
Real sector
Nominal GDP (million US$) 3/ 198.2 197.5 217.3 232.3 245.8 258.9 273.1
Real GDP growth (percent change) -10.7 3.2 5.2 5.5 -0.2 1.8 2.2
GDP deflator (percent change) 4.0 -3.5 4.6 1.3 6.1 3.5 3.2
Consumer prices (percent change; period average) 4.7 1.1 2.6 5.4 2.8
3.0 3.5
Tourist arrivals (number of visitors) 73,365 81,934 103,080 116,856 108,522 112,863 117,377
Public finance 3/ (In percent of GDP)
Central government
Revenue 39.2 44.2 41.0 41.7 38.0 43.9 40.4
Taxes and other revenue 18.1 19.0 19.8 20.9 21.3 21.6 22.4
Grants 21.1 25.2 21.1 20.8 16.6 22.3 18.0
Expenditure 40.0 45.1 39.8 40.8 37.1 39.0 39.5
Expense 34.6 34.9 33.1 33.2 33.7 32.3 32.3
Net acquisition of nonfinancial assets 5.4 10.2 6.7 7.5 3.4 6.7 7.2
Current balance (excluding grants) 4/ -16.5 -15.9 -13.3 -12.3 -12.3 -10.7 -9.9
Net lending (+)/borrowing (–) -0.8 -0.9 1.2 0.9 0.9 4.9 0.9
(In millions of U.S. dollars)
Compact Trust Fund (CTF) balance 144.0 151.1 146.5 169.9 189.6 201.0 214.6
Government cash and deposits 5/ 3.8 8.9 6.6 11.1 12.4 17.2 17.4
Balance of payments 3/
Trade balance -80.2 -86.8 -106.4 -114.7 -123.9 -130.2 -137.8
Exports (f.o.b.) 13.8 16.0 18.6 20.9 20.8 19.0 18.0
Imports (f.o.b.) 94.0 102.8 125.1 135.6 144.7 149.2 155.8
Tourism receipts 85.7 84.2 114.9 125.8 128.1 137.2 147.7
Current account balance
Including grants -9.2 -14.3 -8.9 -11.7 -16.1 -14.2 -14.5
Excluding grants -41.4 -50.1 -44.2 -47.4 -49.9 -49.8 -49.6
International Investment Position 28.6 41.3 39.4 88.7 122.9 137.3 154.0
Assets 327.3 337.2 335.5 394.0 428.5 448.1 466.2
Liabilities 298.7 296.0 296.0 305.3 305.7 310.8 312.1
Of which: External debt 70.4 66.5 62.7 69.1 64.9 63.8 59.8 (In percent of GDP)
Current account balance
Including grants -4.7 -7.2 -4.1 -5.0 -6.5 -5.5 -5.3
Excluding grants -20.9 -25.4 -20.3 -20.4 -20.3 -19.2 -18.2
International Investment Position 14.4 20.9 18.1 38.2 50.0 53.0 56.4
Of which: External debt 35.5 33.7 28.9 29.7 26.4 24.6 21.9
Sources: Palau authorities; and IMF staff estimates and projections.
1/ Fiscal year ending September 30.
2/ Staff projections.
3/ Incorporates the authorities’ revised estimates of GDP and balance of payments, and the audited government financial statements.
4/ Defined as Revenue less Grants and Expense.
5/ Includes unspent external loans.
Statement by Jong-Won Yoon, Executive Director for the Republic of Palau, and TJ Oscar I. Remengesau III, Advisor to the Executive Director
April 23, 2014
Our Palauan authorities wish to express their utmost appreciation to the Fund and its Staff for the constructive engagements and concise report. The authorities broadly concur with the staff views expressed in the 2014 Article IV report which effectively highlighted the current economic status as well as the remaining challenges to preserve macroeconomic stability and ensure long term growth.
Palau, as a small island nation in the remote North Pacific, has a narrow production and export base and remains highly vulnerable to external shocks and natural disasters. To ensure macroeconomic stability, the government is determined to build adequate buffers to mitigate downside risks, address structural impediments to growth and to maintain prudent macroeconomic policies. Given the inherent challenges including resource constraints, my authorities are very grateful for the continued assistance from the international community, in particular, the United States, who has been providing financial support through the Compact of Free Association.1
Economic Development and Outlook
Growth slowed down in FY2013 mainly due to the decline in construction and tourism. The recent typhoon Haiyan had a small adverse effect on GDP, with reconstruction activity offsetting some of the impact. Inflation has moderated to 2¾ percent, thanks to stable international food and fuel prices. However, growth is seen recovering in the near-term as tourism recovers.
There are promising signs that economic activity has picked up in the first few months of 2014, thanks to a strong recovery in tourism. Over the medium-term, growth is expected to gain momentum as tourism recovers and the benefits of recent reforms begin to materialize. Real GDP is forecast to grow at around 1¾ percent in FY2014 and 2¼ - 2½ percent over the medium-term.
While the outlook is positive for 2014 and favorable in the medium-term, important risks to the forecasts remain. Risks remain weighted to the downside if a severe downturn emerges in Asia, Palau’s main source of tourists. A sharp rise in food and fuel prices would also have a negative impact on the economy, given Palau’s heavy reliance on imports. Furthermore, the absence of monetary and exchange rate policies (the economy is using dollar as a legal tender), limit policy space to counter the risks.
1 The Compact of Free Association, which was ratified in 1994 and was then renewed and amended in 2010. The new agreement will last until FY2024 totaling US$229 million, a substantial decrease from the initial US$580 million compact funding in FY1994-FY2009, of which passage, however, has been delayed in US Congress due to lack of offsets to the proposed budget.
2
The authorities are fully aware of Palau’s daunting fiscal challenges from the expiration of the Compact grants in 2024. They indicated that along with current fiscal adjustments, strengthened private sector development is crucial in the near term as the Compact of Free Association with the United States winds down. Given the anticipated increase in the number of tourists coming to Palau, the authorities have focused on development initiatives that would positively improve the tourism sector. New hotels are being constructed in order to accommodate increased tourist volumes. The authorities have negotiated an increase in the number of scheduled and chartered flights in response to the demand from Asia, particularly China. They have also revamped tourism-related activities and continue to identify ways to diversify the tourism industry, Palau’s bread and butter. Fiscal Sustainability The authorities agree that continued fiscal consolidation is needed to build non-Compact Trust Fund (CTF) savings and ensure fiscal self-sufficiency in the future. Given the burden of adjustment, the authorities are looking to embark on a comprehensive revenue and expenditure reforms, which are essential to resolve long-standing fiscal imbalances. The mid-term priority is to pass the tax reform bill, followed by expenditure reforms to be done gradually at a later stage. While current spending was larger than budgeted due to typhoon Bopha in December 2012, the cash buffers, excluding the Compact Trust Fund (CTF), increased to 5 percent of GDP due to stronger revenue and the domestic accounts payables fall to 11 percent of GDP. The authorities credit the slowed fiscal consolidation in FY2013 as a result of two natural disasters. After typhoon Haiyan hit the country in November 2013, the authorities reallocated the planned savings of about ½ percent of GDP for reconstruction expenses. The authorities intend to replenish the reserve fund by containing spending and saving additional revenue gains that are expected with the adoption of a new IT system in customs, the recent increase in the tobacco tax, and the recovery of tourism. Despite the slowdown in tourism in FY2013, tax revenue continued rising thanks to increases in tourism-related taxes, higher prices in the tourism industry, as well as improvements in tax compliance. The current fiscal deficit excluding grants is estimated to have remained unchanged at 12¼ percent of GDP in FY2013. The FY2014 budget reflects the authorities’ commitment to fiscal consolidation by maintaining prudent spending and creating a reserve fund to build fiscal buffers. Reform Agenda The current economic recovery has allowed an opportunity for the authorities to begin the consolidation of the fiscal position. Immediate steps have been taken to strengthen revenue collection. They have continued to embark on several measures to implement structural, as well as revenue and expenditure reforms.
3
Palau’s economy is in the midst of a period of extensive reform that has broad implications for the wider population. Comprehensive reforms are being pursued along many fronts, and the authorities are aware that the social safety net for the most vulnerable must be protected to compensate for the social impact of reforms. Comprehensive Tax Reform The authorities are committed to a comprehensive tax reform aimed at simplifying the tax framework, increasing its fairness, and raising revenue capacity over the medium term. The authorities expressed that comprehensive tax reform will strengthen their effort to re-build the fiscal position. The authorities’ are pushing forwarding with the tax reform bill which is expected to pass in Congress by May 2014. In line with the IMF/PFTAC technical assistance (TA) recommendations, the authorities emphasized the need to replace the gross revenue tax with a single rate VAT with no exemptions except for exports, moving to c.i.f. valuation for imports, raising net income tax (NIT) for financial institutions from the current 4 percent to 20 percent in gradual stages, and expanding it to all VAT registered business. Furthermore, as staff noted, the wage and salary tax rates for low income household could be reduced to offset a potential adverse impact of price increases due to VAT adoption. The authorities also stressed the need to improve revenue administration capacity to support this major reform. This comprehensive tax reform package will bring revenue gain by about 4 percent of GDP during FY2014-19. Medium-term Fiscal Framework Sizable adjustment is required in order to achieve long-term fiscal sustainability. As staff projected, a gradual reduction in the current fiscal deficit by about 8 percent of GDP through FY2019 will provide a sustainable source of financing and offer an adequate fiscal buffer. The authorities recognize the task that lies ahead but are also trying to balance the adjustment with the need for political support for the required reforms. This is particularly important with the expiration of Compact grants in FY2024, which have averaged more than 20 percent of GDP over the past decade. The authorities have taken steps to implement a medium-term budget framework (MTBF) in order to ensure a structured, comprehensive, and realistic approach that is consistent with a sound fiscal policy strategy. An added benefit from this approach would be enhancing budget credibility and governance. With the MTBF, the authorities hope to exert better control over budget execution which is based upon cash availability, cash planning, and spending. Financial Sector The banking system remains profitable and well capitalized. The authorities are committed to ensuring that the banking system is stable and safe for depositors. The Financial Institutions Commission (FIC) has been proactive in its mandate and has increased monitoring of the banks’ loan write-offs. Private credit growth rebounded to 11½ percent in

4
2013. The authorities agree with the need to include the development bank under the FIC’s oversight. The authorities are committed to continue their effort against money laundering and in combating the financing of terrorism (AML/CFT). The Financial Intelligence Unit in collaboration with the FIC has the mandate to investigate any criminal activities within the financial sector and has strengthened its capacity to conduct AML/CFT examinations. Private Sector Development The authorities will continue to undertake critical growth enhancing investment and implement strong structural reforms that will support growth. In their efforts to strengthen economic development the authorities are seeking to develop a vibrant private sector as evidenced by the recent establishment of the Economic Advisory Group. They are of the view that private sector development is a key complement to the planned fiscal consolidation. The authorities have taken critical steps to create a business environment that would allow businesses, both foreign and domestic, to operate successfully through regulatory improvements to the FDI regime and simplification of the regulations on land-use and the labor market. To this end, our authorities are committed to improving the business environment and reducing bottlenecks to improve investor confidence and to lift potential growth. Finally, our Palauan authorities would like to express their gratitude to Management, the IMF mission chief and his team, and the TA mission teams for their continued efforts and dedication.