imf country report no. 17/189 south africa - … art... · 2017-07-06 · considered that greater...
TRANSCRIPT

© 2017 International Monetary Fund
IMF Country Report No. 17/189
SOUTH AFRICA 2017 ARTICLE IV CONSULTATION—PRESS RELEASE; STAFF REPORT; AND STATEMENT BY THE EXECUTIVE DIRECTOR FOR SOUTH AFRICA
Under Article IV of the IMF’s Articles of Agreement, the IMF holds bilateral discussions
with members, usually every year. In the context of the 2017 Article IV consultation with
South Africa, the following documents have been released and are included in this
package:
A Press Release summarizing the views of the Executive Board as expressed during its
June 26, 2017 consideration of the staff report that concluded the Article IV
consultation with South Africa.
The Staff Report prepared by a staff team of the IMF for the Executive Board’s
consideration on June 26, 2017, following discussions that ended on May 16, 2017,
with the officials of South Africa on economic developments and policies. Based on
information available at the time of these discussions, the staff report was completed
on June 9, 2016.
An Informational Annex prepared by the IMF staff.
A Statement by the Executive Director for South Africa.
The IMF’s transparency policy allows for the deletion of market-sensitive information and
premature disclosure of the authorities’ policy intentions in published staff reports and
other documents.
Copies of this report are available to the public from
International Monetary Fund Publication Services
PO Box 92780 Washington, D.C. 20090
Telephone: (202) 623-7430 Fax: (202) 623-7201
E-mail: [email protected] Web: http://www.imf.org
Price: $18.00 per printed copy
International Monetary Fund
Washington, D.C.
July 2017

Press Release No. 17/263
FOR IMMEDIATE RELEASE
July 6, 2017
IMF Executive Board Concludes 2017 Article IV Consultation with South Africa
On June 26, 2017, the Executive Board of the International Monetary Fund concluded the Article
IV consultation1 with South Africa.
Living conditions have ameliorated substantially for the bulk of South Africa’s population during
the past two decades, but the pace of improvement has gradually slowed. Following last year’s
near-standstill in economic activity, growth is projected to increase to 1.0 percent in 2017 and
1.2 percent in 2018, still insufficient to keep pace with the rising population. The current account
deficit is projected to decline to 3 percent of GDP in 2017, boosted by mining and agricultural
exports, and to widen to just below 4 percent of GDP in the medium term. Consumer price
inflation recently returned below 6 percent, owing in part to the easing of the drought, and is
projected to remain marginally below the upper threshold of the 3-6 percent target band for the
remainder of 2017 and in 2018.
South Africa’s vulnerabilities have become more pronounced and are set to increase further
unless economic growth revives. Low growth has taken a toll on the state of the public finances,
increasing government debt. The public sector’s balance sheet is also exposed to sizable
contingent liabilities from state-owned enterprises (SOEs). Perceptions of weakening governance
and uncertainties regarding the direction of future economic policies, partly related to the
electoral calendar, have also adversely affected consumer and investor confidence. In the
external sector, large gross external financing needs, financed mainly by portfolio flows, expose
South Africa to significant financing risks. Vulnerabilities from exchange rate fluctuations are
attenuated by South Africa’s track record of a freely floating exchange rate, corporate resilience
to sizable exchange rate depreciation during the past few years, and high share of domestic-
currency-denominated government debt. Even so, external and domestic contexts could result in
significant shocks, whose implications could in turn be amplified by linkages among the real,
financial, and fiscal sectors, especially if accompanied by further downgrades of local currency
sovereign credit ratings to below investment grade.
1 Under Article IV of the IMF's Articles of Agreement, the IMF holds bilateral discussions with members, usually
every year. A staff team visits the country, collects economic and financial information, and discusses with officials
the country’s economic developments and policies. On return to headquarters, the staff prepares a report, which
forms the basis for discussion by the Executive Board.
International Monetary Fund
700 19th Street, NW
Washington, D. C. 20431 USA

Monetary and fiscal policies have been focused on keeping inflation in check and maintaining
medium-term debt sustainability. The South African Reserve Bank (SARB) tightened the repo
rate in stages by 75 bps in early-2016 to 7.0 percent and has kept it at that level since then. The
headline fiscal deficit was reduced to 3.9 percent of GDP in FY2016/17 from 4.5 percent the
previous fiscal year, and the budget for FY2017/18 envisages a further moderate tightening. The
pace of reform in the labor market and in product/service markets has been insufficient to make a
noticeable contribution to reviving economic growth.
Executive Board Assessment2
Executive Directors considered that the scope for monetary or fiscal policy to provide stimulus is
limited. They noted that, with headline inflation projected marginally below the upper threshold
of the target band, keeping policy rates on hold is appropriate. Directors highlighted the need for
prudent fiscal policy aimed at maintaining debt sustainability while prioritizing pro-growth and
pro-poor spending. They encouraged the authorities to strengthen budget execution and the
implementation of revenue and fiscal reform measures to ensure that government debt stabilizes
significantly below 60 percent of GDP. In particular, they emphasized the need to monitor and
manage fiscal risks from explicit or implicit government guarantees, and the importance of
reform of state-owned enterprises.
Directors urged the authorities to accelerate the pace of reforms in product, service, and labor
markets to spur economic growth and job creation, especially for young people. Reforms should
focus on sectors providing crucial inputs for firms in the economy, such as power generation,
telecommunications, transportation, and financial services for SMEs. In the labor market,
improving educational attainment and skills will be crucial. Directors considered that wage
determination should become more responsive to firm-specific circumstances, including
productivity. They noted that the recently-agreed national minimum wage has the potential to
make a material difference for large segments of the population, although its impact on
employment should be carefully monitored. They urged the authorities to stand ready to
introduce complementary measures to support young workers and SMEs. They also encouraged
them to promote parallel initiatives to improve labor relations, including implementation of a
code of good practice in collective bargaining. Strengthening governance and fighting corruption
will also be critical.
Directors considered that bringing to fruition ongoing reforms in the financial sector to adapt
prudential regulation fully to international best practice and enhance the resolution framework
would further buttress resilience. These reforms should be complemented with greater
competition in the banking system. Robust implementation of the Financial Intelligence Center
Amendment Act will be important to strengthen the integrity of the financial system. Directors
2 At the conclusion of the discussion, the Managing Director, as Chairman of the Board, summarizes the views of
Executive Directors, and this summary is transmitted to the country's authorities. An explanation of any qualifiers
used in summings up can be found here: http://www.imf.org/external/np/sec/misc/qualifiers.htm.
considered that greater access to finance, combined with proper supervision, would help reduce
inequality.
Directors commended South Africa’s resilience, which owes to its flexible exchange rate, low
reliance on foreign currency debt, large domestic investor base, and broadly balanced
international investment position. They noted that attracting more durable foreign investment and
increasing international reserves would further enhance resilience.

Table 1. South Africa: Selected Economic and Social Indicators, 2012–17 Social Indicators
GDP Poverty (percent of population)
Nominal GDP (2016, billions of US dollars) 295
Headcount ratio at $1.90 a day (2011 PPP) (percent of population) 16.6
GDP per capita (2016, in US dollars) 5272
Undernourishment (2015) 5.0
Population characteristics Inequality (income shares unless otherwise specified)
Total (2016, million) 55.9
Highest 10 percent of population 51.3
Urban population (percent of total), 2014 64
Lowest 20 percent of population
2.5
Life expectancy at birth (years), 2016 62
Gini coefficient (2010)
63.4
Economic Indicators
2013 2014 2015 2016 2017 2018
Est. Proj. Proj.
National income and prices (annual percentage change unless otherwise indicated) Real GDP
2.5 1.7 1.3 0.3 1.0 1.2
Real GDP per capita
0.9 0.1 -0.3 -1.3 -0.6 -0.5
Real domestic demand
3.2 0.4 1.7 -0.7 0.7 1.2
GDP deflator
6.1 5.8 5.0 6.8 5.8 5.7
CPI (annual average)
5.8 6.1 4.6 6.3 5.7 5.6
CPI (end of period)
5.4 5.3 5.3 6.7 5.6 5.5
Labor market (annual percentage change unless otherwise indicated)
Unemployment rate (percent of labor force, annual average) 24.7 25.1 25.4 26.7 27.4 28.0
Average remuneration (formal nonagricultural, nominal) 7.2 6.5 7.0 8.1 7.5 7.4
Labor productivity (formal nonagricultural)
1.9 1.3 1.9 1.9 1.9 1.9
Unit labor costs (formal nonagricultural)
5.1 5.1 5.1 6.2 5.5 5.4
Savings and Investment (percent of GDP unless otherwise indicated)
Gross national saving
15.4 15.5 16.3 16.2 16.1 15.7
Public (incl. public enterprises)
-0.9 1.1 1.1 1.0 0.9 1.0
Private
16.2 14.4 15.2 15.1 15.2 14.7
Investment (including inventories)
21.3 20.8 20.7 19.4 19.1 19.1
Public (incl. public enterprises)
7.1 7.3 7.6 7.6 7.6 7.6
Private
13.3 13.3 12.8 12.0 11.7 11.7
Fiscal position (percent of GDP unless otherwise indicated) 1/
Revenue, including grants 2/
27.3 27.6 28.3 28.9 29.1 29.4
Expenditure and net lending
31.6 31.8 32.9 32.9 33.2 33.4
Overall balance
-4.3 -4.2 -4.6 -4.0 -4.1 -4.0
Primary balance
-1.3 -1.1 -1.3 -0.5 -0.4 -0.2
Structural balance (percent of potential GDP)
-4.2 -4.0 -3.9 -3.5 -3.5 -3.3
Gross government debt 3/
44.1 47.0 49.3 51.7 52.6 54.7
Government bond yield (10-year, percent) 4/ 8.2 8.0 9.7 8.9 8.7 ...
Money and credit (annual percentage change unless otherwise indicated)
Broad money
5.9 7.3 10.3 6.1 6.8 6.9
Credit to the private sector
6.6 7.2 8.3 5.6 4.8 5.1
Repo rate (percent, end-period) 4/ 5.0 5.8 6.3 7.0 7.0 ...
3-month Treasury bill interest rate (percent) 4/ 5.1 5.8 6.1 7.2 7.4 ...
Balance of payments (percent of GDP unless otherwise indicated) Current account balance (billions of U.S. dollars) -21.6 -18.7 -14.0 -9.6 -9.6 -11.1
percent of GDP -5.9 -5.3 -4.4 -3.3 -3.0 -3.4
Exports growth (volume)
3.6 3.2 3.9 -0.1 1.9 2.4
Imports growth (volume)
5.0 -0.5 5.4 -3.7 0.9 2.5
Terms of trade (percentage change)
-1.4 -1.6 3.4 0.3 0.3 -1.4
Overall balance 0.1 0.4 -0.2 0.9 0.0 0.0
Gross reserves (billions of U.S. dollars) 49.6 49.1 45.8 47.4 47.4 47.4
Total external debt 37.2 41.3 39.1 48.5 45.2 46.2
Nominal effective exchange rate (percentage change, period average) 5/ -14.4 -10.3 -5.6 -11.0 12.7 …
Real effective exchange rate (percentage change, period average) 6/ -10.1 -3.3 1.1 -3.7 12.9 …
Exchange rate (Rand/U.S. dollar, end-period) 7/ 10.5 11.6 15.6 13.7 13.1 …
Sources: South African Reserve Bank, National Treasury, Haver, Bloomberg, World Bank, and Fund staff estimates and projections.
1/ Consolidated government as defined in the budget unless otherwise indicated. 2/ Revenue excludes the line "transactions in assets and liabilities" classified as part of revenue in budget documents. This is because this line captures proceeds from the sales of
assets, realized valuation gains from holding of foreign currency deposits, and other conceptually similar items which are not classified as revenue by the IMF's Government
Finance Statistics Manual 2010.
3/ Central government. 4/ Average of January-May 2017 data 5/ Percentage change January-May 2017 average with respect to 2016 average. 6/ Percentage change January-March 2017 average with respect to 2016 average. 7/ End May 2017
SOUTH AFRICA
STAFF REPORT FOR THE 2017 ARTICLE IV CONSULTATION
KEY ISSUES
Context. Living conditions have ameliorated substantially for the bulk of South Africa’s
population since the advent of democracy, but the pace of improvement has gradually
slowed. Economic growth is currently insufficient to make a dent in widespread
unemployment and longstanding inequalities. Public debate is increasingly questioning
whether the prevailing economic policy paradigm can deliver results for all citizens.
Outlook and risks. Following last year’s near-standstill in economic activity, growth is
projected to pick up to 1.0 percent in 2017 and 1.2 percent in 2018, largely owing to a
recovery in agricultural and mining output in 2017 and a gradual improvement in
consumption and investment thereafter. Consumer and investor confidence remain low.
South Africa’s vulnerabilities have risen, owing to rising government debt and contingent
liabilities, especially in state-owned enterprises, and perceptions of weakening governance.
On the external front, the main risks stem from a possible decline in commodity prices,
faster-than-expected rise in global interest rates, or a retreat from cross-border integration.
Fiscal and monetary policies. With government debt projected to reach 56 percent of GDP
in 2020 and inflation projected marginally below the upper end of the 3–6 percent target
band for the remainder of 2017 and in 2018, room for macroeconomic stimulus is limited.
Implementation of this year’s approved budget and of the envisaged moderate
improvement in the structural fiscal balance in the next few years will be key to
strengthening confidence. With respect to monetary policy, rates can remain on hold; an
increase would be appropriate if inflation expectations were to rise.
Structural reforms. Reforms are urgently needed to reignite growth and render it more
inclusive. In product and service markets, such as power generation, telecommunications,
and transportation, fostering entry by new firms would reduce costs for a wide range of
businesses, supporting an increase in output as well as job creation. In the labor market,
there is a need for wage setting to become more reflective of firm-specific circumstances.
Introduction of the national minimum wage, expected in mid-2018, could help millions of
employees; its impact on jobs should be monitored, standing ready to take complementary
measures to support small firms or youth. In the financial sector, ongoing reforms to the
prudential and resolution framework should be brought to fruition. Greater financial
inclusion is needed to provide affordable credit to small firms and low-income households.
June 9, 2017

SOUTH AFRICA
2 INTERNATIONAL MONETARY FUND
Approved By Anne-Marie Gulde-
Wolf (AFR) and Peter
Allum (SPR).
Discussions took place in Pretoria, Johannesburg, and Durban
during May 3–16, 2017. The staff team comprised P. Mauro (head,
AFR), L. Christiansen (SPR), K. Miyajima, A. Simone, J. Zhang (all AFR),
assisted by M. Mlachila (Senior Resident Representative).
Mr. H. Miao (MCM) contributed from HQ. Ms. Tshazibana and
Mr. Sishi (OED) also participated in the discussions.
CONTENTS
BACKGROUND: SLOWDOWN IN ECONOMIC GROWTH _______________________________________ 4
OUTLOOK: MODEST RECOVERY IN CHALLENGING EXTERNAL AND DOMESTIC CONTEXTS 8
POLICIES TO LIFT GROWTH, PERMIT MORE GRADUAL FISCAL ADJUSTMENT, AND
INCREASE RESILIENCE __________________________________________________________________________ 12
A. Fiscal Policy ____________________________________________________________________________________ 12
B. Monetary and Financial Sector Policies ________________________________________________________ 15
C. Reforms of Labor and Product/Service Markets _______________________________________________ 17
STAFF APPRAISAL ______________________________________________________________________________ 20
FIGURES
1. South Africa Remains One of the World’s Most Unequal Societies ____________________________ 23
2. Employment Creation has been Insufficient to Curb Unemployment __________________________ 24
3. Growth Slowed Down Further in 2016 _________________________________________________________ 25
4. Monetary Policy Focused on Bringing Inflation Back into the Target Band ____________________ 26
5. The Current Account Deficit Remained Large Despite an Improving Trade Balance ___________ 27
6. Rising Trade and Foreign Direct Investment Integration _______________________________________ 28
7. The Corporate Sector has Earned Healthy Profits Despite the Economic Weakening _________ 29
8. The Financial Sector Remains Resilient ________________________________________________________ 30
9. Financial Markets have Recovered but Market Uncertainty Remains High ____________________ 31
10. Corporate Sector Balance Sheets are Sound with some Pockets of Vulnerability ____________ 32
11. Gross External Debt has Risen but Does not Stand Out Relative to Peers ____________________ 33
12. Consolidation Against Low Growth Headwinds and Increasing Fiscal Risks __________________ 34
TABLES
1. Selected Economic Indicators, 2013–18 _______________________________________________________ 35
2. Consolidated Government Operations, 2012/13–2019/20 _____________________________________ 36
3. Balance of Payments, 2013–22 _________________________________________________________________ 37
4. Monetary Survey, 2012–17 ____________________________________________________________________ 38
5. Financial Soundness Indicators, 2012–17 ______________________________________________________ 39

SOUTH AFRICA
INTERNATIONAL MONETARY FUND 3
6. Medium-Term Macroeconomic Framework, 2013–22 _________________________________________ 40
7. Indicators of External Vulnerability, 2012–17 __________________________________________________ 41
ANNEXES
I. External Sector Assessment ____________________________________________________________________ 42
II. Financial Inclusion—Falling Short Despite Deep Financial Markets ____________________________ 44
III. Exchange Rate Pass-through to Core Inflation in South Africa ________________________________ 48
IV. External Debt Sustainability Analysis __________________________________________________________ 50
V. Risk Assessment Matrix ________________________________________________________________________ 54
VI. Macro-financial Linkages in South Africa _____________________________________________________ 55
VII. Public Debt Sustainability Analysis ___________________________________________________________ 57
VIII. SOE Reforms—International Experience _____________________________________________________ 66
IX. Implementation of FSAP Recommendations __________________________________________________ 69
X. Introduction of a National Minimum Wage ___________________________________________________ 75
XI. Educational Outcomes: Causes and Consequences ___________________________________________ 83

SOUTH AFRICA
4 INTERNATIONAL MONETARY FUND
BACKGROUND: SLOWDOWN IN ECONOMIC GROWTH
1. Living conditions have ameliorated
substantially for the bulk of South Africa’s
population during the past two decades, but the
pace of improvement has gradually slowed.
Robust economic growth and sound
macroeconomic policies were mutually reinforcing
in the decade that followed the advent of
democracy, fostering economic transformation and
reducing poverty. However, potential growth has
abated in more recent years and poverty reduction
has stalled. Following the global economic and
financial crisis that erupted in 2008 and the decline
in commodity prices that began in 2011–12,
economic activity dwindled to a near-standstill in
2016.
2. Weak economic growth impedes the
economy’s ability to curb unemployment and
inequality, and creates new vulnerabilities. South
Africa remains one of the world’s most unequal
societies (Figure 1), largely owing to the legacies of
apartheid. A 2016 survey by the national statistical
office found that average incomes for blacks are still
one-fifth of those for whites. The rate of
unemployment, at 27.7 percent (54.4 percent for
ages 15–24) in the first quarter of 2017, is high by
international standards and has risen by five
percentage points since 2008 (Figure 2). Projected
output growth, at 1 percent in 2017, is insufficient
to keep pace with the increase in population. In
view of lackluster job creation and the rapid rise in
the working-age population, the unemployment
rate is set to rise further and inequality is unlikely to
decline. Slow growth and persistent inequalities
have contributed to increased questioning in the
public discourse of whether the prevailing
economic policy paradigm can deliver results for all citizens.
-4
-3
-2
-1
0
1
2
3
4
5
6
7
1995
1996
1997
1998
1999
2000
2001
2002
2003
2004
2005
2006
2007
2008
2009
2010
2011
2012
2013
2014
2015
2016
Real GDP and Real GDP per Capita
(growth rates, percent)
Real GDP per Capita
Real GDP
Source: World Economic Outlook
0
5
10
15
20
25
30
35
40
45
50
20
06
20
07
20
08
20
09
20
10
20
11
20
12
20
13
20
14
20
15
20
16
$1.9/day PPP
$3.1/day PPP
Poverty Rate(percent of population)
Source: World Bank, World Development Indicators
Note: Percent of population with per capita income below $1.9 and $3.1 a
day in purchasing power parity terms.
15
17
19
21
23
25
27
29
31
33
1995
1996
1997
1998
1999
2000
2001
2002
2003
2004
2005
2006
2007
2008
2009
2010
2011
2012
2013
2014
2015
2016
2017Q
1
Unemployment Rate(percent)
Source: Quarterly Labor Force Survey, StatsSA
SOUTH AFRICA
INTERNATIONAL MONETARY FUND 5
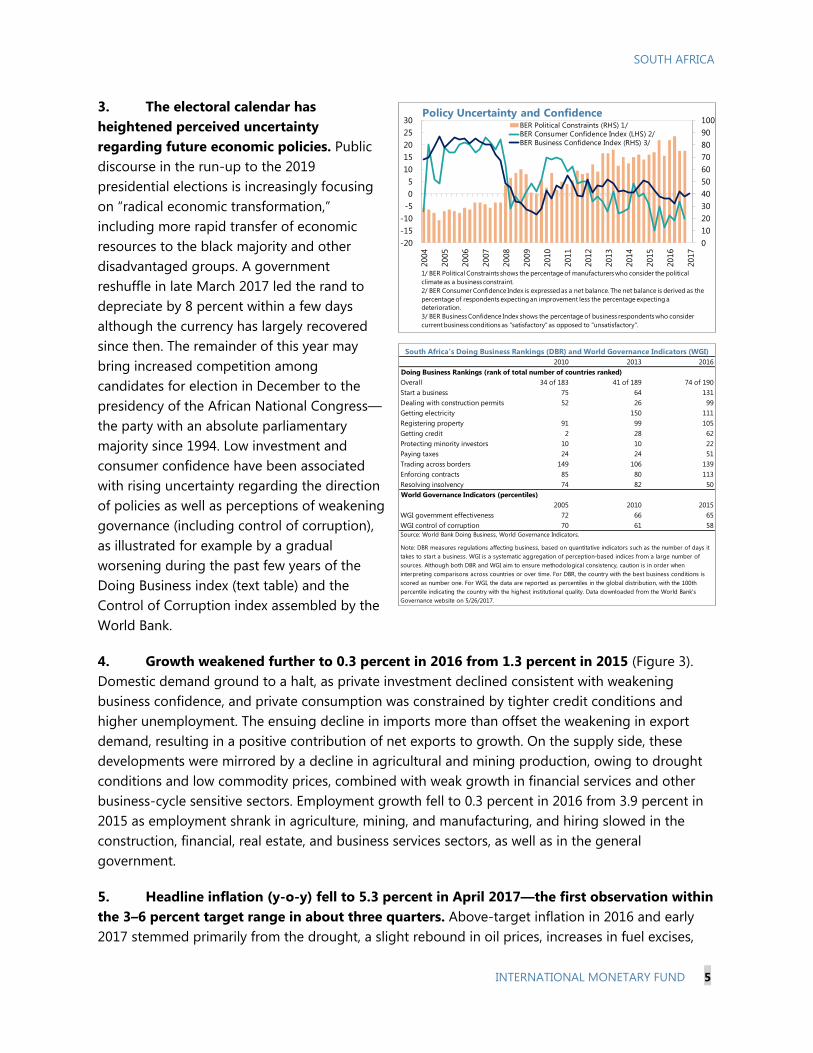
3. The electoral calendar has
heightened perceived uncertainty
regarding future economic policies. Public
discourse in the run-up to the 2019
presidential elections is increasingly focusing
on “radical economic transformation,”
including more rapid transfer of economic
resources to the black majority and other
disadvantaged groups. A government
reshuffle in late March 2017 led the rand to
depreciate by 8 percent within a few days
although the currency has largely recovered
since then. The remainder of this year may
bring increased competition among
candidates for election in December to the
presidency of the African National Congress—
the party with an absolute parliamentary
majority since 1994. Low investment and
consumer confidence have been associated
with rising uncertainty regarding the direction
of policies as well as perceptions of weakening
governance (including control of corruption),
as illustrated for example by a gradual
worsening during the past few years of the
Doing Business index (text table) and the
Control of Corruption index assembled by the
World Bank.
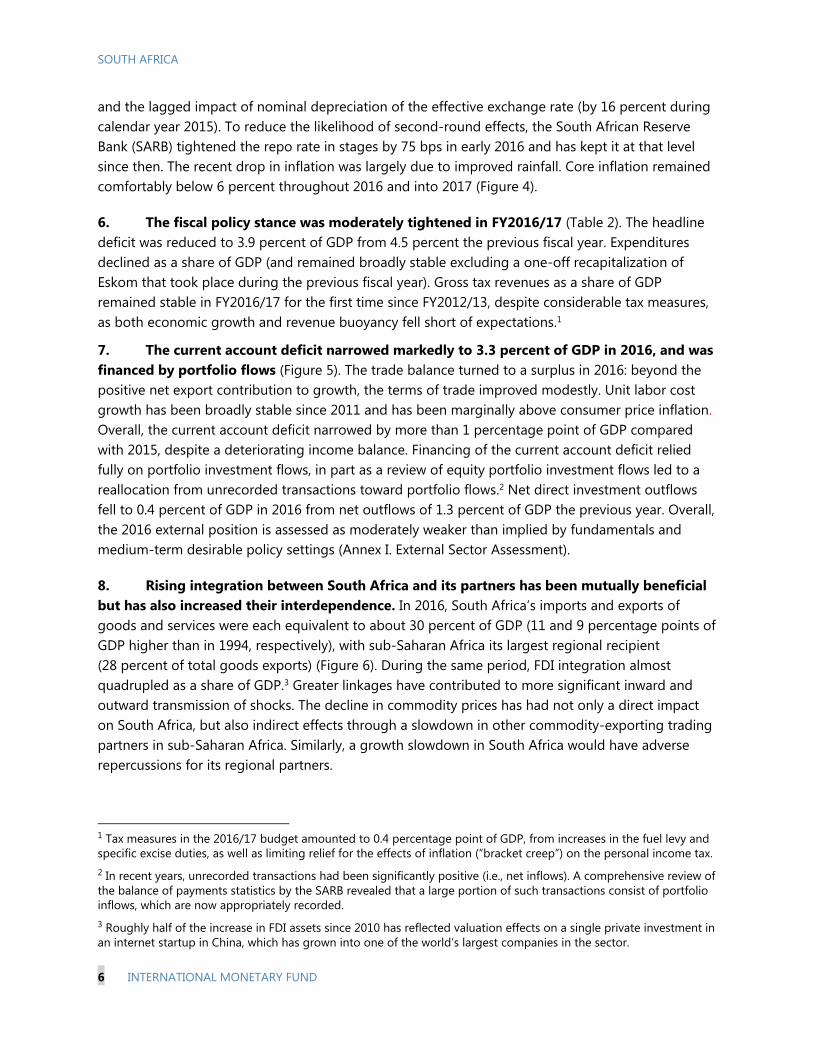
4. Growth weakened further to 0.3 percent in 2016 from 1.3 percent in 2015 (Figure 3).
Domestic demand ground to a halt, as private investment declined consistent with weakening
business confidence, and private consumption was constrained by tighter credit conditions and
higher unemployment. The ensuing decline in imports more than offset the weakening in export
demand, resulting in a positive contribution of net exports to growth. On the supply side, these
developments were mirrored by a decline in agricultural and mining production, owing to drought
conditions and low commodity prices, combined with weak growth in financial services and other
business-cycle sensitive sectors. Employment growth fell to 0.3 percent in 2016 from 3.9 percent in
2015 as employment shrank in agriculture, mining, and manufacturing, and hiring slowed in the
construction, financial, real estate, and business services sectors, as well as in the general
government.
5. Headline inflation (y-o-y) fell to 5.3 percent in April 2017—the first observation within
the 3–6 percent target range in about three quarters. Above-target inflation in 2016 and early
2017 stemmed primarily from the drought, a slight rebound in oil prices, increases in fuel excises,
0
10
20
30
40
50
60
70
80
90
100
-20
-15
-10
-5
0
5
10
15
20
25
30
2004
2005
2006
2007
2008
2009
2010
2011
2012
2013
2014
2015
2016
2017
BER Political Constraints (RHS) 1/
BER Consumer Confidence Index (LHS) 2/
BER Business Confidence Index (RHS) 3/
Policy Uncertainty and Confidence
1/ BER Political Constraints shows the percentage of manufacturers who consider the political
climate as a business constraint.
2/ BER Consumer Confidence Index is expressed as a net balance. The net balance is derived as the
percentage of respondents expecting an improvement less the percentage expecting a
deterioration.
3/ BER Business Confidence Index shows the percentage of business respondents who consider
current business conditions as "satisfactory" as opposed to "unsatisfactory".
2010 2013 2016
Doing Business Rankings (rank of total number of countries ranked)
Overall 34 of 183 41 of 189 74 of 190
Start a business 75 64 131
Dealing with construction permits 52 26 99
Getting electricity 150 111
Registering property 91 99 105
Getting credit 2 28 62
Protecting minority investors 10 10 22
Paying taxes 24 24 51
Trading across borders 149 106 139
Enforcing contracts 85 80 113
Resolving insolvency 74 82 50
World Governance Indicators (percentiles)
2005 2010 2015
WGI government effectiveness 72 66 65
WGI control of corruption 70 61 58
South Africa's Doing Business Rankings (DBR) and World Governance Indicators (WGI)
Source: World Bank Doing Business, World Governance Indicators.
Note: DBR measures regulations affecting business, based on quantitative indicators such as the number of days it
takes to start a business. WGI is a systematic aggregation of perception-based indices from a large number of
sources. Although both DBR and WGI aim to ensure methodological consistency, caution is in order when
interpreting comparisons across countries or over time. For DBR, the country with the best business conditions is
scored as number one. For WGI, the data are reported as percentiles in the global distribution, with the 100th
percentile indicating the country with the highest institutional quality. Data downloaded from the World Bank's
Governance website on 5/26/2017.
SOUTH AFRICA
6 INTERNATIONAL MONETARY FUND
and the lagged impact of nominal depreciation of the effective exchange rate (by 16 percent during
calendar year 2015). To reduce the likelihood of second-round effects, the South African Reserve
Bank (SARB) tightened the repo rate in stages by 75 bps in early 2016 and has kept it at that level
since then. The recent drop in inflation was largely due to improved rainfall. Core inflation remained
comfortably below 6 percent throughout 2016 and into 2017 (Figure 4).
6. The fiscal policy stance was moderately tightened in FY2016/17 (Table 2). The headline
deficit was reduced to 3.9 percent of GDP from 4.5 percent the previous fiscal year. Expenditures
declined as a share of GDP (and remained broadly stable excluding a one-off recapitalization of
Eskom that took place during the previous fiscal year). Gross tax revenues as a share of GDP
remained stable in FY2016/17 for the first time since FY2012/13, despite considerable tax measures,
as both economic growth and revenue buoyancy fell short of expectations.1
7. The current account deficit narrowed markedly to 3.3 percent of GDP in 2016, and was
financed by portfolio flows (Figure 5). The trade balance turned to a surplus in 2016: beyond the
positive net export contribution to growth, the terms of trade improved modestly. Unit labor cost
growth has been broadly stable since 2011 and has been marginally above consumer price inflation.
Overall, the current account deficit narrowed by more than 1 percentage point of GDP compared
with 2015, despite a deteriorating income balance. Financing of the current account deficit relied
fully on portfolio investment flows, in part as a review of equity portfolio investment flows led to a
reallocation from unrecorded transactions toward portfolio flows.2 Net direct investment outflows
fell to 0.4 percent of GDP in 2016 from net outflows of 1.3 percent of GDP the previous year. Overall,
the 2016 external position is assessed as moderately weaker than implied by fundamentals and
medium-term desirable policy settings (Annex I. External Sector Assessment).
8. Rising integration between South Africa and its partners has been mutually beneficial
but has also increased their interdependence. In 2016, South Africa’s imports and exports of
goods and services were each equivalent to about 30 percent of GDP (11 and 9 percentage points of
GDP higher than in 1994, respectively), with sub-Saharan Africa its largest regional recipient
(28 percent of total goods exports) (Figure 6). During the same period, FDI integration almost
quadrupled as a share of GDP.3 Greater linkages have contributed to more significant inward and
outward transmission of shocks. The decline in commodity prices has had not only a direct impact
on South Africa, but also indirect effects through a slowdown in other commodity-exporting trading
partners in sub-Saharan Africa. Similarly, a growth slowdown in South Africa would have adverse
repercussions for its regional partners.
1 Tax measures in the 2016/17 budget amounted to 0.4 percentage point of GDP, from increases in the fuel levy and
specific excise duties, as well as limiting relief for the effects of inflation (“bracket creep”) on the personal income tax.
2 In recent years, unrecorded transactions had been significantly positive (i.e., net inflows). A comprehensive review of
the balance of payments statistics by the SARB revealed that a large portion of such transactions consist of portfolio
inflows, which are now appropriately recorded.
3 Roughly half of the increase in FDI assets since 2010 has reflected valuation effects on a single private investment in
an internet startup in China, which has grown into one of the world’s largest companies in the sector.

SOUTH AFRICA
INTERNATIONAL MONETARY FUND 7
9. Financial conditions remain tight. An
index summarizing conditions in the banking
sector and capital markets is somewhat above its
10-year average, reflecting relatively high interest
rates and credit spreads, as well as uncertainties
measured by the implied 1-year volatility of the
rand.4 Credit growth moderated, especially for
households. Whereas large corporations have
adequate liquidity, small- and medium-sized
enterprises (SMEs) encounter greater challenges
to access financing.
10. Sovereign ratings have weakened. The most recent downgrades occurred in April 2017,
after the government reshuffle in late March. Market response was muted and temporary, benefiting
from abundant global liquidity conditions. Foreign currency (FX) debt is now below investment
grade for two rating agencies; local currency (LC) debt is below investment grade for one agency
and, therefore, South Africa’s LC debt has been excluded from the JPMorgan GBI-EM GD IG index.
Credit ratings have also weakened for corporates, including banks and SOEs. An additional
downgrade of LC debt to below investment grade rating would lead to exclusion from further
indices, forcing divestment by several institutional investors, adversely affecting external funding
and capital flows to South Africa.5 The rating actions reflected weak growth resulting in a worsening
fiscal outlook, sizable contingent liabilities in state-owned enterprises (SOEs), and perceptions of
uncertainty regarding the direction of economic policies.
South Africa’s Long-term Sovereign Ratings, May 31, 2017
Sources: S&P, Moody’s and Fitch.
4 The IMF staff’s index of financial conditions is the first principal component of the Z-scores of seven financial
market variables: SARB policy rate, 10-year government bond yield, sovereign CDS spread, property price index, JSE
top-40 stock index, 1-year implied volatility of rand/US$, spread of 1-year interbank rate over repo.
5 Staff had estimated that downgrades of foreign and local currency sovereign debt to sub-investment grade could
trigger forced sales by non-resident investors of US$2 billion and US$6 billion, respectively (IMF country report
16/218, “Macrofinancial linkages: Capital flows, Sovereign Ratings, and the Financial Sector Nexus.”). More recent
analyst reports suggest that forced sales could be even larger.
-4
-2
0
2
4
6
8
Jan-0
5
Au
g-0
5
Mar-
06
Oct
-06
May-
07
Dec-
07
Jul-
08
Feb
-09
Sep
-09
Ap
r-10
No
v-1
0
Jun
-11
Jan-1
2
Au
g-1
2
Mar-
13
Oct
-13
May-
14
Dec-
14
Jul-
15
Feb
-16
Sep
-16
Ap
r-17
Tigher financial conditions
Financial Conditions Index
Sources: Bloomberg, L.P. and IMF staff calculations.
Moody's S&P Fitch Moody's S&P Fitch
Rating Baa2 BB+ BB+ Baa2 BBB- BB+
Outlook Negative Negative Stable Negative Negative Stable
Date of last outlook change Dec-15 Dec-15 Apr-17 Dec-15 Dec-15 Apr-17
Date of last rating change Nov-14 Apr-17 Apr-17 Nov-14 Apr-17 Apr-17
Sources: S&P, Moody's and Fitch.
Foreign Currency Debt Local Currency Debt
South Africa's Long-term Sovereign Ratings, April 2017
SOUTH AFRICA
8 INTERNATIONAL MONETARY FUND
11. Non-financial corporates are more profitable and less indebted, on average, than in
other emerging markets. Profitability is generally healthy and has improved in the mining sector
with the recovery of metal prices in 2016. While non-financial corporate (NFC) debt has increased
during the past decade, it does not stand out relative to other emerging markets, and corporates
tend to be hedged against currency risk (Figure 7).
12. The financial sector has been resilient to slowing economic activity, but many less
affluent individuals and SMEs have limited access to credit (Figures 8 and 9, Table 5). The
banking sector has traditionally been well capitalized and highly profitable, partly owing to high
concentration and pricing power, including sizable fees for financial services. Major performance
indicators broadly improved in 2017, largely because of higher interest income. Capital ratios (both
risk weighted and unweighted) increased, with the Tier 1 capital ratio at 14.6 percent in April 2017,
well above regulatory requirements. The non-performing loan ratio (NPL) declined to 2.4 percent in
April 2017 from 3.1 percent in 2015 and 2.9 percent in 2016. Banks’ profitability improved as the rise
in interest rates was transmitted more rapidly to their lending rates (often linked to the SARB’s repo
rate) than to their deposit rates. Return on assets (1.7 percent) and return on equity (22 percent) are
one of the highest since the global financial crisis and compare favorably with international peers.
Wholesale funding has been an important but generally stable source of funding for banks
(customer deposits accounted for 49 percent of total non-interbank loans in April 2017). The
Johannesburg Stock Exchange bank index rose by 27 percent in 2016. The banking sector’s
resilience to the sluggish macro-economy stems from the sector’s conservative management, which
focuses lending on less risky/higher net worth firms and individuals. However, compared to other
emerging markets, less affluent individuals and smaller or riskier firms have more limited access to
formal credit channels, with adverse implications for entrepreneurship and economic growth. For
example, only 9 percent of SMEs have credit facilities with banks and only 4 percent of the poorest
40 percent of households have borrowed from a bank in the past year (Annex II. Financial Inclusion).
OUTLOOK: MODEST RECOVERY IN CHALLENGING
EXTERNAL AND DOMESTIC CONTEXTS
13. A modest improvement in real growth is expected in 2017 and the following few
years. Growth is projected to rise to 1.0 percent in 2017 with better rainfall, an increase in mining
output prompted by a moderate rebound in commodity prices, and prospects for a continued low
number of days lost to strikes.6 Private consumption growth is projected to be broadly unchanged,
at about 1 percent, with relatively weak credit growth to households. Private investment is expected
to decline—consistent with high uncertainty and low business confidence—but at a slower pace
than last year. Net exports are expected to remain supportive of growth, as the rebound in
commodity prices fosters export growth sufficiently to offset the rise in imports from the slight
pickup in domestic demand. Economic growth is projected to recover gradually in subsequent years,
6 Key contracts in the mining sector for 2017 have already been signed. Workdays lost to strikes were relatively low in
both 2015 and 2016, a major improvement over 2013 and, especially, 2014, the most recent peak.

SOUTH AFRICA
INTERNATIONAL MONETARY FUND 9
as consumption and investment recover and the output gap closes, to 2.2 percent, slightly above
population growth.
Sources: Stats South Africa and IMF staff calculations. Sources: Stats South Africa and IMF staff calculations.
14. Headline inflation (y-o-y) is projected marginally below 6 percent for the remainder of
2017 and in 2018. Inflation expectations are well anchored at about 6 percent for the next two
years (Figure 4). Slowing wage growth, a widening output gap, and the easing of the drought are
expected to prevail over the rebound in oil prices and the increases in excises. Imported inflation is
projected to be limited (Annex III. Exchange Rate Pass-Through to Core Inflation).
15. The current account deficit is expected to narrow further in 2017 before gradually
widening over the medium term. The current account deficit is projected to decline to 3 percent
of GDP this year as the surplus on the goods balance is boosted by mining and agricultural exports.
Meanwhile, the deficit on the transfer balance is expected to widen moderately to its
2010–16 average. Over the medium term, the current account is projected to return to just below
4 percent of GDP as the surplus on the trade balance dissipates. External debt is seen rising to
almost 50 percent of GDP over the medium term (Figure 11 and Annex IV. External Debt
Sustainability Analysis).
16. South Africa’s vulnerabilities have risen and are set to increase further unless
economic growth revives. Low growth has
taken a toll on the state of the public finances,
with government debt projected at
52.6 percent of GDP by the end of fiscal year
2017 and the public sector’s balance sheet
exposed to significant contingent liabilities
from SOEs (10 percent of GDP). Weak growth
and rising interest rates would pose risks also
for some corporates: interest coverage ratios
(cash flow profits divided by interest payments)
were relatively low in personal services, energy,
and business services (Figure 10). In the
0
50
100
150
200
250
300
350
Emerging Markets: International Reserves, 2016 1/(Percent of the IMF's Assessing Reserve Adequacy metric)
South Africa
Sources: Haver Analytics, National authorities, and IMF staff calculations.
1/ Sample of 48 emerging markets.
Suggested
adequacy range
-1.0
-0.5
0.0
0.5
1.0
1.5
2.0
201
4
201
5
201
6
201
7
201
8
201
9
Contributions to Growth - Supply
(percent)
Other Finance, real estate and business services
Wholesale and retail trade; hotels and restaurants Mining and quarrying
Agriculture, forestry and fishing Real GDP
Projections
Sources: StatsSA and IMF staff calculations.
-3
-2
-1
0
1
2
3
2014
2015
2016
2017
2018
2019
Net Exports Private Investment Including Inventories
Private Consumption Public Consumption and Investment
GDP Growth
Contributions to Growth - Demand(percent)
Projections
Sources: StatsSA and IMF staff calculations.

SOUTH AFRICA
10 INTERNATIONAL MONETARY FUND
external sector, gross external debt equivalent to 48½ percent of GDP at end-2016, as well as
significant gross external financing needs (projected at above 17 percent of GDP in 2017) expose
South Africa to significant financing risks. Gross external liabilities are large at 128 percent of GDP at
end-2016, though the net international investment position is marginally positive (3½ percent of
GDP on the back of valuation effects). Vulnerabilities from exchange rate fluctuations are attenuated
by South Africa’s track record of a freely floating exchange rate, corporate resilience to sizable
exchange rate depreciation during the past few years, and high share of domestic-currency-
denominated government debt. Gross international reserves as of end-2016 covered 104 percent of
short-term debt (residual maturity). However, at 77 percent of the IMF’s Assessing Reserve
Adequacy metric (without considering capital flow management measures; 84 percent after
considering them), they were below the recommended range of 100 to 150 percent.
17. Risks to the outlook are tilted to the downside given challenging external and
domestic contexts (Annex V. Risk Assessment Matrix).
External Risks. South Africa’s highly liquid financial markets are vulnerable to tightening global
financial conditions as investors may reassess policy fundamentals, in the event of international
policy uncertainty and/or a faster-than-expected normalization of U.S. interest rates. Risks from
unstable wholesale funding from European banks and exposure to sub-Saharan African
borrowers would increase in such scenarios, especially if accompanied by additional local
currency sovereign credit rating downgrades to below-investment level. A fall in the prices of
South Africa’s main commodity exports would reduce investment and worsen the current
account. A slowdown in partner growth (e.g., China, destination for about 10 percent of South
Africa’s exports, or other large emerging markets) or structurally weak growth in key advanced
and emerging economies would have both direct and indirect spillovers to South Africa through
financial markets and trade channels.7
7 For a detailed discussion of these channels, see IMF Country Report 16/217, 2016 Article IV consultation.
-20
-10
0
10
20
30
40
50
Ru
ssia
Th
ailan
d
Ind
ia
Ph
ilip
pin
es
Ch
ina
Ind
on
esi
a
Bra
zil
Peru
Hu
ng
ary
Mexi
co
Co
lom
bia
Ch
ile
So
uth
Afr
ica
Tu
rkey
Po
lan
d
Ukra
ine
Mala
ysia
Current account deficit
Debt service
Total gross external financing needs
Gross External Financing Needs, 2016(Percent of GDP)
Sources: World Economic Outlook Database and IMF staff calculations.
-100
-50
0
50
100
150
200
Hu
ng
ary
Chile
Mala
ysia
So
uth
Afr
ica
Po
land
Co
lom
bia
Mexi
co
Thailan
d
Peru
Bra
zil
Ru
ssia
Turk
ey
Ind
on
esi
a
Ind
ia 1
/
Chin
a
Arg
enti
na 1
/
Gross external liabilities
Net international investment position
Gross External Liabilities and NIIP, 2016 (Percent of GDP)
Sources: Haver Analytics, National Authorities, and IMF staff calculations.
1/ 2015.

SOUTH AFRICA
INTERNATIONAL MONETARY FUND 11
Domestic Risks. These include protracted domestic policy uncertainty and continued
deterioration in perceptions of the quality of governance; renewed spending pressures (such as
resurfacing demands for free university tuition, a new costly public wage settlement in 2018, or
the materialization of contingent liabilities from SOEs); reversal of the recent improvement in
labor relations; or a deterioration in banks’ balance sheets stemming from protracted low
growth.
18. Feedback loops between the real, financial, and fiscal sectors could amplify the impact
of these shocks. A continued low growth outlook with rising unemployment would worsen the
financial situation of households and firms, resulting in higher NPLs in banks’ loan portfolios as well
as portfolio rebalancing by foreign investors and domestic non-bank institutions, which would
reduce liquidity and increase funding costs for banks. Under these circumstances, banks would likely
curtail credit, further exacerbating the growth downturn. Staff estimates suggest that, for instance,
following a one percentage point decline in GDP growth, the NPL ratio would increase by
0.5 percentage point. This would in turn dampen credit growth by 2 percentage points (Annex VI.
Macro-financial Linkages in South Africa). Lower growth and weaker bank profitability would also
have sizeable implications for tax revenues. To maintain debt sustainability, further fiscal adjustment
would be required, thus imparting an additional negative impulse to growth.
Authorities’ Views
19. The authorities broadly concurred with staff regarding the main factors shaping the
outlook and the assessment of external risks. In support of near-term growth, they highlighted
the improvements in agricultural output and the pickup in mining production. However, while the
medium-term outlook will only be reviewed in October 2017, they expected that a more gradual
increase in domestic demand in the medium term would be reflected in weaker import growth than
in staff’s forecast and a higher contribution of net exports to growth. With respect to external risks,
the authorities emphasized risks from higher global uncertainty, including a possible decline in
commodity prices, potentially related to a growth slowdown in China, as well as a tightening of U.S.
monetary policy. On domestic risks, the authorities emphasized their commitment to policy
continuity and the resolution of issues in the mining sector. They argued that markets have
sometimes reacted excessively to near-term political developments, rather than focusing on
economic fundamentals and the actual conduct of policies. The authorities concurred that
prolonged low growth would result in greater vulnerabilities, though they emphasized that they saw
the risk of a sudden stop as relatively low. They agreed with the relevance of feedback loops but
highlighted the resilience of the well-capitalized banking system and the high domestic currency
share in total liabilities.
SOUTH AFRICA
12 INTERNATIONAL MONETARY FUND
POLICIES TO LIFT GROWTH, PERMIT MORE GRADUAL
FISCAL ADJUSTMENT, AND INCREASE RESILIENCE
With fiscal and monetary policy space constrained by rising government debt and the need to
maintain inflation within the target band, the priority to stimulate economic growth and job creation
rests with structural reforms, especially in labor and product/service markets. To the extent the
authorities succeed in doing so, there will be an opportunity to reduce the pace of fiscal adjustment. An
early start in undertaking such reforms would also reduce the likelihood of extreme downside risks
materializing.
A. Fiscal Policy8
20. The 2017 budget strikes an appropriate balance between maintaining debt
sustainability and safeguarding a fragile recovery. The authorities’ proposed deficit reduction
path aims to stabilize the gross government debt to GDP ratio at 53 percent of GDP in 2018/19, thus
allowing the phasing of necessary fiscal measures over the next few fiscal years. Under staff’s more
conservative assumptions regarding nominal GDP growth, the debt ratio would increase during the
budget projection period reaching 56 percent in 2019/20. The cumulative measures proposed for
2017/18–2019/20 amount to 1.9 percent of GDP, evenly split between expenditures and revenues
(with specific measures for 2018/19–2019/20 to be determined). This moderate degree of fiscal
adjustment during the next few years is broadly appropriate. Indeed, staff’s assessment is that fiscal
space is limited, consistent with the rising debt, sizable contingent liabilities, the relatively high cost
of government borrowing, and significant uncertainties regarding the future path of economic
growth and interest rates (see below). Abiding by the approved budget ceilings is necessary to
preserve investor confidence.
21. Fiscal risks from lower economic growth and SOEs are sizable, and the room for policy
response to further adverse shocks is limited. The debt sustainability analysis highlights that the
debt would increase significantly faster in the event of weaker economic growth (Annex VII. Public
Debt Sustainability Analysis). If growth turned out 1 percentage point lower than in the baseline, on
average, during 2018–22, the debt ratio would reach a level 14 percentage points of GDP higher
than in the baseline by the end of the projection period. Accommodating a shock of such
magnitude would likely lead to significantly higher financing costs, perhaps accompanied by a local
currency debt downgrade to below-investment grade. A sizable rise in the debt ratio could also
stem from the realization of contingent liabilities (estimated at 18 percent of GDP at end-March
2017, more than half of which are related to SOEs), or recapitalizations of SOEs that might be
needed to address cumulated losses (which averaged 0.4 percent of GDP in the last eight fiscal
8 Revenues reported under “transactions in assets and liabilities” in the budget are here considered as domestic
financing (excluded from revenues), because they consist of proceeds from the sales of assets, realized exchange rate
valuation gains from holding of foreign currency deposits, and other conceptually similar items.

SOUTH AFRICA
INTERNATIONAL MONETARY FUND 13
years). The publication of a fiscal risks statement as part of the MTBPS documentation beginning in
October 2016 is a welcome step toward enhanced monitoring and disclosure of such risks.
22. The outlook for the public finances underscores the urgent need for reforms to
increase the potential rate of economic growth. Although the modest measures embedded in the
2017/18 budget will likely persuade investors to finance this year’s deficit at reasonable cost, the
rising debt ratio could soon cause market participants—in the absence of pro-growth reforms—to
require higher interest rates.
23. During the past few years, the share of both revenues and expenditures continued its
rising trend. The size of general government in South Africa is one of the highest among
international peers at a similar level of development (text chart). Primary expenditures rose by
1.5 percentage points of GDP
between 2012/13 and 2015/16,
owing primarily to public enterprise-
related transfers (0.8 percent of GDP,
including a 0.6 percent of GDP
equity injection for Eskom in
2015/2016) as well as relatively
generous wage agreements
combined with an increase in
consolidated government
employment (0.3 percent of GDP)
(Figure 12).9 In recent years,
including the 2017 budget, higher
personal income taxation has been
the main tax policy instrument to
collect revenue combined with
higher excise rates.
24. In selecting fiscal adjustment measures, priority needs to be given to supporting
economic growth and job creation, as well as reducing inequality. The progressivity of the
personal income tax helps to reduce inequality, although obtaining additional revenues from this
instrument may become increasingly difficult, particularly in an economy that is generally open to
international financial investment. Further revenue measures could be informed by the Davis Tax
Committee proposals and could include moderate increases in the standard VAT rate (while using
social grants to compensate the poor),10 higher taxation of property, and measures to reduce base
erosion and profit shifting. Expenditure reduction measures could include lower transfers to public
9 More than half of the average overall employment growth recorded in the Labor Force Survey since 2010 occurred
in the general government services category.
10 Social grants are preferable to VAT exemptions for specific products consumed by the poor as these benefit
better-off households more than proportionately, owing to their higher consumption levels.
0
5
10
15
20
25
30
35
40
45
50
0 10,000 20,000 30,000 40,000 50,000 60,000 70,000
GDP per Capita, US$ at PPP
Tax
Reve
nu
e,p
erc
en
t o
f G
DP
Tax Revenue and GDP per Capita
Sources: WEO and IMF staff calculations.
Note: Sample of 161 countries. Outliers Qatar, Luxembourg, Kuwait, Brunei and Singapore have
been removed from the sample. The data refer to 2016.

SOUTH AFRICA
14 INTERNATIONAL MONETARY FUND
enterprises—these averaged 0.8 percent of GDP annually in the last 8 years—supported by reforms
to improve their finances (see below), as well as lower increases in public sector wages,11 while
protecting well-targeted social programs and productive investment. Within infrastructure projects,
a priority is to improve opportunities for labor force participants to commute to work and, to the
extent that subsidized housing is planned, choosing its location near new business developments
where jobs are being created. Further strengthening of spending efficiency through the imposition
of penalties for failures to adhere to procurement guidelines and other irregular expenditures is also
warranted, given the Auditor General’s finding of a notable acceleration of irregular expenditures in
government departments.
25. SOE reforms are needed to reduce their cost to the budget, manage fiscal risks from
contingent liabilities, and increase efficiency in the economy. Public enterprises play a major
role, often with limited competition, in providing key products/services, such as power,
telecommunications, and transportation (e.g., ports, airways). Their performance thus affects not
only the public finances and the borrowing costs of the whole economy, but also economic growth
and job creation through the cost of important inputs for a wide range of businesses and
households. Potential directions for reform include: (i) comprehensive stocktaking and review of the
SOEs and their subsidiaries, with information on their commercial viability and the relevance of their
objectives from a public policy perspective; (ii) stricter vetting process for establishing new SOEs
and, especially, their subsidiaries, in view of their large existing stock; (iii) inclusion of costs incurred
by the SOEs for public service delivery in the government budget; and (iv) stricter enforcement, with
sanctions, for breaches of the Public Financial Management Act (Annex VIII. SOE Reforms–
International Experience).
Authorities’ Views
26. The authorities reiterated their commitment to meeting the fiscal targets embedded in
the 2017/18 budget through strengthening budget execution and revenue mobilization, while
monitoring and mitigating fiscal risks as required. Over the medium term, fiscal policy focuses
on containing the budget deficit and slowing the pace of debt accumulation to maintain spending
programs and promote confidence in the economy. A key feature is a reduction of the expenditure
ceiling through reducing operating budgets, lowering transfers to public entities and stringent wage
bill controls achieved in part through the withdrawal of all funding for non-critical vacant posts. The
authorities are also implementing measures to make public spending and budget execution more
efficient, including through a new financing facility for large multi-year infrastructure projects. Since
April 1, 2016 all public procurement has been managed through a web-based e-portal system which
publicly provides information on all public-sector procurement and contracting. This reform,
alongside broader procurement reforms, will promote increased transparency, reduce the scope for
11 Specific measures to keep the public sector wage bill in check include: aligning the wage negotiation cycle with the
budget cycle, to ensure that wage bill decisions compete on an equal footing with other primary spending items;
reforming the wage negotiation framework to cover all aspects of compensation, while limiting sources of automatic
wage increases not based on performance, such as automatic pay scale progression or promotions; and
implementing pay reform by benchmarking public sector salaries to those of the private sector.

SOUTH AFRICA
INTERNATIONAL MONETARY FUND 15
fraud, and contribute toward making public procurement a more effective tool for economic
transformation. The authorities are also implementing additional revenue measures concentrated at
the upper end of the income spectrum and fuel levies, while continuing to work with the Davies Tax
Committee on options for future revenue adjustments.
27. The authorities highlighted their determination to improve the operating efficiency,
governance, and financial performance of state owned enterprises, alongside strengthened
oversight for all national public entities. The average return on equity for state owned enterprises
has been weakening since 2012 and is now well below borrowing costs. To address these issues, in
November 2016, cabinet adopted a new governance framework for these entities, including
guidelines for remuneration and incentives for directors, standards for the appointment of boards
and executive officers, and a framework to guide collaboration between stated owned companies
and the private sector on infrastructure projects. Implementation is expected during this fiscal year.
B. Monetary and Financial Sector Policies
28. Monetary policy can remain on hold unless inflation expectations rise or external
financing becomes challenging. Keeping the repo rate unchanged at current levels is appropriate,
given that inflation is projected marginally below the upper threshold of the 3–6 percent band for
the remainder of 2017 and in 2018, and that inflation expectations currently remain well anchored at
about 6 percent. This also avoids injecting an additional contractionary impulse in a weak economy
experiencing moderate fiscal adjustment. Even so, further tightening would be warranted if inflation
expectations were to rise, owing for example to larger-than-expected second-round effects of fuel
and food price inflation, an unexpected fiscal loosening, or rapid exchange rate depreciation from
increased political and policy uncertainty. Opportunities to increase international reserves to the
recommended range, such as large FDI inflow transactions, should be seized, consistent with
meeting the inflation objective.
29. Bringing to fruition ongoing reforms of prudential regulation and the resolution
framework is expected further to buttress financial sector resilience. The authorities have made
progress in implementing the 2014 IMF FSAP recommendations (Annex IX), particularly on
modernizing the macro-prudential framework, including the introduction of “Twin Peaks” and
resolution regimes.12 These reforms will likely increase financial stability by removing regulatory
gaps and reducing implicit contingent liabilities from the banking sector. The Financial Sector
Regulation bill to execute the Twin Peaks reform is likely to be approved and implemented in 2017,
and the Designated Institutions Resolution bill to introduce the new resolution regime is expected
to be submitted to parliament in late 2017. In this context, National Treasury and the SARB
published for public comment a policy document on an explicit, privately-funded deposit insurance
12 A “Twin Peaks” model refers to setting up a prudential authority to regulate the safety of financial institutions
through group-wide supervision and a market conduct authority whose role includes protecting customers with
respect to financial products and services. The draft Designated Institutions Resolution Bill contains a framework for
the resolution of banks and systemically important financial institutions (which includes restructuring and bail-in
powers), and establishes a deposit insurance scheme.
SOUTH AFRICA
16 INTERNATIONAL MONETARY FUND
scheme. The SARB is also working toward an enhanced macro-prudential framework, including the
addition of new tools such as countercyclical capital buffers, sectoral capital requirements, dynamic
provisioning, as well as leverage and liquidity ratios. Moreover, the tightening of credit standards
that began in 2015 has helped to correct past frothiness in the market for credit to households; slow
consumption growth reflects not only these measures, but also an appropriate, continued reduction
in the indebtedness of many overstretched households. A third draft on the OTC derivative
regulatory framework will be reviewed by National Treasury and the SARB in 2017. However, limited
progress has been made on the reform of collective investment schemes, promotion of fair
competition and financial inclusion, and better consumer protection.
30. Access to financial services for low-income households and SMEs needs to be
enhanced. Greater access of firms and households to banking services or the lifting of their financial
constraints may be expected to foster economic growth and to reduce income inequality. At the
same time, access to credit should be expanded with proper supervision to prevent an increase in
financial stability risks, as illustrated by the recent bankruptcy of African Bank arising from its
unsecured lending to low income customers. The authorities are taking steps to increase financial
inclusion. For the first time in 11 years, the SARB granted three provisional banking licenses in 2016
(to Post Bank, Discovery Bank, and TYME (Take Your Money Elsewhere), a local mobile payments
start-up acquired by Commonwealth Bank of Australia). The market conduct authority under twin
peaks is also expected to introduce more transparency to financial products sold to consumers and
SMEs. Even so, more could be done to expand financial inclusion while keeping financial risks in
check. International experience suggests several options, such as encouraging community-based
credit unions, institutions relying on emerging technologies (“FinTech”), and microcredit insurance;
promoting financial literacy; better protection of low-income borrowers from predatory lending and
abusive loan-recovery; streamlined disclosure standards for small-scale lending; expansion of
eligible collateral and improved and centralized credit registry systems. Hurdles faced by potential
entrants, such as non-transparent rules for access to clearing and payment systems operated by
incumbents, should also be reduced.
31. Full and swift implementation of the Financial Intelligence Center Amendment (FICA)
Act is needed to bring South Africa closer to international standards against money
laundering, financing of terrorism, and other illegal financial transactions. The FICA Bill was
signed by President Zuma in April 2017 and the next step is to issue and enact regulations to fully
implement the FICA Act. Lack of comprehensive implementation might lead to a statement by the
Financial Action Task Force about the risk of doing business with South Africa and could increase
international transaction costs for South African businesses.
Authorities’ views
32. The authorities broadly shared the mission’s views on monetary policy and regulatory
reforms. They considered that the monetary policy tightening cycle may have reached its end, but
that the inflation outlook would need to improve in a durable manner before rates could be
reduced. This assessment may change if the inflation outlook and the risks to the outlook
deteriorate. The authorities highlighted their continued progress on reforms of prudential

SOUTH AFRICA
INTERNATIONAL MONETARY FUND 17
regulations. The implementing regulations for the FICA (Financial Intelligence Centre Act) law are
being prepared for full implementation by late 2017.
33. On the banking system, the authorities highlighted its resilience and their plans to
enhance competition in the sector. Capital adequacy ratios and profitability remain high across
the banking system, with low NPLs and limited foreign currency exposure. Despite headwinds from
low economic growth, banks are well positioned to cope with lower profits and higher impairment.
The high degree of concentration in the banking sector provides stability but also has downsides,
such as a tendency for “too-big-to-fail” situations and greater risk of contagion. This tradeoff can be
managed through a combination of effective prudential regulations and the oversight of
competition authorities. In addition, the authorities were analyzing possible ways of moving toward
a tiered banking system allowing for mid-sized banks with proportionally less stringent regulatory
requirements. Further analysis of the sources of high fees in the retail banking industry and action to
reduce them would also be beneficial. In the past few years, regulations have been issued to limit
interest rates and fees on loans as well as the cost of credit life insurance for various credit facilities.
34. The authorities believe that more needs to be done to improve financial inclusion,
supported by strong market conduct and consumer protection regulation. The authorities
agreed that greater financial inclusion could favorably impact economic growth and reduce
inequality, but views differed regarding the extent of impact. The authorities highlighted that
increased access to credit had unintended consequences, including over-indebtedness. A more
sustainable approach to financial inclusion would be to encourage savings to support asset and
wealth creation. The authorities are exploring ways to improve availability of credit information,
establish viable risk-sharing schemes, extend the asset classes that can practically be used as
collateral, and promote FinTech. Subject to the passage of the Financial Sector Regulation Bill, the
Financial Sector Conduct Authority and Ombud Council will be established in 2017 to ensure a fairer
and more effective financial sector. A FinTech regulatory framework (part of the Conduct of Financial
Institutions Bill) could include a “regulatory sandbox” to encourage innovation within a controlled
environment while managing any potential risks.
35. On contingency planning, the authorities highlighted the use of existing frameworks
and their plans for further enhancement. The Financial Sector Contingency Forum (FSCF) had
recently conducted a simulation exercise to assess operational risk. The SARB established a Financial
Crisis Planning Working Group (FCPWG) in early-2017, including external stakeholders such as the
National Treasury and the Financial Services Board, with a view to enhancing the existing crisis
management framework and aligning it with the new regulatory framework.
C. Reforms of Labor and Product/Service Markets
36. The authorities have made progress in increasing electricity capacity and improving
labor relations, but reforms in other areas have lagged.

SOUTH AFRICA
18 INTERNATIONAL MONETARY FUND
Labor market. Recent efforts to reform the labor market have focused on the introduction of a
national minimum wage (NMW), combined with measures to improve labor relations. A recent
agreement among social partners (government, trade unions, and entrepreneurs’ associations)
under the aegis of the National Economic Development and Labor Council envisages the new NMW
at R20 per hour (R18 for agriculture and R15 for domestic workers), as well as the establishment of a
draft Code of Good Practice for Collective Bargaining, Industrial Action, and Picketing, which
contains steps in the right direction, such as strengthening the expectation of a secret ballot ahead
of a strike and initiatives to reduce the likelihood of violence or intimidation by any parties involved.
If the agreement on the NMW is swiftly transferred into draft legislation and approved,
implementation could begin as early as May 1, 2018. The proposed NMW level—on the high side in
international comparisons (Annex X. Introduction of a National Minimum Wage)—seeks to ensure a
reasonable living standard for millions of workers who are currently near or below the poverty line.
To reduce the risk of adverse employment effects, the initial NMW phase-in period should be closely
monitored, while standing ready to introduce complementary measures to support vulnerable
sectors (e.g., SMEs or youth).
Product/service markets. Efforts to facilitate entry by new firms in key markets such as energy,
transportation, and telecommunications need to be strengthened.13 With new coal-fired plants
brought online by national utility Eskom, as well as rising participation of independent power
producers (IPPs), especially renewables, and with no significant load-shedding since August 2015,
availability of power is no longer a constraint on economic activity. However, further expansion of
IPP activity has been delayed by Eskom’s reluctance to sign new power purchase agreements.
Similarly, there is a need to reduce port tariffs, which remain above international norms for some
sectors; and in telecommunications, allocation of broadband spectrum has suffered from delays.
More generally, there is a need to allow private firms to compete on a more equal footing with large
SOEs. Higher competition will also lead to reduced markups and a lower response of inflation to
cost pressures. For several product/service markets where a few private firms or groups of firms are
dominant, the Competition Commission’s proactive inquiries have helped to curtail anti-competitive
behavior.
Land/Mining. New legislation proposals or issues related to the interpretation of existing legislation
may have increased perceived uncertainty with respect to land and mining, with associated adverse
effects on investment. Examples include the Land Expropriation bill, which aims to allow the state to
redress racial imbalances in land ownership through a process whereby a Land Commission would
audit the present ownership of agricultural land, and assist in determining just and legitimate
compensation in land transfers; the proposed new Mining Charter, which calls for companies to
keep black ownership at a minimum of 26 percent—including in the event that black shareholders
sell their stakes; and, separately, a new Mineral and Petroleum Resources Development bill, which
13 Cross-country evidence shows that reforms of product/service markets (including network industries) are followed
by significant increases in output and employment (IMF working papers 16/114 and 16/116).

SOUTH AFRICA
INTERNATIONAL MONETARY FUND 19
proposes to give the state a 20 percent free stake in new energy projects and the ability to buy
further shares.
37. Undertaking a set of initial, focused reforms in labor and product/service markets
would strengthen confidence, foster investment, and promote inclusive growth. Priorities
include the following.
Barriers to entry, including those resulting from multiple and occasionally conflicting regulations,
should be reduced. Priorities to foster competition, with benefits for a broad range of businesses
and consumers, include: swiftly allocating broadband spectrum through auctions or other
transparent processes that will promote competition in the market; allowing private sector
producers to compete with the state-owned utility on an equal footing in power generation as
demand grows; and reducing port tariffs to levels that are more reflective of costs and
international norms, especially for those sectors which they currently place at a disadvantage.
These reforms would also help further to diversify production and exports, and to increase their
value-added content. Maintaining and enhancing trade integration, including regional
integration, also helps to instill competition, reduce input costs and facilitate reaping economies
of scale.
Further labor market reforms to ensure that wage levels are determined by market conditions
that are relevant to firm-specific conditions—for example, by exempting SMEs from collective
bargaining outcomes. It would also be desirable to introduce a single employment contract with
gradual, continuous increases of rights and benefits that would accrue with tenure—to make it
easier for young people to obtain their first job. Subsidies for transportation to young
unemployed taking up new jobs would be worth considering. Greater use of profit-sharing and
allocation of shares to workers could also be considered as an additional avenue to reduce
inequality while improving labor relations.
Reforming the public schools to improve educational outcomes, where South Africa scores
worse than international peers.14 Possible measures include: (i) enhancing opportunities for
upgrading the skills of teachers and to make them more accountable; (ii) improving equity and
efficiency in the allocation of resources among school districts, especially between rural and
urban areas; and (iii) enhancing the cooperation between educational institutions and employers
with respect to internships and other avenues for school-to-work transition, especially for
disadvantaged youth (Annex XI. Educational Outcomes: Causes and Consequences).
Authorities’ Views
38. The authorities remain committed to the objectives outlined in the 2017/18 budget to
transform the structure of the economy to be more inclusive and for growth to be more
sustainable. They see an urgent need to accelerate the pace of economic transformation while
pursuing the same measures that would support investor confidence. In such pursuit, South Africa
14 Murtin F., 2013, “Improving Education Quality in South Africa”, OECD Economics Department Working Papers, No.
1056, OECD Publishing, Paris. http://dx.doi.org/10.1787/5k452klfn9ls-en
SOUTH AFRICA
20 INTERNATIONAL MONETARY FUND
would continue to rely on a mixed economic system, with government policy playing the central role
in transformation by promoting redistribution and promoting a healthy investment climate by
directing scarce resources towards catalytic investments in human and physical capital alongside a
vibrant private sector to modernize and diversify the economy.
39. The authorities plan to reform product and service markets and to reduce legislative
uncertainty in land and mining to increase confidence, job creation, and potential growth.
Working with business, labor, and civil society, the authorities intend during this fiscal year to finalize
ongoing mining and land legislation to reduce policy uncertainty in these areas, allocate spectrum
to broadband services to expand business opportunities and reduce costs, and expand the
independent producer program in renewables and gas to boost power supply and enhance
competition in the energy sector.
40. In the labor market, the authorities emphasized the improved relations among social
partners. The agreement on a national minimum wage and a draft Code of Good Practice for
Collective Bargaining were positive developments, and had been attained following an extensive
consultation process among a wide range of stakeholders. Improved relations had also been
reflected in fewer days lost to strikes.
STAFF APPRAISAL
41. Against the background of declining confidence and rising impatience with
longstanding inequalities, the authorities face the dual challenge of reigniting growth and
rendering it more inclusive. Addressing that challenge will require early policy action as well as
clear and consistent communication of the strategy to be pursued. International historical
experience shows that successful reductions in inequality that eschewed societal or economic
upheaval, thus preserving healthy, broad-based economic growth occurred gradually, over several
years. Fiscal discipline and good governance will be key; reforms promoting inclusive growth will
need to start promptly and to be implemented assiduously.
42. A near-term priority is to foster domestic demand by reassuring businesspeople and
consumers regarding the future direction of policies. Policymakers should seize available
opportunities to reassert their commitment to pursuing inclusive growth within available financial
means and in a way that supports investment and job creation by the private sector. In this regard,
the authorities’ recent reaffirmation of their budget objectives approved by parliament is helpful.
Implementation of the budget and an initial set of reforms will be necessary to improve confidence.
43. If reforms are undertaken to reignite activity, revenues will rise and the need for fiscal
adjustment will become commensurately lower in the years ahead, further supporting
growth. Conversely, with insufficient reforms, the country would likely become stuck in a prolonged,
vicious cycle of anemic growth and rising public debt. South Africa would then become more
exposed to shocks, such as worsening sentiment of foreign and domestic investors alike; in an
extreme scenario, capital inflows, imports, and domestic activity could contract abruptly.

SOUTH AFRICA
INTERNATIONAL MONETARY FUND 21
44. The scope for monetary or fiscal policies to provide stimulus to the economy is
limited. With headline inflation projected marginally below 6 percent in the remainder of 2017 and
in 2018, keeping policy rates on hold is appropriate. The central bank should stand ready to increase
rates if inflation expectations were to rise—for example, because of sizable exchange rate
depreciation from heightened uncertainty. To ensure that government debt peaks significantly
below 60 percent of GDP, a modest improvement in the structural primary fiscal balance––as
envisaged by the medium-term path in the 2017 budget documents––will be needed in the next few
years. It will also be necessary to monitor, disclose, and manage fiscal risks from explicit or implicit
government guarantees and other firm or contingent, future obligations. Reforms of public
enterprises—to strengthen governance, increase transparency in public procurement, apply
penalties for failures to adhere to procurement guidelines, and quantify public service obligations—
would reassure investors and the public at large, with associated benefits for borrowing costs and
economic efficiency.
45. With limited room for stimulus through macroeconomic policies, the priority to
stimulate economic growth and job creation rests with structural reforms, notably in product
and service markets and in the labor market. The focus should be on sectors providing crucial
inputs for most firms in the economy, such as power generation, telecommunications,
transportation, and financial services for small- and medium-sized enterprises. Beyond the direct
contribution of output and jobs by new firms, declining costs of inputs would have beneficial,
indirect effects through production and employment increases by a wide range of other businesses.
The Competition Commission should be strongly supported in its proactive market inquiries and
vigorous anti-cartel actions. It is also important to reduce uncertainty regarding new proposed
legislation or the interpretation of existing legislation in areas such as land ownership and mining.
46. Labor market reforms should aim at generating jobs, especially for youth. Wage-
setting processes should become more reflective of firm-specific circumstances, including
productivity. Improving educational attainment for students in all age groups is also crucial to
ensure that the large and growing number of young people will have the right skills to find jobs
when they enter the labor market. Introducing the agreed national minimum wage has the potential
to make a material difference for millions of people; at the same time, its impact on employment will
need to be carefully monitored in the early stages of implementation, standing ready to introduce
complementary measures for vulnerable sectors such as small- and medium-sized enterprises or
youth. A parallel agreement on a Code of Good Practice for Collective Bargaining also contains steps
in the right direction; introduction of such Code into legislation would increase its effectiveness.
47. In the financial sector, bringing to fruition ongoing reforms to modernize prudential
regulation and to enhance the resolution framework is expected further to buttress resilience.
This includes implementation of the Financial Sector Regulation Act beginning later this year, soon
to be followed by a financial sector resolution bill, including a deposit insurance scheme. In addition,
full and swift implementation of the FICA Act is needed to bring South Africa closer to international
standards against money laundering, financing of terrorism, and other illegal financial transactions.

SOUTH AFRICA
22 INTERNATIONAL MONETARY FUND
48. Meanwhile, there is a need to foster competition in the banking system, especially by
promoting entry of new players to enhance financial inclusion. This would allow small- and
medium-sized enterprises as well as low-income households greater access to finance, thereby
helping to reduce inequality. In that regard, the expected provision of new banking licenses is a step
toward greater competition. At the same time, access to credit should be expanded with proper
supervision to prevent an increase in financial stability risks.
49. Resilience would be enhanced by attracting more durable foreign investment and
increasing international reserves. South Africa’s strengths include a freely floating exchange rate,
low reliance on foreign currency debt, a large domestic investor base, and a broadly balanced
international investment position. In staff’s view, the external position in 2016 was moderately
weaker than implied by fundamentals and desirable policy settings. Improving perceived
governance and investor confidence would help to attract foreign direct investment—a relatively
stable source of financing—and to reduce the gap between the actual current account deficit and
the estimated norm. The SARB should seize opportunities to increase reserves to the desirable level,
consistent with meeting the inflation objective.
50. It is proposed that South Africa remain on the standard 12-month Article IV cycle.

SOUTH AFRICA
INTERNATIONAL MONETARY FUND 23
Figure 1. South Africa Remains One of the World’s Most Unequal Societies
Gini Index
90:10 Ratio
Sources: Luxembourg Income Study and World Bank.
Notes: The Gini index ranges from 0 for perfect equality to 1 for the limiting case in which all income accrues to one
individual. The 90:10 ratio refers to the ratio of the income of an individual at the 90th percentile in a given country’s
distribution to the income of an individual at the 10th percentile. The data are from the most recent household survey
available. Further details from Hellebrandt and Mauro, 2016, World on the Move: Consumption Patterns in a More Equal
Global Economy, Peterson Institute for International Economics.
0
0.1
0.2
0.3
0.4
0.5
0.6
0.7D
enm
ark
No
rway
Sw
ed
en
Cze
ch R
ep
ublic
Belg
ium
Finla
nd
Slo
venia
Slo
vakia
Neth
erland
s
Au
stri
a
Germ
any
Sw
itze
rlan
d
Tai
wan P
OC
Irela
nd
France
Japan
Russ
ia
Kore
a
Au
stra
lia
Unit
ed K
ingd
om
Esto
nia
Canad
a
Hu
ng
ary
Po
land
Gre
ece
Ital
y
Ser
bia
Spain
Unit
ed S
tate
s
Uru
guay
Georg
ia
Isra
el
Egyp
t
Bra
zil
Mexi
co
Ind
ia
Chin
a
Co
lom
bia
Peru
Panam
a
Guate
mala
Sou
th A
fric
a
0
5
10
15
20
25
30
Denm
ark
No
rway
Sw
ed
en
Cze
ch R
ep
ublic
Belg
ium
Finla
nd
Slo
venia
Slo
vakia
Neth
erland
s
Au
stri
a
Germ
any
Sw
itze
rlan
d
Tai
wan P
OC
Irela
nd
France
Japan
Russ
ia
Kore
a
Au
stra
lia
Unit
ed K
ingd
om
Esto
nia
Canad
a
Hu
ng
ary
Po
land
Gre
ece
Ital
y
Ser
bia
Spain
Unit
ed S
tate
s
Uru
guay
Georg
ia
Isra
el
Egyp
t
Bra
zil
Mexi
co
Ind
ia
Chin
a
Co
lom
bia
Peru
Panam
a
Guate
mala
Sou
th A
fric
a

SOUTH AFRICA
24 INTERNATIONAL MONETARY FUND
Figure 2. South Africa: Employment Creation has been Insufficient to Curb Unemployment
Job growth has been weak in all sectors... …more reliant on public sector employment creation until
recent efforts to contain the wage bill were implemented.
…and not sufficient to keep pace with new entrants in the
labor market… …especially in 2016 with almost no employment growth.
The proportion of working age population employed is one
of the lowest among EMs, especially for youth.
Earnings have outpaced productivity despite a recent
slowdown.
Sources: Haver Analytics, ILO, SARB, StatsSA, and IMF staff estimates.
-5
-4
-3
-2
-1
0
1
2
3
4
5
2009
2010
2011
2012
2013
2014
2015
2016
Q1-2
017
Formal sector - Public Formal sector - Other Informal sector
Agriculture Private households Employment growth
Employment Growth: Contribution by Sector (percent)
-4
-3
-2
-1
0
1
2
3
4
2009
2010
2011
2012
2013
2014
2015
2016
Public sector
Private sector
Employment growth
Formal Employment Growth: Contributions of Public
and Private Sector 1/(percent)
1/ Using non-agriculture formal sector employment from Quarterly
Labor Force Survey.
Q1-2
017
45
46
47
48
49
50
51
52
53
54
55
0
5
10
15
20
25
30
2009
2010
2011
2012
2013
2014
2015
2016
Q1-2
017
Job losers New entrants
Job leavers and Re-entrants Other
Youth unemployment rate (RHS)
Unemployment Rate(percent)
-1.5
-1.0
-0.5
0.0
0.5
1.0
1.5
2.0
2.5
3.0
3.5
2009
2010
2011
2012
2013
2014
2015
2016
Q1-2
017
Employed Unemployed Not economically active Total
Working-age Population Growth (percent)
80
90
100
110
120
130
140
2007
2008
2009
2010
2011
2012
2013
2014
2015
Q3-2
016
Total real earnings
Productivity
Total Earnings and Productivity(Index, 2007=100)
0
10
20
30
40
50
60
70
80
Thailan
d
Peru
Chin
a
Ind
on
esi
a
Co
lom
bia
Mala
ysia
Ph
ilip
pin
es
Mexi
co
Ru
ssia
Bra
zil
Chile
Arg
enti
na
Ukra
ine
Po
land
Ro
man
ia
Ind
ia
Hu
ng
ary
Turk
ey
So
uth
Afr
ica
Total absorption rate
Youth absorption rate
Absorption Rate, 2016(percent)

SOUTH AFRICA
INTERNATIONAL MONETARY FUND 25
Figure 3. South Africa: Growth Slowed Down Further in 2016
Trading partner growth continued to slow in 2016. Labor relations remained stable and electricity capacity
increased.
Agricultural and mining production declined owing to
drought conditions and low commodity prices.
Domestic demand ground to a halt due to slowing
consumption and declining private investment...
…reflecting weak business confidence and record low
consumer confidence.
Forward looking indicators are consistently pointing to a
modest recovery in 2017.
Sources: Andrew Levy Employment Publications, Haver Analytics, Eskom, SARB, and IMF staff estimates.
-5
0
5
10
15
20
2001
2002
2003
2004
2005
2006
2007
2008
2009
2010
2011
2012
2013
2014
2015
2016
South Africa: Real GDP
Trading partners: Non-oil goods imports
Trading partners: Real GDP
South Africa GDP Growth,Trading Partners' GDP and
Import Growth(y/y percentage change)
-2.0
-1.0
0.0
1.0
2.0
3.0
4.0
5.0
6.0
200
1
200
2
200
3
200
4
200
5
200
6
200
7
200
8
200
9
201
0
201
1
201
2
201
3
201
4
201
5
201
6
Contributions to Growth- Supply
(percent)
Other
Finance, real estate and business services
Wholesale and retail trade; hotels and restaurants
Mining and quarrying
Agriculture, forestry and fishing
Real GDP
0
2
4
6
8
10
12
14
50
55
60
65
70
75
80
85
90
95
100
2012 2013 2014 2015 2016
Eskom installed capacity (thousand MW)
Workdays lost to strikes, million (RHS)
Workdays Lost and Electricity Capacity
86
88
90
92
94
96
98
100
102
42
44
46
48
50
52
54
56
58
2012 2013 2014 2015 2016
BER Manufacturing PMI
Markit Composit PMI
SARB Leading Indicator (RHS)
Purchasing Managers Index and Leading Indicator
Q1-2017
0
10
20
30
40
50
60
70
80
90
100
-20
-15
-10
-5
0
5
10
15
20
25
30
2004
2005
2006
2007
2008
2009
2010
2011
2012
2013
2014
2015
2016
Q1-2
017
BER Consumer Confidence Index (LHS)
BER Business Confidence Index (RHS)
Confidence and Political Constraint
-4
-2
0
2
4
6
8
10
122001
2002
2003
2004
2005
2006
2007
2008
2009
2010
2011
2012
2013
2014
2015
2016
Net Exports
Private Investment Including Inventories
Private Consumption
Public Consumption and Investment
GDP Growth
Contributions to Growth(percent)

SOUTH AFRICA
26 INTERNATIONAL MONETARY FUND
Figure 4. South Africa: Monetary Policy Focused on Bringing Inflation Back
into the Target Band Headline Inflation rose above the 6 percent top band in
2016 driven by higher food and fuel prices. Core inflation
also increased but remained below 6 percent.
Import prices continued their decline despite a temporary
recovery.
A growing output gap kept exchange rate pass through
subdued despite significant depreciation since 2011 Q1.
Retailers have earned sizable profits while unit labor costs
have been contained.
Inflation expectations have been well anchored near the
ceiling of the target band.
After a tightening of 200 bps since December 2013,
markets expect the SARB to keep the policy rate stable.
Sources: Bloomberg L.P. Haver Analytics, Reuters, SARB, WEO, and IMF staff estimates.
0
10
20
30
40
50
0
2
4
6
8
10
12
20
03
20
04
20
05
20
06
20
07
20
08
20
09
20
10
20
11
20
12
20
13
20
14
20
15
Q3-2
016
Unit Labor Cost (y/y percentage change)
Retail Corporate Profitability (percent, RHS)
Unit Labor Cost and Corporate Profitability
1/ Return on equity, weighted by market capitalization. 2015 is estimated.
50
60
70
80
90
100
110
0
1
2
3
4
5
6
7
8
9
10
2007
2008
2009
2010
2011
2012
2013
2014
2015
2016
Q1-
2017
Inflation excl petrol &
energy (y/y percentage
change)
NEER (2010=100, RHS)
NEER, Inflation, and Output Gap 1/
1/ Light grey areas represent a negative and rising output gap.
-2
0
2
4
6
8
10
12
2012
2013
2014
2015
2016
2017
Core inflation
Electricity
Food
Petrol
Headline (y/y percentage change)
CPI Inflation Components(contribution to headline inflation)
SARB target band
(3-6 percent)
Ap
r-2017

SOUTH AFRICA
INTERNATIONAL MONETARY FUND 27
Figure 5. South Africa: The Current Account Deficit Remained Large Despite
an Improving Trade Balance
REER depreciation has recently turned around… …and competitiveness remains a challenge.
Net export volumes improved in 2016… …supporting the overall balance.
The current account deficit remains large… …financed by non-FDI flows.
Sources: Haver Analytics, SARB, WEB, and IMF staff calculations.
0
1
2
3
4
5
6
Overall Index
Institutions
Infrastructure
Macroeconomic
environment
Health and primary
education
Higher education
and training
Goods market
efficiency
Labor market
efficiency
Financial market
development
Technological
readiness
Market size
Business
sophistication
Innovation
Global Competitiveness Scores, 2016/17(1 - 7, 7 being highest quality)
South Africa
EM Median
-6
-4
-2
0
2
4
6
8
10
12
14
2005 2006 2007 2008 2009 2010 2011 2012 2013 2014 2015 2016
Unrecorded transactions
Other investment
Portfolio flows
Net FDI
Current account deficit
Financial Account(Percent of GDP)
60
70
80
90
100
110
120
130
2005 2006 2007 2008 2009 2010 2011 2012 2013 2014 2015 2016
ULC-based REER
CPI-based REER
South Africa: CPI-based and ULC-based REER(Index, 2005=100)
CPI-REER
10-year
average
ULC in USD
10-year
average
25
26
27
28
29
30
31
32
-3.0
-2.5
-2.0
-1.5
-1.0
-0.5
0.0
0.5
1.0
1.5
2010 2011 2012 2013 2014 2015 2016
Net exports (LHS)
Exports (RHS)
Imports (RHS)
Net Exports at 2010 prices(Percent of GDP)
-3.0
-2.5
-2.0
-1.5
-1.0
-0.5
0.0
0.5
1.0
1.5
2.0
2011 2012 2013 2014 2015 2016
Contribution from prices
Contribution from volumes
Overall change in net exports
Net exports (percent of GDP)
Change in Net Exports at Current Prices (Percentage points of GDP)
-8
-6
-4
-2
0
2
4
6
8
10
12
TU
R
ZA
F
PO
L
CO
L
IND
BR
A
PER
CZ
E
MEX
HU
N
CH
L
IDN
AR
G
TH
A
RU
S
CH
N
MYS
Average 2006-15
2016
Current Account Balances(Percent of GDP)
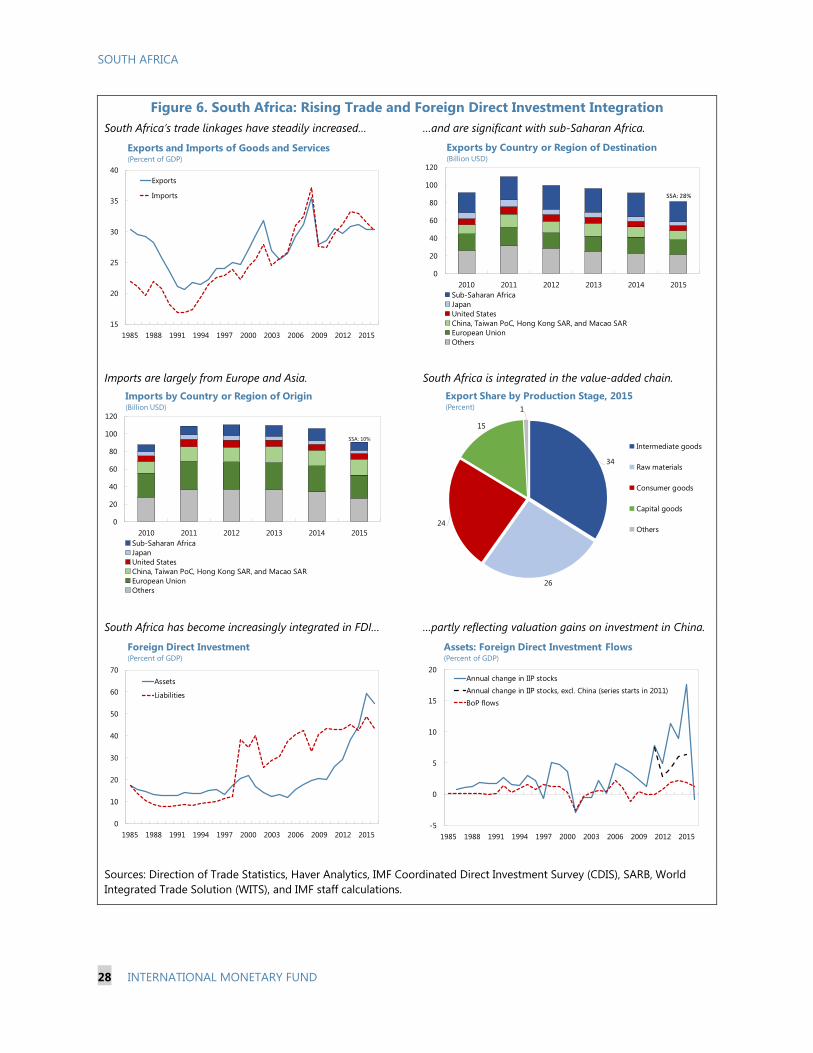
SOUTH AFRICA
28 INTERNATIONAL MONETARY FUND
Figure 6. South Africa: Rising Trade and Foreign Direct Investment Integration
South Africa’s trade linkages have steadily increased… …and are significant with sub-Saharan Africa.
Imports are largely from Europe and Asia. South Africa is integrated in the value-added chain.
South Africa has become increasingly integrated in FDI… …partly reflecting valuation gains on investment in China.
Sources: Direction of Trade Statistics, Haver Analytics, IMF Coordinated Direct Investment Survey (CDIS), SARB, World
Integrated Trade Solution (WITS), and IMF staff calculations.
15
20
25
30
35
40
1985 1988 1991 1994 1997 2000 2003 2006 2009 2012 2015
Exports
Imports
Exports and Imports of Goods and Services(Percent of GDP)
-5
0
5
10
15
20
1985 1988 1991 1994 1997 2000 2003 2006 2009 2012 2015
Annual change in IIP stocks
Annual change in IIP stocks, excl. China (series starts in 2011)
BoP flows
Assets: Foreign Direct Investment Flows(Percent of GDP)
34
26
24
15
1
Export Share by Production Stage, 2015(Percent)
Intermediate goods
Raw materials
Consumer goods
Capital goods
Others
0
10
20
30
40
50
60
70
1985 1988 1991 1994 1997 2000 2003 2006 2009 2012 2015
Assets
Liabilities
Foreign Direct Investment(Percent of GDP)
SSA: 10%
0
20
40
60
80
100
120
2010 2011 2012 2013 2014 2015
Imports by Country or Region of Origin(Billion USD)
Sub-Saharan Africa
Japan
United States
China, Taiwan PoC, Hong Kong SAR, and Macao SAR
European Union
Others
SSA: 28%
0
20
40
60
80
100
120
2010 2011 2012 2013 2014 2015
Exports by Country or Region of Destination(Billion USD)
Sub-Saharan Africa
Japan
United States
China, Taiwan PoC, Hong Kong SAR, and Macao SAR
European Union
Others

SOUTH AFRICA
INTERNATIONAL MONETARY FUND 29
Figure 7. South Africa: The Corporate Sector has Earned Healthy Profits Despite
the Economic Weakening
Profitability has weakened in manufacturing and mining… …but steel and agriculture have started to strengthen.
Corporate leverage has risen… …though it remains below that in peers.
Corporate debt has increased… …but does not stand out relative to other emerging market
economies.
Sources: Bloomberg, L.P., Corporate Vulnerability Utility, Haver Analytics, Institute of International Finance, Orbis, SARB,
World Economic Outlook, and IMF staff calculations.
0
100
200
300
400
500
0
50
100
150
200
250
Jan 2
007
Jul 2007
Jan 2
008
Jul 2008
Jan 2
009
Jul 2009
Jan 2
010
Jul 2010
Jan 2
011
Jul 2011
Jan 2
012
Jul 2012
Jan 2
013
Jul 2013
Jan 2
014
Jul 2014
Jan 2
015
Jul 2015
Jan 2
016
Jul 2016
Jan 2
017
JSE All-Share Index
JSE/FTSE Resources 10
Agriculture
Construction
Steel (RHS)
South Africa: Stock Performance(Index: January 2007 = 100)
Ap
r2017
0
20
40
60
80
100
120
140
160
180
AR
G
IDN
MEX
CO
L
ZA
F
BR
A
IND
PO
L
TH
A
RU
S
CZ
E
MYS
TU
R
HU
N
CH
L
CH
N
Local currency
Foreign currency
Non-Financial Corporate Debt, 2016Q4(Percent of GDP)
-10
0
10
20
30
40
50
2007 2008 2009 2010 2011 2012 2013 2014 2015 2016
Non-Financial Retail trade
Manufacturing Mining
South Africa: Corporate Profitability(Percent, return on equity, capital-weighted mean)
0
20
40
60
80
100
120
140
160
RO
M
UK
R
HU
N
PO
L
IDN
ZA
F
PER
IND
CH
L
MYS
AR
G
CH
N
TU
R
TH
A
RU
S
CO
L
PH
L
BR
A
MEX
Non-Financial Corporate Leverage, 2015(Debt-to-equity, percent)
0
10
20
30
40
50
60
70
80
90
2007 2008 2009 2010 2011 2012 2013 2014 2015 2016
Debt-to-equity
Debt-to-assets
Debt-to-sales
South Africa: Non-Financial Corporate Leverage(Percent, capital-weighted mean)
15
20
25
30
35
40
Mar-95 Mar-98 Mar-01 Mar-04 Mar-07 Mar-10 Mar-13 Mar-16
South Africa: Non-Financial Corporate Debt(Percent of GDP)

SOUTH AFRICA
30 INTERNATIONAL MONETARY FUND
Figure 8. South Africa: The Financial Sector Remains Resilient
Banking sector fundamentals improved. Bank stocks outperformed the JSE index.
SARB rate hike boosted interest rate margin. Bank stocks are still reasonably valued.
Sources: Bloomberg, L.P., S&P, EPFR, Haver Analytics, and IMF staff calculations.
0
5
10
15
20
25
20
09
20
10
20
11
20
12
20
13
20
14
20
15
20
16
Risk-weighted capital adequacy ratio
NPL ratio
RoE
Bank Soundness Indicators(percent)
85
90
95
100
105
110
115
120
125
130
135
Jan
16
Feb
16
Mar
16
Ap
r 1
6
May
16
Jun
16
Jul 1
6
Au
g 1
6
Sep
16
Oct
16
No
v 16
Dec
16
Jan
17
Feb
17
Mar
17
Ap
r 1
7
May
17
Bank Index
Top40 Index
Non-Bank financial Index
Equity Market Performance(Indices: January 1, 2016 = 100)
-5
-4
-3
-2
-1
0
1
2
3
30
35
40
45
50
55
20
06
20
07
20
08
20
09
20
10
20
11
20
12
20
13
20
14
20
15
20
16
Interest Income to Total
IncomeSARB Repo Rate Change
(RHS)
SARB Rate Hike Boosted Interest Income(percent)

SOUTH AFRICA
INTERNATIONAL MONETARY FUND 31
Figure 9. South Africa: Financial Markets Have Recovered but Market Uncertainty
Remains High
Large cumulative equity and bond inflows are starting to
reverse, particularly for equities.
Bond yields are elevated, in part reflecting sizable credit
spreads.
CDS spreads have for some time been on the high side,
even by sub-investment grade standards.
Government bond yields have been less volatile than in
other key emerging markets.
The 1-year JIBAR is well above the repo rate. Stock market uncertainty has declined from relatively high
levels.
Sources: Bloomberg, L.P., S&P, IIF, and IMF staff calculations.
-10
0
10
20
30
40
50
60
70
80
Feb
05
Au
g 0
5
Feb
06
Au
g 0
6
Feb
07
Au
g 0
7
Feb
08
Au
g 0
8
Feb
09
Au
g 0
9
Feb
10
Au
g 1
0
Feb
11
Au
g 1
1
Feb
12
Au
g 1
2
Feb
13
Au
g 1
3
Feb
14
Au
g 1
4
Feb
15
Au
g 1
5
Feb
16
Au
g 1
6
Feb
17
Equity Inflows
Bond Inflows
Cumulative Portfolio Flows(billions of U.S. dollars)
Ap
r 17
0
200
400
600
800
1,000
1,200
Jan
15
Ap
r 1
5
Jul 1
5
Oct
15
Jan
16
Ap
r 1
6
Jul 1
6
Oct
16
Jan
17
Ap
r 1
7
South Africa CDS
Eskom CDS
10Y SAGB Yield
CDS Spread and Bond Yield(bps)
Chile
China
Poland
Malaysia
Mexico
Peru
Thailand
Colombia
South Africa
Philippines
Romania
Turkey
Indonesia
Brazil
Russia
Hungary
0
50
100
150
200
250
5Y
CD
S S
pre
ad
South Africa's CDS trade as high yield 1/
AAA AA+ AA AA- A+ A- BBB+ BBB BBB- BB+ BB
1/ Credit Rating represents average of ratings from S&P, Fitch and Moody's for
each country. Data as on May 24, 2017.
Trend line
Source: Bloomberg, L.P.
6
8
10
12
14
16
18Ja
n 1
4
Mar
14
May
14
Jul 1
4
Sep
14
No
v 14
Jan
15
Mar
15
May
15
Jul 1
5
Sep
15
No
v 15
Jan
16
Mar
16
May
16
Jul 1
6
Sep
16
No
v 16
Jan
17
Turkey
South Africa
Brazil
Indonesia
10-Year Government Bond Yield(percent)
Mar
17
0
2
4
6
8
10
12
14
16
Jan
06
Jun
06
No
v 06
Ap
r 0
7Sep
07
Feb
08
Jul 0
8D
ec
08
May
09
Oct
09
Mar
10
Au
g 1
0Ja
n 1
1Ju
n 1
1N
ov
11
Ap
r 1
2Sep
12
Feb
13
Jul 1
3D
ec
13
May
14
Oct
14
Mar
15
Au
g 1
5Ja
n 1
6Ju
n 1
6N
ov
16
Ap
r 1
7
1-year Interbank Rate
SARB Policy Rate
JIBAR and SARB Policy Rate(percent)
12
14
16
18
20
22
24
26
12
13
14
15
16
17
18
19
20
21
Jan
15
Mar
15
May
15
Jul 1
5
Sep
15
No
v 15
Jan
16
Mar
16
May
16
Jul 1
6
Sep
16
No
v 16
Jan
17
Mar
17
Rand 1-year Implied Vol
JSE Equity VIX (RHS)
JSE Equity Index and Foreign Exchange
Volatility(percent)
Ap
r 17

SOUTH AFRICA
32 INTERNATIONAL MONETARY FUND
Figure 10. South Africa: Corporate Sector Balance Sheets are Sound with some
Pockets of Vulnerability
South African corporations are highly profitable… …though corporate financial health has weakened.
Some sectors could face difficulties in meeting payments… …which could hamper growth.
In addition, liquidity has worsened somewhat… …and weakening credit growth weighs on the outlook.
Sources: Corporate Vulnerability Utility, Haver Analytics, SARB, and IMF staff calculations.
ARGBRA
BGR
CHLCHN
COL
HUN
IND IDN
KAZ
MYS
MEX
PER
PHL
POL
ROM
RUS
ZAF
THA
TUR
0
2
4
6
8
10
12
14
16
0 5 10 15 20 25
Emerging Markets: Profitability, 2015(Percent)
Retu
rn o
n a
ssets
Return on equity
0
1
2
3
4
5
6
CO
L
CZ
E
AR
G
PER
BR
A
ZA
F
PH
L
PO
L
TU
R
RU
S
TH
A
EG
Y
CH
L
HU
N
BG
R
IND
MEX
CH
N
MYS
IDN
RO
M
KA
Z
2015
2010
Non-Financial Sector: Current Assets Relative to Current
Liabilities (Ratio)
0
1
2
3
4
5
6
2010 2011 2012 2013 2014 2015 2016
South Africa: Interest Coverage Ratio(All industries; ratio; threshold assumed at 2)
0 2 4 6 8
Business services
Electricity, Gas & Water supply 1/
Personal services
Transport, storage & communication
Manufacturing
Construction
Mining & Quarrying
Trade
South Africa: Interest Coverage Ratio, 2016Q4(Ratio; threshold of debt at risk assumed at 2)
1/ 2016Q3.
-20
-10
0
10
20
30
40
2005 2006 2007 2008 2009 2010 2011 2012 2013 2014 2015 2016 2017
Fixed investment volume
Credit to the private sector
Loans and advances to corporations
South Africa: Investment and Credit Growth(Percent, year-on-year)
Agriculture,
forestry, and fishing
Mining and
quarrying
Manufacturing
Electricity and water
Construction
Wholesale and retail
trade; hotels and
restaurants
Transport and
communication
Finance, real estate
and business
services
General government
Personal
services
South Africa: Sectoral Shares in Gross Value Added, 2016(Percent of total gross value added)

SOUTH AFRICA
INTERNATIONAL MONETARY FUND 33
Figure 11. South Africa: Gross External Debt Has Risen but Does Not Stand Out
Relative to Peers
Gross external debt does not stand out relative to other
EMs.
While public sector external debt has risen…
…the debt increase has largely been of long-term maturity. Non-financial sector external debt also compares well…
…but has increasingly been of short-term nature… …and a large share of external non-financial sector debt is
due within one year.
Sources: Haver Analytics, International Financial Statistics, SARB, World Economic Outlook database, and IMF staff
calculations.
0
10
20
30
40
50
60
Mar-08 Mar-09 Mar-10 Mar-11 Mar-12 Mar-13 Mar-14 Mar-15 Mar-16
General government
Public corporations
Monetary authorities
Banking sector
Other
Breakdown of External Debt by Sector(Percent of four-quarter rolling sum of quarterly U.S. dollar GDP)
0
10
20
30
40
50
60
Mar-08 Mar-09 Mar-10 Mar-11 Mar-12 Mar-13 Mar-14 Mar-15 Mar-16
Direct investment (incl. short-term)
Other long-term instruments banking sector
Long-term loans
Long-term bonds and notes
Short-term debt (original maturity)
Breakdown of External Debt by Maturity and Instrument(Percent of four-quarter rolling sum of quarterly GDP)
0
1
2
3
4
5
6
Mar-08 Mar-09 Mar-10 Mar-11 Mar-12 Mar-13 Mar-14 Mar-15 Mar-16
Long-term loans
Long-term bonds and notes
Short-term loans and trade credit (original maturity)
Non-Financial Sector External Debt, Excluding FDI(Percent of four-quarter rolling sum of quarterly GDP)
FX bonds, LT
Other FX loans, LT
LC bonds, LT
Other LC debt, LT
Other FX loans, ST
LC bonds, ST
Other LC debt, ST
Decomposition of Non-Financial Sector External Debt(Data as of 2016Q4; debt defined on remaining maturity basis)
Total external NFC debt:
13.6 percent of GDP
Due within 12 months:
6.6 percent of GDP
0
20
40
60
80
100
120
140
0
50
100
150
200
250
300
TH
A
CZ
E
IND
BU
L
ZA
F
RU
S
PH
L
RO
U
PO
L
HU
N
MEX
PER
IDN
AR
G
TU
R
CH
L
UK
R
CO
L
VEN
BR
A
External debt to exports (left)
External debt to GDP (right)
Gross External Debt, 2015(Percent)
0
10
20
30
40
50
60
70
80A
RG
IND
PH
L
IDN
PER
TU
R
ZA
F
CO
L
BR
A
TH
A
RU
S
RO
U
MEX
PO
L
VEN
CZ
E
CH
L
BG
R
UK
R
HU
N
Intercompany debt (direct investment, debt instruments)
Nonintercompany debt
Non-Financial Sector External Debt, 2015(Percent of GDP)

SOUTH AFRICA
34 INTERNATIONAL MONETARY FUND
Figure 12. South Africa: Consolidation Against Low Growth Headwinds and Increasing
Fiscal Risks
Stepped up consolidation efforts in recent years… …kept the fiscal deficit broadly stable as revenue buoyancy
largely offset the increasing expenditure ratio…
…driven in part by an increasing wage bill as public wage
agreements have yet to adjust to weaker growth… …which has been consistently been revised down.…
…making debt stabilization challenging… …especially in a context of sizable and growing fiscal risks.
Sources: National Treausury, and IMF staff calculations.
-2.00
-1.00
0.00
1.00
2.00
3.00
4.00
5.00
-
0.20
0.40
0.60
0.80
1.00
1.20
2015/16 2016/17 2017/18 2018/19
Revenue Increases
Expenditure reductions
Structural Primary Balance (RHS,
percent of potential GDP)
Planned Fiscal Consolidation(percent of fiscal year GDP, unless otherwise stated)
-40
-30
-20
-10
0
10
20
30
2004/0
5
2005/0
6
2006/0
7
2007/0
8
2008/0
9
2009/1
0
2010/1
1
2011/1
2
2012/1
3
2013/1
4
2014/1
5
2015/1
6
Tax Revenue Non-tax Revenue Non-Interest Expenditure
Interest Expenditure Overall Balance
Fiscal Deficit(percent of GDP)
-2
0
2
4
6
8
10
12
14
20
06/0
7
20
07/0
8
20
08/0
9
20
09/1
0
20
10/1
1
20
11/1
2
20
12/1
3
20
13/1
4
20
14/1
5
20
15/1
6
20
16/1
7
20
17/1
8
20
18/1
9
20
19/2
0
20
20/2
1
20
21/2
2
Government Gross Financing Need
Fiscal Deficit
Deficit and Gross Financing Need(percent of GDP)
0
10
20
30
40
50
60
70
80
2004/5
2005/6
2006/7
2007/8
2008/9
2009/1
0
2010/1
1
2011/1
2
2012/1
3
2013/1
4
2014/1
5
2015/1
6Contingent Liabilities SOE Debt
Local Government Debt Central Government Debt
Public Sector Debt(percent of GDP)
11.0
11.1
11.2
11.3
11.4
11.5
11.6
11.7
11.8
-2.0
0.0
2.0
4.0
6.0
8.0
10.0
2012/1
3
2013/1
4
2014/1
5
2015/1
6
2016/1
7
Wage bill as a percent of GDP (RHS)
Wage bill growth
Employment growth
Average compensation growth
Wage Bill Growth(percent unless otherwise specified, consolidated government)
-2
-1
0
1
2
3
4
5
2016 Budget 2015 MTBPS 2015 Budget
2014 MTBPS 2014 Budget 2013 Budget
2013 MTBPS 2012 Budget 2012 MTBPS
2016 MTBPS
GDP Growth Revisions in the Budget(percent)

SOUTH AFRICA
INTERNATIONAL MONETARY FUND 35
Table 1. South Africa: Selected Economic Indicators, 2013–18
GDP
Nominal GDP (2016, billions of US dollars) 295 16.6
GDP per capita (2016, in US dollars) 5272 5.0
Population characteristics Inequality (income shares unless otherwise specified)
Total (2016, million) 55.9 51.3
Urban population (percent of total), 2014 64 2.5
Life expectancy at birth (years), 2016 62 63.4
2013 2014 2015 2016 2017 2018
Est. Proj. Proj.
Real GDP 2.5 1.7 1.3 0.3 1.0 1.2
Real GDP per capita 0.9 0.1 -0.3 -1.3 -0.6 -0.5
Real domestic demand 3.2 0.4 1.7 -0.7 0.7 1.2
GDP deflator 6.1 5.8 5.0 6.8 5.8 5.7
CPI (annual average) 5.8 6.1 4.6 6.3 5.7 5.6
CPI (end of period) 5.4 5.3 5.3 6.7 5.6 5.5
24.7 25.1 25.4 26.7 27.4 28.0
7.2 6.5 7.0 8.1 7.5 7.4
Labor productivity (formal nonagricultural) 1.9 1.3 1.9 1.9 1.9 1.9
Unit labor costs (formal nonagricultural) 5.1 5.1 5.1 6.2 5.5 5.4
Gross national saving 15.4 15.5 16.3 16.2 16.1 15.7
Public (incl. public enterprises) -0.9 1.1 1.1 1.0 0.9 1.0
Private 16.2 14.4 15.2 15.1 15.2 14.7
Investment (including inventories) 21.3 20.8 20.7 19.4 19.1 19.1
Public (incl. public enterprises) 7.1 7.3 7.6 7.6 7.6 7.6
Private 13.3 13.3 12.8 12.0 11.7 11.7
Revenue, including grants 2/ 27.3 27.6 28.3 28.9 29.1 29.4
Expenditure and net lending 31.6 31.8 32.9 32.9 33.2 33.4
Overall balance -4.3 -4.2 -4.6 -4.0 -4.1 -4.0
Primary balance -1.3 -1.1 -1.3 -0.5 -0.4 -0.2
Structural balance (percent of potential GDP) -4.2 -4.0 -3.9 -3.5 -3.5 -3.3
Gross government debt 3/ 44.1 47.0 49.3 51.7 52.6 54.7
8.2 8.0 9.7 8.9 8.7 ...
Broad money 5.9 7.3 10.3 6.1 6.8 6.9
Credit to the private sector 6.6 7.2 8.3 5.6 4.8 5.1
5.0 5.8 6.3 7.0 7.0 ...
3-month Treasury bill interest rate (percent) 4/ 5.1 5.8 6.1 7.2 7.4 ...
Current account balance (billions of U.S. dollars) -21.6 -18.7 -14.0 -9.6 -9.6 -11.1
percent of GDP -5.9 -5.3 -4.4 -3.3 -3.0 -3.4
Exports growth (volume) 3.6 3.2 3.9 -0.1 1.9 2.4
Imports growth (volume) 5.0 -0.5 5.4 -3.7 0.9 2.5
Terms of trade (percentage change) -1.4 -1.6 3.4 0.3 0.3 -1.4
Overall balance 0.1 0.4 -0.2 0.9 0.0 0.0
Gross reserves (billions of U.S. dollars) 49.6 49.1 45.8 47.4 47.4 47.4
Total external debt 37.2 41.3 39.1 48.5 45.2 46.2
-14.4 -10.3 -5.6 -11.0 12.7 …
-10.1 -3.3 1.1 -3.7 12.9 …
Exchange rate (Rand/U.S. dollar, end-period) 7/ 10.5 11.6 15.6 13.7 13.1 …
1/ Consolidated government as defined in the budget unless otherwise indicated.
3/ Central government.
4/ Average of January-May 2017 data
5/ Percentage change January-May 2017 average with respect to 2016 average.
6/ Percentage change January-March 2017 average with respect to 2016 average.
7/ End May 2017
Sources: South African Reserve Bank, National Treasury, Haver, Bloomberg, World Bank, and Fund staff estimates and projections.
2/ Revenue excludes the line "transactions in assets and liabilites" classified as part of revenue in budget documents. This is because this line captures
proceeds from the sales of assets, realized valuation gains from holding of foreign currency deposits, and other conceptually similar items which are not
classified as revenue by the IMF's Government Finance Statistics Manual 2010.
Economic Indicators
Social Indicators
Headcount ratio at $1.90 a day (2011 PPP) (percent
Undernourishment (2015)
Poverty (percent of population)
Highest 10 percent of population
Gini coefficient (2010)
Lowest 20 percent of population
Real effective exchange rate (percentage change, period average) 6/
Unemployment rate (percent of labor force, annual average)
Average remuneration (formal nonagricultural, nominal)
Nominal effective exchange rate (percentage change, period average) 5/
Labor market (annual percentage change unless otherwise indicated)
National income and prices (annual percentage change unless otherwise indicated)
Savings and Investment (percent of GDP unless otherwise indicated)
Fiscal position (percent of GDP unless otherwise indicated) 1/
Money and credit (annual percentage change unless otherwise indicated)
Balance of payments (percent of GDP unless otherwise indicated)
Government bond yield (10-year, percent) 4/
Repo rate (percent, end-period) 4/

SOUTH AFRICA
36 INTERNATIONAL MONETARY FUND
Table 2. South Africa: Consolidated Government Operations, 2012/13–2019/20 1/
Sources: South African National Treasury and Fund staff estimates and projections.
1/ Data is on a fiscal year basis (April 1-March 31). Consolidated government corresponds to the national government, social security funds,
provincial governments, and some public entities. Local governments are only partially captured through the transfers sent to them by the national
government. The authorities projections are based on the 2017 Budget.
2/ Tax revenue net of SACU payments.
3/ Non- tax revenue excludes transactions in financial assets and liabilities. These transactions are classified as a domestic financing item given that
they involve primarily revenues associated with realized exchange rate valuation gains from the holding of foreign currency deposits, sale of assets,
and other conceptually similar smaller items. This adjustment was done historically and in both the authorities and IMF staff columns for
comparability purposes.
4/ Covers only national government debt.
5/ Historical nominal fiscal year GDP is computed using the average from Q2 in a given calendar year to Q1 in the following calendar year of
annualized seasonally adjusted quarterly nominal GDP figures from the national accounts.
2012/13 2013/14
Auth. Staff Auth. Staff Auth. Staff Auth. Staff
Total revenue and grants 893.6 992.1 1,083.5 1,178.6 1,280.5 1,274.5 1,396.8 1,376.1 1,522.0 1,486.2 1,651.2 1,610.7
Tax revenue 2/ 771.7 856.6 934.6 1,019.0 1,104.9 1,104.6 1,209.5 1,193.9 1,322.0 1,292.1 1,443.0 1,402.7
Non-tax revenue 3/ 14.5 14.8 15.6 13.9 15.2 13.9 15.6 15.6 15.8 15.8 11.2 11.2
Provinces, social security, and other entities 107.4 120.7 133.4 145.7 160.4 156.0 171.7 166.6 184.2 178.3 197.0 196.8
Total expenditure 1,043.4 1,143.4 1,233.5 1,364.2 1,445.2 1,447.2 1,563.1 1,567.1 1,677.1 1,681.1 1,814.3 1,822.7
Current expenditure 919.6 1,005.4 1,082.5 1,175.7 1,276.5 1,278.5 1,378.1 1,382.1 1,480.9 1,484.9 1,599.4 1,607.8
Wages and salaries 376.3 408.0 437.4 473.1 512.2 512.2 550.4 550.4 588.7 588.7 631.1 631.1
Other goods and services 162.9 174.2 185.5 195.6 208.3 208.3 221.7 221.7 237.5 237.5 253.6 253.6
Interest 93.3 109.6 121.4 136.3 153.4 155.4 169.3 173.3 187.6 191.6 206.4 214.8
Transfers 287.1 313.7 338.3 370.6 402.7 402.7 436.7 436.7 467.1 467.1 508.4 508.4
Capital expenditure 118.7 133.8 145.3 158.3 162.3 162.3 173.5 173.5 181.2 181.2 189.7 189.7
Payment for financial assets 5.1 4.2 5.6 30.3 6.4 6.4 5.6 5.6 5.0 5.0 5.2 5.2
Contingency 0.0 0.0 0.0 0.0 0.0 0.0 6.0 6.0 10.0 10.0 20.0 20.0
Primary balance -56.6 -41.8 -28.6 -49.3 -11.4 -17.4 3.0 -17.7 32.5 -3.3 43.3 2.8
Overall balance -149.8 -151.3 -149.9 -185.6 -164.7 -172.7 -166.3 -191.0 -155.1 -194.9 -163.1 -212.0
Structural primary balance -48.6 -39.6 -24.5 -32.7 n.a. 6.4 n.a. 11.2 n.a. 30.9 n.a. 33.0
Gross government debt 1,366 1,585 1,799 2,019 2,238 2,238 2,478 2,502 2,713 2,778 2,905 3,038
Total revenue and grants 26.9 27.5 28.0 28.6 29.0 28.9 29.5 29.2 29.7 29.5 29.8 29.7
Tax revenue 23.2 23.7 24.2 24.7 25.1 25.1 25.5 25.3 25.8 25.6 26.0 25.9
Non-tax revenue 0.4 0.4 0.4 0.3 0.3 0.3 0.3 0.3 0.3 0.3 0.2 0.2
Provinces, social security, and other entities 3.2 3.3 3.5 3.5 3.6 3.5 3.6 3.5 3.6 3.5 3.6 3.6
Total expenditure 31.4 31.7 31.9 33.1 32.8 32.8 33.0 33.3 32.7 33.4 32.7 33.6
Current expenditure 27.7 27.8 28.0 28.5 28.9 29.0 29.1 29.3 28.9 29.5 28.8 29.7
Wages and salaries 11.3 11.3 11.3 11.5 11.6 11.6 11.6 11.7 11.5 11.7 11.4 11.6
Other goods and services 4.9 4.8 4.8 4.7 4.7 4.7 4.7 4.7 4.6 4.7 4.6 4.7
Interest 2.8 3.0 3.1 3.3 3.5 3.5 3.6 3.7 3.7 3.8 3.7 4.0
Transfers 8.6 8.7 8.8 9.0 9.1 9.1 9.2 9.3 9.1 9.3 9.2 9.4
Capital expenditure 3.6 3.7 3.8 3.8 3.7 3.7 3.7 3.7 3.5 3.6 3.4 3.5
Payment for financial assets 0.2 0.1 0.1 0.7 0.1 0.1 0.1 0.1 0.1 0.1 0.1 0.1
Contingency 0.0 0.0 0.0 0.0 0.0 0.0 0.1 0.1 0.2 0.2 0.4 0.4
Primary balance -1.7 -1.2 -0.7 -1.2 -0.3 -0.4 0.1 -0.4 0.6 -0.1 0.8 0.1
Overall balance -4.5 -4.2 -3.9 -4.5 -3.7 -3.9 -3.5 -4.1 -3.0 -3.9 -2.9 -3.9
Structural primary balance (percent of potential GDP) -1.5 -1.1 -0.6 -0.8 n.a. 0.1 n.a. 0.2 n.a. 0.6 n.a. 0.6
Gross government debt 4/ 41.1 43.9 46.5 49.0 50.7 50.8 52.3 53.1 52.9 55.1 52.4 56.0
Memorandum items:
National budget primary balance (percent of GDP) -2.7 -2.1 -1.7 -2.0 -0.9 -0.9 -0.5 -0.8 -0.1 -0.7 0.0 -0.8
National budget overall balance (percent of GDP) -5.4 -4.9 -4.7 -5.1 -4.2 -4.2 -3.9 -4.3 -3.6 -4.3 -3.6 -4.6
Fiscal year GDP (billions of rand) 5/ 3,320 3,612 3,865 4,119 4,410 4,409 4,741 4,710 5,129 5,041 5,546 5,420
Fiscal year real GDP growth (percent) 2.2 2.6 1.7 0.6 1.0 0.7 1.3 1.0 2.1 1.2 2.3 1.9
2019/202018/192014/15 2015/16 2016/17 2017/18
(in billions of Rand)
(in percent of GDP)
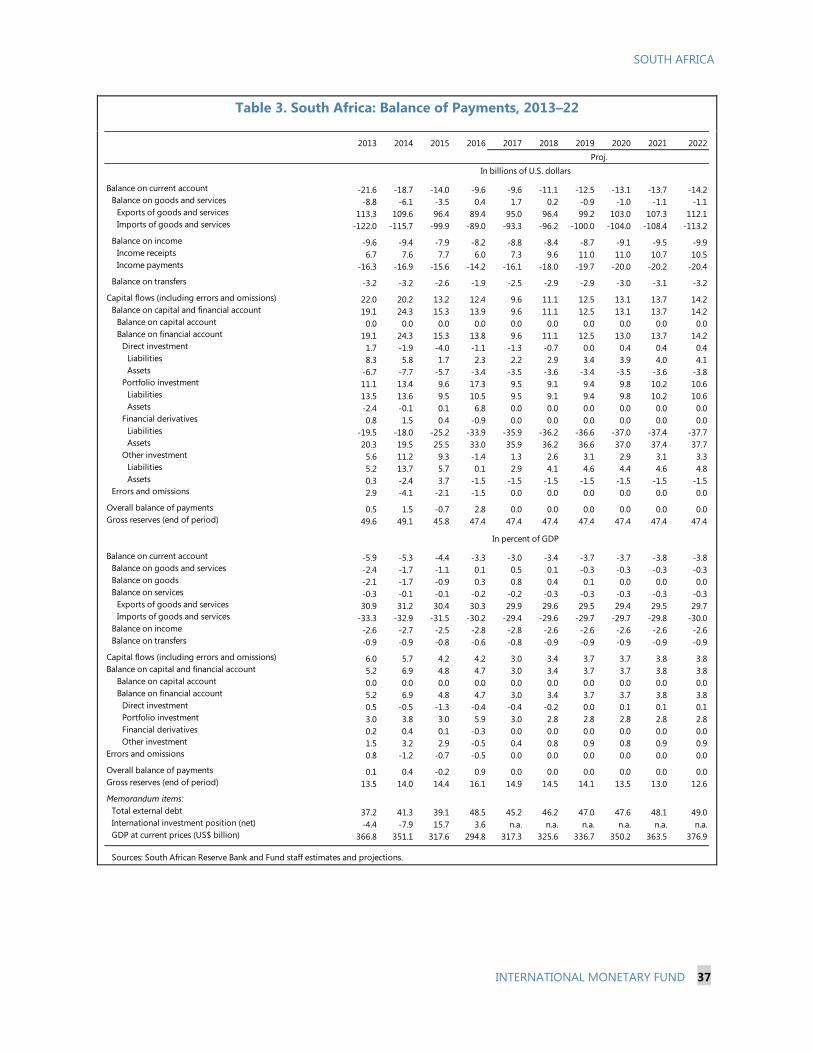
SOUTH AFRICA
INTERNATIONAL MONETARY FUND 37
Table 3. South Africa: Balance of Payments, 2013–22
2013 2014 2015 2016 2017 2018 2019 2020 2021 2022
Balance on current account -21.6 -18.7 -14.0 -9.6 -9.6 -11.1 -12.5 -13.1 -13.7 -14.2
Balance on goods and services -8.8 -6.1 -3.5 0.4 1.7 0.2 -0.9 -1.0 -1.1 -1.1
Exports of goods and services 113.3 109.6 96.4 89.4 95.0 96.4 99.2 103.0 107.3 112.1
Imports of goods and services -122.0 -115.7 -99.9 -89.0 -93.3 -96.2 -100.0 -104.0 -108.4 -113.2
Balance on income -9.6 -9.4 -7.9 -8.2 -8.8 -8.4 -8.7 -9.1 -9.5 -9.9
Income receipts 6.7 7.6 7.7 6.0 7.3 9.6 11.0 11.0 10.7 10.5
Income payments -16.3 -16.9 -15.6 -14.2 -16.1 -18.0 -19.7 -20.0 -20.2 -20.4
Balance on transfers -3.2 -3.2 -2.6 -1.9 -2.5 -2.9 -2.9 -3.0 -3.1 -3.2
Capital flows (including errors and omissions) 22.0 20.2 13.2 12.4 9.6 11.1 12.5 13.1 13.7 14.2
Balance on capital and financial account 19.1 24.3 15.3 13.9 9.6 11.1 12.5 13.1 13.7 14.2
Balance on capital account 0.0 0.0 0.0 0.0 0.0 0.0 0.0 0.0 0.0 0.0
Balance on financial account 19.1 24.3 15.3 13.8 9.6 11.1 12.5 13.0 13.7 14.2
Direct investment 1.7 -1.9 -4.0 -1.1 -1.3 -0.7 0.0 0.4 0.4 0.4
Liabilities 8.3 5.8 1.7 2.3 2.2 2.9 3.4 3.9 4.0 4.1
Assets -6.7 -7.7 -5.7 -3.4 -3.5 -3.6 -3.4 -3.5 -3.6 -3.8
Portfolio investment 11.1 13.4 9.6 17.3 9.5 9.1 9.4 9.8 10.2 10.6
Liabilities 13.5 13.6 9.5 10.5 9.5 9.1 9.4 9.8 10.2 10.6
Assets -2.4 -0.1 0.1 6.8 0.0 0.0 0.0 0.0 0.0 0.0
Financial derivatives 0.8 1.5 0.4 -0.9 0.0 0.0 0.0 0.0 0.0 0.0
Liabilities -19.5 -18.0 -25.2 -33.9 -35.9 -36.2 -36.6 -37.0 -37.4 -37.7
Assets 20.3 19.5 25.5 33.0 35.9 36.2 36.6 37.0 37.4 37.7
Other investment 5.6 11.2 9.3 -1.4 1.3 2.6 3.1 2.9 3.1 3.3
Liabilities 5.2 13.7 5.7 0.1 2.9 4.1 4.6 4.4 4.6 4.8
Assets 0.3 -2.4 3.7 -1.5 -1.5 -1.5 -1.5 -1.5 -1.5 -1.5
Errors and omissions 2.9 -4.1 -2.1 -1.5 0.0 0.0 0.0 0.0 0.0 0.0
Overall balance of payments 0.5 1.5 -0.7 2.8 0.0 0.0 0.0 0.0 0.0 0.0
Gross reserves (end of period) 49.6 49.1 45.8 47.4 47.4 47.4 47.4 47.4 47.4 47.4
Balance on current account -5.9 -5.3 -4.4 -3.3 -3.0 -3.4 -3.7 -3.7 -3.8 -3.8
Balance on goods and services -2.4 -1.7 -1.1 0.1 0.5 0.1 -0.3 -0.3 -0.3 -0.3
Balance on goods -2.1 -1.7 -0.9 0.3 0.8 0.4 0.1 0.0 0.0 0.0
Balance on services -0.3 -0.1 -0.1 -0.2 -0.2 -0.3 -0.3 -0.3 -0.3 -0.3
Exports of goods and services 30.9 31.2 30.4 30.3 29.9 29.6 29.5 29.4 29.5 29.7
Imports of goods and services -33.3 -32.9 -31.5 -30.2 -29.4 -29.6 -29.7 -29.7 -29.8 -30.0
Balance on income -2.6 -2.7 -2.5 -2.8 -2.8 -2.6 -2.6 -2.6 -2.6 -2.6
Balance on transfers -0.9 -0.9 -0.8 -0.6 -0.8 -0.9 -0.9 -0.9 -0.9 -0.9
Capital flows (including errors and omissions) 6.0 5.7 4.2 4.2 3.0 3.4 3.7 3.7 3.8 3.8
Balance on capital and financial account 5.2 6.9 4.8 4.7 3.0 3.4 3.7 3.7 3.8 3.8
Balance on capital account 0.0 0.0 0.0 0.0 0.0 0.0 0.0 0.0 0.0 0.0
Balance on financial account 5.2 6.9 4.8 4.7 3.0 3.4 3.7 3.7 3.8 3.8
Direct investment 0.5 -0.5 -1.3 -0.4 -0.4 -0.2 0.0 0.1 0.1 0.1
Portfolio investment 3.0 3.8 3.0 5.9 3.0 2.8 2.8 2.8 2.8 2.8
Financial derivatives 0.2 0.4 0.1 -0.3 0.0 0.0 0.0 0.0 0.0 0.0
Other investment 1.5 3.2 2.9 -0.5 0.4 0.8 0.9 0.8 0.9 0.9
Errors and omissions 0.8 -1.2 -0.7 -0.5 0.0 0.0 0.0 0.0 0.0 0.0
Overall balance of payments 0.1 0.4 -0.2 0.9 0.0 0.0 0.0 0.0 0.0 0.0
Gross reserves (end of period) 13.5 14.0 14.4 16.1 14.9 14.5 14.1 13.5 13.0 12.6
Memorandum items:
Total external debt 37.2 41.3 39.1 48.5 45.2 46.2 47.0 47.6 48.1 49.0
International investment position (net) -4.4 -7.9 15.7 3.6 n.a. n.a. n.a. n.a. n.a. n.a.
GDP at current prices (US$ billion) 366.8 351.1 317.6 294.8 317.3 325.6 336.7 350.2 363.5 376.9
Sources: South African Reserve Bank and Fund staff estimates and projections.
In billions of U.S. dollars
In percent of GDP
Proj.

SOUTH AFRICA
38 INTERNATIONAL MONETARY FUND
Table 4. South Africa: Monetary Survey, 2012–17
2012 2013 2014 2015 2016 2017
Est. Proj.
Monetary Survey
Net Foreign Assets 504 641 600 785 742 697
Net Domestic Assets 1,869 1,872 2,097 2,190 2,415 2,675
General government -4 -94 -87 -180 -91 -42
Public Nonfinancial Corporations 34 30 46 49 61 61
Nonfinancial Private Sector 2,233 2,381 2,552 2,764 2,918 3,059
Other items net -394 -445 -415 -443 -474 -403
Broad Money 2,373 2,514 2,697 2,975 3,157 3,372
Central bank
Net Foreign Assets 402 486 528 668 606 608
Net Domestic Assets -228 -295 -323 -444 -366 -351
General government -246 -318 -352 -484 -411 -395
Public Nonfinancial Corporations 1 1 1 1 1 1
Nonfinancial Private Sector 0 0 0 0 0 0
Depository institutions (banks) 26 30 37 49 56 56
Other items net -9 -8 -9 -11 -13 -14
Monetary base 174 191 205 224 240 257
Currency in circulation 112 119 131 138 143 153
Reserves and others 62 72 74 86 97 104
Memorandum items:
Broad money growth 5.2 5.9 7.3 10.3 6.1 6.8
Monetary base growth 11.2 9.8 7.3 9.0 7.4 6.9
Credit to private sector 9.3 6.6 7.2 8.3 5.6 4.8
Broad money multiplier 13.6 13.2 13.1 13.3 13.1 13.1
Sources: International Financial Statistics, South African Reserve Bank, and Fund staff estimates.
billions of rand
annual percentage change

SOUTH AFRICA
INTERNATIONAL MONETARY FUND 39
Table 5. South Africa: Financial Soundness Indicators, 2012–171
2012 2013 2014 2015 2016 2017
Capital adequacy
Risk-weighted capital adequacy ratio 15.9 15.6 14.8 14.2 15.9 16.1
of which Tier 1 capital 14.0 14.1 13.6 13.8 14.5 14.6
Capital to asset ratio 7.8 7.9 7.6 7.0 8.2 8.3
Asset quality
Nonperforming loans (percent of outstanding loans) 4.0 3.6 3.2 3.1 2.9 2.4
Nonperforming loans net of provisions (percent of regulatory capital) 21.5 18.1 16.3 16.5 14.8 12.3
Earnings, profitability, and efficiency
Return on assets 1.5 1.4 1.4 1.5 1.7 1.7
Return on equity 20.5 18.6 18.8 20.7 22.2 21.5
Interest income (percent of gross income) 41.3 48.1 53.3 49.7 51.7 56.2
Trading income (percent of gross income) 8.9 7.8 2.8 2.0 6.4 8.7
Non-interest expenses (percent of gross income) 55.0 56.3 53.5 47.8 53.3 61.0
Personnel expenses (percent of non-interest expenditure) 38.7 47.3 50.7 41.4 46.0 51.2
Liquidity
Liquid assets (percent of total assets) 16.2 16.6 17.6 17.7 16.0 13.9
Liquid assets (percent of short-term liabilties) 33.0 33.0 33.5 35.0 30.9 33.8
Customer deposits (percent of total non-interbank loans) 52.2 53.1 53.5 54.3 54.5 48.5
Exposure to FX risk
Effective net open FX position (percent of regulatory capital) 0.5 0.3 0.3 -0.3 1.0 1.2
Foreign-currency-denominated loans (percent of outstanding loans) 8.3 8.7 10.1 11.3 10.0 9.2
Foreign-currency-denominated liabilities (percent of total liabilities) 5.7 6.3 8.1 9.4 8.5 7.8
Sectoral distribution of loans and advances
Residents 90.5 89.2 88.2 87.4 88.5 89.3
Central Bank and other financial corporations 2/ 12.7 12.3 12.2 13.8 13.7 13.0
General government 0.8 0.7 0.7 0.6 0.5 0.5
Nonfinancial corporations 31.0 31.1 32.2 32.4 34.7 34.9
Households 46.0 45.1 43.1 40.6 39.6 39.6
Nonresidents 9.5 10.8 11.9 12.6 11.5 10.7
Derivatives (percent of regulatory capital)
Gross asset position in financial derivatives 88.6 70.4 64.5 113.7 51.6 49.7
Gross liability position in financial derivatives 87.6 75.4 69.5 129.2 54.2 52.3
Real Estate Market
Residential real estate prices (annual percentage change) 7.4 8.6 9.1 5.4 7.3 …
Residential real estate loans (percent of total loans) 30.3 28.5 26.6 24.8 24.8 24.8
Commercial real estate loans (percent of total loans) 9.1 8.8 9.1 9.2 7.4 4.3
Household debt
Household debt (percent of GDP) 47.7 46.3 45.8 46.2 43.5 …
Household debt (percent of disposable income) 76.3 78.8 77.8 77.8 73.4 73.4
Household debt service (percent of disposable income) 7.7 8.6 9.3 9.7 9.5 …
Source: South African Reserve Bank.
1/ 2016 data are for December except for residential real estate prices (November). 2017 data are for April.
2/ Including interbank loans.

SOUTH AFRICA
40 INTERNATIONAL MONETARY FUND
Table 6. South Africa: Medium-Term Macroeconomic Framework, 2013–22
2013 2014 2015 2016 2017 2018 2019 2020 2021 2022
Real GDP 2.5 1.7 1.3 0.3 1.0 1.2 1.7 2.2 2.2 2.2
CPI (annual average) 5.8 6.1 4.6 6.3 5.7 5.6 5.5 5.5 5.5 5.5
Output gap (percent of potential real GDP) 0.0 -0.1 -0.3 -1.2 -1.5 -1.7 -1.5 -0.9 -0.5 -0.1
24.7 25.1 25.4 26.7 27.4 28.0 28.1 28.2 28.2 28.2
Gross national saving 15.4 15.5 16.3 16.2 16.1 15.7 15.4 15.6 15.7 15.8
Public (incl. public enterprises) -0.9 1.1 1.1 1.0 0.9 1.0 1.0 1.0 1.1 1.2
Private 16.2 14.4 15.2 15.1 15.2 14.7 14.4 14.5 14.6 14.6
Investment (including inventories) 21.3 20.8 20.7 19.4 19.1 19.1 19.1 19.3 19.4 19.6
Public (incl. public enterprises) 7.1 7.3 7.6 7.6 7.6 7.6 7.5 7.4 7.3 7.2
Private 13.3 13.3 12.8 12.0 11.7 11.7 11.8 12.1 12.3 12.5
Revenue, including grants 27.3 27.6 28.3 28.9 29.1 29.4 29.6 29.7 29.7 29.7
Expenditure and net lending 31.6 31.8 32.9 32.9 33.2 33.4 33.6 33.6 33.4 33.2
Overall balance -4.3 -4.2 -4.6 -4.0 -4.1 -4.0 -4.0 -3.9 -3.7 -3.4
Primary balance -1.3 -1.1 -1.3 -0.5 -0.4 -0.2 0.0 0.1 0.4 0.7
Gross government debt 2/ 44.1 47.0 49.3 51.7 52.6 54.7 55.9 56.5 56.9 57.0
Exports of Goods and Services (volume, annual percentage change) 3.6 3.2 3.9 -0.1 1.9 2.4 3.1 3.2 3.4 3.4
Imports of Goods and Services (volume, annual percentage change) 5.0 -0.5 5.4 -3.7 0.9 2.5 3.2 3.1 3.1 3.1
Current account balance (billions of U.S. dollars) -21.6 -18.7 -14.0 -9.6 -9.6 -11.1 -12.5 -13.1 -13.7 -14.2
percent of GDP -5.9 -5.3 -4.4 -3.3 -3.0 -3.4 -3.7 -3.7 -3.8 -3.8
Overall balance 0.1 0.4 -0.2 0.9 0.0 0.0 0.0 0.0 0.0 0.0
Gross reserves (billions of U.S. dollars) 49.6 49.1 45.8 47.4 47.4 47.4 47.4 47.4 47.4 47.4
percent of short-term debt (residual maturity) 125.9 100.5 106.9 104.4 101.3 93.3 82.4 85.4 83.8 81.3
Total external debt 37.2 41.3 39.1 48.5 45.2 46.2 47.0 47.6 48.1 49.0
Sources: Haver, South African National Treasury, World Bank, and Fund staff estimates and projections.
1/ Consolidated government unless otherwise indicated.
2/ National government.
Balance of payments (percent of GDP unless otherwise indicated)
Unemployment rate (percent of labor force, annual average)
Savings and Investment (percent of GDP)
Fiscal position (percent of GDP) 1/
National income and prices (annual percentage change)
Labor market (annual percentage change)

SOUTH AFRICA
INTERNATIONAL MONETARY FUND 41
Table 7. South Africa: Indicators of External Vulnerability, 2012–17
2012 2013 2014 2015 2016 2017
Proj.
Financial indicators
Gross government debt (percent of GDP) 41.0 44.1 47.0 49.3 51.7 52.6
Broad money (annual percentage change) 5.2 5.9 7.3 10.3 6.1 6.8
Private sector credit (annual percentage change) 9.3 6.6 7.2 8.3 5.6 5.0
91 day Treasury bill yield (percent, end-period) 1/ 5.3 5.1 5.8 6.1 7.2 7.4
91 day Treasury bill yield (real, percent, end-period) 1/ 2/ -0.4 -0.7 -0.3 1.5 0.6 2.1
External indicators
Exports (annual percentage change in U.S. dollars) -8.4 -3.8 -3.9 -12.2 -7.8 6.3
Export volume (goods and services, annual percentage change) 0.8 3.6 3.2 3.9 -0.1 1.9
Imports (annual percentage change in U.S. dollars) 2.1 -0.6 -5.2 -14.4 -12.2 4.5
Import volume (goods and services, annual percentage change) 4.2 5.0 -0.5 5.4 -3.7 0.9
Terms of trade (annual percentage change) 3/ -4.0 -1.4 -1.6 3.4 0.3 0.3
Current account balance (percent of GDP) -5.1 -5.9 -5.3 -4.4 -3.3 -3.0
Capital and financial account, excl. financial derivatives (percent of GDP) 6.0 5.0 6.5 4.7 5.0 3.0
of which: Net portfolio investment (debt and equity) 3.5 3.0 3.8 3.0 5.9 3.0
Other investment (loans, trade credits, etc.) 2.2 1.5 3.2 2.9 -0.5 0.4
Net foreign direct investment 0.4 0.5 -0.5 -1.3 -0.4 -0.4
Gross international reserves (billions of U.S. dollars) 1/ 50.7 49.6 49.1 45.8 47.4 46.7
in months of prospective imports of goods and services 5.0 5.1 5.9 6.2 6.1 5.8
in percent of broad money 18.2 20.7 21.1 24.0 20.5 20.6
in percent of short-term debt, residual maturity 112.3 125.9 100.5 106.9 104.4 99.9
Net international reserves (billions of U.S. dollars) 1/ 47.9 45.5 42.7 40.7 40.8 41.7
Foreign currency forward position (billions of U.S. dollars) 1/ 5.2 3.6 2.0 1.4 1.8 2.9
Total external debt (percent of GDP) 35.8 37.2 41.3 39.1 48.5 45.2
percent of export earnings 114.6 113.8 132.4 128.7 159.8 151.2
External interest payments (percent of export earnings) 4.4 4.9 5.2 6.9 6.3 7.4
External amortization payments (percent of export earnings) 29.4 39.9 36.0 50.7 47.9 47.7
Exchange rate (Rand/U.S. dollar, period average) 4/ 8.2 9.7 10.8 12.8 14.7 13.3
Real effective exchange rate (annual percentage change, period average) -5.4 -10.5 -6.3 -0.6 -7.3 n.a.
Financial market indicators
Stock market index (end-period) 1/ 39,250 46,256 49,771 50,694 50,654 53,817
Net purchases of bonds by nonresidents (billions of U.S. dollars) 10.4 0.1 -5.1 -2.3 -2.4 n.a.
Net purchases of shares by nonresidents (billions of U.S. dollars) -0.4 0.0 1.2 -0.3 -8.2 n.a.
Sources: Haver and IMF staff calculations.
1/ For 2017, April data.
2/ Nominal yield deflated by current CPI inflation.
3/ The terms of trade include gold.
4/ For 2017, average of January-April data.

An
nex I. E
xte
rnal S
ecto
r Asse
ssmen
t
South Africa Overall Assessment Foreign asset
and liability
position and
trajectory
Background. South Africa’s economy is highly integrated in international financial markets, with large
external assets and liabilities. Although valuation effects led to a marked improvement of the net
international investment position (NIIP) in 2015 (from -8 percent of GDP at end-2014 to 16 percent of GDP
one year later), this has since moderated, with the NIIP at 3.6 percent of GDP as of end-2016. The IIP is
expected to weaken further over the medium term on account of current account deficits.1/ External assets
and liabilities were equivalent to 131 and 128 percent of GDP, respectively. For FDI (usually considered
harder to liquidate), liabilities were lower than assets (43 and 55 percent of GDP, respectively), owing to
valuation gains on FDI assets in China. Gross external debt rose to 48.5 percent of GDP at end-2016 from 26
percent of GDP at end-2008 on the back of an increase in long-term debt. Short-term external debt
(residual maturity) amounted to 15½ percent of GDP.
Assessment. Large gross external liabilities pose risks. Mitigating factors include the large external asset
position and the sizable rand-denominated share of external debt (about half of total external debt).
Overall Assessment:
The external position in 2016 was moderately weaker than implied by fundamentals and desirable policy settings.
In 2016, the current account gap remained broadly unchanged and South Africa remains highly reliant on non-FDI flows to finance its relatively high CA deficit. Despite the REER depreciation of recent years, structural rigidities result in a relatively slow pace of CA adjustment as well as a somewhat narrower estimated CA deficit norm than would be expected for an emerging economy.
Potential policy responses:
Several measures would help to reduce the gap related to the external position by speeding up the pace of external adjustment, improving competitiveness, and increasing employment and savings. These measures include fostering entry into key product markets (such as power generation, transportation, and telecommunications); upgrades in infrastructure and education/skills; and greater financial inclusion. Reducing policy uncertainty, preserving government debt sustainability, and accelerating labor and product market reforms are also essential to continue to attract foreign inflows, especially durable inflows such as FDI. Seizing opportunities—such as large FDI inflow transactions—to build up reserves would strengthen the country’s ability to deal with FX liquidity shocks.
Current account Background. The current account (CA) deficit narrowed to 3.3 percent of GDP in 2016 from 4.4 percent in
2015, owing to an improvement in the trade balance as domestic demand growth weakened. The CA deficit
is projected to further narrow to 3 percent of GDP in 2017 as the trade balance strengthens.
Assessment. The CA regression model estimates a CA norm of -0.8 percent of GDP, implying a CA gap of
-2.4 percent of GDP for 2016. The CA gap is largely explained by structural factors not captured by the
model. The ES approach estimates an NFA-stabilizing CA of -1.4 percent of GDP and a CA gap of
-2.2 percent of GDP. Staff assesses the overall CA gap to be somewhat narrower, because (i) policy
uncertainty is expected to unwind after key elections and (ii) net transfers to other members of the
Southern African Customs Union (SACU) (not accounted for in the regression analysis) reduce the CA
balance. Combined with estimation uncertainty, staff assesses the cyclically adjusted CA to be
½–2½ percentage points of GDP weaker than implied by fundamentals and medium-term desirable policy
settings—broadly as assessed in 2015.2/
Real exchange
rate
Background. The CPI-REER depreciated by 7 percent on average in 2016 relative to 2015. However, as of
March 2017, the REER had appreciated 19 percent relative to the 2016 average.
Assessment. The REER is assessed through two REER-based regressions and by computing the implied
REER gap from the CA gaps. Based on the 2016 REER-average, the REER approaches point to
undervaluation of between 13 percent (level approach) and 29 percent (index approach). However, as
gauging the appropriate REER for South Africa is challenging, owing to its structural changes since 1994,
staff’s assessment puts much greater weight on the CA approaches, while acknowledging the results of the
REER approaches. For the CA approaches, the estimated CA/REER elasticity applied to the CA gap range
above points to overvaluation of between 2 and 9 percent.3/ Combining all these methods, staff assesses a
REER overvaluation of 0–10 percent for 2016, broadly consistent with the CA gap.4/
42
IN
TER
NA
TIO
NA
L M
ON
ETA
RY
FU
ND
SO
UTH
AFR
ICA

Capital and
financial
accounts:
flows and
policy
measures
Background. Net FDI flows were less negative at -0.4 percent of GDP in 2016, down from -1.3 percent of GDP
in 2015. Portfolio investment picked up markedly to 5.9 percent of GDP, financing the CA deficit. Gross
external financing needs stood at 18 percent of GDP in 2016.
Assessment. High reliance on non-FDI flows and high nonresident holdings of local financial assets pose
risks. These are mitigated by a floating exchange rate, the fact that nonresident portfolio holdings are mainly
denominated in local currency, and a large domestic institutional investor base.
FX intervention
and reserves
level
Background. South Africa has a floating exchange rate regime. Foreign exchange intervention is rare. Reserves
cover six months of imports but are below the IMF’s composite adequacy metric (77 percent of the metric
without considering capital flow management measures and 84 percent of the metric after considering them).
Assessment. As conditions allow, reserve accumulation is desirable to strengthen the external liquidity buffer,
subject to maintaining the primacy of the inflation objective.
Technical
Background
Notes
1/ Of the 128 percent of GDP in total external liabilities as of end-2016, 51 percent were portfolio investment liabilities, 34 percent were direct investments, and the
remaining 15 percent were financial derivatives and other investments. Total external assets amounted to 131 percent of GDP as of end-2016, of which 42 percent
were direct investments, 36 percent were portfolio investment assets, 11 percent were reserve assets, and the remaining 11 percent were financial derivatives and
other investment assets. 2/ The CA gap presented here results from the CA regression and External Sustainability (ES) approaches as well as staff’s judgment.
Net current transfers related to the Southern African Customs Union (SACU), which are assessed to have a net negative impact on the CA, are not accounted
for in the regression model and therefore warrant an adjustment of the estimated CA cap. In addition, 0.3 percentage points of GDP of the improvements in
the CA norm since 2014 are attributable to a worsening of the indicator of perceived political uncertainty and institutional quality, which is assessed to be
temporary, and is expected to unwind following the December 2017 elections. In sum, and considering also the uncertainty surrounding the estimated norm
(standard deviation of 0.9 percent of GDP), staff believes the regression-based CA gap is smaller than what the model suggests.
The ES approach compares the CA balance expected to prevail in the medium term with the one that would stabilize South Africa’s stock of net foreign assets
at its EM peers’ benchmark (-35 percent of GDP). According to this approach, to stabilize South Africa’s net IIP at this level, South Africa’s CA deficit would
need to be -1.4 percent of GDP, compared to staff’s medium-term projection of a CA deficit of below 4 percent of GDP, thus resulting in a CA gap of -2.2
percent of GDP.
Overall, while the model-based CA gaps for 2016 range from -2.2 to -2.4 percent of GDP, staff believes the CA gap is somewhat smaller at between ½ and 2½
percentage points of GDP. 3/ The EBA REER regressions (which use the CPI-based REER) point to undervaluation for 2016. However, gauging the appropriate REER for South Africa is
challenging as the pre-2000 average REER was at a more appreciated level than the post-2000 average. In this context, REER regression-based models are likely to
point to undervaluation, unless they can link the full downward trend of the REER to deteriorating fundamentals. In addition, it appears that the level of the REER
that is consistent with a given level of the current account has declined over time but that empirical models are unable to fully explain this shift. Other indicators,
including the EBA CA regression model and South Africa’s declining share in world exports, suggest overvaluation. 4/ Using staff’s assessment of the CA gap range and applying a long-run elasticity estimate of 0.27 would suggest a REER overvaluation of 2–9 percent. However,
considering the uncertainty regarding the estimates as well as the REER-regression results, staff assesses REER overvaluation in the order of 0–10 percent.
INTER
NA
TIO
NA
L M
ON
ETA
RY
FU
ND
4
3
SO
UTH
AFR
ICA

SOUTH AFRICA
44 INTERNATIONAL MONETARY FUND
Annex II. Financial Inclusion—Falling Short Despite Deep
Financial Markets
1. South Africa has deep and sophisticated financial
markets. The nation performs well on financial development
among emerging markets (EMs). For instance, South Africa
compares well to BRICs and other selected EMs in terms of
bank account ownership and mobile payment.
2. However, inequalities in financial access are
significant. EMs with lower levels of financial development
attain better outcomes in financial inclusion. In South Africa,
only about 60 percent of the lowest quintile have bank
accounts compared to over 80 percent among the top
quintile. Moreover, most of the poor households’ access
is limited to withdrawing cash from social grants
accounts, which cover 17 million recipients (1/3 of total
population), with little usage of other banking services
such as savings or loans. This somewhat reflects the
“dual” nature of the economy, where the richest have
incomes close to OECD levels, while the poorest are
closer to other sub-Saharan African countries.
3. Other indicators of financial inclusion on
access to credit confirm that South Africa lags
behind many EM peers. South Africa generally
ranked low on access to credit by households and
SMEs relative to 25 EM peers.1 Last year, only 4
percent of households in the poorest 40 percent
bracket borrowed from financial institutions in
South Africa, less than one half of the average for
25 EM peers of 11 percent. However, the share is
significantly higher when lending by small credit
providers under light supervision2 is included.
Moreover, some of the development finance
institutions lend to the poor. Only 9 percent of
SMEs had outstanding credit, significantly below
the average for the EM peers of 30 percent. Most traditional lenders typically cite high costs of
administration, perceptions of higher risks, and lack of collateral as major impediments to providing
1 http://databank.worldbank.org/data/reports.aspx?source=g20-basic-set-of-financial-inclusion-indicators#
2 These credit providers are regulated for market conduct only by the National Credit Regulator.
South Africa
0
0.1
0.2
0.3
0.4
0.5
0.6
0.7
0.8
0.9
0 0.1 0.2 0.3 0.4 0.5 0.6 0.7 0.8 0.9 1
Fin
an
cia
l In
clu
sio
n In
dex 2
014
Financial Development Index 2013
Financial Inclusion vs. Financial
Development
Source: World Bank FINDEX, IMF Staff Estimates
0
10
20
30
40
50
60
70
80
South Africa BRICS Selected MICs
Percentage of Population (age 15 & above): With
an Account at a financial institution
Account Saved at a financial institution Borrowed from a financial institution
0
0.1
0.2
0.3
0.4
0.5
0.6
0.7
0.8
0.9
Poorest 20% Second 20% Middle 20% Fourth 20% Richest 20%
Account Ownership: By Income Quintile and Gender
Male Female BRICS Selected MICs

SOUTH AFRICA
INTERNATIONAL MONETARY FUND 45
small-scale lending. It appears that the relatively sophisticated financial infrastructure in terms of
bank account ownership and mobile payments was not fully utilized to improve financial inclusion.
4. Greater financial inclusion has the potential to boost growth, support job creation, and
reduce income inequality. In OECD economies, SMEs and micro enterprises account for 55 percent
of GDP, 60–70 percent of employment, and a sizable share of new jobs.3 In EMs, SMEs account for
most of formal jobs and the creation of 4 out of 5 new formal positions. However, approximately
70 percent of all SMEs in EMs lack access to credit.4 Several studies have found that greater access
of firms and households to various banking services or the lifting of their financial constraints lead
to higher economic growth.5 They also caution that access to credit should be expanded with proper
supervision to safeguard financial stability.
5. Limited financial inclusion in South Africa reflects both demand-side and supply-side
constraints.6 On the demand side, low households’ access to credit stems in part from high
unemployment, at 27.7 percent in the first quarter of 2017. On the supply side, high costs of
opening and maintaining bank accounts are key impediments compared to other BRICS. The four
largest banks control four-fifths of the market and are highly profitable. Incentives for them to
service low-margin, high-risk customers, such as low-income households and SMEs, are limited. The
sophisticated nature of banking operations in South Africa involves costly structures for compliance
and decision-making, typically geared to more affluent segments of the population. Banks adapting
best to the tighter compliance regulations, through targeted changes to the operating models and
processes, would benefit from higher quality of oversight and efficiency. However, rules based
customer due diligence requirements and associated high fees make banking typically inaccessible
to most lower-income households.7 Finally, the legacy of apartheid has meant high travel costs for
the poorest to access banking facilities.
6. Further efforts are needed to improve access to financial services for households and
SMEs.
Exploit credit information technology. This area represents a major opportunity to expand
financial inclusion for SMEs, especially by encouraging small savings and loans8 and facilitating
3 “Small Businesses, Job Creation, and Growth: Facts, Obstacles, and Best Practices” OECD (2009).
4 World Bank. 2015. “Small and Medium Enterprises Finance.”
5 Sahay, R., M. Čihák, P. N’Diaye, A. Barajas, S. Mitra, A. Kyobe, Y. N. Mooi, and S. R. Yousefi. 2015. “Financial Inclusion:
Can It Meet Multiple Macroeconomic Goals?” Staff Discussion Note 15/17. Dabla-Norris, E., R. Townsend, and D.F.
Unsal. 2015. “Identifying Constraints to Financial Inclusion and their Impact on GDP and Inequality: A Structural
Framework for Policy.” IMF Working Paper 15/22.
6 World Bank. 2013. “South Africa Economic Update: Focus on Financial Inclusion.”
7 An exemption has lowered regulatory costs for small value (“Mzansi”) accounts.
8 The Kenyan experience has shown that, with appropriate technology, costs of servicing the poor can be reduced,
rendering this market accessible (Mlachila and others. 2016. Financial Development in sub-Saharan Africa: Promoting
Inclusive and Sustainable Growth, African Departmental Paper 16/5, IMF; EIB. 2016. “Banking in sub-Saharan Africa—
Recent Trends and Digital Financial Inclusion”).

SOUTH AFRICA
46 INTERNATIONAL MONETARY FUND
the establishment of SME credit bureaus. Particular care should be taken to avoid subsidizing
unproductive SMEs. South Africa fares comparatively better than other MICs and BRICs with
regards to the share of the population with banking accounts, but these are often used just to
receive social grants. It would be important to leverage the opportunity provided by that
existing infrastructure to provide additional financial services to the poorer segments of the
population.
Encourage entry of new banks. The planned entry of new banks should increase competition
and foster financial inclusion. The granting of provisional licenses to three banks—including the
PostBank, which has a large country-wide network of offices—could increase access to financial
services, especially by the rural poor. That said, high capital requirements (R250 million, about
US$20 million) for opening a deposit-taking institution have constrained their development.
Microfinance, an underdeveloped segment of the domestic financial sector, is another area that
may present opportunities.
Develop a separate framework for “Tier II” banks that service SMEs. There are no other
licenses that would allow smaller deposit-taking institutions, potentially focusing on SME
lending. Cooperative and mutual banks licenses are not suitable because of specific governance
structure requirements. The authorities are analyzing possible ways of moving toward a tiered
banking system allowing for mid-sized banks with proportionally less stringent regulatory
requirements.
7. Efforts to enhance access to credit should be accompanied by measures to safeguard
financial stability. Better financial education can help borrowers choose suitable financial products
and avoid paying excessive fees and interest rates. Low income households tend to be less indebted
than the wealthier segment, which enjoys easier access to credit. However, the bankruptcy of African
Bank from its unsecured lending to low income customers highlights that the authorities should
remain vigilant and continue efforts to strengthen the regulatory and supervisory frameworks.
Establishment of the Financial Sector Conduct Authority following the enactment of the Financial
Sector Regulation (FSR) Bill will provide an opportunity to close regulatory gaps on conduct
supervision.

SOUTH AFRICA
INTERNATIONAL MONETARY FUND 47
Figure A2.1. Financial Inclusion Compared to its 25 EM peers, South Africa ranks slightly
better in terms of account ownership and mobile payment.
Prevalence of loans (per 1,000 adults) in South Africa is in line
with income per capita.
But South Africa ranks low in credit access for low-income
households and SMEs. Fewer bank branches per 100,000 residents in South Africa.
Household credit access is below EM average. SMEs have low access to credit.
0
20
40
60
80
Bank Account
Ownership (%)
ATMs per 100,000
adults
Borrowed from a
financial institution
in the past year (% )
Made mobile
payment (% )
Saved at a financial
institution (%)
Indicator of bank account ownership
South Africa Average of 25 EMs
-15
10
35
60
85
Account Ownership,
poorest 40%
Borrowed from a
financial institution
in the past year,
poorest 40%
Made mobile
payment, poorest
40%
SMEs with an
account at a formal
financial institution
(%)
SMEs with an
outstanding credit
(%)
Indicator of credit access for SMEs and low-
income households
South Africa Average of 25 EMs
0
5
10
15
20
25
30
35
40
Alg
eri
a
Ind
ia
Ukra
ine
Arg
en
tin
a
Hu
ngary
Ch
ina
Ru
ssia
Mexi
co
Peru
Ph
ilip
pin
es
Ro
man
ia
Bra
zil
So
uth
Afr
ica
Ind
onesi
a
Bulg
ari
a
Ave
rag
e
Kenya
Th
aila
nd
Co
lom
bia
Sri
Lanka
Vie
tnam
Po
lan
d
Mala
ysia
Tu
rkey
Uru
gu
ay
Mo
ng
olia
Indicator of credit access for household
Borrowed from a financial institution in the past year (% age 15+)
Borrowed from a financial institution in the past year, income, poorest 40%
(% age 15+)
0
5
10
15
20
25
30
35
40
South Africa Brazil India Mexico U.K. U.S.
Bank Branch per 100,000
0
20
40
60
80
100
120
So
uth
Afr
ica
Ro
man
ia
Vie
tnam
Ind
onesi
a
Tu
rkey
Ave
rag
e
Ind
ia
Hu
ngary
Ukra
ine
Sri
Lanka
Po
lan
d
Kenya
Ph
ilip
pin
es
Mo
ng
olia
Ch
ina
Bulg
ari
a
Ru
ssia
SME credit access
SMEs with an account at a formal financial institution (%)
SMEs with an outstanding loan or line of credit (%)
Algeria
Romania
Argentina
Peru
Hungary
Bulgaria
Indonesia
Colombia
South Africa
Malaysia
Thailand
India
Mongolia
-
2,000
4,000
6,000
8,000
10,000
12,000
0 100 200 300 400 500 600 700 800
Inco
me p
er c
ap
ita 2
014
people with outstanding loan per 1,000
Income per capita and adults with outstanding
loan, per 1,000 adults

SOUTH AFRICA
48 INTERNATIONAL MONETARY FUND
Annex III. Exchange Rate Pass-through to Core Inflation
in South Africa
1. Exchange rate pass-through to core
inflation in South Africa seems to have
moderated in recent years. The impact of
nominal effective exchange rate (NEER)
depreciation (red line, top chart) on core
inflation (broken blue line) may have weakened
during the 2010s as the two variables co-
moved to a lesser extent than in earlier years.
Disinflation of producer prices in countries
from which South Africa imports goods and
services (green line) could have played some
role.
2. Two approaches were used to
estimate long-run exchange-rate pass-
through (LRERPT). The error-correction
approach (ECM, model A) was estimated
drawing on recent studies on Kabundi and
Mbelu (2016) and IMF (2016).1 However,
diagnostic tests for co-integration amongst
included variables, a key assumption
underpinning ECM, yielded mixed results.
Therefore, a model in first differences and
without implied co-integration constraints
(model B) was also estimated, drawing on BIS
(2016).2 In both models, core inflation from
2002Q1 to 2016Q4 was regressed on NEER,
while controlling for producer prices in foreign
countries and domestic unit labor costs.3
3. LRERPT in the past few years was 10–15 percent. When estimated recursively with 10-
year rolling windows, both models yielded similar LRERPT for the past few years of 10–15 percent.
1 Kabundi A. and A. Mbelu. 2016. “Has the Exchange Rate Pass Through Changed in South Africa?”, SARB Working
Paper 2016/10; IMF. 2016. Box 5. Exchange Rate Pass-Through to Consumer Price Inflation, in IMF Country Report
16/217.
2 BIS. 2016. “Exchange rate pass through: What has changed since the crisis?” Working Paper 583. In this model,
LRERPT is the sum of coefficients on lagged NEER depreciation (4 lags) divided by 1 minus the coefficient on lagged
core inflation.
3 NEER and foreign producer price inflation were import-weighted. In model B, data were in quarter-on-quarter
percent changes.
Source: IMF staff estimates.
Long-run ERPT to core inflation
(percent)
0
5
10
15
20
25
30
12 13 14 15 16
Model A
Model B
Source: Haver.
Core inflation, foreign price inflation, and NEER
depreciation (percent)
-10
-5
0
5
10
03 05 07 09 11 13 15
-40
-20
0
20
40
NEER depreciation (right)
Core inflation
Foreign price inflation, trade weighted

SOUTH AFRICA
INTERNATIONAL MONETARY FUND 49
However, results differed for earlier years. Using model A, LRERPT was stable, at 10 percent. Using
model B, LRERPT was 25 percent through 2013, but subsequently fell to 10 percent when
observations in 2003–04 dropped out of the sample.
4. Our results are comparable to those attained by previous studies that used similar
approaches. LRERPT using model A was similar to those in Kabundi and Mbelu (2016) and IMF
(2016). Our estimates were lower because a different measure of core inflation, shorter but publicly
available, was used. LRERPT using model B was broadly consistent with that in BIS (2016) estimated
for a panel of emerging economies.
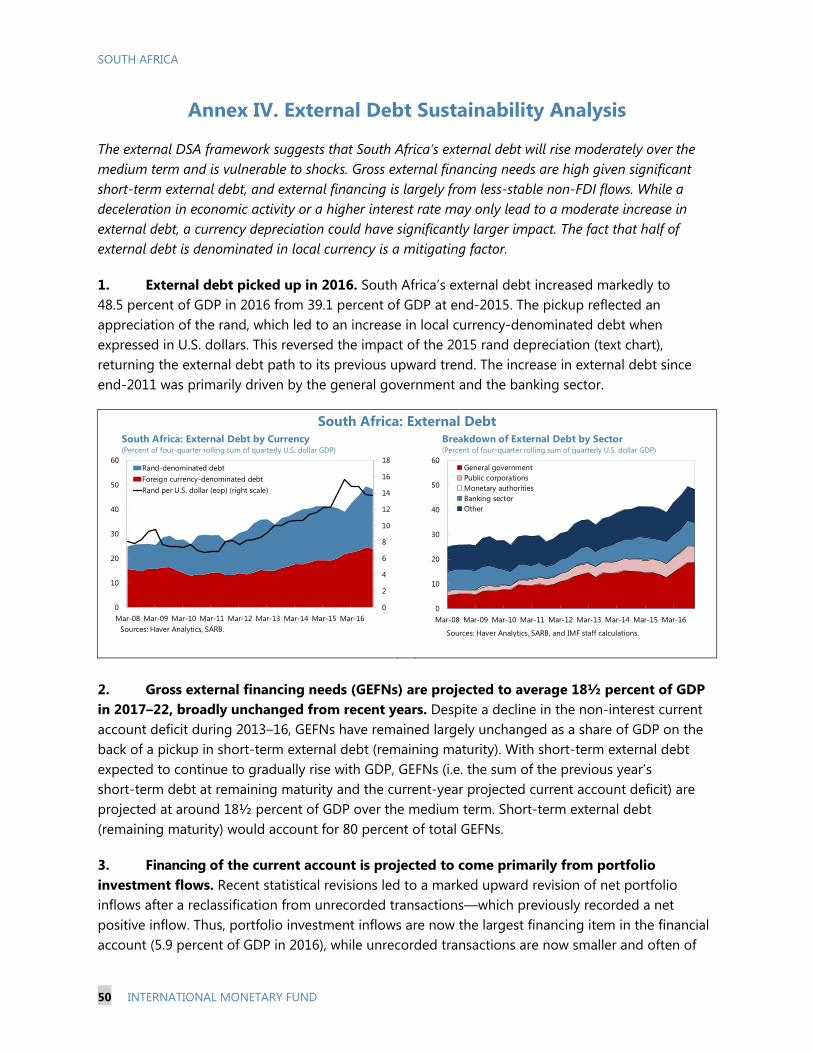
SOUTH AFRICA
50 INTERNATIONAL MONETARY FUND
Annex IV. External Debt Sustainability Analysis
The external DSA framework suggests that South Africa’s external debt will rise moderately over the
medium term and is vulnerable to shocks. Gross external financing needs are high given significant
short-term external debt, and external financing is largely from less-stable non-FDI flows. While a
deceleration in economic activity or a higher interest rate may only lead to a moderate increase in
external debt, a currency depreciation could have significantly larger impact. The fact that half of
external debt is denominated in local currency is a mitigating factor.
1. External debt picked up in 2016. South Africa’s external debt increased markedly to
48.5 percent of GDP in 2016 from 39.1 percent of GDP at end-2015. The pickup reflected an
appreciation of the rand, which led to an increase in local currency-denominated debt when
expressed in U.S. dollars. This reversed the impact of the 2015 rand depreciation (text chart),
returning the external debt path to its previous upward trend. The increase in external debt since
end-2011 was primarily driven by the general government and the banking sector.
South Africa: External Debt
2. Gross external financing needs (GEFNs) are projected to average 18½ percent of GDP
in 2017–22, broadly unchanged from recent years. Despite a decline in the non-interest current
account deficit during 2013–16, GEFNs have remained largely unchanged as a share of GDP on the
back of a pickup in short-term external debt (remaining maturity). With short-term external debt
expected to continue to gradually rise with GDP, GEFNs (i.e. the sum of the previous year’s
short-term debt at remaining maturity and the current-year projected current account deficit) are
projected at around 18½ percent of GDP over the medium term. Short-term external debt
(remaining maturity) would account for 80 percent of total GEFNs.
3. Financing of the current account is projected to come primarily from portfolio
investment flows. Recent statistical revisions led to a marked upward revision of net portfolio
inflows after a reclassification from unrecorded transactions—which previously recorded a net
positive inflow. Thus, portfolio investment inflows are now the largest financing item in the financial
account (5.9 percent of GDP in 2016), while unrecorded transactions are now smaller and often of
0
2
4
6
8
10
12
14
16
18
0
10
20
30
40
50
60
Mar-08 Mar-09 Mar-10 Mar-11 Mar-12 Mar-13 Mar-14 Mar-15 Mar-16
Rand-denominated debt
Foreign currency-denominated debt
Rand per U.S. dollar (eop) (right scale)
South Africa: External Debt by Currency(Percent of four-quarter rolling sum of quarterly U.S. dollar GDP)
Sources: Haver Analytics, SARB.
0
10
20
30
40
50
60
Mar-08 Mar-09 Mar-10 Mar-11 Mar-12 Mar-13 Mar-14 Mar-15 Mar-16
General government
Public corporations
Monetary authorities
Banking sector
Other
Breakdown of External Debt by Sector(Percent of four-quarter rolling sum of quarterly U.S. dollar GDP)
Sources: Haver Analytics, SARB, and IMF staff calculations.

SOUTH AFRICA
INTERNATIONAL MONETARY FUND 51
the reverse sign (-0.5 percent of GDP in 2016). With net FDI inflows projected to remain negative or
very low during the projection period, net portfolio investment is expected to continue to provide
the bulk of financing, combined with net other investment inflows (primarily bank loans), which in
recent years have been as large as 3 percent of GDP (Table 3).
4. Rising external debt and sizable GEFNs would keep South Africa’s external
vulnerabilities elevated. External debt is projected to reach 49 percent of GDP by 2022. The debt-
stabilizing non-interest current account deficit is estimated at 1.6 percent of GDP (Table 1 of this
annex). Stress tests indicate that a 30 percent currency depreciation could push external debt above
60 percent of GDP. Other standard shocks simulated in the external debt sustainability analysis—
such as a widening of the non-interest current account deficit, a deceleration in real GDP growth,
and a rise in the interest rate—would lead to moderate increases in external debt. These shocks
would be mitigated by the high share of rand-denominated external debt (about half of external
debt is denominated in rand).

Table A4.1. South Africa: External Debt Sustainability Framework, 2012–22
(Percent of GDP, unless otherwise indicated)
2012 2013 2014 2015 2016 2017 2018 2019 2020 2021 2022 Debt-stabilizing
non-interest
current account 6/
1 Baseline: External debt 35.8 37.2 41.3 39.1 48.5 45.2 46.2 47.0 47.6 48.1 49.0 -1.6
2 Change in external debt 7.4 1.4 4.1 -2.2 9.4 -3.2 0.9 0.9 0.5 0.5 0.9
3 Identified external debt-creating flows (4+8+9) 2.4 2.6 1.5 2.5 3.0 1.8 2.2 2.2 2.0 2.0 2.0
4 Current account deficit, excluding interest payments 4.0 4.8 4.0 2.7 1.7 1.2 1.6 1.9 1.9 1.9 1.9
5 Deficit in balance of goods and services 1.5 2.4 1.7 1.1 -0.1 -0.5 -0.1 0.3 0.3 0.3 0.3
6 Exports 29.7 30.9 31.2 30.4 30.3 29.9 29.6 29.5 29.4 29.5 29.7
7 Imports 31.2 33.3 32.9 31.5 30.2 29.4 29.6 29.7 29.7 29.8 30.0
8 Net non-debt creating capital inflows (negative) -2.2 -2.7 -3.0 -2.5 -0.7 -0.7 -0.7 -0.7 -0.7 -0.7 -0.7
9 Automatic debt dynamics 1/ 0.7 0.6 0.5 2.3 2.0 1.4 1.3 1.0 0.8 0.8 0.8
10 Contribution from nominal interest rate 1.1 1.1 1.3 1.7 1.6 1.8 1.8 1.8 1.8 1.8 1.9
11 Contribution from real GDP growth -0.7 -1.0 -0.7 -0.6 -0.1 -0.5 -0.5 -0.8 -1.0 -1.0 -1.0
12 Contribution from price and exchange rate changes 2/ 0.2 0.4 -0.1 1.2 0.6 ... ... ... ... ... ...
13 Residual, incl. change in gross foreign assets (2-3) 3/ 5.0 -1.2 2.6 -4.7 6.4 -5.1 -1.2 -1.4 -1.5 -1.5 -1.1
External debt-to-exports ratio (in percent) 120.4 120.5 132.4 128.7 159.8 151.2 155.9 159.7 161.7 162.8 164.7
Gross external financing need (in billions of US dollars) 4/ 54.9 66.8 58.0 62.8 52.5 54.9 57.8 63.3 70.5 69.1 70.7
in percent of GDP 13.9 18.2 16.5 19.8 17.8 17.3 17.8 18.8 20.1 19.0 18.8
Scenario with key variables at their historical averages 5/ 45.2 46.6 47.9 49.2 50.4 52.0 -2.0
Key Macroeconomic Assumptions Underlying Baseline
Real GDP growth (in percent) 2.2 2.5 1.7 1.3 0.3 1.0 1.2 1.7 2.2 2.2 2.2
GDP deflator in US dollars (change in percent) -7.0 -9.7 -5.9 -10.7 -7.4 6.6 1.4 1.7 1.8 1.6 1.4
Nominal external interest rate (in percent) 3.8 2.9 3.4 3.7 3.7 4.0 4.0 4.0 4.0 4.0 4.0
Growth of exports (US dollar terms, in percent) -7.2 -3.9 -3.3 -12.0 -7.3 6.2 1.5 2.9 3.8 4.2 4.4
Growth of imports (US dollar terms, in percent) 0.0 -1.2 -5.2 -13.6 -11.0 4.9 3.1 4.0 4.0 4.2 4.4
Current account balance, excluding interest payments -4.0 -4.8 -4.0 -2.7 -1.7 -1.2 -1.6 -1.9 -1.9 -1.9 -1.9
Net non-debt creating capital inflows 2.2 2.7 3.0 2.5 0.7 0.7 0.7 0.7 0.7 0.7 0.7
2/ The contribution from price and exchange rate changes is defined as [-r(1+g) + ea(1+r)]/(1+g+r+gr) times previous period debt stock. r increases with an appreciating domestic currency (e > 0) and rising inflation.
3/ For projection, line includes the impact of price and exchange rate changes.
4/ Defined as current account deficit, plus amortization on medium- and long-term debt, plus short-term debt at end of previous period.
5/ The key variables include real GDP growth; nominal interest rate; dollar deflator growth; and both non-interest current account and non-debt inflows in percent of GDP.
6/ Long-run, constant balance that stabilizes the debt ratio assuming that key variables (real GDP growth, nominal interest rate, dollar deflator growth, and non-debt inflows in percent of GDP) remain at their levels
of the last projection year.
1/ Derived as [r - g - k(1+g) + ea(1+r)]/(1+g+r+gr) times previous period debt stock, with r = nominal effective interest rate on external debt; k = change in domestic GDP deflator in US dollar terms, g = real GDP
growth rate, e = nominal appreciation (increase in dollar value of domestic currency), and a = share of domestic-currency denominated debt in total external debt.
Projections
52
IN
TER
NA
TIO
NA
L M
ON
ETA
RY
FU
ND
SO
UTH
AFR
ICA
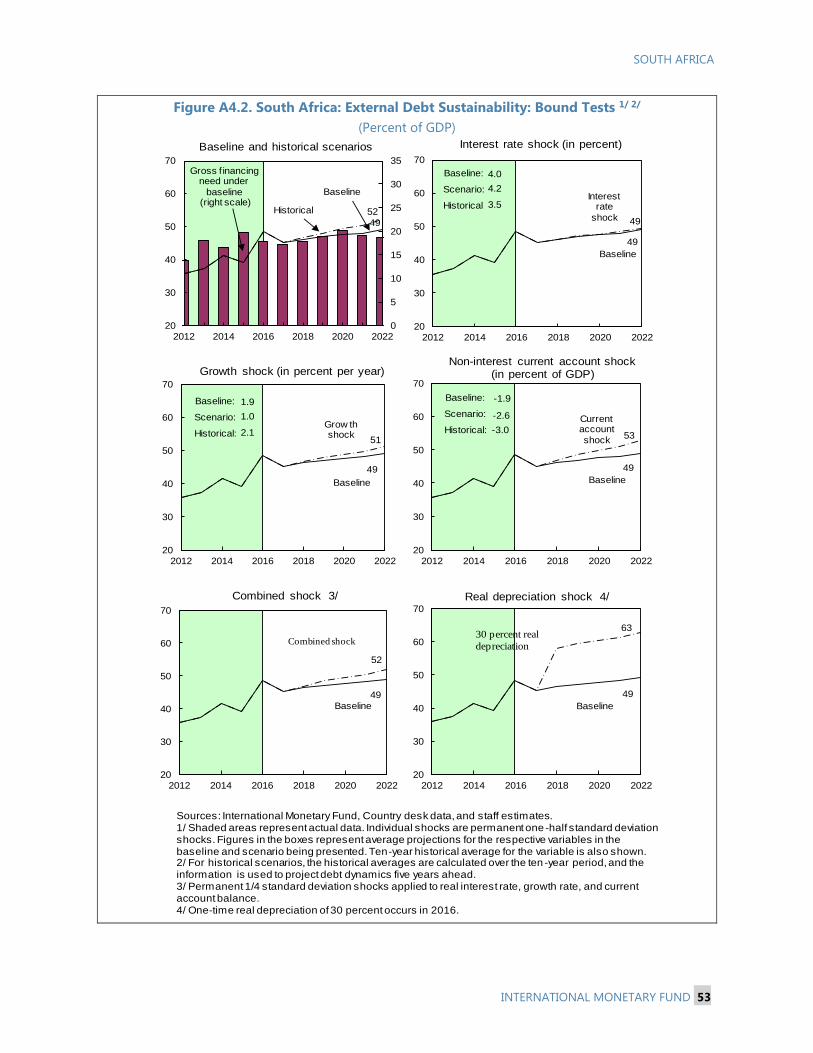
SOUTH AFRICA
INTERNATIONAL MONETARY FUND 53
Figure A4.2. South Africa: External Debt Sustainability: Bound Tests 1/ 2/
(Percent of GDP)
Interest rate
shock 49
Baseline
49
20
30
40
50
60
70
2012 2014 2016 2018 2020 2022
Interest rate shock (in percent)
Sources: International Monetary Fund, Country desk data, and staff estimates.1/ Shaded areas represent actual data. Individual shocks are permanent one -half standard deviation shocks. Figures in the boxes represent average projections for the respective variables in the baseline and scenario being presented. Ten-year historical average for the variable is also shown. 2/ For historical scenarios, the historical averages are calculated over the ten -year period, and the information is used to project debt dynamics five years ahead.3/ Permanent 1/4 standard deviation shocks applied to real interest rate, growth rate, and current account balance.4/ One-time real depreciation of 30 percent occurs in 2016.
Historical 52
Baseline
49
0
5
10
15
20
25
30
35
20
30
40
50
60
70
2012 2014 2016 2018 2020 2022
Baseline and historical scenarios
Current account
shock 53
Baseline
49
20
30
40
50
60
70
2012 2014 2016 2018 2020 2022
52
Baseline
49
20
30
40
50
60
70
2012 2014 2016 2018 2020 2022
Combined shock 3/
Combined shock
63
Baseline
49
20
30
40
50
60
70
2012 2014 2016 2018 2020 2022
Real depreciation shock 4/
30 percent real
depreciation
Gross f inancing need under
baseline(right scale)
Non-interest current account shock (in percent of GDP)
Grow th shock
51
Baseline
49
20
30
40
50
60
70
2012 2014 2016 2018 2020 2022
Growth shock (in percent per year)
Baseline:
Scenario:
Historical
4.0
4.2
3.5
Baseline:
Scenario:
Historical:
1.9
1.0
2.1
Baseline:
Scenario:
Historical:
-1.9
-2.6
-3.0
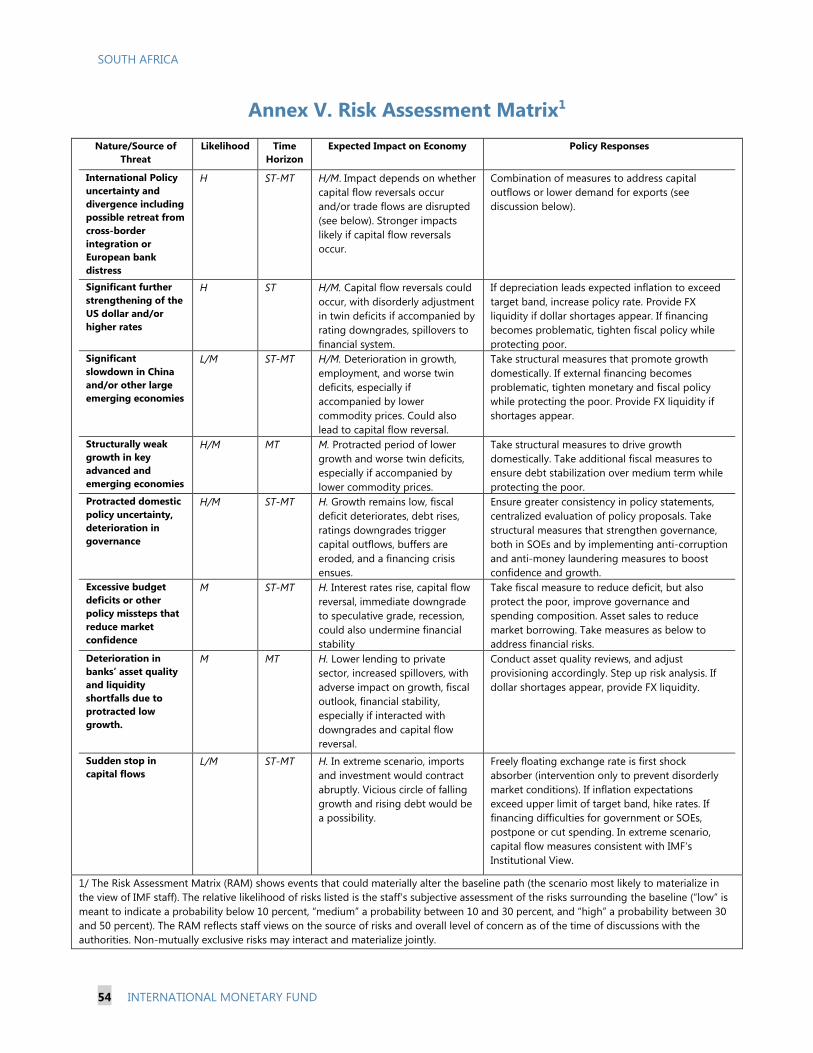
SOUTH AFRICA
54 INTERNATIONAL MONETARY FUND
Annex V. Risk Assessment Matrix1
Nature/Source of
Threat
Likelihood Time
Horizon
Expected Impact on Economy Policy Responses
International Policy
uncertainty and
divergence including
possible retreat from
cross-border
integration or
European bank
distress
H ST-MT H/M. Impact depends on whether
capital flow reversals occur
and/or trade flows are disrupted
(see below). Stronger impacts
likely if capital flow reversals
occur.
Combination of measures to address capital
outflows or lower demand for exports (see
discussion below).
Significant further
strengthening of the
US dollar and/or
higher rates
H ST H/M. Capital flow reversals could
occur, with disorderly adjustment
in twin deficits if accompanied by
rating downgrades, spillovers to
financial system.
If depreciation leads expected inflation to exceed
target band, increase policy rate. Provide FX
liquidity if dollar shortages appear. If financing
becomes problematic, tighten fiscal policy while
protecting poor.
Significant
slowdown in China
and/or other large
emerging economies
L/M ST-MT H/M. Deterioration in growth,
employment, and worse twin
deficits, especially if
accompanied by lower
commodity prices. Could also
lead to capital flow reversal.
Take structural measures that promote growth
domestically. If external financing becomes
problematic, tighten monetary and fiscal policy
while protecting the poor. Provide FX liquidity if
shortages appear.
Structurally weak
growth in key
advanced and
emerging economies
H/M MT M. Protracted period of lower
growth and worse twin deficits,
especially if accompanied by
lower commodity prices.
Take structural measures to drive growth
domestically. Take additional fiscal measures to
ensure debt stabilization over medium term while
protecting the poor.
Protracted domestic
policy uncertainty,
deterioration in
governance
H/M ST-MT H. Growth remains low, fiscal
deficit deteriorates, debt rises,
ratings downgrades trigger
capital outflows, buffers are
eroded, and a financing crisis
ensues.
Ensure greater consistency in policy statements,
centralized evaluation of policy proposals. Take
structural measures that strengthen governance,
both in SOEs and by implementing anti-corruption
and anti-money laundering measures to boost
confidence and growth.
Excessive budget
deficits or other
policy missteps that
reduce market
confidence
M
ST-MT H. Interest rates rise, capital flow
reversal, immediate downgrade
to speculative grade, recession,
could also undermine financial
stability
Take fiscal measure to reduce deficit, but also
protect the poor, improve governance and
spending composition. Asset sales to reduce
market borrowing. Take measures as below to
address financial risks.
Deterioration in
banks’ asset quality
and liquidity
shortfalls due to
protracted low
growth.
M MT H. Lower lending to private
sector, increased spillovers, with
adverse impact on growth, fiscal
outlook, financial stability,
especially if interacted with
downgrades and capital flow
reversal.
Conduct asset quality reviews, and adjust
provisioning accordingly. Step up risk analysis. If
dollar shortages appear, provide FX liquidity.
Sudden stop in
capital flows
L/M ST-MT H. In extreme scenario, imports
and investment would contract
abruptly. Vicious circle of falling
growth and rising debt would be
a possibility.
Freely floating exchange rate is first shock
absorber (intervention only to prevent disorderly
market conditions). If inflation expectations
exceed upper limit of target band, hike rates. If
financing difficulties for government or SOEs,
postpone or cut spending. In extreme scenario,
capital flow measures consistent with IMF‘s
Institutional View.
1/ The Risk Assessment Matrix (RAM) shows events that could materially alter the baseline path (the scenario most likely to materialize in
the view of IMF staff). The relative likelihood of risks listed is the staff’s subjective assessment of the risks surrounding the baseline (“low” is
meant to indicate a probability below 10 percent, “medium” a probability between 10 and 30 percent, and “high” a probability between 30
and 50 percent). The RAM reflects staff views on the source of risks and overall level of concern as of the time of discussions with the
authorities. Non-mutually exclusive risks may interact and materialize jointly.

SOUTH AFRICA
INTERNATIONAL MONETARY FUND 55
Annex VI. Macro-financial Linkages in South Africa
1. Adverse macroeconomic shocks can propagate through the domestic financial system
and feed back to the real economy. Subdued foreign investors’ appetite for domestic assets and
slower economic growth can weaken corporates’ balance sheets, put banks’ asset quality under
pressure, and dampen bank lending. If these create negative spillbacks to the real economy, a
vicious feedback loop can develop. Such linkages could also exist between domestic banks and
economies outside of South Africa in which these banks operate.
2. Macrofinancial linkages were
estimated using a panel VAR model and
both macro- and bank-level data
spanning 2000–16. In the baseline model,
global risk sentiment was captured by VIX,
the implied volatility of S&P 500 index
options. Domestic economic activity was
captured by real GDP growth. NPL ratios
and real growth rates of credit and
deposits for five large banks captured
balance sheet conditions. In alternative
specifications, an index of the prices of
commodities that South Africa exports
was used as a source of external shocks
(replacing VIX). To capture linkages with
regional economies, GDP-weighted
average of growth in economies outside of South Africa where a large South African bank operates
was calculated (replacing domestic growth).
3. The baseline results illustrate the size of the impact of adverse macroeconomic shocks
onto bank balance sheets. Following a one percentage point increase in VIX, the NPL ratios would
rise by 0.1–0.2 percentage point in one to two quarters. Credit and deposit growth would fall by
1.0 percentage point in two quarters. In response to a one percentage point decline in GDP growth,
the NPL ratios would rise by 0.5 percentage point in one to two quarters. Credit and deposit growth
would fall by 6 percentage points in one quarter. The results were qualitatively unchanged when VIX
was replaced by an index of commodity prices.
4. Bank balance sheet variables would influence each other and create spillbacks to the
real economy. A one percentage point increase in the NPL ratios would dampen credit growth by
4 percentage points in one quarter. Tighter funding conditions, represented by lower deposit
growth, would adversely affect asset quality and banks’ capacity to lend. In turn, a one percentage
point rise in the NPL ratios would dampen economic activity by 0.5 percentage point in two
quarters.
Adverse
shock toVIX
GDP
growthNPL ratio
Credit
growth
Deposit
growth
Response of
…
-0.2 -0.5 -0.05
…
0.15 0.5 0.02
-1.0 -6.0 -4.0 -0.15
…
-1.0 -6.0 -1.0
Macro-financial Linkages in South Africa
GDP
growth
NPL ratio
Credit
growth
Deposit
growth
Note: Two lags. Annual data for 2000-16. Bank level data for real credit and deposit
growth and NPL ratios. Numbers represent percentage point response to a one
percentage point adverse shock. "…" when statistically insignificant.

SOUTH AFRICA
56 INTERNATIONAL MONETARY FUND
5. South African banks’ performance is interlinked with regional economies’ growth in
which these banks are estimated to operate, although less so than with domestic growth. The
benchmark model was re-estimated after replacing domestic growth with regional economies’
growth (ex-South Africa) in which one large bank operates. A one percentage point decline in
regional growth would lead to a 1–2 percentage point reduction in credit and deposit growth. In
turn, a one percentage point increase in the NPL ratios would dampen regional growth by
0.5 percentage point after 4 quarters. A 10-percentage point reduction in deposit growth would
dampen GDP growth by 0.2 percentage point. These findings are comparable to those for other
emerging economies, including Indonesia (IMF Country Report 16/82, 16/218).

SOUTH AFRICA
INTERNATIONAL MONETARY FUND 57
Annex VII. Public Debt Sustainability Analysis1
The DSA framework suggests that South Africa’s government debt-to-GDP ratio is sustainable in the
baseline scenario, but is highly sensitive to shocks. Persistent low growth or a shock to contingent
liabilities could push both South Africa’s gross financing needs and debt level above the high-risk
benchmarks of 15 and 70 percent of GDP, respectively, indicating an increased risk of financing
difficulties and debt distress in those scenarios. Gross financing needs and the debt level could also
increase significantly to slightly above 15 percent of GDP and 67 percent of GDP, respectively, if the
economy were buffeted by a standard combination of macro-fiscal shocks. These results suggest
limited room for policy response to further adverse shocks and underscore the urgent need for reforms
to increase economic growth and reduce contingent liabilities, especially from state-owned enterprises,
to increase the resilience to shocks. Insufficient reform progress risks a continuation of the ongoing
vicious cycle of weak growth, a growing debt ratio, and the repeated need to take fiscal measures to
keep the debt sustainable.
1. Data coverage. Consistent with the coverage of government debt reported by the fiscal
authorities, the fiscal assumptions in this DSA are based on the national government’s main budget (central
government). While this coverage excludes provincial governments, social security funds, and extra-
budgetary institutions, these entities are not allowed to incur debt. Even though municipalities are allowed
to incur debt, most provincial and municipal expenditure is funded through transfers from the national
government and thus is captured to a large extent in the projections. The DSA also excludes SOEs, whose
indebtedness has increased rapidly in recent years. However, a scenario on the possible realization of
contingent liabilities in this annex covers the potential impact of guarantees on SOE loans been called. Total
contingent liabilities are estimated at 18 percent of GDP at end March 2017 with SOE loan related
guarantees accounting for 56 percent of total contingent liabilities (10 percent of GDP).2 Contingent
claims to the road accident fund, post-retirement medical assistance for public employees, claims
against government departments, public-private partnerships, and other guarantees to entities that
are not SOEs largely account for the remaining 8 percentage points of GDP.
2. Macroeconomic assumptions. Real GDP growth is projected to improve to 1.0 percent in 2017
from 0.3 percent in 2016 as a result of better rainfall, an increase in mining output prompted by a
moderate rebound in commodity prices, and prospects for lower number of days lost due to strikes.
Over the medium term, growth is projected at 2.2 percent as consumption and investment recover and
the output gap closes. GDP deflator inflation is expected to average 5.6 percent in 2017–2022, consistent
with CPI inflation close to the upper range of the South Africa Reserve Bank’s (SARB) 3–6 percent target
range.
1 For methodology, see: “Staff Guidance Note for Public Debt Sustainability Analysis in Market-Access Countries,” IMF
Policy Paper, May 6 2013 and “Modernizing the Framework for Fiscal Policy and Public Debt Sustainability Analysis,”
SM/11/211.
2 These estimates are from Table 11 of the Statistical Annex of the 2017 budget.

SOUTH AFRICA
58 INTERNATIONAL MONETARY FUND
3. Fiscal assumptions. The FY2017/18 national government primary fiscal deficit is projected to
improve to 0.8 percent of GDP from a deficit of 0.9 percent of GDP in FY2016/17 as a result of fiscal
measures in the 2016 and 2017 Budget Reviews— which are assumed to have the same yield as in the
Budget Reviews. The primary deficit is expected to continue to improve over the medium term as a result
of additional fiscal measures and the gradual improvement in growth. The amount of consolidation,
however, is not expected to be sufficient to stabilize the debt-to-GDP ratio before 2019 which will reach
about 56 percent of GDP by then. The projections include stock-flow adjustments to capture discounts on
new issuance of existing benchmark bonds as well as valuation effects on inflation-linked bonds (Figure
A6.3). The projections assume no additional fiscal measures beyond those signaled in the 2016 and 2017
budgets, contingency reserves averaging 0.2 percent of GDP for each fiscal year starting with FY 2017/2018,
and a continuation of historical budget expenditure and financing trends for years after FY 2019/2020 for
which budget projections are not available.
4. Risks to the Fiscal Outlook. Upward pressure on the fiscal deficit could stem from lower-than-
anticipated growth, higher borrowing costs, and a variety of possible sources of spending pressures
(e.g. rapid procurement of nuclear energy, national health insurance, free university tuition, or a
potentially generous new public wage settlement in 2018). At the same time, the weak state of some
SOEs’ balance sheets could trigger calls for further government support.
5. The macroeconomic forecast track record suggests that over-projection of real growth
poses risks to the debt path (Figure A7.2-top panel). Between 2007–15, the median real GDP forecast
error was -1.2 percentage points, broadly in line with other surveillance countries. Although neither the
primary balance nor GDP inflation projections were systematically biased, the persistent over-projection of
real GDP growth poses an upside risk to the debt-to-GDP forecasts. The risk of persistently lower growth is
thus analyzed in a scenario below.
6. Fiscal adjustment assumed in the DSA is well within the recent fiscal adjustment experience
in South Africa and that of market access countries (Figure 2-lower panel). Fiscal consolidation, which
occurred in a context of slowing growth and started with the 2013 Budget, has reduced the national
government deficit from 5.4 percent of GDP in FY2012/13 to 4.2 percent of GDP in FY2016/17. Rising
interest costs mean that the national government primary deficit has adjusted even more, from 2.7 percent
in FY2012/13 to 0.9 percent in FY2016/17. Looking forward, the maximum three-year adjustment in the
cyclically-adjusted primary balance over the projection period (1.2 percent of GDP) as well as the maximum
three-year average level of the cyclically-adjusted primary balance (1.2 percent of GDP) are well below the
thresholds in the distributions reflecting market access country experiences of 3 and 3.5 percent of GDP
respectively.
7. The heat map highlights that South Africa faces risks from lower growth and contingent
liabilities (Figure A7.1). Persistently low growth or a shock to contingent liabilities could both push the
gross financing needs and the debt level above the high-risk benchmarks, indicating an increased risk of

SOUTH AFRICA
INTERNATIONAL MONETARY FUND 59
financing difficulties and debt distress in those scenarios.3 South Africa’s elevated bond spreads, large
external financing requirements, and the share of debt held by non-residents also point to risks. However,
these risks are mitigated by a large domestic institutional investor base and a low share of foreign currency
and short-term debt.
8. The DSA framework suggests South Africa’s government debt-to-GDP ratio is sustainable in
the baseline scenario, but is highly sensitive to shocks (Figures A7.3, 4, and 5).
Under the baseline, the debt-to-GDP ratio is projected to increase to 57 percent by 2022,
significantly below the 70 percent high-risk threshold (Figure A7.3). Gross financing needs are
estimated at 11.4 percent of GDP in 2016 and are expected to remain at similar levels during the
projection period. Such gross financing needs levels are relatively high compared to other EMs
average despite a favorable maturity and currency structure.
If the primary balance failed to improve during the rest of the projection period, the projected
debt level in 2022 would increase to 59 percent of GDP (Figure A7.4). The debt to GDP ratio
would reach 62 percent of GDP if a one-standard-deviation temporary shock to growth were to
materialize in 2018 and 2019.
A combined macro-fiscal shock—including standard shocks to growth and interest rates, and a
primary balance shock (a temporary half of a 10-year historical standard deviation deterioration
in the primary balance) and an exchange rate shock (consistent with the maximum movement
over the past 10 years and an exchange rate pass-through of 0.25 based on cross-country
estimates of pass-through in EMs)—results in a sharp increase in the debt-to-GDP ratio to
67 percent of GDP and gross financing needs slightly above the 15 percent high risk threshold.
A customized shock entailing a persistently low growth scenario, where growth is permanently
lower than the baseline by 1 percentage point on average during 2018–2022, would result in the
debt to GDP ratio reaching 71 percent of GDP in 2022. This scenario factors in the adverse
impact on the primary balance of lower tax revenue elasticities, denominator effects of the lower
GDP on the expenditure to GDP ratio, and a 300 basis points interest rate shock.
A contingent liability shock entailing the calling of all SOE loan guarantees plus the contingent
liabilities of Road Accident Fund would push debt above the high-risk threshold of 70 percent of
GDP by 2022. While extreme, this scenario, which would entail the calling 78 percent of the
government’s contingent liabilities estimated at 13.8 percent of GDP at end of FY2016/17, serves
3 The framework uses indicative thresholds of 70 percent of GDP for debt and 15 percent of GDP for gross financing
needs, benchmarks beyond which a country is reported as high risk leading to a yellow color in the heat map if they
are exceeded in a stress scenario and a red color if they are exceeded in the baseline. The benchmarks are based on a
cross-country early-warning exercise of emerging market countries that have experienced episodes of debt distress.
Debt distress events are defined as default to commercial or official creditors, restructuring and rescheduling events,
or IMF financing.

SOUTH AFRICA
60 INTERNATIONAL MONETARY FUND
to underscore the growing risks posed by contingent liabilities, both to the fiscal outlook directly
and indirectly through its potential impact on investor confidence and borrowing costs.
The DSA also includes fan charts that take into consideration the impact of the historical
volatility of macro-fiscal variables on the future debt path which allows to estimate, for example,
the probability that the debt level goes above a certain level (Figure A7.1, middle panel). The
asymmetric version reflects the predominance of downside risks while the symmetric version
takes into account the possibility of more rapid progress on structural reforms that would boost
growth and improve the primary balance. Under the predominance of asymmetric shocks, there
is a 10 percent chance that the debt-to-GDP ratio could exceed 70 percent of GDP by 2022.
Under the predominance of symmetric shocks, the probability of the debt exceeding the same
level is halved to 5 percent showing the importance of structural reforms and growth in
reducing the probability of debt distress.

SOUTH AFRICA
INTERNATIONAL MONETARY FUND 61
Figure A7.1. South Africa: Public Sector Debt Sustainability Analysis—Risk Assessment
Sources: IMF staff.
1/ The cell is highlighted in green if debt burden benchmark of 70% is not exceeded under the specific shock or baseline, yellow if exceeded under specific shock but not
baseline, red if benchmark is exceeded under baseline, white if stress test is not relevant.
2/ The cell is highlighted in green if gross financing needs benchmark of 15% is not exceeded under the specific shock or baseline, yellow if exceeded under specific shock
but not baseline, red if benchmark is exceeded under baseline, white if stress test is not relevant.
3/ The cell is highlighted in green if country value is less than the lower risk-assessment benchmark, red if country value exceeds the upper risk-assessment benchmark,
yellow if country value is between the lower and upper risk-assessment benchmarks. If data are unavailable or indicator is not relevant, cell is white. Lower and upper risk-
assessment benchmarks are: 200 and 600 basis points for bond spreads; 5 and 15 percent of GDP for external financing requirement; 0.5 and 1 percent for change in the
share of short-term debt; 15 and 45 percent for the public debt held by non-residents; and 20 and 60 percent for the share of foreign-currency denominated debt.
4/ Long-term bond spread over U.S. bonds, an average over the last 3 months, 10-Jan-17 through 10-Apr-17.
5/ The external financing requirement is defined for the economy as a whole (including the private sector). More specifically, it is defined as the sum of current account
deficit, amortization of medium and long-term total external debt, and short-term total external debt at the end of previous period.
6/ The contingent liability shock scenario included in the heat map entails the calling of all SOE loan guarantees plus the contingent liabilities of the road accident fund.
The standard financial sector contingent liability shock usually in the heat map is not triggered in the case of South Africa because the three year cumulative increase of the
credit-to-GDP or loan-to-deposit ratio do not exceed the corresponding thresholds (i.e. 15 percent of GDP for the credit to GDP ratio and 1.5 loan-to-deposit ratio).
South Africa
Real Interest
Rate Shock
External
Financing
Requirements
Real GDP
Growth Shock
Heat Map
Upper early warning
Evolution of Predictive Densities of Gross Nominal Public Debt
(in percent of GDP)
Debt profile 3/
Lower early warning
Persistently
Low Growth
(Indicators vis-à-vis risk assessment benchmarks, in 2016)
Debt Profile Vulnerabilities
Gross financing needs 2/
Market
Perception
Debt level 1/ Persistently
Low Growth
Real GDP
Growth Shock
Primary
Balance Shock
Change in the
Share of Short-
Term Debt
Foreign
Currency
Debt
Public Debt
Held by Non-
Residents
Primary
Balance Shock
Real Interest
Rate Shock
Exchange Rate
Shock
Contingent
Liability Shock
/6
Exchange Rate
Shock
Contingent
Liability Shock
/6
20
60
10%
1 2
200
600
633
bp
1 2
5
15
18%
1 2
0.5
1
0.9%
1 2
Bond spreadExternal Financing
Requirement
Annual Change in
Short-Term Public
Debt
Public Debt in
Foreign Currency
(in basis points) 4/ (in percent of GDP) 5/ (in percent of total) (in percent of total)
0
10
20
30
40
50
60
70
80
2015 2016 2017 2018 2019 2020 2021 2022
10th-25th 25th-75th 75th-90thPercentiles:Baseline
Symmetric Distribution
0
10
20
30
40
50
60
70
80
2015 2016 2017 2018 2019 2020 2021 2022
Restricted (Asymmetric) Distribution
no restriction on the growth rate shock
no restriction on the interest rate shock
0 is the max positive pb shock (percent GDP)
no restriction on the exchange rate shock
Restrictions on upside shocks:
15
45
36%
1 2
Public Debt Held by
Non-Residents
(in percent of total)

SOUTH AFRICA
62 INTERNATIONAL MONETARY FUND
Figure A7.2. South Africa: Public Sector Debt Sustainability Analysis—Realism of Baseline
Assumptions
Source: IMF staff.
1/ Plotted distribution includes all countries, percentile rank refers to all countries.
2/ Projections made in the spring WEO vintage of the preceding year.
3/ Not applicable for South Africa, as it meets neither the positive output gap criterion nor the private credit growth criterion.
4/ Data cover annual observations from 1990 to 2011 for advanced and emerging economies with debt greater than 60 percent
of GDP. Percent of sample on vertical axis.
Source : IMF Staff.
1/ Plotted distribution includes all countries, percentile rank refers to all countries.
2/ Projections made in the spring WEO vintage of the preceding year.
3/ Not applicable for South Africa, as it meets neither the positive output gap criterion nor the private credit growth criterion.
Forecast Track Record, versus all countries
Boom-Bust Analysis 3/Assessing the Realism of Projected Fiscal Adjustment
4/ Data cover annual obervations from 1990 to 2011 for advanced and emerging economies with debt greater than 60 percent of
GDP. Percent of sample on vertical axis.
-10
-8
-6
-4
-2
0
2
4
6
2007 2008 2009 2010 2011 2012 2013 2014 2015
Year 2/
Real GDP Growth
Interquartile range (25-75)
Median
South Africa forecast error
-1.23
19%Has a percentile rank of:
South Africa median forecast error, 2007-2015:
Distribution of
forecast errors: 1/
(in percent, actual-projection)
-8
-6
-4
-2
0
2
4
2007 2008 2009 2010 2011 2012 2013 2014 2015
Year 2/
Primary Balance
Interquartile range (25-75)
Median
South Africa forecast error
0.26
84%Has a percentile rank of:
South Africa median forecast error, 2007-2015:
Distribution of
forecast errors: 1/
(in percent of GDP, actual-projection)
-8
-6
-4
-2
0
2
4
6
8
10
2007 2008 2009 2010 2011 2012 2013 2014 2015
Year 2/
Inflation (Deflator)
Interquartile range (25-75)
Median
South Africa forecast error
0.19
55%Has a percentile rank of:
South Africa median forecast error, 2007-2015:
Distribution of
forecast errors: 1/
(in percent, actual-projection)
pess
imis
tic
op
tim
isti
c
-6
-4
-2
0
2
4
6
8
t-5 t-4 t-3 t-2 t-1 t t+1 t+2 t+3 t+4 t+5
Real GDP growth
South Africa
(in percent)
Not applicable for South Africa
0
2
4
6
8
10
12
14
Le
ss -4 -3 -2 -1 0 1 2 3 4 5 6 7 8
Distribution 4/
South Africa
3-Year Adjustment in Cyclically-Adjusted
Primary Balance (CAPB)(Percent of GDP)
Mo
re
3-year CAPB adjustment
greater than 3 percent of
GDP in approx. top quartilehas a percentile
rank of 38%
0
2
4
6
8
10
12
Less -4 -3 -2 -1 0 1 2 3 4 5 6 7 8
Distribution 4/
South Africa
3-Year Average Level of Cyclically-Adjusted
Primary Balance (CAPB)(Percent of GDP)
Mo
re
3-year average CAPB level
greater than 3.5 percent of
GDP in approx. top quartilehas a percentile
rank of 59%

SOUTH AFRICA
INTERNATIONAL MONETARY FUND 63
Figure A7.3. South Africa: Public Sector Debt Sustainability Analysis—Baseline Scenario
(in percent of GDP unless otherwise indicated)
Sources: IMF staff.
1/ Public sector is defined as general government.
2/ Based on available data.
3/ Long-term bond spread over U.S. bonds.
4/ Defined as interest payments divided by debt stock (excluding guarantees) at the end of previous year.
5/ Derived as [(r - π(1+g) - g + ae(1+r)]/(1+g+π+gπ)) times previous period debt ratio, with r = interest rate; π = growth rate of GDP deflator; g = real GDP growth rate;
a = share of foreign-currency denominated debt; and e = nominal exchange rate depreciation (measured by increase in local currency value of U.S. dollar).
6/ The real interest rate contribution is derived from the numerator in footnote 5 as r - π (1+g) and the real growth contribution as -g.
7/ The exchange rate contribution is derived from the numerator in footnote 5 as ae(1+r).
8/ Includes asset changes and interest revenues (if any). For projections, includes exchange rate changes during the projection period.
9/ Assumes that key variables (real GDP growth, real interest rate, and other identified debt-creating flows) remain at the level of the last projection year.
As of May 31, 20172/
2015 2016 2017 2018 2019 2020 2021 2022 Sovereign Spreads
Nominal gross public debt 35.6 49.3 51.7 52.6 54.7 55.9 56.5 56.9 57.0 EMBIG (bp) 3/ 638
Public gross financing needs 7.9 11.2 11.4 11.2 11.4 11.7 11.6 11.4 11.1 5Y CDS (bp) 190
Real GDP growth (in percent) 2.8 1.3 0.3 1.0 1.2 1.7 2.2 2.2 2.2 Ratings Foreign Local
Inflation (GDP deflator, in percent) 6.8 5.0 6.8 5.8 5.7 5.6 5.6 5.6 5.6 Moody's Baa2 Baa2
Nominal GDP growth (in percent) 9.8 6.4 7.1 6.8 6.9 7.4 7.9 7.9 7.9 S&Ps BB+ BBB-
Effective interest rate (in percent) 4/ 8.3 6.8 7.0 7.2 7.4 7.4 7.5 7.6 7.6 Fitch BB+ BB+
2015 2016 2017 2018 2019 2020 2021 2022 cumulative
Change in gross public sector debt 1.5 2.4 2.4 0.9 2.1 1.2 0.6 0.4 0.1 5.3
Identified debt-creating flows 2.0 4.9 2.2 0.4 1.9 1.0 0.4 0.2 0.0 3.8
Primary deficit 0.8 1.8 1.4 0.9 0.8 0.8 0.7 0.4 0.1 3.6
Primary (noninterest) revenue and grants 24.3 24.8 25.4 25.6 25.9 26.0 26.0 26.1 26.1 155.7
Primary (noninterest) expenditure 25.1 26.6 26.7 26.4 26.6 26.8 26.7 26.5 26.2 159.3
Automatic debt dynamics 5/
-0.2 1.7 -0.7 0.2 0.2 0.0 -0.2 -0.2 -0.2 -0.1
Interest rate/growth differential 6/
-0.5 0.2 0.0 0.2 0.2 0.0 -0.2 -0.2 -0.2 -0.1
Of which: real interest rate 0.4 0.8 0.1 0.7 0.8 0.9 0.9 1.0 1.0 5.2
Of which: real GDP growth -0.9 -0.6 -0.1 -0.5 -0.6 -0.9 -1.1 -1.2 -1.2 -5.4
Exchange rate depreciation 7/
0.3 1.5 -0.6 … … … … … … …
Other identified debt-creating flows 1.4 1.5 1.5 -0.6 0.9 0.2 0.0 0.0 0.0 0.4
Privatization/Drawdown of Deposits 0.7 -0.3 1.2 -0.9 0.4 -0.4 -0.7 -0.6 -0.6 -2.9
Contingent liabilities 0.0 0.0 0.0 0.0 0.0 0.0 0.0 0.0 0.0 0.0
Stock-Flow adjustment 0.7 1.8 0.3 0.3 0.5 0.6 0.6 0.6 0.6 3.2
Residual, including asset changes 8/
-0.5 -2.5 0.2 0.4 0.2 0.2 0.2 0.2 0.1 1.4
-0.1
balance 9/
primary
Debt, Economic and Market Indicators 1/
2006-2014
Actual
Projections
Contribution to Changes in Public Debt
Projections
2006-2014
Actual
debt-stabilizing
-6
-4
-2
0
2
4
6
8
2006 2007 2008 2009 2010 2011 2012 2013 2014 2015 2016 2017 2018 2019 2020 2021 2022
Debt-Creating Flows
Primary deficit Real GDP growth Real interest rate
Exchange rate depreciation Other debt-creating flows Residual
Change in gross public sector debt
projection
(in percent of GDP)
-8
-6
-4
-2
0
2
4
6
8
10
12
cumulative

SOUTH AFRICA
64 INTERNATIONAL MONETARY FUND
Figure A7.4. South Africa: Public Sector Debt Sustainability Analysis—Composition of
Public Debt and Alternative Scenarios
Sources: IMF staff.
Baseline Scenario 2017 2018 2019 2020 2021 2022 Historical Scenario 2017 2018 2019 2020 2021 2022
Real GDP growth 1.0 1.2 1.7 2.2 2.2 2.2 Real GDP growth 1.0 2.1 2.1 2.1 2.1 2.1
Inflation 5.8 5.7 5.6 5.6 5.6 5.6 Inflation 5.8 5.7 5.6 5.6 5.6 5.6
Primary Balance -0.9 -0.8 -0.8 -0.7 -0.4 -0.1 Primary Balance -0.9 -1.4 -1.4 -1.4 -1.4 -1.4
Effective interest rate 7.2 7.4 7.4 7.5 7.6 7.6 Effective interest rate 7.2 7.4 7.3 7.3 7.4 7.4
Constant Primary Balance Scenario
Real GDP growth 1.0 1.2 1.7 2.2 2.2 2.2
Inflation 5.8 5.7 5.6 5.6 5.6 5.6
Primary Balance -0.9 -0.9 -0.9 -0.9 -0.9 -0.9
Effective interest rate 7.2 7.4 7.4 7.5 7.6 7.6
Underlying Assumptions(in percent)
Alternative Scenarios
Composition of Public Debt
Baseline Historical Constant Primary Balance
45
47
49
51
53
55
57
59
61
2015 2016 2017 2018 2019 2020 2021 2022
Gross Public Debt
(in percent of GDP)
projection
5
6
7
8
9
10
11
12
13
14
2015 2016 2017 2018 2019 2020 2021 2022
Public Gross Financing Needs
(in percent of GDP)
projection
0
10
20
30
40
50
60
2006 2008 2010 2012 2014 2016 2018 2020 2022
By Maturity
Medium and long-term
Short-term
projection
(in percent of GDP)
0
10
20
30
40
50
60
2006 2008 2010 2012 2014 2016 2018 2020 2022
By Currency
Local currency-denominated
Foreign currency-denominated
projection
(in percent of GDP)
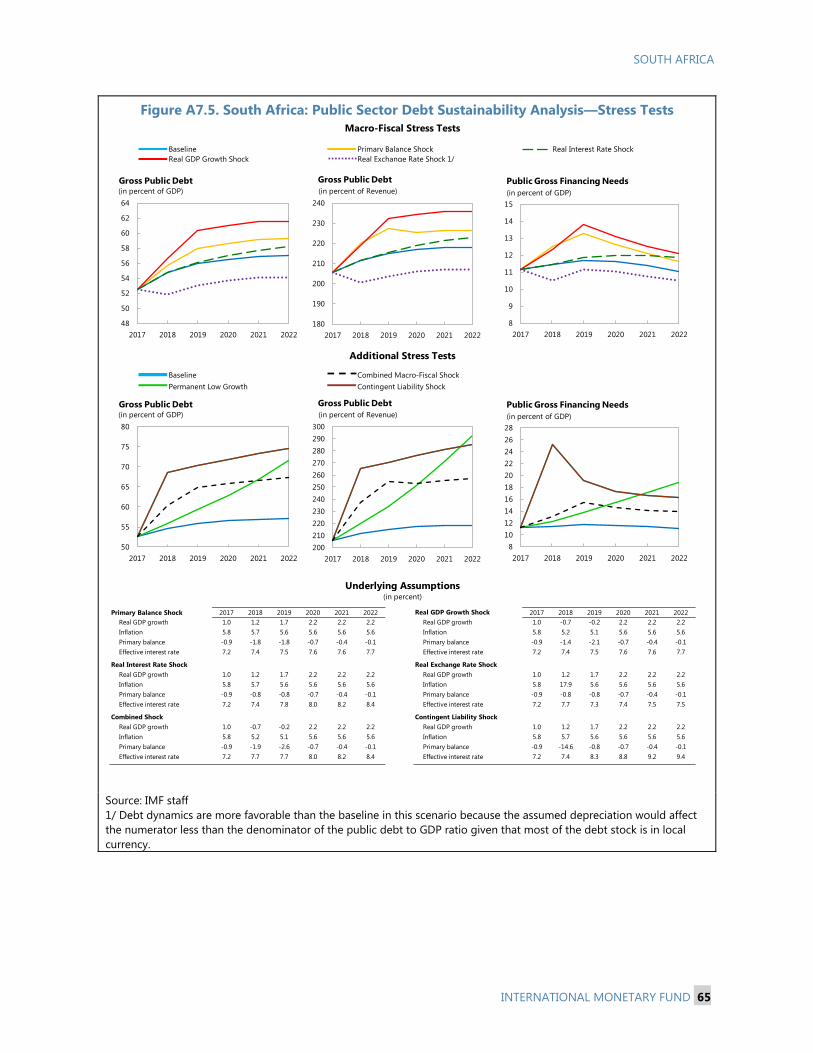
SOUTH AFRICA
INTERNATIONAL MONETARY FUND 65
Figure A7.5. South Africa: Public Sector Debt Sustainability Analysis—Stress Tests
Source: IMF staff
1/ Debt dynamics are more favorable than the baseline in this scenario because the assumed depreciation would affect
the numerator less than the denominator of the public debt to GDP ratio given that most of the debt stock is in local
currency.
Primary Balance Shock 2017 2018 2019 2020 2021 2022 Real GDP Growth Shock 2017 2018 2019 2020 2021 2022
Real GDP growth 1.0 1.2 1.7 2.2 2.2 2.2 Real GDP growth 1.0 -0.7 -0.2 2.2 2.2 2.2
Inflation 5.8 5.7 5.6 5.6 5.6 5.6 Inflation 5.8 5.2 5.1 5.6 5.6 5.6
Primary balance -0.9 -1.8 -1.8 -0.7 -0.4 -0.1 Primary balance -0.9 -1.4 -2.1 -0.7 -0.4 -0.1
Effective interest rate 7.2 7.4 7.5 7.6 7.6 7.7 Effective interest rate 7.2 7.4 7.5 7.6 7.6 7.7
Real Interest Rate Shock Real Exchange Rate Shock
Real GDP growth 1.0 1.2 1.7 2.2 2.2 2.2 Real GDP growth 1.0 1.2 1.7 2.2 2.2 2.2
Inflation 5.8 5.7 5.6 5.6 5.6 5.6 Inflation 5.8 17.9 5.6 5.6 5.6 5.6
Primary balance -0.9 -0.8 -0.8 -0.7 -0.4 -0.1 Primary balance -0.9 -0.8 -0.8 -0.7 -0.4 -0.1
Effective interest rate 7.2 7.4 7.8 8.0 8.2 8.4 Effective interest rate 7.2 7.7 7.3 7.4 7.5 7.5
Combined Shock Contingent Liability Shock
Real GDP growth 1.0 -0.7 -0.2 2.2 2.2 2.2 Real GDP growth 1.0 1.2 1.7 2.2 2.2 2.2
Inflation 5.8 5.2 5.1 5.6 5.6 5.6 Inflation 5.8 5.7 5.6 5.6 5.6 5.6
Primary balance -0.9 -1.9 -2.6 -0.7 -0.4 -0.1 Primary balance -0.9 -14.6 -0.8 -0.7 -0.4 -0.1
Effective interest rate 7.2 7.7 7.7 8.0 8.2 8.4 Effective interest rate 7.2 7.4 8.3 8.8 9.2 9.4
Macro-Fiscal Stress Tests
Baseline Primary Balance Shock
Real GDP Growth Shock
Real Interest Rate Shock
(in percent)
Real Exchange Rate Shock 1/
Combined Macro-Fiscal Shock
Additional Stress Tests
Baseline
Underlying Assumptions
Permanent Low Growth Contingent Liability Shock
48
50
52
54
56
58
60
62
64
2017 2018 2019 2020 2021 2022
Gross Public Debt(in percent of GDP)
180
190
200
210
220
230
240
2017 2018 2019 2020 2021 2022
Gross Public Debt
(in percent of Revenue)
8
9
10
11
12
13
14
15
2017 2018 2019 2020 2021 2022
Public Gross Financing Needs
(in percent of GDP)
50
55
60
65
70
75
80
2017 2018 2019 2020 2021 2022
Gross Public Debt(in percent of GDP)
200
210
220
230
240
250
260
270
280
290
300
2017 2018 2019 2020 2021 2022
Gross Public Debt
(in percent of Revenue)
8
10
12
14
16
18
20
22
24
26
28
2017 2018 2019 2020 2021 2022
Public Gross Financing Needs
(in percent of GDP)
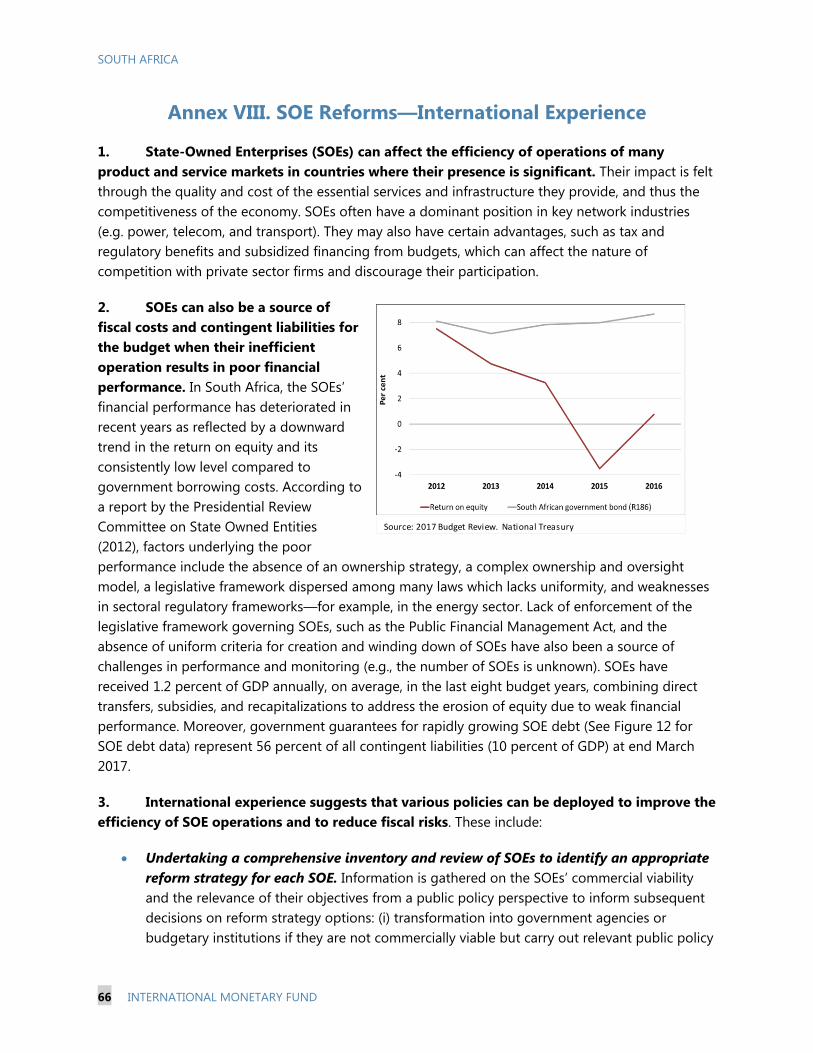
SOUTH AFRICA
66 INTERNATIONAL MONETARY FUND
Annex VIII. SOE Reforms—International Experience
1. State-Owned Enterprises (SOEs) can affect the efficiency of operations of many
product and service markets in countries where their presence is significant. Their impact is felt
through the quality and cost of the essential services and infrastructure they provide, and thus the
competitiveness of the economy. SOEs often have a dominant position in key network industries
(e.g. power, telecom, and transport). They may also have certain advantages, such as tax and
regulatory benefits and subsidized financing from budgets, which can affect the nature of
competition with private sector firms and discourage their participation.
2. SOEs can also be a source of
fiscal costs and contingent liabilities for
the budget when their inefficient
operation results in poor financial
performance. In South Africa, the SOEs’
financial performance has deteriorated in
recent years as reflected by a downward
trend in the return on equity and its
consistently low level compared to
government borrowing costs. According to
a report by the Presidential Review
Committee on State Owned Entities
(2012), factors underlying the poor
performance include the absence of an ownership strategy, a complex ownership and oversight
model, a legislative framework dispersed among many laws which lacks uniformity, and weaknesses
in sectoral regulatory frameworks—for example, in the energy sector. Lack of enforcement of the
legislative framework governing SOEs, such as the Public Financial Management Act, and the
absence of uniform criteria for creation and winding down of SOEs have also been a source of
challenges in performance and monitoring (e.g., the number of SOEs is unknown). SOEs have
received 1.2 percent of GDP annually, on average, in the last eight budget years, combining direct
transfers, subsidies, and recapitalizations to address the erosion of equity due to weak financial
performance. Moreover, government guarantees for rapidly growing SOE debt (See Figure 12 for
SOE debt data) represent 56 percent of all contingent liabilities (10 percent of GDP) at end March
2017.
3. International experience suggests that various policies can be deployed to improve the
efficiency of SOE operations and to reduce fiscal risks. These include:
Undertaking a comprehensive inventory and review of SOEs to identify an appropriate
reform strategy for each SOE. Information is gathered on the SOEs’ commercial viability
and the relevance of their objectives from a public policy perspective to inform subsequent
decisions on reform strategy options: (i) transformation into government agencies or
budgetary institutions if they are not commercially viable but carry out relevant public policy
Source: 2017 Budget Review. National Treasury
SOUTH AFRICA
INTERNATIONAL MONETARY FUND 67
objectives; (ii) divestment if they are commercially viable but their objectives are not relevant
from a public policy perspective; (iii) liquidation if they are not commercially viable and their
objectives are not relevant from a public policy perspective; (iv) retaining them as SOE but
pursuing reforms to improve their performance if they are both commercially viable and
have relevant objectives from a public policy perspective.
Reforming SOEs that are retained as such to improve their operational and financial
performance. Countries have pursued the following reform strategies in isolation or
combining them, depending on country specific circumstances:
Broadening the ownership structure to include private sector participation. The models for
this type of reform were retaining majority shareholding but implementing corporate
governance reforms (e.g., Brazil, China, India, Poland) and maintaining minority
shareholding after sale of majority of shares to the private sector (e.g., Brazil, UK,
Norway, Spain, Poland).
Stepping up monitoring of SOE performance. Reforms of this type included:
(a) implementation/enforcement of international accounting and auditing standards,
timeliness of accounts, and disclosure and transparency requirements more generally
(e.g., Switzerland, Turkey, Germany, Sweden, New Zealand); (b) linking main objectives to
a set of key performance indicators measuring financial and non-financial performance,
financial risk, and transactions with the government (e.g. Australia, Indonesia, Thailand,
South Africa); (c) requiring quantification and budget compensation for quasi-fiscal
operations (e.g., EU regulatory framework for the transportation sector); (d) production
of consolidated information regarding the SOE sector in annual reports. (e.g. Lithuania,
Finland, France, Brazil, New Zealand, Sweden).
Leveling the playing field with the private sector. These reforms involve limiting SOE tax,
regulatory, and subsidized financing benefits (e.g. Directives on State Aid in EU
countries, Australia’s competitive neutrality policy).
Balancing increased SOE autonomy with control of fiscal risks. Reforms of this type
included increasing professional qualifications of board members and strengthening
rules against conflict of interest (e.g., Germany, Italy, Spain, Singapore), reducing board
sizes (e.g. Korea, France, Poland, Spain), introducing guidelines for remuneration and
employment (Finland, Norway, Sweden, Czech Republic), and retaining financial controls
(e.g., borrowing/guarantees approval by the Ministry of Finance).
Preparing framework laws on SOEs (e.g., Cyprus, New Zealand, the Philippines, and
Korea). Important components of such laws were clarifying the definition of SOEs,
defining clearly the roles and responsibilities of key players such as line ministries and
SOE boards, establishing sound SOE corporate governance policies, introducing
requirements for the creation/winding down and sale of SOEs, tightening of sanctions

SOUTH AFRICA
68 INTERNATIONAL MONETARY FUND
for non-compliance with SOE legislation, and increased disclosure and reporting
requirements for SOEs.
Increasing the centralization of the ownership function for SOEs (e.g., Singapore, Denmark,
Netherlands, China, Finland, France and Peru). This facilitates separating the ownership
function from the policy function, implementing unified SOE guidelines and their
interpretation, compiling and reporting of aggregate information on SOEs, and
leveraging scarce expertise.
Developing and publishing a comprehensive ownership policy and reviewing it
periodically (e.g., France, Finland, Norway, Sweden and the U.K). Key features of the
ownership policies include: (a) statement of the government’s policy and financial objectives
for the entities exercising the ownership function and each company or group of companies
and associated with performance indicators (b) organization of the ownership function,
including mandate and main functions of the ownership entity(ies) (c) key policy principles
and policies to be followed. (e.g., adherence to corporate governance principles).
4. SOE reforms were generally carried out in stages spanning many years and responding
to country specific circumstances. For example, the tightening of financing constraints (e.g., the
end of the petrodollar era in the 1980s for Brazil) and recurrent scandals related to SOEs were
important reform catalysts in multiple countries. While it is difficult to point to good practice reform
sequencing examples given the staged and country-specific nature of many SOE reforms, an
illustrative reform sequence based on the complexity of the reforms could involve:
Short term (first year): (1) Full inventory of public sector entities; (2) Clarification of roles and
responsibilities of key players; (3) Simple quantification of quasi-fiscal operations focusing
on high fiscal risk SOEs; and (4) Simple performance indicators and targets.
Medium term (first 3 years): (1) SOE legal framework revision including a possible framework
law on SOEs;(2) Development of an ownership policy; (3) Consolidated annual report on all
SOEs.
Long term (later years): Refinements in: (1) set of performance indicators and targets; (2) full
costing, reporting, and compensation of quasi-fiscal operations; (3) periodic reviews of the
ownership policy.
References
Allen, Richard and Miguel Alves. 2016. “How to Improve the Financial Oversight of Public
Corporations,” How to Notes. Fiscal Policy.” Fiscal Affairs Department, International Monetary
Fund
OECD. 2015. “Stated-Owned Enterprises in the Development Process.”
OECD Website on Corporate Governance at http://www.oecd.org/corporate/
Government of South Africa. 2012. “Presidential Review Committee on State-Owned Entities. Main
Report.”

Priority Recommendations Progress update An
nex IX
. Imp
lem
en
tatio
n o
f FS
AP
Reco
mm
en
datio
ns
Twin Peaks Reform Well advanced or near completion
Define clear and comprehensive
institutional, governance and
accountability arrangements for
prudential and market conduct
regulation, including National Credit
Regulator (NCR) and other relevant
institutions.
The Financial Sector Regulation Bill (FSRB) to implement a Twin Peaks regulatory architecture
reform was approved by the National Assembly on December 5, 2016. The FSRB is expected to be
approved by the upper house towards the second half of 2017. The FSRB will ensure that there are
Memoranda of Understanding between the financial sector regulators, including the NCR.
Publish a roadmap for regulatory
reform, with adequate resource
allocation, monitoring and evaluation,
to carefully implement the move to twin
peaks and minimize transition risks.
A regulatory strategy will be published as required in clause 47 of the FSRB and will serve as a
roadmap. Once the FSRB is enacted, the Prudential Authority (PA) could be created towards the
end of 2017 and the Financial Sector Conduct Authority (FSCA) in end-2017 or 2018.
Under Twin Peaks, insurance companies will be supervised by the PA to help improve oversight of
financial conglomerates. (All big banks have some insurance business). More than 50 staff are
expected to move from the Financial Services Board (FSB) to the South African Reserve Bank
(SARB). The SARB is ready to merge the bank and insurance supervision. The prudential supervision
of securities companies will also move to the SARB. The FSB will be transformed into FSCA.
INTER
NA
TIO
NA
L M
ON
ETA
RY
FU
ND
69
SO
UTH
AFR
ICA

Microprudential Progress is uneven
Strengthen group-wide supervision of
financial conglomerates, focusing on
interconnectedness by monitoring
intra-group transactions and aggregate
exposures, and conducting joint on-site
visits.
The PA will regulate financial conglomerates, including related non-financial entities which are currently not
regulated by either the SARB or the FSB (e.g., the furniture business owned by African Bank, or joint ventures
between banks and retailers, which may not be on the banks’ balance sheet). A separate Conglomerate
Supervision Department has been established and a Conglomerate Supervisory Blueprint is being drafted.
The Bank Supervision Department (future PA) and FSB (future FSCA) already conduct joint supervisory visits
and reviews.
Clarify objectives and strengthen the
operational independence of all
financial sector supervisors in the
relevant legislation in line with
international standards.
The FSRB clarifies the independence and roles of the FSCA and the PA. Under FSRB and Twin Peaks
architecture, memoranda of understanding among all regulators will ensure independence and collaboration
on shared objectives.
Enhance regulatory requirements of
Collective Investment Schemes (CIS),
particularly for disclosure, valuation and
accounting, introduce variable net asset
valuation, and strengthen the
supervision of CIS managers.
To enhance the existing legislation, the FSB drafted regulations concerning valuation, pricing, and accounting
of CIS which will be circulated for comment to industry by the third quarter of 2017 and then finalized for
publication. BN 92 of 2014 already sufficiently provides for requirements for the disclosure of CIS unit prices.
Board Notice 90 of 2014 permits use of variable Net Asset Value (NAV) for money market funds (MMFs).
MMFs are not required to apply variable NAV and may continue using a daily constant price. All MMFs that
do apply a constant NAV must perform a monthly mark-to-market valuation and report it to the regulator,
indicating the variance from the constant price. The relevant regulations (BN90) will be reviewed during 2017
and all latest relevant IOSCO principles will be considered.
INTER
NA
TIO
NA
L M
ON
ETA
RY
FU
ND
70
SO
UTH
AFR
ICA
SO
UTH
AFR
ICA
70
IN
TER
NA
TIO
NA
L M
ON
ETA
RY
FU
ND
Fully implement the Solvency
Assessment and Management regime
and Treating Customers Initiative; give
high priority in legislation to protecting
policyholder rights and entitlements.
Under the FSRB, the PA will be responsible for the prudential aspects of insurance supervision, particularly the
new risk-based solvency framework, Solvency Assessment and Management (SAM). As part of the process to
implement the SAM framework, the Financial Soundness Standards for solo insurers, Lloyd’s, branches of
foreign reinsurers, micro-insurers and insurance groups were released on November 4, 2016 for informal
public comment by January 31, 2017. The Governance and Operational Standards for Insurers were released
on April 24, 2017 for informal public comment by May 24, 2017. The remainder of the prudential standards
under SAM are expected to be released for informal public comment by the end of June 2017. The Insurance
Bill, which will give effect to the SAM framework, was tabled in Parliament on January 28, 2016 and is
currently in parliamentary processes. The finalization and implementation of the Insurance Bill and the
prudential standards are dependent on the finalization and implementation of the FSRB. At this stage the
envisaged implementation date of the SAM framework is July 1, 2018.
Treating Customers Fairly (TCF) conduct matters is already being implemented by FSB through its TCF
Roadmap and will remain with the FSCA. The Conduct of Financial Institutions Bill (CoFI Bill) is being drafted,
consolidating 13 sectoral laws, and will further enhance the rights of customers. CoFI Bill will go to the
parliament by end-2017. Policyholders and depositor’s rights and entitlements will be addressed as part of
the drafting process of the Designated Institutions Resolution Bill, 2017 (Resolution Bill).
An update of the Retail Distribution Review (RDR) discussion document was published in December 2015. A
further update, “Status Update: Retail Distribution Review – status as at December 2016” was published on
December 13, 2016. The RDR discussion document issued in November 2014 proposed reforms to the
regulatory framework for distributing financial products to customers. The RDR discussion document
proposes 55 specific regulatory objectives. The RDR status update confirms that these proposals would be
implemented in three broad phases and aligned to the broader reform of financial regulation in terms of the
Twin Peaks regulatory model.
Proposed amendments to the Regulations made under the Long-term Insurance Act, 1998 and Short-term
Insurance Act, 1998 (collectively referred to as the “Insurance Acts”) giving effect to a number of regulatory
reforms focusing on conduct of business that cannot be deferred until the enactment of the CoFI Bill were
issued for public comment on December 9, 2016 with comments due by February 22, 2017.
The proposed replacement of the Policyholder Protection Rules made under the Insurance Acts giving effect
to a number of regulatory reforms focusing on conduct of business that cannot be deferred until the
enactment of the CoFI Bill was published in Board Notice 192 of 2016 and issued for public comment on
December 15, 2016 with comments due February 22, 2017.
INTER
NA
TIO
NA
L M
ON
ETA
RY
FU
ND
71
SO
UTH
AFR
ICA

Macroprudential
Continue building a top-down stress
test framework for both the banking
and insurance sectors and give SARB
more resources for data collection and
analysis.
The Financial Stability Department (FinStab) developed a top-down (TD) stress-testing framework which
consists of (i) a risk assessment matrix, (ii) scenarios design, (iii) data management, (iv) development of TD
models, and (v) calculation and reporting.
During October 2015–February 2016, FinStab conducted a solvency scenario stress test. Banks undertook
bottom-up tests, the results of which were validated by TD tests conducted by the Stress Testing Division.
The aggregated results were published, and were the first published by SARB. The Stress Testing Division
recruited an additional staff member with quantitative and banking experiences. The Deutsche Bundesbank
performed an independent assessment of the TD stress-testing framework and recommendations are
considered in SARB framework. In addition, the stress test exercise was subjected to a peer review by the IMF
and the suggestions from this exercise are also being considered by the SARB in its stress testing framework.
Financial Safety Nets
Introduce a resolution regime
compliant with the Key Attributes for,
and make the SARB the resolution
authority of, all banks and SIFIs.
In August 2015, the National Treasury (NT), the SARB and the FSB-SA jointly published a discussion paper
“Strengthening SA’s Resolution Framework for Financial Institutions” for public comment and held a series of
public consultations thereafter. The paper proposes, for instance, to establish an explicit deposit insurance
scheme and broaden the scope of resolution to holding companies. The NT, in collaboration with the SARB, is
drafting a legislation (Resolution Bill). The first draft legislation is intended to be published for public
comment by end-2017 and submitted to parliament for approval thereafter.
Adopt depositor preference and
introduce an ex-ante funded deposit
insurance scheme, with a back-up
credit line from the NT.
Deposit insurance will be introduced through the Resolution Bill. The NT and the SARB have published a
policy document on the deposit insurance scheme for comment.
The Resolution Bill will cover all banks and systematically important financial market infrastructures (FMIs),
insurance companies and financial conglomerates, and will establish the deposit insurance fund. The level of
deposit insurance coverage is expected to be R100,000 per person per bank (most deposits are below
R3,000). The funding mechanism for the deposit insurance fund is yet to be finalized.
Remove constraints to early
intervention powers and improve legal
protection for resolution officials.
The envisaged strengthened resolution framework, in line with the powers assigned in the Resolution Bill, will
allow SARB as the resolution authority to take early intervention measures. The Resolution Bill will consolidate
the previously fragmented resolution powers under different regulators. SARB can initiate early intervention
based on actions taken in terms of its pre-resolution powers, that the financial position of an institution is
significantly overstated and/or that it is, in fact, non-viable or likely to be non-viable. SARB can request the
PA to implement recovery actions. The legislation will provide resolution officials with legal protection as set
out in the NT and SARB discussion paper proposals.
72
IN
TER
NA
TIO
NA
L M
ON
ETA
RY
FU
ND
SO
UTH
AFR
ICA

OTC derivatives Market Reforms and
Oversight Draft bill under review
Improve data collection of OTC
derivatives and enhance surveillance of
the OTC derivatives market
In July 2016, the NT, the FSB and the SARB jointly published a 3rd draft on the OTC derivative regulatory
framework proposing that the regulations be submitted for parliamentary review. However, the timeline to
finalize the OTC derivatives regulations is dependent on the promulgation processes that are currently
underway for the FSRB and Financial Markets Act (FMA) consequential amendments. The central clearing
mandate will be reviewed during 2017. The code of conduct and central clearing mandate are expected to be
implemented during 2018. These regulations will encourage central clearing and central reporting for
standard derivative contracts while implementing capital and margin requirements for non-centrally cleared
transactions. An OTC steering committee consisting of officials from the NT, the FSB, and the SARB are in the
process of considering the various OTC issues in the context of the FSRB, of which some OTC matters will
partly fall in SARB’s mandate in the future. Given the large size of the OTC derivative market, timely data
collection is vital for risk monitoring.
Consider establishing a local CCP, with
credit lines to the central bank and
securities collateral placed at a central
securities depository to reduce
dependency on local banks.
CCP issues are also part of the deliberations of the OTC steering committee. More progress is expected in the
future.
INTER
NA
TIO
NA
L M
ON
ETA
RY
FU
ND
73
SO
UTH
AFR
ICA

Competition Some progress
Adopt the international best practices
on provision and disclosure of market
information to retail customers and to
potential entrants into the payments
and clearance systems.
The National Payment System Act, 1998 (NPS Act) does not specifically provide requirements for payment
participants in relation to retail customers. Although the National Payment System Department (NPSD) has
been applying the CPSS Core principles for systemically important payment system and subsequently the
CPMI-IOSCO Principles for Financial Market Infrastructures (PFMIs), these principles have not been formally
adopted into domestic law. NPSD has publicly expressed its commitment and support to adopting the PFMIs.
FSRB currently in Parliament makes provision for conduct regulation of payment services providers (PSPs) by
FSCA for consumer protection purposes. It is envisaged that once promulgated, the FSR Act will provide legal
authority for the regulation, supervision and oversight of PSPs and their conduct in relation to retail
customers. In anticipation of the promulgation of FSRB, FSB is also in the process of developing the CoFI Bill
which will apply to PSPs and include provisions on, among others, disclosure to retail customers of PSPs. The
NPSD is part of the Working Group on the CoFI Bill. In addition, further clarity will also be provided in the
National Payment System Amendment Bill. In this regard, NPSD is also in the process of reviewing the NPS
Act to align it with FSRB, to among others, align with international standards.
With regards to disclosure to potential market entrants, section 6A (3), (4) and (5) of the NPS Act make
provision for market access.
In addition, once the PFMIs have been adopted, these provisions will be fully aligned to the PFMIs principle
on access and participation, and the broad public policy on disclosure and transparency.
Adopt a rules-based entry and exit
framework, and lower entry hurdles to
the financial system.
NPSD is currently reviewing the NPS Act to address among others, entry and exit frameworks in line with the
PFMIs and other applicable international standards. In this regard, NPSD has taken a policy view to include a
broader definition of payment services in the NPS Amendment Bill and to ensure that NPS is more accessible
to non-banks.
It is envisaged that restrictions relating to bank sponsorships for non-banks in the clearing and settlement
systems would be removed provided that the non-banks meet entry requirements to help increase
competition in the NPS particularly in the remittance, mobile money/payments, clearing and settlement
environment. The proposal has been included in the NPS Act Review Policy paper to be submitted to
Treasury during the third quarter of 2017 for translation into the NPS Amendment Bill.
74
IN
TER
NA
TIO
NA
L M
ON
ETA
RY
FU
ND
SO
UTH
AFR
ICA

SOUTH AFRICA
INTERNATIONAL MONETARY FUND 75
Annex X. Introduction of a National Minimum Wage
An agreement was reached in February 2017 among social partners (government, trade unions,
and employers’ associations) to establish, for the first time in South Africa, a national minimum
wage (NMW). The agreement was informed by extensive consultation of a wide range of domestic
stakeholders and a comprehensive study.1 National minimum wages have the potential to improve
incomes and well-being for workers currently earning less than the proposed minimum. Moreover,
other aspects of the agreement (not discussed in this note), such as measures to reduce the
likelihood and duration of strikes, are expected to improve labor relations and economic efficiency.
At the same time, minimum wages can induce some firms that currently pay workers less than the
proposed minimum to reduce employment. This note places the new NMW in context through
comparisons to other countries and to existing sectoral minimum wages in South Africa. It also
analyses how many workers are currently employed at wages below the NMW in each sector.
Level and Modalities
1. The NMW is set at R20 per hour (equivalent to $1.35 at market exchange rate at end-2016
or $3.44 at 2016 purchasing power parity). The expectation is that this would normally translate
into R3,500 per month, given a mode of 175 hours per month. It is envisaged that the NMW would
become effective in May 2018. Two sectors will have a lower minimum wage upon introduction of
the NMW: farm workers (R18, or 90 percent of NMW) and domestic workers (R15, or 75 percent of
NMW). It is expected that the exemption will be a transitional arrangement lasting for two years.
International Comparisons
2. Several indicators are widely used to compare minimum wages internationally, including
(i) the minimum-to-median wage ratio, (ii) the minimum-to-mean wage ratio, and (iii) the
minimum wage to gross national income (GNI) ratio. The first measure, the minimum-to-median
wage ratio, is usually considered the most appropriate one because the median wage is generally
closer than the mean wage or GNI to the wage levels of workers in the proximity of the minimum
wage. (In all countries, the mean is higher than the median, because a large share of the
population earns relatively low wages, and a small share earns very high wages). This is even more
so for South Africa, where the distribution of wages is highly unequal, and thus the gap between
the median and the mean is especially large.
3. The international minimum-to-median ratio has been computed using the latest available
data (usually for 2015) for the minimum and median wages from the OECD database.2 For 11
emerging market countries not covered by that source, the Rani et al. (2013) estimation has been
1 National Minimum Wage Panel Report to the Deputy President, 2016, A National Minimum Wage for South Africa.
This note draws on that report and uses some of the same data sources.
2 The OECD data is from https://data.oecd.org/

SOUTH AFRICA
76 INTERNATIONAL MONETARY FUND
used.3 For South Africa, the data refer to the projected median monthly wage of R3,250 in May
2018 (when the NMW may become effective). The projection is obtained by applying the median
wage growth rate of 2 percent observed from 2014 to 20154 to the 2015 median monthly wage of
R3,100 (LMDS2015). On that basis, the NMW would be slightly above the median wage (1.08 ratio),
that is, the NMW would be higher than the projected wage for slightly more than half of the
workers. Indeed, South Africa’s minimum-to-median ratio would be the highest in the sample
(Figure A10.1). Alternatively, considering the minimum-to-median ratio of 0.72 estimated in the
panel’s report based on the 2014 wage distribution excluding the agriculture and domestic workers
and adjusting the median wage by inflation till May 2018, South Africa would rank as the fifth
highest.
4. Considering instead the minimum-to-mean wage ratio (Figure A10.2), South Africa is
among the lowest in the sample. This result holds using the 0.33 ratio estimated in the panel’s
report or the 0.36 computed as the ratio between the minimum wage and the projected mean
wage for May 2018 (applying the IMF staff’s projected CPI inflation in 2017 and 2018 to the mean
wage in 2016). As noted above, the large discrepancy between the minimum-to-median ratio and
the minimum-to-mean ratio reflects major wage inequality in South Africa, which drives down the
median wage substantially for a given average wage.
5. Using the ratio of the minimum wage to the per capita GNI for 2015, South Africa is the
highest among the BRICS countries and higher than the majority of the countries in the sample. As
the GNI data refer to 2015, to compute the ratio for South Africa, the minimum wage of R3500
(effective in May 2018) was converted to 2015 prices by using actual CPI inflation in 2016 and the
projected inflation for 2017 and 2018.
3 Since South Africa has aspects of both an advanced and an emerging economy, this annex seeks to compare the
minimum wage level in South Africa with the one prevailing in a broad sample of advanced and emerging
economies. For this purpose, the OECD database and the database from Rani et.al (2013) have been combined
given their broad coverage of advanced and emerging economies respectively.
4 The median monthly wages are R3,033 and R3,100 for 2014 and 2015 respectively. An alternative is to use the past
5-year average median wage growth rate (1.4 percent given that the 2010 median monthly wage is R2,900), which
would generate similar results

SOUTH AFRICA
INTERNATIONAL MONETARY FUND 77
Figure A10.1. Minimum-to-median wage ratio
Sources: OECD 2015, Rani et.al 2013, LMDS2015 and IMF staff calculation
Figure A10.2. Minimum-to-mean wage ratio
Sources: OECD 2015, Rani et al. 2013, LMDS 2015 and IMF staff calculation
Figure A10.3. 2015 Minimum wage (PPP)/GNI (PPP)
Sources: OECD 2015, World Bank and IMF staff calculation
0.33 0.36
0.0
0.1
0.2
0.3
0.4
0.5
0.6
0.7
0.8
0.9
Un
ited
Sta
tes
Mali
Mexic
o
Sp
ain
Gre
ece
SA
(O
ffic
ial)
Czech
Rep
ub
lic
Tu
rkey
Jap
an
Esto
nia
So
uth
Afr
ica
Slo
vak
Vie
tnam
Irela
nd
Ko
rea
Ne
the
rlan
ds
Mala
ysia
Ind
ia
Ro
man
ia
Hu
ng
ary
Can
ad
a
Lit
hu
an
ia
Un
ited
Kin
gd
om
Po
rtu
gal
Po
land
Latv
ia
Belg
ium
Isra
el
Germ
an
y
Au
str
alia
Lu
xem
bo
urg
Ch
ile
Bra
zil
Co
sta
Ric
a
Slo
ven
ia
Fra
nce
Peru
Ne
w Z
eala
nd
Co
lom
bia
Co
sta
Ric
a
Ind
on
esia
Ph
ilip
pin
es
0.72
1.08
0.0
0.2
0.4
0.6
0.8
1.0
1.2
Un
ited
Sta
tes
Sp
ain
Mexic
o
Czech R
ep
ub
lic
Jap
an
Vie
tna
m
Est
on
ia
Ire
land
Ca
nad
a
Neth
erl
and
s
Slo
vak R
ep
ub
lic
Gre
ece
Ge
rman
y
Mali
Ko
rea
Un
ited
Kin
gd
om
Belg
ium
Lit
hu
an
ia
Po
lan
d
Latv
ia
Tu
rkey
Hun
gary
Au
stra
lia
Ro
mania
Luxem
bo
urg
Mala
ysi
a
Po
rtu
gal
Isra
el
New
Zeala
nd
Slo
ven
ia
Fra
nce
Ch
ile
Peru
Co
sta
Ric
a
Ind
ia
SA
(O
ffic
ial)
Bra
zil
Co
lom
bia
Ph
ilip
pin
es
Ind
on
esi
a
So
uth
Afr
ica
0.51
0.0
0.1
0.2
0.3
0.4
0.5
0.6
0.7
0.8
Mex
ico
Ru
ssia
n Fe
dera
tion
Un
ited
Sta
tes
Cze
ch R
epu
blic
Esto
nia
Slo
vak
Rep
ub
lic
Ch
ile
Ch
ina
Bra
zil
Ro
man
ia
Latv
ia
Luxe
mb
ou
rg
Japa
n
Hu
nga
ry
Spai
n
Isra
el
Can
ada
Irel
and
Port
ug
al
Mal
ta
Ko
rea
Pola
nd
Un
ited
Kin
gd
om
Gre
ece
Net
her
land
s
Aus
tral
ia
Sout
h A
fric
a
Bel
giu
m
Slo
ven
ia
Fran
ce
Ger
man
y
Co
lom
bia
New
Zea
land
Turk
ey
Co
sta
Ric
a

SOUTH AFRICA
78 INTERNATIONAL MONETARY FUND
Comparing the NMW with the Existing Wage Distribution and Sectoral Minimum Wages
6. The proposed NMW is higher than the wages currently earned by 47.3 percent of total
employed workers (Table A10.1).5 The sectors with the largest shares of workers currently below the
NMW are agriculture (84.5 percent) and the private household sector (90.7 percent). Half of the
workers in construction as well as wholesale and retail trade also currently earn less than the NMW.
The bulk of workers in modern, formal firms in internationally-integrated industries, especially
mining, manufacturing, and financial services earn wages well in excess of the NWM.
7. The proposed NMW is also above a majority of the sectoral minimum wages already in
place in South Africa (Table A10.2). The May 2018 NMW has been converted to 2016 prices using
the projected average inflation of 6 percent in 2017–18 and it has been adjusted for agriculture
(90 percent of NMW) and domestic workers (75 percent of NMW). In some cases, existing
minimum wages depend not only on the sector but also on factors such as job subcategories,
seniority, etc. Existing sectoral minimum wages are at or below the proposed NMW except the top
end of the minimum wages for private security as well as wholesale and retail trade.
Table A10.1. Workers currently earning less than NMW, by sector
Sources: National Minimum Wage Panel Report to the Deputy President 2016 and IMF staff calculations.
5 Wage data are drawn from the National Minimum Wage Panel Report to the Deputy President 2016.
Sector
Number of
Workers
Number of Workers
within Industry
Earning Below R3500
Workers Within
Industry Earning
Below R3500
Share of Total
Number of Workers
Earning Below R3500
Share of Total
Number of Workers
Earning Below R3500
Agriculture 657,286 555,193 84.5% 4.2% 8.9%
Mining and Quarrying 427,869 77,912 18.2% 0.6% 1.3%
Manufacturing 1,565,716 622,181 39.7% 4.7% 10.0%
Electricity, gas and water supply 117,118 27,982 23.9% 0.2% 0.5%
Construction 948,331 517,786 54.6% 3.9% 8.3%
Wholesale and Retail Trade 2,307,491 1,112,935 48.2% 8.5% 17.9%
Transport, storage and communications 810,423 319,453 39.4% 2.4% 5.1%
Financial Services 1,816,839 671,008 36.9% 5.1% 10.8%
CSP 3,261,921 1,190,986 36.5% 9.1% 19.2%
Private Households 1,235,770 1,120,636 90.7% 8.5% 18.0%
Other 3,933 2,021 51.4% 0.0% 0.0%
Total 13,152,697 6,218,092 47.3% 100.0%

SOUTH AFRICA
INTERNATIONAL MONETARY FUND 79
Table A10.2. Comparison between the 2016 sectoral minimum wages and the NMW
Sectoral SD Range SD-to-NMW Ratio
Agriculture R2,789 0.96
Forestry R2,789 0.96
Domestic Workers R1,940-R2,210 0.80-0.91
Private Security R2,212-R6,586 0.69-2.04
Wholesale and Retail R2,690-R6,961 0.84-2.16
Taxi R2,261-R3,232 0.70-1.00
Hospitality R2,954-R3,292 0.92-1.02
Contract Cleaners R3,043-R3,341 0.94-1.04
Sources: Department of Labor and IMF staff calculations.
Notes: The sectoral minimum wages in some cases depend on factors such as the subcategory of job, seniority, etc.
Thus, the table reports the range of minimum wages for each sector. The NMW (May 2018) has been adjusted
to 2016 prices using the projected 6 percent inflation rate. The domestic workers minimum wage is 75 percent of the
NMW and agricultural minimum wage is 90 percent of the NMW.
Compliance Rates
8. The impact of introducing the NMW on both employment and inequality depends on the
extent to which employers comply with it. International experience suggests that, especially in non-
advanced economies, high minimum wages are usually accompanied by a significant share of
informal employment as well as low compliance. For instance, considering the three countries with
the highest minimum-to-median wage ratios following South Africa in Figure A10.1, the share of
informal employment is estimated at 55 percent for Colombia (ILO 2014), 60 percent for Indonesia
(Rani et al. 2013) and 71 percent for the Philippines (ILO 2014). Rates of compliance with the
minimum wage are estimated at 47 percent for Indonesia and 59 percent for the Philippines, as
well as 30 percent for Costa Rica—another country with a relatively high minimum wage (Gindling
and Trejos 2010). Similarly, in Turkey, it is estimated that half of women and 30 percent of men are
employed in the informal sector (IMF 2016).6
9. International experience suggests that increases in minimum wages can reduce compliance
as well. For example, in Indonesia, 21 percent of regular wage employees received wages below
the applicable provincial minimum wage in August 2001. Between 2003 and 2008, when minimum
wage was steadily increased and average wages stagnated, non-compliance rose to nearly
40 percent. The empirical association between higher minimum wages and a lower share of
workers in formal activities has also been documented for Kenya (Andalón and Pagés 2007),
Nicaragua (Alaniz, Gindling and Terrell 2011), and Turkey (IMF 2016).
6 To encourage compliance and to reduce any associated adverse effects on employment, Turkey reduces the fiscal
burden on minimum wage earners and their employers.

SOUTH AFRICA
80 INTERNATIONAL MONETARY FUND
In South Africa, whereas informal workers represent a relatively low share of total employees
(16.7 percent in 2016Q4, Quarterly Labor Force Survey), the rate of compliance with minimum
wages in the formal sector is estimated to be only 55 percent, with an average shortfall of
36 percent of the applicable minimum wage (Bhorat, Kanbur and Mayet 2010, 2012). The impact of
introducing a NMW would be mitigated by such relatively low compliance rates, and they could
drop further as a result of the rise in applicable minimum wages.
Poverty Reduction
10. Whereas the NMW would likely reduce inequality, the impact on poverty of introducing the
proposed NMW is likely to be limited. Families in the lowest-income quintile (containing almost
one third of the population) earn only 24 percent of their family income, that is R1,671 on average,
from wages, and only 36.2 percent of the households in the lowest-income quintile are working
households. About 76 percent of the monthly family income of this quintile is from social grants
(R1,270). Moreover, people in the lowest-income quintile are usually employed in the informal
sector or the sectors with the lowest compliance with minimum wages, such as agriculture,
security, and domestic work and would therefore be less likely to see wage increases as a result of
the introduction of the NMW. Overall, the NMW’s effects in reducing poverty for the poorest
families should not be overestimated. Other policies are needed to make a more significant dent in
poverty.
Figure A10.4. Household income structure and working household percentage
Impact on Employment and Other Macroeconomic Variables
11. South African studies provide supporting evidence to allow fragile sectors, such as
agriculture and domestic work to have a lower minimum wage upon introduction of the NMW.
Conradie (2004), using data from a survey of 190 grape farmers, shows that a wage increase of 10
percent will decrease employment by between three and 6 percent. Bhorat, Kanbur and Stanwix
(2015) and Garber (2015) show that after the sectoral minimum wage law in agriculture was
launched in 2003, wages rose by approximately 17 percent, and the probability of employment for

SOUTH AFRICA
INTERNATIONAL MONETARY FUND 81
a farmer fell by approximately 13 percent in the post-law period. The elasticity of employment
demand with respect to wages, and thus the impact on jobs of increases in the minimum wage,
depends on various factors difficult to estimate. Among them is the extent to which firms enjoy
economic rents. In cases where such rents exist and currently accrue to the firms' owners, an
increase in the minimum wage would shift part of the rents to the workers, with limited effect on
employment. On the other hand, job losses could be more sizable in more competitive markets.
12. The impact of the NMW on international competitiveness or the government’s wage bill is
likely to be limited, because most workers in firms engaged in international trade as well as
government employees already earn wages above the proposed NMW. Likewise, no mechanism is
envisaged whereby the introduction of the NMW would shift the entire wage structure in firms or
the government.
Conclusion
13. The NMW level seeks to balance the objectives of ensuring a reasonable living standard for
millions of workers who are currently near or below the poverty line, and of preserving
employment levels. The proposed NMW, at R20 per hour, is nevertheless on the high side of
several comparisons (i.e., with other countries, with existing sectoral minimum wages in South
Africa, and with the current wage levels for large segments of South Africa’s employed labor force)
risking adverse employment effects. Employment performance should therefore be closely
monitored after the NMW becomes effective, especially in the sectors most likely to be affected. To
reduce the possibility of undue employment reductions, rules-based exemptions beyond those for
agriculture and domestic workers could be considered—for example, for newly-hired youth.
Should employment performance worsen significantly for small- and medium-sized enterprises,
the introduction of complementary measures should be considered to provide them with adequate
support
SOUTH AFRICA
82 INTERNATIONAL MONETARY FUND
References
Alaniz, Enrique, T.H. Gindling and Katherine Terrell. 2011. “The Impact of Minimum Wages on Wages,
Work and Poverty in Nicaragua”, Labour Economics, Vol. 18.
Allen, Emma. 2016. “Analysis of Trends and Challenges in the Indonesian Labor Market”, Asian
Development Bank Papers on Indonesia.
Andalón, Mabel and Carmen Pagés. 2008. “Minimum Wages in Kenya”, Institute for the Study of
Labor Discussing Paper, No. 3 390.
Bhorat, Haroon, Ravi Kanbur, and Natasha Mayet. 2010. “Minimum Wage Enforcement in South
Africa: Measurement and Determinants”, Trade & Industrial Policy Strategies Annual Forum
Papers.
________. 2012. “Minimum Wage Violation in South Africa”, International Labour Review, Vol. 151, Issue 3.
Bhorat, Haroon Ravi Kanbur and Benjamin Stanwix. 2014., “Estimating Impact on Minimum Wages
on Employment, Wages, and Non-Wage Benefits: The Case of Agriculture in South Africa”,
American Journal of Agricultural Economics, 96(5).
Conradie, B. 2004. "Wages and wage elasticities for wine and table grapes in South Africa," Centre
for Social Science Research, Working Paper 90, University of Cape Town. Available from:
http://www.cssr.uct.ac.za
Garbers, Chris. 2015. “The Impact of the Agricultural Minimum Wage on Farmworker Employment in
South Africa: A fixed Effects Approach”, Stellenbosch University Working Paper.
Gindling, T. H. and Juan Diego Trejos. 2010. “Improving Compliance with Legal Minimum Wages in
Costa Rica”, Working Paper No.1 27, Department of Economics, University of Maryland.
IMF. 2016. “Turkey: Selected Issues”, IMF Country Report No.1 6/105 (Washington).
ILO. 2012. “Statistical update on employment in the informal economy”, Working Paper.
ILO. 2014. “Trends in informal employment in Colombia: 2009 –2013”, Notes on Formalization.
Murray, J. and C. van Walbeek. 2007. "Impact of the Sectoral determination for farm workers on the
South African sugar industry: case study of the Kwazulu-Natal North and South Coasts,"
Centre for Social Science Research, Working Paper 181, University of Cape Town, available
from: http://www.cssr.uct.ac.za
Rani, U., P. Belser, S. Oelz and S. Ranjbar. 2013. “Minimum wage coverage and compliance in
developing countries”, International Labour Review, Vol. 152, Issue 3–4.
South African Department of Labour, 2016Q4, “Quarterly Labour Force Survey 2016 Q4”

SOUTH AFRICA
83 INTERNATIONAL MONETARY FUND
Annex XI. Educational Outcomes: Causes and Consequences
1. South Africa suffers from weak educational attainment, despite public spending on
education equivalent to over 6 percent of its GDP, on par with many OECD countries. South
Africa was second-to-last in a ranking of 39 countries by the International Association for
Evaluation of Educational Achievement for eighth-grade student mathematics performance in
2015 (Figure A11.1). About half of South Africa’s students drop out of school before completing
secondary education. Among the students attending the end of school examination, about a
quarter fail. Less than 5 percent of students who start primary school end up with a university
diploma. Another OECD report shows that more than two-thirds of South African students lack
basic skills, a significantly worse performance than in most countries surveyed.1
2. The performance of South Africa’s education system lags considerably behind other
countries (such as Romania, Thailand, and Tunisia) with similar education spending in 2015
(Figure A11.2). South Africa’s scores are also well below the line-of-best-fit between educational
attainment and GDP per capita (Figure A11.3). South Africa’s results in terms of basic skills are
similar or, in some cases, significantly worse than in neighboring countries, as evidenced by the
Southern and Eastern African Consortium for Monitoring Education Quality (SACMEQ)
mathematics and reading skill evaluation for six-grade students (Table A11.1), although South
Africa spends 2-3 times more per pupil than do its neighbors.
Figure A11.1 2015 TIMSS Eighth-Grade Student Mathematics Evaluations Score
Sources: IEA, World Bank and IMF staff calculation.
1 OECD, July 2015, South Africa Policy Brief.
0
100
200
300
400
500
600
700
Sin
gapo
re
Ko
rea
Taiw
an P
OC
Ho
ng
Ko
ng
SA
R
Japan
Ru
ssia
Kaza
kh
stan
Can
ada
Irela
nd
Eng
lan
d
Un
ited
Sta
tes
Slo
ven
ia
Hu
ngary
No
rway
Lith
uania
Isra
el
Aust
ralia
Sw
ed
en
Italy
Malt
a
New
Zeala
nd
Mala
ysia
Un
ited
Ara
b E
mir
ates
Tu
rkey
Bah
rain
Geo
rgia
Leb
ano
n
Qata
r
Iran
Th
aila
nd
Ch
ile
Om
an
Kuw
ait
Eg
ypt
Bots
wan
a
Jord
an
Mo
rocc
o
So
uth
Afr
ica
Saud
i A
rab
ia
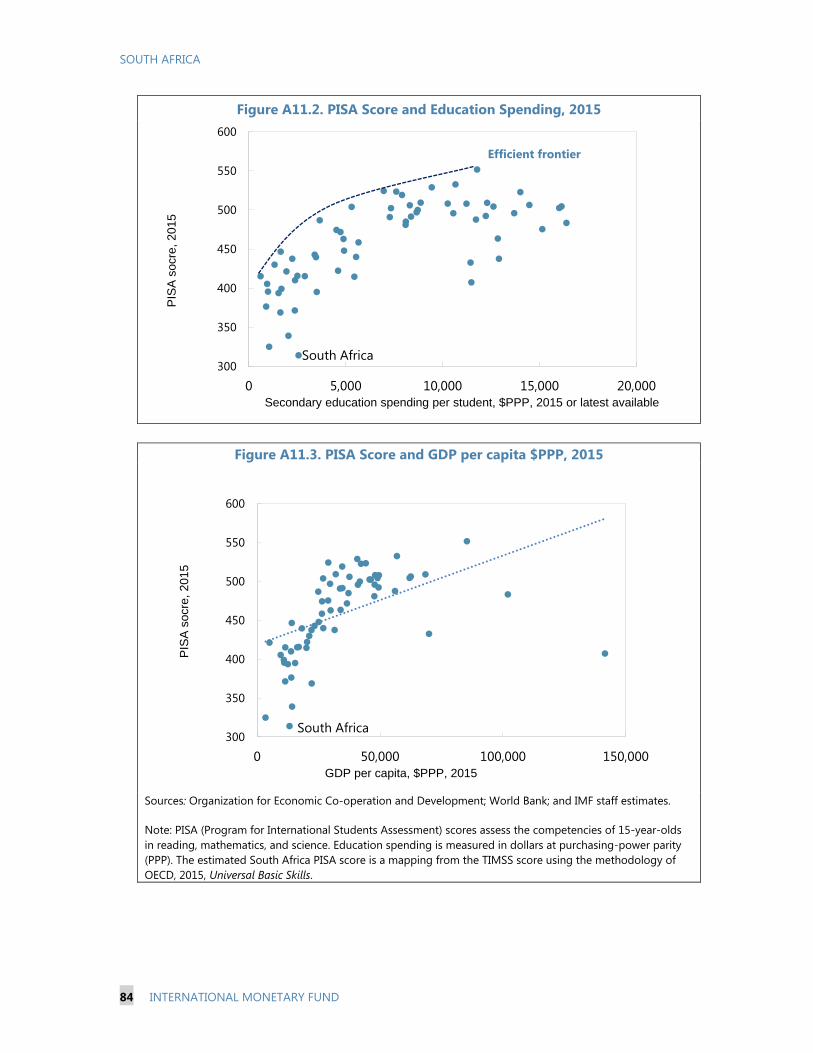
SOUTH AFRICA
84 INTERNATIONAL MONETARY FUND
Figure A11.2. PISA Score and Education Spending, 2015
Figure A11.3. PISA Score and GDP per capita $PPP, 2015
Sources: Organization for Economic Co-operation and Development; World Bank; and IMF staff estimates.
Note: PISA (Program for International Students Assessment) scores assess the competencies of 15-year-olds
in reading, mathematics, and science. Education spending is measured in dollars at purchasing-power parity
(PPP). The estimated South Africa PISA score is a mapping from the TIMSS score using the methodology of
OECD, 2015, Universal Basic Skills.
South Africa300
350
400
450
500
550
600
0 5,000 10,000 15,000 20,000
PIS
A s
ocre
, 2
015
Secondary education spending per student, $PPP, 2015 or latest available
Efficient frontier
South Africa300
350
400
450
500
550
600
0 50,000 100,000 150,000
PIS
A s
ocre
, 2015
GDP per capita, $PPP, 2015

SOUTH AFRICA
INTERNATIONAL MONETARY FUND 85
Table A11.1. 2007 and 2013 SACMEQ test results
Sources: Southern and Eastern African Consortium for Monitoring Education Quality (SACMEQ).
3. Multiple and complex factors contribute to South Africa’s underperformance in
education, often related to the legacy of apartheid, as reflected in differences in
educational attainments among the various races. A sizable share of today’s teachers received
inadequate education as they grew up under apartheid.2 While total spending on education is
comparable to that of many other countries, a likely contributing factor to weak outcomes is its
uneven distribution. Notwithstanding the government’s pro-poor school funding policy, public
schools in urban areas and those located in richer neighborhoods tend to have more resources
per pupil than those in poorer areas, sometimes supplemented by private resources. Moreover,
although children from low-income families have been exempted from school tuition, other costs
such as transport and uniforms remain burdensome for them.
4. Weak educational attainment has profound social and economic consequences. It
contributes to wide income disparities and high unemployment, perpetuates the
intergenerational transmission of poverty, and constrains economic growth. The rate of
unemployment decreases sharply with the level of education, with an especially large premium
for having a university degree.
5. To improve educational outcomes, several reforms could be considered:
(i) strengthening the training and accountability of teachers, some of whom may need to be
upgraded; (ii) improving equity and efficiency in the allocation of resources between rural and
urban areas; and (iii) closer coordination between tertiary educational institutions and employers
2 OECD, 2013, Improving Education Quality in South Africa.
Country
2007 2013 Difference 2007 2013 Difference
Mauritius 574 597 23 623 694 71
Kenya 543 601 58 557 651 94
Seychelles 575 602 27 551 630 79
Swaziland 549 590 41 541 601 60
Botswana 535 582 47 521 598 77
South Africa 495 558 63 495 587 92
Uganda 479 554 75 482 580 98
Zimbabwe 508 528 20 520 566 46
Lesotho 468 531 63 477 559 82
Namibia 497 599 102 471 558 87
Mozambique 476 519 43 484 558 74
Zambia 434 494 60 435 522 87
Malawi 434 434 0 447 522 75
SACMEQ (Average) 500 507 7 507 584 77
Learner reading score Learner mathematics score

SOUTH AFRICA
86 INTERNATIONAL MONETARY FUND
to strengthen the labor market relevance of education, including internships and other avenues
for school-to-work transition, particularly for disadvantaged youth.

South Africa Article IV Information Annex—JMAP World Bank IMF Matrix
SOUTH AFRICA
STAFF REPORT FOR THE 2017 ARTICLE IV
CONSULTATION—INFORMATIONAL ANNEX
Prepared By
The African Department
(In collaboration with other departments and the World
Bank)
RELATIONS WITH THE IMF __________________________________________________________ 2
THE JMAP WORLD BANK IMF MATRIX _____________________________________________ 5
STATISTICAL ISSUES _________________________________________________________________ 8
CONTENTS
June 9, 2017
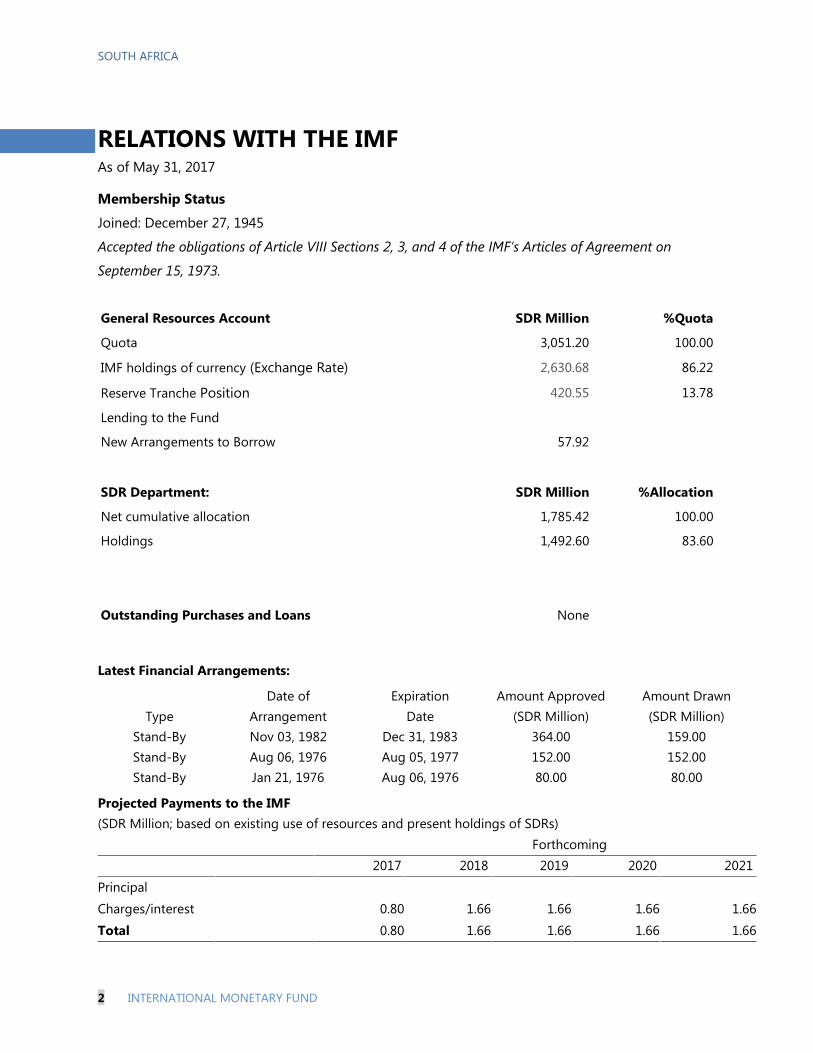
SOUTH AFRICA
2 INTERNATIONAL MONETARY FUND
RELATIONS WITH THE IMF As of May 31, 2017
Membership Status
Joined: December 27, 1945
Accepted the obligations of Article VIII Sections 2, 3, and 4 of the IMF’s Articles of Agreement on
September 15, 1973.
General Resources Account SDR Million %Quota
Quota 3,051.20 100.00
IMF holdings of currency (Exchange Rate) 2,630.68 86.22
Reserve Tranche Position 420.55 13.78
Lending to the Fund
New Arrangements to Borrow 57.92
SDR Department: SDR Million %Allocation
Net cumulative allocation 1,785.42 100.00
Holdings 1,492.60 83.60
Outstanding Purchases and Loans None
Latest Financial Arrangements:
Date of Expiration Amount Approved Amount Drawn
Type Arrangement Date (SDR Million) (SDR Million)
Stand-By Nov 03, 1982 Dec 31, 1983 364.00 159.00
Stand-By Aug 06, 1976 Aug 05, 1977 152.00 152.00
Stand-By Jan 21, 1976 Aug 06, 1976 80.00 80.00
Projected Payments to the IMF
(SDR Million; based on existing use of resources and present holdings of SDRs)
Forthcoming
2017 2018 2019 2020 2021
Principal
Charges/interest 0.80 1.66 1.66 1.66 1.66
Total 0.80 1.66 1.66 1.66 1.66

SOUTH AFRICA
INTERNATIONAL MONETARY FUND 3
Exchange rate arrangement
The rand floats against other currencies, and South Africa maintains an exchange system
consistent with obligations under Article VIII of the IMF’s Articles of Agreement.1 South
Africa’s de jure exchange rate arrangement is free floating, and the de facto arrangement is floating.
Its exchange system is free of multiple currency practices and restrictions on the making of
payments and transfers for current international transactions. South Africa has continued to
gradually liberalize the system of capital controls in place since the apartheid regime.
With the abolition of the financial rand in 1995, all exchange controls on nonresidents were
eliminated. Nonresidents are free to purchase shares, bonds, and other assets and to repatriate
dividends, interest receipts, and current and capital profits, as well as the original investment capital.
Foreign companies, African governments, and institutions may list equity and debt instruments on
South Africa’s securities exchanges.
Exchange controls on capital transactions by residents have been gradually relaxed. The
authorities’ main objective has been to move toward a system based on prudential limits and
supervision, and away from a rigid system of quantitative controls.
Article IV consultation
The 2016 Article IV consultation was concluded by the Executive Board on July 1, 2016. South Africa
is on the standard 12-month Article IV consultation cycle.
Technical assistance
Fiscal Affairs Department (FAD) technical assistance (TA) missions
In April 2013, an FAD TA mission visited Cape Town to support the authorities in the establishment
of a new Parliamentary Budget Office (PBO). An FAD mission visited Pretoria in August 2013 to
discuss options for the National Treasury to strengthen their performance management systems. In
December 2013, the National Treasury and FAD held a joint workshop on fiscal risks. In June 2014,
FAD missions provided advice on expenditure reviews and on options for further strengthening the
PBO, while a mission visited the South African Revenue Service (SARS) to conduct a pilot of the Tax
Administration Diagnostic Assessment Tool (TADAT). As part of the technical support for the Davis
Tax Committee, an FAD mission on VAT gaps took place in August 2014 and January 2015, and
missions on natural resource taxation took place in January and November 2015. An FAD mission
visited Pretoria in March 2015 on public sector balance sheets. In December 2015, an FAD mission
conducted a workshop on wage bill management and PBO analysis. In March 2016, an FAD mission
followed up on the review of mining and petroleum fiscal regimes.
1 South Africa accepted the Article VIII, Section 2(a), 3, and 4 obligations in 1973.

SOUTH AFRICA
4 INTERNATIONAL MONETARY FUND
Monetary and Capital Markets Department (MCM) technical assistance (TA) missions
In May 2014, an MCM mission took place to conduct the training on banking sector stress test for
the SARB. In August 2015, an MCM mission conducted seminars on stress testing.
Legal Department (MCM) technical assistance (TA) missions
In January 2015, a LEG mission provided technical assistance on fiscal law of the extractive industries
in conjunction with FAD’s mission on national taxation.

SOUTH AFRICA
INTERNATIONAL MONETARY FUND 5
THE JMAP WORLD BANK IMF MATRIX
The IMF South Africa team led by Mr. Paolo Mauro (mission chief) met with the World Bank South
Africa team led by Mr. Sebastian Dessus in May 2017, to discuss macrocritical structural issues.
The teams agreed that South Africa’s macroeconomic challenges include promoting job creation
and improving the long-run inclusive growth needed for maintaining social cohesion, and
macroeconomic stability.
The teams have the following requests for information from their counterparts:
The IMF team asks to be kept informed of progress in the macrocritical structural reform areas
under the World Bank’s purview. Timing: when milestones are reached or in the context of
missions (and at least semiannually).
The World Bank team asks to be kept informed of progress in the macrocritical structural reform
areas under the IMF’s purview. Timing: when milestones are reached (and at least semiannually).
Table 1 lists the teams’ separate and joint work programs during May, 2017–May, 2018.

SOUTH AFRICA
6 INTERNATIONAL MONETARY FUND
Table 1. South Africa: Bank and IMF Planned Activities in Macrocritical
Reform Areas, May 2017-May 2018
Title Products Expected Delivery Date
1. World Bank
Work Program1 $3.75b IBRD Eskom operation Ongoing
Ongoing $250m CTF renewable (solar and wind)
operation
Ongoing
Isimangaliso Wetland Project (GEF) $9.0 m Ongoing
Carbon Capture and Storage Development TA, US$14
million Ongoing
Land Bank Financial Intermediation Loan (US$100m) Ongoing
Cities Support Program Reimbursable Advisory
Services (RAS) Ongoing
Rural Development and land reform Reimbursable
Advisory Services (RAS) Ongoing
PFM dialogue Ongoing
Economic Updates
Systematic Country Diagnostic
Semiannual
December 2017
National Health Insurance TA Ongoing (Knowledge Hub)
TB and HIV/AIDS Program Ongoing (Knowledge Hub)
Financial sector stability, including financial inclusion
dialogue Ongoing
TA on helping the NT and the relevant stakeholders
decide on how to improve the secondary market
architecture
Analysis of productivity trends and labor demand in
South Africa (w/ National Treasury)
Contingent Liability TA with National Treasury
Analysis of effect of potential downgrade to sub-
investment grade on public borrowing costs
Analysis of effective tax rates and efficacy of tax
incentives
Analysis of innovation policy (w/ National Treasury and
Department of Science and Technology)
Doing Business Reform
Ongoing
Ongoing
Ongoing
Complete
Complete
Ongoing
Ongoing

SOUTH AFRICA
INTERNATIONAL MONETARY FUND 7
Analysis of competition policy
Analysis of impact of rand volatility on investment
Poverty and Inequality Assessment
Ongoing
Ongoing
Ongoing
TA supporting the revision of the strategic
benchmarks by the NT based on cost and risk analysis
through an analytical tool to be developed
Ongoing
Technical advisory services with the SARB and
GEPF/PIC on the management of the official foreign
currency reserves and the pension assets respectively
Ongoing
Private Investment Program Ongoing
2. IMF Work Program
Introduction of a National Minimum Wage Ongoing
Financial Inclusion Ongoing
Macro-financial linkages in South Africa
Exchange rate pass-through to core inflation
SOE reform
Educational Outcomes: Causes and Consequences
All Ongoing
3. Joint products in the next 12 months
No joint products planned at this time
1/ Missions are ad hoc, but generally occur twice a year.

SOUTH AFRICA
8 INTERNATIONAL MONETARY FUND
STATISTICAL ISSUES
I. Assessment of Data Adequacy for Surveillance
General: Data provided to the IMF are adequate for surveillance.
Real sector statistics: Reporting of real sector data for International Financial Statistics (IFS) is
timely. Statistics South Africa (SSA), which has been responsible for compiling GDP data by
production, has now also taken over the compilation of GDP data by expenditure from the South
African Reserve Bank (SARB). The revised 2010−15 GDP data were published in May 2016. GDP data
are compiled according to SNA2008, with a base year of 2010.
Quarterly labor market statistics are published one month after the end of the previous quarter.
Given the seriousness of the unemployment problem, labor market analysis and policy design would
benefit from better and more frequent labor market data. A new Quarterly Labor Force Survey
(QLFS) was launched in January 2008 based on major revisions to the old Labour Force Survey that
was in existence since 2000. Since 2015, a new Master Sample has been introduced based on the
2011 census data. The new Master Sample should improve the level of precision in the estimates
produced compared to the prior Master Sample which was only based on the prior census in 2001.
The consumer price index (CPI) covers all households living in metropolitan and urban areas, which
represent approximately 61 percent of the total number of households based on the 2010/11
Income and Expenditure Survey. The current CPI weights were derived primarily from SSA’s
household expenditure survey. Current price indices are compiled with December 2016=100.
Government Finance Statistics: To move toward fiscal analysis based on the Government Finance
Statistics (GFS) framework in compliance with the GFS Manual 2014, fiscal data provided for
surveillance by the Treasury Department and data reported to IMF’s Statistics Department (STA) for
GFS database need to be fully reconciled. Treasury Department’s fiscal data covers a part of the
general government and do not include the corresponding balance sheet data. Data reported for
GFS database, compiled by the South African Reserve Bank (SARB), cover all the general government
subsectors and include the balance sheet data.
Monetary and Financial Statistics: Monetary statistics compiled by the SARB are consistent with
the methodology of the Monetary and Financial Statistics Manual. South Africa reports regular and
good quality monetary statistics for publication in the IFS, although there is room for improving the
timeliness of the data on other financial corporations.
Financial sector surveillance: South Africa reports quarterly Financial Soundness Indicators (FSIs) to
the Fund, which are published on the IMF’s FSI website. The reported information comprises all the
core FSIs, 13 encouraged FSIs for deposit takers, and 2 encouraged FSI for other financial
corporations (OFCs).
SOUTH AFRICA
INTERNATIONAL MONETARY FUND 9
External sector statistics: Balance of payments and international investment position data are
reported quarterly and are broadly consistent with the sixth edition of the Balance of Payments and
International Investment Position Manual (BPM6). The authorities improved the coverage of trade
flows within the Southern African Customs Union (SACU) in 2013. Work is needed to improve the
reliability and accuracy of balance of payments data with the aim of reducing errors and omissions.
Data on the international reserves position are disseminated in line with the requirements of the
IMF’s Data Template on International Reserves and Foreign Currency Liquidity. South Africa also
participate in the IMF’s Coordinated Portfolio Investment Survey (CPIS) and Coordinated Direct
Investment Survey (CDIS).
II. Data Standards and Quality
South Africa subscribed to the Special Data Dissemination Standard (SDDS) on August 2, 1996, and
is in observance of the specifications for coverage, periodicity, and timeliness of data.
A Report on Observance of Standards and Codes—Data Module, Response by the Authorities, and
Detailed Assessments Using the Data Quality Assessment Framework (DQAF) was published on
October 16, 2001.
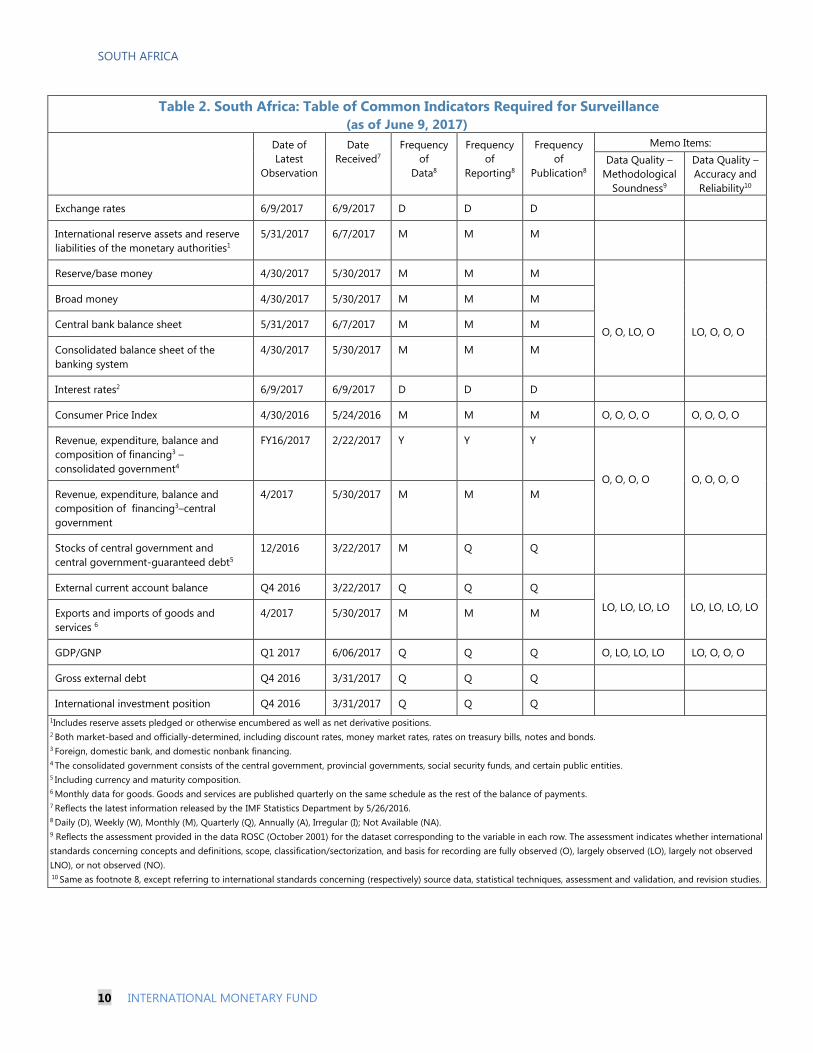
SOUTH AFRICA
10 INTERNATIONAL MONETARY FUND
Table 2. South Africa: Table of Common Indicators Required for Surveillance
(as of June 9, 2017)
Date of
Latest
Observation
Date
Received7
Frequency
of
Data8
Frequency
of
Reporting8
Frequency
of
Publication8
Memo Items:
Data Quality –
Methodological
Soundness9
Data Quality –
Accuracy and
Reliability10
Exchange rates 6/9/2017 6/9/2017 D D D
International reserve assets and reserve
liabilities of the monetary authorities1
5/31/2017 6/7/2017 M M M
Reserve/base money 4/30/2017 5/30/2017 M M M
O, O, LO, O
LO, O, O, O
Broad money 4/30/2017 5/30/2017 M M M
Central bank balance sheet 5/31/2017 6/7/2017 M M M
Consolidated balance sheet of the
banking system
4/30/2017 5/30/2017 M M M
Interest rates2 6/9/2017 6/9/2017 D D D
Consumer Price Index 4/30/2016 5/24/2016 M M M O, O, O, O O, O, O, O
Revenue, expenditure, balance and
composition of financing3 –
consolidated government4
FY16/2017 2/22/2017 Y Y Y
O, O, O, O
O, O, O, O
Revenue, expenditure, balance and
composition of financing3–central
government
4/2017 5/30/2017 M M M
Stocks of central government and
central government-guaranteed debt5
12/2016 3/22/2017 M Q Q
External current account balance Q4 2016 3/22/2017 Q Q Q
LO, LO, LO, LO
LO, LO, LO, LO Exports and imports of goods and
services 6
4/2017 5/30/2017 M M M
GDP/GNP Q1 2017 6/06/2017 Q Q Q O, LO, LO, LO LO, O, O, O
Gross external debt Q4 2016 3/31/2017 Q Q Q
International investment position Q4 2016 3/31/2017 Q Q Q
1Includes reserve assets pledged or otherwise encumbered as well as net derivative positions. 2 Both market-based and officially-determined, including discount rates, money market rates, rates on treasury bills, notes and bonds. 3 Foreign, domestic bank, and domestic nonbank financing.
4 The consolidated government consists of the central government, provincial governments, social security funds, and certain public entities.
5 Including currency and maturity composition. 6 Monthly data for goods. Goods and services are published quarterly on the same schedule as the rest of the balance of payments. 7 Reflects the latest information released by the IMF Statistics Department by 5/26/2016. 8 Daily (D), Weekly (W), Monthly (M), Quarterly (Q), Annually (A), Irregular (I); Not Available (NA).
9 Reflects the assessment provided in the data ROSC (October 2001) for the dataset corresponding to the variable in each row. The assessment indicates whether international
standards concerning concepts and definitions, scope, classification/sectorization, and basis for recording are fully observed (O), largely observed (LO), largely not observed
LNO), or not observed (NO). 10 Same as footnote 8, except referring to international standards concerning (respectively) source data, statistical techniques, assessment and validation, and revision studies.

Statement by Ms. Tshazibana, Alternate Executive Director for South Africa, and Mr. Sishi, Senior Advisor to the Exective Director
June 26, 2017
On behalf of the South African authorities, we thank staff for the useful and detailed discussions during the 2017 Article IV Consultation. We also welcome the comprehensive analysis of economic developments and policy issues. Overall, structural challenges continue to weigh down on economic growth and the living standards of much of the population, making economic transformation even more urgent. The authorities remain concerned about low growth and declining per capita incomes. They broadly share staff’s assessment on the economic outlook and risks, and the need to focus on inclusive growth.
As reflected in the 2017 Budget and all stakeholder engagements, the authorities remain determined to bolster business and consumer confidence and promote investment to stimulate economic growth. While concerns over poor growth are warranted and shared, it is critical to bear in mind that South Africa still has strengths that are essential foundations of growth, including deep and liquid capital markets, a significant majority of total liabilities in domestic currency, a relatively diversified industrial base, and strong constitutional institutions.
Recent Economic Developments and Outlook
Recent economic developments reflect a combination of macroeconomic improvements alongside deterioration in some other areas. The normalization in rainfall patterns has supported a rebound in agricultural output, while mining production is up on the back of moderate improvements in commodity prices. Household debt stocks – which peaked at nearly 90 percent of disposable incomes in 2008 – are now back to 2006 levels, slightly above 70 percent. The current account deficit has also narrowed on the back of an increasingly positive trade balance, moving to below 4 percent of GDP in 2016, while inflation has moderated. However, subdued manufacturing production and weakness in the retail and financial sectors continued to weigh on growth, resulting in the contraction of GDP in the fourth quarter of 2016 as well as in the first quarter of 2017.
Consistent with the broad trends in staff’s assessment, the authorities expect a rebound in economic performance over the medium-term. Official forecasts tabled in February 2017 are for growth of 1.3 percent in 2017 and 2 percent in 2018. A revised forecast that takes first and second quarter growth outcomes into account will be published in the Medium-Term
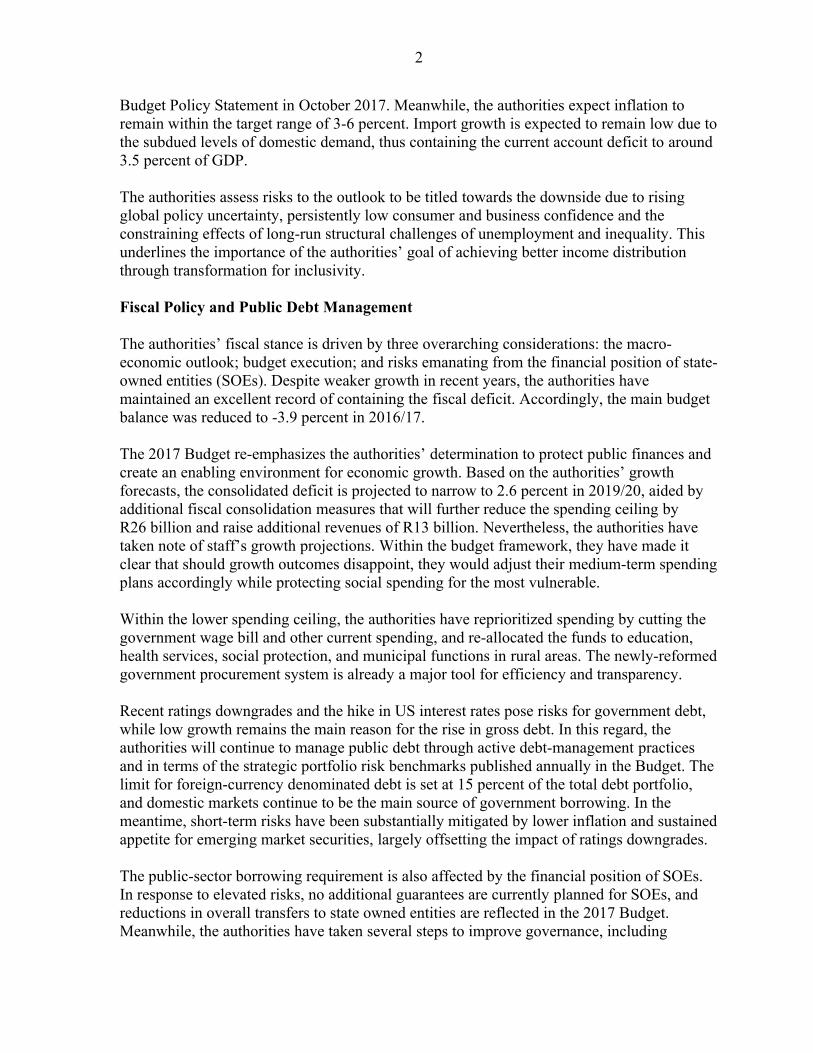
Budget Policy Statement in October 2017. Meanwhile, the authorities expect inflation to remain within the target range of 3-6 percent. Import growth is expected to remain low due to the subdued levels of domestic demand, thus containing the current account deficit to around 3.5 percent of GDP.
The authorities assess risks to the outlook to be titled towards the downside due to rising global policy uncertainty, persistently low consumer and business confidence and the constraining effects of long-run structural challenges of unemployment and inequality. This underlines the importance of the authorities’ goal of achieving better income distribution through transformation for inclusivity.
Fiscal Policy and Public Debt Management
The authorities’ fiscal stance is driven by three overarching considerations: the macro-economic outlook; budget execution; and risks emanating from the financial position of state-owned entities (SOEs). Despite weaker growth in recent years, the authorities have maintained an excellent record of containing the fiscal deficit. Accordingly, the main budget balance was reduced to -3.9 percent in 2016/17.
The 2017 Budget re-emphasizes the authorities’ determination to protect public finances and create an enabling environment for economic growth. Based on the authorities’ growth forecasts, the consolidated deficit is projected to narrow to 2.6 percent in 2019/20, aided by additional fiscal consolidation measures that will further reduce the spending ceiling by R26 billion and raise additional revenues of R13 billion. Nevertheless, the authorities have taken note of staff’s growth projections. Within the budget framework, they have made it clear that should growth outcomes disappoint, they would adjust their medium-term spending plans accordingly while protecting social spending for the most vulnerable.
Within the lower spending ceiling, the authorities have reprioritized spending by cutting the government wage bill and other current spending, and re-allocated the funds to education, health services, social protection, and municipal functions in rural areas. The newly-reformed government procurement system is already a major tool for efficiency and transparency.
Recent ratings downgrades and the hike in US interest rates pose risks for government debt, while low growth remains the main reason for the rise in gross debt. In this regard, the authorities will continue to manage public debt through active debt-management practices and in terms of the strategic portfolio risk benchmarks published annually in the Budget. The limit for foreign-currency denominated debt is set at 15 percent of the total debt portfolio, and domestic markets continue to be the main source of government borrowing. In the meantime, short-term risks have been substantially mitigated by lower inflation and sustained appetite for emerging market securities, largely offsetting the impact of ratings downgrades.
The public-sector borrowing requirement is also affected by the financial position of SOEs. In response to elevated risks, no additional guarantees are currently planned for SOEs, and reductions in overall transfers to state owned entities are reflected in the 2017 Budget. Meanwhile, the authorities have taken several steps to improve governance, including
2
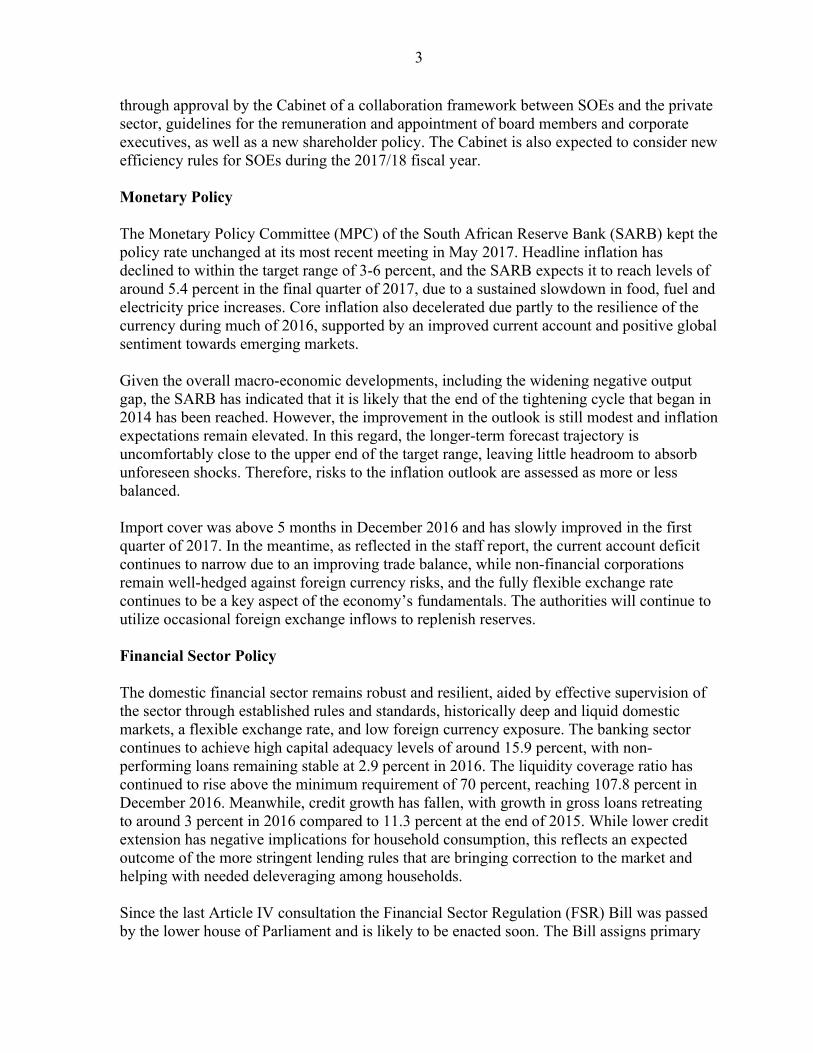
through approval by the Cabinet of a collaboration framework between SOEs and the private sector, guidelines for the remuneration and appointment of board members and corporate executives, as well as a new shareholder policy. The Cabinet is also expected to consider new efficiency rules for SOEs during the 2017/18 fiscal year.
Monetary Policy
The Monetary Policy Committee (MPC) of the South African Reserve Bank (SARB) kept the policy rate unchanged at its most recent meeting in May 2017. Headline inflation has declined to within the target range of 3-6 percent, and the SARB expects it to reach levels of around 5.4 percent in the final quarter of 2017, due to a sustained slowdown in food, fuel and electricity price increases. Core inflation also decelerated due partly to the resilience of the currency during much of 2016, supported by an improved current account and positive global sentiment towards emerging markets.
Given the overall macro-economic developments, including the widening negative output gap, the SARB has indicated that it is likely that the end of the tightening cycle that began in 2014 has been reached. However, the improvement in the outlook is still modest and inflation expectations remain elevated. In this regard, the longer-term forecast trajectory is uncomfortably close to the upper end of the target range, leaving little headroom to absorb unforeseen shocks. Therefore, risks to the inflation outlook are assessed as more or less balanced.
Import cover was above 5 months in December 2016 and has slowly improved in the first quarter of 2017. In the meantime, as reflected in the staff report, the current account deficit continues to narrow due to an improving trade balance, while non-financial corporations remain well-hedged against foreign currency risks, and the fully flexible exchange rate continues to be a key aspect of the economy’s fundamentals. The authorities will continue to utilize occasional foreign exchange inflows to replenish reserves.
Financial Sector Policy
The domestic financial sector remains robust and resilient, aided by effective supervision of the sector through established rules and standards, historically deep and liquid domestic markets, a flexible exchange rate, and low foreign currency exposure. The banking sector continues to achieve high capital adequacy levels of around 15.9 percent, with non-performing loans remaining stable at 2.9 percent in 2016. The liquidity coverage ratio has continued to rise above the minimum requirement of 70 percent, reaching 107.8 percent in December 2016. Meanwhile, credit growth has fallen, with growth in gross loans retreating to around 3 percent in 2016 compared to 11.3 percent at the end of 2015. While lower credit extension has negative implications for household consumption, this reflects an expected outcome of the more stringent lending rules that are bringing correction to the market and helping with needed deleveraging among households.
Since the last Article IV consultation the Financial Sector Regulation (FSR) Bill was passed by the lower house of Parliament and is likely to be enacted soon. The Bill assigns primary
3

responsibility for protecting and enhancing financial stability, which used to be shared with the Financial Services Board, to the SARB. In addition, the Financial Intelligence Center Act (FICA) has been signed into law, thus fully aligning the country with international standards on AML/CFT. With stress tests already institutionalized, thematic on-site inspections and reviews by the SARB’s Bank Supervision Department now include AML/CFT checks.
The authorities agree with staff that financial inclusion and increased competition in the banking sector should be a major priority. There are currently 32 banking institutions in the country, excluding mutual and cooperative banks. In 2016, three institutions were granted new banking establishment authorizations, and the SARB is focused on promoting a multi-tiered system, which can provide more tailored financial services, including to small and medium-sized enterprises (SMEs). In the meantime, while appreciating staff’s useful analysis, the authorities maintain a prudent and balanced approach to financial inclusion, by also focusing on preventing high household indebtedness and the associated risks.
Structural Reforms
Policy actions continue to be guided by the National Development Plan (NDP), which emphasizes inclusive growth through broad-based transformation and breaking down structural impediments to new economic activities, increased competition in industries dominated by a few participants, accelerated market inclusion for previously disadvantaged groups, and a return to a path of rising per capita incomes. To achieve this, the authorities will prioritize education and skills development, strengthen competition laws, increase private sector participation in industries dominated by public sector enterprises, provide support to labor-intensive sectors such as agriculture and tourism, and overcome spatial fragmentation in urban areas.
The authorities are committed to tackling infrastructure bottlenecks that hinder growth. Economic infrastructure accounts for around 77 percent of all government infrastructure spending over the medium-term. In this regard, one of the most important reforms is the establishment of a new facility that is designed to streamline many of these projects through a uniform life-cycle costing and budgeting process, thus achieving greater efficiency within the existing budget. In addition to these, the authorities have committed to signing off on the outstanding power purchase agreements with independent power producers (IPP) in renewable energy and gas. The IPP program has contributed not only to minimize electricity supply shortages over the past year but to also diversify the energy mix and increase private sector participation in the electricity sector.
The government procurement system will also become an important vehicle for transformation. In 2017, revised preferential procurement policy regulations, designed to channel most of the government’s R500 billion annual procurement towards local producers and previously disadvantaged groups, took effect. The budget also supports private sector job creation, including through allocations to promote tourism, small and medium enterprises and cooperatives, agriculture, as well as scientific and industrial research.
4
The most recent initiative to address inequality is the agreement between business, labor, and the government on a national minimum wage. When implemented, this could contribute towards reducing wage inequality and increase domestic demand. Negative employment effects will be mitigated by the existence of sector-determined minimum wages already in place in several sectors. In addition, provision has been made for exemptions of small enterprises that cannot afford the wage increases, while any inflation-inducing indexation moves will be prevented. The authorities continue to recognize that addressing education shortcomings and wage rigidities should be prioritized.
Conclusion
The authorities remain committed to macro-economic policies that promote growth, confidence, and financial stability. They view the macro policy stance, including inflation targeting, a flexible exchange rate, and deficit reduction as broadly appropriate for promoting growth and reducing volatility. Additional policies to deliver a more inclusive growth outcome are indispensable to achieving long-run growth and the authorities agree with staff that these can be implemented in a manner that promotes socio-political stability. The authorities look forward to the Fund’s continued contribution to their reform efforts.
5