immigrants: does mother’s region of origin matter?
TRANSCRIPT

The Pennsylvania State University
The Graduate School
College of Health and Human Development
HEALTH INSURANCE COVERAGE AMONG CHILDREN OF
IMMIGRANTS: DOES MOTHER’S REGION OF ORIGIN MATTER?
A Thesis in
Human Development and Family Studies
by
Kaylin M. Greene
2009 Kaylin M. Greene
Submitted in Partial Fulfillment
of the Requirements
for the Degree of
Master of Science
December 2009

ii
The thesis of Kaylin Greene was reviewed and approved* by the following:
Daphne C. Hernandez
Assistant Professor of Human Development and Family Studies and Demography
Thesis Advisor
Pamela Farley Short
Professor of Health Policy and Administration and Demography
Director of the Center for Health Care Policy
Douglas M. Teti
Professor of Human Development and Psychology
Professor-In-Charge, Graduate Program, Human Development and Family
Studies
*Signatures are on file in the Graduate School

iii
ABSTRACT
Objectives: I estimated region of origin differences in health insurance coverage in a
national sample of children of immigrants.
Methods: Immigrant mothers from the Early Childhood Longitudinal Study –
Kindergarten Cohort (ECLS-K) provided information. Chi-squares, ANOVAs, and multinomial
logistic regressions examined the relationship between mother‟s region of origin and child‟s type
of insurance (i.e., private, government, and uninsured), controlling for family, community, and
state-level factors known to affect health insurance coverage.
Results: The majority of the immigrant children are insured, regardless of the mother‟s
region of origin. In comparison to children of immigrants from Europe or Canada, children of
immigrants from Mexico, Latin America, and the Caribbean are less likely to have private
insurance compared to government insurance; they are also more likely to be uninsured than have
private insurance.
Conclusions: The lower likelihood of private insurance and the higher likelihood of
uninsurance among children of immigrants from Mexico, Latin America, and the Caribbean
position these children at risk for poor health outcomes later in life. Targeting children of
immigrants from these regions is a useful intervention strategy to reduce disparities among
immigrant children.

iv
TABLE OF CONTENTS
LIST OF TABLES ................................................................................................................... .v
Chapter 1 Introduction ........................................................................................................... .1
Chapter 2 Methods ................................................................................................................. .4
Data and Sample ............................................................................................................. .4 Measures .......................................................................................................................... .4
Health Insurance Coverage ...................................................................................... .4 Region of Origin ...................................................................................................... .5 Individual and Household Factors affecting Eligibility and Knowledge of
Health Insurance Coverage ...................................................................................... .6
Community and State Factors……………………………………………...……......7
Analytic Strategy ............................................................................................................. .7
Chapter 3 Results .................................................................................................................... .9
Descriptive Results ......................................................................................................... .9
Multivariate Results ......................................................................................................... .9
Chapter 4 Discussion…………………………………………………………………….…..12
References ........................................................................................................................ 17
Appendix Description of Region of Origin Coding Information ............................................ 20

v
LIST OF TABLES
Descriptive and Bivariate Statistics for Children of Immigrants by Type of Health
Insurance Coverage: Early Childhood Longitudinal Study—Kindergarten Cohort,
2000 .................................................................................................................................. 21
Weighted Descriptives for Children of Immigrants and Children of Native-born by
Mother’s Region of Origin: Early Childhood Longitudinal Study – Kindergarten
Cohort, 2000. ................................................................................................................... 23
Odds Ratios from Multinomial Logistic Regression Analyses Predicting Health Insurance
Coverage for Children of Immigrants: Early Childhood Longitudinal Study –
Kindergarten Cohort, 2000 (n = 1998). ........................................................................... 25

1
Chapter 1
Introduction
More than one in five children in the United States lives in an immigrant family, and this
number is growing rapidly (Hernandez, 2004). Despite the fact that the majority of children in
immigrant families are US citizens, children of immigrants comprise a disproportionately large
section of the uninsured population (Guendelman, Schauffler, and Pearl, 2001; Mohanty,
Woolhandler, Himmelstein et al., 2005). Compared to children of native-born parents, children
of foreign-born parents have considerably lower rates of employer-sponsored and private
insurance (Guendelman, Schauffler, and Pearl, 2001; Lessard & Ku, 2003). In addition, children
in immigrant families have low participation in government insurance considering their high
poverty rates (Mohanty, Woolhandler, Himmelstein et al., 2005).
Many immigrant families face individual-level barriers to obtaining health insurance
including a lack of human capital and limited English skills. For instance, the educational
attainment of immigrants is lower than that of native-born, and immigrants are often employed in
unskilled jobs in the service sector with limited or no access to employer-sponsored insurance
(Buchmueller, Sasso, Lurie, & Dolfin, 2006, Schur & Feldman, 2001). The difficulty immigrant
parents have obtaining employment with benefits lowers the likelihood that their children will be
covered by private insurance. In addition, many immigrants have limited English language
proficiency (LEP), making it challenging to navigate insurance options. Indeed, research
documents that LEP parents often have difficulty understanding and completing Medicaid forms
(Perry, Kannel, Valdez, & Chang, 2000).
Immigrants also experience policy-level barriers, such as eligibility requirements, to
obtaining health insurance. In 1996, welfare reform changed Medicaid and Children‟s Health
Insurance Program (CHIP) eligibility criteria for most legal immigrants from a no residency
2
requirement to a five-year residency requirement. Although the vast majority of children in
immigrant families are born in the US, and thus eligible for government insurance (Ku, 2007),
some immigrant parents voluntarily withdrew their Medicaid- and CHIP-eligible children in what
has been known as the “chilling” effects of welfare reform (Hagan, Rodriguez, & Capps, 2003).
Relatedly, many parents resist using government programs (such as CHIP or Medicaid) fearing
that they will be seen as public charges and this will affect their ability to become legal residents
or citizens at a later date. This fear remains in spite of the statement made by INS in 1999 that
Medicaid and CHIP use would not be considered when deciding applications for permanent
residency or citizenship (Hagan, Rodriguez, & Capps, 2003).
The unique barriers facing immigrant families have caused an increased interest and a
burgeoning body of literature comparing health insurance among immigrant and native-born
populations. However, despite significant heterogeneity within the immigrant population, little
research has utilized a within group approach to understand this group. Existing research
suggests that examining country of origin is a useful tool to understand health insurance among
immigrants. Using the Current Population Survey (CPS), researchers found that Medicaid rates
for adults differed based on country of origin, with individuals from the Dominican Republic
having the highest rates of Medicaid coverage (32%), followed by those from Russia (26%),
Cuba (19%), and Vietnam (16%) (Carrasquillo, Carrasquillo, & Shea, 2000). Descriptive
research by Hernandez (2004) suggests that the same may be true for children, although it is
unclear whether parental country of origin is an independent predictor of the type of child health
insurance within a multivariate context.
The following study uses data from the Early Childhood Longitudinal Study –
Kindergarten (ECLS-K) cohort to examine the relationship between immigrant mother‟s region
of origin and children‟s health insurance. Specifically, the study focuses on the association
between mother‟s region of origin and immigrant children‟s use of either (1) private or (2)

3
government insurance, or (3) lack of insurance, while controlling for family, community, and
state-level characteristics related to health insurance coverage. Examining mother‟s region of
origin helps to explore the disparities within immigrant populations, and limiting the sample to
immigrants enables a more nuanced understanding of this group. Documenting which immigrant
groups enroll in private and public health insurance – as well as those who are uninsured – is
pivotal at a time when there are concerns over the well-being of immigrants, and government
funding for health insurance is increasing and a focus of debate. It is crucial that policymakers
understand the characteristics of the populations with and without health care coverage, as this
information.

4
Chapter 2
Method
Data and Sample
Data are derived from the first grade wave of the Early Childhood Longitudinal Study –
Kindergarten Cohort (ECLS-K) collected in the spring of 2000 by the National Center for
Education Statistics (NCES).1 The sample is limited to those children whose mothers reported
being born in a country other than the United States (n = 2,750). Children whose mothers were
born in a foreign country not on the ECLS-K list of countries were excluded (n = 12), along with
children who had missing data on the dependent and independent variables (n = 752), resulting in
a study sample of 1,998 children of immigrants. Information on children of US-born mothers (n =
10,566 with complete data) is provided for descriptive purposes; however, these children are
excluded from multivariate analyses which focus solely on children of immigrants.
Measures
Health Insurance Coverage
Children‟s health insurance coverage is based on maternal report and categorized into
three mutually exclusive groups: private health insurance, government health insurance, and no
health insurance. Children whose mothers reported that their child was covered by employer-
based insurance or private insurance are coded as having private insurance (1 = yes, 0 = no).
Children whose mothers reported that their child was covered by CHIP or Medicaid are coded as
1 The baseline (Kindergarten wave) does not contain the necessary information about the type of health care
coverage.
5
having government health insurance (1 = yes, 0 = no). Children whose mothers reported no health
insurance are coded as uninsured (1 = yes, 0 = no).2
Region of origin
Mother‟s region of origin is based on the mother‟s response to the question regarding her
country of birth. Countries are grouped into eight categories: Canada and Europe, Latin America
(e.g. Columbia, Ecuador, Guatemala), Mexico, Caribbean (e.g. Jamaica, Dominican Republic,
Puerto Rico), Northeast Asia ( e.g. China, Japan, Taiwan), Southeast Asia (e.g. Vietnam,
Cambodia, Laos), Other Southeast Asia (e.g. Thailand, Bangladesh), and West Central Asia and
Africa (e.g. Afghanistan, Iran, Nepal).
Canada and Europe comprise a single region as the majority of immigrants from these
countries speak English fluently and are white. All analyses are conducted with Canada/Europe
as the comparison group. Immigrants from Europe and Canada may be more advantaged than
other immigrant groups (e.g. they may face minimal racism in the US and may be advantaged
financially) and thus they may be able to assimilate more easily into mainstream America.
Central and South American countries are combined to form the Latin American region because
of their proximity to each other, similar cultural backgrounds, and similar socioeconomic
statuses. Mexico is maintained as a region in and of itself because of ample sample size, and
research suggesting that Mexican-Americans have particularly low rates of health insurance
2 To create mutually exclusive categories, children who reportedly were covered by more than one
insurance type are assigned to a specific type. If the child reportedly had Medicaid or SCHIP and also
private insurance, then the child is coded as having government sponsored health insurance. If the child
reportedly had private insurance but also reported being uninsured then the child is coded as private.
Coding the categories in this way results in the „no insurance‟ category being composed solely of children
who reportedly had no health insurance coverage.

6
coverage (e.g. Trevino, Moyer, Valdez & Stroup-Benham, 1991). The Caribbean is a separate
category as many of these countries have distinct Afro-Caribbean cultural influences and are
close to the United States. Northeastern Asian countries known to be more advantaged (such as
China, Japan, and Korea) are grouped together. As has been done in previous research (Han,
2006), Southeast Asian countries such as Vietnam, Laos, and Cambodia are categorized
separately from other Southeast Asian countries because the former exhibit a high proportion of
refugees and the visa process is typically quite different for individuals from these countries. The
final region of origin is composed of countries in West-Central Asia and Africa. The sample
sizes of the regions in the present study range from 150 to 605. 3
Individual and Household-level Factors affecting Eligibility and Knowledge of Health
Insurance Coverage
Mothers reported on several family-level factors that may be associated with health
insurance. Child characteristics include child gender (male = 1; female = 0), health status of the
child (1 = poor health to 5 = excellent health), and a continuous variable of the number of siblings
in the household. Poor health motivates parents to seek insurance and having more children in the
household may increase knowledge of health insurance options. Maternal characteristics include
education [< high school, high school diploma (reference), > high school], employment
[unemployed (reference), employed < 35 hours a week, employed > 35 hours a week], marital
status (married = 1; not married = 0), and years living in the United States. Controlling for
parental employment serves to capture the family‟s ability to obtain employer-sponsored
insurance, as individuals working full-time are more likely than part-time workers to receive
3 In creating the region groups, the goal was to create groups that were as homogenous as possible while
simultaneously balancing the need for adequate sample sizes (for a complete description of how countries
of origin were coded into regions of origin see Appendix 1). To determine appropriate sample sizes,
research by Carrasquillo, Carrasquillo, and Shea (2000) was used as a guide. The authors examined
country of origin and Medicaid use by adults. The smallest country of origin examined by Carrasquillo et
al., 2000 had a sample size of 173 people. The number of 173 was used as a guide in this study for
adequate sample size to enable comparisons with this study. For this reason Africa (n = 45) was not
analyzed as a separate region.

7
benefits such as health insurance coverage (Farber & Levy, 2000). In addition, mothers living in
the U.S. for longer periods of time may have greater insight into sources of health insurance
coverage. Household-level characteristics include home language (non-English = 1; English = 0),
use of government assistance in the past year (received TANF or food stamps = 1; did not receive
TANF or food stamps = 0), and poverty status [low income (< 200% of the FPL) = 1; not poor
(>200% of the FPL) = 0]. Home language is included as non-English speakers may face
challenges navigating government services; while participation in other government assistance
programs may increase awareness of the availability of government health insurance. Family
poverty status impacts eligibility for different types of health insurance and is based on household
income4.
Community and State Factors
Community- and state-level characteristics are included to control for contextual factors
that may influence eligibility and the ease of obtaining health insurance coverage. A variable
capturing the generosity of state health insurance policies was created by determining the state‟s
income threshold for eligibility for SCHIP in 2000. States with an income eligibility threshold
equal to 200% of the FPL, and states with eligibility threshold above 200% of the FPL, are
compared to states with an income eligibility less than 200% of the poverty line. This variable
was created using information from the Kaiser Family Foundation website
(www.kaiserfamilyfoundation.org). Additionally, a measure of urbanicity based on city size
[urban (reference), suburban, rural] is included.
Analytic Strategy
Chi-square analyses and ANOVAs are performed to compare children‟s health insurance
coverage across mother‟s region of origin and family, community, and state factors known to
4 Because the ECLS-K collects income information in brackets (e.g. $10-15,000), these categories are
imprecise. The categories are based upon poverty thresholds for the appropriate household size and are
intended to approximate actual eligibility.
8
affect health insurance coverage. Multinomial logistic regression models are conducted to
examine the associations between mother‟s region of origin and children‟s health insurance
coverage, controlling for family, community, and state-level factors. All analyses are conducted
in STATA (version 10.0; Stata Co., College Station) and are weighted using the person-level
weight (C4PW0).5
5 Although it would be ideal to use the Taylor Series weights (the svy command) to account for the
complex sampling design, this is not possible with this data for the current research question. This is
because there are too few observations in the strata variables and thus Stata cannot produce stable standard
errors and p-values.

9
Chapter 3
Results
Descriptive Results
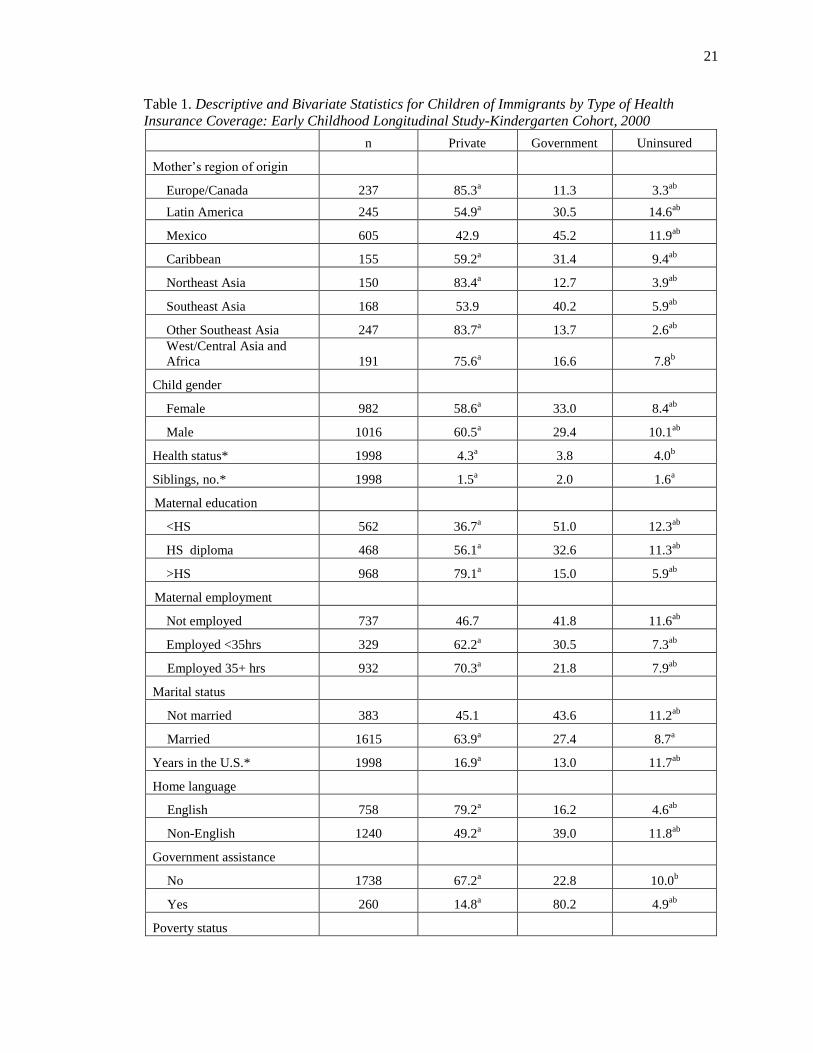
Descriptive statistics for immigrant children by type of health insurance coverage
demonstrate that most children in immigrant families are insured, regardless of their mothers‟
region of origin (Table 1). Among insured children, the majority have higher rates of private
insurance than government insurance. Children with mothers from Mexico, Latin America, the
Caribbean and Southeast Asia have particularly low rates of private insurance (43-55%) and high
rates of government insurance (40% for Southeast Asia and 45% for Mexico) compared to
children with mothers from the other regions. In contrast, children with mothers from Europe and
Canada or Northeast Asia have high rates of private insurance (84-85%) and low rates of
government insurance (11% and 13% respectively). Differences are likewise apparent when we
examine the percentage of uninsured children by mother‟s region of origin. Whereas 3% to 4%
of European and Canadian, Northeast Asian, and other Southeast Asian children of immigrants
are uninsured, the corresponding percentages among Latin American and Mexican children of
immigrants are 14.6 and 11.9 respectively.
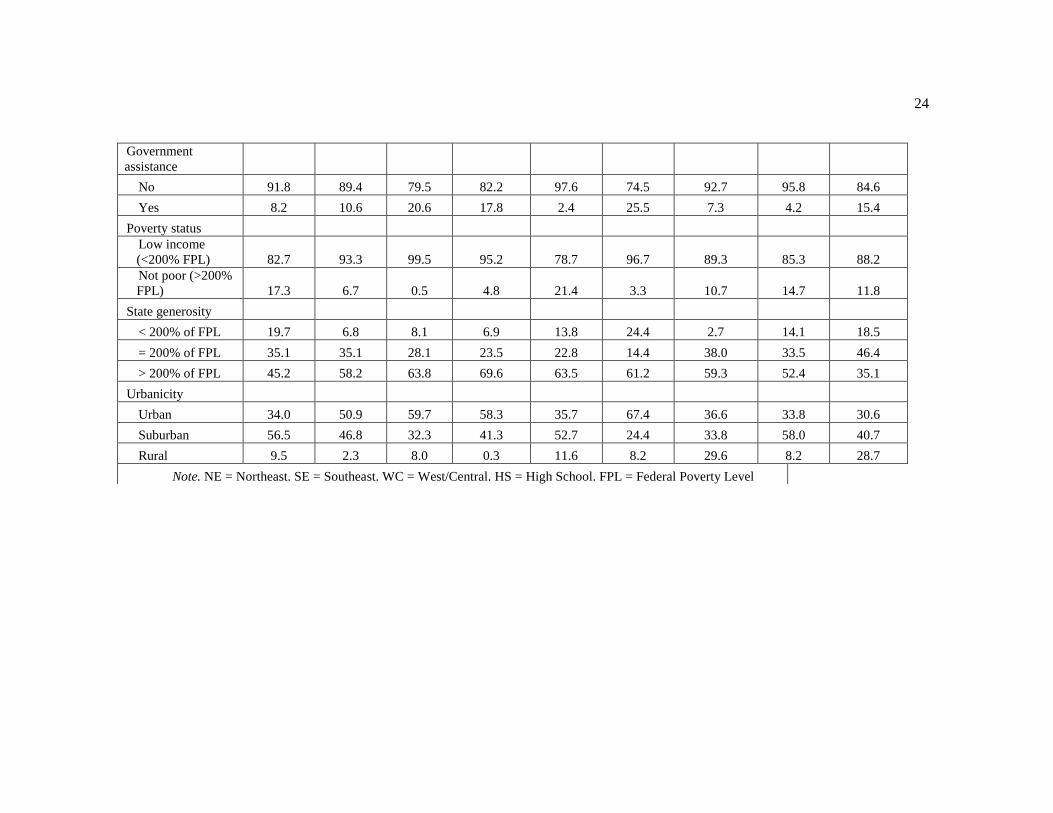
Descriptive statistics by mother‟s region of origin suggest that many factors covary with
maternal region of origin including maternal education and number of years the mother has lived
in the US (Table 2). For example, mothers from Europe and Canada, Northeast Asia, or other
Southeast Asia (regions with high rates of privately insured children), have high levels of
maternal education and have lived in the US for 17 or more years.
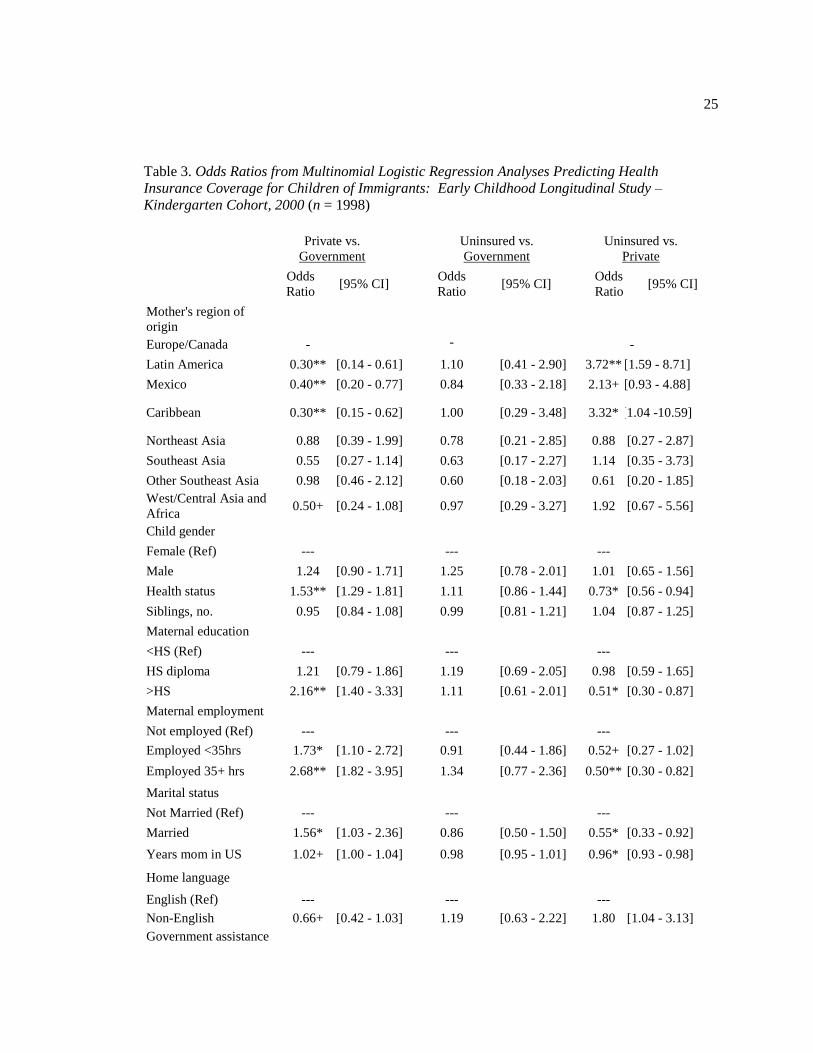
Multivariate Results
Multinomial logistic regression is used to examine the association between mother‟s
region of origin and immigrant children‟s health insurance coverage, controlling for family,

10
community, and state-level characteristics known to affect health insurance coverage (Table 3).
Results indicate that mother‟s region of origin predicts child‟s type of health insurance for two of
the three comparisons. Mother‟s region is associated with the odds of private versus government
insurance. The odds that children of immigrants from Mexico, Latin America, and the Caribbean
have private compared to government insurance are 60-70% lower than the odds of children of
European and Canadian immigrants. Children of mothers from Northeast Asia, Southeast Asia,
and the Other Southeast Asia group do not differ significantly from children of mothers from
Europe and Canada. Coefficients for individual and household covariates are in the expected
direction, with more advantaged characteristics (i.e. better health, greater maternal education,
employment, married) associated with a higher likelihood of private than government insurance.
In contrast, factors demonstrating disadvantage (e.g. low income, having used government
services in the last year) are associated with a lower likelihood of private versus government
insurance. Immigrant children living in states with an average health insurance policy compared
to states with a less generous health insurance policy and immigrant children living in suburban
areas compared to those living in the urban areas have a higher likelihood of being privately
insured than insured by the government.
Comparing the likelihood of being uninsured versus being privately insured also shows
differences by mother‟s region of origin. Compared to children of immigrants from Europe and
Canada, the odds are three times higher that children of mothers from Latin America and the
Caribbean will be uninsured rather than have private insurance. However, due to the large
standard errors observed when examining the uninsured population, estimates may be unstable.
Results further document that immigrant children in better health and those with mothers who
have more than a high school education, are employed more than 35 hours a week, and are
married, compared to immigrant children living with less educated mothers, those not in the labor
force, and those that are single are less likely to be uninsured than to be privately insured. Last,

11
the years a mother has lived in the US is associated with a lower likelihood of having no
insurance versus private insurance.
Mother‟s region of origin does not predict group differences between uninsured and
government insured immigrant children. In fact, few variables in the model are associated with
the likelihood of immigrant children being uninsured versus having government insurance. The
use of other government services is associated with a lower likelihood of being uninsured versus
having government insurance. In addition, compared to children living states with an SCHIP
eligibility threshold less than 200% of the FPL, the odds are four times higher that children living
in a state with an eligibility threshold equal to 200% of the FPL will be uninsured compared to
have government health insurance

12
Chapter 4
Discussion
This study explored the association between mother‟s region of origin and immigrant
children‟s health insurance coverage. Results indicate most immigrant children are insured,
however, disparities in coverage exist based on mother‟s region of origin. Mother‟s region of
origin is particularly salient for children of immigrant mothers from Mexico, Latin America, and
the Caribbean. This group, compared to their counterparts from Europe and Canada, are more
likely to be uninsured or covered by government insurance than private insurance. Previous
research documents a strong association between health insurance coverage and having a usual
source of care, having seen a doctor or a dentist within the last year, and receiving preventative
and specialist care (Kenney & Chang, 2004). If children from these regions are not receiving
these services then this could have detrimental consequences for their subsequent health and well-
being.
Taken as a whole, the results suggest that children of mothers from Mexico, Latin
America, and the Caribbean may comprise a distinctly disadvantaged group in terms of insurance
coverage. Placing these differences in context of the study, immigrants from these regions
display a particularly disadvantaged demographic profile with mothers from all three regions
displaying high rates of poverty and mothers from Latin America and Mexico having low levels
of education and employment.
There are numerous factors differing by region of origin that could contribute to these
results. For example, the context in which migration occurs is highly variable. The ease of
obtaining a visa differs dramatically across regions6, with immigrants often waiting years to gain
6 Despite civil wars in many Central American countries (e.g. Guatemala and Nicaragua), these immigrants
did not receive refugee status. In contrast, many Southeast Asian immigrant parents (from Vietnam, Laos,
and Cambodia) received refugee status due to the US involvement in the Vietnam War. Being refugees, the
13
legal entry into the US and many being denied as a result of strict immigration policy since the
mid-1980s (Fernandez-Kelley & Massey, 2007). Difficulty obtaining a visa can contribute to
illegal migration, and research documents that the majority of undocumented immigrants in the
US come from Mexico and Latin American countries (Passel, 2005). Future studies focusing on
the disparities in immigrant children‟s health insurance coverage should focus on including
measures that capture parents‟ difficulty acquiring a visa and the class of immigration and
naturalization service (INS) admission.
Further, undocumented immigrant parents may fear getting “found out” and thus be
hesitant to use government services. Alternatively, undocumented immigrant parents may worry
that government service use will cause them to be seen as public charges and interfere with their
ability to become legal immigrants. Another possibility is that undocumented status is a barrier to
securing employment with benefits, resulting in a higher likelihood of being uninsured among
this population. Qualitative interviews that focus on how legal status of immigrants influences
their use of government services may help clarify the disparities in immigrant children‟s health
insurance coverage.
Beyond legal status, low human capital among individuals from these regions could lead
to difficulty accessing employer-sponsored insurance. Research documents that low rates of
private insurance among immigrant adults can be attributed to the large percentage of immigrants
employed in unskilled jobs, with minimal access to employer-sponsored insurance (Buchmueller
et al., 2001). This “channeling” of immigrant parents into low-wage jobs with few benefits may
be particularly true for Mexican, Latin American, and Caribbean immigrants, and have negative
consequences for their children.
visa process may have been easier for SE Asians, and may have exposed them to information about
government health insurance options. Regardless of duration in the US, refugees can receive government
services, a benefit not bestowed on all legal immigrants. Thus, the refugee status of SE Asians may help
explain why rates of uninsurance are so low among this population despite such a disadvantaged
demographic profile.

14
English language skills among immigrant families has typically been used as a proxy for
acculturation. While previous research documents a strong association between parental English
ability and child‟s insurance coverage (Yu et al., 2006), the results did not show a clear
relationship between the language spoken in the home and the insurance type of the child. This is
likely due to the poor measurement of the language variable, as language spoken at home is used
as a proxy for English proficiency. Research documents that Hispanic children of immigrants are
more likely to have parents with limited English language proficiency and to live in linguistically
isolated households than children of other immigrant groups (Fix & Passel, 2003). Thus, a scale
that measures English proficiency (including reading, writing, speaking, and listening) would be
ideal and likely demonstrate stronger association with type of insurance. Importantly, immigrants
may prefer speaking in their native language while still possessing excellent English skills
(enabling successful navigation of health insurance options). This would imply that practicing a
non-English language at home is a proxy for socio-economic status and not of acculturation.
In addition, it is possible that other unmeasured characteristics of acculturation and social
networks may influence immigrant mothers‟ knowledge about health insurance coverage. If
these unmeasured factors are also associated with mother‟s region of origin, then they may be
contributing to the multivariate results found in the present study. Likewise, cultural differences
in the acceptability of using government services may contribute to differences seen across these
groups.
One anomalous result relates to the state-level generosity measure for public insurance
coverage. Results suggest that, compared with living in a state with less generous policies,
children from a state with average policies are more likely to have private (versus government
insurance) and to be uninsured versus having government insurance. Although the second
finding is counterintuitive it suggest that states with average generosity levels may not be
sufficiently advertising the program nor reaching out to the most disadvantaged in assisting them
15
with the application process. It is also possible (and perhaps more likely) that the inconsistent
pattern is due to the specific states included in each category.
Aside from the measurement limitations mentioned above, how the sample was selected
and defined causes the results to be interpreted with caution. For instance, sample sizes become
quite small (ranging from 150 to 605) when the sample is divided by mother‟s region of origin.
In a few instances, these small sample sizes cause large standard errors and interfere with my
ability to make conclusive statements regarding the uninsured population among children of
immigrants. However, the ECLS-K is the largest nationally representative dataset with
information on mother‟s country of origin, and thus, though not ideal, it is the best data that is
currently available.
Furthermore, a conservative definition of „children of immigrants‟ is used in this study.
Immigrant families in the ECLS-K are identified using only the country of origin of the mother
and the data lacks corresponding information for fathers. Thus, children whose family structure
consists of an immigrant father and native-born mother are excluded, as we cannot identify these
families in the data.
Despite these limitations, the results paint a picture of inequality within the immigrant
population. The high rates of uninsurance documented among children of Mexican, Latin
American and Caribbean immigrant mothers suggest that these children may not be receiving the
health services that they need; thus placing these children at risk for negative health outcomes.
Interventions targeting the children of Hispanic and Caribbean immigrants are needed to reduce
disparities in health insurance coverage documented within the present study. Future within-
group, longitudinal research is necessary in order obtain a greater understanding of the clustering
of advantaged characteristics associated with private insurance among certain immigrant groups
and the clustering of disadvantage characteristics associated with uninsurance among others. Such

16
findings will provide insight into how to better serve the needs of immigrant children and
consequently reduce health disparities.

17
References
Buchmueller, T. C., Lo Sasso, A. T., Lurie, I., & Dolfin, S. (2006). Immigrants and employer-
sponsored health insurance, Health Services Research, 42, 286-310.
Carrasquillo, O., Carrasquillo, A. I., & Shea, S. (2000). Health insurance coverage of immigrants
living in the US: Differences by citizenship status and country of origin. American
Journal of Public Health, 90, 917-923.
Center for Children and Families, Georgetown University Health Policy Institute. (2008). SCHIP
funding in the year ahead: Implications of the Medicare, Medicaid, and SCHIP
Extension Act. Available online at http://ccf.georgetown.edu/index/cms-
filesystemaction?file=ccf%20publications/federal%20schip%20policy/schipfinancing030
3.pdf
Farber, H. S. & Levy, H. (2000). Recent trends in employer-sponsored health insurance
coverage: are bad jobs getting worse? Journal of Health Economics, 19, 93-119.
Fernandez-Kelly, P. & Massey, D. S. (2007). Borders for whom? The role of NAFTA in
Mexico-U.S. migration. The annals of the American Academy of Political and Social
Science, 610, 98-117.
Fix, M. & Passel, J. S. (2003). US immigration: Trends and implications for schools. Urban
Institute.
Flores, G., Abreu, M., Olivar, M. A., Bastner, B. (1998) Access barriers to health care for Latino
children. Arch Pediatr Adolesc Med., 152, 1119-1125.
Goldman, D. P., Smith J. P., & Sood, N. (2005). Legal status and health insurance among
immigrants. Health Affairs, 24, 1640-1653.
18
Granados, G., Puvvula, J., Berman, N., & Dowling, P. (2001). Health care for Latino children:
Impact of child and parental birthplace on insurance status and access to health services.
American Journal of Public Health, 91, 1806-1807.
Guendelman, S., Schauffler, H. H., & Pearl M. (2001). Unfriendly shores: How immigrant
children fare in the U.S. health system. Health Affairs, 20, 257-266.
Hagan, J., Rodriguez, N., & Kabiri, N. (2003). The effects of recent welfare and immigration
reforms on immigrants‟ access to health care. International Migration Review, 37, 444-
463.
Han, W. (2006). Academic achievements of children in immigrant families. Educational
Research and Review, 1, 286-318.
Hernandez, D. J. (2004). Demographic change and the life circumstances of immigrant families.
Future of Children, 14, 17-47.
Horner D, Guyer J, Mann C, Alker J. (2009).The Children’s Health Insurance Program
Reauthorization Act of 2009, Overview and Summary. Georgetown University Center for
Children and Families.
Huang, Z. J., Yu, S. M., & Ledsky, R. (2006). Health status and health service access and use
among children in U.S. immigrant families. American Journal of Public Health, 96, 634-
640.
Kenney, G. The impacts of the State Children‟s Health Insurance Program on children who
enroll: Findings from ten states. Health Services research, 42, 1520-1540.
Kenney, G. & Chang, D. (2004). The State Children‟s Health Insurance Program: Successes,
shortcomings, and challenges. Health Affairs, 23, 51-62.
Ku, L. Improving health insurance and access to care for children in immigrant families. (2007).
Ambulatory Pediatrics, 7, 412-420.
Lessard, G. & Ku, L. (2003). Gaps in coverage for children in immigrant families. Future of
Children, 13, 101-115.
19
Mohanty, S. A., Woolhandler, S, Himmelstein, D. U., Pati, S., Carrasquillo, O., & Bor, D. H.
Health care expenditures of immigrants in the United States: A nationally representative
analysis. American Journal of Public Health, 95, 1431-1438.
Passel, J. (2005). Estimates of the size and characteristics of the undocumented population. Pew
Hispanic Center, March 21, 2005. Available athttp://pewhispanic.org/files/reports/44.pdf
Perry, M., Kannel, S., Valdez, R. & Chang, C. (2000). Medicaid and children: Overcoming
barriers to enrollment: Findings from a national survey. Washington, DC: Kaiser
Commission on Medicaid and the Uninsured.
Prentice, J. C., Pebley, A., R., & Sastry, N. (2005). Immigration status and health insurance
coverage: Who gains? Who loses? American Journal of Public Health, 95, 109-116.
Schur, C. L., & Feldman, J. (2001). Running in place: How job characteristics,
immigrant status, and family structure keep Hispanics uninsured. The
Commonwealth Fund. Available online at
http://www.cmwf.org/usr_doc/schur_running_453.pdf.
Treviño, F. M., Moyer M. E., Valdez, R. B., & Stroup-Benham, C. A. (1991). Health insurance
coverage and utilization of health services by Mexican Americans, mainland Puerto
Ricans, and Cuban Americans. The Journal of the American Medical Association, 265,
233-237.
Yu, S. M., Huang, J., Schweiberg, R. H., & Nyman, R. M. (2006). Parental English
proficiency and children‟s health services access. American Journal of Public
Health, 96, 1-7.

20
Appendix
Appendix. Description of Region of Origin Coding Information
Countries in Each Region
Region N
N
country
Europe/ Canada
283
42
Turkey, Ukraine, Vatican City, United Kingdom, Sweden,
Switzerland, Spain, Slovakia, San Marino, Romania, Russia,
Poland, Portugal, Norway, New Zealand, Netherlands, Moldova,
Malta, Macedonia, Luxemburg, Lithuania, Italy, Ireland, Iceland,
Guernsey, Greece, Germany, Georgia, French Southern and
Antarctic Lands, France, Finland, Cyprus, Croatia, Canada,
Bulgaria, Bosnia and Herzegovina, Belgium, Austria, Australia,
Armenia, Andorra, Albania
Latin America 305
19
Argentina, Belize, Bolivia, Brazil, Chile, Colombia, Costa Rica,
Clipperton Island, Ecuador, El Salvador, Guatemala, Guyana,
Honduras, Nicaragua, Panama, Peru, South Georgia and the
Sandwich Islands, Uruguay, Venezuela
Mexico 746
1 Mexico
Caribbean 285
14
Aruba, Bahamas, Barbados, Bermuda, Cuba, Dominica,
Dominican Republic, Haiti, Jamaica, Puerto Rico, Saint Kitts and
Nevis, Saint Vincent and the Grenadines, Trinidad and Tobago,
US Virgin Islands,
NE Asia 177
6 China, Hong Kong, Japan, North Korea, South Korea, Taiwan
South East
Asia 201
3 Vietnam, Cambodia, Laos
Other SE Asia 287
18
Bangladesh, Burma, Cocos (Keeling) Islands, Indonesia,
Malaysia, Philippines, Singapore, Thailand, American Samoa,
Baker Island, Fiji, Guam, Howland Island, Marshall Islands, Niue,
Samoa, Tonga, Wallis and Futuna
West/
Central Asia
and Africa 221
38
Afghanistan, British Indian ocean Islands, India, Iran, Iraq, Israel,
Jordan, Kuwait, Lebanon, Nepal, Oman, Pakistan, Qatar, Saudi
Arabia, Sri Lanka, Syria, UAE, Yemen
Angola, Burundi, Cape Verde, Djibouti, Egypt, Ethiopia, Ghana,
Guinea, Kenya, Liberia, Mayotte, Nigeria, Sao Tome and
Principe, Sierra Leone, Somalia, South Africa, Sudan, Togo,
Tunisia, Zimbabwe
21
Table 1. Descriptive and Bivariate Statistics for Children of Immigrants by Type of Health
Insurance Coverage: Early Childhood Longitudinal Study-Kindergarten Cohort, 2000
n Private Government Uninsured
Mother‟s region of origin
Europe/Canada 237 85.3a 11.3 3.3
ab
Latin America 245 54.9a 30.5 14.6
ab
Mexico 605 42.9 45.2 11.9ab
Caribbean 155 59.2a 31.4 9.4
ab
Northeast Asia 150 83.4a 12.7 3.9
ab
Southeast Asia 168 53.9 40.2 5.9ab
Other Southeast Asia 247 83.7a 13.7 2.6
ab
West/Central Asia and
Africa 191 75.6a 16.6 7.8
b
Child gender
Female 982 58.6a 33.0 8.4
ab
Male 1016 60.5a 29.4 10.1
ab
Health status* 1998 4.3a 3.8 4.0
b
Siblings, no.* 1998 1.5a 2.0 1.6
a
Maternal education
<HS 562 36.7a 51.0 12.3
ab
HS diploma 468 56.1a 32.6 11.3
ab
>HS 968 79.1a 15.0 5.9
ab
Maternal employment
Not employed 737 46.7 41.8 11.6ab
Employed <35hrs 329 62.2a 30.5 7.3
ab
Employed 35+ hrs 932 70.3a 21.8 7.9
ab
Marital status
Not married 383 45.1 43.6 11.2ab
Married 1615 63.9a 27.4 8.7
a
Years in the U.S.* 1998 16.9a 13.0 11.7
ab
Home language
English 758 79.2a 16.2 4.6
ab
Non-English 1240 49.2a 39.0 11.8
ab
Government assistance
No 1738 67.2a 22.8 10.0
b
Yes 260 14.8a 80.2 4.9
ab
Poverty status

22
Low income (<200% FPL) 1799 56.9a 33.2 9.9
ab
Not poor (>200% FPL) 199 96.6a 02.6 .8
ab
State generosity
< 200% FPL 220 68.0a 26.4 5.6
ab
= 200% FPL 627 64.9a 22.9 12.2
ab
> 200% FPL 1151 55.5a 36.0 8.4
ab
Urbanicity
Urban 1060 50.7a 38.9 10.4
ab
Suburban 760 70.2a 21.0 8.7
ab
Rural 178 61.0 33.8 5.2ab
Note. HS = High School. FPL = Federal Poverty Level a p < .05 compared to government insurance
b p < .05 compared to private insurance
*linear variable; means reported

23
Europe/
Canada
Latin
America Mexico Caribbean NE Asia SE Asia
Other SE
Asia
WC Asia
and Africa US-Born
n 237 245 605 155 150 168 247 191 10566
Type of insurance
Private 85.4 54.9 42.9 59.2 83.4 53.9 83.7 75.6 74.2
Government 11.3 30.5 45.2 31.4 12.7 40.2 13.8 16.6 21.5
Uninsured 3.3 14.6 11.9 9.4 3.9 5.9 2.6 7.8 4.3
Child gender
Female 52 47 47 45 50 47 44 51 49.1
Male 48 53 53 55 50 53 56 49 51.0
Health status 4.5 4.3 3.9 4.3 4.0 3.9 4.1 4.3 4.4
Siblings, no. 1.4 1.3 2.0 1.3 1.1 2.7 1.5 1.6 1.5
Maternal education
<HS 6.7 31.1 58.7 12.9 11.0 44.5 9.9 5.4 10.1
HS diploma 20.3 27.6 23.9 26.5 13.9 29.7 21.5 25.1 30.4
>HS 73.0 41.3 17.5 60.6 75.1 25.8 68.6 69.5 59.5
Maternal employment
Not unemployed 35.3 31.2 53.6 24.2 40.5 24.7 23.0 37.8 28.1
<35hrs 24.8 22.3 12.2 17.0 15.4 12.7 13.0 8.9 22.5
35+ hrs 39.9 46.5 34.2 58.8 44.1 62.6 63.9 53.3 49.5
Marital status
Not married 17.5 24.2 26.2 35.1 6.7 25.9 16.7 10.4 30.6
Married 82.5 75.8 73.8 64.9 93.3 74.1 83.3 89.6 69.4
Years in US 19.2 14.8 14.0 17.0 17.2 13.7 14.9 13.5 -
Home language
English 71.4 33.7 12.2 58.9 34.0 8.4 59.6 48.6 98.1
Non-English 28.7 66.3 87.8 41.1 66.0 91.6 40.4 51.4 1.9
Table 2. Weighted Descriptives for Children of Immigrants and Children of Native-born by Mother’s Region of Origin:
Early Childhood Longitudinal Study – Kindergarten Cohort, 2000
24
Government
assistance
No 91.8 89.4 79.5 82.2 97.6 74.5 92.7 95.8 84.6
Yes 8.2 10.6 20.6 17.8 2.4 25.5 7.3 4.2 15.4
Poverty status
Low income
(<200% FPL) 82.7 93.3 99.5 95.2 78.7 96.7 89.3 85.3 88.2
Not poor (>200%
FPL) 17.3 6.7 0.5 4.8 21.4 3.3 10.7 14.7 11.8
State generosity
< 200% of FPL 19.7 6.8 8.1 6.9 13.8 24.4 2.7 14.1 18.5
= 200% of FPL 35.1 35.1 28.1 23.5 22.8 14.4 38.0 33.5 46.4
> 200% of FPL 45.2 58.2 63.8 69.6 63.5 61.2 59.3 52.4 35.1
Urbanicity
Urban 34.0 50.9 59.7 58.3 35.7 67.4 36.6 33.8 30.6
Suburban 56.5 46.8 32.3 41.3 52.7 24.4 33.8 58.0 40.7
Rural 9.5 2.3 8.0 0.3 11.6 8.2 29.6 8.2 28.7
Note. NE = Northeast. SE = Southeast. WC = West/Central. HS = High School. FPL = Federal Poverty Level
25
Table 3. Odds Ratios from Multinomial Logistic Regression Analyses Predicting Health
Insurance Coverage for Children of Immigrants: Early Childhood Longitudinal Study –
Kindergarten Cohort, 2000 (n = 1998)
Private vs.
Government
Uninsured vs.
Government
Uninsured vs.
Private
Odds
Ratio [95% CI]
Odds
Ratio [95% CI]
Odds
Ratio [95% CI]
Mother's region of
origin
Europe/Canada - - -
Latin America 0.30** [0.14 - 0.61] 1.10 [0.41 - 2.90] 3.72** [1.59 - 8.71]
Mexico 0.40** [0.20 - 0.77] 0.84 [0.33 - 2.18] 2.13+ [0.93 - 4.88]
Caribbean 0.30** [0.15 - 0.62] 1.00 [0.29 - 3.48] 3.32* [1.04 -10.59]
Northeast Asia 0.88 [0.39 - 1.99] 0.78 [0.21 - 2.85] 0.88 [0.27 - 2.87]
Southeast Asia 0.55 [0.27 - 1.14] 0.63 [0.17 - 2.27] 1.14 [0.35 - 3.73]
Other Southeast Asia 0.98 [0.46 - 2.12] 0.60 [0.18 - 2.03] 0.61 [0.20 - 1.85]
West/Central Asia and
Africa 0.50+ [0.24 - 1.08] 0.97 [0.29 - 3.27] 1.92 [0.67 - 5.56]
Child gender
Female (Ref) --- --- ---
Male 1.24 [0.90 - 1.71] 1.25 [0.78 - 2.01] 1.01 [0.65 - 1.56]
Health status 1.53** [1.29 - 1.81] 1.11 [0.86 - 1.44] 0.73* [0.56 - 0.94]
Siblings, no. 0.95 [0.84 - 1.08] 0.99 [0.81 - 1.21] 1.04 [0.87 - 1.25]
Maternal education
<HS (Ref) --- --- ---
HS diploma 1.21 [0.79 - 1.86] 1.19 [0.69 - 2.05] 0.98 [0.59 - 1.65]
>HS 2.16** [1.40 - 3.33] 1.11 [0.61 - 2.01] 0.51* [0.30 - 0.87]
Maternal employment
Not employed (Ref) --- --- ---
Employed <35hrs 1.73* [1.10 - 2.72] 0.91 [0.44 - 1.86] 0.52+ [0.27 - 1.02]
Employed 35+ hrs 2.68** [1.82 - 3.95] 1.34 [0.77 - 2.36] 0.50** [0.30 - 0.82]
Marital status
Not Married (Ref) --- --- ---
Married 1.56* [1.03 - 2.36] 0.86 [0.50 - 1.50] 0.55* [0.33 - 0.92]
Years mom in US 1.02+ [1.00 - 1.04] 0.98 [0.95 - 1.01] 0.96* [0.93 - 0.98]
Home language
English (Ref) --- --- ---
Non-English 0.66+ [0.42 - 1.03] 1.19 [0.63 - 2.22] 1.80 [1.04 - 3.13]
Government assistance

26
No (Ref) --- --- ---
Yes 0.10* [0.06 - 0.17] 0.12** [0.05 - 0.30] 1.28 [0.49 - 3.33]
Poverty status
Low income (<200%
FPL) 0.24* [0.07 - 0.83] 1.76 [0.25 - 12.47] 7.50* [1.55 -36.24]
Not Poor (>200% FPL) --- --- ---
State generosity
< 200% FPL (Ref) --- --- ---
Average 1.78* [1.00 - 3.16] 3.60** [1.56 - 8.32] 2.02+ [0.91 - 4.48]
Generous 0.83 [0.50 - 1.38] 1.17 [0.53 - 2.57] 1.41 [0.65 - 3.06]
Urbanicity
Urban (Ref) --- --- ---
Suburban 1.79** [1.25 - 2.55] 1.43 [0.88 - 2.31] 0.80 [0.51 - 1.25]
Rural 0.74 [0.33 - 1.66] 0.46 [0.15 - 1.44] 0.62 [0.21 - 1.78]
Pseudo R2 =
.25
χ2 (46) = 340.82