immigration policies and the ecuadorian exodusftp.iza.org/dp4737.pdfimmigration policies between the...
TRANSCRIPT
DI
SC
US
SI
ON
P
AP
ER
S
ER
IE
S
Forschungsinstitut zur Zukunft der ArbeitInstitute for the Study of Labor
Immigration Policies and the Ecuadorian Exodus
IZA DP No. 4737
February 2010
Simone BertoliJesús Fernández-Huertas MoragaFrancesc Ortega

Immigration Policies and the
Ecuadorian Exodus
Simone Bertoli European University Institute
Jesús Fernández-Huertas Moraga
IAE-CSIC and IZA
Francesc Ortega Universitat Pompeu Fabra and IZA
Discussion Paper No. 4737 February 2010
IZA
P.O. Box 7240 53072 Bonn
Germany
Phone: +49-228-3894-0 Fax: +49-228-3894-180
E-mail: [email protected]
Any opinions expressed here are those of the author(s) and not those of IZA. Research published in this series may include views on policy, but the institute itself takes no institutional policy positions. The Institute for the Study of Labor (IZA) in Bonn is a local and virtual international research center and a place of communication between science, politics and business. IZA is an independent nonprofit organization supported by Deutsche Post Foundation. The center is associated with the University of Bonn and offers a stimulating research environment through its international network, workshops and conferences, data service, project support, research visits and doctoral program. IZA engages in (i) original and internationally competitive research in all fields of labor economics, (ii) development of policy concepts, and (iii) dissemination of research results and concepts to the interested public. IZA Discussion Papers often represent preliminary work and are circulated to encourage discussion. Citation of such a paper should account for its provisional character. A revised version may be available directly from the author.

IZA Discussion Paper No. 4737 February 2010
ABSTRACT
Immigration Policies and the Ecuadorian Exodus* Ecuador experienced an unprecedented wave of international migration since the late 1990s, triggered by a severe economic and financial crisis. This paper gathers individual-level data from Ecuador and the two main destinations of Ecuadorian migrants: the US and Spain. First, we provide a careful description of the main characteristics of migration flows, both in terms of their scale and skill composition. Second, we estimate Mincer regressions for Ecuadorians in the three countries, and attempt to reconcile the features of migration flows with our predictions for earnings by destination. We find that earnings differences can account for the higher share of college graduates among migrants to the US, but fail to explain the larger scale of the flows to Spain. We argue that the puzzle is explained by taking into account that (i) the options to migrate legally to either destination were slim, and (ii) the cost of illegally migrating to Spain was lower than to the US. JEL Classification: O15, J61, D31 Keywords: migration, selection, sorting, immigration policies Corresponding author: Jesús Fernández-Huertas Moraga Institut d’Anàlisi Econòmica - CSIC Campus UAB 08193 Bellaterra (Barcelona) Spain E-mail: [email protected]
* This paper is part of the INSIDE research projects. The authors are grateful to Gordon Hanson, Hillel Rapoport, participants at the World Bank-AFD Second International Conference on Migration and Development and at the Third INSIDE Workshop for their comments and suggestions. We would also like to thank Lídia Brun and Feray Koç for their helpful research assistance. Jesús Fernández-Huertas Moraga received financial support from the ECO2008-04785 project, funded by the Spanish Ministry for Science and Innovation. Jesús Fernández-Huertas Moraga and Francesc Ortega also acknowledge the support of the Barcelona GSE Research Network and of the Government of Catalonia. The usual disclaimers apply.

2
1. Introduction
The literature identifies wage differentials across countries as the key factor
shaping the decision of whether and where to migrate (e.g. Roy, 1951; Borjas,
1987). There is a broad consensus that many other non-wage factors, such as
demographic changes in the origin countries (Hanson and McIntosh, 2009) and
cultural and linguistic proximity (Grogger and Hanson, 2008), also play an important
role in determining international migration flows. One such factor is the immigration
policy adopted by the main host countries. In general, the effects of immigration
restrictions on immigration flows are hard to disentangle from the effects of other
characteristics of the host country.2
Here, we analyze a migration episode where immigration policies arguably
represented a crucial factor in shaping migration flows. In the aftermath of a severe
economic crisis at the end of the 1990s, Ecuador experienced an unprecedented
wave of emigration. Most migrants did not opt for the traditional destination, the US,
although this offered the highest wages. Rather, most Ecuadorian migrants chose
Spain. We argue that differences in the immigration policies adopted by the US and
Spain explain this puzzle.
In this paper, we assemble individual-level data for Ecuador and for the two
main destinations (the US and Spain).3 Then we address three research questions.
First, we aim at describing the salient features – in terms of scale and skill
composition - of the recent Ecuadorian migration wave. Second, we estimate
country -specific Mincer regressions and assess whether our estimates are consistent
with the observed migration flows. Third, we discuss the role played by other
2 Ortega and Peri (2009) provide some evidence based on within-country variation over time.
3 The 2001 Ecuadorian Population Census evidences that Spain and the US jointly absorbed 79 percent of the Ecuadorian migrants who left the country between 1999 and 2001, when the wave of migration reached its peak.

3
non-wage factors – specifically, migration costs and the risk of deportation - in
affecting migrants’ destination choices.
The data reveal that, although Spain was the main destination for all
education-gender groups, there were relevant differences across groups. The scale of
flows to Spain relative to those to the US was larger for women and for non-college
graduates. Regarding skill composition, we find that the share of college graduates
among Ecuadorian migrants to the US was larger than the corresponding share
among Ecuadorians migrating to Spain.
The Mincer regressions reveal that the college wage premium was highest in
Ecuador and lowest for Ecuadorians in Spain. The pattern of wages is consistent with
the higher share of college-educated migrants in the flow to the US. However, the
lower earnings for all education-gender groups in Spain relative to the US are starkly
at odds with the surprisingly larger flows.
We argue that this apparent puzzle can be explained by the differences in
immigration policies between the two destination countries. The options for legal
migration to both Spain and the US were extremely limited, but the monetary costs
and the risks of migrating illegally to Spain were considerably lower than doing so to
the US. We argue that the key policy difference was that Ecuadorians could travel to
Spain as tourists on a visa waiver program, while illegal migration to the US was
much more risky and expensive.
The paper is structured as follows. Section 2 provides a brief description of
the economic causes of the recent Ecuadorian exodus. Section 3 presents basic data
on the scale of this migration episode. Section 4 presents descriptive statistics.
Section 5 presents our analysis of the skill composition of migration flows. Section 6
reports Mincerian regressions and attempts to reconcile the implied wages with the
data on migration flows. Section 7 discusses the most relevant differences in
immigration policies between the US and Spain. Finally, Section 8 concludes.
4
2. The economic roots of the Ecuadorian exodus
The late 1990s represented a period of high macroeconomic instability for
Ecuador, which eventually led to the collapse of the domestic currency, the Sucre,
which was replaced by the dollar as a legal tender of exchange in January 2000. The
decision to opt for a de jure dollarization taken by the government led by Jamil
Mahuad followed a long period of de facto dollarization of the economic system
(Jácome, 2004), as domestic agents attempted to preserve the value of their assets
from a high and unstable domestic inflation. This de facto dollarization magnified the
vulnerability of the country to external shocks: in 1998, the international price of oil,
which represented the largest source of foreign currency earnings and fiscal revenue
fell to a historical low, at the time the government had to confront the spending
needs determined by the major damages to the infrastructures and to the
agricultural sector induced by El Niño in the coastal areas of the country.
The Sucre began to depreciate against the dollar, and a mounting pressure
was exerted on the banking system, whose credit portfolio suffered from the loss of
value of the Sucre: banks had lent in dollars to Sucre-earners, so that the
devaluation impaired the ability of the debtors to pay back their debts. The
government froze all bank accounts in March 1999 in an attempt to prevent a bank
run, while the central bank was injecting huge amounts of liquidity in the system.
But these interventions could not prevent the situation from deteriorating. In
September, Ecuador defaulted on its external debt, and 16 banks –representing 40
percent of the deposit base– had either failed or had gone under public stewardship
(Jácome, 2004). The gross domestic product fell by 6 percent over the year, and
Ecuador was on the verge of hyperinflation when the government decided to
dollarize.
Dollarization did not stop inflation immediately, as the conversion of the Sucre
was implemented at a highly depreciated exchange rate, because of the limited

5
foreign exchange holdings of the central bank which had to be used to buy back the
monetary base (Beckerman and Cortés Douglas, 2002). This substantially curtailed
real wages, which began to recover alongside the Ecuadorian economy, that
benefited from the marked and steady increase in the price of oil. Nevertheless, the
crisis produced an hysteretic impact upon income poverty (Larrea, 2004), and it
generated long-lasting effects upon the value of financial savings; notwithstanding a
blanket public guarantee on deposits, many domestic savers had not yet recovered
their savings several years after the crisis (Laeven and Valencia, 2008).
3. Ecuadorian migration after the crisis
The three data sources that we employ are the December 2005 round of the
Encuesta Nacional sobre el Empleo y Desempleo en el Area Urbana y Rural (ENEMDU
2005) for Ecuador, the 2007 American Community Survey (ACS 2007) for the US,
and the 2007 Encuesta Nacional de Inmigrantes (ENI 2007) for Spain. The ENEMDU
2005 is a nationally representative labor market survey conducted in December 2005
on a sample of 18,357 households. The ACS 2007 has a sample covering
approximately 2.5 percent of the resident population in the US, while the ENI 2007 is
a nationally representative survey on the foreign-born population in Spain, with a
sample size of 15,500 foreign-born individuals.
These three data sources provide comparable individual-level information on
the Ecuadorians residing in the three countries concerning age, year of migration,
gender, education, marital status, employment status, sector of occupation and
income at the individual level at the time of the survey. Merging the three datasets
delivers a sample of 73,758 stayers and 2,030 migrants (to Spain and the US
combined) over the 1999-2005 period.4
4 The ENEMDU 2005 also provides the same information – except for income - on the migrant members of sample households; we do not use these data as the ENEMDU 2005 suffers from an undercounting of the
6
Figure 1 plots the distribution of the Ecuadorian migrants sampled in the ACS
2007 and in the ENI 2007 by year of arrival in the US or in Spain. The time profile of
migration flows from Ecuador in the two sources is strikingly similar. Figure 1 clearly
shows a surge in the flows to the US and Spain around the year 2000, in the
aftermath of the economic crisis. The scale of the flows to both destinations
remained well above the pre-crisis levels until 2003. This strongly suggests that
these flows were mainly driven by push-factors.
While the flows to the two destinations have a similar timing, it is important
to realize that their scale differs substantially. According to these sources,
Ecuadorian migration to the US stood at 137,148 individuals over the 1999-2005
period, while the corresponding figure for Spain reached 318,243 individuals. The
ACS 2007 and the ENI 2007 should theoretically cover the foreign-born
independently of their legal status, but miss return migration happening between
1999 and 2007. In order to understand the magnitude of both sources of bias, we
attempt to validate these figures comparing them with the ones emerging from
different data sources for the three countries.
First, we compare the stock of Ecuadorian-born individuals in both destination
countries before and after our period of study. The size of the Ecuadorian-born
individuals in the US increased from 272,000 individuals prior to the crisis (2000 US
Census5) to 374,000 in 2005, according to the ACS 20066. The size of the Ecuadorian
community in Spain increased from 76,000 (2001 Spain Census7) to 457,000
migrants which is due both to its inability to capture whole households that move and to interviewees’ reluctance to disclose information about a migrant who resides illegally in the country of destination.
5 This figure corresponds to Ecuadorian-born in the US Census who declared having arrived to the US before 1999.
6 The corresponding figure for the ACS 2007 stands at 394,000, reflecting the delay with which host country surveys are able to enumerate recently arrived immigrants.
7 This figure corresponds to Ecuadorian-born in the Spain Census who declared having arrived to Spain before 1999; it is substantially larger than the figure of 8,000 typically reported elsewhere (e.g. Jokisch and Pribilsky, 2002) on the basis of the Local Population Registry (Padrón). The reason for the discrepancy is that illegal immigrants lacked incentives to register in the Padrón before the Law 4/2000 which granted registered immigrants access to public services (see section 7).

7
individuals (2006 Local Population Registry8) over the same period. Hence, these
data imply that 122,000 Ecuadorians migrated to the US between 1999 and 2005,
while the corresponding estimate for Spain was 361,000 individuals. Reassuringly, a
very similar picture emerges from Ecuadorian administrative data collected upon
arrival or departure of Ecuadorians (Anuario Estadístico de Migración by the INEC).9
Figure 2 depicts the net flow of Ecuadorians to the US and Spain according to this
administrative source.
The total net flow of Ecuadorians to the US between 1999 and 2005 amounts
to 114,000 individuals, compared with 384,000 individuals to Spain.10 In conclusion,
different data sources provide a consistent picture with respect to the scale of the
post-crisis Ecuadorian migration flows to the two main destinations: the scale of
migration to Spain during our period of interest was roughly three times larger than
the corresponding figure for the US. The concordance between all the sources
validates our use of the ACS 2007 and ENI 2007 as the basis for the analysis.
4. Descriptive statistics
We now turn to the education and gender composition of the migration flows
from Ecuador to the US and Spain between 1999 and 2005.11 The Spain-US ratio for
the total migration flow in Figure 1 is 2.3 (ENI and ACS 2007). The corresponding
8 This figure referes to January 1, 2006; it is likely to be an upper bound on the total number of Ecuadorians in Spain at that time since municipal authorities did not have incentives to unregister returning migrants, as the assignment of funds from the central government relates to the size of the resident population.
9 The data from this source are not directly comparable with the data from the destination country sources described above; first, it fails to capture the migrants who leave the country through illegal routes; second, because it captures temporary migrants, who go unrecorded in destination country data sources if they return home prior to the time of the survey; third, because they are not influenced by demographic events who concern the migrants after departure, while destination country data sources are influenced. 10 Figure 2 evidences a flow of 111,836 migrants to Spain in the peak year, 1999, while Figure 1 reports 81,901 migrants for the same year; the difference is consistent with the difference in the two data sources, and with the fact that Figure 2 suggests that the number of return migrants exceeded the number of new migrants to Spain in 2004 and 2005. 11 Data on years of schooling are not comparable across the three surveys, so that we differentiate among college and non-college graduates, with the former being defined as individuals with at least 4 years of tertiary education.

8
ratio falls to 2.1 for males and rises to 2.6 for females. Similarly, the Spain-US ratios
for college and non-college graduates were, respectively, 1.8 and 2.4. That is to say,
migration flows to Spain were relatively larger for women and for non-college
graduates (see Table A1 in the appendix). We can restrict the sample of migrants to
individuals belonging to the 1949-1982 birth cohorts, who were aged 16 to 49 in
1998, at the onset of the economic crisis. This age restriction reduces the sample
estimated migration flow out of Ecuador from 455,391 to 327,962 individuals. This
choice, which gives us a sample of 28,122 stayers, 509 emigrants to the US and 915
migrants to Spain, allows us to compare migrants with stayers which belong to the
same birth cohorts, while a restriction on the basis of age – either at the time of the
survey or at the time of migration – would have failed to do so.
Our estimates of the ratio of Spain to US migration flows in the restricted
sample provide a very similar picture. The total migration flow to Spain was 3.0
times as large as the flow to the US. And the scale of migration to Spain was
relatively larger for non-college graduates (3.2 versus 1.9 for college-graduates) and
for women (3.2 versus 2.8 for males). These figures suggest that the incentives –
and the ability – to migrate to the US differed across education and gender groups.
Even though the scale of the flows to Spain relative to the US was larger for all four
groups, the differences were smaller for males and for college-graduates.
In order to compare migrants with stayers, and to get a first sense of the
pattern of selection with respect to education, we draw also on the ENEMDU 2005.12
As mentioned above, we restrict our merged dataset to the individuals who were
born in 1949-1982, and – if they did so – migrated between 1999 and 2005.
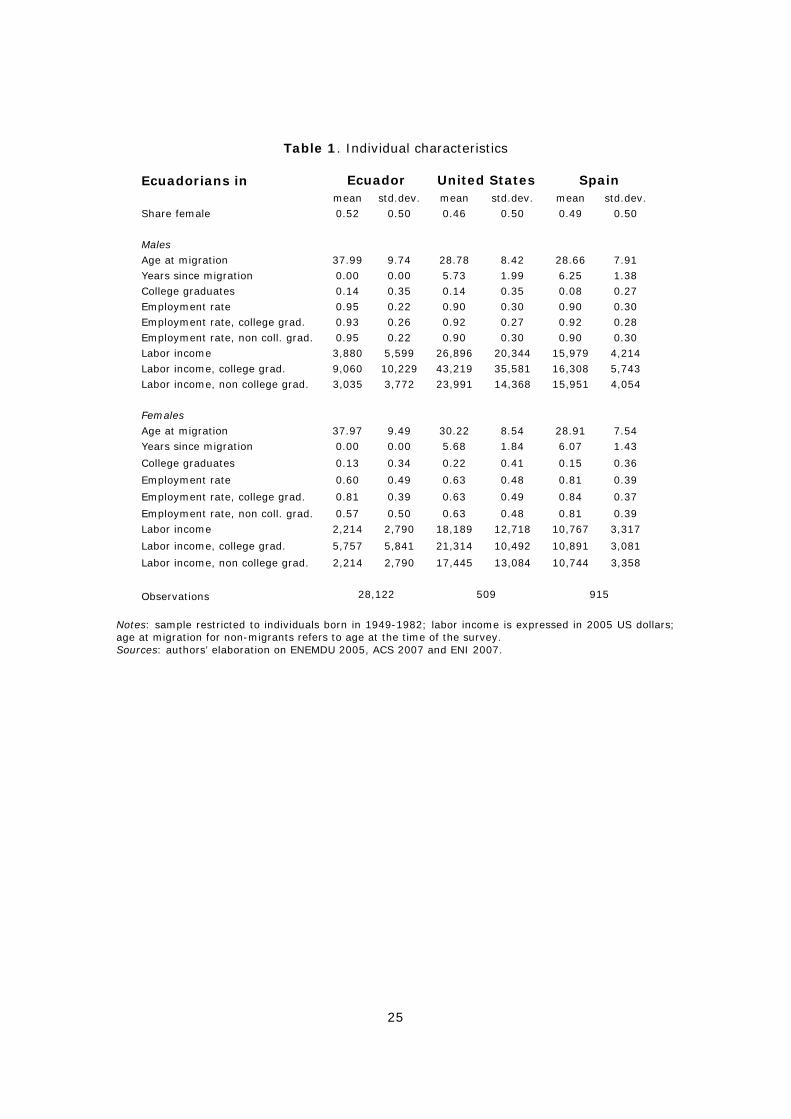
Table 1 shows that migrants to the two destinations have a similar age, and
they are younger than stayers. In line with the similar timing of the flows to the US
12 By selection we mean the comparison between the average education of migration flows to a particular destination relative to the average education of stayers.

9
and Spain evidenced in Figures 1 and 2, migrants to the two destinations had been
residing for an average of approximately 6 years in the two countries at the time of
the surveys. Table 1 also reveals that male migrants to Spain, where just 8 percent
of them hold a college degree, are negatively selected with respect to education,
while the share of college graduates among Ecuadorian male migrants to the US, 14
percent, is in line with the one recorded for stayers, 14 percent. For females, Table 1
evidences positive selection towards the US, where the share of college graduates
stands at 22 percent, compared with 13 percent for non migrants.13
It is important to observe that the employment rate for males – for both
college and non-college graduates - is the same in the US as in Spain, which
suggests that this should have played a limited role in influencing male would-be
migrants’ destination choice. For females, we observe a substantially higher
employment rate in Spain than in the US, which is probably more reflective of the
fact that tied movers were a greater share of Ecuadorian women in the US, rather
than of relevant differences in labor market conditions at the two destinations.
Ecuadorian migration to the US had traditionally been predominantly male, so
women could access family reunification provisions, which are described in section 7,
to a greater extent than men (Sánchez, 2004) in the post-crisis period. Conversely,
early migrants to Spain were predominantly females, which were given permits to
work in the domestic and elderly care sectors (Jokisch and Pribilsky, 2002).
Table 1 also provides information about labor incomes for Ecuadorians in the
three countries, which are analyzed in greater detail in section 6. Labor earnings in
the US are well above the corresponding figures for Spain – and for Ecuador - for
both genders and levels of education. Average labor earnings for an Ecuadorian male
13 The same picture emerges when we restrict the sample to individuals born in 1949-1973 (25 to 49 years of age in 1998), so that they had already completed their education at the onset of the late-1990s crisis.
10
college graduate in the US exceed those in Spain by $27,000, while this differential
for non-college graduates narrows down to $8,000.
With respect to the labor earning figures, it is important to observe that these were
collected in 2007 for migrants, and that the exchange rate between the euro and the
dollar underwent substantial swings over our 7-year reference period. The exchange
rate stood at $0.92 per euro in 2000, when the post-crisis migration reached its
peak, while the exchange rate had moved up to $1.37 per euro in 2007, at the time
when the labor earning figures where collected (see appendix figure A1). The sharp
depreciation of the dollar over the period entails that Table 1 underestimates the
difference in earnings between the two main countries of destination which was
prevailing at the time when most migrants decided to leave Ecuador.
5. Selection and sorting by education
We now present a more formal comparison of the skill composition of
migration flows relative to stayers (selection in terms of education) and between the
two destinations (sorting).
Table 2 presents our selection and sorting regressions. We estimate a probit
model for the probability of being a college-graduate, on a sample including stayers
and migrants to both destinations (selection) or just migrants to both destinations
(sorting). We consider several specifications, varying in the control variables we
include.14
Regarding selection, the first panel presents our estimates on the subsample
of males. Likewise the second panel presents the estimates for females. We have
14 The need to merge three datasets limits the set of controls that can be included. Specifically, while the ENI 2007 provides information on the province of origin of Ecuadorian migrants, the ACS 2007 does not, and this prevents us from controlling for the influence that pre-crisis migration networks can exert upon the pattern of selection of migrants with respect to education (McKenzie and Rapoport, forthcoming), which Bertoli (2009) found to be significant as far as migration to the US is concerned; still, the province of origin is highly correlated with the education in the case of the US (see below), while the results for Spain do not change once we control for this additional variable.
11
two main findings regarding selection by education. First, Ecuadorian female
migrants to the US were significantly more educated, on average, than stayers, as
can be seen in the bottom panel. Possibly, male migrants to the US were also
positively selected in terms of education. However, our point estimate is much closer
to zero and not significant. Second, Ecuadorian males that migrated to Spain were
significantly negatively selected. We again find a gender asymmetry. For the case of
Ecuadorian female migrants to Spain we do not find evidence of negative selection.
As can be seen in the third panel, our point estimates are positive although not
significant.
We now turn to our results on sorting by education across destinations. These
models are now estimated on the sub-sample of migrants alone. The main
explanatory variable takes a value of one if the individual migrated to Spain and zero
if he or she migrated to the US. The third panel presents the results for males and
the fourth for females. In both panels the estimated coefficients are negative and
highly significant. In words, we find that migrants to Spain were negatively sorted, in
terms of education, relative to migrants to the US. Moreover, this is true for both
genders although the coefficients are somewhat larger (in absolute value) for men
than for women.
6. Earnings and the destination choice
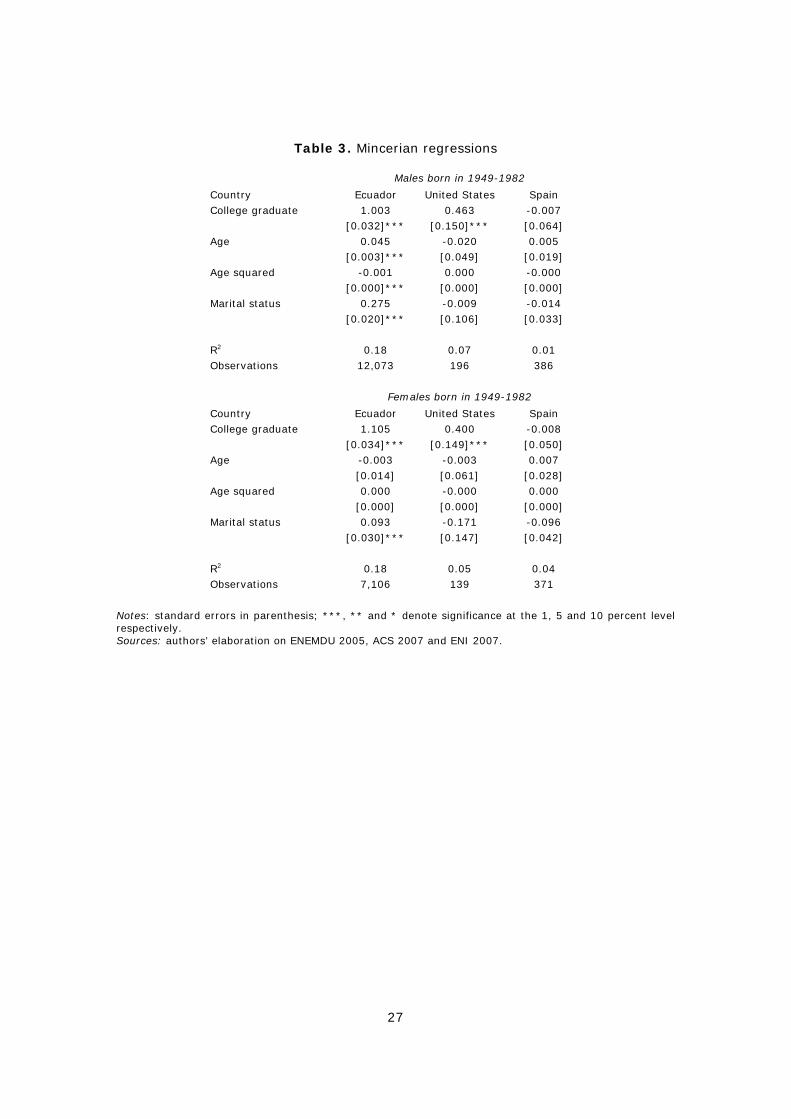
Our rich individual-level data allow us to estimate Mincer regressions using
earnings for Ecuadorians in each of the three countries. In particular, this implies
that we are able to estimate the returns to education for Ecuadorian migrants at
each destination, without having to rely on extrapolations from the native
population, as is the case in most studies (Grogger and Hanson, 2008). Specifically,
the dependent variable in our regressions is the log of annual earnings in 2005 USD.
As explanatory variables we include age, age squared, marital status and a dummy

12
for having a college degree. We estimate the models separately by gender and
country.
Table 3 reports our estimates. Our findings are in line with the descriptive
statistics in Table 1. First, Ecuador features a very high college wage premium: 100
and a 110 percent for males and females, respectively. Second, the estimates for the
US reveal that the college wage premium for Ecuadorians in the US was also quite
substantial, although lower than in Ecuador: 46 percent for males and 40 percent for
females. In contrast, college-educated Ecuadorians in Spain earned virtually the
same as non-college-educated ones. That is, the earnings profile for Ecuadorians in
Spain appears to be flat across education levels, both for men and women.
The differences in the estimated college premia across the two destination
countries are due neither to differences in the time elapsed since migration to the
two countries, given the similar timing of the flows to the two countries shown in
Figure 1, nor to differences in the legal status of the Ecuadorian migrants in the two
countries. We estimate that the share of Ecuadorians that resided legally in the US in
2007 was 60.4 percent,15 while we estimate that the corresponding figure for Spain
was 91.0 percent.16 Therefore accounting for the rate of illegality would, if anything,
suggest a larger gap in college wage premia between the two countries.
Table 4 displays the predicted average annual earnings, by gender and level
of education, for Ecuadorians in each of the three countries. The table reveals that
college graduates enjoyed a larger earnings gain from migrating to the US (around
$26,000 for males) than non-college graduates (around $18,000 for males). In
contrast, migration to Spain entailed larger expected gains in earnings for
15 The ACS 2007 reports that there were 403,643 individuals born in Ecuador who were residing in the US by January 1, 2007; at the same date, Hoefer, Rytina and Baker (2008) report that an estimated 160,000 Ecuadorians were residing illegally in the country, so that the share of legal migrants stood at 60.4 percent, and this share would be lower if one could focus only on post-crisis migrants. 16 There were 434,673 Ecuadorians recorded in Spain’s Local Population Registry at January 1, 2007. 376,233 Ecuadorians held a legal residence permit and 19,345 had been naturalized. These figures entail that 91.0 percent of the Ecuadorian-born were residing legally in the country in 2007.

13
non-college graduates (around $13,000 for males) than for individuals with a college
degree (about $9,000 for males).
Tables 3 and 4 produce unambiguous predictions with respect to the pattern
of migrants’ selection to Spain no matter whether one assumes that migration
decisions are driven by differences in relative or in absolute returns to education, as
both assumptions entail a negative selection of the migrants to Spain. This prediction
is in line with what Table 2 evidences with respect to males, while the corresponding
estimates on the female sample are not significant.
On the other hand, Tables 3 and 4 produce contrasting predictions with
respect to the pattern of migrants’ selection to the US, as a linear utility model along
the lines of Grogger and Hanson (2008) would predict positive selection with respect
to education on the basis of the predicted wages in Table 4, while a logarithmic
utility model á la Roy (1951) would lead to the opposite prediction on the basis of
the college premia estimated in Table 3. The estimates on selection that we
presented in Table 2 point to a positive selection, in line with the prediction based on
a simple linear utility model, though this is not statistically significant for males,
possibly because of the confounding effect of migration networks. Networks, which
provided options for legal migration through family reunification provisions, may
explain these results. The rural and low-educated provinces of Azuay and Cañar were
the only ones with established migration networks to the US to the crisis (Jokisch
and Pribilsky, 2002; Bertoli, 2009).17
Tables 3 and 4 produce unambiguous predictions with respect to the sorting
of migrants across destinations, as Ecuadorian college graduates enjoy a higher
return – both in relative and in absolute terms – from migrating to the US than to 17 The data from the ENEMDU 2005 reveal that the share of college graduates among migrants to the US originating from Azuay and Cañar stands at 4.6 percent, compared to 27.6 percent for migrants from the rest of the country. Though one should bear in mind the limitations of the ENEMDU 2005 as far as the migrant data are concerned, the observed difference - which is highly statistically significant - is suggestive of the role that migration networks played in shaping migrants’ selection with respect to education.

14
Spain, and this prediction is consistent with the evidence that we presented in Table
2 for both genders. The estimated coefficients are less precisely estimated for
females; this might be due to the fact that the greater relevance of tied moving for
females softens the sensitivity of their destination choice to income-maximization
objectives. Even in this case, the evidence on positive sorting would probably be
even stronger if we were able to control for the province of origin of the migrants.
Thus, the estimated college premia and the predicted average level of wages across
groups are consistent with the pattern of migrants’ sorting, and – though less neatly
so – with what we have observed in terms of selection to the two main destinations.
Still, there is a crucial factor that Table 3 and Table 4 cannot explain, which is the
relative scale of migration to the US or Spain: any basic migration decision model
would predict much greater flows to the US rather than to Spain, while the data
suggest that the latter destination attracted a flow of Ecuadorian migrants in the
post-crisis period which was two to three times larger than the first one. Section 7
discusses the non-wage factors that can contribute to address and solve this puzzle.
7. Immigration policies
The immigration policies adopted by the US and Spain offered Ecuadorians
markedly different options for migration. Legal migration to the US was restricted
almost exclusively to Ecuadorians with immediate relatives already in the country.
Various issues of the Yearbook of Immigration Statistics by the Department of
Homeland Security reveal that only 7,705 out of 64,059 Ecuadorians who obtained a
legal residence permit between 1999 and 2005 did so thanks to employment-based

15
preferences.18 Most Ecuadorians obtained legal status thanks either to family-based
preferences (17,396) or because they were close relatives of US citizens (36,412).19
As noted above, migration to the US prior to the crisis originated mostly from
the two Southern Andean provinces of Azuay and Cañar. In contrast, migrants to the
US during the crisis originated all throughout the country. This suggests that most
migrants aiming at the US were forced to enter illegally. Typically, this required
travelling by plane (legally) from Ecuador to Mexico, and then attempting to cross
(illegally) the Southern border of the US (Jokisch and Pribilsky, 2002). Tighter
controls substantially increased the monetary costs of migrating illegally to the US,20
and greatly increased the risk of apprehension.
The options for migrating to Spain were radically different. Ecuador and Spain
had signed a bilateral agreement back in 1963 allowing their citizens to be admitted
for a period of up to 3 months in the other country without a visa. This visa waiver –
which was a common practice between Spain and most of its former colonies in Latin
America – gave Ecuadorians the option to enter legally into the country, provided
that they could present “approximately $2,000 (‘la bolsa’), a credit card, tourist plan,
hotel reservations, confirmed return flight, and justification for being in Spain”
(Jokisch and Pribilsky, 2002). Then, it was easy to extend the stay over the 3-month
period, and wait for one of the recurrent amnesties (2000, 2001 and 2005).
Ecuadorian migrants used to send la bolsa back to Ecuador through a money
transfer operator, to allow another individual to migrate, so that the monetary costs
of migrating to Spain were substantially lower than the corresponding costs of
migrating illegally to the US. The Encuesta Nacional de Inmigrantes provides data on
18 These figures include adjustment of status of individuals who were already residing in the US.
19 The 2000 US Census signals that 102,550 out of the 298,650 individuals who were born in Ecuador had obtained the citizenship.
20 Anecdotic evidence suggests to be in the $7,000-9,000 range in the late 1990s (Jokisch and Pribilsky, 2002).

16
the monetary costs, which stand at approximately $1,800 over our sample of
Ecuadorian migrants in the post-crisis period. As in the aftermath of the crisis
liquidity-constraints were probably binding for many would-be migrants, the lower
monetary costs of migrating to Spain are likely to have been an important factor in
determining the choice of destination.
It is possible to provide a measure of the risks entailed by illegal migration to
the US and Spain through data on apprehensions and deportations. Table 5 reports
data from the US Immigration Authority, the US Coast Guard and the Mexican
Instituto Nacional de Migración about the number of apprehensions or interdictions of
Ecuadorians who tried to reach the US21 and data on deportations of Ecuadorian
migrants to Spain from the Spanish authorities.
The total number of episodes between 1999 and 2005 in which Ecuadorian
migrants were caught at sea, in Mexico or by border patrollers stands at 21,605,
with each of these three cases having roughly the same frequency. 22 Table 5 reveals
the role played by Mexico within the Operation Gatekeeper in curbing illegal
migration from Ecuador to the US. Table 5 also reports 15,149 cases of Ecuadorians
that were deported from Spain over the 1999-2003 period.23 The vast majority of
these (13,438) were rejections at the border, possibly because they failed to
21 The website www.migrantesecuador.org includes a detailed press section, which signals episodes in which illegal Ecuadorian migrants were apprehended in Guatemala and El Salvador, and information about tragic episodes such as the death of 17 migrants who were trying to cross the Cocibolga Lake in Nicaragua in April 1998, the drowning of 26 Ecuadorians close to the Guatemalan coasts in August 2000, and the death of 94 Ecuadorians in Ecuadorian waters in August 2005; these episodes are not included in Table 5, and reveal that illegal migration to the US also entailed a non-negligible risk of death.
22 A usual concern with apprehension figures is that the same would-be migrant can be apprehended more than once, and eventually succeed in migrating; Pribilsky (2007) observes that “it is a common practice for Border Patrol agents to ‘throw back’ alien Mexicans caught crossing illegally”, and most Ecuadorians can successfully pretend to be Mexicans upon apprehension, so that they can easily attempt again to cross the border. Still, the figures in Table 5 only refer to individuals who are identified as Ecuadorians, and hence deported to Ecuador.
23 Spanish authorities ceased to report data on deportations broken down by country of origin of the migrants in 2004.

17
convince Spanish authorities of their intention to remain only temporarily in the
country as tourists.24
Combining the data in Table 5 with data on total migration flows (as in Figure
1), and with information on legal migration, we produce an estimate of the risk of
failure associated to an attempt to migrate illegally to each of the two countries.25
Specifically, we compute the ratio between the number of deportations and the
estimate of illegal migration plus deportations.
The estimated risk for the US is at 19.4 percent, while the corresponding
figure for Spain is 5.7 percent. Hence, the two main destinations differed markedly
both with respect to their direct cost of migrating and with respect to the risk that
the attempt to migrate could fail.
Does accounting for risk alter the perception of the relative profitability of
opting for Spain rather than for the US? It does, although the estimated risks fall
short of offsetting the wage differential between the two destination countries. Using
the predicted earnings in Table 4 and the estimated risk, pSP, entailed by illegal
migration to Spain, we can make a back-of-the-envelope calculation of the risk of
apprehension in the US, pUS, that would offset the wage differential between the two
destinations.26 Specifically, we assume that if apprehended and individual has to
remain permanently in the country of origin, then pUS is given by:27
24 Table 5 evidences a surge in the number of Ecuadorians who were rejected at Spanish borders in 2002 and 2003; this entails that – before the visa waiver was eventually lifted in August 2003 – the authorities markedly intensified their controls on immigrants to Spain.
25 For the US, the 2008 edition of Yearbook of Immigration Statistics reports that 16,951 Ecuadorians entered legally over the 1999-2002 period, a figure that represents 25.0 percent of the total inflow over the same period according to the ACS 2007; for Spain, 52,828 were admitted in Spain with a working visa over the 1999-2003 period, which represents 17.4 percent of the total inflow over the same period according to the ENI 2007.
26 Note that this computation relates only to the predicted earnings figure, while it disregards the monetary costs of migration to the two countries, as we do not have individual-level data on this for the US; if we were to account for them, the risk of apprehension which makes a would-be migrant indifferent would be clearly lower than the one suggested by Eq. [1].
27 This simple exercise implicitly assumes that would-be migrants are forward looking, as the predicted earnings which enter into Eq. [1] are compared at the nominal exchange rates prevailing in 2005, and not

18
( ) ( )( )
( )( )
US SP US SP SP ECUS SP
US EC US EC
w w c c w w
w w w w
− − − −= +
− −p p [1]
The figures in Table 4 entail pUS = 0.31 for male non-college graduates, while
the corresponding figure for male college graduates is 0.66. While this latter figure is
more than three times larger the 19.7 percent risk that we inferred from the data
presented in Table 5, the former is just 1.5 times larger.
This exercise is suggestive of the relevant role played by immigration policies
in shaping the attractiveness of the two countries for Ecuadorian would-be migrants,
and of its greater influence on the destination choice of non-college graduates.
Needless to say, immigration policies were not the unique non-wage factor
that influenced the destination choices of Ecuadorian would-be migrants. Specifically,
there are at least four major factors which increase the attractiveness of Spain for
any given differential in earnings.28 First, figures in Table 4 are not adjusted for price
differences between the two destination countries; the ratio between the purchasing
power parity conversion factor and the nominal exchange rate between the euro and
the dollar stood at 95.5 percent in 2005 (World Bank, 2008), revealing that the costs
of living were slightly lower in Spain. Second, Ecuadorians were aware of the high
frequency of Spanish amnesties. Third, the cultural proximity between Ecuador and
Spain is likely to have played a role as well. Fourth, Ecuadorian migrants benefited
from a bilateral agreement with Spain, the General Agreement on Social Security
at the time of migration; the value of pUS computed according to Eq. [1] would be higher if we accounted for the depreciation of the dollar vis á vis the euro.
28 There are two additional factors which go in the ooposite direction, though they are admittedly less influential than the ones that we describe in the text: income taxes in the United States were lower than in Spain for the level of earnings of Ecuadorian migrants (Bertoli, Fernández Huertas-Moraga and Ortega, 2009), and the cost of sending remittances back home was lower from the United States than from Spain, as the dollarization of Ecuador prevented MTOs in the United States from applying an unfavourable exchange rate to the transfers. See World Bank, Remittances Prices Worldwide, at http://remittanceprices.worldbank.org.

19
signed in Quito on April 1, 1960, which ensured the full portability of pension rights
between the two countries.29
Despite these four and possibly other non-wage factors, we still believe that
the differences in immigration policies between the two countries were the key
difference. Our conviction is based on an important change in Spain’s immigration
policy. In March 2003, the Council of the European Union included Ecuador in the list
of countries whose citizens needed a visa to enter a member country (Council
Regulation (EC) No. 453/2003), and Spain aligned to this regulation on June 3,
2003, when it informed Ecuadorian authorities of the suspension of the visa waiver
(Boletín Oficial del Estado No. 159, July 4, 2003). The communication entailed a
two-month notice, so that the requirement of a visa for Ecuadorians came into force
on August 3.
Figure 3 reports the monthly inflows of Ecuadorians into Spain according to
the Local Population Registry.30 Clearly, the inflow of Ecuadorians sharply dropped
right after the suspension of the visa waiver: the average monthly inflow went down
from 7,862 in the twelve months prior to the immigration policy change to 1,566 in
the subsequent twelve months. This seemingly minor policy change had a dramatic
change on the distribution of Ecuadorians across the two main destination countries,
as Figure 1 and 2 show that the US came back to be the main destination for 2004
and 2005.
29 Article 4 of the General Agreement on Social Security states that: “when an insured person has worked in the two countries without completing in either the minimum period of contribution necessary to receive the invalidity benefit and old-age pension provided for under the social security legislation of each country, the periods of contribution in each country shall be aggregated for the purpose of determining entitlement”.
30 The accuracy of the Registry is very high, particularly since year 2000. See Fernández-Huertas Moraga, Ferrer and Saiz (2009).

20
8. Conclusions
The economic crisis that hit Ecuador in the late 1990s gave rise to an
unprecedented migration wave. Most migrants went to Spain or the US. Using
individual-level data from a variety of sources we have argued that the skill
composition of these migration flows was consistent with the wages received by
Ecuadorians at each destination.
However, the larger size of the migration flows to Spain was puzzling given
the lower wages received by Ecuadorians, relative to the US. This puzzle is resolved
by taking into account i) that the options for legally migrating to the US or Spain
were severe limited, and ii) migrating illegally to the US was much more costly (in
terms of money, risk of death and uncertainty) than to Spain. This difference in costs
was, to a large extent, policy-induced.
The evidence presented in this paper shows that changes in immigration
policy can have very large effects on the size of immigration flows. The US tightening
of controls over illegal immigration since the mid-1990s was effective in diverting the
flow of Ecuadorians in the aftermath of the crisis towards Spain. When Spain
repealed the visa waiver granted to Ecuadorians in August 2003, the inflow of
Ecuadorians halted almost immediately.
21
References
Beckerman, P., Cortés Douglas, H., (2002), “Ecuador under Dollarization:
Opportunities and Risks”, in P. Beckerman and A. Solimano (eds.), Crisis and
Dollarization in Ecuador, pp. 81-126, the World Bank, Washington DC.
Bertoli, S., (2009), “Networks, sorting and self-selection of Ecuadorian migrants”,
paper presented at the Transnationality of Migrants Conference, January,
Louvain La Neuve.
Bertoli, S., Fernández-Huertas Moraga, J., Ortega, F., (2009), “The Determinants of
International Migration Accounting for Self-Selection”, paper presented at
the Second Conference on Migration and Development, September,
Washington DC.
Borjas, G., (1987), “Self-selection and the earnings of immigrants”, American
Economic Review 77, 531-553.
Chiquiar, D., Hanson, G., (2005), “International migration, self-selection, and the
distribution of wages: evidence from Mexico and the United States”, Journal
of Political Economy 113 (2), 239-281.
Fernández-Huertas Moraga, J., Ferrer, A. Saiz, A., (2009), "Localización de los
inmigrantes y preferencias residenciales de la población autóctona: ¿Nuevos
guetos?", mimeo.
Grogger, J., Hanson, G., (2008), Income maximization and the selection and sorting
of international migrants, NBER Working Paper No. 13821, Cambridge, MA.
Hanson, G., McIntosh, C., (2009), “Birth Rates and Border Crossings: The
Demographic Push Behind Emigration in the Americas”, mimeo, University of
California, San Diego.
Hoefer, M., Rytina, N., Baker, B.C., (2008), “Estimates of the Unauthorized
Immigrant Population Residing in the United States: January 2007.” Office of
Immigration Statistics, Policy Directorate, United States Department of
Homeland Security.
INEC, various issues, Anuario de Migración Internacional, Quito: Instituto Nacional
de Estadistica y Censo.

22
Jokisch, B., Pribilsky, J., (2002), “The Panic to Leave: Economic Crisis and the ‘New
Emigration’ from Ecuador”, International Migration 40 (4), 76-101.
Laeven, L., Valencia, F.V., (2008), Systemic Banking Crisis: A New Database, IMF
Working Paper No. 08/224, Washington DC.
Larrea, C., (2004), Pobreza, Dolarización y Crisis en el Ecuador, Ediciones Abya-Yala,
Quito.
McKenzie, D., Rapoport, H., (forthcoming), “Self-selection patterns in Mexico-U.S.
migration: The role of migration networks”, Review of Economics and
Statistics.
Ortega, F., Peri, G., (2009), The Causes and Effects of International Migrations:
Evidence from OECD Countries 1980-2005, NBER Working Paper No. 14883,
Cambridge, MA.
Pribilsky, J., (2007), La Chulla Vida – Gender, Migration and the Family in Andean
Ecuador and New York City, Syracuse University Press.
Roy, A.D., (1951), “Some thoughts on the distribution of earnings”, Oxford Economic
Papers 3 (2), 135-146.
Ruggles, S., Sobek, M., Trent, A., Fitch, C.A., Goeken, R., Kelly Hall, P., King, M.,
Ronnander, C., (2008), Integrated Public Use Microdata Series: Version 4.0
[Machine-readable database], Minneapolis, Minnesota Population Center.
Sánchez, J., (2004), “Ensayo sobre la economía de la emigración en Ecuador”,
Ecuador Debate 63, 47-62, CAAP, Quito.
United States, Department of Homeland Security, various issues, Yearbook of
Immigration Statistics. Washington: US Department of Homeland Security,
Office of Immigration Statistics.
World Bank, 2008, World Development Indicators, Washington DC.

23
Annex – Figures and Tables
Figure 1. Arrivals of Ecuadorians to Spain and the United States, 1995-2006
0
20,000
40,000
60,000
80,000
100,000
120,000
1995 1996 1997 1998 1999 2000 2001 2002 2003 2004 2005 2006
United States
Spain
Sources: authors’ elaboration on ACS 2007 and ENI 2007.
Figure 2. Net migration flows to Spain and the United States, 1998-2006
-20,000
0
20,000
40,000
60,000
80,000
100,000
120,000
1995 1996 1997 1998 1999 2000 2001 2002 2003 2004 2005 2006
United States
Spain
Sources: authors’ elaboration on INEC, Anuario de Migración Internacional, various issues.

24
Figure 3. Monthly inflows of Ecuadorians into Spain, Jan. 1997-Dec. 2007.
0
2,000
4,000
6,000
8,000
10,000
12,000
14,000
Jan-9
7
Jul-97
Jan-9
8
Jul-98
Jan-9
9
Jul-99
Jan-0
0
Jul-00
Jan-0
1
Jul-01
Jan-0
2
Jul-02
Jan-0
3
Jul-03
Jan-0
4
Jul-04
Jan-0
5
Jul-05
Jan-0
6
Jul-06
Jan-0
7
Jul-07
Notes: the dashed blue lines identify the 1999-2005 reference period; the first red line identifies January 2000, when registration to the Local Population Registry gave immigrants access to the health care and education systems; the second red line identifies August 2003, when the visa waiver was removed. Sources: authors’ elaboration on Local Population Registry (Estadística de Variaciones Residenciales).
25
Table 1. Individual characteristics
Ecuadorians in Ecuador United States Spain mean std.dev. mean std.dev. mean std.dev. Share female 0.52 0.50 0.46 0.50 0.49 0.50 Males Age at migration 37.99 9.74 28.78 8.42 28.66 7.91 Years since migration 0.00 0.00 5.73 1.99 6.25 1.38 College graduates 0.14 0.35 0.14 0.35 0.08 0.27 Employment rate 0.95 0.22 0.90 0.30 0.90 0.30 Employment rate, college grad. 0.93 0.26 0.92 0.27 0.92 0.28 Employment rate, non coll. grad. 0.95 0.22 0.90 0.30 0.90 0.30 Labor income 3,880 5,599 26,896 20,344 15,979 4,214 Labor income, college grad. 9,060 10,229 43,219 35,581 16,308 5,743 Labor income, non college grad. 3,035 3,772 23,991 14,368 15,951 4,054 Females Age at migration 37.97 9.49 30.22 8.54 28.91 7.54 Years since migration 0.00 0.00 5.68 1.84 6.07 1.43
College graduates 0.13 0.34 0.22 0.41 0.15 0.36
Employment rate 0.60 0.49 0.63 0.48 0.81 0.39
Employment rate, college grad. 0.81 0.39 0.63 0.49 0.84 0.37
Employment rate, non coll. grad. 0.57 0.50 0.63 0.48 0.81 0.39 Labor income 2,214 2,790 18,189 12,718 10,767 3,317
Labor income, college grad. 5,757 5,841 21,314 10,492 10,891 3,081
Labor income, non college grad. 2,214 2,790 17,445 13,084 10,744 3,358
Observations 28,122 509 915
Notes: sample restricted to individuals born in 1949-1982; labor income is expressed in 2005 US dollars; age at migration for non-migrants refers to age at the time of the survey. Sources: authors’ elaboration on ENEMDU 2005, ACS 2007 and ENI 2007.

26
Table 2. Selection and sorting regressions, probit model
Dependent variable: college graduate
Country of destination Males born in 1949-1982
United States -0.014 0.044 0.045 -0.003
[0.102] [0.103] [0.103] [0.103]
Spain -0.365 -0.317 -0.326 -0.328
[0.100]*** [0.101]*** [0.101]*** [0.103]***
Birth cohorts No Yes No Yes
Year of birth dummy No No Yes No
Marital status No No No Yes
Observations 14,088 14,088 14,088 14,088
Dependent variable: college graduate
Country of destination Females born in 1949-1982
United States 0.333 0.328 0.335 0.318
[0.102]*** [0.103]*** [0.104]*** [0.103]***
Spain 0.088 0.063 0.062 0.061
[0.090] [0.091] [0.091] [0.091]
Birth cohorts No Yes No Yes
Year of birth dummy No No Yes No
Marital status No No No Yes
Observations 15,458 15,458 15,458 15,458
Dependent variable: college graduate
Country of destination Males born in 1949-1982
Spain -0.35 -0.383 -0.454 -0.404
[0.141]** [0.145]** [0.149]*** [0.143]***
Birth cohorts No Yes No Yes
Year of birth dummy No No Yes No
Marital status No No No Yes
Observations 688 688 688 688
Dependent variable: college graduate
Country of destination Females born in 1949-1982
Spain -0.245 -0.292 -0.292 -0.254
[0.134]* [0.140]** [0.140]** [0.140]*
Birth cohorts No Yes No Yes
Year of birth dummy No No Yes No
Marital status No No No Yes
Observations 736 736 736 736 Notes: standard errors in parenthesis; ***, ** and * denote significance at the 1, 5 and 10 percent level respectively. Sources: authors’ elaboration on ENEMDU 2005, ACS 2007 and ENI 2007.
27
Table 3. Mincerian regressions
Males born in 1949-1982
Country Ecuador United States Spain College graduate 1.003 0.463 -0.007
[0.032]*** [0.150]*** [0.064] Age 0.045 -0.020 0.005
[0.003]*** [0.049] [0.019] Age squared -0.001 0.000 -0.000
[0.000]*** [0.000] [0.000] Marital status 0.275 -0.009 -0.014
[0.020]*** [0.106] [0.033] R2 0.18 0.07 0.01 Observations 12,073 196 386
Females born in 1949-1982
Country Ecuador United States Spain College graduate 1.105 0.400 -0.008
[0.034]*** [0.149]*** [0.050] Age -0.003 -0.003 0.007
[0.014] [0.061] [0.028] Age squared 0.000 -0.000 0.000
[0.000] [0.000] [0.000] Marital status 0.093 -0.171 -0.096
[0.030]*** [0.147] [0.042] R2 0.18 0.05 0.04 Observations 7,106 139 371
Notes: standard errors in parenthesis; ***, ** and * denote significance at the 1, 5 and 10 percent level respectively. Sources: authors’ elaboration on ENEMDU 2005, ACS 2007 and ENI 2007.

28
Table 4. Predicted earnings by gender and educational group
Individuals born in 1949-1982 Country Ecuador United States Spain mean s.e. mean s.e. mean s.e. Males College graduates 6,149 1,236 32,150 5,067 15,536 1,044 Non college graduates 2,153 387 20,485 1,958 15,473 502 Females College graduates 4,234 162 19,542 2,851 10,472 572 Non college graduates 1,401 42 13,466 1,840 10,179 430
Notes: predictions from the Mincerian regressions in Table 3.
Sources: authors’ elaboration on ENEMDU 2005, ACS 2007 and ENI 2007.

29
Table 5. Deported Ecuadorian migrants to the United States and Spain
United States Spain
year Mexico(1) Coast
Guard(2) INS(3) Total Expulsions Devolutions Returns(4) Total
1999 n.a. 298 822 1,120 170 10 1,686 1,866
2000 n.a. 1,244 913 2,157 52 120 1,106 1,278
2001 1,055 1,020 960 3,035 70 91 1,021 1,182
2002 1,427 1,608 729 3,764 314 92 4,675 5,081
2003 808 703 722 2,233 614 178 4,950 5,742
2004 1,076 1,189 1,116 3,381 n.a. n.a. n.a. n.a.
2005 3,276 1,149 1,490 5,915 n.a. n.a. n.a. n.a.
Total 7,642 7,211 6,752 21,605 1,220 491 13,438 15,149
Notes: (1) refers to apprehensions and deportations by Mexican authorities; (2) corresponds to alien migrants interdiction by the US Coast Guard, fiscal year; (3) corresponds to aliens removed, fiscal year; (1) refers to individuals rejected at the borders (Pyrenees, ports and airports). Sources: authors’ elaboration on Instituto Nacional de Migracion, Mexico, US Coast Guard and US Department of Homeland Security, 2008 Yearbook of Immigration Statistics.