immobilization of enzymes to create heterogeneous- enzyme … · 2019-04-03 · 1 abstract...
TRANSCRIPT
Immobilization of Enzymes to Create Heterogeneous-Enzyme Hybrid Catalysts
by
Tyler Hurlburt
A dissertation submitted in partial satisfaction of therequirements for the degree of
Doctor of Philosophyin
Chemistryin the
Graduate Divisionof the
University of California, Berkeley
Committee in charge:Professor Gabor A. Somorjai, Chair
Professor Matthew B. FrancisProfessor Wenjun Zhang
Fall 2018
Immobilization of Enzymes to Create Heterogeneous-Enzyme Hybrid Catalysts
Copyright © 2018
by
Tyler Hurlburt
1
Abstract
Immobilization of Enzymes to Create Heterogeneous-Enzyme Hybrid Catalysts
ByTyler Hurlburt
Doctor of Philosophy in ChemistryUniversity of California, Berkeley
Professor Gabor A. Somorjai, Chair
Enzymes are highly selective and active biocatalysts that can catalyze reactions at much milder conditions than heterogeneous catalysts. However, in solution enzymes are not reusable, can not be used in a flow cell, and can be difficult to separate from the products. By immobilizing enzymes onto a solid support, it is possible to create a catalytic system that combines the activity and selectivity of enzymes with the reusability and ease of separation of heterogeneous catalysis. This immobilization process also allows for enzymes to be studied with surface-specific techniques.
One method to immobilize enzymes is through DNA directed immobilization (DDI). This method uses the selective binding of complementary DNA strands to immobilize enzymes in an ordered and selective manner. The activity of aldolase—an enzyme in the glycolysis pathway that catalyzes the C-C bond breaking step—was found to be significant after conjugation to DNA and subsequent immobilization onto functionalized glass surfaces. These immobilized enzyme surfaces were found to be reusable for multiple reaction cycles and regeneratable by dehybridizing the DNA strands.
These DNA and enzyme modified surfaces were studied by using sum frequency generation (SFG) vibrational spectroscopy. This showed that quartz modified with double-stranded DNA has an ordered structure, while single-stranded DNA surfaces are more disordered due to the lack of rigidity.
Alcohol dehydrogenase, which catalyzes the conversion of a primary or secondary alcohol into an aldehyde or ketone, can be immobilized onto the mesoporous silica material SBA-15 through non-specific physical adsorption. These immobilized enzymes are active upon adsorption but are prone to significant leaching. The specificity of immobilized alcohol dehydrogenase towards longer alcohols was found to be slightly diminished.
This dissertation builds on existing knowledge of enzyme immobilization methods and surface science characterization techniques. This research shows that immobilized enzymes are a promising method for creating novel catalytic systems. The results show the importance of limiting the leaching of enzymes off of the support for potential catalytic applications.
i
Table of Contents
Acknowledgments...............................................................................................................................................iv
Chapter 1: Surface Science Approach to the Molecular Level Integration of the Principles in Heterogeneous, Homogeneous, and Enzymatic Catalysis............................................................1 1.1. Unification of the Three Fields of Catalysis.................................................................................2 1.2. Characterization of Catalysts under Reaction Conditions....................................................3 1.3. Introduction to Enzymes...................................................................................................................6 1.4. Methods of Enzyme Immobilization.............................................................................................8 1.4. References...........................................................................................................................................10
Chapter 2: Site-selective Attachment of Enzymes to Glass Surfaces through DNA Directed Immobilization...................................................................................................................................14 2.1. Introduction.......................................................................................................................................15 2.2. Results and Discussion....................................................................................................................17 2.2.1. Modifying Glass Slides with Single Stranded DNA and Hybridizing to Complementary DNA...............................................................................................................17 2.2.2. Modifying Aldolase with A’ DNA and Evaluating its Activity...........................19 2.2.3. Evaluating the Activity of Surface Immobilized Aldolase................................25 2.2.4. Reusing the Protein Immobilized Surfaces............................................................27 2.2.5. Surface Characterization with Atomic Force Microscopy.................................29 2.2.6. Hybridization Temperature Modulates Immobilization Levels......................30 2.2.7. Regenerating and Recycling the Single Stranded DNA Modified Surfaces.........................................................................................................................................31 2.3. Conclusions........................................................................................................................................33 2.4. Materials and Methods...................................................................................................................33 2.4.1. General Procedures and Materials............................................................................33 2.4.2. Instrumentation and Sample Analysis.....................................................................34 2.4.3. Preparation of Aniline Functionalized Glass Slides.............................................35 2.4.4. Synthesis of Aminophenol-DNA................................................................................36 2.4.5. Patterning Single Stranded DNA on Aniline Functionalized Slides Using Potassium Ferricyanide Mediated Oxidative Coupling................................................36 2.4.6. Annealing of Complementary DNA Strands on Single Stranded DNA Modified Glass Slides.................................................................................................................37 2.4.7. Capping Free Cysteines on Aldolase with N-ethyl maleimide.......................37 2.4.8. Synthesis of DNA-Aldolase Bioconjugate...............................................................37 2.4.9. Synthesis of Fluorescent DNA-Aldolase Conjugate............................................38 2.4.10. Characterization of DNA-Aldolase Conjugate....................................................38 2.4.11. Activity Assay of Aldolase in Solution...................................................................38
ii
2.4.12. Immobilization of DNA-Aldolase onto Glass Surfaces and Analysis of Activity...........................................................................................................................................39 2.4.13. Reusing Surfaces with Immobilized Aldolase....................................................39 2.4.14. Regenerating Surfaces with Immobilized Aldolase.........................................39 2.4.15. Atomic Force Microscopy Studies...........................................................................40 2.4.16. Capping of Free Cysteines with 5,5’-dithio-bis-(2-nitrobenzoic Acid)......40 2.4.17. Modification of Aldolase with a Small Molecule o-aminophenol Reagent at the N-terminus for Mass Spectrometry Analysis.......................................................40 2.4.18. Trypsin Digestion of a Small Molecule Modified Aldolase for MS/MS Analysis..........................................................................................................................................41 2.5. References...........................................................................................................................................41
Chapter 3: Characterization of DNA Surfaces via Sum Frequency Generation Spectroscopy..........................................................................................................................................................45
3.1. Introduction.......................................................................................................................................46 3.2. Results and Discussion...................................................................................................................49 3.2.1. Evaluating DNA Attachment Using Fluorescence...............................................49 3.2.2. SFG Spectroscopy of Aniline Functionalized Quartz Surface.........................50 3.2.3. SFG Spectroscopy of DNA Surfaces in Air..............................................................51 3.2.4. SFG Spectroscopy in Air of Immobilized Enzymes.............................................53 3.3. Conclusions........................................................................................................................................54 3.4. Materials and Methods...................................................................................................................54 3.4.1. General Procedures and Materials............................................................................54 3.4.2. Instrumentation...............................................................................................................54 3.4.3. Preparation of Aniline Functionalized Quartz Discs...........................................55 3.4.4. Synthesis of Aminophenol-DNA................................................................................56 3.4.5. Patterning Single Stranded DNA on Aniline Functionalized Slides Using Potassium Ferricyanide Mediated Oxidative Coupling................................................56 3.4.6. Annealing of Complementary DNA Strands on Single Stranded DNA Modified Glass Slides.................................................................................................................57 3.4.7. Synthesis of DNA-Aldolase Bioconjugate...............................................................57 3.4.8. Immobilization of DNA-Aldolase onto Quartz Discs..........................................57 3.5. References...........................................................................................................................................58
Chapter 4: Immobilization of Enzymes onto Mesoporous Silica...................................................60
4.1. Introduction.......................................................................................................................................61 4.2. Results and Discussion...................................................................................................................62 4.2.1. Evaluating Incorporation of Phenylazide Silane into SBA-15.........................62 4.2.2. Measuring Activity of Non-specifically Adsorbed Alcohol Dehydrogenase...........................................................................................................................65 4.2.3. Effect of Incubation Temperature, Concentration, and Time on Activity...67
iii
4.2.4. Alcohol Specificity...........................................................................................................68 4.2.5. Leaching Tests...................................................................................................................69 4.3. Conclusions........................................................................................................................................69 4.4. Materials and Methods...................................................................................................................70 4.4.1. General Procedures and Materials............................................................................70 4.4.2. Instrumentation...............................................................................................................70 4.4.3. Preparation of SBA-15....................................................................................................70 4.4.4. Expression of Alcohol Dehydrogenase....................................................................72 4.4.5. Activity Assay of Alcohol Dehydrogenase in Solution......................................75 4.4.6. Immobilization of Alcohol Dehydrogenase onto SBA-15................................75 4.4.7. Activity Assay of Alcohol Dehydrogenase on SBA-15.......................................75 4.4.8. Screen of Activity for Various Alcohols....................................................................75 4.4.9. Determination of Leaching of Enzyme from SBA-15.........................................76 4.5. References...........................................................................................................................................76

iv
Acknowledgments
The research contained within this dissertation was supported by the Director, Office of Science, Office of Basic Energy Sciences, Chemical Sciences, Geosciences and Biosciences Division of the U.S. Department of Energy, under Contract no. DE-AC02-05CH11231
First, I must express my gratitude to my Ph.D. advisor, Professor Gabor A. Somorjai, for giving me the opportunity to study in his lab. It is a great honor to be the last Ph.D. student of such a distinguished scientist. The amount of science that Gabor has done and the number of truly great scientists that he has molded is certainly awe-inspiring. Beyond his scientific mentorship, I have greatly appreciated listening to him tell stories of his journey to becoming a professor or of great scientific breakthroughs coming from unlikely beginnings. I will always be grateful to his support and advice.
I also must thank Professor Matt Francis. This project started out as a collaboration with his lab and Matt quickly came to treat me as one of his own students. Giving me a desk in his lab, inviting me on group trips, and advising me just like any other Francis lab member. This work would not have been accomplished without his support
The Somorjai group as a whole has been an essential guiding light in my graduate studies. I have to thank Walter Ralston, Griffin Kennedy, Gérôme Melaet, Yonatan Horowitz, Wenchi Liu, Alex Buyanin, Christophe Deraedt, Nate Musselwhite, Lindsay Carl Keller, Rong “Rocky” Ye, Selim Alayoglu, Kwangjin An, Fudong Liu, Lynda Han, and Shanshan Yang. It was always a great time with them, even when we fail to win the softball championship.
I consider the Francis Lab to be my “adopted lab.” You have all taught me all of the biology and biochemistry that I came to learn over these last five years. Without you I would have been lost in a discipline I knew nothing about. I must specifically thank Ariel Furst, Sarah Klass, Matt Smith, and all the members of 733 that I have overlapped with: Ioana Aanei, Joel Finbloom, Kristin Wucherer, and Daniel Brauer. Your jokes, discussion, and good moods have kept me sane during rough stretches, plus you were always willing to help me execute a good (or typically bad) prank. Most importantly I must thank my collaborator and partner in crime, Kanwal Palla. You were perhaps the most important person during my time in grad school. Working so closely with another student could have been difficult but working with you was always so easy and so much fun.
Finally, I have to thank my family. My parents have always supported me and pushed me to be my best self. They made me everything that I am, and I can never thank them enough. To my brother, Nick, you have always been a wonderful role model for me. We could be competitive at times, but you have always been one of my best friends and I am so fortu-nate that you were only an hour away for most of my graduate career to make it easy to have family when needed. Lastly, I wish to thank my girlfriend, Sara. You have made my life so much better for the last year and a half. Your humor, intellect, caring, and love have kept me going more than you can know. I am so excited for our future and all the adventures we have in store.
1
Chapter 1
Surface Science Approach to the Molecular Level Integration of the Principles in Heterogeneous, Homogeneous, and Enzymatic Catalysis
Abstract
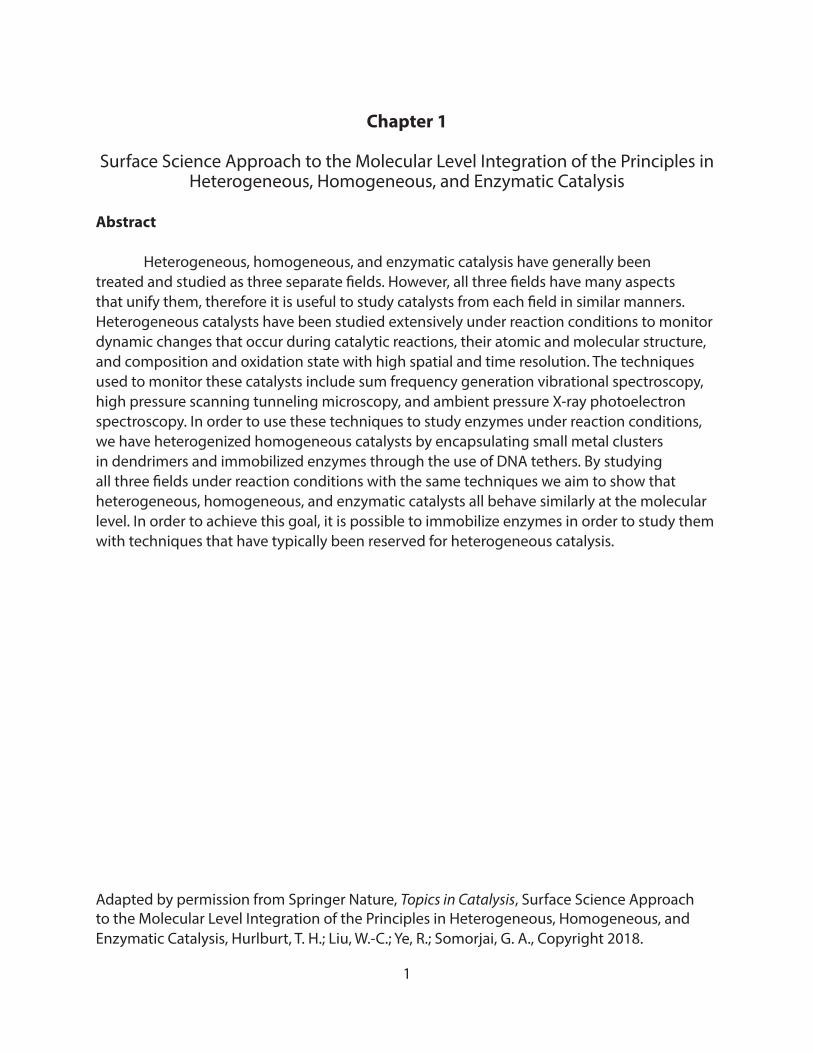
Heterogeneous, homogeneous, and enzymatic catalysis have generally been treated and studied as three separate fields. However, all three fields have many aspects that unify them, therefore it is useful to study catalysts from each field in similar manners. Heterogeneous catalysts have been studied extensively under reaction conditions to monitor dynamic changes that occur during catalytic reactions, their atomic and molecular structure, and composition and oxidation state with high spatial and time resolution. The techniques used to monitor these catalysts include sum frequency generation vibrational spectroscopy, high pressure scanning tunneling microscopy, and ambient pressure X-ray photoelectron spectroscopy. In order to use these techniques to study enzymes under reaction conditions, we have heterogenized homogeneous catalysts by encapsulating small metal clusters in dendrimers and immobilized enzymes through the use of DNA tethers. By studying all three fields under reaction conditions with the same techniques we aim to show that heterogeneous, homogeneous, and enzymatic catalysts all behave similarly at the molecular level. In order to achieve this goal, it is possible to immobilize enzymes in order to study them with techniques that have typically been reserved for heterogeneous catalysis.
Adapted by permission from Springer Nature, Topics in Catalysis, Surface Science Approach to the Molecular Level Integration of the Principles in Heterogeneous, Homogeneous, and Enzymatic Catalysis, Hurlburt, T. H.; Liu, W.-C.; Ye, R.; Somorjai, G. A., Copyright 2018.
2
1.1. Introduction
Catalysis has long been separated into three distinct fields—heterogeneous, homogeneous, and enzymatic—all studied independently. Heterogeneous catalysis operates with the catalyst in a different phase than the reactants and products (e.g. solid-liquid, solid-gas); homogeneous catalysis has both catalyst and reactants/products in the same phase (almost exclusively liquid); enzymatic catalysis uses the active site of proteins to carry out the catalysis needed for biological systems.
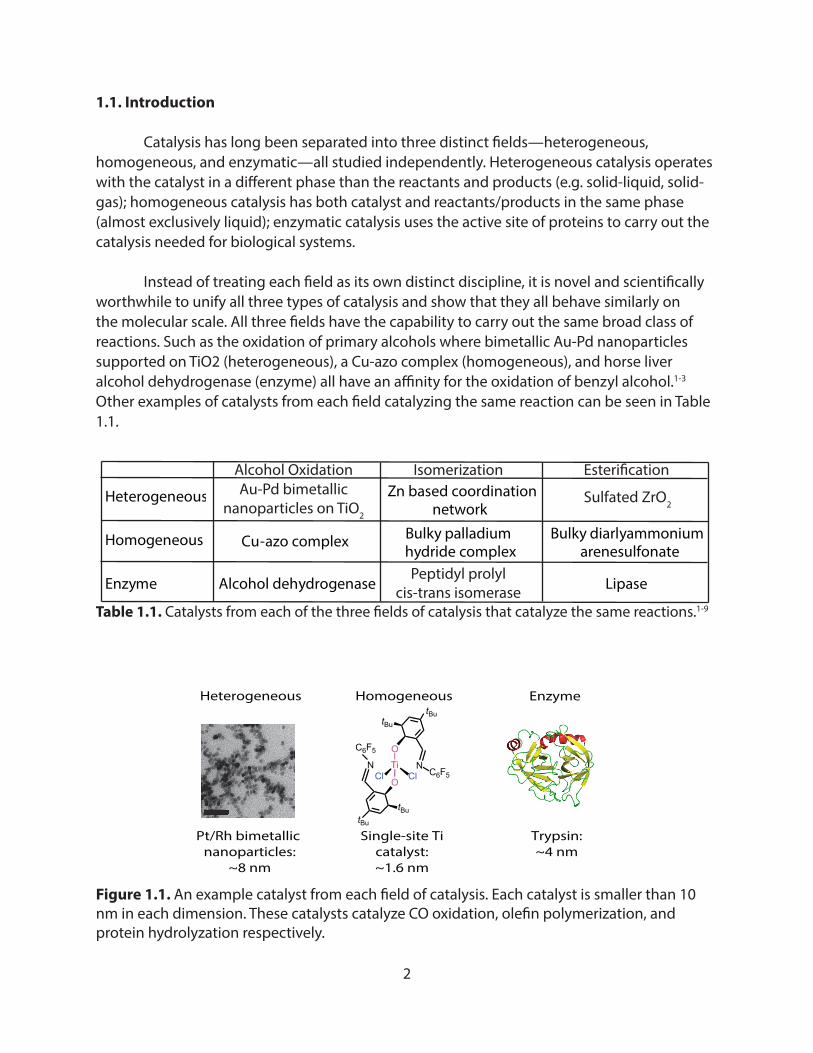
Instead of treating each field as its own distinct discipline, it is novel and scientifically worthwhile to unify all three types of catalysis and show that they all behave similarly on the molecular scale. All three fields have the capability to carry out the same broad class of reactions. Such as the oxidation of primary alcohols where bimetallic Au-Pd nanoparticles supported on TiO2 (heterogeneous), a Cu-azo complex (homogeneous), and horse liver alcohol dehydrogenase (enzyme) all have an affinity for the oxidation of benzyl alcohol.1-3 Other examples of catalysts from each field catalyzing the same reaction can be seen in Table 1.1.
Heterogeneous Zn based coordination network
Homogeneous Cu-azo complex Bulky palladium hydride complex
Bulky diarlyammonium arenesulfonate
Enzyme Alcohol dehydrogenase Lipase
Table 1.1. Catalysts from each of the three �elds of catalysis that catalyze the same reactions.1-9
Au-Pd bimetallic nanoparticles on TiO2
Sulfated ZrO2
Peptidyl prolyl cis-trans isomerase
Alcohol Oxidation Isomerization Esteri�cation
Heterogeneous Homogeneous Enzyme
TiO
O
NNC6F5
C6F5
tBu
tBu
tBu
tBu
ClCl
Pt/Rh bimetallic nanoparticles:
~8 nm
Trypsin:~4 nm
Single-site Ticatalyst:~1.6 nm
Figure 1.1. An example catalyst from each �eld of catalysis. Each catalyst is smaller than 10 nm in each dimension. These catalysts catalyze CO oxidation, ole�n polymerization, and protein hydrolyzation respectively.
3
In most cases, the active catalyst, whether heterogeneous, homogeneous, or enzyme, is under 10 nm in scale (Figure 1.1). As such, all of these catalysts could be considered nanoparticles. Besides the connection in their sizes, it has also been shown that the oxidation states of noble metal nanoparticles, including Pt and Rh, increase with decreasing sizes.10, 11 When the nanoparticles are sufficiently small, their oxidation states eventually approach that of the metal complexes, which are extensively used as catalysts in homogeneous catalysis.The heterogenization of homogeneous and enzyme catalysts are also actively sought after, as that provides the means to study all three fields of catalysis with the same techniques typically only used for heterogeneous catalysts.
1.2. Characterization of Nanoparticle Catalysts Under Reaction Conditions
To truly understand these nanoparticle catalysts, it is not enough to study the catalyst before and after the reaction, but to actually follow the catalyst while the reaction is ongoing. For example, it has been demonstrated repeatedly that the catalysts undergo structure reconstruction and changes in oxidation states upon contact with the reaction atmosphere,
532 nm
SF
1800 to4000 cm-1 Detector
Nd:YAGOPG/OPA1064nm ~20ps
ωvis ωSFG
ωIR |ν0
|ν1
|n
a) b)
SFG
Inte
nsity
(a.u
.)
Ethylene hydrogenation
ethylidyne
di-σ-bondedethylene
π-bondedethylene
CC
H H H
H-C=C -HH
H- -HH H
H
Frequency (cm-1)2850 305029502900 3000
c)
C=C
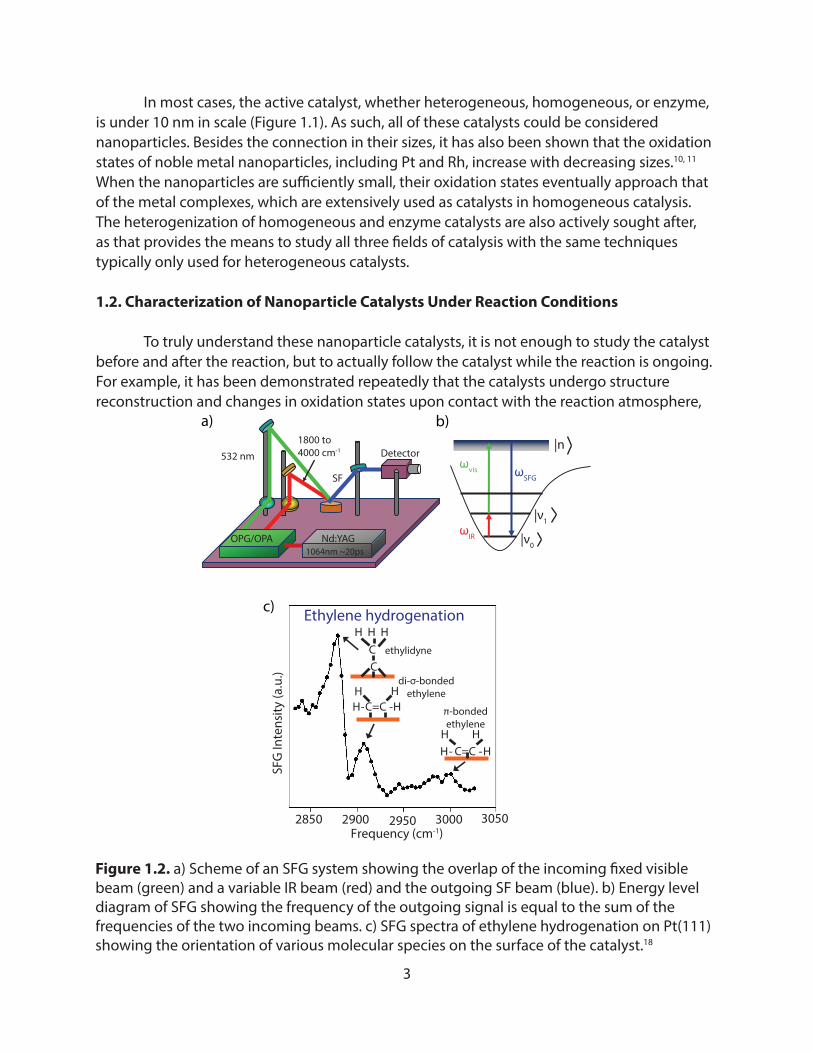
Figure 1.2. a) Scheme of an SFG system showing the overlap of the incoming �xed visible beam (green) and a variable IR beam (red) and the outgoing SF beam (blue). b) Energy level diagram of SFG showing the frequency of the outgoing signal is equal to the sum of the frequencies of the two incoming beams. c) SFG spectra of ethylene hydrogenation on Pt(111) showing the orientation of various molecular species on the surface of the catalyst.18
4
and that the active sites are often formed in-situ under reaction conditions.12-15 In addition, since the catalytic reactions often take place on the surface of the nanoparticle catalysts, characterization techniques equipped with superior surface sensitivities would be extremely powerful. Much of the work that has been done in studying catalysis under reaction conditions has focused on heterogeneous catalysis due to limitations of the spectroscopic and microscopic techniques used. These techniques include: sum frequency generation (SFG) vibrational spectroscopy, high pressure scanning tunneling microscopy (STM), ambient pressure X-ray photoelectron spectroscopy (AP-XPS), and nanodiode hot electron detection.
SFG is an inherently surface sensitive spectroscopic technique, making it a particularly good tool for studying adsorbed species under catalytic reaction conditions.16-19 SFG requires the spatial and temporal overlap of a fixed wavelength visible beam and a variable IR beam (Figure 1.2a). When the IR frequency matches a vibrational mode of the surface there is a resulting outgoing beam that has a frequency equal to the sum of the frequencies of the two
0
5
10
15
20
25
0 10 20 30Time (h)
Pres
sure
(mTo
rr)
BenzeneCyclohexane
Cyclohexene
0
5
10
15
20
25
Pres
sure
(mTo
rr)
0 2 4 6Time (h)
Cyclohexene
BenzeneCyclohexane
a) b)
c) d)
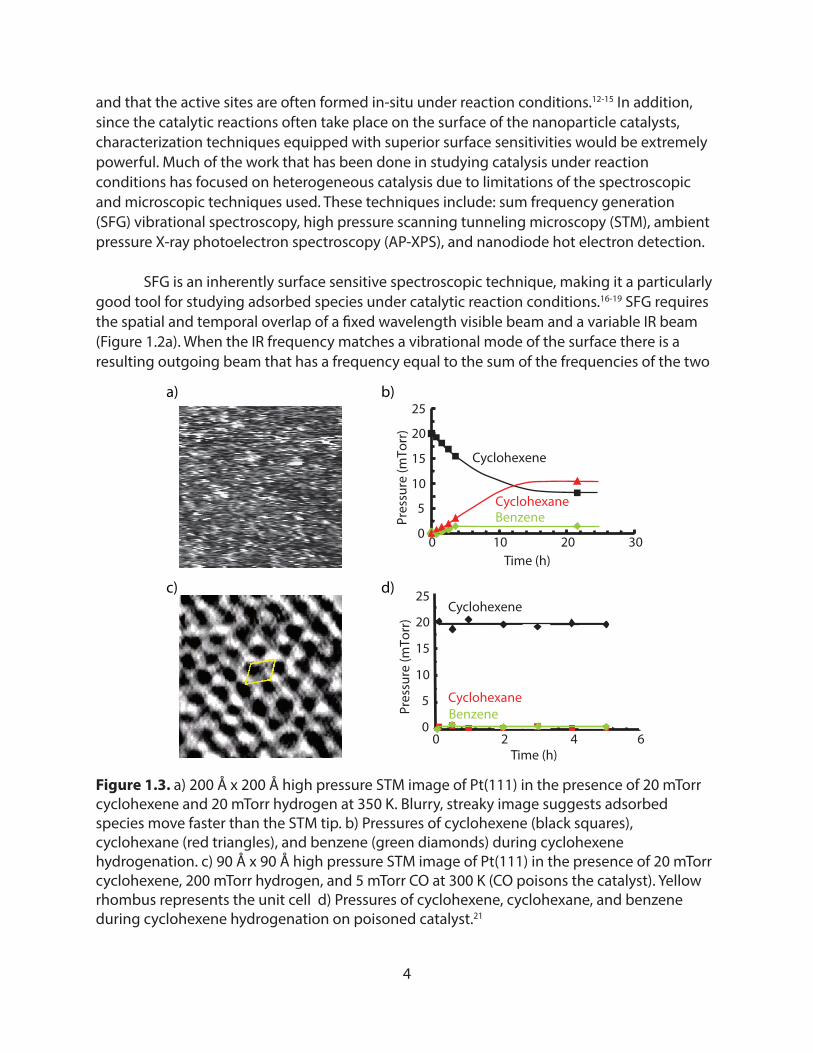
Figure 1.3. a) 200 Å x 200 Å high pressure STM image of Pt(111) in the presence of 20 mTorr cyclohexene and 20 mTorr hydrogen at 350 K. Blurry, streaky image suggests adsorbed species move faster than the STM tip. b) Pressures of cyclohexene (black squares), cyclohexane (red triangles), and benzene (green diamonds) during cyclohexene hydrogenation. c) 90 Å x 90 Å high pressure STM image of Pt(111) in the presence of 20 mTorr cyclohexene, 200 mTorr hydrogen, and 5 mTorr CO at 300 K (CO poisons the catalyst). Yellow rhombus represents the unit cell d) Pressures of cyclohexene, cyclohexane, and benzene during cyclohexene hydrogenation on poisoned catalyst.21

5
incoming beams (Figure 1.2b). During ethylene hydrogenation reactions on Pt(111) we have observed several molecular species on the surface of the catalysts.18 These include ethylidyne bound perpendicularly to the surface and ethylene bound parallel to the surface via either π-bonded or di-σ-bonded (Figure 1.2c). Knowing the orientation and bonding of these molecules makes it possible to determine, under reaction conditions, the molecular details of the mechanisms of these reactions.
Using high pressure STM it is seen that the species adsorbed on a solid catalyst are mobile, not just stuck in one active site.20-22 Studies of cyclohexene hydrogenation on Pt(111) show streaky, diffuse STM images while the reaction is ongoing (Figure 1.3a, b). However, upon the addition of carbon monoxide (which poisons any catalytic turnover) clear, ordered structures are seen (Figure 1.3c, d). This suggests that when the catalyst is active and the reaction is ongoing the adsorbed species move faster than the tip of the STM (100 Å/ms).22
Ambient pressure XPS can be used to determine the surface composition and oxidation states of bimetallic nanoparticles under reaction relevant conditions rather than the ultra-high vacuum conditions typically needed for XPS (Figure 1.4a). In the presence of an oxidizing gas (nitric oxide) 15 nm rhodium-palladium nanoparticles preferentially segregate rhodium to the surface, with ~94% of the Rh being in the oxide form. Upon the addition of a reducing gas (carbon monoxide) to mimic the reaction conditions, the surface composition becomes much more equal and about 76% of the remaining surface Rh are reduced to its metallic state. This trend continues through cycles of oxidizing and reducing conditions (Figure 1.4b).23
Di�erentialpumping stages
10-9 p0
Lenses
Rh
Pd
0.3
0.5
0.90.8
0.7
0.6
0.4
0.2
0.1
0
1.0
Ato
mic
Fra
ctio
n
NO NO+CO NO+CONO NOb)
Samplecell
p0 < 5 torr
hν
e-
Gas
a)
Figure 1.4. a) Scheme of ambient pressure XPS setup. b) Surface atomic fraction of Rh and Pd in bimetallic nanoparticles under oxidizing (NO) and reducing/catalytic (NO+CO) conditions.23
6
1.3. Introduction to Enzymes
Enzymes are biological catalysts, typically proteins, but occasionally RNA. Because enzymes function under biological conditions, they can catalyze reactions under significantly more mild conditions than conventional heterogeneous and homogeneous catalysts. Enzymes generally function in aqueous solution, at temperatures ranging from 25-100 °C, and at nearly neutral pH’s. Elevated temperatures and extreme pH conditions can lead to unfolding (or denaturing) of the enzyme structure, causing inactivation of the catalytic active site.24 Industrial uses of enzymes necessitates increased stability, particularly in the longterm thermal stability.
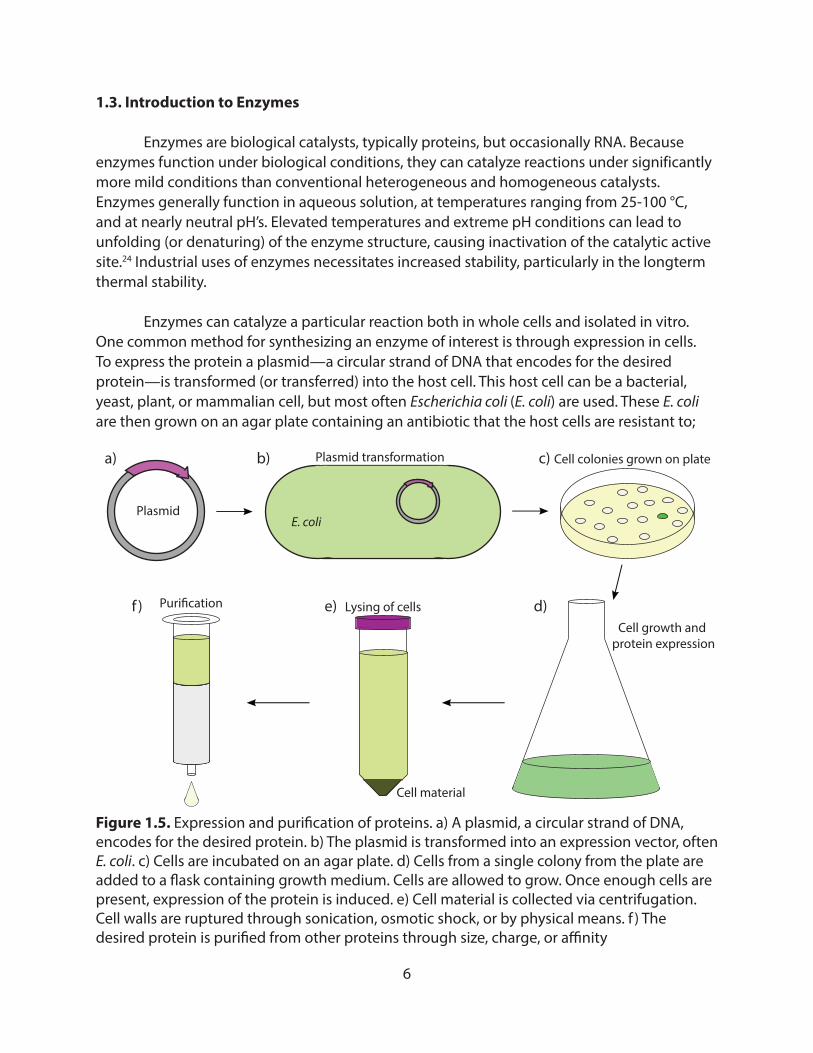
Enzymes can catalyze a particular reaction both in whole cells and isolated in vitro. One common method for synthesizing an enzyme of interest is through expression in cells. To express the protein a plasmid—a circular strand of DNA that encodes for the desired protein—is transformed (or transferred) into the host cell. This host cell can be a bacterial, yeast, plant, or mammalian cell, but most often Escherichia coli (E. coli) are used. These E. coli are then grown on an agar plate containing an antibiotic that the host cells are resistant to;
Plasmid
Figure 1.5. Expression and puri�cation of proteins. a) A plasmid, a circular strand of DNA, encodes for the desired protein. b) The plasmid is transformed into an expression vector, often E. coli. c) Cells are incubated on an agar plate. d) Cells from a single colony from the plate are added to a �ask containing growth medium. Cells are allowed to grow. Once enough cells are present, expression of the protein is induced. e) Cell material is collected via centrifugation. Cell walls are ruptured through sonication, osmotic shock, or by physical means. f ) The desired protein is puri�ed from other proteins through size, charge, or a�nity chromatography.
E. coli
a) b) c)
f ) e) d)
Cell material
Plasmid transformation
Cell growth and protein expression
Puri�cation
Cell colonies grown on plate
Lysing of cells
7
this allows for the selected growth of the cells containing the desired plasmid. Cells from one isolated colony on the agar plate are selected and added to a flask containing a growth medium. The cells are allowed to exponentially grow in these incubation flasks. Once a desired concentration of cells has been reached, a reagent—commonly Isopropyl β-D-1-thiogalactopyranoside (IPTG)— is added to induce the cells into producing large amounts of the chosen protein. The solution containing the cells is then centrifuged, and the solid cell material (pellet) is isolated. The cells are then lysed, or broken apart, by sonication, osmotic shock, or physical means enabling the release of the expressed protein. This solution containing the freed protein and cell debris is centrifuged again, causing the ruptured cell material to precipitate, and the supernatant containing the desired (and other ancillary) proteins is collected. This liquid is then added to a column that will separate the desired protein from others based on size, charge, or affinity. The purity of the collected protein fractions can be determined by gel electrophoresis. The complete process is diagrammed in Figure 1.5.
The kinetics of enzymes can be simplified in to two steps: 1) the binding of the reactant (or substrate) to the enzyme; and 2) the reaction to create the products. At relatively low substrate concentrations, the reaction rate is linearly correlated to the substrate concentration. There are sufficient enzymes relative to substrates such that the enzymes are largely free, allowing them to catalyze the reaction. An increase in the substrate concentration leads to a increase in the reaction rate. As the substrate concentration continues to increase, more enzymes are bound to a substrate. At a sufficiently high concentration, the enzymes are saturated with substrate such that all of the active sites are occupied. In this case, the reaction rate is limited by the turnover rate of the enzyme; at this concentration increasing the amount of substrate does not result in an increase in the reaction rate. Two important kinetic factors of enzymes are this turnover rate, called kcat, and the substrate concentration where the reaction rate is at half of its maximum, KM. A higher kcat is the result of an enzyme that can catalyze a reaction faster and a lower KM is the result of a higher affinity of an enzyme for its substrate. The overall catalytic efficiency of an enzyme can be measured by kcat/ KM. For select enzymes, this value can reach the theoretical maximum of 108-1010 M-1s-1 which is the limit of diffusion of substrate into the active site.
8
1.4. Methods of Enzyme Immobilization
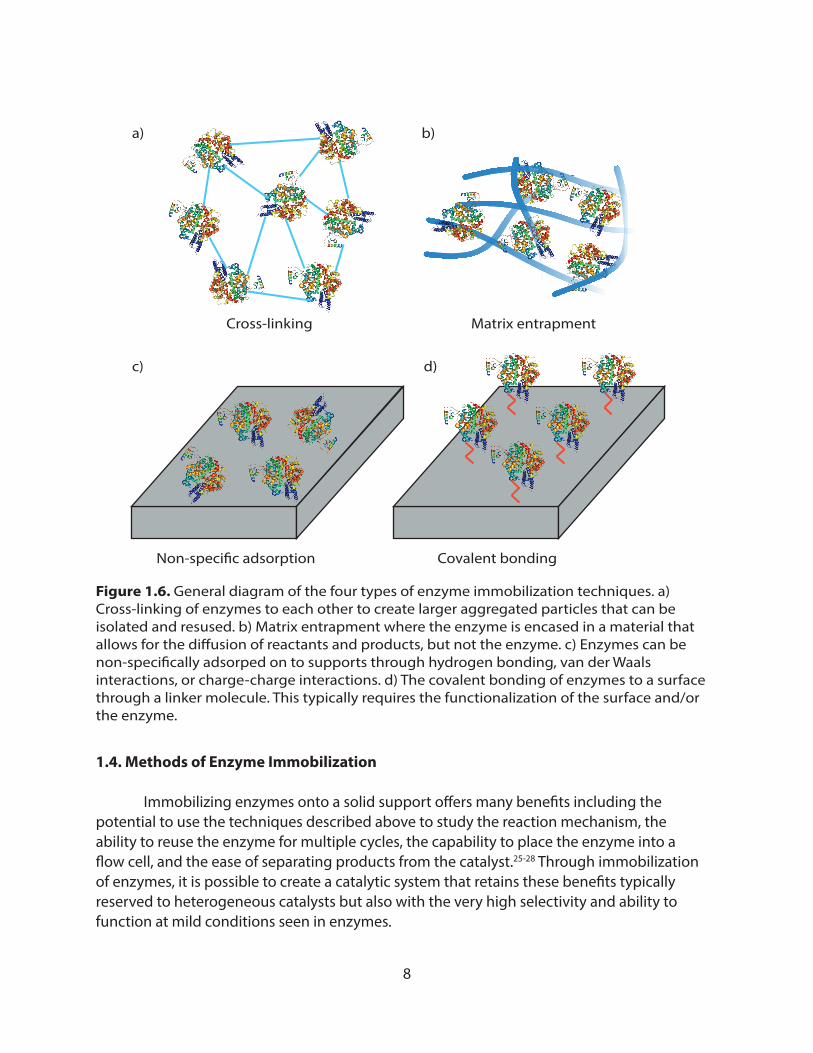
Immobilizing enzymes onto a solid support offers many benefits including the potential to use the techniques described above to study the reaction mechanism, the ability to reuse the enzyme for multiple cycles, the capability to place the enzyme into a flow cell, and the ease of separating products from the catalyst.25-28 Through immobilization of enzymes, it is possible to create a catalytic system that retains these benefits typically reserved to heterogeneous catalysts but also with the very high selectivity and ability to function at mild conditions seen in enzymes.
Cross-linking Matrix entrapment
Non-speci�c adsorption Covalent bonding
Figure 1.6. General diagram of the four types of enzyme immobilization techniques. a) Cross-linking of enzymes to each other to create larger aggregated particles that can be isolated and resused. b) Matrix entrapment where the enzyme is encased in a material that allows for the di�usion of reactants and products, but not the enzyme. c) Enzymes can be non-speci�cally adsorped on to supports through hydrogen bonding, van der Waals interactions, or charge-charge interactions. d) The covalent bonding of enzymes to a surface through a linker molecule. This typically requires the functionalization of the surface and/or the enzyme.
a) b)
c) d)
9
Techniques for immobilizing enzymes can be broken down into four broad groups: cross-linking, matrix entrapment, non-specific adsorption, and covalent bonding (Figure 1.6). It has been shown that through the creation of cross-linked enzyme crystals (CLCs) of thermolysin, an enzyme used in the manufacturing of aspartame, it is possible to make an enzyme catalyst that is much more stable in organic solvents and for longer times.29
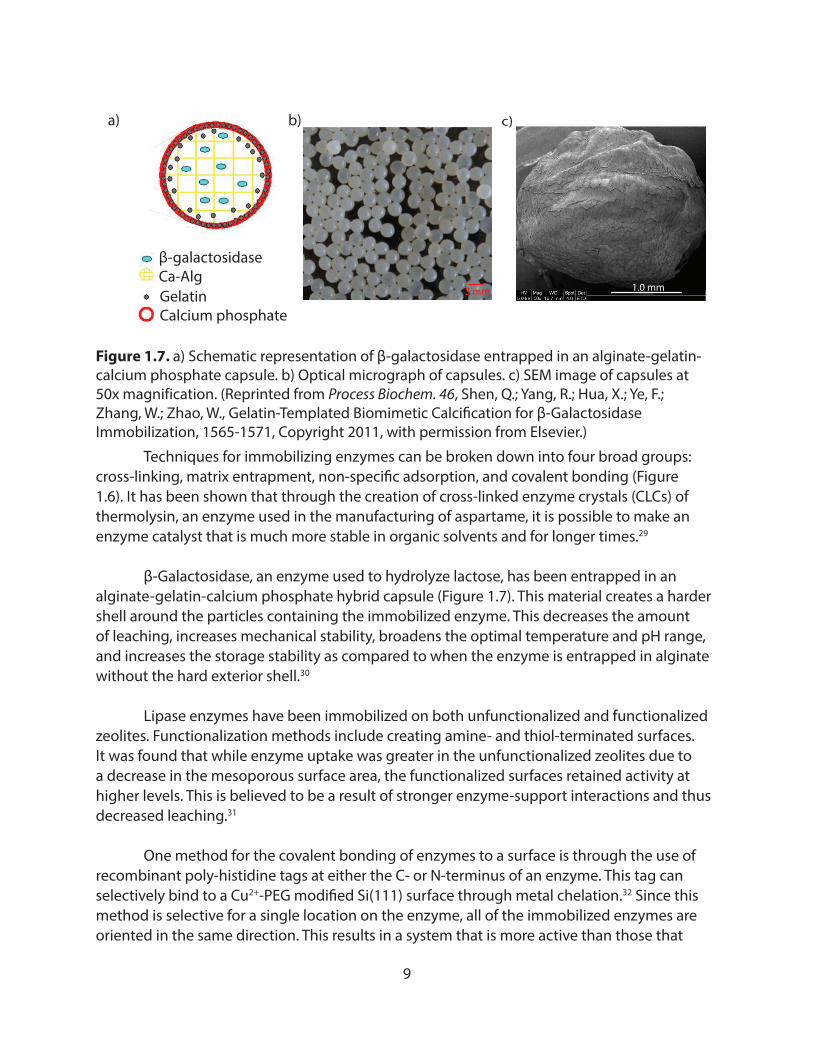
β-Galactosidase, an enzyme used to hydrolyze lactose, has been entrapped in an alginate-gelatin-calcium phosphate hybrid capsule (Figure 1.7). This material creates a harder shell around the particles containing the immobilized enzyme. This decreases the amount of leaching, increases mechanical stability, broadens the optimal temperature and pH range, and increases the storage stability as compared to when the enzyme is entrapped in alginate without the hard exterior shell.30
Lipase enzymes have been immobilized on both unfunctionalized and functionalized zeolites. Functionalization methods include creating amine- and thiol-terminated surfaces. It was found that while enzyme uptake was greater in the unfunctionalized zeolites due to a decrease in the mesoporous surface area, the functionalized surfaces retained activity at higher levels. This is believed to be a result of stronger enzyme-support interactions and thus decreased leaching.31
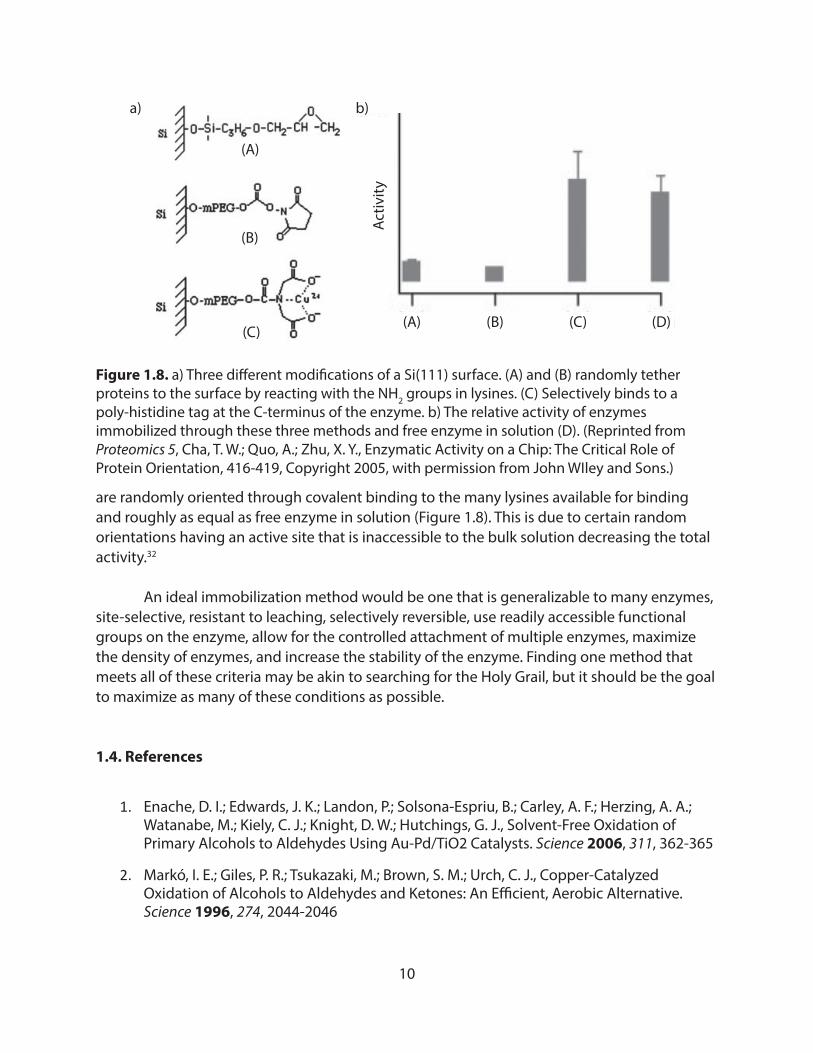
One method for the covalent bonding of enzymes to a surface is through the use of recombinant poly-histidine tags at either the C- or N-terminus of an enzyme. This tag can selectively bind to a Cu2+-PEG modified Si(111) surface through metal chelation.32 Since this method is selective for a single location on the enzyme, all of the immobilized enzymes are oriented in the same direction. This results in a system that is more active than those that
a)
Ca-Algβ-galactosidase
Calcium phosphateGelatin
b) c)
Figure 1.7. a) Schematic representation of β-galactosidase entrapped in an alginate-gelatin- calcium phosphate capsule. b) Optical micrograph of capsules. c) SEM image of capsules at 50x magnification. (Reprinted from Process Biochem. 46, Shen, Q.; Yang, R.; Hua, X.; Ye, F.; Zhang, W.; Zhao, W., Gelatin-Templated Biomimetic Calci�cation for β-Galactosidase Immobilization, 1565-1571, Copyright 2011, with permission from Elsevier.)
1.0 mm3 mm
10
are randomly oriented through covalent binding to the many lysines available for binding and roughly as equal as free enzyme in solution (Figure 1.8). This is due to certain random orientations having an active site that is inaccessible to the bulk solution decreasing the total activity.32
An ideal immobilization method would be one that is generalizable to many enzymes, site-selective, resistant to leaching, selectively reversible, use readily accessible functional groups on the enzyme, allow for the controlled attachment of multiple enzymes, maximize the density of enzymes, and increase the stability of the enzyme. Finding one method that meets all of these criteria may be akin to searching for the Holy Grail, but it should be the goal to maximize as many of these conditions as possible.
1.4. References
1. Enache, D. I.; Edwards, J. K.; Landon, P.; Solsona-Espriu, B.; Carley, A. F.; Herzing, A. A.; Watanabe, M.; Kiely, C. J.; Knight, D. W.; Hutchings, G. J., Solvent-Free Oxidation of Primary Alcohols to Aldehydes Using Au-Pd/TiO2 Catalysts. Science 2006, 311, 362-365
2. Markó, I. E.; Giles, P. R.; Tsukazaki, M.; Brown, S. M.; Urch, C. J., Copper-Catalyzed Oxidation of Alcohols to Aldehydes and Ketones: An Efficient, Aerobic Alternative. Science 1996, 274, 2044-2046
a) b)
Activ
ity
(A) (B) (C) (D)
(A)
(B)
(C)
Figure 1.8. a) Three di�erent modi�cations of a Si(111) surface. (A) and (B) randomly tether proteins to the surface by reacting with the NH2 groups in lysines. (C) Selectively binds to a poly-histidine tag at the C-terminus of the enzyme. b) The relative activity of enzymes immobilized through these three methods and free enzyme in solution (D). (Reprinted from Proteomics 5, Cha, T. W.; Quo, A.; Zhu, X. Y., Enzymatic Activity on a Chip: The Critical Role of Protein Orientation, 416-419, Copyright 2005, with permission from John WIley and Sons.)
11
3. Shearer, G. L.; Kim, K.; Lee, K. M.; Wang, C. K.; Plapp, B. V., Alternative Pathways and Reactions of Benzyl Alcohol and Benzaldehyde with Horse Liver Alcohol Dehydrogenase. Biochemistry 1993, 32, 11186-11194
4. Ohara, K.; Kawano, M.; Inokuma, Y.; Fujita, M. A, Porous Coordination Network Catalyzes an Olefin Isomerization Reaction in the Pore. J. Am. Chem. Soc. 2010, 132, 30-31
5. Gauthier, D.; Lindhardt, A. T.; Olsen, E. P. K.; Overgaard, J.; Skrydstrup, T., In Situ Generated Bulky Palladium Hydride Complexes as Catalysts for the Efficient Isomerization of Olefins. Selective Transformation of Terminal Alkenes to 2-Alkenes. J. Am. Chem. Soc. 2010, 132, 7998-8009
6. Kofron, J. L.; Kuzmic, P.; Kishore, V.; Colon-Bonilla, E.; Rich, D. H., Determination of Kinetic Constants for Peptidyl Prolyl Cis Trans Isomerases by an Improved Spectrophotometric Assay. Biochemistry 1991, 30, 6127-6134
7. Sejidov, F. T.; Mansoori, Y.; Goodarzi, N., Esterification Reaction Using Solid Heterogeneous Acid Catalysts under Solvent-Less Condition. J. Mol. Catal. A Chem. 2005, 240, 186-190
8. Ishihara, K.; Nakagawa, S.; Sakakura, A., Bulky Diarylammonium Arenesulfonates as Selective Esterification Catalysts. J. Am. Chem. Soc. 2005, 127, 4168-4169
9. Björkling, F.; Godtfredsen, S. E.; Kirk, O. A., Highly Selective Enzyme-Catalysed Esterification of Simple Glucosides. J. Chem. Soc. Chem. Commun. 1989, 14, 934-935
10. Li, Y.; Liu, J. H.-C.; Witham, C. A.; Huang, W.; Marcus, M. A.; Fakra, S. C.; Alayoglu, P.; Zhu, Z.; Thompson, C. M.; Arjun, A.; Lee, K.; Gross, E.; Toste, F. D.; Somorjai, G. A., A Pt-Cluster-Based Heterogeneous Catalyst for Homogeneous Catalytic Reactions: X-Ray Absorption Spectroscopy and Reaction Kinetic Studies of Their Activity and Stability against Leaching. J. Am. Chem. Soc. 2011, 133, 13527-13533
11. Grass, M. E.; Zhang, Y.; Butcher, D. R.; Park, J. Y.; Li, Y.; Bluhm, H.; Bratlie, K. M.; Zhang, T.; Somorjai, G. A., A Reactive Oxide Overlayer on Rhodium Nanoparticles during CO Oxidation and Its Size Dependence Studied by in Situ Ambient-Pressure X-Ray Photoelectron Spectroscopy. Angew. Chemie - Int. Ed. 2008, 47, 8893-8896
12. Tao, F.; Grass, M. E.; Zhang, Y.; Butcher, D. R.; Aksoy, F.; Aloni, S.; Altoe, V.; Alayoglu, S.; Renzas, J. R.; Tsung, C. K.; Zhu, Z.; Liu, Z.; Salmeron, M.; Somorjai, G. A., Evolution of Structure and Chemistry of Bimetallic Nanoparticle Catalysts under Reaction Conditions. J Am Chem Soc 2010, 132, 8697-8703
13. Schott, V.; Oberhofer, H.; Birkner, A.; Xu, M.; Wang, Y.; Muhler, M.; Reuter, K.; Wöll, C., Corrigendum to: Chemical Activity of Thin Oxide Layers: Strong Interactions with the Support Yield a New Thin-Film Phase of ZnO Angew. Chemie - Int. Ed. 2017, 52, 11925-11929
12
14. Gross, E.; Shu, X. Z.; Alayoglu, S.; Bechtel, H. A.; Martin, M. C.; Toste, F. D.; Somorjai, G. A., In Situ IR and X-Ray High Spatial-Resolution Microspectroscopy Measurements of Multistep Organic Transformation in Flow Microreactor Catalyzed by Au Nanoclusters. J. Am. Chem. Soc. 2014, 136, 3624-3629
15. Tsakoumis, N. E.; Walmsley, J. C.; Rønning, M.; Van Beek, W.; Rytter, E.; Holmen, A., Evaluation of Reoxidation Thresholds for γ-Al2O3Supported Cobalt Catalysts under Fischer-Tropsch Synthesis Conditions. J. Am. Chem. Soc. 2017, 139, 3706-3715
16. Shen, Y. R., Surface Properties Probed by Second-Harmonic and Sum-Frequency Generation. Nature. 1989, 337, 519-525
17. Somorjai, G. A.; Frei, H.; Park, J. Y., Advancing the Frontiers in Nanocatalysis, Biointerfaces, and Renewable Energy Conversion by Innovations of Surface Techniques. J. Am. Chem. Soc. 2009, 131, 16589-16605
18. McCrea, K. R.; Somorjai, G. A., SFG-Surface Vibrational Spectroscopy Studies of Structure sensitivity and Insensitivity in Catalytic Reactions: Cyclohexene dehydrogenation and Ethylene Hydrogenation on Pt(111) and Pt(100) Crystal Surfaces. J. Mol. Catal. Chem. 2000, 163, 43-53
19. Holinga, G. J.; York, R. L.; Onorato, R. M.; Thompson, C. M.; Webb, N. E.; Yoon, A. P.; Somorjai, G. A., An SFG Study of Interfacial Amino Acids at the Hydrophilic SiO2 and Hydrophobic Deuterated Polystyrene Surfaces. J. Am. Chem. Soc. 2011, 133, 6243-6253
20. Tao, F.; Dag, S.; Wang, L. W.; Liu, Z.; Butcher, D. R.; Bluhm, H.; Salmeron, M.; Somorjai, G. A., Break-up of Stepped Platinum Catalyst Surfaces by High Co Coverage. Science 2010, 327, 850-853
21. Zhu, Z.; Melaet, G.; Axnanda, S.; Alayoglu, S.; Liu, Z.; Salmeron, M.; Somorjai, G. A., Structure and Chemical State of the Pt(557) Surface during Hydrogen Oxidation Reaction Studied by in Situ Scanning Tunneling Microscopy and X-Ray Photoelectron Spectroscopy. J. Am. Chem. Soc. 2013, 135, 12560-12563
22. Montano, M.; Salmeron, M.; Somorjai, G. A., STM Studies of Cyclohexene Hydrogenation/Dehydrogenation and Its Poisoning by Carbon Monoxide on Pt(111). Surf. Sci. 2006, 600, 1809-1816
23. Tao, F.; Grass, M. E.; Zhang, Y.; Butcher, D. R.; Renzas, J. R.; Liu, Z.; Chung, J. Y.; Mun, B. S.; Salmeron, M.; Somorjai, G. A., Reaction-Driven Restructuring of Rh-Pd and Pt-Pd Core-Shell Nanoparticles. Science 2008, 322, 932-934
24. Iyer, P. V.; Ananthanarayan, L., Enzyme Stability and Stabilization—Aqueous and Non-aqueous Environment. Proc. Biochem. 2008, 43, 1019-1032
25. D’Souza, S. F., Immobilized Enzymes in Bioprocess. Current Science 1999, 77, 69-79
26. Polizzi, K. M.; Bommarius, A. S.; Broering, J. M.; Chaparro-Riggers, J. F., Stability of Biocatalysts. Curr. Opin. Chem. Bio. 2007, 11, 220-225
13
27. Xie, H.; Wang, Z.; Kong, W.; Wang, L.; Fu, Z., A Novel Enzyme-Immobilized Flow Cell Used as End-Column Chemiluminescent Detection Interface in Open-Tubular Capillary Electrochromatography. Analyst, 2013, 138, 1107-1113
28. Katchalski-Katzir, E.; Kraemer, D. M., Eupergit C, a Carrier for Immobilization of Enzymes of Industrial Potential. J. Mol. Catal B: Enzym. 2000, 10, 157-176
29. Cao, L.; van Rantwijk, F.; Sheldon, R. A., Cross-Linked Enzyme Aggregates: A Simple and Effective Method for the Immobilization of Penicillin Acylase. Org. Lett. 2000, 2, 1361-1364
30. Shen, Q.; Yang, R.; Hua, X.; Ye, F.; Zhang, W.; Zhao, W., Gelatin-Templated Biomimetic Calcification for β-Galactosidase Immobilization. Process Biochem. 2011, 46, 1565-1571
31. Mitchell, S.; Pérez-Ramírez, J., Mesoporous Zeolites as Enzyme Carriers: Synthesis, Characterization, and Application in Biocatalysis. Catal. Today 2011, 168, 28-37
32. Cha, T. W.; Quo, A.; Zhu, X. Y., Enzymatic Activity on a Chip: The Critical Role of Protein Orientation. Proteomics 2005, 5, 416-419
14
Chapter 2
Site-Selective Oxidative Coupling Reactions for the Attachment of Enzymes to Glass Surfaces through DNA Directed Immobilization
Abstract
Enzymes are able to maintain remarkably high selectivity towards their substrates while still retaining high catalytic rates. By immobilizing enzymes onto surfaces we can heterogenize these biological catalysts, making it practical to study, use, and combine them in an easily controlled system. In this work, we develop a platform that allows for the simple and oriented immobilization of proteins through DNA directed immobilization (DDI). First, we modified a glass surface with single stranded DNA. We then site-selectively attached the complementary DNA strand to the N-terminus of a protein. Both DNA modifications were carried out using an oxidative coupling strategy, and the DNA strands served as easily tunable and reversible chemical handles to hybridize the protein-DNA conjugates onto the surface. We have used the aldolase enzyme as a model protein to conduct our studies. We characterized each step of the protein immobilization process using fluorescent reporters as well as atomic force microscopy. We also conducted activity assays on the surfaces with DNA linked aldolase to validate that, despite being modified with DNA and undergoing subsequent immobilization, the enzyme was still able to retain its catalytic activity and the surfaces were reusable in subsequent cycles.
Adapted with permission from Palla, K. S.; Hurlburt, T. H.; Buyanin, A. M.; Somorjai, G. A.; Francis, M. B., J. Am. Chem. Soc. 2017, 139, 1967-1974. Copyright 2017 American Chemical Society
15
2.1. Introduction
Traditionally, catalysis research has been undertaken as the three separate disciplines involving homogeneous complexes, heterogeneous structures, and enzymes. As such, the tools to determine mechanistic information have largely evolved separately. In previous work, we have successfully converted homogeneous catalysts into heterogeneous systems, merging high reaction selectivity with the advantages of catalyst recovery,1 ability to be employed in continuous flow processes,2 and compatibility with surface-sensitive characterization techniques.3 To integrate enzymes into heterogeneous systems, there is a need for new immobilization strategies that are site-selective, general, and inherently capable of combining multiple species into complex arrays. With the overall goal of studying the dynamics of enzyme behavior using sum frequency generation vibrational spectroscopy and other techniques suited for heterogeneous systems,4 we have developed an efficient surface attachment strategy based on DNA hybridization. An interesting feature of this approach is the use of two different reaction modes of a family of oxidative coupling methods, allowing a unified strategy for modifying both the surface and the protein components with pendant nucleic acid groups.
The utility of immobilizing proteins onto a surface spans a variety of applications, including the study of protein-protein interactions, enzyme kinetic studies, biosensors, bioanalytics, and even industrial biocatalytic processes.5-7 These studies create a constant need for effective and facile ways to assemble protein microarrays. Many protein immobilization chemistries involve the direct attachment of proteins to surfaces through short linkers and reactive handles. Common approaches include nonspecific covalent modification of native amino acid side chains on the surface of a protein, such as lysine acylation with NHS esters. However, it has been found that randomly oriented proteins can exhibit reduced accessibility of active sites and display lower activities than their ordered counterparts.7-9
Because an ordered display of proteins is often more favored, both covalent and non-covalent strategies to orient proteins uniformly on surfaces have been developed. Covalent approaches have taken advantage of maleimide reactivity with thiols,9 native chemical ligation,10 photochemical thiol-ene chemistry,1 carbohydrate moieties,12 Si-tags,13 and enzymatic tags,14,15 to name a few. Representative non-covalent systems are exemplified by polyhistidine tag incorporation via genetic engineering to bind to Ni-NTA functionalized surfaces, as well as biotin-streptavidin complexation.16-18 Another non-covalent protein immobilization approach is through the use of DNA, taking advantage of complementary strand hybridization. This type of DNA directed immobilization (DDI) requires that the surface be functionalized with a short oligonucleotide and that its complementary strand be conjugated to the target protein such that the hybridization of the two strands will lead to the controlled immobilization of the proteins under chemically mild and biocompatible conditions. DDI has shown reliability and has been used in tandem with a variety of other assembly processes. It has also been reported that the DDI strategy is an efficient method to immobilize proteins because of the easily adjustable linker it provides, thereby helping to prevent protein denaturation.19-21
16
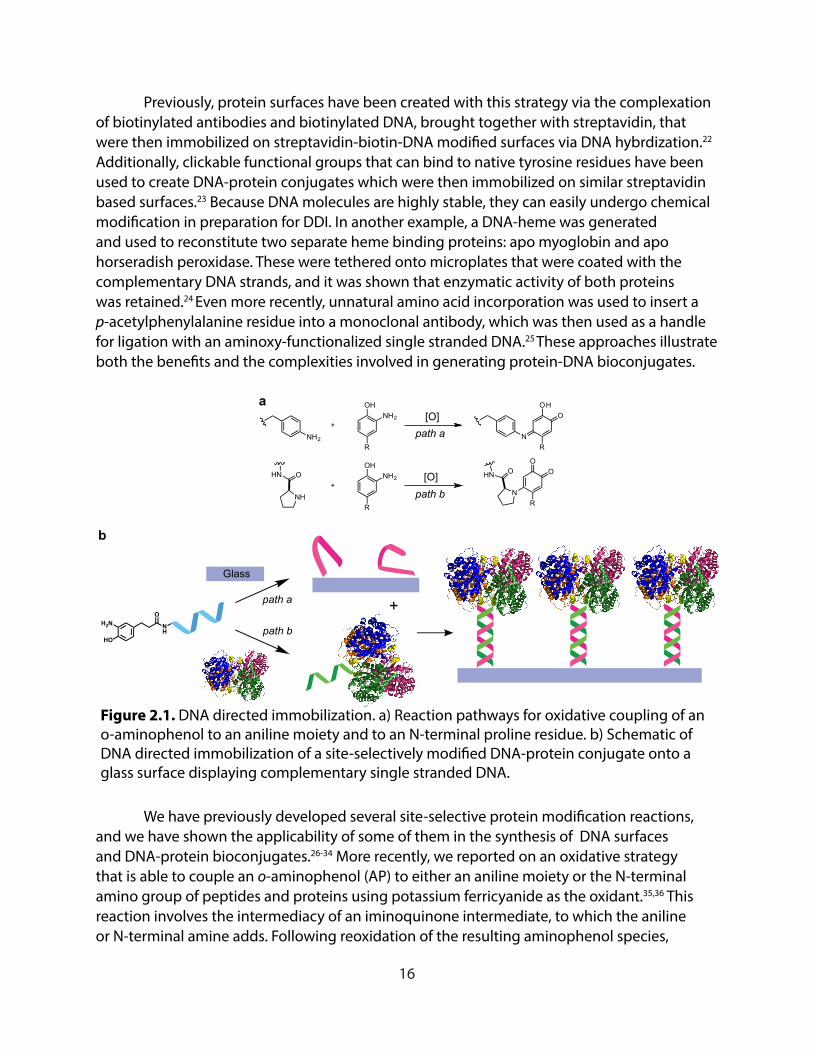
Previously, protein surfaces have been created with this strategy via the complexation of biotinylated antibodies and biotinylated DNA, brought together with streptavidin, that were then immobilized on streptavidin-biotin-DNA modified surfaces via DNA hybrdization.22 Additionally, clickable functional groups that can bind to native tyrosine residues have been used to create DNA-protein conjugates which were then immobilized on similar streptavidin based surfaces.23 Because DNA molecules are highly stable, they can easily undergo chemical modification in preparation for DDI. In another example, a DNA-heme was generated and used to reconstitute two separate heme binding proteins: apo myoglobin and apo horseradish peroxidase. These were tethered onto microplates that were coated with the complementary DNA strands, and it was shown that enzymatic activity of both proteins was retained.24 Even more recently, unnatural amino acid incorporation was used to insert a p-acetylphenylalanine residue into a monoclonal antibody, which was then used as a handle for ligation with an aminoxy-functionalized single stranded DNA.25 These approaches illustrate both the benefits and the complexities involved in generating protein-DNA bioconjugates.
We have previously developed several site-selective protein modification reactions, and we have shown the applicability of some of them in the synthesis of DNA surfaces and DNA-protein bioconjugates.26-34 More recently, we reported on an oxidative strategy that is able to couple an o-aminophenol (AP) to either an aniline moiety or the N-terminal amino group of peptides and proteins using potassium ferricyanide as the oxidant.35,36 This reaction involves the intermediacy of an iminoquinone intermediate, to which the aniline or N-terminal amine adds. Following reoxidation of the resulting aminophenol species,
+
Glass
H2N
HO
NH
O
a
b
path a
path b
OO
NR
HN O
OO
N
H
R
OHNH2
RNH2
+
OHNH2
R
+NH
HN O
[O]
[O]
path a
path b
Figure 2.1. DNA directed immobilization. a) Reaction pathways for oxidative coupling of an o-aminophenol to an aniline moiety and to an N-terminal proline residue. b) Schematic of DNA directed immobilization of a site-selectively modi�ed DNA-protein conjugate onto a glass surface displaying complementary single stranded DNA.

17
hydrolysis of the iminoquinone imine yields the final ketone group. Aniline addition products prefer the tautomer shown in Figure 2.1a, path a, while additions with N-terminal prolines sit as the o-quinone species shown in Figure 2.1a, path b. Both type of products are highly stable and resist hydrolysis.
Herein, we take advantage of this positional selectivity and functional group tolerance and apply it toward the development of a DDI based platform as shown in Figure 2.1b. We first coupled an o-aminophenol modified DNA strand to an aniline modified glass surface. Separately, we modified our protein of interest at the N-terminus with a complementary o-aminophenol substituted DNA strand in a single step with low concentrations of reagents. The subsequent hybridization of the surface oligo with the complementary oligo-protein conjugate allowed for the controlled attachment of the protein to surfaces in an oriented and versatile manner. We then apply DNA hybridization based protein immobilization using aldolase and evaluate its catalytic activity after attachment to glass slides. We also study the reusability and regenerability of these surfaces.
2.2. Results and Discussion
2.2.1. Modifying Glass Slides with Single Stranded DNA and Hybridizing to Complementary DNA
5000 6000 70000
50
100
Mass (m/z)
Amine-A DNA
Aminophenol-A DNA
6272.3 6432.6
% In
tens
ity
Figure 2.2. MALDI-TOF analysis of DNA before (black) and after (red) aminophenol attachment.
Most previous studies of DDI-based protein immobilization have used gold or coated plastic substrates.19 For these studies we selected glass slides because of their advantages for spectroscopic and microscopic analysis. We used silanization with 3-(4-azidophenyl)-N-(3-
18
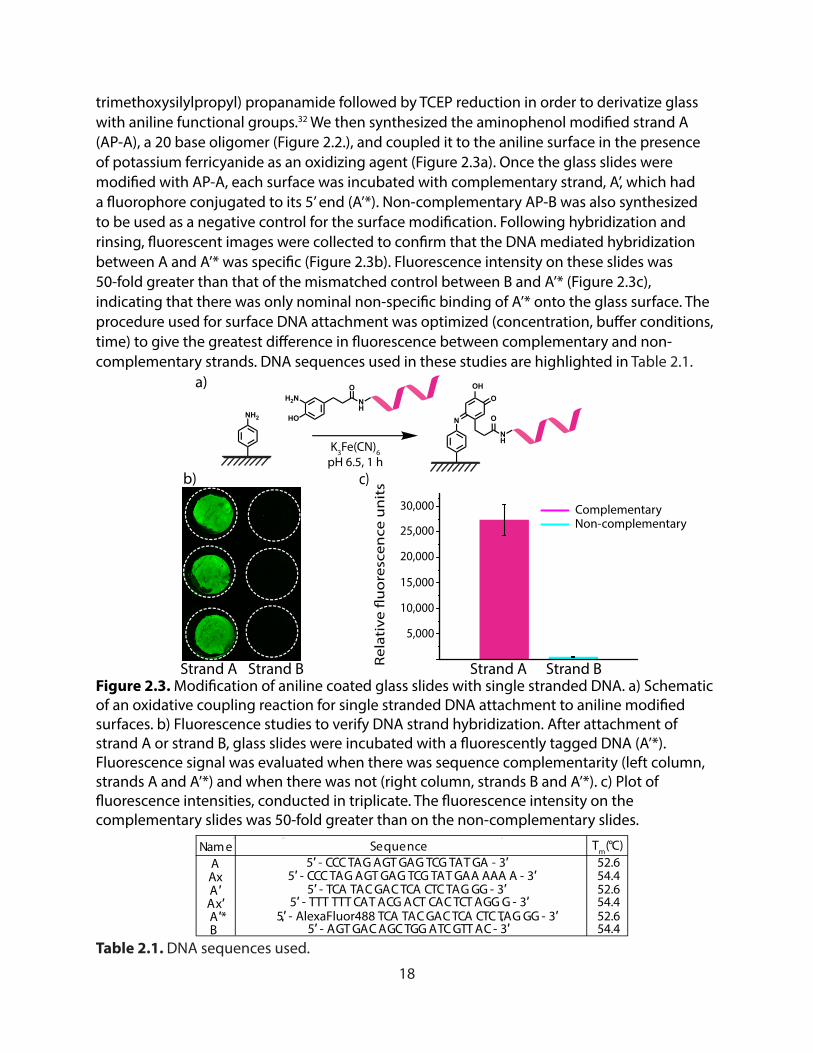
trimethoxysilylpropyl) propanamide followed by TCEP reduction in order to derivatize glass with aniline functional groups.32 We then synthesized the aminophenol modified strand A (AP-A), a 20 base oligomer (Figure 2.2.), and coupled it to the aniline surface in the presence of potassium ferricyanide as an oxidizing agent (Figure 2.3a). Once the glass slides were modified with AP-A, each surface was incubated with complementary strand, A’, which had a fluorophore conjugated to its 5’ end (A’*). Non-complementary AP-B was also synthesized to be used as a negative control for the surface modification. Following hybridization and rinsing, fluorescent images were collected to confirm that the DNA mediated hybridization between A and A’* was specific (Figure 2.3b). Fluorescence intensity on these slides was 50-fold greater than that of the mismatched control between B and A’* (Figure 2.3c), indicating that there was only nominal non-specific binding of A’* onto the glass surface. The procedure used for surface DNA attachment was optimized (concentration, buffer conditions, time) to give the greatest difference in fluorescence between complementary and non-complementary strands. DNA sequences used in these studies are highlighted in Table 2.1.
Nam e Sequence Tm ( °C) A 5′ - CCC TAG AGT GAG TCG TAT GA - 3′ 52.6
A ′ 5′ - TCA TAC GAC TCA CTC TAG GG - 3′ 52.6
A ′* 52.6 B 5′ - AGT GAC AGC TGG ATC GTT AC - 3′ 54.4
5′ - AlexaFluor488 TCA TAC GAC TCA CTC TAG GG - 3′ Ax′ 5′ - TTT TTT CAT ACG ACT CAC TCT AGG G - 3′
5′ - CCC TAG AGT GAG TCG TAT GAA AAA A - 3′ Ax
54.4
54.4
Table 2.1. DNA sequences used.
K3Fe(CN)6pH 6.5, 1 h
NH2 N O
NH
OHOH2N
HO
NH
O
30,000
a)
b)
Strand A Strand BStrand A Strand B Rel
ativ
e �
uo
resc
ence
un
its
Complementary Non-complementary
c)
25,000
20,000
15,000
10,000
5,000
Figure 2.3. Modi�cation of aniline coated glass slides with single stranded DNA. a) Schematic of an oxidative coupling reaction for single stranded DNA attachment to aniline modi�ed surfaces. b) Fluorescence studies to verify DNA strand hybridization. After attachment of strand A or strand B, glass slides were incubated with a �uorescently tagged DNA (A’*). Fluorescence signal was evaluated when there was sequence complementarity (left column, strands A and A’*) and when there was not (right column, strands B and A’*). c) Plot of �uorescence intensities, conducted in triplicate. The �uorescence intensity on the complementary slides was 50-fold greater than on the non-complementary slides.
19
2.2.2. Modifying Aldolase with A’ DNA and Evaluating its Activity
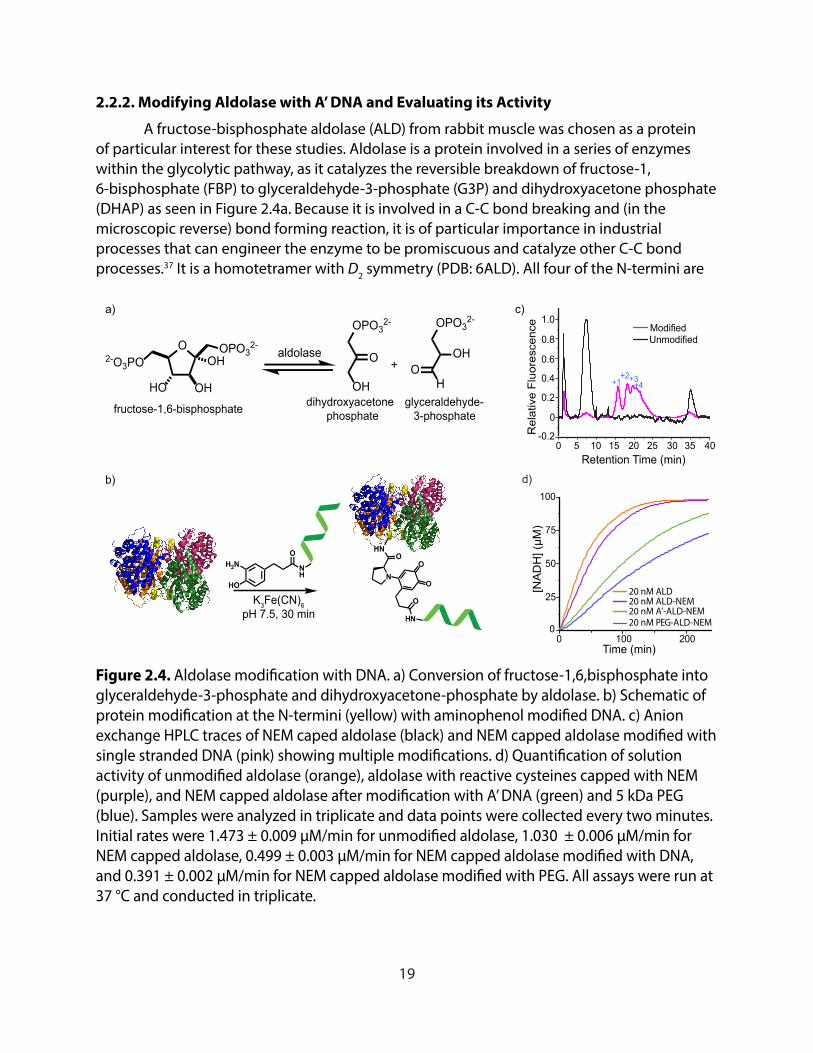
A fructose-bisphosphate aldolase (ALD) from rabbit muscle was chosen as a protein of particular interest for these studies. Aldolase is a protein involved in a series of enzymes within the glycolytic pathway, as it catalyzes the reversible breakdown of fructose-1, 6-bisphosphate (FBP) to glyceraldehyde-3-phosphate (G3P) and dihydroxyacetone phosphate (DHAP) as seen in Figure 2.4a. Because it is involved in a C-C bond breaking and (in the microscopic reverse) bond forming reaction, it is of particular importance in industrial processes that can engineer the enzyme to be promiscuous and catalyze other C-C bond processes.37 It is a homotetramer with D2 symmetry (PDB: 6ALD). All four of the N-termini are
b)
c)
d)
K3Fe(CN)6pH 7.5, 30 min
0 100 2000
25
50
75
100
20 nM ALD20 nM ALD-NEM20 nM A’-ALD-NEM
Time (min)
[NA
DH
] (µM
)
H2N
HO
NH
O
O
ON
HNO
N
O
H
Retention Time (min)
ModifiedUnmodified
Rel
ativ
e Fl
uore
scen
ce
0 5 1510 20 353025 40-0.2
0.6
1.0
0.2
0.4
0
0.8
+1 +4+3+2
20 nM PEG-ALD-NEM
a)
O
HO OH
2-O3PO OHOPO3
2-aldolase
OH
O
OPO32-
H
OH
OPO32-
O+
fructose-1,6-bisphosphate glyceraldehyde-3-phosphate
dihydroxyacetonephosphate
Figure 2.4. Aldolase modi�cation with DNA. a) Conversion of fructose-1,6,bisphosphate into glyceraldehyde-3-phosphate and dihydroxyacetone-phosphate by aldolase. b) Schematic of protein modi�cation at the N-termini (yellow) with aminophenol modi�ed DNA. c) Anion exchange HPLC traces of NEM caped aldolase (black) and NEM capped aldolase modi�ed with single stranded DNA (pink) showing multiple modi�cations. d) Quanti�cation of solution activity of unmodi�ed aldolase (orange), aldolase with reactive cysteines capped with NEM (purple), and NEM capped aldolase after modi�cation with A’ DNA (green) and 5 kDa PEG (blue). Samples were analyzed in triplicate and data points were collected every two minutes. Initial rates were 1.473 ± 0.009 µM/min for unmodi�ed aldolase, 1.030 ± 0.006 µM/min for NEM capped aldolase, 0.499 ± 0.003 µM/min for NEM capped aldolase modi�ed with DNA, and 0.391 ± 0.002 µM/min for NEM capped aldolase modi�ed with PEG. All assays were run at 37 °C and conducted in triplicate.
20
solvent exposed, with two N-termini in proximity to one another and the other two N-termini on the opposite face. As a result of this configuration, there are two possible ways for the protein to be immobilized via its N-terminal positions. Fortunately, these would be expected to display the protein with highly similar orientations. Additionally, it retains a proline residue at its N-terminus, which has a favorable propensity towards the oxidative coupling reaction.36
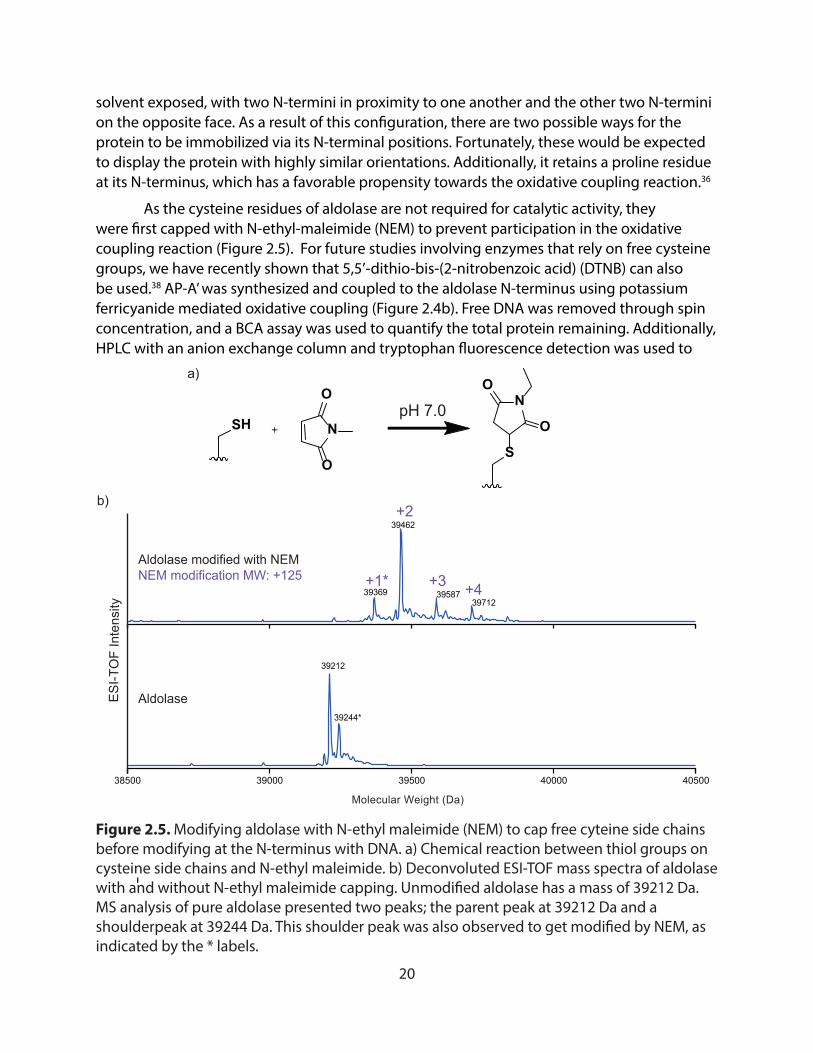
As the cysteine residues of aldolase are not required for catalytic activity, they were first capped with N-ethyl-maleimide (NEM) to prevent participation in the oxidative coupling reaction (Figure 2.5). For future studies involving enzymes that rely on free cysteine groups, we have recently shown that 5,5’-dithio-bis-(2-nitrobenzoic acid) (DTNB) can also be used.38 AP-A’ was synthesized and coupled to the aldolase N-terminus using potassium ferricyanide mediated oxidative coupling (Figure 2.4b). Free DNA was removed through spin concentration, and a BCA assay was used to quantify the total protein remaining. Additionally, HPLC with an anion exchange column and tryptophan fluorescence detection was used to
+2
a)
39369
39462
3958739712
400003900038500 39500 40500
39212
Aldolase
Aldolase modified with NEMNEM modification MW: +125 +3 +4
SH N
O
OS
N
O
O
b)
Molecular Weight (Da)
39244*
+1*
ESI-T
OF
Inte
nsity
pH 7.0
Figure 2.5. Modifying aldolase with N-ethyl maleimide (NEM) to cap free cyteine side chains before modifying at the N-terminus with DNA. a) Chemical reaction between thiol groups on cysteine side chains and N-ethyl maleimide. b) Deconvoluted ESI-TOF mass spectra of aldolase with and without N-ethyl maleimide capping. Unmodi�ed aldolase has a mass of 39212 Da. MS analysis of pure aldolase presented two peaks; the parent peak at 39212 Da and a shoulderpeak at 39244 Da. This shoulder peak was also observed to get modi�ed by NEM, as indicated by the * labels.
21
determine the level of modification of the DNA-aldolase bioconjugate. Less than 5% of the total protein was unmodified with DNA, and a range of modifications from one to four DNA strands per tetramer were seen (Figure 2.4c).
Solution activity assays were carried out on aldolase, aldolase capped with NEM, and NEM capped aldolase that was modified separately with AP-A’ DNA and aminophenol 5 kDA polyethylene glycol (PEG) to determine how the modification itself as well as reaction conditions impacted the enzymatic activity. The 5 kDa PEG modification was chosen because of its comparability to the 20 base A’ DNA in molecular weight while having a neutral charge. Glyceraldehyde-3-phosphate dehydrogenase (GAPDH) was paired with aldolase in the activity assays. GAPDH catalyzes the conversion of G3P to 1,3-bisphosphoglycerate in the presence of NAD+ as a cofactor. The conversion of NAD+ to NADH can be monitored by the increase in absorbance at 340 nm and can be used to quantify aldolase activity. As illustrated in Figure 2.4d, NEM capped aldolase after modification with DNA retained about 48% of its enzymatic activity (PEG modified aldolase retained 38% of its activity). This difference could be attributed to the DNA (or PEG) sterically hindering accessibility of the active site.
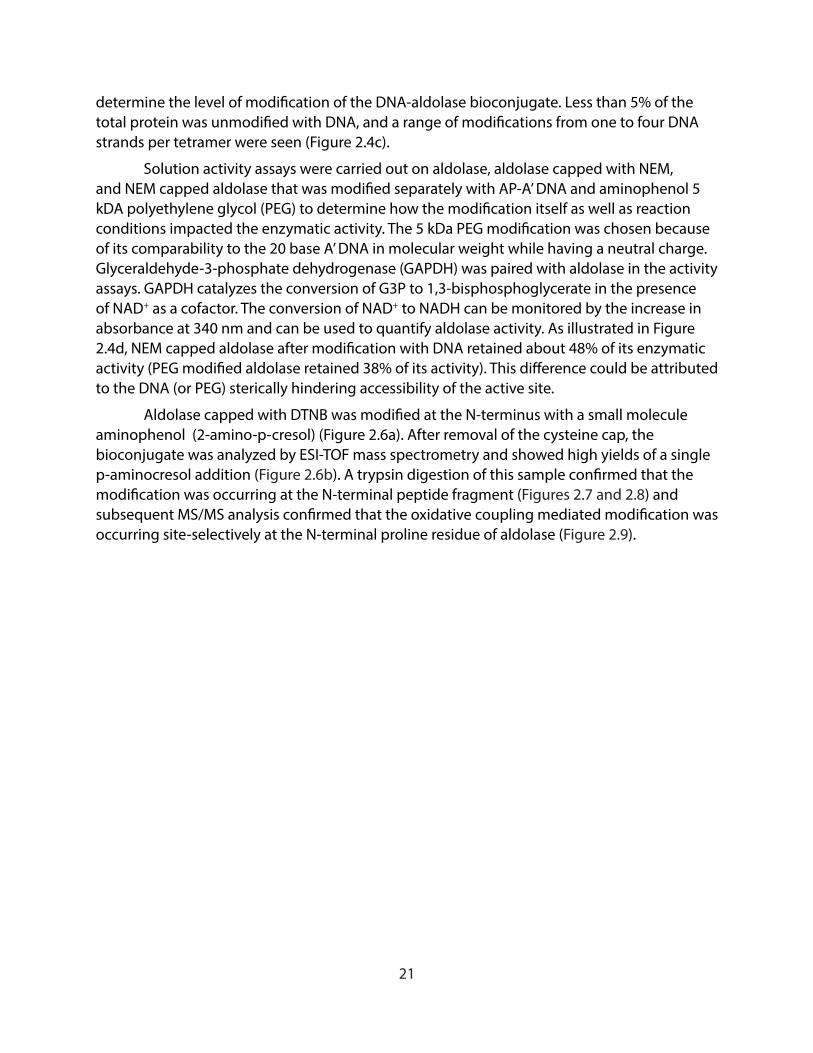
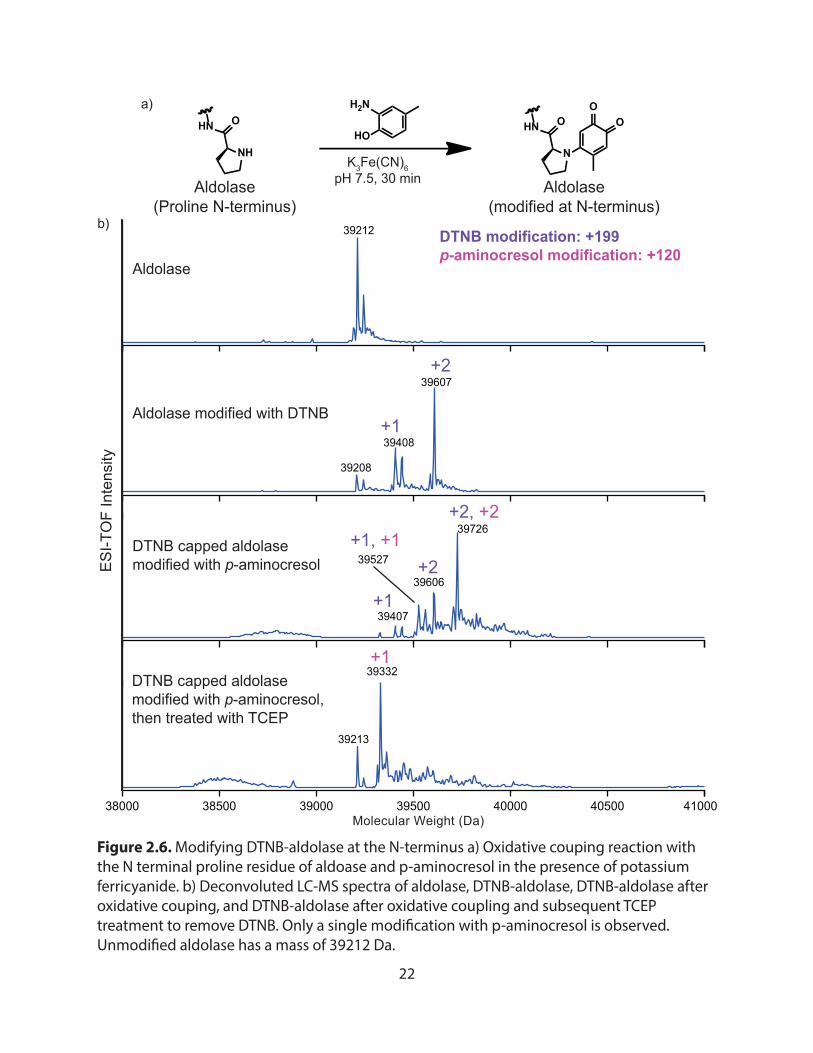
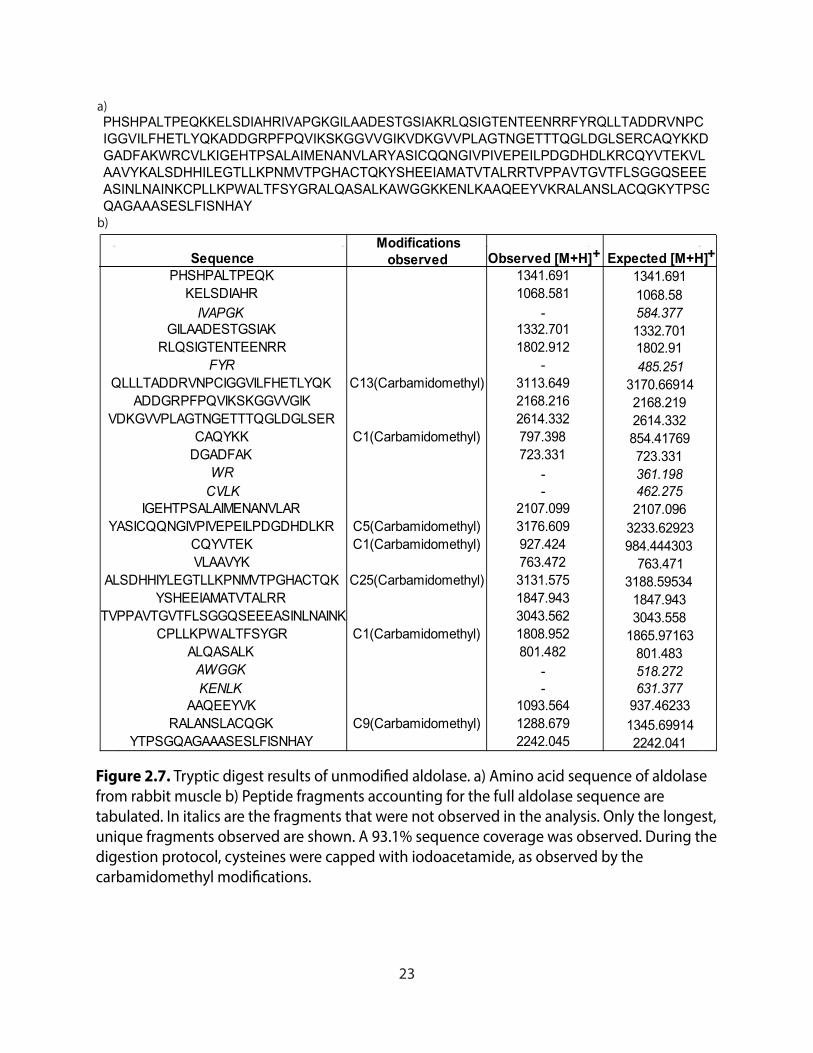
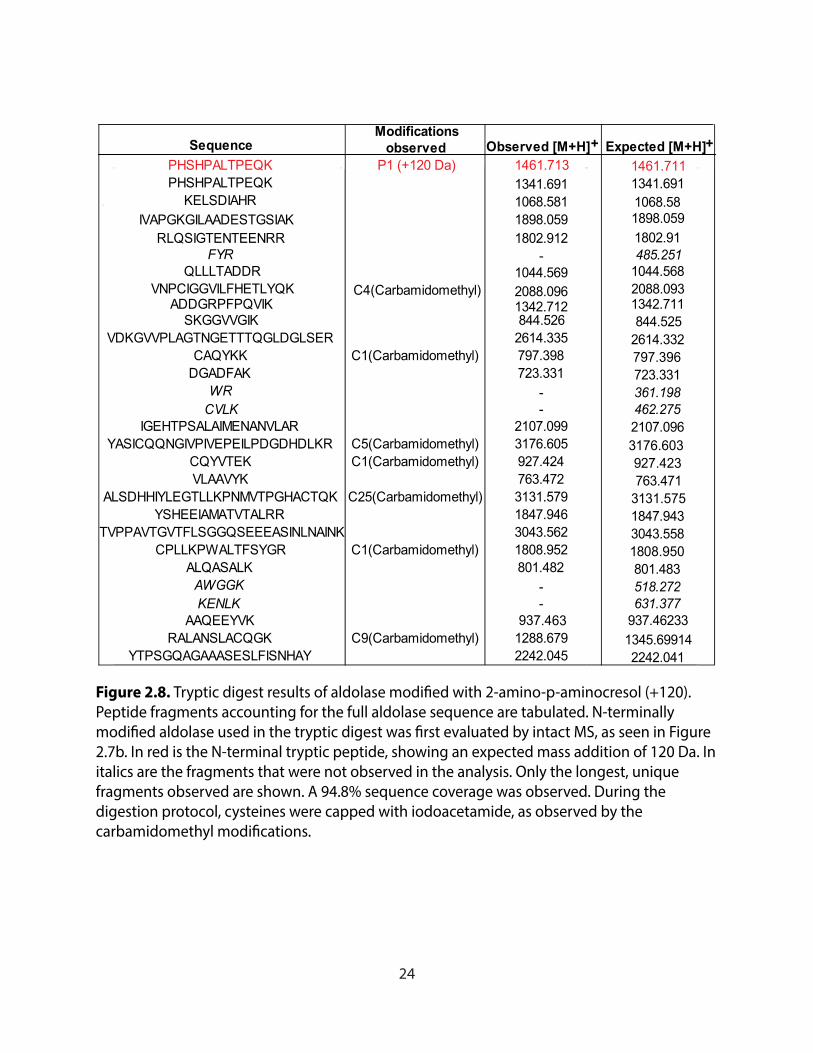
Aldolase capped with DTNB was modified at the N-terminus with a small molecule aminophenol (2-amino-p-cresol) (Figure 2.6a). After removal of the cysteine cap, the bioconjugate was analyzed by ESI-TOF mass spectrometry and showed high yields of a single p-aminocresol addition (Figure 2.6b). A trypsin digestion of this sample confirmed that the modification was occurring at the N-terminal peptide fragment (Figures 2.7 and 2.8) and subsequent MS/MS analysis confirmed that the oxidative coupling mediated modification was occurring site-selectively at the N-terminal proline residue of aldolase (Figure 2.9).
22
a)
Aldolase
Aldolase modified with DTNB +1
+2
b)
Molecular Weight (Da)
DTNB capped aldolase modified with p-aminocresol
39212
39208
39408
39607
39407
39527
39606
39726
38000 38500 39000 39500 40000 40500 41000
39213
39332DTNB capped aldolase modified with p-aminocresol, then treated with TCEP
+1
+2+1, +1
+2, +2
+1
DTNB modification: +199 p-aminocresol modification: +120
H2N
HOO
O
N
HN O
NH
HN O
K3Fe(CN)6pH 7.5, 30 minAldolase
(Proline N-terminus)Aldolase
(modified at N-terminus)
ESI-T
OF
Inte
nsity
Figure 2.6. Modifying DTNB-aldolase at the N-terminus a) Oxidative couping reaction with the N terminal proline residue of aldoase and p-aminocresol in the presence of potassium ferricyanide. b) Deconvoluted LC-MS spectra of aldolase, DTNB-aldolase, DTNB-aldolase after oxidative couping, and DTNB-aldolase after oxidative coupling and subsequent TCEP treatment to remove DTNB. Only a single modi�cation with p-aminocresol is observed. Unmodi�ed aldolase has a mass of 39212 Da.
23
a)
b)
PHSHPALTPEQKKELSDIAHRIVAPGKGILAADESTGSIAKRLQSIGTENTEENRRFYRQLLTADDRVNPC IGGVILFHETLYQKADDGRPFPQVIKSKGGVVGIKVDKGVVPLAGTNGETTTQGLDGLSERCAQYKKD GADFAKWRCVLKIGEHTPSALAIMENANVLARYASICQQNGIVPIVEPEILPDGDHDLKRCQYVTEKVL AAVYKALSDHHILEGTLLKPNMVTPGHACTQKYSHEEIAMATVTALRRTVPPAVTGVTFLSGGQSEEE ASINLNAINKCPLLKPWALTFSYGRALQASALKAWGGKKENLKAAQEEYVKRALANSLACQGKYTPSG QAGAAASESLFISNHAY
SequenceModifications observed Observed [M+H]+ Expected [M+H]+
PHSHPALTPEQK 1341.691 1341.691KELSDIAHR 1068.581 1068.58
IVAPGK - 584.377GILAADESTGSIAK 1332.701 1332.701
RLQSIGTENTEENRR 1802.912 1802.91FYR - 485.251
QLLLTADDRVNPCIGGVILFHETLYQK C13(Carbamidomethyl) 3113.649 3170.66914ADDGRPFPQVIKSKGGVVGIK 2168.216 2168.219
VDKGVVPLAGTNGETTTQGLDGLSER 2614.332 2614.332CAQYKK C1(Carbamidomethyl) 797.398 854.41769
DGADFAK 723.331 723.331WR - 361.198
CVLK - 462.275IGEHTPSALAIMENANVLAR 2107.099 2107.096
YASICQQNGIVPIVEPEILPDGDHDLKR C5(Carbamidomethyl) 3176.609 3233.62923CQYVTEK C1(Carbamidomethyl) 927.424 984.444303VLAAVYK 763.472 763.471
ALSDHHIYLEGTLLKPNMVTPGHACTQK C25(Carbamidomethyl) 3131.575 3188.59534YSHEEIAMATVTALRR 1847.943 1847.943
TVPPAVTGVTFLSGGQSEEEASINLNAINK 3043.562 3043.558CPLLKPWALTFSYGR C1(Carbamidomethyl) 1808.952 1865.97163
ALQASALK 801.482 801.483AWGGK - 518.272KENLK - 631.377
AAQEEYVK 1093.564 937.46233RALANSLACQGK C9(Carbamidomethyl) 1288.679 1345.69914
YTPSGQAGAAASESLFISNHAY 2242.045 2242.041
Figure 2.7. Tryptic digest results of unmodi�ed aldolase. a) Amino acid sequence of aldolase from rabbit muscle b) Peptide fragments accounting for the full aldolase sequence are tabulated. In italics are the fragments that were not observed in the analysis. Only the longest, unique fragments observed are shown. A 93.1% sequence coverage was observed. During the digestion protocol, cysteines were capped with iodoacetamide, as observed by the carbamidomethyl modi�cations.
24
SequenceModifications observed Observed [M+H]+ Expected [M+H]+
PHSHPALTPEQK 1341.691 1341.691KELSDIAHR 1068.581 1068.58
IVAPGKGILAADESTGSIAKRLQSIGTENTEENRR 1802.912 1802.91
FYR - 485.251
VNPCIGGVILFHETLYQK C4(Carbamidomethyl)
SKGGVVGIKVDKGVVPLAGTNGETTTQGLDGLSER 2614.335 2614.332
CAQYKK C1(Carbamidomethyl) 797.398 797.396DGADFAK 723.331 723.331
WR - 361.198CVLK - 462.275
IGEHTPSALAIMENANVLAR 2107.099 2107.096YASICQQNGIVPIVEPEILPDGDHDLKR C5(Carbamidomethyl) 3176.605 3176.603
CQYVTEK C1(Carbamidomethyl) 927.424 927.423VLAAVYK 763.472 763.471
ALSDHHIYLEGTLLKPNMVTPGHACTQK C25(Carbamidomethyl) 3131.579 3131.575YSHEEIAMATVTALRR 1847.946 1847.943
TVPPAVTGVTFLSGGQSEEEASINLNAINK 3043.562 3043.558CPLLKPWALTFSYGR C1(Carbamidomethyl) 1808.952 1808.950
ALQASALK 801.482 801.483AWGGK - 518.272KENLK - 631.377
AAQEEYVK 937.463 937.46233RALANSLACQGK C9(Carbamidomethyl) 1288.679 1345.69914
YTPSGQAGAAASESLFISNHAY 2242.045 2242.041
PHSHPALTPEQK 1461.713 1461.711P1 (+120 Da)
1898.059 1898.059
QLLLTADDR2088.096 2088.0931044.569 1044.568
ADDGRPFPQVIK844.526 844.525
1342.712 1342.711
Figure 2.8. Tryptic digest results of aldolase modi�ed with 2-amino-p-aminocresol (+120). Peptide fragments accounting for the full aldolase sequence are tabulated. N-terminally modi�ed aldolase used in the tryptic digest was �rst evaluated by intact MS, as seen in Figure 2.7b. In red is the N-terminal tryptic peptide, showing an expected mass addition of 120 Da. In italics are the fragments that were not observed in the analysis. Only the longest, unique fragments observed are shown. A 94.8% sequence coverage was observed. During the digestion protocol, cysteines were capped with iodoacetamide, as observed by the carbamidomethyl modi�cations.
25
2.2.3. Evaluating the Activity of Surface Immobilized Aldolase
The A’-aldolase bioconjugate was incubated on A-modified (complementary) surfaces to allow for DNA directed immobilization. Enzymatic activity was subsequently evaluated and the results of these assays are shown in Figure 2.10. Because hybridization to the surface is an internal purification tool, unmodified aldolase did not need to be purified away from DNA modified aldolase. In order to evaluate any non-specific binding that was occurring, a control was included where the DNA-protein conjugate was incubated on B-modified (non-complementary) surfaces. As compared to the control, we observed that when A’-aldolase was incubated on the surface displaying its complementary strand, aldolase activity was significant, and background activity was minimal. This confirmed that aldolase was successfully immobilized with very low levels of non-specific adsorption and that the surface immobilization itself did not destroy its quaternary structure. An additional control was included with 20 nM free A’-aldolase in solution to ensure that the assay was functioning as
0 400 8000
50
100
Time (min)
[NAD
H] (
µM)
20 nM A'-ALD in solution
Complementary
Non-complementary
Figure 2.10. Testing the activity of DNA-aldolase conjugates immobilized after hybridization to the glass surface. Activity assay of A’-aldolase exposed to a glass surface displaying the complementary DNA strand (A, pink), the non-complementary DNA strand (B, blue), and free in solution at a concentration of 20 nM (green). All assays were run at 37 °C and conducted in triplicate.
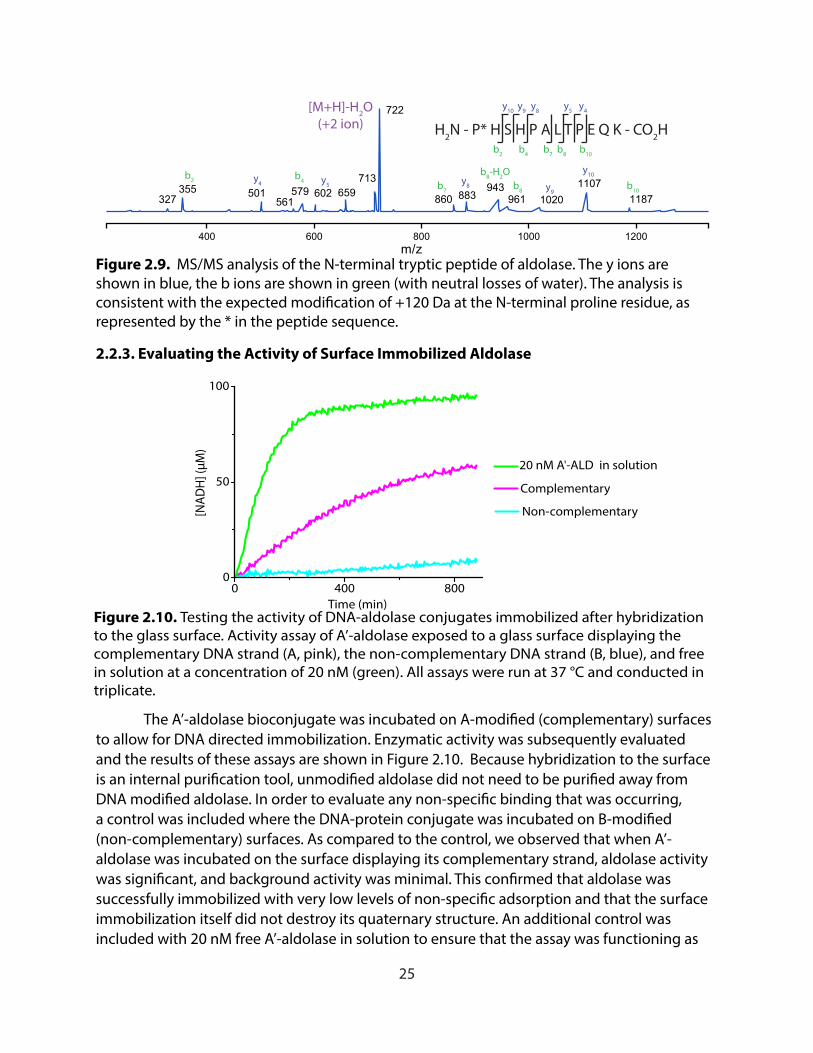
H2N - P* H S H P A L T P E Q K - CO2H
400 600 800 1000 1200
327355 501
561579 602 659
713
722
860 883943
961 10201107
1187
[M+H]-H2O(+2 ion)
b2 b4 b7
b8-H2Ob8 b10
y4 y5 y8
y10
y9
m/z
b4b2 b7 b8 b10
y4y5y8y10 y9
Figure 2.9. MS/MS analysis of the N-terminal tryptic peptide of aldolase. The y ions are shown in blue, the b ions are shown in green (with neutral losses of water). The analysis is consistent with the expected modi�cation of +120 Da at the N-terminal proline residue, as represented by the * in the peptide sequence.
26
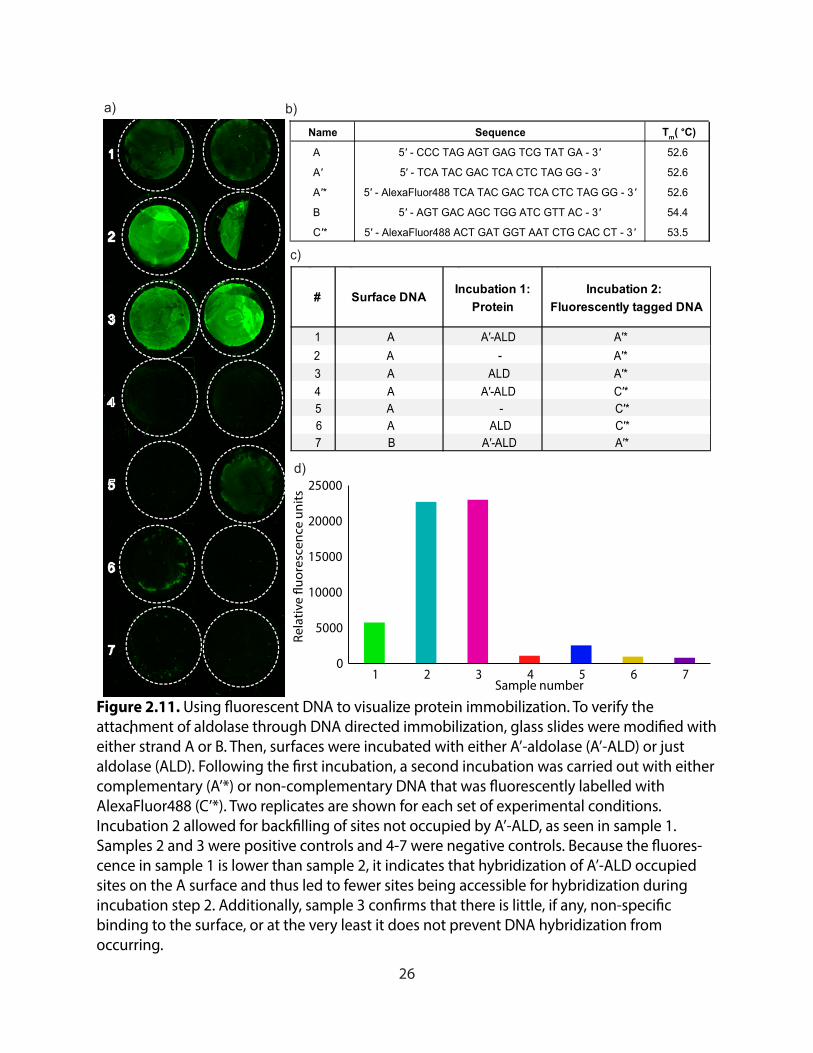
0
5000
10000
15000
20000
25000
1 2 3 4 5 6 7
Rela
tive
�uor
esce
nce
units
Sample number
1
2
3
4
5
6
7
a) b)
# Surface DNA Incubation 1: Protein
Incubation 2: Fluorescently tagged DNA
1 A A′-ALD A′*2 A - A′*3 A ALD A′*4 A A′-ALD C′*5 A - C′*6 A ALD C′*7 B A′-ALD A′*
c)
d)
ecneuqeSemaN Tm( °C)
A 5′ - CCC TAG AGT GAG TCG TAT GA - 3 ′ 52.6
A ′ 5′ - TCA TAC GAC TCA CTC TAG GG - 3 ′ 52.6
A ′* 5′ - AlexaFluor488 TCA TAC GAC TCA CTC TAG GG - 3 ′ 52.6
B 5′ - AGT GAC AGC TGG ATC GTT AC - 3 ′ 54.4
C′* 5′ - AlexaFluor488 ACT GAT GGT AAT CTG CAC CT - 3 ′ 53.5
Figure 2.11. Using �uorescent DNA to visualize protein immobilization. To verify the attachment of aldolase through DNA directed immobilization, glass slides were modi�ed with either strand A or B. Then, surfaces were incubated with either A’-aldolase (A’-ALD) or just aldolase (ALD). Following the �rst incubation, a second incubation was carried out with either complementary (A’*) or non-complementary DNA that was �uorescently labelled with AlexaFluor488 (C’*). Two replicates are shown for each set of experimental conditions. Incubation 2 allowed for back�lling of sites not occupied by A’-ALD, as seen in sample 1. Samples 2 and 3 were positive controls and 4-7 were negative controls. Because the �uores-cence in sample 1 is lower than sample 2, it indicates that hybridization of A’-ALD occupied sites on the A surface and thus led to fewer sites being accessible for hybridization during incubation step 2. Additionally, sample 3 con�rms that there is little, if any, non-speci�c binding to the surface, or at the very least it does not prevent DNA hybridization from occurring.
27
expected. This amount of protein represents the theoretical maximum amount that can be on the surface, as determined by dividing the total area of the experimental region by the “footprint” each protein would occupy. Fluorescence studies were also conducted to visualize each step qualitatively, and are depicted in Figures 2.11 and 2.12.
2.2.4 Reusing the Protein Immobilized Surfaces
Given the successful immobilization of aldolase onto the glass slides, we were interested in investigating the reusability of the surfaces. We ran each cycle for 15 h, rinsed reagents from the wells and repeated the assay using the same surface. These data are shown in Figure 2.13a. It can be seen that, while we do see a drop in activity in each subsequent cycle, about half of the activity is maintained from one run to the next. We hypothesized that because the assay was conducted at 37 °C, the temperature could be attributing to inactivation of the protein over time. To test this, we incubated unmodified aldolase in solution at 37 °C for lengths of time equivalent to each iterative cycle, and we observed that the drop in activity was in fact a result of the protein being exposed to the elevated temperatures for extended periods of time (Figure 2.13b). The immobilized aldolase was
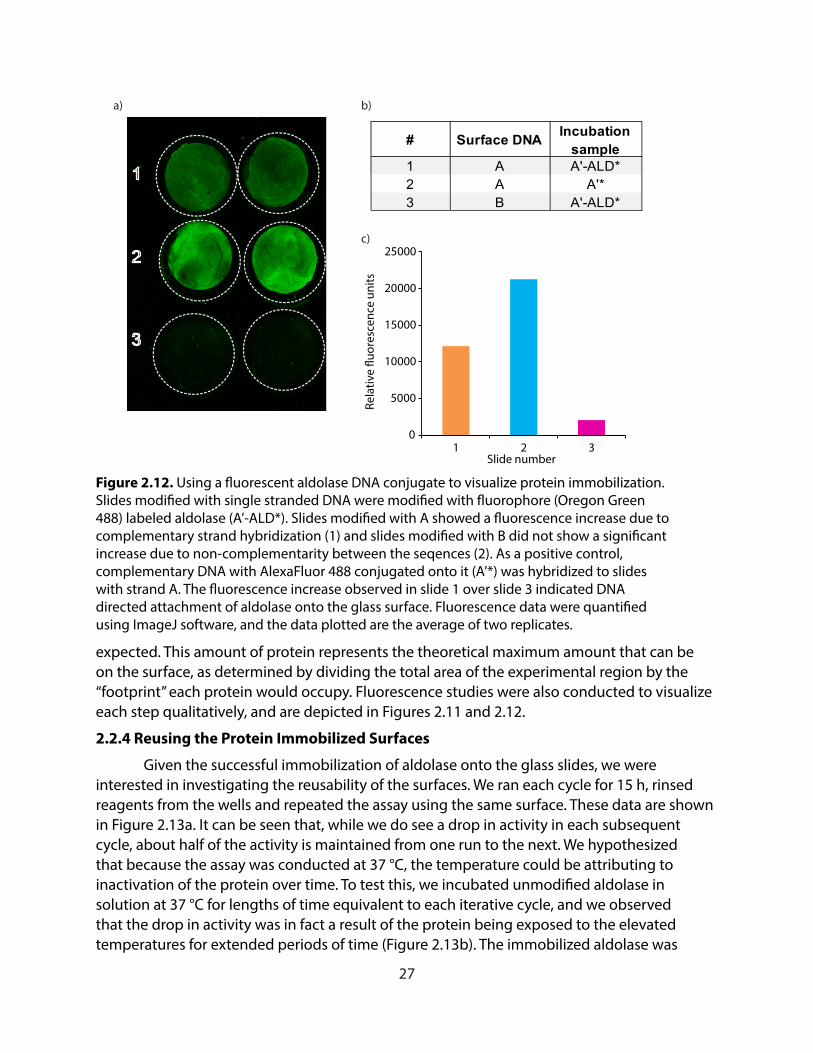
1
2
3
a) b)
c)
0
5000
10000
15000
20000
25000
1 2 3
Rela
tive
�uor
esce
nce
units
Slide number
# Surface DNA Incubation sample
1 A A'-ALD*2 A A'*3 B A'-ALD*
Figure 2.12. Using a �uorescent aldolase DNA conjugate to visualize protein immobilization. Slides modi�ed with single stranded DNA were modi�ed with �uorophore (Oregon Green 488) labeled aldolase (A’-ALD*). Slides modi�ed with A showed a �uorescence increase due to complementary strand hybridization (1) and slides modi�ed with B did not show a signi�cant increase due to non-complementarity between the seqences (2). As a positive control, complementary DNA with AlexaFluor 488 conjugated onto it (A’*) was hybridized to slides with strand A. The �uorescence increase observed in slide 1 over slide 3 indicated DNA directed attachment of aldolase onto the glass surface. Fluorescence data were quanti�ed using ImageJ software, and the data plotted are the average of two replicates.
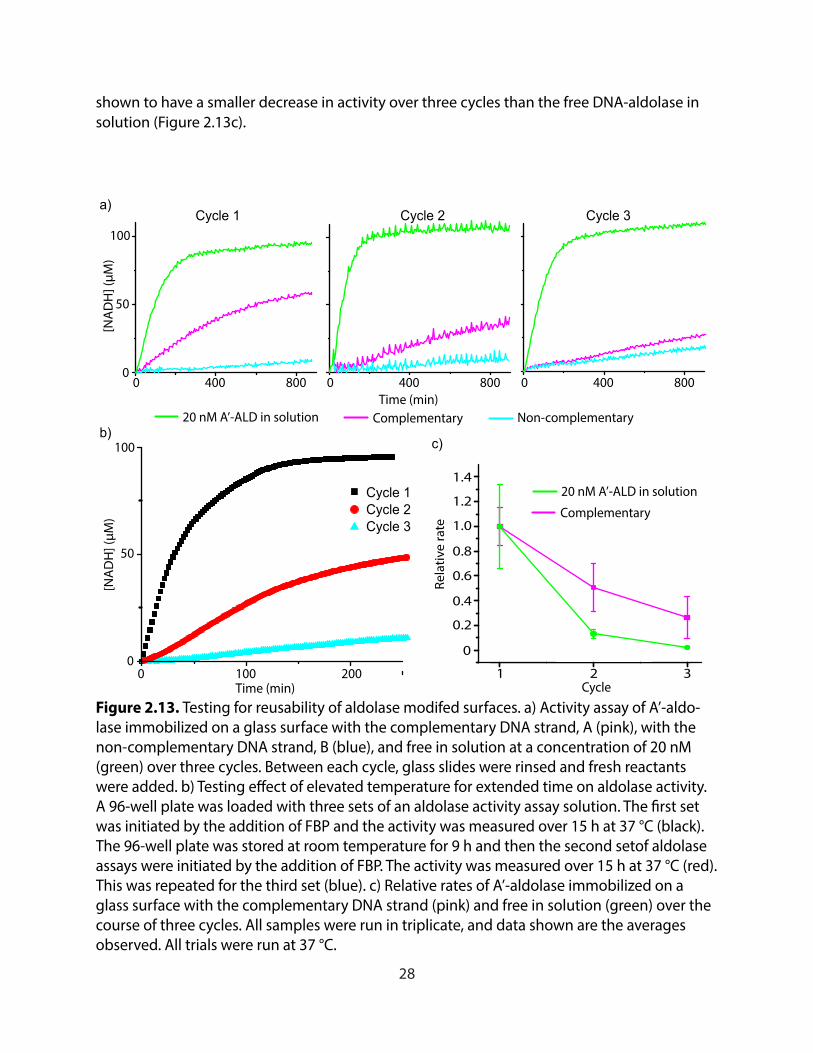
28
shown to have a smaller decrease in activity over three cycles than the free DNA-aldolase in solution (Figure 2.13c).
0 400 8000
50
100
[NA
DH
] (µM
)
a)
20 nM A’-ALD in solution Complementary Non-complementary
0 400 800Time (min)
0 400 800
0 100 2000
50
100
Time (min)
Cycle 1 Cycle 2 Cycle 3
[NA
DH
] (µM
)
1 2 3Cycle
Rela
tive
rate
0
0.2
0.4
0.6
0.8
1.2
1.4
1.0
20 nM A’-ALD in solution
Complementary
Cycle 1 Cycle 2 Cycle 3
b)c)
Figure 2.13. Testing for reusability of aldolase modifed surfaces. a) Activity assay of A’-aldo-lase immobilized on a glass surface with the complementary DNA strand, A (pink), with the non-complementary DNA strand, B (blue), and free in solution at a concentration of 20 nM (green) over three cycles. Between each cycle, glass slides were rinsed and fresh reactants were added. b) Testing e�ect of elevated temperature for extended time on aldolase activity. A 96-well plate was loaded with three sets of an aldolase activity assay solution. The �rst set was initiated by the addition of FBP and the activity was measured over 15 h at 37 °C (black). The 96-well plate was stored at room temperature for 9 h and then the second setof aldolase assays were initiated by the addition of FBP. The activity was measured over 15 h at 37 °C (red). This was repeated for the third set (blue). c) Relative rates of A’-aldolase immobilized on a glass surface with the complementary DNA strand (pink) and free in solution (green) over the course of three cycles. All samples were run in triplicate, and data shown are the averages observed. All trials were run at 37 °C.
29
2.2.5. Surface Characterization with Atomic Force Microscopy
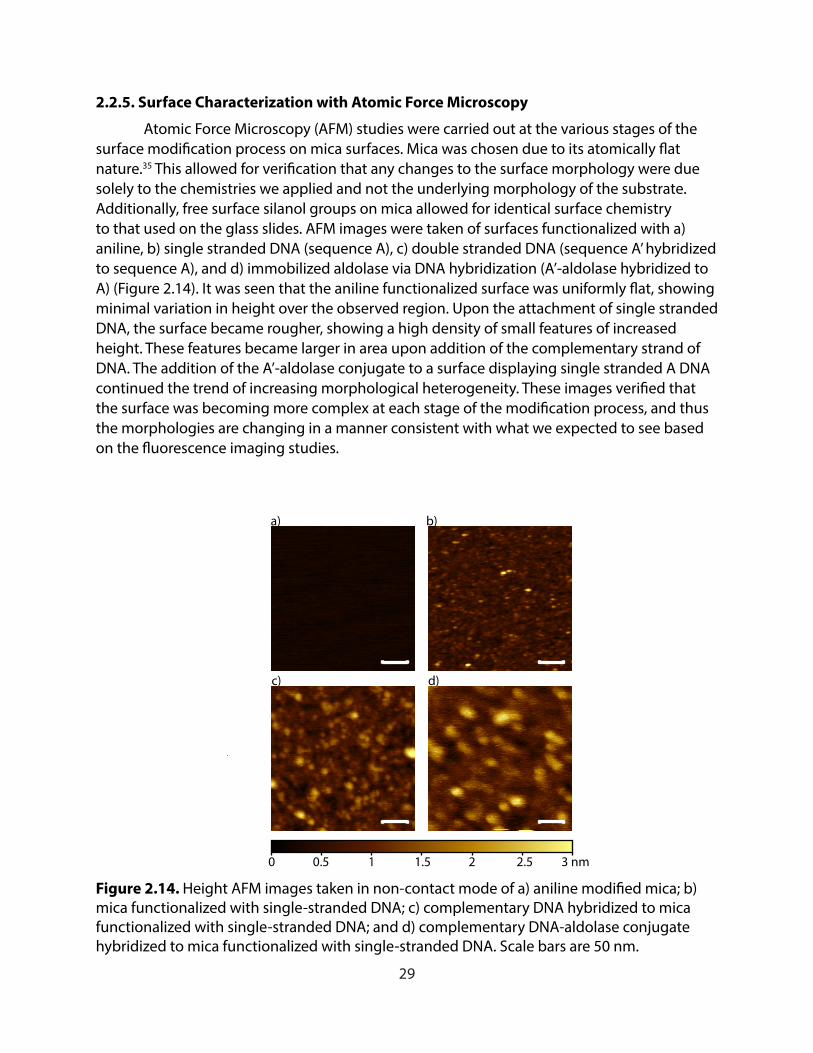
Atomic Force Microscopy (AFM) studies were carried out at the various stages of the surface modification process on mica surfaces. Mica was chosen due to its atomically flat nature.35 This allowed for verification that any changes to the surface morphology were due solely to the chemistries we applied and not the underlying morphology of the substrate. Additionally, free surface silanol groups on mica allowed for identical surface chemistry to that used on the glass slides. AFM images were taken of surfaces functionalized with a) aniline, b) single stranded DNA (sequence A), c) double stranded DNA (sequence A’ hybridized to sequence A), and d) immobilized aldolase via DNA hybridization (A’-aldolase hybridized to A) (Figure 2.14). It was seen that the aniline functionalized surface was uniformly flat, showing minimal variation in height over the observed region. Upon the attachment of single stranded DNA, the surface became rougher, showing a high density of small features of increased height. These features became larger in area upon addition of the complementary strand of DNA. The addition of the A’-aldolase conjugate to a surface displaying single stranded A DNA continued the trend of increasing morphological heterogeneity. These images verified that the surface was becoming more complex at each stage of the modification process, and thus the morphologies are changing in a manner consistent with what we expected to see based on the fluorescence imaging studies.
0.5 1.5 3 nm210
b)
c) d)
a)
50 nm 50 nm
50 nm 50 nm
2.5
Figure 2.14. Height AFM images taken in non-contact mode of a) aniline modi�ed mica; b) mica functionalized with single-stranded DNA; c) complementary DNA hybridized to mica functionalized with single-stranded DNA; and d) complementary DNA-aldolase conjugate hybridized to mica functionalized with single-stranded DNA. Scale bars are 50 nm.
30
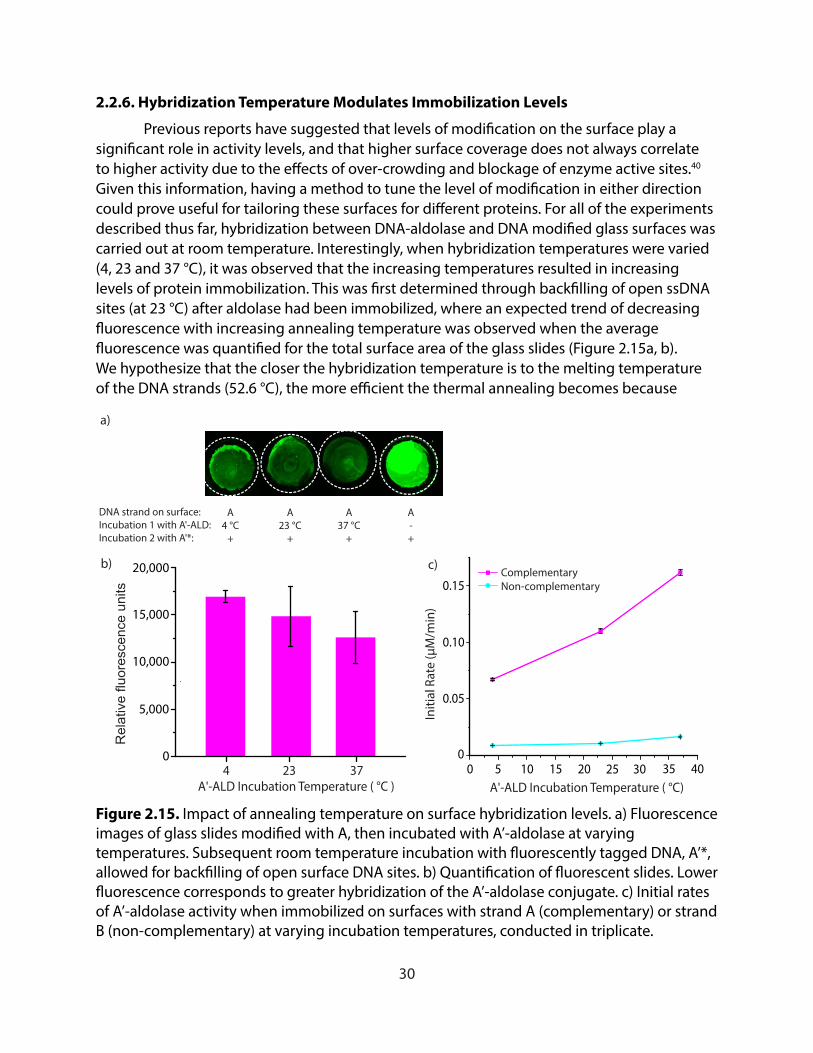
2.2.6. Hybridization Temperature Modulates Immobilization Levels
Previous reports have suggested that levels of modification on the surface play a significant role in activity levels, and that higher surface coverage does not always correlate to higher activity due to the effects of over-crowding and blockage of enzyme active sites.40 Given this information, having a method to tune the level of modification in either direction could prove useful for tailoring these surfaces for different proteins. For all of the experiments described thus far, hybridization between DNA-aldolase and DNA modified glass surfaces was carried out at room temperature. Interestingly, when hybridization temperatures were varied (4, 23 and 37 °C), it was observed that the increasing temperatures resulted in increasing levels of protein immobilization. This was first determined through backfilling of open ssDNA sites (at 23 °C) after aldolase had been immobilized, where an expected trend of decreasing fluorescence with increasing annealing temperature was observed when the average fluorescence was quantified for the total surface area of the glass slides (Figure 2.15a, b). We hypothesize that the closer the hybridization temperature is to the melting temperature of the DNA strands (52.6 °C), the more efficient the thermal annealing becomes because
4 23 37A'-ALD Incubation Temperature ( °C )
0
20,000
Rel
ativ
e flu
ores
cenc
e un
its
0 5 100
0.15
A'-ALD Incubation Temperature ( °C)
Initi
al R
ate
(μM
/min
)
Complementary Non-complementary
a)
DNA strand on surface:Incubation 1 with A'-ALD:Incubation 2 with A'*:
A4 °C
+
A23 °C
+
A37 °C
+
A-+
c)b)
10,000
15,000
5,000
0.10
0.05
15 20 25 30 35 40
Figure 2.15. Impact of annealing temperature on surface hybridization levels. a) Fluorescence images of glass slides modi�ed with A, then incubated with A’-aldolase at varying temperatures. Subsequent room temperature incubation with �uorescently tagged DNA, A’*, allowed for back�lling of open surface DNA sites. b) Quanti�cation of �uorescent slides. Lower �uorescence corresponds to greater hybridization of the A’-aldolase conjugate. c) Initial rates of A’-aldolase activity when immobilized on surfaces with strand A (complementary) or strand B (non-complementary) at varying incubation temperatures, conducted in triplicate.
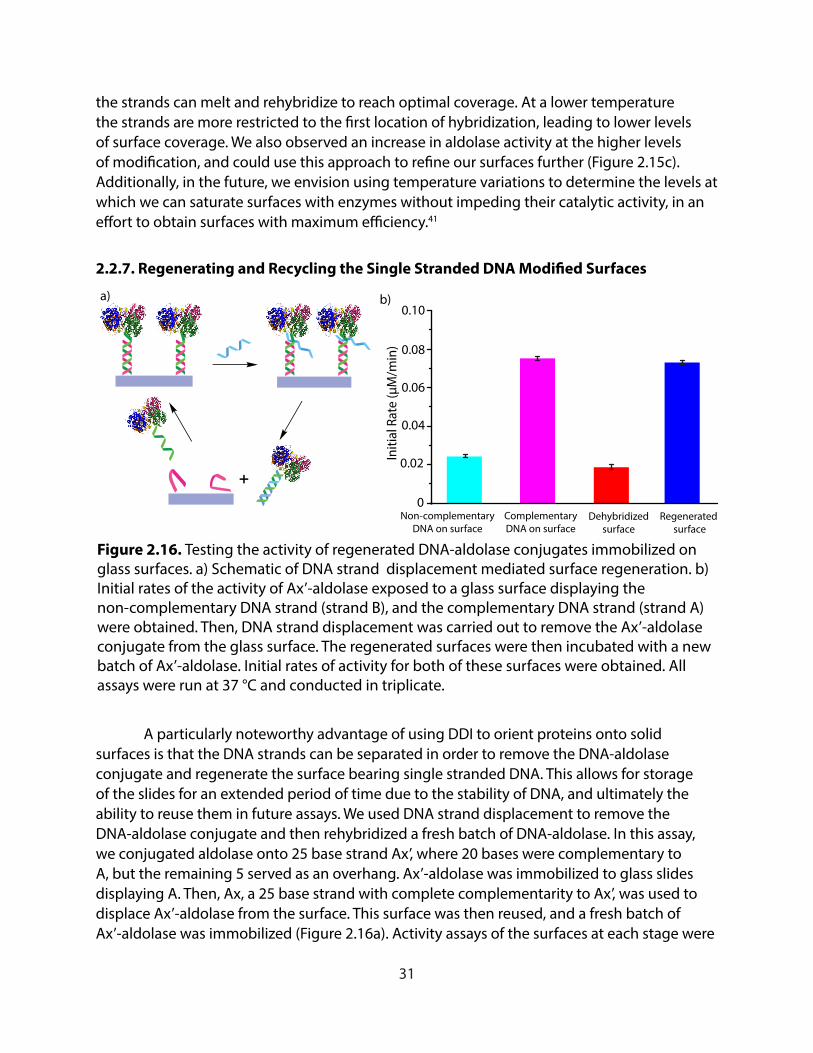
31
the strands can melt and rehybridize to reach optimal coverage. At a lower temperature the strands are more restricted to the first location of hybridization, leading to lower levels of surface coverage. We also observed an increase in aldolase activity at the higher levels of modification, and could use this approach to refine our surfaces further (Figure 2.15c). Additionally, in the future, we envision using temperature variations to determine the levels at which we can saturate surfaces with enzymes without impeding their catalytic activity, in an effort to obtain surfaces with maximum efficiency.41
2.2.7. Regenerating and Recycling the Single Stranded DNA Modified Surfaces
A particularly noteworthy advantage of using DDI to orient proteins onto solid surfaces is that the DNA strands can be separated in order to remove the DNA-aldolase conjugate and regenerate the surface bearing single stranded DNA. This allows for storage of the slides for an extended period of time due to the stability of DNA, and ultimately the ability to reuse them in future assays. We used DNA strand displacement to remove the DNA-aldolase conjugate and then rehybridized a fresh batch of DNA-aldolase. In this assay, we conjugated aldolase onto 25 base strand Ax’, where 20 bases were complementary to A, but the remaining 5 served as an overhang. Ax’-aldolase was immobilized to glass slides displaying A. Then, Ax, a 25 base strand with complete complementarity to Ax’, was used to displace Ax’-aldolase from the surface. This surface was then reused, and a fresh batch of Ax’-aldolase was immobilized (Figure 2.16a). Activity assays of the surfaces at each stage were
a) b)0.10
0.08
0.06
0.04
0.02
0
Initi
al R
ate
(μM
/min
)
Regenerated surface
Dehybridizedsurface
ComplementaryDNA on surface
Non-complementaryDNA on surface
+
Figure 2.16. Testing the activity of regenerated DNA-aldolase conjugates immobilized on glass surfaces. a) Schematic of DNA strand displacement mediated surface regeneration. b) Initial rates of the activity of Ax’-aldolase exposed to a glass surface displaying the non-complementary DNA strand (strand B), and the complementary DNA strand (strand A) were obtained. Then, DNA strand displacement was carried out to remove the Ax’-aldolase conjugate from the glass surface. The regenerated surfaces were then incubated with a new batch of Ax’-aldolase. Initial rates of activity for both of these surfaces were obtained. All assays were run at 37 °C and conducted in triplicate.
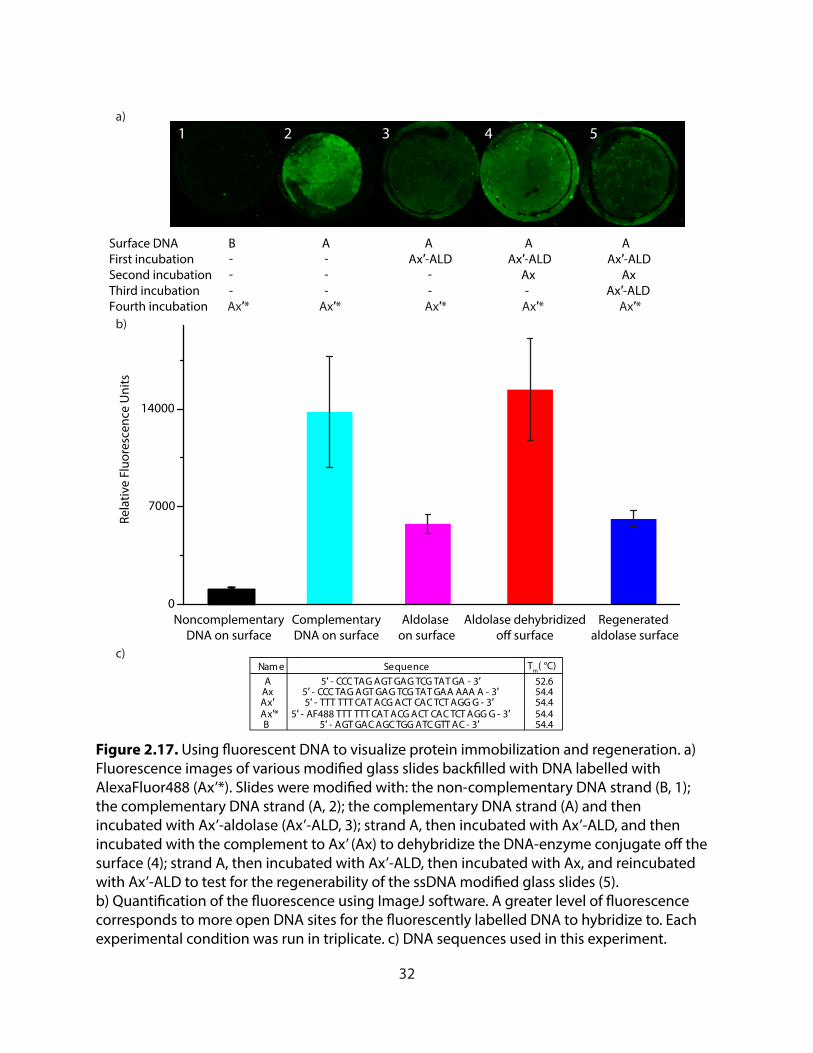
32
a)
b)
0
7000
14000
Rela
tive
Fluo
resc
ence
Uni
ts
Regenerated aldolase surface
Aldolase dehybridizedo� surface
Aldolase on surface
NoncomplementaryDNA on surface
ComplementaryDNA on surface
Surface DNA B A A A AFirst incubation Ax′-ALD Ax′-ALD Ax′-ALDSecond incubation Ax Ax Third incubation Ax′-ALDFourth incubation Ax′* Ax′* Ax′* Ax′* Ax′*
1 2 3 4 5
c)Nam e Sequence Tm( °C)
A 5′ - CCC TAG AGT GAG TCG TAT GA - 3′ 52.6
B 5′ - AGT GAC AGC TGG ATC GTT AC - 3′ 54.4
Ax′ Ax
5′ - AF488 TTT TTT CAT ACG ACT CAC TCT AGG G - 3′ Ax′*
5′ - CCC TAG AGT GAG TCG TAT GAA AAA A - 3′5′ - TTT TTT CAT ACG ACT CAC TCT AGG G - 3′
54.454.454.4
--- -
--- -
-
Figure 2.17. Using �uorescent DNA to visualize protein immobilization and regeneration. a) Fluorescence images of various modi�ed glass slides back�lled with DNA labelled with AlexaFluor488 (Ax’*). Slides were modi�ed with: the non-complementary DNA strand (B, 1); the complementary DNA strand (A, 2); the complementary DNA strand (A) and then incubated with Ax’-aldolase (Ax’-ALD, 3); strand A, then incubated with Ax’-ALD, and then incubated with the complement to Ax’ (Ax) to dehybridize the DNA-enzyme conjugate o� the surface (4); strand A, then incubated with Ax’-ALD, then incubated with Ax, and reincubated with Ax’-ALD to test for the regenerability of the ssDNA modi�ed glass slides (5). b) Quanti�cation of the �uorescence using ImageJ software. A greater level of �uorescence corresponds to more open DNA sites for the �uorescently labelled DNA to hybridize to. Each experimental condition was run in triplicate. c) DNA sequences used in this experiment.
33
carried out, and as seen in Figure 2.16b, the activity of aldolase immobilized on fresh glass slides remained consistent with the activity observed on aldolase that was immobilized on a regenerated glass slide. Fluorescence studies also corroborated these trends (Figure 2.17).
The ability to recycle the DNA modified glass slides will be of particular use for slides with more complex DNA patterns. It should be possible to pattern the glass with multiple different DNA strands with spatial control, creating an ordered array that would selectively bind multiple enzymes, allowing for the catalysis of a complex series of reactions.
2.3. Conclusions
In this work, we have prepared a single class of aminophenol substituted DNA strands and used them to modify both glass surfaces and protein N-termini. By piecing together each component, we have developed a step-by-step platform for producing oriented displays of proteins on glass surfaces. We have qualitatively verified our chemistry at each stage through fluorescence studies and AFM, and have also demonstrated its utility by testing the enzymatic activity of surface immobilized aldolase. This allows for the oriented immobilization of proteins with an adjustable spacer, where the enzyme can be reused in multiple cycles. Additionally, through DNA strand displacement, we have successfully regenerated the single stranded DNA bearing glass surfaces, and we have shown them to be reusable in subsequent hybridization assays. The chemistry involved in attaching the first strand of DNA to the surface is convenient, quick, stable, and works on inexpensive glass slides. The conjugation of the complementary DNA strands to proteins is biocompatible, quick, and only requires low concentrations of the coupling partners. In addition, because the native N-terminal amine is being targeted as the attachment site, it can be applied to a large scope of proteins with minimal genetic engineering being required, this could include thermostable enzymes which would give longer lifetimes.
Because we have used DNA hybridization as our mode of protein attachment, the easily accessible diversity of DNA strands offer a wide range of attachment handles, both in terms of linker length and rigidity. Additionally, the generalizable nature of this DDI method should facilitate the immobilization of a variety of proteins. Given all of these advantages provided by this approach, we seek to enhance this platform further in the future.
Taking advantage of the transparent nature of the glass surfaces used in these studies, we are also seeking to characterize these surfaces using alternative spectroscopic techniques, such as Sum Frequency Generation and X-Ray Photoelectron Spectroscopy, to gain information about the orientation and coverage of the protein.4,42,43
2.4. Materials and Methods
2.4.1. General Procedures and Materials
Unless otherwise noted, the chemicals and solvents used were of analytical grade and were used as received from commercial sources. Water (dd-H2O) used as a reaction solvent
34
and in biological procedures was deionized using a Barnstead NANOpure purification system (ThermoFisher, Waltham, MA). Aldolase from rabbit muscle, glyceraldehyde-3-phosphate dehydrogenase from rabbit muscle, NAD+, NADH and Fructose-1,6-bisphosphate was obtained from Aldrich (St. Louis, MO). Single stranded 5’ aminated or fluorophore labeled DNA molecules were purchased from Integrated DNA Technologies. Absorbance measurements of samples in 24 and 96–well plates were obtained on a Tecan Infinite 200 Pro plate reader. Fluorescence images of glass slides were taken on a Typhoon 9410 variable mode imager (Amersham Biosciences).
2.4.2. Instrumentation and Sample Analysis
NMR1H spectra were measured with a Bruker AVQ-400 (400 MHz, 100 MHz) spectrometer.
Mass Spectrometry of DNA strandsMatrix assisted laser desorption-ionization time-of-flight mass spectrometry (MALDI-
TOF MS) was performed on a Voyager-DE system (PerSeptive Biosystems, USA) and data were analyzed using Data Explorer software. Oligonucleotide samples were co-crystallized using 3-hydroxypicolinic acid: ammonium citrate solution (9:1) in 1:1 acetonitrile (MeCN) to H2O.
Atomic Force Microscopy
The Agilent 5500 system (Keysight Technologies Inc., Santa Rose, CA, USA) was used for AFM high resolution imaging of the surface modification on mica. Non-contact AFM images were obtained under dry nitrogen conditions (<1%RH) using Tap150Al-G probes (Innovative Solutions Bulgaria Ltd., Sofia, Bulgaria) with a nominal resonant frequency value of 150 kHz. Freshly cleaved muscovite mica, V1 quality (Electron Microscopy Sciences, Hatfield, PA, USA) was used as AFM substrates for surface modification. The AFM images were analyzed using Gwyddion SPM data analysis software.
Full Length Protein Mass Spectrometry
Proteins and protein conjugates were analyzed on an Agilent 6224 Time-of-Flight (TOF) mass spectrometer with a dual electrospray source connected in-line with an Agilent 1200 series HPLC (Agilent Technologies, USA). Chromatography was performed using a Proswift RP-4H (Thermo Scientific, USA) column with a H2O/MeCN gradient mobile phase containing 0.1% formic acid. Mass spectra of proteins and protein conjugates were deconvoluted with the MassHunter Qualitative Analysis Suite B.05 (Agilent Technologies, USA).
Liquid Chromatography/Tandem Mass Spectrometry.
High-resolution electrospray ionization (ESI) and liquid chromatography with tandem mass spectrometry detection (LC-MS/MS) mass spectra were obtained at the UC Berkeley QB3/Chemistry Mass Spectrometry Facility.
35
Trypsin-digested protein samples were analyzed using a Thermo Dionex UltiMate3000 RSLCnano liquid chromatograph that was connected in-line with an LTQ-Orbitrap-XL mass spectrometer equipped with a nanoelectrospray ionization (nanoESI) source (Thermo Fisher Scientific, Waltham, MA). The LC was equipped with a C18 analytical column (Acclaim® PepMap RSLC, 150 mm length × 0.075 mm inner diameter, 2 μm particles, 100 Å pores, Thermo) and a 1 μL sample loop. Acetonitrile, formic acid (Fisher Optima grade, 99.9%), and water purified to a resistivity of 18.2 MΩ·cm (at 25 °C) using a Milli-Q Gradient ultrapure water purification system (Millipore, Billerica, MA) were used to prepare mobile phase solvents. Solvent A was 99.9% water/0.1% formic acid and solvent B was 99.9% acetonitrile/0.1% formic acid (v/v). The elution program consisted of isocratic flow at 2% B for 4 min, a linear gradient to 30% B over 38 min, isocratic flow at 95% B for 6 min, and isocratic flow at 2% B for 12 min, at a flow rate of 300 nL/min. Full-scan mass spectra were acquired in the positive ion mode over the range m/z = 350 to 1600 using the Orbitrap mass analyzer, in profile format, with a mass resolution setting of 60,000 (at m/z = 400, measured at full width at half-maximum peak height, FWHM). In the data-dependent mode, the eight most intense ions exceeding an intensity threshold of 20,000 counts were selected from each full-scan mass spectrum for tandem mass spectrometry (MS/MS) analysis using collision-induced dissociation (CID). Data acquisition and analysis were performed using Xcalibur (version 2.0.7) and Proteome Discoverer software (version 1.3, Thermo), respectively. Peptide identifications were validated by manual inspection of MS/MS spectra, i.e., to check for the presence of y-type and b-type fragment ions that identify the peptide sequences.44
2.4.3. Preparation of Aniline Functionalized Glass Slides
Synthesis of 3-(4-azidophenyl)-N-(3-trimethoxysilylpropyl) Propanamide (Phenylazide Silane)
Phenylazide silane was synthesized following a previously pubished protocol.32 Briefly, to a solution of 3-(4-azidophenyl) propionic acid (574 mg, 3.0 mmol) in 90 mL of anhydrous THF under positive nitrogen pressure were added DIPEA (0.7 mL, 7.5 mmol, excess) and pentafluorphenyl trifluoroacetate (0.64 mL, 3.75 mmol), which was added slowly over 20 min, resulting in the formation of dense, white fumes. The reaction was stirred for 2 h at RT. To this solution was added 3-aminopropyl trimethoxysilane (0.57 mL, 3.3 mmol), and the resulting solution was stirred under nitrogen at RT for 18 h. The solvent was then removed using a rotary evaporator. After purification by flash chromatography (100% EtOAc), a light yellow oil was obtained, and confirmed by NMR.
Modification of Glass Slides with 3-(4-azidophenyl)-N-(3-trimethoxysilylpropyl) Propanamide
Circular glass slides (Fisher Scientific, 15 mm diameter, 0.17-0.25 mm thick) were sonicated (Cole-Parmer Ultrasonic Cleaner 8890-R-MTH) for 2 min in acetone and isopropanol consecutively, then immersed in Nanopure water. The slides were dried with N2 and then cleaned with oxygen plasma (Plasma Equipment Technical Services, Inc, PETS reactive ion etcher, RIE-1) at 100 W (~0.2 Torr) for 5 min. Following plasma cleaning, the slides were immersed in a solution of 25 mM 3-(4-azidophenyl)-N-(3-trimethoxysilylpropyl) propanamide
36
in methanol containing 1% v/v water and 148 mM acetic acid. The slides were incubated in this solution at RT for 2 h with stirring, after which they were rinsed in a solution of 148 mM acetic acid in methanol for 2 minutes. The slides were then rinsed with pure methanol, and finally dried with a stream of N2. After drying, the slides were cured in an oven at 110 °C for a minimum of 12 h to promote covalent modification of the glass surface. These phenylazide coated glass slides were stored in the dark at RT in a dessicator until the azide groups were reduced to the anilines, as described below. The silanization solution could be reused a minimum of six times with no change in performance if stored at -20 °C between uses.
Reduction of Phenylazide Functionalized Glass Slides to Aniline Functionalized Glass Slides
Phenylazide modified slides were submerged in a solution of 50 mM TCEP in 200 mM sodium phosphate buffer at pH 7.5 and incubated at RT with stirring for 30 min. After reduction, the slides were rinsed in Nanopure water and dried with a stream of N2. The aniline displaying glass slides were stored at RT in a desiccator until use.
2.4.4. Synthesis of Aminophenol-DNA
Amine-modified DNA was dissolved to 2.5 mM. The reaction conditions describe the generalized procedure for the modification of amine functionalized DNA. [Representative DNA strand A: 5’/5AmMC6/ CCC TAG AGT GAG TCG TAT GA-3’ (5AmMC6 = 6-aminohexyl phosphate)]. To a solution of 125 μL of 100 mM pH 8 phosphate buffer was added 125 μL of a 2.5 mM amine DNA solution (0.31 μmol). To this were added 150 μL of DMF and 100 μL of a ~500 mM solution of nitrophenol-NHS (~50 μmol) in DMSO. 3(4-hydroxy-3-nitrophenyl) propionic acid NHS ester (nitrophenol-NHS) was prepared following a previously published protocol.36 The solution was shaken for at least 4 h. This solution was added to a NAP-5 column (GE Healthcare), equilibrated and eluted with nanopure water. To the resulting solution was added 53 μL of 200 mM Na2S2O4 to reduce the nitrophenol to the desired aminophenol. The Na2S2O4 was stored in a dessicator at RT, and a 200 mM stock solution was prepared fresh in 0.2 M phosphate buffer, pH 6.5 before addition. The solution was shaken for at least 20 minutes before being directly loaded onto a NAP-10 column, and the elution process was repeated. The eluent was lyophilized, yielding ~1.0 mg of a white solid (50%). The DNA was prepared via C-18 ziptip for MADLI-TOF analysis and modification was confirmed. Aminophenol-DNA stock solutions were prepared at 1 mM in water and stored at -20 °C for future use.2
2.4.5. Patterning Single Stranded DNA on Aniline Functionalized Slides Using Potassium Ferricyanide Mediated Oxidative Coupling
Aniline functionalized 15 mm circular glass slides were modified with ssDNA. A 4.5 μL drop of 50 μM aminophenol-modified DNA, 1 mM K3Fe(CN)6, and 250 mM NaCl in 10 mM pH 6.5 phosphate buffer was placed on the center of the aniline glass slide. Another unmodified glass slide was placed on top of the drop causing the DNA solution to spread over the slide in
37
a sandwich. Slides were incubated in the dark at RT for 1 h. Then, slides were dipped in water and the unmodified glass slides were removed from the DNA-modified glass. DNA-modified glass slides were rinsed in 0.4% SDS and then 10 mM pH 6.5 phosphate buffered saline (PBS) each at RT for 5 min with stirring. Slides were rinsed in Nanopure water and dried with a stream of N2. The single stranded DNA displaying glass slides were stored at RT in a desiccator until use.
2.4.6. Annealing of Complementary DNA Strands on Single Stranded DNA Modified Glass Slides
Glass slides (15 mm in diameter) coated with ssDNA were incubated with the complementary strand for hybridization. PDMS wells were used to form a well on top of the glass slides, and 200 μL of 0.05 μM DNA in 5x SSC + 0.1% Tween 20 was added to the well, just enough to cover the top of the slide. Slides were incubated for 1h in humidifying conditions on an orbital shaker at RT. Following incubation, the PDMS wells were removed and the glass slides were rinsed in 5x SSC + 0.1% Tween 20 three times for 1 min and then in 1x SSC + 0.1% Tween 20 two times for 10 min. Following the rinses, glass slides were rinsed in water, dried with nitrogen and stored for subsequent use and analysis. Slides with fluorescent DNA strands were analyzed using a Typhoon 9410 variable mode imager. Controls involved DNA strand mismatches chosen such that hybridization should not occur. (20X SSC buffer: 0.3 M sodium citrate dihydrate, 3 M NaCl, pH 7.0)
2.4.7. Capping Free Cysteines on Aldolase with N-ethyl Maleimide
Free cysteines were capped from potential modification during subsequent oxidative coupling steps by reaction with N-ethyl maleimide (NEM). To a solution of aldolase from rabbit muscle (100 μL of a 118 μM solution in 100 mM pH 7.0 phosphate buffer) was added NEM (5 μL of a 100 mM solution in DMSO) and 95 uL of 100 mM pH 7.0 phosphate buffer. The reaction mixture was incubated at RT for 3 h and then the excess NEM was removed by repeated (6 times) centrifugal filtration against a 30 kDa MWCO membrane.
2.4.8. Synthesis of DNA-Aldolase Bioconjugate
To the aldolase (20 μM) in 10 mM phosphate buffer, pH 7.5 was added 5 equiv. of the o-aminophenol modified DNA (100 μM). The solution was briefly vortexed and then 10 equiv. (relative to the o-aminophenol) of K3Fe(CN)6 (as a 10 mM stock solution in water) was added. After 30 min, the reaction was purified by repeated (>12 times) centrifugal filtration against a 30 kDa MWCO membrane (Millipore), allowing for purification of aldolase and aldolase-DNA conjugate from free DNA. Modification was monitored by a combination of SDS-PAGE and a BCA assay (kit purchased from Thermo Scientific).
38
2.4.9. Synthesis of Fluorescent DNA-Aldolase Conjugate
To aldolase-DNA conjugate (15 μM based on DNA concentration) in 100 mM carbonate buffer, pH 10.0 was added 25 equiv. of commercially purchased Oregon Green NHS ester. This solution was vortexed for 1 h. The reaction was purified by repeated (>6 times) centrifugal filtration against a 30 kDa MWCO membrane (Millipore) into 25 mM phosphate buffer, pH 8.5, allowing for purification of fluorescent aldolase-DNA conjugate from free dye.
2.4.10. Characterization of DNA-Aldolase Conjugate
For protein analysis, high performance liquid chromatography (HPLC) was carried out on an Agilent Technologies 1260 Infinity LC system with an anion exchange column (Agilent Bio WAX, NP 1.7, 4.6x50 mm). Solvents used were: Solvent A: 20 mM bis-trispropane, pH 6.9; Solvent B: 20 mM bis-trispropane, 2M NaCl, pH 6.9. Samples were injected and then solvent mixture was increased from 0% B to 65% B over 30 min, then back to 0% B over 0.1 min, and held at 0% B for 12 min to re-equilibrate. Column held at 37 °C. Fluorescence detection was used with 290 nm excitation and 340 nm emission. Modification levels were calculated by dividing the peak area of unmodified aldolase by the sum of the modified and unmodified aldolase peak area.
Additionally, sodium dodecyl sulfate-polyacrylamide gel electrophoresis (SDS-PAGE) was carried out on a Mini Gel Tank apparatus from Life Technologies following the manufacturer’s protocols. MOPS buffer purchased from Life Technologies was used as the electrode buffer. All protein electrophoresis samples were heated for at least 15 minutes at 100 °C in the presence of 1,4-dithiothreitol (DTT) to ensure reduction of any disulfide bonds. NuPAGE Bis-Tris Mini Gels (12%) were run for 50 min at 200 V to allow good resolution of bands. Commercially available markers (Bio Rad) were applied to at least one lane of each gel for assignment of apparent molecular masses. Visualization of protein bands was accomplished by staining with Coomassie Brilliant Blue R-250. Gel imaging was performed on a Gel Doc EZTM Imager (Bio Rad). Image Lab software was used to determine the level of modification by optical densitometry.
Once the level of modification was determined, a BCA assay was run following the manufacturer’s protocols to determine the total protein concentration of the stock solution.
2.4.11. Activity Assay of Aldolase in Solution
Activities of aldolase, unmodified and modified, were meaured in solution in a 96-well plate. Each well had aldolase, NAD+, GAPDH, and FBP added to it such that the final concentrations were 20 nM aldolase, 1 mM NAD+, 1.35 μM GAPDH, and 100 μM FBP in 250 μL total reaction volume of the activity assay buffer (20 mM potassium phosphate, 10 mM potassium pyrophosphate, 3 μM dithiothreitol (DTT) pH 8.5). Prior to adding the FBP, the plate was equilibrated to 37 °C. After the addition of FBP, the absorbance at 340 nm was measured every 2 min for 5 h while holding the temperature at 37 °C (Tecan Infinite 200 Pro plate reader). Samples were run in triplicate.
39
2.4.12. Immobilization of DNA-Aldolase onto Glass Surfaces and Analysis of Activity
Glass slides (15mm in diameter) coated with ssDNA (strands A and B) were loaded in a 24 well plate. These slides were incubated with DNA-aldolase conjugate (strand A’) for hybridization. PDMS wells were used to form a well on top of the glass slides while in the 24-well plate, and 200 μL of 0.025 μM conjugate (based on DNA concentration) in 5x SSC + 0.1% Tween 20 was added to the well, just enough to cover the top of the slide. Slides were incubated for 1 h in humidifying conditions on an orbital shaker at RT (unless otherwise noted). Following incubation, 2 mL of 5x SSC + 0.1% Tween 20 were added to the wells and the PDMS wells were removed. The glass slides were rinsed in 5x SSC + 0.1% Tween 20 via repeated pipetting and then the plate was shaken twice for ten minutes with the wells filled with 2 mL of 1x SSC + 0.1% Tween 20. At this point, the PDMS wells were removed from the glass slides, but the slides remained immersed in solution within the 24-well plate.
After rinsing with SSC, the buffer was exchanged into the activity assay buffer (20 mM potassium phosphate, 10 mM potassium pyrophosphate, 3 μM dithiothreitol (DTT) pH 8.5). Each well had NAD+, GAPDH, and FBP added to it such that the final concentrations were 1 mM NAD+, 1.35 μM GAPDH, and 100 μM FBP in 500 μL total volume. Prior to adding the FBP, the plate was equilibrated to 37 °C. A positive control was also run with the addition of 20 nM DNA-aldolase conjugate (strand A’) in solution with wells containing a glass slide that had the non-complementary DNA strand attached to it. Immediately after the addition of FBP, the absorbance at 340 nm was measured every 5 min for 16 h while holding the temperature at 37 °C (Tecan Infinite 200 Pro plate reader). A standard curve with NADH was also prepared on the same plate, in concentrations ranging from 0-100 μM. All samples were run in triplicate.
2.4.13. Reusing Surfaces with Immobilized Aldolase
After running the activity assay, the 24-well plate was removed from the plate reader and stored at 4 °C until further use (~6 h). The used wells had 2 mL of fresh activity assay buffer added to them and then 2 mL were drawn out, using a pipet. This was repeated at least two more times, so that the wells were rinsed without allowing the slides to dry out. After rinsing, each well had NAD+, GAPDH, and FBP added to it such that the final concentrations were 1 mM NAD+, 1.35 μM GAPDH, and 100 μM FBP in 500 μL total volume. Prior to adding the FBP, the plate was heated to 37 °C. After the addition of FBP, the absorbance at 340 nm was measured every 5 min for 16 h while holding the plate at 37 °C (Tecan Infinite 200 Pro plate reader). All samples were run in triplicate.
2.4.14. Regenerating Surfaces with Immobilized Aldolase
Glass slides displaying strand A were modified with DNA-aldolase (strand Ax’) and were tested for activity in a 24-well plate assay, as described above. Each well had 1 mL of 25 μM complementary DNA (strand Ax) in 5x SSC + 0.1% Tween 20 added to it to dehybridize the DNA-aldolase from the surface. Slides were incubated for 1 h in humidifying conditions on an orbital shaker at 37 °C. Following incubation, 2 mL of 5x SSC + 0.1% Tween 20 were added to the wells. The glass slides were rinsed in 5x SSC + 0.1% Tween 20 via repeated pipetting and

40
then the plate was shaken twice for ten minutes with the wells filled with 2 mL of 1x SSC + 0.1% Tween 20. All liquid was drawn out of each well. PDMS wells were used to form a well on top of the glass slides while in the 24-well plate, and 200 μL of 0.025 μM conjugate (based on DNA concentration) in 5x SSC + 0.1% Tween 20 was added to the well, just enough to cover the top of the slide. Slides were incubated and rinsed as before.
After rinsing with SSC, the buffer was exchanged into the activity assay buffer (20 mM potassium phosphate, 10 mM potassium pyrophosphate, 3 μM dithiothreitol (DTT) pH 8.5). Each well had NAD+, GAPDH, and FBP added to it such that the final concentrations were 1 mM NAD+, 1.35 μM GAPDH, and 100 μM FBP in 500 μL total volume. Prior to adding the FBP, the plate was equilibrated to 37 °C. A positive control was also run with the addition of 20 nM DNA-aldolase conjugate (strand Ax’) in solution. After the addition of FBP, the absorbance at 340 nm was measured every 5 min for 16 h while holding the temperature at 37 °C (Tecan Infinite 200 Pro plate reader). A standard curve with NADH was also prepared on the same plate, in concentrations ranging from 0-100 μM.
2.4.15. Atomic Force Microscopy Studies
Mica surfaces were used in the AFM studies. Surface modification protocols on mica were identical to those outlined above for glass slides. In lieu of sonication, a fresh mica layer was exposed just before immersing it into the 3-(4-azidophenyl)-N-(3-trimethoxysilylpropyl) propanamide solution. All subsequent steps remained unchanged when preparing surfaces functionalized with a) aniline, b) single stranded DNA (sequence A), c) double stranded DNA (sequence A’ hybridized to sequence A), and d) immobilized aldolase via DNA hybridization (A’-aldolase hybridized to A).
2.4.16. Capping of Free Cysteines with 5,5’-dithio-bis-(2-nitrobenzoic acid) (DTNB)
Free cysteines were protected from potential modification by disulfide formation with 5,5’-dithiobis-(2-nitrobenzoic acid), (DTNB). To a solution of aldolase (780 μL of a 100 μM solution) was added DTNB (20 μL of a 20 mM solution in 100 mM phosphate buffer, pH 7.2 with 1 mM EDTA). The reaction mixture was incubated at RT for 15-30 min and then the excess DTNB was removed by repeated (6 times) centrifugal filtration against a 10 kDa MWCO membrane. To reduce the disulfide, approximately 25 equiv. of TCEP (as a 0.5 M solution, pH 7.0) was added to the protein sample. The reaction mixture was incubated at RT for 15 min and then purified using a 0.5 mL centrifugal filter with a 10 kDa MWCO.
2.4.17. Modification of Aldolase with a Small Molecule o-aminophenol Reagent at the N-terminus for Mass Spectrometry Analysis
To a solution of aldolase (20 μM) in 10 mM phosphate buffer, pH 7.5 was added 5 equiv. of 2-amino-p-cresol (100 μM). The solution was briefly vortexed and then 10 equiv. of K3Fe(CN)6 (1 mM as a solution in 10 mM phosphate buffer, pH 7.5) was added. After 30 min, the reaction was purified using a 0.5 mL centrifugal filter with a 10 kDa MWCO.
41
2.4.18. Trypsin Digestion of a Small Molecule Modified Aldolase for MS/MS Analysis.
For the tryptic digest, a procedure from UC Berkeley QB3 Mass Spectrometry Facility was followed.45-47 To 5 μL of a 765 μM protein stock was added 20 μL of 8M urea and 0.5 μL of 500 mM DTT, all in 50 Tris buffer, pH 7.0. After incubation at 55 °C for 20 minues, 6 μL of a freshly made 100 mM iodoacetamide solution was added. The resulting solution was incubated at RT for 30 minutes in the dark. After incubation, 2 uL of 500 mM DTT were added. After incubation at RT for 20 minutes, 6 μL of the alkylyated protein from this sample was used for digestion. To 6 uL was added 2.5 uL of 1 M Tris, pH 7.0, 0.5 μL of 100 mM CaCl2 0.5 μL of 1 μg/μl trypsin (Promega), and 41.5 μL water. This solution was allowed to incubate overnight at RT for protein digestion to occur prior to sample analysis.
2.5. References
1. Witham, C. A.; Huang, W. Y.; Tsung, C. K.; Kuhn, J. N.; Somorjai, G. A.; Toste, F. D., Converting homogeneous to heterogeneous in electrophilic catalysis using monodisperse metal nanoparticles. Nat. Chem. 2010, 2, 36–41.
2. Huang, W. Y.; Liu, J. H.-C.; Alayoglu, P.; Li, Y. M.; Witham, C. A.; Tsung, C. K.; Toste, F. D.; Somorjai, G. A., Highly Active Heterogeneous Palladium Nanoparticle Catalysts for Homogeneous Electrophilic Reactions in Solution and the Utilization of a Continuous Flow Reactor. J. Am. Chem. Soc. 2010, 132, 16771–16773.
3. Li, Y.; Liu, J. H.−C.; Witham, C. A.; Huang, W.; Marcus, M. A.; Fakra, S. C.; Alayoglu, P.; Zhu, Z.; Thompson, C. M.; Arjun, A.; Lee, K.; Gross, E.; Toste, F. D.; Somorjai, G. A., A Pt-Cluster-Based Heterogeneous Catalyst for Homogeneous Catalytic Reactions: X-ray Absorption Spectroscopy and Reaction Kinetic Studies of Their Activity and Stability against Leaching. J. Am. Chem. Soc. 2011, 133, 13527-13533.
4. Baio, J. E.; Weidner, T.; Baugh, L.; Gamble, L. J.; Stayton, P. S.; Castner, D. G., Probing the orientation of electrostatically immobilized protein G B1 by time of flight aecondary ion spectrometry, sum frequency generation and near-edge x-ray adsorption fine structure spectroscopy. Langmuir 2012, 28, 2107-2112.
5. Phizicky, E.; Bastiaens, P. I. H.; Zhu, H.; Snyder, M.; Fields, S., Protein analysis on a proteomic scale. Nature 2003, 422, 208–215.
6. Brady, D.; Jordaan, J., Advances in enzyme immobilization. Biotechnol. Lett. 2009, 31, 1639–1650.
7. Jonkheijm, P.; Weinrich, D.; SchrÖder, H.; Niemeyer, C. M.; Waldmann, H., Chemical strategies for generating protein biochips. Angew. Chem. Int. Ed. 2008, 47, 9618–9647.
8. Cha, T.; Guo, A.; Zhu, X., Enzymatic activity on a chip: The critical role of protein orientation. Proteomics 2005, 5, 416–419.
9. Vallières, K.; Chevallier, P.; Sarra-Bournet, C.; Turgeon, S.; Laroche, G., AFM imaging of immobilized fibronectin: Does the surface conjugation scheme affect the protein orientation/conformation? Langmuir 2007, 23, 9745–9751.
42
10. Camarero, J. A.; Kwon, Y.; Coleman, M. A., Chemoselective attachment of biologically active proteins to surfaces by expressed protein ligation and its application for “protein chip” fabrication. J Am Chem Soc. 2004, 126, 14730–14731.
11. Buhl, M.; VonhÖren, B.; Ravoo, B. J., Immobilization of enzymes via microcontact printing and thio-ene chemistry. Bioconjugate Chem. 2015, 26, 1017–1020.
12. Yeritsyan, H.E.; Gasparyan, V.K., Homogeneous immunoassay for human IgG using oriented hen egg IgY immobilized on gold sol nanoparticles. Microchim. Acta 2012, 176, 117-122.
13. Taniguchi, K.; Nomura, K.; Hata, Y.; Nishimura, T.; Ksami, Y.; Kuroda, A., The Si-tag for immobilizing proteins on a silica surface. Biotechnol Bioeng 2007, 96, 1023–1029.
14. Kindermann, M.; George, N.; Johnsson, N.; Johnsson, K., Covalent and site-specific immobilization of fusion proteins. J. Am. Chem. Soc. 2003, 125, 7810–7811.
15. Wong, L. S.; Thirlway, J.; Micklefield, J., Direct site-selective covalent immobilization catalyzed by a phosphopantetheinyl transferase. J. Am. Chem. Soc. 2008, 130, 12456–12464.
16. Abad, J. M.; Mertens, S. F. L.; Pita, M.; Fernandez, V. M.; Schiffrin, D. J., Functionalization of thioctic acid-capped gold nanoparticles for specific immobilization of histidine tagged proteins. J. Am. Chem. Soc. 2005, 127, 5689–5694.
17. Reynolds, N. P.; Tucker, J. D.; Davison, P. A.; Timney, J. A.; Hunter, C. N.; Leggett, G. J., Site-specific immobilization and micrometer and nanometer scale photopatterning of yellow fluorescent protein on glass surfaces. J. Am. Chem. Soc. 2009, 131, 896–897.
18. Hutsell, S. Q.; Kimple, R. J.; Siderovski, D. P.; Willard, F. S.; Kimple, A. J., High affinity immobilization of proteins using biotin and GST-based coupling strategies. Methods Mol. Biol. 2010, 627, 75–90.
19. Nimse, S. B.; Song, K.; Sonawane, M. D.; Sayyed, D. R.; Kim, T., Immobilization techniques for microarray: challenges and applications. Sensors 2014, 14, 22208–22229.
20. Niemeyer, C. M., Semisynthetic DNA-protein conjugates for biosensing and nanofabrication. Angew. Chem. Int. Ed. 2010, 49, 1200–1216.
21. Beaucage, S. L., Strategies in the preparation of DNA oligonucleotide arrays for siagnostic applications. Curr. Med. Chem. 2001, 8, 1213–1244.
22. Niemeyer, C. M.; Boldt, L; Ceyhan, B; Blohm, D., DNA-directed immobilization: Efficient, reversible, and site-selective surface binding of proteins by means of covalent DNA- streptavidin conjugates. Anal. Biochem. 1999, 268, 54–63.
23. Bauer, D.M.; Ahmed, I.; Vigovskaya, A.; Fruk, L., Clickable Tyrosine Binding Bifunctional Linkers for Preparation of DNA-Protein Conjugates Bioconjug Chem 2013, 24, 1094–1101.
24. Fruk, L.; MÜller, J.; Niemeyer, C. M., Kinetic analysis of semisynthetic peroxidase enzymes containing a covalent DNA-heme adduct as the cofactor. Chem. Eur. J. 2006, 12, 7448–7457.
43
25. Wold, E. D.; McBride, R.; Axup, J. Y.; Kazane, S. A.; Smider, V. V., Antibody microarrays utilizing site-specific antibody-oligonucleotide conjugates. Bioconjugate Chem. 2015, 26, 807–811.
26. Behrens, C. R.; Hooker, J. M., Obermeyer, A. C.; Romanini, D. W.; Katz, E. M.; Francis, M. B., Rapid chemoselective bioconjugation through the oxidative coupling of anilines and aminophenols. J. Am. Chem. Soc. 2011, 133, 16398–16401.
27. Witus, L.S.; Netirojjanakul, C.; Palla, K.S.; Muehl, E.M,; Weng, C.H.; Iavarone, A.T.; Francis, M.B., Site-specific protein transamination using N-methylpyridinium-4-carboxaldehyde. J. Am. Chem. Soc. 2013, 135, 17223–17229.
28. Scheck, R. A.; Dedeo, M. T.; Iavarone, A. T.; Francis, M. B., Optimization of a Biomimetic Transamination Reaction. J. Am. Chem. Soc. 2008, 130, 11762–11770.
29. Palla, K. S.; Witus, L. S.; Mackenzie, K. J.; Netirojjanakul, C.; Francis, M. B., Optimization and expansion of a site selective N-methylpyridinium-4-carboxaldehyde mediated transamination for bacterially expressed proteins. J. Am. Chem. Soc. 2015, 137, 1123–1129.
30. Tong, G. J.; Hsiao, S. C.; Carrico, Z. M.; Francis, M. B., Viral capsid DNA aptamer conjugates as multivalent cell-targeting vehicles. J. Am. Chem. Soc. 2009, 131, 11174–11178.
31. Netirojjanakul, C.; Witus, L. S.; Behrens, C. R.; Weng, C.; Iavarone, A. T.; Francis, M. B., Synthetically modified Fc domains as building blocks for immunotherapy applications. Chem. Sci. 2013, 4, 266–272.
32. El Muslemany, L. M.; Twite, A. A.; ElSohly, A. M.; Obermeyer, A. C.; Mathies, R. A.; Francis, M. B., Photoactivated bioconjugation between ortho-azidophenols and anilines: A facile approach to biomolecular photopatterning. J. Am. Chem. Soc. 2014, 136, 12600–12606.
33. Capehart, S. L.; Coyle, M. P.; Glasgow, J. E.; Francis, M.B., Controlled integration of gold nanoparticles and organic fluorophores using synthetically modified MS2 viral capsids. J. Am. Chem. Soc. 2013, 135, 3011–3016.
34. Capehart, S. L.; ElSohly, A. M.; Obermeyer, A. C.; Francis, M. B., Bioconjugation of Gold nanoparticles through the oxidative coupling of ortho-aminophenols and anilines. Bioconjugate Chem. 2014, 25, 1888–1892.
35. Obermeyer, A. C.; Jarman, J. B.; Netirojjanakul, C.; Francis, M. B., Mild Bioconjugation Through the Oxidative coupling of ortho-aminophenols and anilines with ferricyanide. Angew. Chem., Int. Ed. 2014, 53, 1057–1061.
36. Obermeyer, A.C.; Jarman, J.B.; Francis, M.B., N-Terminal modification of proteins with o-aminophenols. J. Am. Chem. Soc. 2014, 136, 9572–9579.
37. Windle, C. L.; MÜller, M.; Nelson, A.; Berry, A., Engineering aldolases as biocatalysts. Curr. Opin. Chem. Biol. 2014, 19, 25–33.
38. Rosen, C.B.; Kwant, R.L.; MacDonald, J.I.; Rao, M.; Francis, M. B., Capture and Recycling of Sortase A through Site-Specific Labeling with Lithocholic Acid. Angew. Chem. Int. Ed. 2016, 55, 8585-858.
44
39. Sasou, M.; Sugiyama, S.; Yoshino, T.; Ohtani, T., Molecular flat mica surface silanized with methyltrimethoxysilane for fixing and straightening DNA. Langmuir 2003, 19, 9845–9849.
40. Saha, B.; Saikia, J.; Das, G., Correlating enzyme density, conformation and activity on nanoparticle surfaces in highly functional bio-nanocomposites. Analyst 2015, 140, 532–542.
41. Seeman, N. C., Nanomaterials based on DNA Annu. Rev. Biochem. 2010, 79, 65–87.
42. Phillips, D. C.; York, R. L.; Mermut, O.; McCrea, K. R.; Ward, R. S.; Somorjai, G. A., Side chain, chain Length, and sequence effects on amphiphilic peptide adsorption at hydrophobic and hydrophilic surfaces studied by sum-frequency generation vibrational spectroscopy and quartz crystal microbalance. J. Phys. Chem. C. 2007, 111, 255-261.
43. York, R. L.; Browne, W. K.; Geissler, P. L.; Somorjai, G. A., Peptides adsorbed on hydrophobic surfaces—A sum frequency generation vibrational spectroscopy and modeling study. Isr. J. Chem. 2007, 47, 51-58.
44. Roepstorff, P.; Fohlman, J., Proposal for a common nomenclature for sequence ions in mass spectra of peptides. Biol. Mass Spectrum. 1984, 11, 601.
45. Rebecchi, K. R.; Go, E. P.; Xu, L.; Woodin, C. L.; Mure, M.; Desaire, H., A general protease digestion procedure for optimal protein sequence coverage and post-translational modifications analysis of recombinant glycoproteins: application to the characterization of human lysyl oxidase-like 2 glycosylation. Anal. Chem. 2011, 83, 8484–8491.
46. Hervey, W. J., IV; Strader, M. B.; Hurst, G. B., Comparison of digestion protocols for microgram quantities of enriched protein samples. J. Proteome Res. 2007, 6, 3054–3061.
47. Strader, M. B.; Tabb, D. L.; Hervey, W. J.; Pan, C.; Hurst, G. B., Efficient and specific trypsin digestion of microgram to nanogram quantities of proteins in organic-aqueous solvent systems. Anal. Chem. 2006, 78, 125–134.
45
Chapter 3
Characterization of DNA Surfaces via Sum Frequency Generation Vibrational Spectroscopy
Abstract
Sum frequency generation (SFG) vibrational spectroscopy is an inherently surface specific spectroscopic technique that can give information about the orientation and bonding of molecules on surfaces. SFG was used to study surfaces of DNA and enzymes that were tethered through DNA directed immobilization. It was seen that single-stranded DNA surfaces are disordered, while the double-stranded surfaces have a more rigid and ordered array of DNA. The immobilized enzyme does not have a spectra that is significantly different from the double-stranded DNA surface.
Portions of this work were performed in collaboration with Shanshan Yang
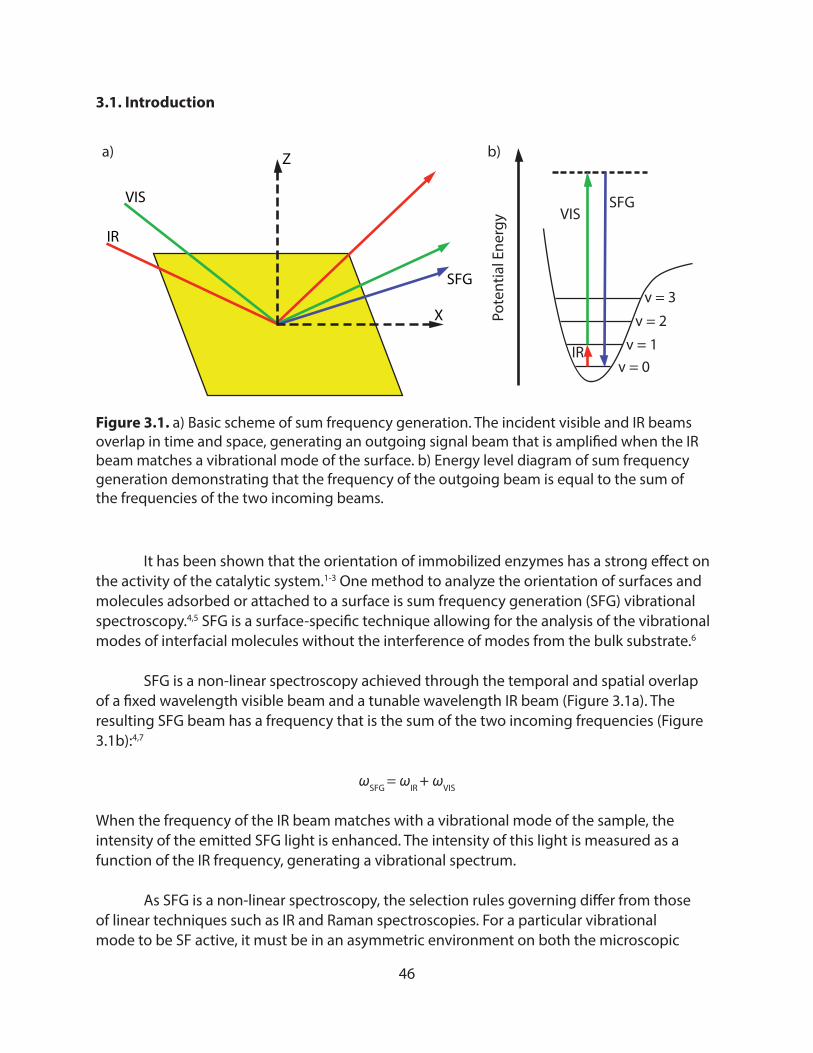
46
3.1. Introduction
It has been shown that the orientation of immobilized enzymes has a strong effect on the activity of the catalytic system.1-3 One method to analyze the orientation of surfaces and molecules adsorbed or attached to a surface is sum frequency generation (SFG) vibrational spectroscopy.4,5 SFG is a surface-specific technique allowing for the analysis of the vibrational modes of interfacial molecules without the interference of modes from the bulk substrate.6
SFG is a non-linear spectroscopy achieved through the temporal and spatial overlap of a fixed wavelength visible beam and a tunable wavelength IR beam (Figure 3.1a). The resulting SFG beam has a frequency that is the sum of the two incoming frequencies (Figure 3.1b):4,7
ωSFG = ωIR + ωVIS
When the frequency of the IR beam matches with a vibrational mode of the sample, the intensity of the emitted SFG light is enhanced. The intensity of this light is measured as a function of the IR frequency, generating a vibrational spectrum.
As SFG is a non-linear spectroscopy, the selection rules governing differ from those of linear techniques such as IR and Raman spectroscopies. For a particular vibrational mode to be SF active, it must be in an asymmetric environment on both the microscopic
v = 0v = 1
v = 2
v = 3
SFGVIS
IR
Pote
ntia
l Ene
rgy
Z
X
IR
VIS
SFG
a) b)
Figure 3.1. a) Basic scheme of sum frequency generation. The incident visible and IR beams overlap in time and space, generating an outgoing signal beam that is ampli�ed when the IR beam matches a vibrational mode of the surface. b) Energy level diagram of sum frequency generation demonstrating that the frequency of the outgoing beam is equal to the sum of the frequencies of the two incoming beams.
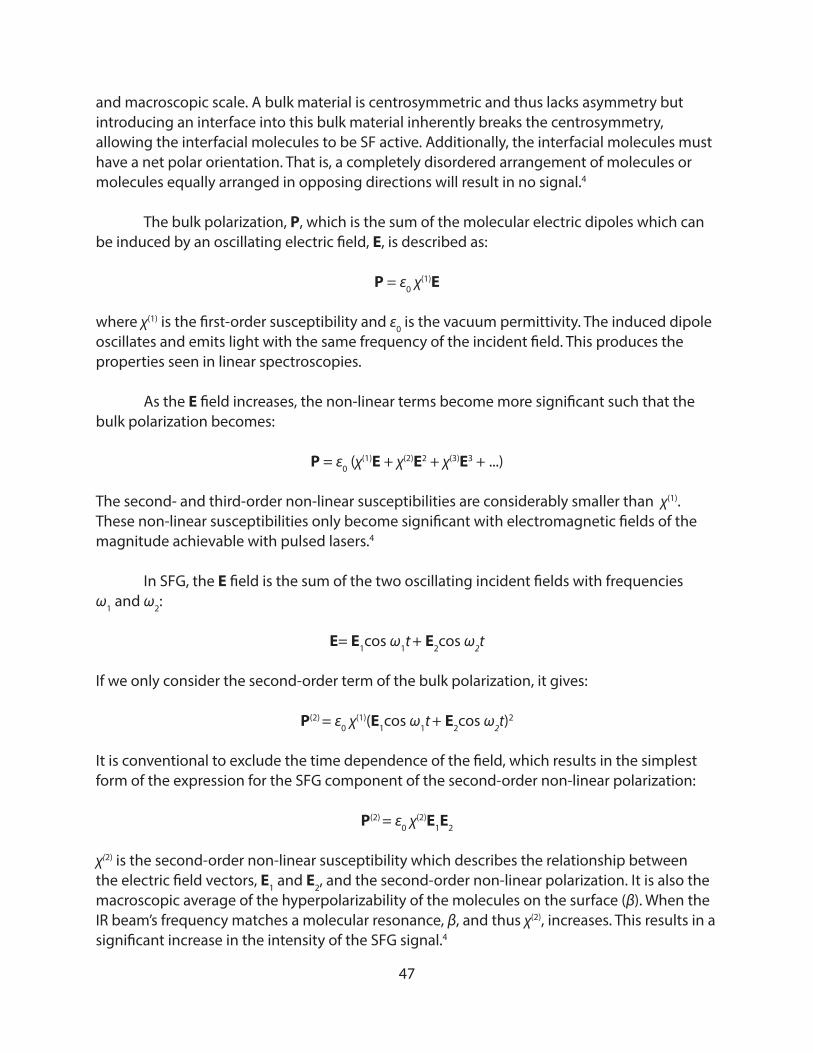
47
and macroscopic scale. A bulk material is centrosymmetric and thus lacks asymmetry but introducing an interface into this bulk material inherently breaks the centrosymmetry, allowing the interfacial molecules to be SF active. Additionally, the interfacial molecules must have a net polar orientation. That is, a completely disordered arrangement of molecules or molecules equally arranged in opposing directions will result in no signal.4
The bulk polarization, P, which is the sum of the molecular electric dipoles which can be induced by an oscillating electric field, E, is described as:
P = ε0 χ(1)E
where χ(1) is the first-order susceptibility and ε0 is the vacuum permittivity. The induced dipole oscillates and emits light with the same frequency of the incident field. This produces the properties seen in linear spectroscopies.
As the E field increases, the non-linear terms become more significant such that the bulk polarization becomes:
P = ε0 (χ(1)E + χ(2)E2 + χ(3)E3 + ...)
The second- and third-order non-linear susceptibilities are considerably smaller than χ(1). These non-linear susceptibilities only become significant with electromagnetic fields of the magnitude achievable with pulsed lasers.4
In SFG, the E field is the sum of the two oscillating incident fields with frequencies ω1 and ω2:
E= E1cos ω1t + E2cos ω2t
If we only consider the second-order term of the bulk polarization, it gives:
P(2) = ε0 χ(1)(E1cos ω1t + E2cos ω2t)2
It is conventional to exclude the time dependence of the field, which results in the simplest form of the expression for the SFG component of the second-order non-linear polarization:
P(2) = ε0 χ(2)E1E2
χ(2) is the second-order non-linear susceptibility which describes the relationship between the electric field vectors, E1 and E2, and the second-order non-linear polarization. It is also the macroscopic average of the hyperpolarizability of the molecules on the surface (β). When the IR beam’s frequency matches a molecular resonance, β, and thus χ(2), increases. This results in a significant increase in the intensity of the SFG signal.4
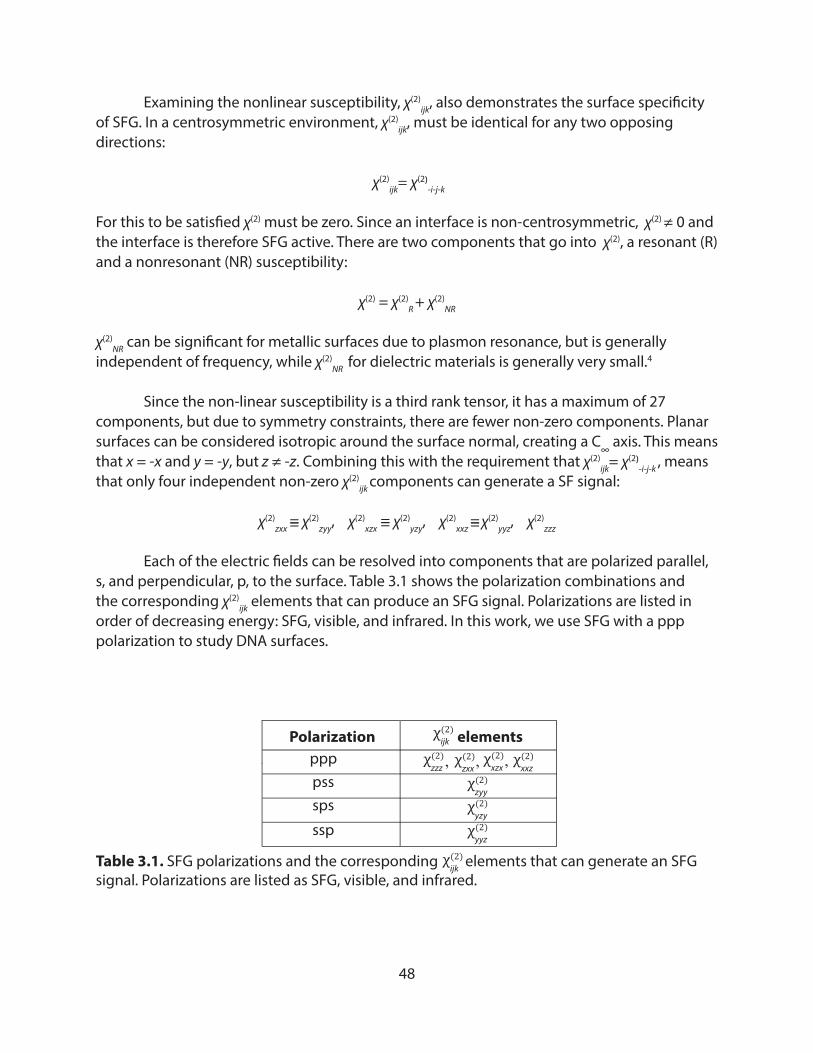
48
Examining the nonlinear susceptibility, χ(2)ijk, also demonstrates the surface specificity
of SFG. In a centrosymmetric environment, χ(2)ijk, must be identical for any two opposing
directions:
χ(2)ijk= χ(2)-i-j-k
For this to be satisfied χ(2) must be zero. Since an interface is non-centrosymmetric, χ(2) ≠ 0 and the interface is therefore SFG active. There are two components that go into χ(2), a resonant (R) and a nonresonant (NR) susceptibility:
χ(2) = χ(2)R + χ(2)
NR
χ(2)NR can be significant for metallic surfaces due to plasmon resonance, but is generally
independent of frequency, while χ(2)NR for dielectric materials is generally very small.4
Since the non-linear susceptibility is a third rank tensor, it has a maximum of 27 components, but due to symmetry constraints, there are fewer non-zero components. Planar surfaces can be considered isotropic around the surface normal, creating a C∞ axis. This means that x = -x and y = -y, but z ≠ -z. Combining this with the requirement that χ(2)
ijk= χ(2)-i-j-k , means that only four independent non-zero χ(2)
ijk components can generate a SF signal:
χ(2)zxx χ
(2)zyy, χ
(2)xzx χ
(2)yzy, χ
(2)xxz χ
(2)yyz, χ
(2)zzz
Each of the electric fields can be resolved into components that are polarized parallel, s, and perpendicular, p, to the surface. Table 3.1 shows the polarization combinations and the corresponding χ(2)
ijk elements that can produce an SFG signal. Polarizations are listed in order of decreasing energy: SFG, visible, and infrared. In this work, we use SFG with a ppp polarization to study DNA surfaces.
pppPolarization elements
psssps
ssp
χ(2)ijk
χ(2)zzz
χ(2)zxx
χ(2)xzx
χ(2)xxz, , ,
χ(2)zyy
χ(2)yzy
χ(2)yyz
Table 3.1. SFG polarizations and the corresponding elements that can generate an SFG signal. Polarizations are listed as SFG, visible, and infrared.
χ(2)ijk
= = = = = =
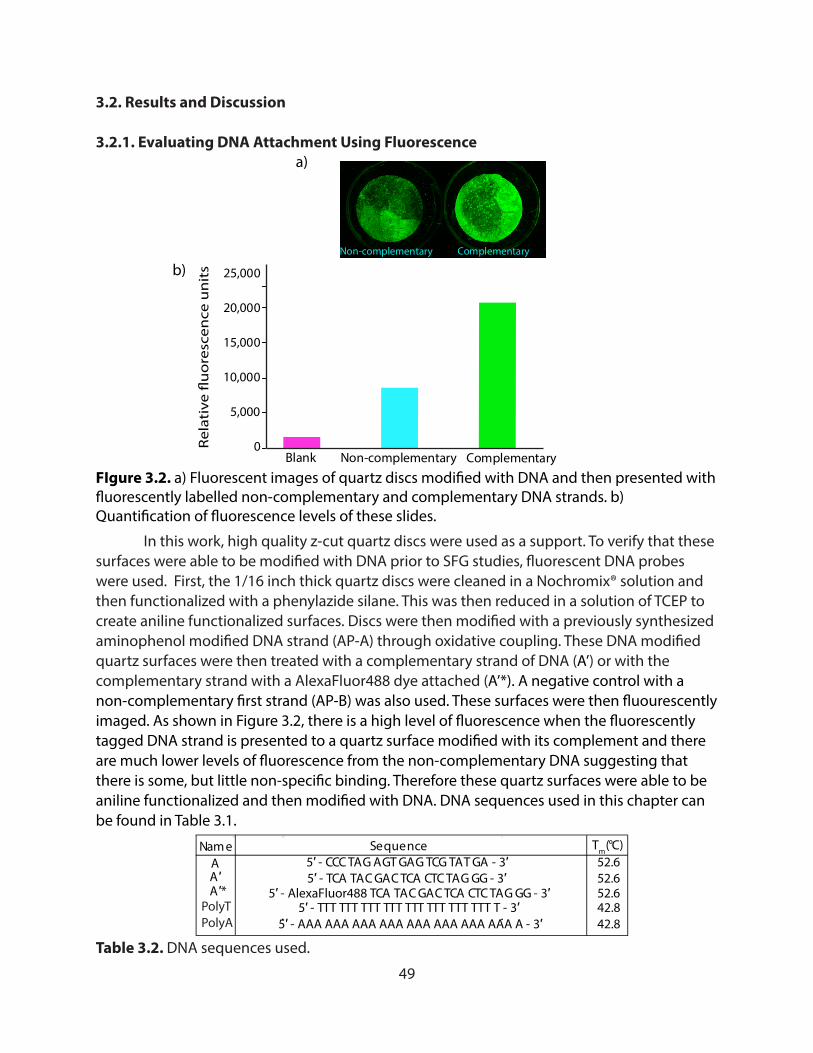
49
3.2. Results and Discussion
3.2.1. Evaluating DNA Attachment Using Fluorescence
In this work, high quality z-cut quartz discs were used as a support. To verify that these surfaces were able to be modified with DNA prior to SFG studies, fluorescent DNA probes were used. First, the 1/16 inch thick quartz discs were cleaned in a Nochromix® solution and then functionalized with a phenylazide silane. This was then reduced in a solution of TCEP to create aniline functionalized surfaces. Discs were then modified with a previously synthesized aminophenol modified DNA strand (AP-A) through oxidative coupling. These DNA modified quartz surfaces were then treated with a complementary strand of DNA (A’) or with the complementary strand with a AlexaFluor488 dye attached (A’*). A negative control with a non-complementary first strand (AP-B) was also used. These surfaces were then fluourescently imaged. As shown in Figure 3.2, there is a high level of fluorescence when the fluorescently tagged DNA strand is presented to a quartz surface modified with its complement and there are much lower levels of fluorescence from the non-complementary DNA suggesting that there is some, but little non-specific binding. Therefore these quartz surfaces were able to be aniline functionalized and then modified with DNA. DNA sequences used in this chapter can be found in Table 3.1.
Nam e Sequence Tm ( °C) A 5′ - CCC TAG AGT GAG TCG TAT GA - 3′ 52.6 A ′ 5′ - TCA TAC GAC TCA CTC TAG GG - 3′ 52.6 A ′* 52.65′ - AlexaFluor488 TCA TAC GAC TCA CTC TAG GG - 3′
Table 3.2. DNA sequences used.
PolyTPolyA
5′ - TTT TTT TTT TTT TTT TTT TTT TTT T - 3′5′ - AAA AAA AAA AAA AAA AAA AAA AAA A - 3′
42.842.8
0
5,000
10,000
15,000
20,000
25,000
Blank Non-complementary Complementary
Rel
ativ
e �
uo
resc
ence
un
its
FIgure 3.2. a) Fluorescent images of quartz discs modi�ed with DNA and then presented with �uorescently labelled non-complementary and complementary DNA strands. b) Quanti�cation of �uorescence levels of these slides.
a)
b)Non-complementary Complementary
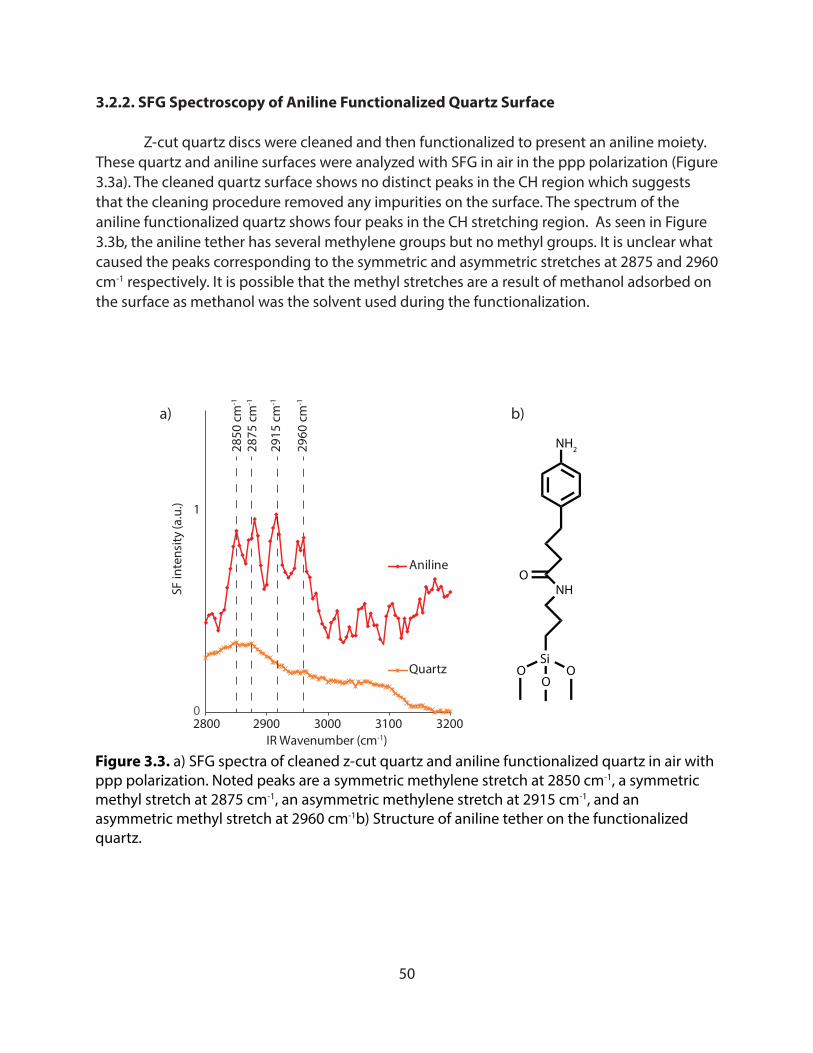
50
3.2.2. SFG Spectroscopy of Aniline Functionalized Quartz Surface
Z-cut quartz discs were cleaned and then functionalized to present an aniline moiety. These quartz and aniline surfaces were analyzed with SFG in air in the ppp polarization (Figure 3.3a). The cleaned quartz surface shows no distinct peaks in the CH region which suggests that the cleaning procedure removed any impurities on the surface. The spectrum of the aniline functionalized quartz shows four peaks in the CH stretching region. As seen in Figure 3.3b, the aniline tether has several methylene groups but no methyl groups. It is unclear what caused the peaks corresponding to the symmetric and asymmetric stretches at 2875 and 2960 cm-1 respectively. It is possible that the methyl stretches are a result of methanol adsorbed on the surface as methanol was the solvent used during the functionalization.
Quartz
Aniline
2800 2900 3000 3100 3200IR Wavenumber (cm-1)
Figure 3.3. a) SFG spectra of cleaned z-cut quartz and aniline functionalized quartz in air with ppp polarization. Noted peaks are a symmetric methylene stretch at 2850 cm-1, a symmetric methyl stretch at 2875 cm-1, an asymmetric methylene stretch at 2915 cm-1, and an asymmetric methyl stretch at 2960 cm-1b) Structure of aniline tether on the functionalized quartz.
NH2
NH
Si
O
OO
O
a) b)
0
1
SF in
tens
ity (a
.u.)
2850
cm
-1
2960
cm
-1
2875
cm
-1
2915
cm
-1
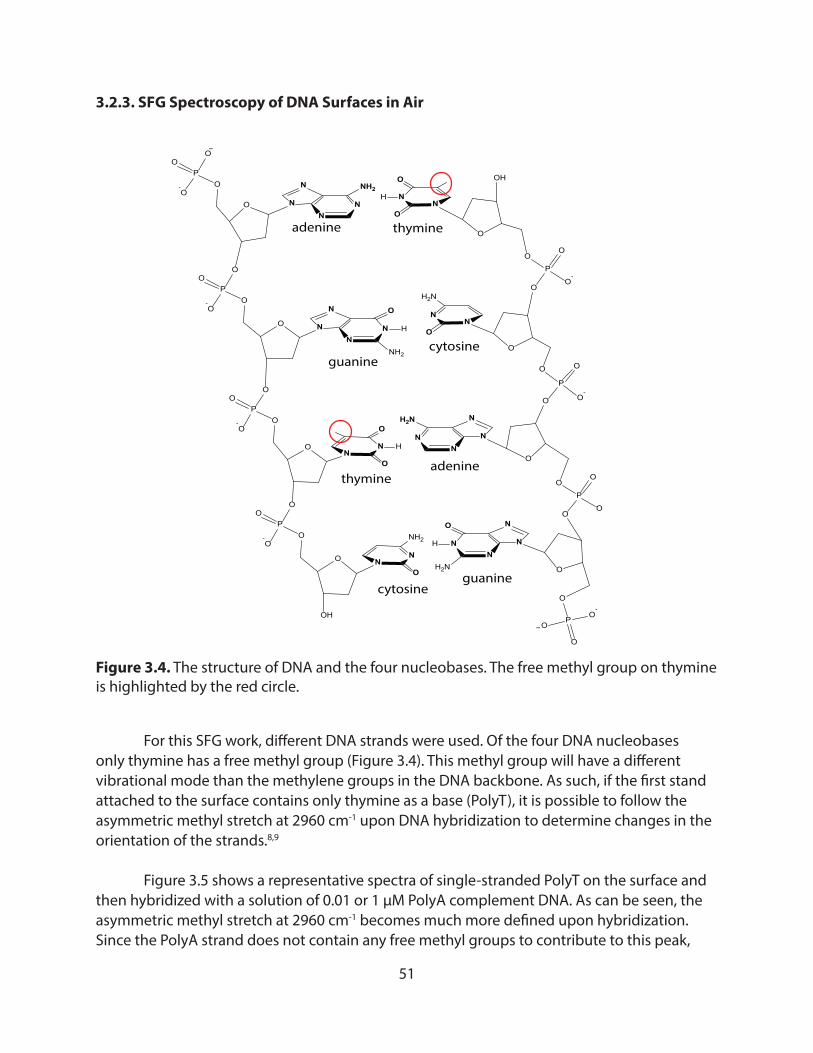
51
3.2.3. SFG Spectroscopy of DNA Surfaces in Air
adenine
guaninecytosine
thymine
PO
-O
O
O
O
O
P
O
O-
O
O
O
O
PO
-O
O
O
PO
-O
O
O
PO
-O
O
O
O
O
thymine
cytosine
P
O
O-
O
O
adenine
guanine
O
P
O
O-O
O
O
OH
OH
P
O
O-
O
O
NO
N
O
H
NO
N
O
H
NO
N
NH2
NO
N
H2N
N
N
NNH2
N
O
H
N
N
NH2N
N
O
H
N
N
NN
H2N
N
N
NN
NH2
Figure 3.4. The structure of DNA and the four nucleobases. The free methyl group on thymine is highlighted by the red circle.
For this SFG work, different DNA strands were used. Of the four DNA nucleobases only thymine has a free methyl group (Figure 3.4). This methyl group will have a different vibrational mode than the methylene groups in the DNA backbone. As such, if the first stand attached to the surface contains only thymine as a base (PolyT), it is possible to follow the asymmetric methyl stretch at 2960 cm-1 upon DNA hybridization to determine changes in the orientation of the strands.8,9
Figure 3.5 shows a representative spectra of single-stranded PolyT on the surface and then hybridized with a solution of 0.01 or 1 µM PolyA complement DNA. As can be seen, the asymmetric methyl stretch at 2960 cm-1 becomes much more defined upon hybridization. Since the PolyA strand does not contain any free methyl groups to contribute to this peak,
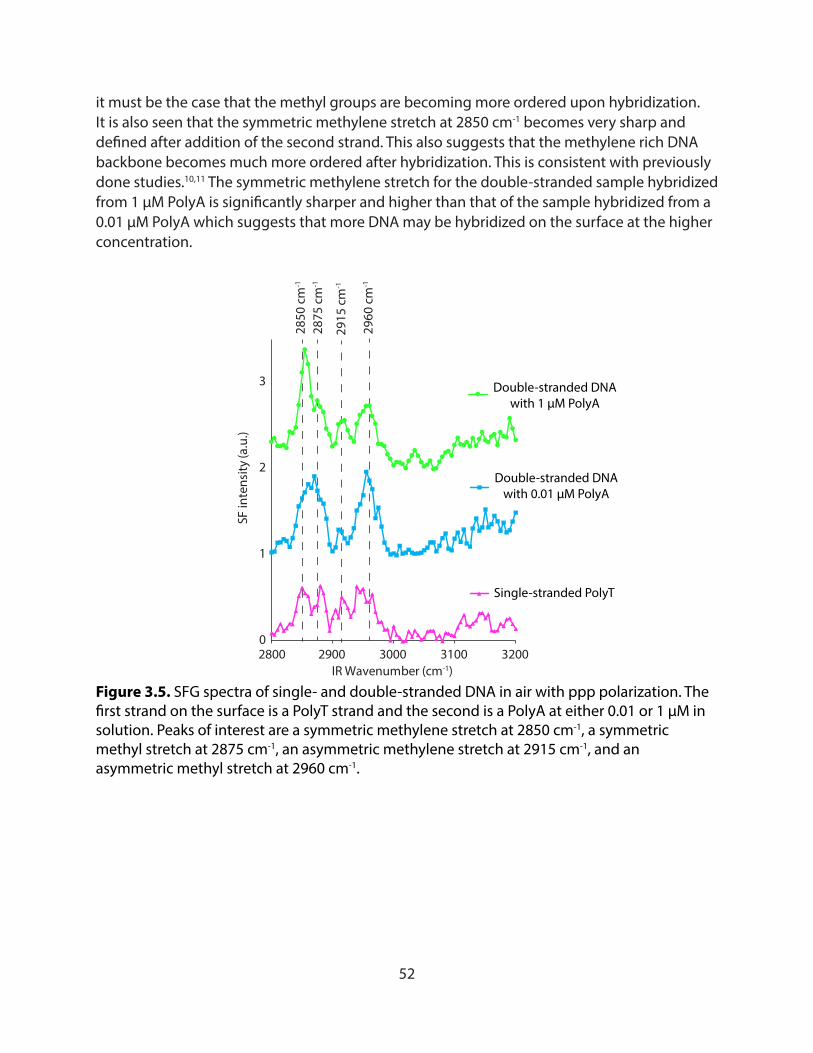
52
it must be the case that the methyl groups are becoming more ordered upon hybridization. It is also seen that the symmetric methylene stretch at 2850 cm-1 becomes very sharp and defined after addition of the second strand. This also suggests that the methylene rich DNA backbone becomes much more ordered after hybridization. This is consistent with previously done studies.10,11 The symmetric methylene stretch for the double-stranded sample hybridized from 1 µM PolyA is significantly sharper and higher than that of the sample hybridized from a 0.01 µM PolyA which suggests that more DNA may be hybridized on the surface at the higher concentration.
2800 2900 3000 3100 3200IR Wavenumber (cm-1)
Figure 3.5. SFG spectra of single- and double-stranded DNA in air with ppp polarization. The �rst strand on the surface is a PolyT strand and the second is a PolyA at either 0.01 or 1 μM in solution. Peaks of interest are a symmetric methylene stretch at 2850 cm-1, a symmetric methyl stretch at 2875 cm-1, an asymmetric methylene stretch at 2915 cm-1, and an asymmetric methyl stretch at 2960 cm-1.
2850
cm
-1
2960
cm
-1
2875
cm
-1
2915
cm
-1
Single-stranded PolyT
Double-stranded DNAwith 0.01 μM PolyA
Double-stranded DNAwith 1 μM PolyA
0
1
2
3
SF in
tens
ity (a
.u.)
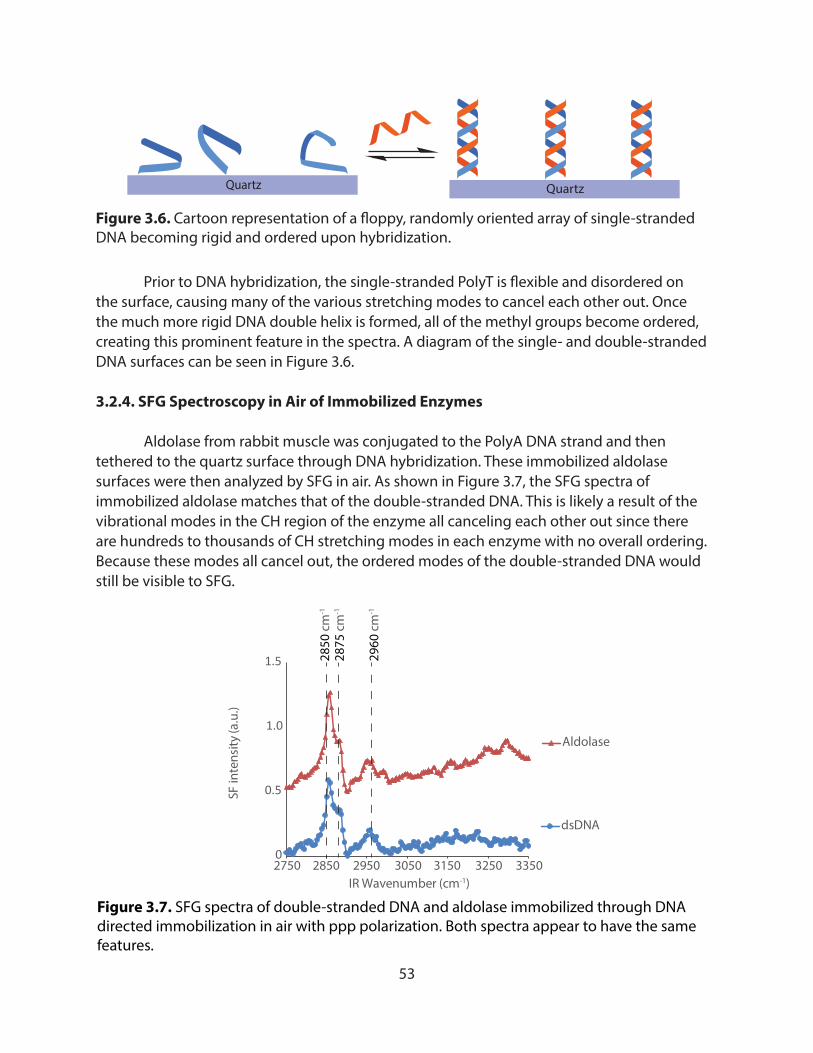
53
Glass QuartzQuartz
Figure 3.6. Cartoon representation of a �oppy, randomly oriented array of single-stranded DNA becoming rigid and ordered upon hybridization.
Prior to DNA hybridization, the single-stranded PolyT is flexible and disordered on the surface, causing many of the various stretching modes to cancel each other out. Once the much more rigid DNA double helix is formed, all of the methyl groups become ordered, creating this prominent feature in the spectra. A diagram of the single- and double-stranded DNA surfaces can be seen in Figure 3.6.
3.2.4. SFG Spectroscopy in Air of Immobilized Enzymes
Aldolase from rabbit muscle was conjugated to the PolyA DNA strand and then tethered to the quartz surface through DNA hybridization. These immobilized aldolase surfaces were then analyzed by SFG in air. As shown in Figure 3.7, the SFG spectra of immobilized aldolase matches that of the double-stranded DNA. This is likely a result of the vibrational modes in the CH region of the enzyme all canceling each other out since there are hundreds to thousands of CH stretching modes in each enzyme with no overall ordering. Because these modes all cancel out, the ordered modes of the double-stranded DNA would still be visible to SFG.
Figure 3.7. SFG spectra of double-stranded DNA and aldolase immobilized through DNA directed immobilization in air with ppp polarization. Both spectra appear to have the same features.
0
0.5
1.0
1.5
2750 2850 2950 3050 3150 3250 3350
dsDNA
Aldolase
IR Wavenumber (cm-1)
SF in
tens
ity (a
.u.)
2850
cm
-1
2960
cm
-1
2875
cm
-1
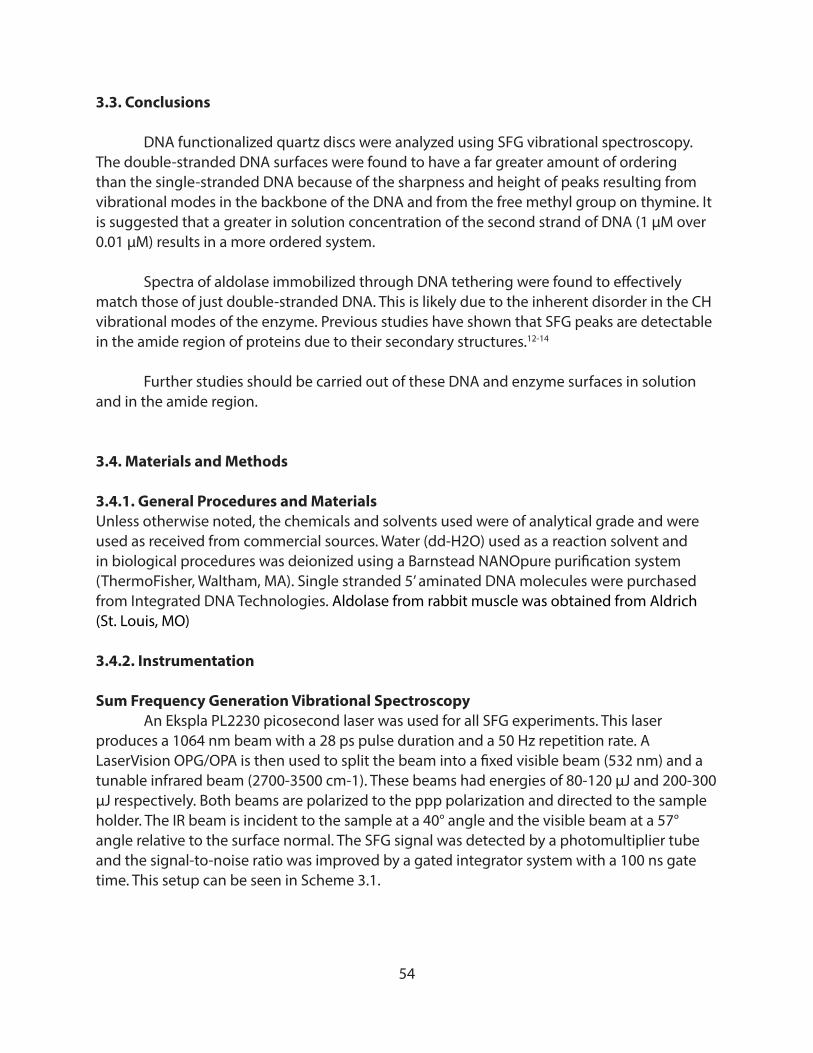
54
3.3. Conclusions
DNA functionalized quartz discs were analyzed using SFG vibrational spectroscopy. The double-stranded DNA surfaces were found to have a far greater amount of ordering than the single-stranded DNA because of the sharpness and height of peaks resulting from vibrational modes in the backbone of the DNA and from the free methyl group on thymine. It is suggested that a greater in solution concentration of the second strand of DNA (1 µM over 0.01 µM) results in a more ordered system.
Spectra of aldolase immobilized through DNA tethering were found to effectively match those of just double-stranded DNA. This is likely due to the inherent disorder in the CH vibrational modes of the enzyme. Previous studies have shown that SFG peaks are detectable in the amide region of proteins due to their secondary structures.12-14
Further studies should be carried out of these DNA and enzyme surfaces in solution and in the amide region.
3.4. Materials and Methods
3.4.1. General Procedures and MaterialsUnless otherwise noted, the chemicals and solvents used were of analytical grade and were used as received from commercial sources. Water (dd-H2O) used as a reaction solvent and in biological procedures was deionized using a Barnstead NANOpure purification system (ThermoFisher, Waltham, MA). Single stranded 5’ aminated DNA molecules were purchased from Integrated DNA Technologies. Aldolase from rabbit muscle was obtained from Aldrich (St. Louis, MO)
3.4.2. Instrumentation
Sum Frequency Generation Vibrational Spectroscopy An Ekspla PL2230 picosecond laser was used for all SFG experiments. This laser produces a 1064 nm beam with a 28 ps pulse duration and a 50 Hz repetition rate. A LaserVision OPG/OPA is then used to split the beam into a fixed visible beam (532 nm) and a tunable infrared beam (2700-3500 cm-1). These beams had energies of 80-120 µJ and 200-300 µJ respectively. Both beams are polarized to the ppp polarization and directed to the sample holder. The IR beam is incident to the sample at a 40° angle and the visible beam at a 57° angle relative to the surface normal. The SFG signal was detected by a photomultiplier tube and the signal-to-noise ratio was improved by a gated integrator system with a 100 ns gate time. This setup can be seen in Scheme 3.1.
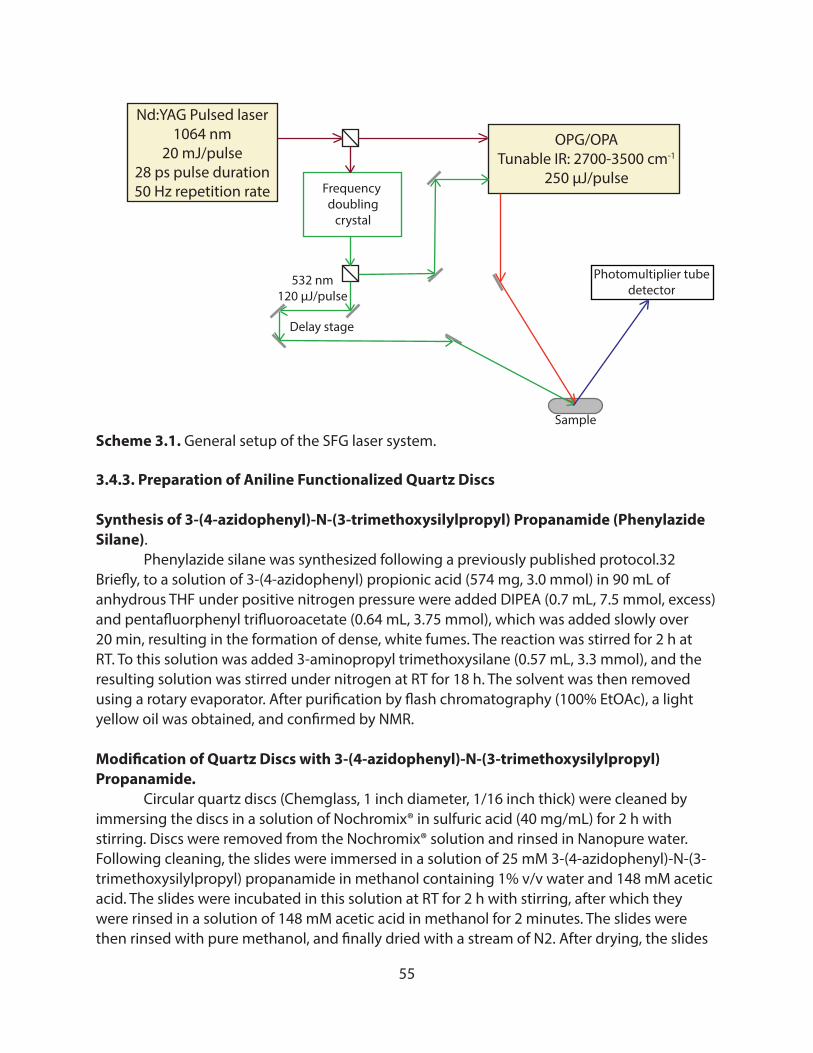
55
3.4.3. Preparation of Aniline Functionalized Quartz Discs
Synthesis of 3-(4-azidophenyl)-N-(3-trimethoxysilylpropyl) Propanamide (Phenylazide Silane). Phenylazide silane was synthesized following a previously published protocol.32 Briefly, to a solution of 3-(4-azidophenyl) propionic acid (574 mg, 3.0 mmol) in 90 mL of anhydrous THF under positive nitrogen pressure were added DIPEA (0.7 mL, 7.5 mmol, excess) and pentafluorphenyl trifluoroacetate (0.64 mL, 3.75 mmol), which was added slowly over 20 min, resulting in the formation of dense, white fumes. The reaction was stirred for 2 h at RT. To this solution was added 3-aminopropyl trimethoxysilane (0.57 mL, 3.3 mmol), and the resulting solution was stirred under nitrogen at RT for 18 h. The solvent was then removed using a rotary evaporator. After purification by flash chromatography (100% EtOAc), a light yellow oil was obtained, and confirmed by NMR.
Modification of Quartz Discs with 3-(4-azidophenyl)-N-(3-trimethoxysilylpropyl) Propanamide. Circular quartz discs (Chemglass, 1 inch diameter, 1/16 inch thick) were cleaned by immersing the discs in a solution of Nochromix® in sulfuric acid (40 mg/mL) for 2 h with stirring. Discs were removed from the Nochromix® solution and rinsed in Nanopure water. Following cleaning, the slides were immersed in a solution of 25 mM 3-(4-azidophenyl)-N-(3-trimethoxysilylpropyl) propanamide in methanol containing 1% v/v water and 148 mM acetic acid. The slides were incubated in this solution at RT for 2 h with stirring, after which they were rinsed in a solution of 148 mM acetic acid in methanol for 2 minutes. The slides were then rinsed with pure methanol, and finally dried with a stream of N2. After drying, the slides
Nd:YAG Pulsed laser1064 nm
20 mJ/pulse28 ps pulse duration50 Hz repetition rate Frequency
doublingcrystal
OPG/OPATunable IR: 2700-3500 cm-1
250 μJ/pulse
Delay stage
Sample
Photomultiplier tubedetector
532 nm120 μJ/pulse
Scheme 3.1. General setup of the SFG laser system.
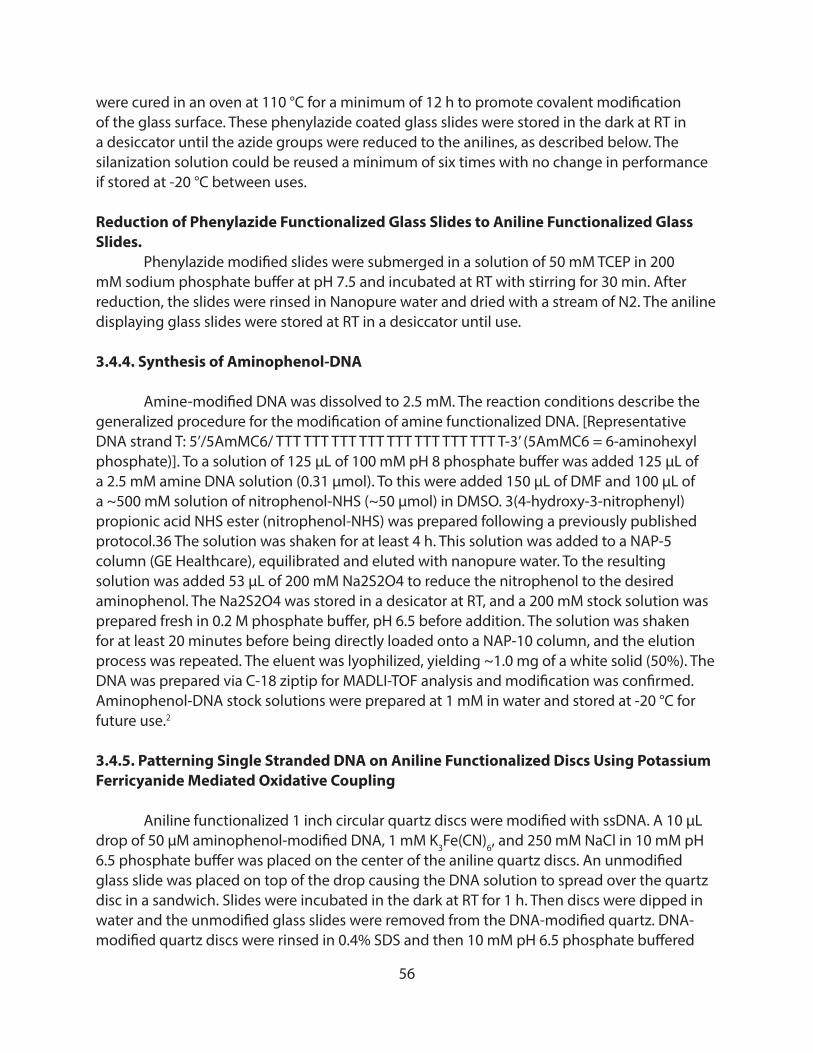
56
were cured in an oven at 110 °C for a minimum of 12 h to promote covalent modification of the glass surface. These phenylazide coated glass slides were stored in the dark at RT in a desiccator until the azide groups were reduced to the anilines, as described below. The silanization solution could be reused a minimum of six times with no change in performance if stored at -20 °C between uses.
Reduction of Phenylazide Functionalized Glass Slides to Aniline Functionalized Glass Slides. Phenylazide modified slides were submerged in a solution of 50 mM TCEP in 200 mM sodium phosphate buffer at pH 7.5 and incubated at RT with stirring for 30 min. After reduction, the slides were rinsed in Nanopure water and dried with a stream of N2. The aniline displaying glass slides were stored at RT in a desiccator until use.
3.4.4. Synthesis of Aminophenol-DNA
Amine-modified DNA was dissolved to 2.5 mM. The reaction conditions describe the generalized procedure for the modification of amine functionalized DNA. [Representative DNA strand T: 5’/5AmMC6/ TTT TTT TTT TTT TTT TTT TTT TTT T-3’ (5AmMC6 = 6-aminohexyl phosphate)]. To a solution of 125 μL of 100 mM pH 8 phosphate buffer was added 125 μL of a 2.5 mM amine DNA solution (0.31 μmol). To this were added 150 μL of DMF and 100 μL of a ~500 mM solution of nitrophenol-NHS (~50 μmol) in DMSO. 3(4-hydroxy-3-nitrophenyl) propionic acid NHS ester (nitrophenol-NHS) was prepared following a previously published protocol.36 The solution was shaken for at least 4 h. This solution was added to a NAP-5 column (GE Healthcare), equilibrated and eluted with nanopure water. To the resulting solution was added 53 μL of 200 mM Na2S2O4 to reduce the nitrophenol to the desired aminophenol. The Na2S2O4 was stored in a desicator at RT, and a 200 mM stock solution was prepared fresh in 0.2 M phosphate buffer, pH 6.5 before addition. The solution was shaken for at least 20 minutes before being directly loaded onto a NAP-10 column, and the elution process was repeated. The eluent was lyophilized, yielding ~1.0 mg of a white solid (50%). The DNA was prepared via C-18 ziptip for MADLI-TOF analysis and modification was confirmed. Aminophenol-DNA stock solutions were prepared at 1 mM in water and stored at -20 °C for future use.2
3.4.5. Patterning Single Stranded DNA on Aniline Functionalized Discs Using Potassium Ferricyanide Mediated Oxidative Coupling
Aniline functionalized 1 inch circular quartz discs were modified with ssDNA. A 10 μL drop of 50 μM aminophenol-modified DNA, 1 mM K3Fe(CN)6, and 250 mM NaCl in 10 mM pH 6.5 phosphate buffer was placed on the center of the aniline quartz discs. An unmodified glass slide was placed on top of the drop causing the DNA solution to spread over the quartz disc in a sandwich. Slides were incubated in the dark at RT for 1 h. Then discs were dipped in water and the unmodified glass slides were removed from the DNA-modified quartz. DNA-modified quartz discs were rinsed in 0.4% SDS and then 10 mM pH 6.5 phosphate buffered
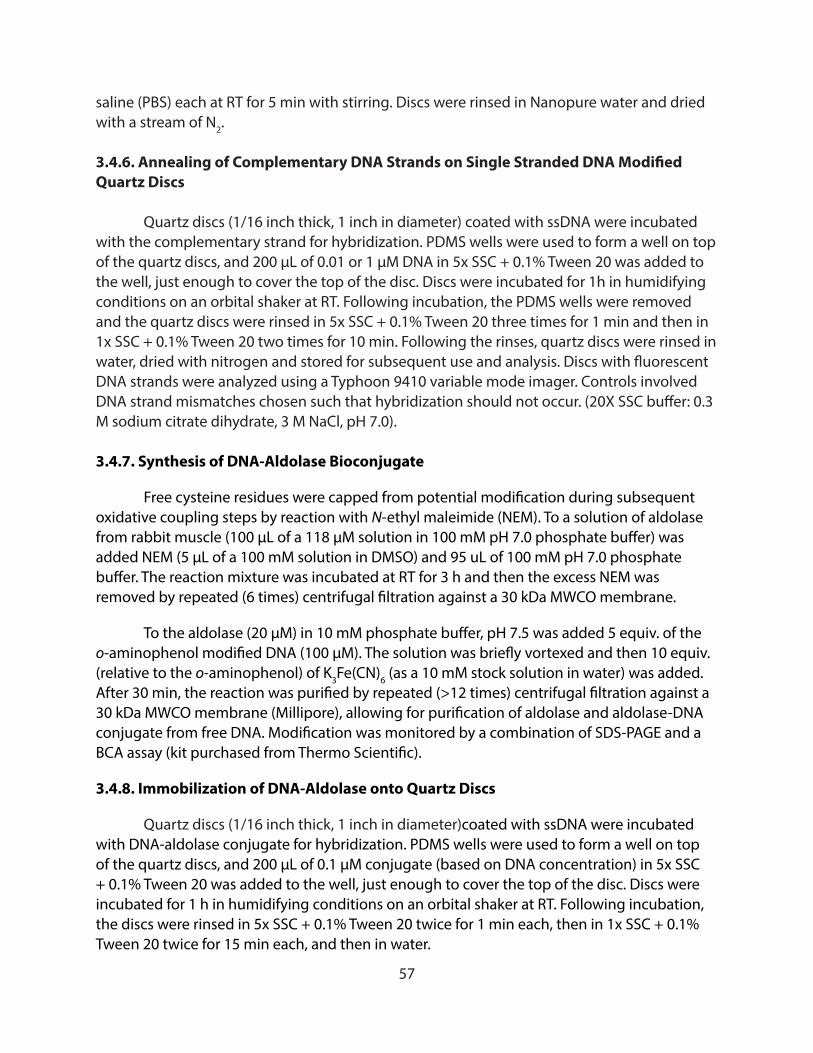
57
saline (PBS) each at RT for 5 min with stirring. Discs were rinsed in Nanopure water and dried with a stream of N2.
3.4.6. Annealing of Complementary DNA Strands on Single Stranded DNA Modified Quartz Discs
Quartz discs (1/16 inch thick, 1 inch in diameter) coated with ssDNA were incubated with the complementary strand for hybridization. PDMS wells were used to form a well on top of the quartz discs, and 200 μL of 0.01 or 1 μM DNA in 5x SSC + 0.1% Tween 20 was added to the well, just enough to cover the top of the disc. Discs were incubated for 1h in humidifying conditions on an orbital shaker at RT. Following incubation, the PDMS wells were removed and the quartz discs were rinsed in 5x SSC + 0.1% Tween 20 three times for 1 min and then in 1x SSC + 0.1% Tween 20 two times for 10 min. Following the rinses, quartz discs were rinsed in water, dried with nitrogen and stored for subsequent use and analysis. Discs with fluorescent DNA strands were analyzed using a Typhoon 9410 variable mode imager. Controls involved DNA strand mismatches chosen such that hybridization should not occur. (20X SSC buffer: 0.3 M sodium citrate dihydrate, 3 M NaCl, pH 7.0).
3.4.7. Synthesis of DNA-Aldolase Bioconjugate
Free cysteine residues were capped from potential modification during subsequent oxidative coupling steps by reaction with N-ethyl maleimide (NEM). To a solution of aldolase from rabbit muscle (100 μL of a 118 μM solution in 100 mM pH 7.0 phosphate buffer) was added NEM (5 μL of a 100 mM solution in DMSO) and 95 uL of 100 mM pH 7.0 phosphate buffer. The reaction mixture was incubated at RT for 3 h and then the excess NEM was removed by repeated (6 times) centrifugal filtration against a 30 kDa MWCO membrane.
To the aldolase (20 μM) in 10 mM phosphate buffer, pH 7.5 was added 5 equiv. of the o-aminophenol modified DNA (100 μM). The solution was briefly vortexed and then 10 equiv. (relative to the o-aminophenol) of K3Fe(CN)6 (as a 10 mM stock solution in water) was added. After 30 min, the reaction was purified by repeated (>12 times) centrifugal filtration against a 30 kDa MWCO membrane (Millipore), allowing for purification of aldolase and aldolase-DNA conjugate from free DNA. Modification was monitored by a combination of SDS-PAGE and a BCA assay (kit purchased from Thermo Scientific).
3.4.8. Immobilization of DNA-Aldolase onto Quartz Discs
Quartz discs (1/16 inch thick, 1 inch in diameter)coated with ssDNA were incubated with DNA-aldolase conjugate for hybridization. PDMS wells were used to form a well on top of the quartz discs, and 200 μL of 0.1 μM conjugate (based on DNA concentration) in 5x SSC + 0.1% Tween 20 was added to the well, just enough to cover the top of the disc. Discs were incubated for 1 h in humidifying conditions on an orbital shaker at RT. Following incubation, the discs were rinsed in 5x SSC + 0.1% Tween 20 twice for 1 min each, then in 1x SSC + 0.1% Tween 20 twice for 15 min each, and then in water.
58
3.5. References
1. Cha, T. W.; Quo, A.; Zhu, X. Y., Enzymatic Activity on a Chip: The Critical Role of Protein Orientation. Proteomics 2005, 5, 416-419
2. Turková, J.; Fusek, M.; Štovíčková, J.; Králová, Z., Biospecific Complex Formation as a Tool for Oriented Immobilization. Makromol. Chem., Macromol. Symp. 1988, 17, 241-256
3. Huang, W.; Wang, J.; Bhattacharyya, D.; Bachas, L. G., Improving the Activity of Immobilized Subtilisin by Site-Specific Attachment to Surfaces. Anal. Chem. 1997, 69, 4601-4607
4. Lambert, A. G.; Davies, P. B.; Neivandt, D. J., Implementing the Theory of Sum Frequency Generation Vibrational Spectroscopy: A Tutorial Review. Appl. Spectrosc. Rev. 2005, 40, 103-145
5. Cremer, P. S.; Su, X.; Shen, Y. R.; Somorjai, G. A., Ethylene Hydrogenation on Pt(111) Monitored in Situ at High Pressures Using Sum Frequency Generation. J. Am. Chem. Soc. 1996, 118, 2942-2949
6. Miranda, P. B.; Shen, Y. R., Liquid Interfaces: A Study by Sum-Frequency Vibrational Spectroscopy. J. Phys. Chem. B 1999, 103, 3292-3307
7. Shen, Y. R., The Principles of Nonlinear Optics; Wiley, 1984.
8. Howell, C.; Schmidt, R.; Kurz, V.; Koelsch, P., Sum-Frequency-Generation Spectroscopy of DNA Films in Air and Aqueous Environments. Biointerphases 2008, 3, 47-51
9. Stokes, G. Y.; Gibbs-Davis, J. M.; Boman, F. C.; Stepp, B. R.; Condie, A. G.; Nguyen, S. T.; Geiger, F. M., Making “Sense” of DNA. J. Am. Chem. Soc. 2007, 129, 7492-7493
10. Walter, S.; Geiger, F. M., DNA on Stage: Showcasing Oligonucleotides at Surfaces and Interfaces with Second Harmonic and Vibrational Sum Frequency Generation. J. Phys. Chem. Lett. 2010, 1, 9-15
11. Asanuma, H.; Noguchi, H.; Uosaki, K.; Yu, H.-Z., Metal Cation-Induced Deformation of DNA Self-Assembled Monolayers on Silicon: Vibrational Sum Frequency Generation Spectroscopy. J. Am. Chem. Soc. 2008, 130, 8016-8022
12. Baio, J. E.; Weidner, T.; Baugh, L.; Gamble, L. J.; Stayton, P. S.; Castner, D. G., Probing the Orientation of Electrostatically Immobilized Protein G B1 by Time-of-Flight Secondary Ion Spectrometry, Sum Frequency Generation, and Near-Edge X-ray Adsorption Fine Structure Spectroscopy. Langmuir 2012, 28, 2107-2112

59
13. Wang, J.; Chen, X.; Clarke, M. L.; Chen, Z., Detection of Chiral Sum Frequency Generation Vibrational Spectra of Proteins and Peptides at Interfaces in Situ. Proc. Natl. Acad. Sci. 2005, 102, 4978-4983
14. Fu, L.; Liu, J.; Yan, E. C. Y., Chiral Sum Frequency Generation Spectroscopy for Characterizing Protein Secondary Structures at Interfaces. J. Am. Chem. Soc. 2011, 133, 8094-8097
60
Chapter 4
Immobilization of Enzymes onto Mesoporous Silica
Abstract
Mesoporous silicas are materials with very high surface areas and tunable pore sizes. SBA-15 is one type of mesoporous silica with pores large enough to fit enzymes. Herein, we use SBA-15 as a support for immobilizing alcohol dehydrogenase. Alcohol dehydrogenase was found to non-specifically adsorb onto SBA-15 and retain activity upon adsorption. This activity of immobilized enzyme appears to be largely independent of enzyme incubation temperature and time, but is dependent on incubation concentration. The specificity of alcohol dehydrogenase was altered upon immobilization for the largest alcohols studied in this work. Significant leaching of the enzyme from SBA-15 was detected, leaving the utility of this immobilization technique to be limited.
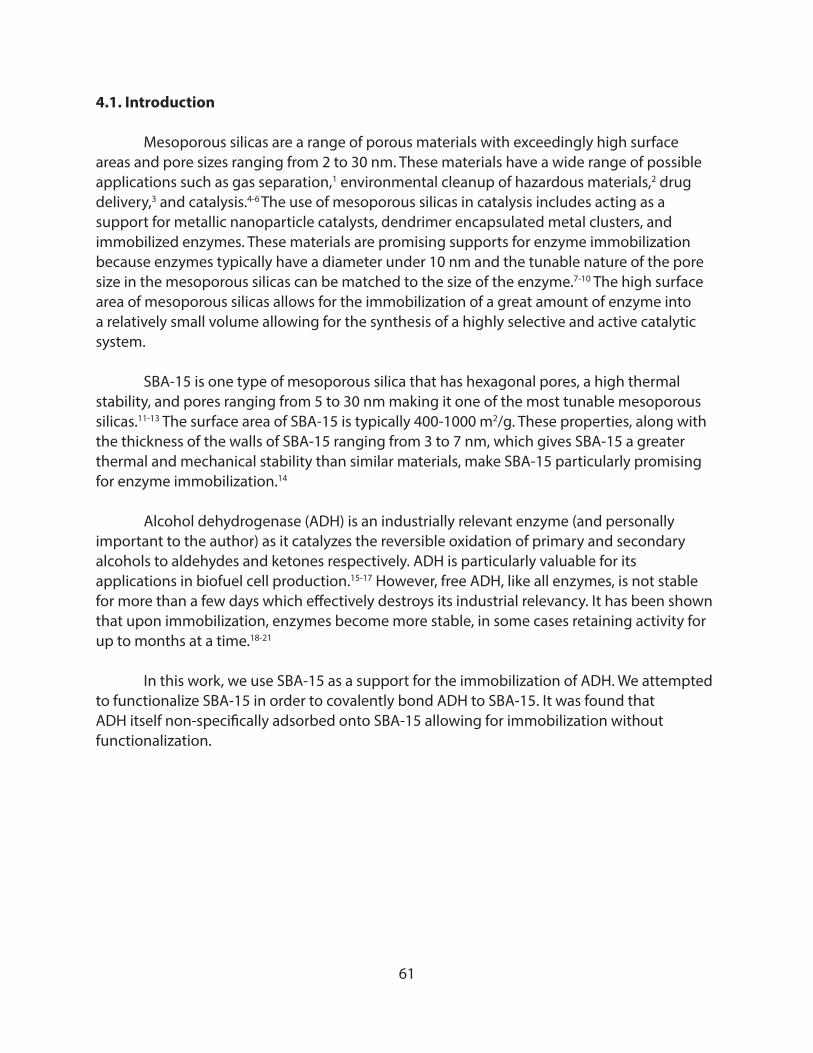
61
4.1. Introduction
Mesoporous silicas are a range of porous materials with exceedingly high surface areas and pore sizes ranging from 2 to 30 nm. These materials have a wide range of possible applications such as gas separation,1 environmental cleanup of hazardous materials,2 drug delivery,3 and catalysis.4-6 The use of mesoporous silicas in catalysis includes acting as a support for metallic nanoparticle catalysts, dendrimer encapsulated metal clusters, and immobilized enzymes. These materials are promising supports for enzyme immobilization because enzymes typically have a diameter under 10 nm and the tunable nature of the pore size in the mesoporous silicas can be matched to the size of the enzyme.7-10 The high surface area of mesoporous silicas allows for the immobilization of a great amount of enzyme into a relatively small volume allowing for the synthesis of a highly selective and active catalytic system.
SBA-15 is one type of mesoporous silica that has hexagonal pores, a high thermal stability, and pores ranging from 5 to 30 nm making it one of the most tunable mesoporous silicas.11-13 The surface area of SBA-15 is typically 400-1000 m2/g. These properties, along with the thickness of the walls of SBA-15 ranging from 3 to 7 nm, which gives SBA-15 a greater thermal and mechanical stability than similar materials, make SBA-15 particularly promising for enzyme immobilization.14
Alcohol dehydrogenase (ADH) is an industrially relevant enzyme (and personally important to the author) as it catalyzes the reversible oxidation of primary and secondary alcohols to aldehydes and ketones respectively. ADH is particularly valuable for its applications in biofuel cell production.15-17 However, free ADH, like all enzymes, is not stable for more than a few days which effectively destroys its industrial relevancy. It has been shown that upon immobilization, enzymes become more stable, in some cases retaining activity for up to months at a time.18-21
In this work, we use SBA-15 as a support for the immobilization of ADH. We attempted to functionalize SBA-15 in order to covalently bond ADH to SBA-15. It was found that ADH itself non-specifically adsorbed onto SBA-15 allowing for immobilization without functionalization.
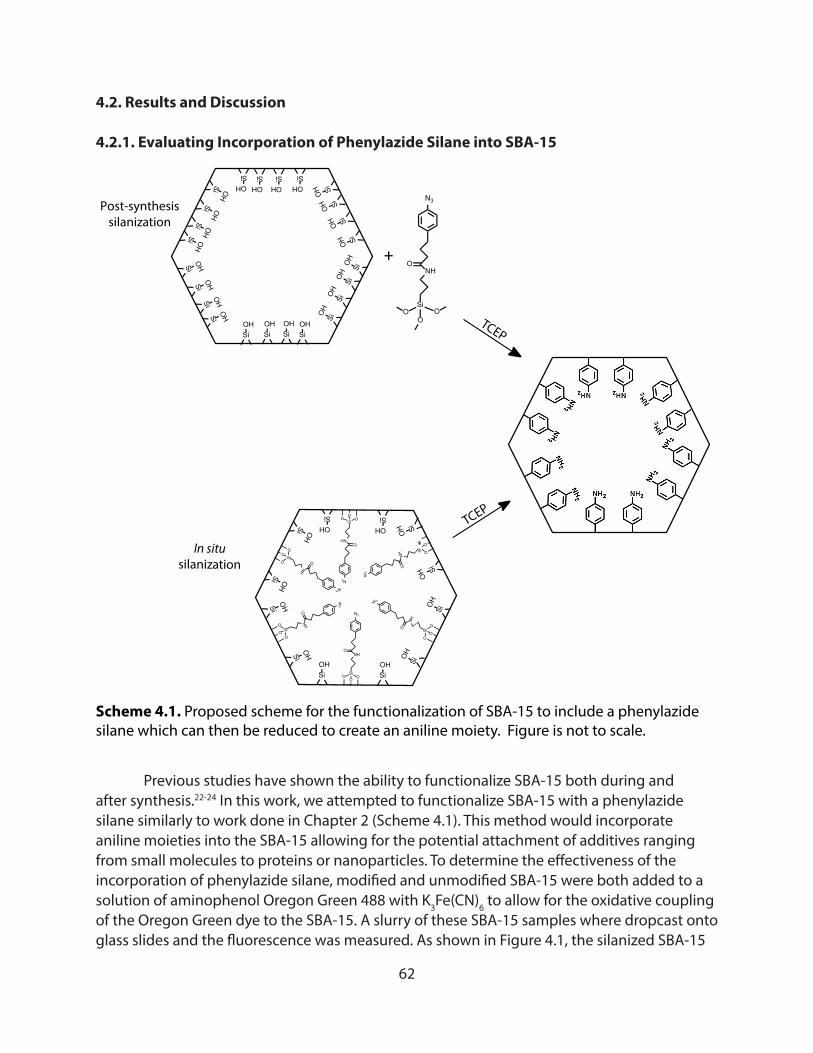
62
4.2. Results and Discussion
4.2.1. Evaluating Incorporation of Phenylazide Silane into SBA-15
Previous studies have shown the ability to functionalize SBA-15 both during and after synthesis.22-24 In this work, we attempted to functionalize SBA-15 with a phenylazide silane similarly to work done in Chapter 2 (Scheme 4.1). This method would incorporate aniline moieties into the SBA-15 allowing for the potential attachment of additives ranging from small molecules to proteins or nanoparticles. To determine the effectiveness of the incorporation of phenylazide silane, modified and unmodified SBA-15 were both added to a solution of aminophenol Oregon Green 488 with K3Fe(CN)6 to allow for the oxidative coupling of the Oregon Green dye to the SBA-15. A slurry of these SBA-15 samples where dropcast onto glass slides and the fluorescence was measured. As shown in Figure 4.1, the silanized SBA-15
SiO
H
SiO
H
SiO
H
SiO
HSi O
HSi O
HSi O
HSi O
H
SiOH
SiOH
SiOH
SiOH SiOH
SiOH
SiOH
SiOH
SiO
HSi
OH
SiO
HSi
OH
SiOH
SiOH
SiOH
SiOH
N3
NH
SiO
OO
O+
N3
NH
SiO
OO
O
N3
NH
SiO
OO
O
N3
NH
Si OOO
O
N 3
NH
SiO
OOO
N3
NHSi
OO
O
O
N3
NH
SiO
OO O
SiOH
SiOH Si
OH
SiO
H
SiO
H
SiO
HSi O
H
Si OH
SiOH
SiOH SiO
H
SiO
H
In situsilanization
Post-synthesissilanization
TCEP
TCEP
Scheme 4.1. Proposed scheme for the functionalization of SBA-15 to include a phenylazide silane which can then be reduced to create an aniline moiety. Figure is not to scale.
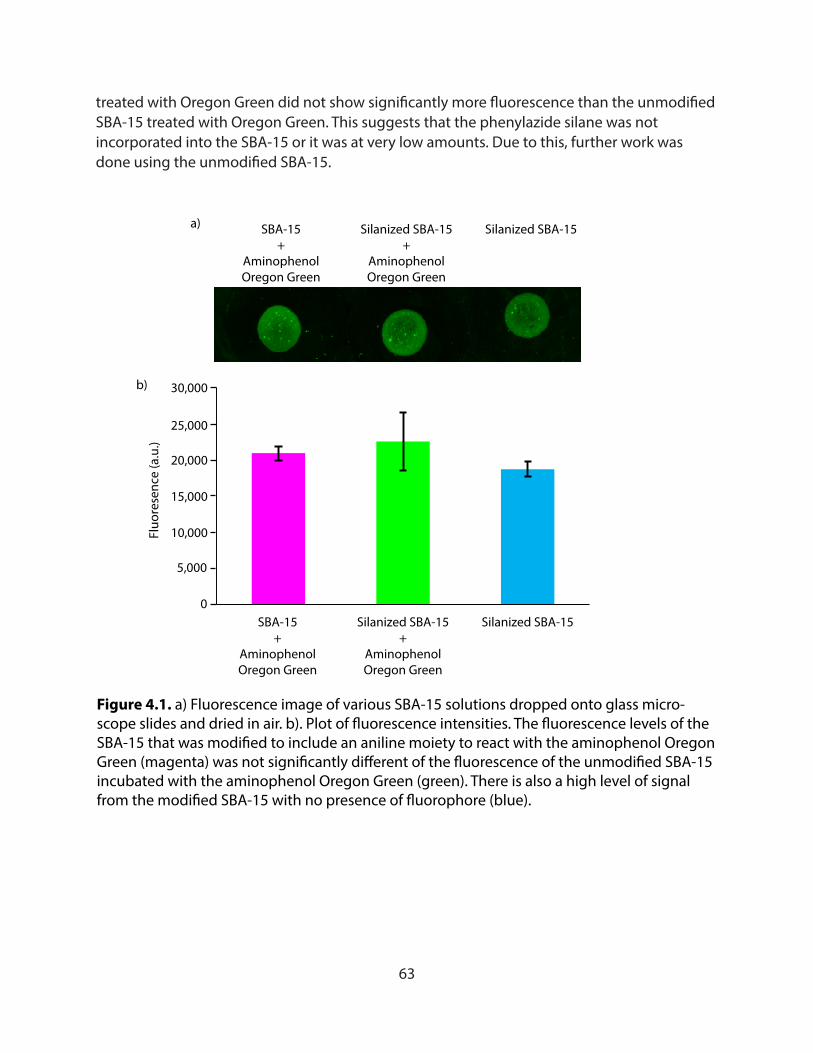
63
treated with Oregon Green did not show significantly more fluorescence than the unmodified SBA-15 treated with Oregon Green. This suggests that the phenylazide silane was not incorporated into the SBA-15 or it was at very low amounts. Due to this, further work was done using the unmodified SBA-15.
0
5,000
10,000
15,000
20,000
25,000
30,000
SBA-15+
AminophenolOregon Green
Fluo
rese
nce
(a.u
.)
Silanized SBA-15+
AminophenolOregon Green
Silanized SBA-15
a)
b)
SBA-15+
AminophenolOregon Green
Silanized SBA-15+
AminophenolOregon Green
Silanized SBA-15
Figure 4.1. a) Fluorescence image of various SBA-15 solutions dropped onto glass micro-scope slides and dried in air. b). Plot of �uorescence intensities. The �uorescence levels of the SBA-15 that was modi�ed to include an aniline moiety to react with the aminophenol Oregon Green (magenta) was not signi�cantly di�erent of the �uorescence of the unmodi�ed SBA-15 incubated with the aminophenol Oregon Green (green). There is also a high level of signal from the modi�ed SBA-15 with no presence of �uorophore (blue).

64
Lysa
te
25 kDa
37 kDa50 kDa
20 kDa15 kDa
75 kDa100 kDa
-2000
-1500
-1000
-500
0
500
0
5,000
10,000
15,000
20,000
25,000
30,000
20 30 40 50 60 70 80 90 100
Rela
tive
Fluo
resc
ence
Temperature (°C)Fluorescence Derivative
Der
ivat
ive
a)
c)
Figure 4.2. Characterization of alcohol dehydrogenase. a) SDS-PAGE gel of expressed alcohol dehydrogenase. The desired enzyme shows up as a double band because not all of the enzyme was denatured due to its high thermostability. Elution fractions 2 and 3 were collected and lyophilized. b) Deconvoluted ESI-TOF mass spectra of alcohol dehydrogenase. Alcohol dehydrogenase has a mass of 33,280 Da. c) Melting temperature curve of alcohol dehydrogenase. The high increase in the �uorescence (blue squares) and decrease in the derivative of the �uorescence curve (orange triangles) as the temperature approaches 100 °C demonstrates that the melting point of this protein is at or above 100 °C.
Flow
Thr
ough
Was
h 1
Was
h 2
Was
h 3
Elut
ion
1
Elut
ion
2El
utio
n 3
Elut
ion
4El
utio
n 5
Elut
ion
6
33,280
0
2,500
5,000
7,500
10,000
12,500
15,000
17,500
20,000
20,000 25,000 30,000 35,000 40,000 45,000 50,000
Coun
ts
Molecular Weight (Da)
b)
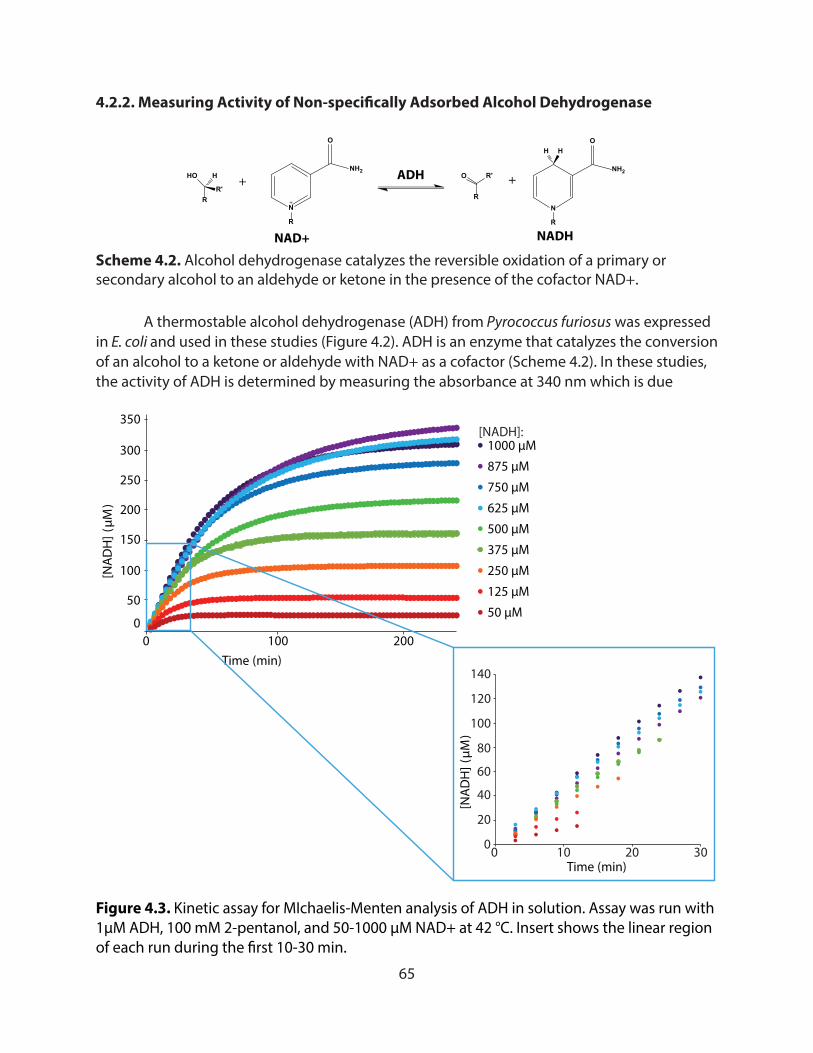
65
4.2.2. Measuring Activity of Non-specifically Adsorbed Alcohol Dehydrogenase
A thermostable alcohol dehydrogenase (ADH) from Pyrococcus furiosus was expressed in E. coli and used in these studies (Figure 4.2). ADH is an enzyme that catalyzes the conversion of an alcohol to a ketone or aldehyde with NAD+ as a cofactor (Scheme 4.2). In these studies, the activity of ADH is determined by measuring the absorbance at 340 nm which is due
[NADH]:
0
50
100
150
200
250
300
350
0 100 200
[NA
DH
] (μM
)
Time (min)
1000 μM
875 μM
750 μM
625 μM
500 μM
375 μM
250 μM
125 μM
50 μM
0
20
40
60
80
100
120
140
0 10 20 30Time (min)
[NA
DH
] (μM
)
Figure 4.3. Kinetic assay for MIchaelis-Menten analysis of ADH in solution. Assay was run with 1μM ADH, 100 mM 2-pentanol, and 50-1000 μM NAD+ at 42 °C. Insert shows the linear region of each run during the �rst 10-30 min.
N
O
NH2
R
HO
R'
H + ADHR
O R' +
NAD+ NADH
N
O
NH2
HH
R R
Scheme 4.2. Alcohol dehydrogenase catalyzes the reversible oxidation of a primary or secondary alcohol to an aldehyde or ketone in the presence of the cofactor NAD+.
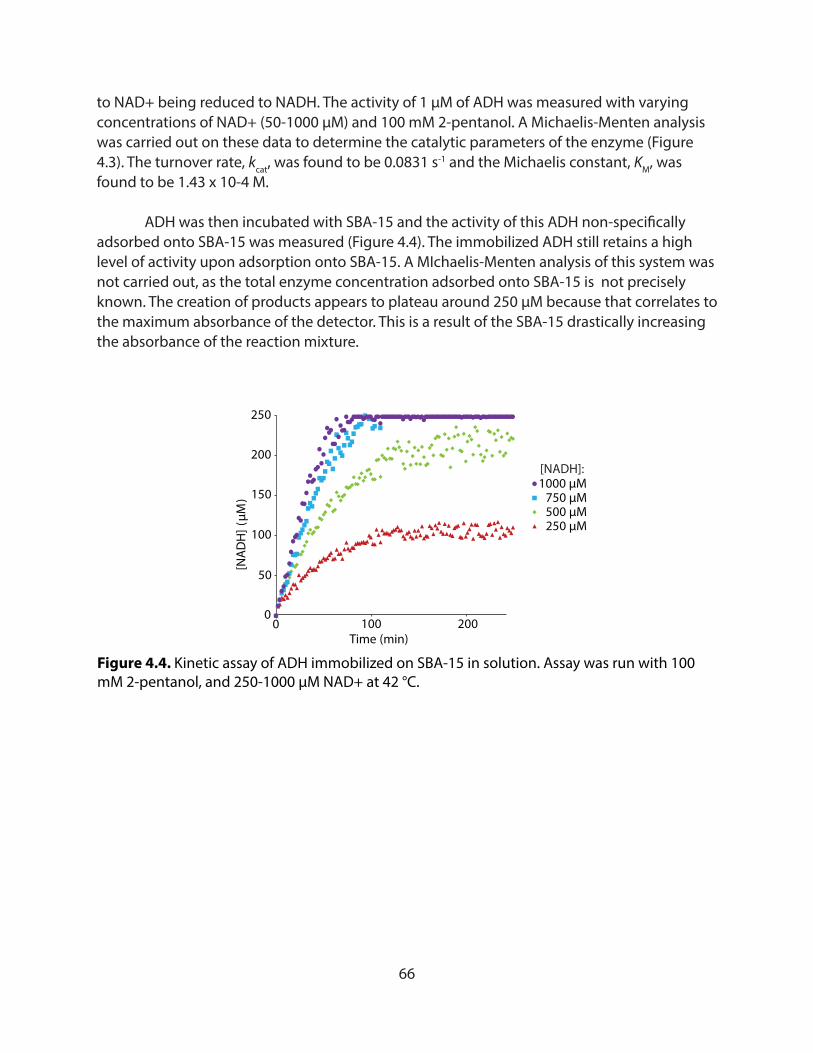
66
to NAD+ being reduced to NADH. The activity of 1 μM of ADH was measured with varying concentrations of NAD+ (50-1000 μM) and 100 mM 2-pentanol. A Michaelis-Menten analysis was carried out on these data to determine the catalytic parameters of the enzyme (Figure 4.3). The turnover rate, kcat, was found to be 0.0831 s-1 and the Michaelis constant, KM, was found to be 1.43 x 10⁻⁴ M.
ADH was then incubated with SBA-15 and the activity of this ADH non-specifically adsorbed onto SBA-15 was measured (Figure 4.4). The immobilized ADH still retains a high level of activity upon adsorption onto SBA-15. A MIchaelis-Menten analysis of this system was not carried out, as the total enzyme concentration adsorbed onto SBA-15 is not precisely known. The creation of products appears to plateau around 250 μM because that correlates to the maximum absorbance of the detector. This is a result of the SBA-15 drastically increasing the absorbance of the reaction mixture.
0
50
100
150
200
250
0 100 200
[NAD
H] (
μM)
Time (min)
1000 μM750 μM500 μM250 μM
Figure 4.4. Kinetic assay of ADH immobilized on SBA-15 in solution. Assay was run with 100 mM 2-pentanol, and 250-1000 μM NAD+ at 42 °C.
[NADH]:

67
4.2.3. Effect of Incubation Temperature, Concentration, and Time on Activity
We investigated the conditions to achieve the highest activity of alcohol dehydrogenase adsorbed onto SBA-15. Alcohol dehydrogenase (0 μM, 0.1 μM, 1 μM, 10 μM) was incubated onto SBA-15 for 15 min, 1, 5, or 20 h at 4, 23, or 37 °C. As shown in Figure 4.5, the incubation concentration has a major effect on the activity of the catalytic system. When incubated at 0.1 μM the activity was essentially the same as when no alcohol dehydrogenase was incubated on the SBA-15. It should be noted that incubating with 10 μM alcohol dehydrogenase is four to six times as active as when incubating with 1 μM alcohol dehydrogenase. There are no clear overall trends seen regarding the temperature and time variations in the incubation, although at 4 °C, the activity decreases slightly as the incubation time increases.
2
2.5
3
3.5
4
0 200 400 600
Abs
oran
ce (a
.u.)
Time (min)
15 min, 23 °C
0 μM 0.1 μM 1 μM 10 μM
0 200 400 600Time (min)
1 h, 23 °C
0 200 400 600Time (min)
5 h, 23 °C
0 200 400 600Time (min)
20 h, 23 °C
2
2.5
3
3.5
4
Abs
oran
ce (a
.u.)
0 200 400 600Time (min)
15 min, 37 °C
0 200 400 600Time (min)
1h, 37 °C
0 200 400 600Time (min)
5 h, 37 °C
0 200 400 600Time (min)
20 h, 37 °C
2
2.5
3
3.5
4
Abs
oran
ce (a
.u.)
0 200 400 600Time (min)
15 min, 4 °C
0 200 400 600Time (min)
1 h, 4 °C
0 200 400 600Time (min)
0 200 400 600Time (min)
5 h, 4 °C 20 h, 4 °C
Figure 4.5. A screen of the e�ect of incubation concentration (0 μM (gray), 0.1 μM (purple), 1 μM (green), and 10 μM (blue)), temperature (4 °C, 23 °C, and 37 °C), and time (15 min, 1 h, 5 h, and 20 h) on the activity of alcohol dehydrogenase immobilized on SBA-15.
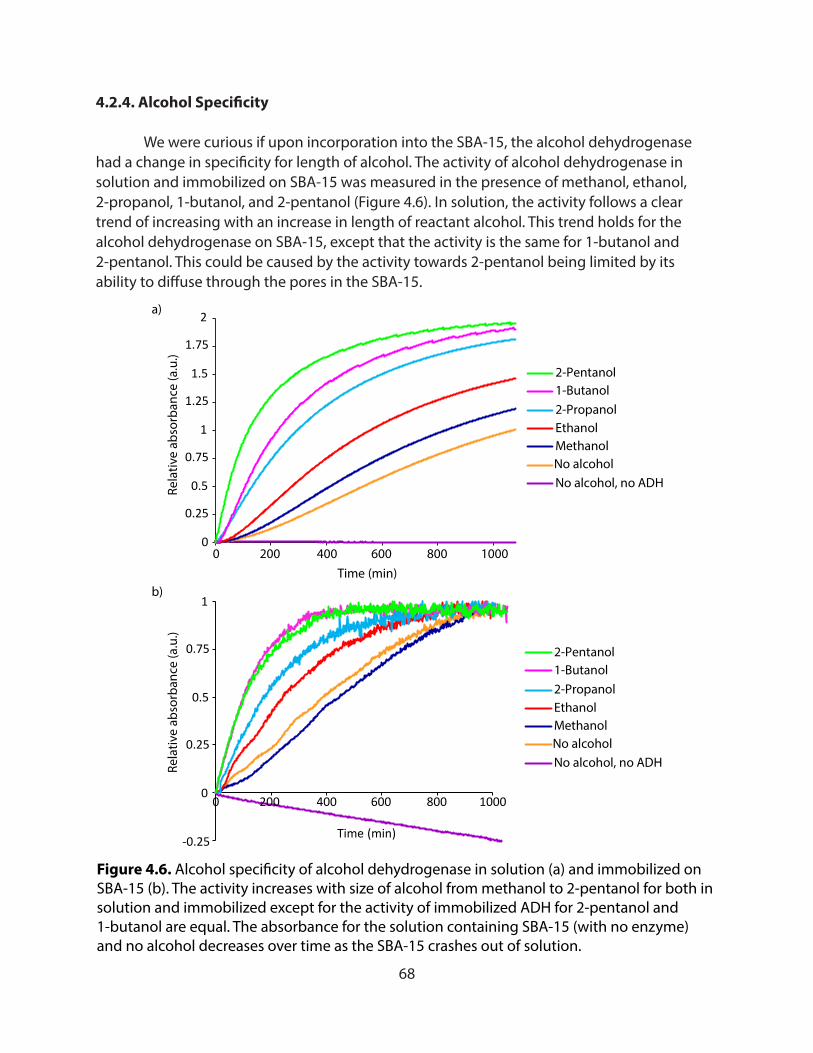
68
0
0.25
0.5
0.75
1
1.25
1.5
1.75
2
0 200 400 600 800 1000Time (min)
No alcohol, no ADHNo alcoholMethanolEthanol2-Propanol1-Butanol2-Pentanol
-0.25
0
0.25
0.5
0.75
1
a)
b)
0 200 400 600 800 1000
Time (min)
No alcohol, no ADHNo alcoholMethanolEthanol2-Propanol1-Butanol2-Pentanol
Rela
tive
abso
rban
ce (a
.u.)
Rela
tive
abso
rban
ce (a
.u.)
Figure 4.6. Alcohol speci�city of alcohol dehydrogenase in solution (a) and immobilized on SBA-15 (b). The activity increases with size of alcohol from methanol to 2-pentanol for both in solution and immobilized except for the activity of immobilized ADH for 2-pentanol and 1-butanol are equal. The absorbance for the solution containing SBA-15 (with no enzyme) and no alcohol decreases over time as the SBA-15 crashes out of solution.
4.2.4. Alcohol Specificity
We were curious if upon incorporation into the SBA-15, the alcohol dehydrogenase had a change in specificity for length of alcohol. The activity of alcohol dehydrogenase in solution and immobilized on SBA-15 was measured in the presence of methanol, ethanol, 2-propanol, 1-butanol, and 2-pentanol (Figure 4.6). In solution, the activity follows a clear trend of increasing with an increase in length of reactant alcohol. This trend holds for the alcohol dehydrogenase on SBA-15, except that the activity is the same for 1-butanol and 2-pentanol. This could be caused by the activity towards 2-pentanol being limited by its ability to diffuse through the pores in the SBA-15.
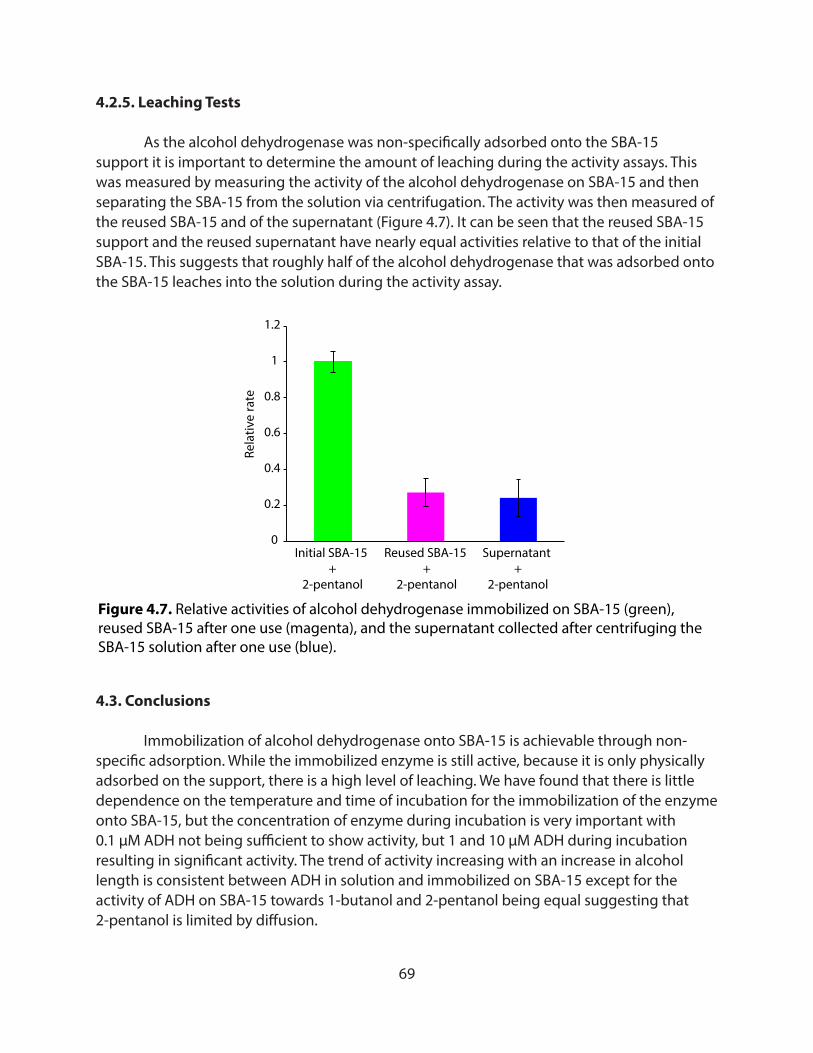
69
4.2.5. Leaching Tests
As the alcohol dehydrogenase was non-specifically adsorbed onto the SBA-15 support it is important to determine the amount of leaching during the activity assays. This was measured by measuring the activity of the alcohol dehydrogenase on SBA-15 and then separating the SBA-15 from the solution via centrifugation. The activity was then measured of the reused SBA-15 and of the supernatant (Figure 4.7). It can be seen that the reused SBA-15 support and the reused supernatant have nearly equal activities relative to that of the initial SBA-15. This suggests that roughly half of the alcohol dehydrogenase that was adsorbed onto the SBA-15 leaches into the solution during the activity assay.
4.3. Conclusions
Immobilization of alcohol dehydrogenase onto SBA-15 is achievable through non-specific adsorption. While the immobilized enzyme is still active, because it is only physically adsorbed on the support, there is a high level of leaching. We have found that there is little dependence on the temperature and time of incubation for the immobilization of the enzyme onto SBA-15, but the concentration of enzyme during incubation is very important with 0.1 μM ADH not being sufficient to show activity, but 1 and 10 μM ADH during incubation resulting in significant activity. The trend of activity increasing with an increase in alcohol length is consistent between ADH in solution and immobilized on SBA-15 except for the activity of ADH on SBA-15 towards 1-butanol and 2-pentanol being equal suggesting that 2-pentanol is limited by diffusion.
0
0.2
0.4
0.6
0.8
1
1.2
Initial SBA-15 +
2-pentanol
Rela
tive
rate
Reused SBA-15 +
2-pentanol
Supernatant +
2-pentanol
Figure 4.7. Relative activities of alcohol dehydrogenase immobilized on SBA-15 (green), reused SBA-15 after one use (magenta), and the supernatant collected after centrifuging the SBA-15 solution after one use (blue).

70
This method for immobilization is effective for one cycle of the reaction. But due to the significant amount of leaching, it would not be a particularly suitable method for multiple reuses of the catalyst. It may be possible to find a procedure that prevents this leaching in which case this ADH would be a fitting enzyme to use due to its high thermostability.
4.4. Materials and Methods
4.4.1. General Procedures and Materials
Unless otherwise noted, the chemicals and solvents used were of analytical grade and were used as received from commercial sources. Water (dd-H2O) used as a reaction solvent and in biological procedures was deionized using a Barnstead NANOpure purification system (ThermoFisher, Waltham, MA). Absorbance measurements of samples in 24 and 96–well plates were obtained on a Tecan Infinite 200 Pro plate reader. Fluorescence images of glass slides were taken on a Typhoon 9410 variable mode imager (Amersham Biosciences).
4.4.2. Instrumentation
Full Length Protein Mass Spectrometry Proteins were analyzed on an Agilent 6224 Time-of-Flight (TOF) mass spectrometer with a dual electrospray source connected in-line with an Agilent 1200 series HPLC (Agilent Technologies, USA). Chromatography was performed using a Proswift RP-4H (Thermo Scientific, USA) column with a H2O/MeCN gradient mobile phase containing 0.1% formic acid. Mass spectra of proteins and protein conjugates were deconvoluted with the MassHunter Qualitative Analysis Suite B.05 (Agilent Technologies, USA).
4.4.3. Preparation of SBA-15
Synthesis of SBA-15 Pluronic 123 (5 g) was dissolved in 180 mL of water and 20 ml of 36% HCl with stirring at 40 °C for 30 min in a 500 mL polypropylene bottle. 10 g of TEOS was added to the solution with stirring at 40 °C for 20 h. The mixture was heated at 100 °C for 24 h in a polypropylene bottle. The white powder was recovered through filtration, washed with water, and dried at 60 °C for 12 h. The product was then refluxed with ethanol three times (50 mL of ethanol per 1 g of product) for 12 h each.
Synthesis of 3-(4-azidophenyl)-N-(3-trimethoxysilylpropyl) Propanamide (Phenylazide Silane) Phenylazide silane was synthesized following a previously published protocol.32 Briefly, to a solution of 3-(4-azidophenyl) propionic acid (574 mg, 3.0 mmol) in 90 mL of anhydrous THF under positive nitrogen pressure were added DIPEA (0.7 mL, 7.5 mmol, excess) and pentafluorphenyl trifluoroacetate (0.64 mL, 3.75 mmol), which was added slowly over
71
20 min, resulting in the formation of dense, white fumes. The reaction was stirred for 2 h at RT. To this solution was added 3-aminopropyl trimethoxysilane (0.57 mL, 3.3 mmol), and the resulting solution was stirred under nitrogen at RT for 18 h. The solvent was then removed using a rotary evaporator. After purification by flash chromatography (100% EtOAc), a light-yellow oil was obtained, and confirmed by NMR.
One-pot Synthesis of Silanized SBA-15 The same procedure was followed as in the synthesis of unmodified SBA-15, except that phenylazide silane was included with the addition of TEOS (1:19 molar ratio of phenylazide silane to TEOS). The resulting powder was light-brown instead of white. After refluxing with ethanol, the product was added to a solution of 50 mM TCEP in 200 mM sodium phosphate buffer at pH 7.5 and incubated at RT with shaking for 30 min to reduce the phenylazide to aniline. Product was then filtered and dried in air overnight.
Post-synthesis Silanization of SBA-15 Unmodified SBA-15 (10 mg) was loaded into 1.6 mL Eppendorf tubes. 500 μL of a solution of 25 mM 3-(4-azidophenyl)-N-(3-trimethoxysilylpropyl) propanamide in methanol containing 1% v/v water and 148 mM acetic acid was added. Tubes were wrapped in foil and shaken for 2 h at room temperature. The SBA-15 was centrifuged (10K rpm, 4 °C, 3 min) and the supernatant was removed by pipetting. The SBA-15 was then rinsed by adding 1 mL of 148 mM acetic acid in methanol and shaking for 10 min. The SBA-15 was centrifuged, and the supernatant was removed. This rinsing was repeated two more times and then dried in an oven overnight. The SBA-15 was added to a solution of 50 mM TCEP in 200 mM sodium phosphate buffer at pH 7.5 and incubated at RT with shaking for 30 min to reduce the phenylazide to aniline. The product was rinsed by centrifuging, removing the supernatant, adding 1 mL of DI water, shaking for 10 min, and repeating the centrifugation process.
Characterization of fluorescently labeled SBA-15 10 mg of SBA-15 (unmodified, silanized during synthesis, and silanized post-synthesis) were loaded into 1.6 mL Eppendorf tubes and 240 μL of a solution of 10 μM aminophenol Oregon Green 488, 1 mM K3Fe(CN)6, and 250 mM NaCl in 10 mM phosphate buffer, pH 6.5 was added to each tube. The tubes were shaken for 1 h while covered in foil. The SBA-15 was centrifuged (10K rpm, 4 °C, 3 min) and the supernatant was removed by pipetting. The SBA-15 was then rinsed by adding 1 mL of 0.04% SDS and shaking at 23 °C for 10 min. The solution was centrifuged again, the supernatant was removed, and 1 mL of 10 mM phosphate, 250 mM NaCl, pH 7.5 buffer was added before shaking again. The solution was centrifuged once more, the supernatant was removed, and 200 μL of 10 mM phosphate buffer, pH 6.5 was added. 10 μL of each solution was dropped on a glass slide (15mm in diameter) and allowed to dry in air at room temperature while covered. Slides were analyzed using a Typhoon 9410 variable mode imager.
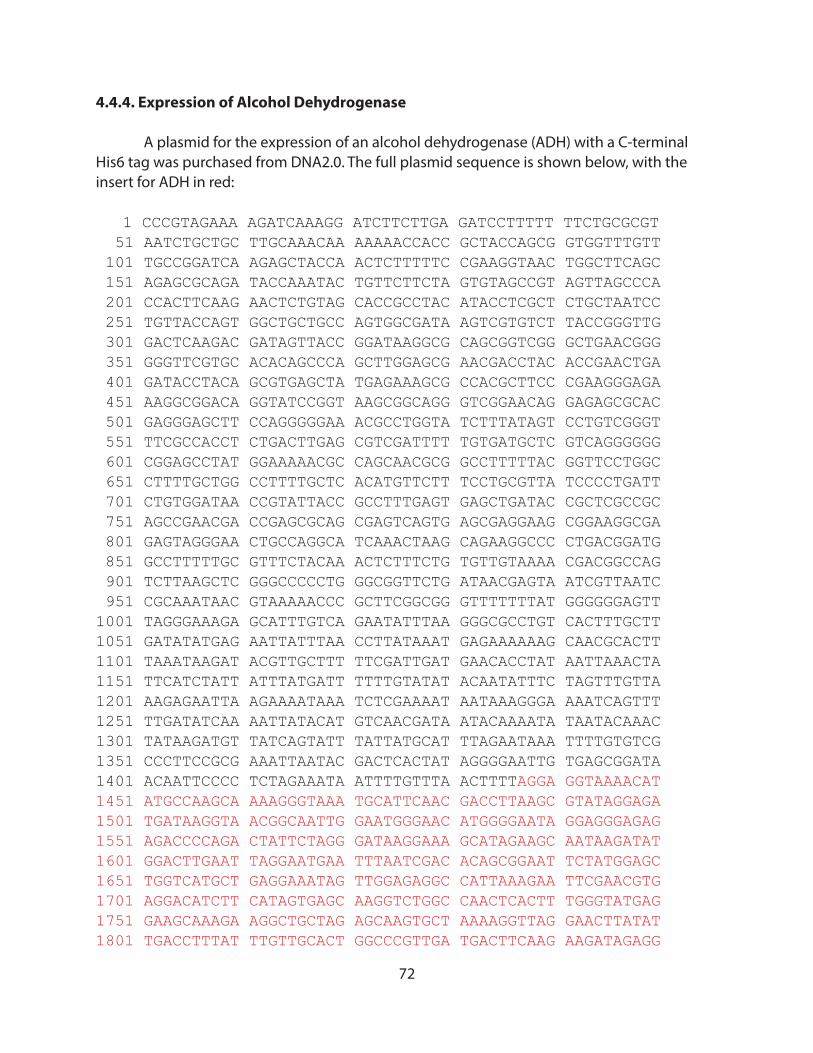
72
4.4.4. Expression of Alcohol Dehydrogenase
A plasmid for the expression of an alcohol dehydrogenase (ADH) with a C-terminal His6 tag was purchased from DNA2.0. The full plasmid sequence is shown below, with the insert for ADH in red:
1 CCCGTAGAAA AGATCAAAGG ATCTTCTTGA GATCCTTTTT TTCTGCGCGT 51 AATCTGCTGC TTGCAAACAA AAAAACCACC GCTACCAGCG GTGGTTTGTT 101 TGCCGGATCA AGAGCTACCA ACTCTTTTTC CGAAGGTAAC TGGCTTCAGC 151 AGAGCGCAGA TACCAAATAC TGTTCTTCTA GTGTAGCCGT AGTTAGCCCA 201 CCACTTCAAG AACTCTGTAG CACCGCCTAC ATACCTCGCT CTGCTAATCC 251 TGTTACCAGT GGCTGCTGCC AGTGGCGATA AGTCGTGTCT TACCGGGTTG 301 GACTCAAGAC GATAGTTACC GGATAAGGCG CAGCGGTCGG GCTGAACGGG 351 GGGTTCGTGC ACACAGCCCA GCTTGGAGCG AACGACCTAC ACCGAACTGA 401 GATACCTACA GCGTGAGCTA TGAGAAAGCG CCACGCTTCC CGAAGGGAGA 451 AAGGCGGACA GGTATCCGGT AAGCGGCAGG GTCGGAACAG GAGAGCGCAC 501 GAGGGAGCTT CCAGGGGGAA ACGCCTGGTA TCTTTATAGT CCTGTCGGGT 551 TTCGCCACCT CTGACTTGAG CGTCGATTTT TGTGATGCTC GTCAGGGGGG 601 CGGAGCCTAT GGAAAAACGC CAGCAACGCG GCCTTTTTAC GGTTCCTGGC 651 CTTTTGCTGG CCTTTTGCTC ACATGTTCTT TCCTGCGTTA TCCCCTGATT 701 CTGTGGATAA CCGTATTACC GCCTTTGAGT GAGCTGATAC CGCTCGCCGC 751 AGCCGAACGA CCGAGCGCAG CGAGTCAGTG AGCGAGGAAG CGGAAGGCGA 801 GAGTAGGGAA CTGCCAGGCA TCAAACTAAG CAGAAGGCCC CTGACGGATG 851 GCCTTTTTGC GTTTCTACAA ACTCTTTCTG TGTTGTAAAA CGACGGCCAG 901 TCTTAAGCTC GGGCCCCCTG GGCGGTTCTG ATAACGAGTA ATCGTTAATC 951 CGCAAATAAC GTAAAAACCC GCTTCGGCGG GTTTTTTTAT GGGGGGAGTT 1001 TAGGGAAAGA GCATTTGTCA GAATATTTAA GGGCGCCTGT CACTTTGCTT 1051 GATATATGAG AATTATTTAA CCTTATAAAT GAGAAAAAAG CAACGCACTT 1101 TAAATAAGAT ACGTTGCTTT TTCGATTGAT GAACACCTAT AATTAAACTA 1151 TTCATCTATT ATTTATGATT TTTTGTATAT ACAATATTTC TAGTTTGTTA1201 AAGAGAATTA AGAAAATAAA TCTCGAAAAT AATAAAGGGA AAATCAGTTT 1251 TTGATATCAA AATTATACAT GTCAACGATA ATACAAAATA TAATACAAAC 1301 TATAAGATGT TATCAGTATT TATTATGCAT TTAGAATAAA TTTTGTGTCG 1351 CCCTTCCGCG AAATTAATAC GACTCACTAT AGGGGAATTG TGAGCGGATA 1401 ACAATTCCCC TCTAGAAATA ATTTTGTTTA ACTTTTAGGA GGTAAAACAT 1451 ATGCCAAGCA AAAGGGTAAA TGCATTCAAC GACCTTAAGC GTATAGGAGA1501 TGATAAGGTA ACGGCAATTG GAATGGGAAC ATGGGGAATA GGAGGGAGAG 1551 AGACCCCAGA CTATTCTAGG GATAAGGAAA GCATAGAAGC AATAAGATAT 1601 GGACTTGAAT TAGGAATGAA TTTAATCGAC ACAGCGGAAT TCTATGGAGC 1651 TGGTCATGCT GAGGAAATAG TTGGAGAGGC CATTAAAGAA TTCGAACGTG 1701 AGGACATCTT CATAGTGAGC AAGGTCTGGC CAACTCACTT TGGGTATGAG 1751 GAAGCAAAGA AGGCTGCTAG AGCAAGTGCT AAAAGGTTAG GAACTTATAT1801 TGACCTTTAT TTGTTGCACT GGCCCGTTGA TGACTTCAAG AAGATAGAGG
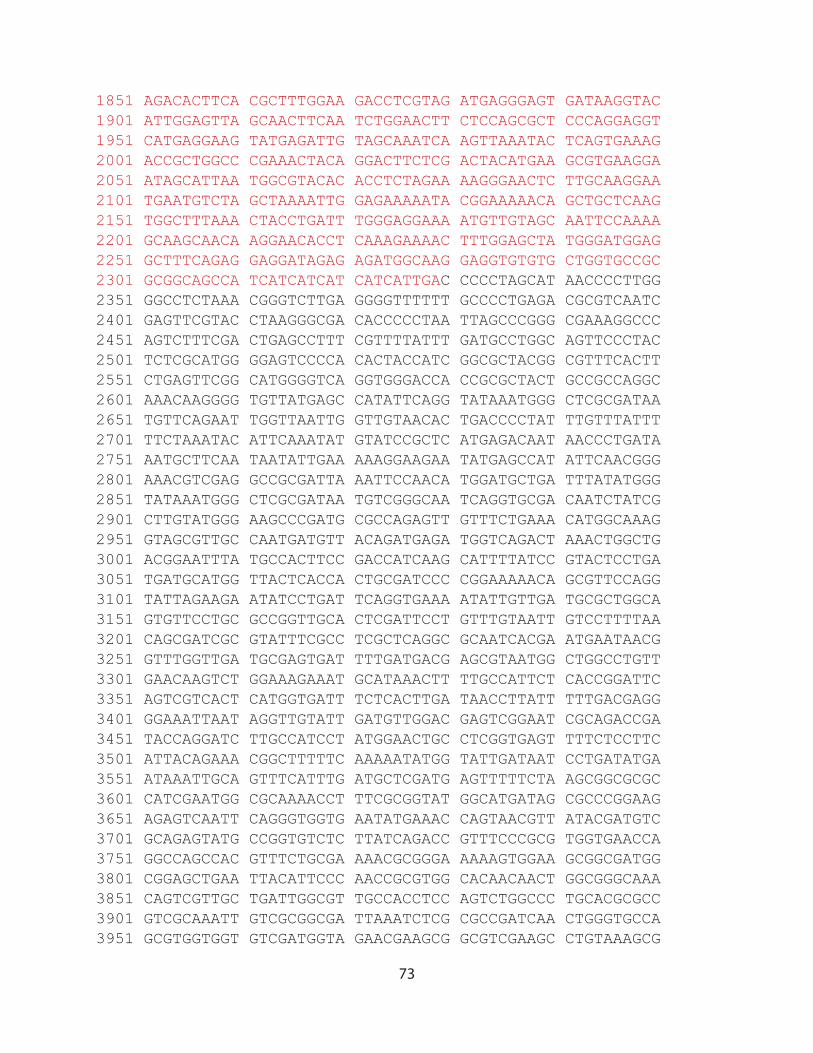
73
1851 AGACACTTCA CGCTTTGGAA GACCTCGTAG ATGAGGGAGT GATAAGGTAC 1901 ATTGGAGTTA GCAACTTCAA TCTGGAACTT CTCCAGCGCT CCCAGGAGGT 1951 CATGAGGAAG TATGAGATTG TAGCAAATCA AGTTAAATAC TCAGTGAAAG2001 ACCGCTGGCC CGAAACTACA GGACTTCTCG ACTACATGAA GCGTGAAGGA 2051 ATAGCATTAA TGGCGTACAC ACCTCTAGAA AAGGGAACTC TTGCAAGGAA2101 TGAATGTCTA GCTAAAATTG GAGAAAAATA CGGAAAAACA GCTGCTCAAG 2151 TGGCTTTAAA CTACCTGATT TGGGAGGAAA ATGTTGTAGC AATTCCAAAA 2201 GCAAGCAACA AGGAACACCT CAAAGAAAAC TTTGGAGCTA TGGGATGGAG 2251 GCTTTCAGAG GAGGATAGAG AGATGGCAAG GAGGTGTGTG CTGGTGCCGC 2301 GCGGCAGCCA TCATCATCAT CATCATTGAC CCCCTAGCAT AACCCCTTGG2351 GGCCTCTAAA CGGGTCTTGA GGGGTTTTTT GCCCCTGAGA CGCGTCAATC2401 GAGTTCGTAC CTAAGGGCGA CACCCCCTAA TTAGCCCGGG CGAAAGGCCC2451 AGTCTTTCGA CTGAGCCTTT CGTTTTATTT GATGCCTGGC AGTTCCCTAC 2501 TCTCGCATGG GGAGTCCCCA CACTACCATC GGCGCTACGG CGTTTCACTT 2551 CTGAGTTCGG CATGGGGTCA GGTGGGACCA CCGCGCTACT GCCGCCAGGC 2601 AAACAAGGGG TGTTATGAGC CATATTCAGG TATAAATGGG CTCGCGATAA 2651 TGTTCAGAAT TGGTTAATTG GTTGTAACAC TGACCCCTAT TTGTTTATTT2701 TTCTAAATAC ATTCAAATAT GTATCCGCTC ATGAGACAAT AACCCTGATA 2751 AATGCTTCAA TAATATTGAA AAAGGAAGAA TATGAGCCAT ATTCAACGGG 2801 AAACGTCGAG GCCGCGATTA AATTCCAACA TGGATGCTGA TTTATATGGG 2851 TATAAATGGG CTCGCGATAA TGTCGGGCAA TCAGGTGCGA CAATCTATCG 2901 CTTGTATGGG AAGCCCGATG CGCCAGAGTT GTTTCTGAAA CATGGCAAAG 2951 GTAGCGTTGC CAATGATGTT ACAGATGAGA TGGTCAGACT AAACTGGCTG3001 ACGGAATTTA TGCCACTTCC GACCATCAAG CATTTTATCC GTACTCCTGA 3051 TGATGCATGG TTACTCACCA CTGCGATCCC CGGAAAAACA GCGTTCCAGG 3101 TATTAGAAGA ATATCCTGAT TCAGGTGAAA ATATTGTTGA TGCGCTGGCA 3151 GTGTTCCTGC GCCGGTTGCA CTCGATTCCT GTTTGTAATT GTCCTTTTAA 3201 CAGCGATCGC GTATTTCGCC TCGCTCAGGC GCAATCACGA ATGAATAACG 3251 GTTTGGTTGA TGCGAGTGAT TTTGATGACG AGCGTAATGG CTGGCCTGTT3301 GAACAAGTCT GGAAAGAAAT GCATAAACTT TTGCCATTCT CACCGGATTC 3351 AGTCGTCACT CATGGTGATT TCTCACTTGA TAACCTTATT TTTGACGAGG 3401 GGAAATTAAT AGGTTGTATT GATGTTGGAC GAGTCGGAAT CGCAGACCGA 3451 TACCAGGATC TTGCCATCCT ATGGAACTGC CTCGGTGAGT TTTCTCCTTC 3501 ATTACAGAAA CGGCTTTTTC AAAAATATGG TATTGATAAT CCTGATATGA3551 ATAAATTGCA GTTTCATTTG ATGCTCGATG AGTTTTTCTA AGCGGCGCGC3601 CATCGAATGG CGCAAAACCT TTCGCGGTAT GGCATGATAG CGCCCGGAAG 3651 AGAGTCAATT CAGGGTGGTG AATATGAAAC CAGTAACGTT ATACGATGTC 3701 GCAGAGTATG CCGGTGTCTC TTATCAGACC GTTTCCCGCG TGGTGAACCA 3751 GGCCAGCCAC GTTTCTGCGA AAACGCGGGA AAAAGTGGAA GCGGCGATGG 3801 CGGAGCTGAA TTACATTCCC AACCGCGTGG CACAACAACT GGCGGGCAAA 3851 CAGTCGTTGC TGATTGGCGT TGCCACCTCC AGTCTGGCCC TGCACGCGCC3901 GTCGCAAATT GTCGCGGCGA TTAAATCTCG CGCCGATCAA CTGGGTGCCA 3951 GCGTGGTGGT GTCGATGGTA GAACGAAGCG GCGTCGAAGC CTGTAAAGCG
74
4001 GCGGTGCACA ATCTTCTCGC GCAACGCGTC AGTGGGCTGA TCATTAACTA 4051 TCCGCTGGAT GACCAGGATG CCATTGCTGT GGAAGCTGCC TGCACTAATG 4101 TTCCGGCGTT ATTTCTTGAT GTCTCTGACC AGACACCCAT CAACAGTATT 4151 ATTTTCTCCC ATGAGGACGG TACGCGACTG GGCGTGGAGC ATCTGGTCGC4201 ATTGGGTCAC CAGCAAATCG CGCTGTTAGC GGGCCCATTA AGTTCTGTCT 4251 CGGCGCGTCT GCGTCTGGCT GGCTGGCATA AATATCTCAC TCGCAATCAA 4301 ATTCAGCCGA TAGCGGAACG GGAAGGCGAC TGGAGTGCCA TGTCCGGTTT 4351 TCAACAAACC ATGCAAATGC TGAATGAGGG CATCGTTCCC ACTGCGATGC4401 TGGTTGCCAA CGATCAGATG GCGCTGGGCG CAATGCGCGC CATTACCGAG 4451 TCCGGGCTGC GCGTTGGTGC GGATATCTCG GTAGTGGGAT ACGACGATAC4501 CGAAGATAGC TCATGTTATA TCCCGCCGTT AACCACCATC AAACAGGATT 4551 TTCGCCTGCT GGGGCAAACC AGCGTGGACC GCTTGCTGCA ACTCTCTCAG 4601 GGCCAGGCGG TGAAGGGCAA TCAGCTGTTG CCAGTCTCAC TGGTGAAAAG 4651 AAAAACCACC CTGGCGCCCA ATACGCAAAC CGCCTCTCCC CGCGCGTTGG 4701 CCGATTCATT AATGCAGCTG GCACGACAGG TTTCCCGACT GGAAAGCGGG 4751 CAGTGACTCA TGACCAAAAT CCCTTAACGT GAGTTACGCG CGCGTCGTTC4801 CACTGAGCGT CAGAC
Plasmid for ADH was transformed into One Shot® BL21 (DE3) competent E. coli cells (Invitrogen). Transformed cells were added to Luria broth (LB) agar plates containing kanamycin (50 μg/mL) and incubated overnight at 37 °C. Isolated colonies were grown overnight in 4 mL of LB containing kanamycin (50 μg/mL) at 37 °C. Cultures grown overnight were added to 1 L of LB containing kanamycin (50 μg/mL) at 37 °C until an optical density (OD) of 0.6 was observed at 600 nm. Expression of ADH-His6 was induced by the addition of 2 mL of 0.1 mM isopropyl β-D-1-thiogalactopyranoside (IPTG). Cultures were grown for 18 h at 37 °C and then centrifuged (8000 rpm, 4 °C, 15 min) to pellet the cells. The cells were resuspended in 12 mL of lysis buffer (50 mM NaH2PO4, 300 mM NaCl, 10 mM imidazole, pH 8.0), lysed by sonication (FisherbrandTM Model 120 Sonic Dismembrator, 2 s on, 4 s off, 50% amplitude) for 30 min, and cell debris was removed by centrifugation (11,000 rcf, 4 °C, 1h). The cleared cell lysate was incubated with 5 mL of rinsed nickel-nitrilotriacetic acid resin (Ni-NTA) in a 20 mL cartridge for 1 h at 4 °C. The resin-bound protein was washed with three 10 mL portions of wash buffer (50 mM NaH2PO4, 300 mM NaCl, 20 mM imidazole, pH 8.0), then eluted with six 1.25 mL portions of elution buffer (50 mM NaH2PO4, 300 mM NaCl, 250 mM imidazole, pH 8.0).
Protein fractions from Ni-NTA column were run on sodium dodecyl sulfate-polyacrylamide gel electrophoresis (SDS-PAGE) carried out on a Mini Gel Tank apparatus from Life Technologies following the manufacturer’s protocols. MOPS buffer purchased from Life Technologies was used as the electrode buffer. All protein electrophoresis samples were heated for at least 15 minutes at 100 °C in the presence of 1,4-dithiothreitol (DTT) to ensure reduction of any disulfide bonds. NuPAGE Bis-Tris Mini Gels (12%) were run for 50 min at 200 V to allow good resolution of bands. Commercially available markers (Bio Rad) were applied to at least one lane of each gel for assignment of apparent molecular masses. Visualization of
75
protein bands was accomplished by staining with Coomassie Brilliant Blue R-250. Gel imaging was performed on a Gel Doc EZTM Imager (Bio Rad). The fractions containing purified protein were combined and lyophilized yielding 250 mg of protein.
4.4.5. Activity Assay of Alcohol Dehydrogenase in Solution
Activity of alcohol dehydrogenase was measured in a 96-well plate. Each well had alcohol dehydrogenase, NAD+, and 2-pentanol added to it such that the final concentrations were 1 μM alcohol dehydrogenase, 1 mM NAD+, and 100 mM 2-pentanol in 250 μL total reaction volume of the activity assay buffer (250 mM glycine, pH 8.5). Prior to adding the 2-pentanol, the plate was equilibrated to 42 °C. After the addition of 2-pentanol, the absorbance at 340 nm was measured every 2 min for 5 h while holding the temperature at 42 °C (Tecan Infinite 200 Pro plate reader). Samples were run in triplicate.
4.4.6. Immobilization of Alcohol Dehydrogenase onto SBA-15
Eppendorf tubes (1.6 mL) were loaded with SBA-15 (10 mg). To each tube was added 300 μL alcohol dehydrogenase (0.1-10 μM) in 50 mM phosphate buffer, pH 8.5. The tubes were shaken for a varying amount of time (0.25-20 h) at either 4, 23, or 37 °C. The SBA-15 was centrifuged (10K rpm, 4 °C, 3 min) and the supernatant was removed by pipetting. The SBA-15 was then rinsed by adding 1 mL of 0.04% SDS and shaking at 23 °C for 10 min. The solution was centrifuged again, the supernatant was removed, and 1 mL of 10 mM phosphate, 250 mM NaCl, pH 7.5 buffer was added before shaking again. This process was repeated two more times with the activity assay buffer (250 mM glycine, pH 8.5).
4.4.7. Activity Assay of Alcohol Dehydrogenase on SBA-15
Activity of the immobilized alcohol dehydrogenase was measured in a 96-well plate. Each well had a slurry of SBA-15 incubated with alcohol dehydrogenase in 200 μL of the activity assay buffer. NAD+, and 2-pentanol were added to each well such that the final concentrations were 1 μM alcohol dehydrogenase, 1 mM NAD+, and 100 mM 2-pentanol in 250 μL total reaction volume of the activity assay buffer (250 mM glycine, pH 8.5). Prior to adding the 2-pentanol, the plate was equilibrated to 42 °C. After the addition of 2-pentanol, the absorbance at 340 nm was measured every 2 min for 5 h while holding the temperature at 42 °C (Tecan Infinite 200 Pro plate reader) with shaking for 5 sec every minute. Samples were run in triplicate.
4.4.8. Screen of Activity for Various Alcohols
Activity of alcohol dehydrogenase free in solution and immobilized on SBA-15 were measured as described above with 100 mM of methanol, ethanol, 2-propanol, 1-butanol, or 2-pentanol.
76
4.4.9. Determination of Leaching of Enzyme from SBA-15
To measure the extent of leaching of alcohol dehydrogenase from SBA-15, the activity of immobilized alcohol dehydrogenase was measured as described above. The solutions from each well were then pipetted out of the well plate and loaded into 1.6 mL Eppendorf tubes. These solutions were centrifuged (10K rpm, 4 °C, 3 min) and the supernatants were pipetted into separate Eppendorf tubes. 200 μL of activity assay buffer was added to each of the Eppendorf tubes still loaded with SBA-15.
All of the solutions were transferred to a new 96-well plate. NAD+ and 2-pentanol were added to each well such that the final concentrations 1 mM NAD+, and 100 mM 2-pentanol in 250 μL total reaction volume of the activity assay buffer. Prior to adding the 2-pentanol, the plate was equilibrated to 42 °C. After the addition of 2-pentanol, the absorbance at 340 nm was measured every 2 min for 5 h while holding the temperature at 42 °C (Tecan Infinite 200 Pro plate reader) with shaking for 5 seconds every minute. Samples were run in triplicate.
4.5. References
1. Harlick, P. J. E.; Sayari, A., Applications of Pore-Expanded Mesoporous Silicas. 3. Triamine Silane Grafting for Enhanced CO2 Adsorption. Ind. Eng. Chem. Res. 2006, 45, 3248-3255
2. Feng, X.; Fryxell, G. E.; Wang, L. Q.; Kim, A. Y.; Liu, J.; Kemner, K. M., Functionalized Monolayers on Ordered Mesoporous Supports. Science 1997, 276, 923–926
3. Song, S. W.; Hidajat, K.; Kawi, S., Functionalized SBA-15 Materials as Carriers for Controlled Drug Delivery: Influence of Surface Properties on Matrix-Drug Interactions. Langmuir 2005, 21, 9568–9575.
4. Ye, R.; Zhukhovitskiy, A. V.; Kazantsev, R. V.; Fakra, S. C.; Wickemeyer, B. B.; Toste, F. D.; Somorjai, G. A., Supported Au Nanoparticles with N -Heterocyclic Carbene Ligands as Active and Stable Heterogeneous Catalysts for Lactonization. J. Am. Chem. Soc. 2018, 140, 4144–4149
5. Wang, Y.; Caruso, F., Mesoporous Silica Spheres as Supports for Enzyme Immobilization and Encapsulation. Chem. Mater. 2005, 17, 953–961
6. Veisi, H.; Sedrpoushan, A.; Faraji, A. R.; Heydari, M.; Hemmati, S.; Fatahi, B. A., Mesoporous SBA-15 Silica Catalyst Functionalized with Phenylsulfonic Acid Groups (SBA-15-Ph-SO3H) as a Novel Hydrophobic Nanoreactor Solid Acid Catalyst for a One-Pot Three-Component Synthesis of 2H-Indazolo[2,1-b]Phthalazine-Triones and Triazolo[1,2-a]indazole-triones. RSC Adv. 2015, 5, 68523–68530
7. Takahashi, H.; Li, B.; Sasaki, T.; Miyazaki, C.; Kajino, T.; Inagaki, S., Catalytic Activity in Organic Solvents and Stability of Immobilized Enzymes Depend on the Pore Size and Surface Characteristics of Mesoporous Silica. Chem. Mater. 2000, 12, 3301–3305
77
8. Dai, Z.; Liu, S.; Ju, H.; Chen, H., Direct Electron Transfer and Enzymatic Activity of Hemoglobin in a Hexagonal Mesoporous Silica Matrix. Biosens. Bioelectron. 2004, 19, 861–867
9. Li, Y.; Wang, W.; Han, P., Immobilization of Candida Sp.99-125 Lipase onto Silanized SBA-15 Mesoporous Materials by Physical Adsorption. Korean J. Chem. Eng. 2014, 31, 98–103
10. Popat, A.; Hartono, S. B.; Stahr, F.; Liu, J.; Qiao, S. Z.; Lu, G. Q., Mesoporous Silica Nanoparticles for Bioadsorption, Enzyme Immobilisation, and Delivery Carriers. Nanoscale 2011, 3, 2801–2818
11. Zhao, D.; Feng, J.; Huo, Q.; Melosh, N.; Fredrickson, G. H.; Chmelka, B. F.; Stucky, G. D., Triblock Copolymer Syntheses of Mesoporous Silica with Periodic 50 to 300 Angstrom Pores. Science 1998, 279, 548–552
12. Zhao, D.; Huo, Q.; Feng, J.; Chmelka, B. F.; Stucky, G. D., Nonionic Triblock and Star Diblock Copolymer and Oligomeric Sufactant Syntheses of Highly Ordered, Hydrothermally Stable, Mesoporous Silica Structures. J. Am. Chem. Soc. 1998, 120, 6024–6036
13. Zhao, D.; Sun, J.; Li, Q.; Stucky, G. D., Morphological Control of Highly Ordered Mesoporous Silica SBA-15. Chem. Mater. 2000, 12, 275–279
14. Cassiers, K.; Linssen, T.; Mathieu, M.; Benjelloun, M.; Schrijnemakers, K.; Van Der Voort, P.; Cool, P.; Vansant, E. F. A., Detailed Study of Thermal, Hydrothermal, and Mechanical Stabilities of a Wide Range of Surfactant Assembled Mesoporous Silicas. Chem. Mater. 2002, 14, 2317-2324
15. Akers, N. L.; Moore, C. M.; Minteer, S. D., Development of Alcohol/O2 Biofuel Cells Using Salt-Extracted Tetrabutylammonium Bromide/Nafion Membranes to Immobilize Dehydrogenase Enzymes. Electrochim. Acta 2005, 50, 2521–2525
16. Atsumi, S.; Wu, T. Y.; Eckl, E. M.; Hawkins, S. D.; Buelter, T.; Liao, J. C., Engineering the Isobutanol Biosynthetic Pathway in Escherichia Coli by Comparison of Three Aldehyde Reductase/Alcohol Dehydrogenase Genes. Appl. Microbiol. Biotechnol. 2010, 85, 651–657
17. Palmore, G. T. R.; Bertschy, H.; Bergens, S. H.; Whitesides, G. M., A Methanol/Dioxygen Biofuel Cell That Uses NAD+-Dependent Dehydrogenases as Catalysts: Application of an Electro-Enzymatic Method to Regenerate Nicotinamide Adenine Dinucleotide at Low Overpotentials. J. Electroanal. Chem. 1998, 443, 155–161
18. Bes, M. T.; Gomez-Moreno, C.; Guisan, J. M.; Fernandez-Lafuente, R., Selective Oxidation: Stabilisation by Multipoint Attachment of Ferredoxin NADP+reductase, an Interesting Cofactor Recycling Enzyme. J. Mol. Catal. A. Chem. 1995, 3, 161–169
19. Klibanov, A. M., Stabilization of Enzymes against Thermal Inactivation. Adv. Appl. Microbiol. 1983, 29, 1–28
20. Martinek, K.; Klibanov, A. M.; Goldmacher, V. S.; Berezin, I. V., The Principles of Enzyme Stabilization I. Increase in Thermostability of Enzymes Covalently Bound to a Complementary Surface of a Polymer Support in a Multipoint Fashion. BBA - Enzymol. 1977, 485, 1–12
78
21. Dekker, R. F. H., Immobilization of a Lactase onto a Magnetic Support by Covalent Attachment to Polyethyleneimine-Glutaraldehyde-Activated Magnetite. Appl. Biochem. Biotechnol. 1989, 22, 289–310
22. Burkett, S. L.; Sims, S. D.; Mann, S., Synthesis of Hybrid Inorganic-Organic Mesoporous Silica by Co-Condensation of Siloxane and Organosiloxane Precursors. Chem. Commun. 1996, 1367–1368
23. Chong, A. S. M.; Zhao, X. S., Functionalization of SBA-15 with APTES and Characterization of Functionalized Materials. J. Phys. Chem. B 2003, 107, 12650–12657
24. Margolese, D.; Melero, J. A.; Christiansen, S. C.; Chmelka, B. F.; Stucky, G. D., Direct Syntheses of Ordered SBA-15 Mesoporous Silica Containing Sulfonic Acid Groups. Chem. Mater. 2000, 12, 2448–2459