immunological and mass spectrometry-based approaches to
TRANSCRIPT

Immunological and mass spectrometry-based approaches
to determine thresholds of the mutagenic DNA adduct O6-
methylguanine in vivo
Alexander Kraus1,‡, Maureen McKeague2,‡, Nina Seiwert1,3, Georg Nagel1, Susanne
M. Geisen2, Nathalie Ziegler2, Ioannis A. Trantakis2, Bernd Kaina1, Adam D.
Thomas4, Shana J. Sturla2, Jörg Fahrer1,3,*
1 Department of Toxicology, University Medical Center, Mainz, Germany
2 Department of Health Sciences and Technology, ETH Zurich, Switzerland
3 Rudolf-Buchheim-Institute of Pharmacology, Justus-Liebig-University, Giessen,
Germany
4 Centre for Research in Biosciences, University of the West of England, Bristol, UK
* Correspondence should be addressed to: Jörg Fahrer, PhD, Rudolf Buchheim
Institute of Pharmacology, Justus-Liebig-University Giessen, Schubertstr. 81, D-
35392 Giessen, Germany. Tel.: +49 (0)641 99-47603; Fax: +49 (0)641 99-47619; E-
Mail: [email protected]
‡ authors contributed equally
RUNNING TITLE: Analysis of O6-methylguanine and threshold determination
KEY WORDS: O6-methylguanine, O6-methylguanine-DNA methyltransferase (MGMT),
alkylating agents, ultra-performance liquid chromatography-tandem mass spectrometry,
thresholds
CONFLICT OF INTEREST: The authors declare no conflict of interest.

ABSTRACT N-nitroso compounds are alkylating agents, which occur widespread in diet and environment.
They induce DNA alkylation adducts such as O6-methylguanine (O6-MeG), which is repaired
by O6-methylguanine-DNA methyltransferase (MGMT). Persistent O6-MeG lesions have
detrimental biological consequences like mutagenicity and cytotoxicity. Due to its pivotal role
in the etiology of cancer and in cytotoxic cancer therapy, it is important to detect and quantify
O6-MeG in biological specimens in a sensitive and accurate manner. Here, we used
immunological approaches and established an ultra-performance liquid chromatography-
tandem mass spectrometry (UPLC-MS/MS) to monitor O6-MeG adducts. First, colorectal
cancer (CRC) cells were treated with the methylating anticancer drug temozolomide (TMZ).
Immunofluorescence microscopy and an immuno-slot blot assay, both based on an adduct-
specific antibody, allowed for the semi-quantitative, dose-dependent assessment of O6-MeG
in CRC cells. Using the highly sensitive and specific UPLC-MS/MS, TMZ-induced O6-MeG
adducts were quantified in CRC cells and even in peripheral blood mononuclear cells
exposed to clinically relevant TMZ doses. Furthermore, all methodologies were used to
detect O6-MeG in wildtype (WT) and MGMT-deficient mice challenged with the carcinogen
azoxymethane. UPLC-MS/MS measurements and dose-response modeling revealed a non-
linear formation of hepatic and colonic O6-MeG adducts in WT, whereas linear O6-MeG
formation without a threshold was observed in MGMT-deficient mice. Collectively, the UPLC-
MS/MS analysis is highly sensitive and specific for O6-MeG, thereby allowing for the first time
for the determination of thresholds upon exposure to O6-methylating agents. We envision
that this method will be instrumental to monitor the efficacy of methylating chemotherapy and
to assess dietary exposures.
INTRODUCTION
Genotoxic N-nitroso compounds (NOC) are widespread in our diet and environment. They
are found in processed meat and fish, beer, cosmetics and cigarette smoke (Fahrer and
Kaina 2013). Furthermore, NOC are formed endogenously in the stomach and the large
intestine by nitrosation of amino acids (Fahrer and Kaina 2013). These critical compounds
cause DNA alkylation and thereby generate a plethora of DNA adducts, such as N-
methylpurines and O6-methylguanine (O6-MeG) (Fu et al. 2012). O6-MeG is repaired by the
suicide enzyme O6-methylguanine-DNA methyltransferase (MGMT) in a damage reversal
reaction by transferring the methyl group from O6-MeG onto a cysteine residue located in its
active site (Daniels et al. 2004). The S-methylation of MGMT leads to its inactivation and
concomitant degradation by the ubiquitin-proteasome pathway (Xu-Welliver and Pegg 2002).
Interestingly, a number of compounds modulate the MGMT level and its transferase activity.
Antioxidants such as N-acetyl cysteine and the polyphenol curcumin were shown to increase
MGMT activity (Niture et al. 2007), whereas the disulfide compound and dietary supplement
α-lipoic acid (LA) was identified as natural MGMT inhibitor (Dörsam and Fahrer 2016; Göder
et al. 2015). Importantly, persistent O6-MeG lesions have detrimental biological
consequences including mutagenicity and carcinogenicity (Kaina et al. 2007). Apart from
that, O6-MeG has also cytotoxic potential due to the downstream generation of DNA double-
strand breaks (DSBs) (Mojas et al. 2007; Ochs and Kaina 2000; Quiros et al. 2010).
NOC-related compounds such as dimethylhydrazine and its metabolite azoxymethane
(AOM) are frequently used in rodents to initiate colon carcinogenesis through induction of O6-
MeG and other alkylated DNA bases (Neufert et al. 2007). Alkylating agents play also an
important role in cancer chemotherapy due to their induction of cytotoxic DSBs, resulting
mainly from subsequent replications over O6-MeG. These methylating anticancer drugs
include temozolomide (TMZ) and dacarbazine (DTIC), which are both triazine compounds
used for the treatment of high-grade glioma and malignant melanoma (Kaina et al. 2010).
Thus, understanding the basis of O6-MeG formation and how its repair is regulated are
critical in broad biological questions, ranging from fundamental mechanisms of mutagenesis
to creating strategies to overcome clinical resistance to cancer therapeutics. However,
gaining a functional and quantitative picture of how much O6-MeG is in genomic DNA from
cells and tissues remains difficult. Immunological assays for detection of O6-MeG have been
developed that are based upon a monoclonal antibody against the adduct (Seiler et al.
1993). This O6-MeG antibody has been used to visualize the DNA lesion in fixed cultured
cells and organs, e.g. liver and colon, by immunofluorescence microscopy (Fahrer et al.
2015; Seiler et al. 1993). In addition, the antibody has been successfully employed for
immuno-slot blot (ISB) analysis of O6-MeG lesions in genomic DNA extracted from cells and
tissue (Fahrer et al. 2015; Mikhed et al. 2016; Stephanou et al. 1996), and an ELISA-related
assay, in which single-stranded (ss) DNA fragments with O6-MeG were captured by the
antibody followed by the detection of the ssDNA (Georgiadis et al. 2011). Complementary to
immunoassay strategies, DNA adducts have been measured in diverse sample matrices by
liquid chromatography combined with tandem mass spectrometry (LC-MS/MS). This
approach was successfully used to quantify O6-MeG in lung and liver DNA (≥ 50 µg) from
rats chronically exposed to 10 ppm of the tobacco-specific nitrosamine 4-
(methylnitrosamino)-1-(3-pyridyl)-1-butanone (NNK), which worked with fresh-frozen and
formalin-fixed paraffin-embedded tissue (Guo et al. 2016; Upadhyaya et al. 2009). By means
of LC-MS/MS, the formation of O6-MeG was also monitored in calf thymus DNA and genomic
DNA (100 µg) from colorectal cancer cells challenged in vitro with potassium diazoacetate at
mM doses (Vanden Bussche et al. 2012).
Here, we performed a head-to-head comparison of these methods and examined the scope
of each method for measuring O6-MeG adducts in both cells and tissues isolated from
animals exposed to the anticancer drug TMZ and the colonotropic carcinogen AOM. Our
data illustrated that both immunofluorescence (IF) and immunoslot blot (ISB) assay permitted
the time- and dose-dependent detection of O6-MeG in CRC cells in a semi-quantitative
manner, but are limited in sensitivity as illustrated in colon tissue exposed to low AOM doses.
The UPLC-MS/MS approach was demonstrated to be highly sensitive and specific, allowing
for the quantification of O6-MeG adducts in CRC cells and peripheral blood mononuclear

cells (PBMCs) at clinically relevant TMZ doses. Furthermore, the dose-response curve of
AOM-induced O6-MeG formation was assessed by mass spectrometry in liver and colon
tissue of mice differing in their MGMT repair status. Using hockey-stick dose-response
modeling, our data revealed, for the first time, a genotoxic threshold for O6-MeG formation in
vivo, resulting from MGMT repair activity.

MATERIAL AND METHODS
Material
All solutions were made with deionized water (18.2 MΩ resistivity). O6-methyl-d3-guanine (O6-
Me-d3-G) was from Toronto Research Chemicals (Toronto, Canada). O6-MeG, ammonium
hydroxide (ACS Reagent 28-30 %), hydrochloric acid (ACS Reagent 37 %), and acetic acid
(HPLC grade) were purchased from Sigma-Aldrich (Buchs, Switzerland). Guanine was
obtained from Acros Organics (New Jersey, USA) and Strata-X polymeric columns (30 μm)
were from Phenomenex (Torrance, USA). Methanol (HPLC Gradient Grade) was bought at
VWR (Dietikon, Switzerland).
Cell Culture
HCT116 colorectal cancer cells were kindly provided by Dr. Bert Vogelstein (John Hopkins
University, Baltimore, USA). HCT116 cells were cultured in DMEM (Life Technologies,
Darmstadt, Germany) supplemented with 10 % FCS and antibiotics (100 U/mL penicillin and
100 μg/mL streptomycin). PBMCs (peripheral blood mononuclear cells) were isolated from
buffy coat by density centrifugation as described previously (Heylmann and Kaina 2016).
Buffy coat from human healthy donors was provided by the blood transfusion center at
University Medical Center, Mainz, Germany. Blood samples were layered on Histopaque
(Sigma-Aldrich, Deisenhofen, Germany) and centrifuged at 2500 rpm for 35 min at RT
without the brake. PBMCs (lymphocytes, monocytes) were collected, transferred to a 50 ml
tube and resuspended in wash buffer (2 mM EDTA in PBS with 0.5% bovine serum albumin).
Cells were pelleted by centrifugation and washed three times in wash buffer. Finally, cells
were resuspended in X-VIVO 15 medium (LONZA, Basel, Switzerland) and transferred into
six well plates.
Animal experiments
Mgmt-null (MGMT-/-) mice on a C57BL/6 background were described previously (Bugni et al.
2009; Glassner et al. 1999). Eight to 14 week old MGMT-/- and C57BL/6 wildtype (WT) mice

were used. All mouse strains were obtained from the in-house animal breeding facility at
University Medical Center, Mainz, Germany. Animal experiments were approved by the
government of Rhineland-Palatinate and the Animal Care and Use Committee of the
University Medical Center, Mainz, Germany. All animal studies were performed in agreement
with the German federal law and the guidelines for the protection of animals. Azoxymethane
(AOM; Sigma, Deisenhofen, Germany) solution was prepared as described previously and
administered by intraperitoneal injection at doses up to 10 mg/kg body weight (bw) (Fahrer et
al. 2015). Animals were then sacrificed after 24 h. Colon and liver tissue were harvested,
carefully rinsed with ice-cold PBS and either snap-frozen in liquid nitrogen or fixed in 4 %
neutral buffered formaldehyde solution (Roti®-Histofix; Carl Roth, Karlsruhe, Germany). For
subsequent histological analysis, fixed tissue was embedded in paraffin and stored at room
temperature awaiting immunological analysis as detailed below.
Immunofluorescence detection of O6-MeG adducts
HCT116 cells (2 x 10⁵ cells per well) were seeded onto cover slips and allowed to adhere
overnight. The medium was replaced by fresh medium and the cells were then preincubated
with the specific MGMT inhibitor O6-benzylguanine (O6-BG; 10 µM; Sigma-Aldrich,
Deisenhofen, Germany) for 2 h. Temozolomide (TMZ; kind gift of Dr. Geoffrey P. Margison,
Manchester, UK) was added (0 to 1000 µM) and cells were incubated for another 2 h.
Following aspiration of the medium, cells were washed with pre-warmed phosphate-buffered
saline (PBS) and fixed with ice-cold methanol for 15 min at -20 °C. After two washing steps
with PBS, RNA was digested with a mixture of RNase A (200 µg/ml) and RNase T (50 U/ml)
for 10 min at 37 °C. Cells were washed with PBS followed by Proteinase K (20 µg/ml)
digestion for 10 min at 37 °C. Cells then were washed with 0.2 % glycine in PBS for 10 min
and cover slips were transferred into a humid chamber. Unspecific binding sites were
blocked with 5 % BSA in PBS for 45 min at RT. Subsequently, the samples were incubated
with a primary mouse antibody against O6-MeG (diluted 1:2000 in 1 % BSA in tris buffered
saline-tween 20 (TBS-T); #SQX-SQM003.1, Axxora, Farmingdale, USA) overnight at 4 °C.

After several washing steps with TBS-T and PBS, the samples were incubated with an
appropriate secondary antibody (Goat-anti-Mouse-Alexa Fluor 488, diluted 1:400 in 1 %
BSA/PBS, Life Technologies) for 2 h at RT under light exclusion. After several washing steps
with TBS-T and PBS, the nuclei were counterstained with TO-PRO-3 (diluted 1:100 in PBS,
Life Technologies, Darmstadt, Germany) for 15 min at RT. Finally, the cover slips were
coated with Vectashield® (Linaris, Dossenheim, Germany) medium and transferred onto a
microscope slide. The samples were analyzed by confocal microscopy with a Zeiss Axio
Observer.Z1 microscope equipped with a LSM710 laser-scanning unit (Zeiss). Images were
acquired with ZEN software and processed with ImageJ (NIH, USA). The mean O6-MeG
intensity per nucleus was assessed with ImageJ (at least 10 sections with 100
nuclei/treatment, n≥3) and data were evaluated using GraphPad Prism 7.0 software.
Isolation of genomic DNA from cells and tissue
HCT116 cells (4 x 10⁶) were seeded into 10 cm dishes and grown overnight. Cells were then
incubated in fresh medium and O6-BG was added as described above. After 2 h, cells were
treated with increasing doses of TMZ as indicated and harvested. To extract the genomic
DNA, cells were resuspended in 300 µl Tris-EDTA buffer supplemented with 0.1 % Triton X-
100 and RNase A (30 µg/ml). After incubation for 1.5 h at RT, proteinase K (20 µg/ml) and 1
% SDS were added and incubated overnight at 48°C. In the next step, 700 µl
phenol/chloroform/isoamyl alcohol (Carl Roth, Karlsruhe, Germany) was added. The samples
were briefly vortexed and centrifuged for 5 min at 20.000 g. The upper aqueous layer was
transferred into a new reaction tube and extracted again with 700 µl phenol-chloroform.
Following centrifugation, the upper aqueous layer was transferred to a new reaction tube and
supplemented with 750 µl 90 % ethanol and 1 M NH4OAc in order to precipitate the DNA for
1 h at 4 °C. The samples were then centrifuged for 45 min at 20. 000 g and 4 °C. The
supernatant was discarded and the DNA pellets were washed with 1 ml 70 % EtOH.
Following centrifugation at 20.000 g and 4 °C for 15 min, the supernatant was discarded and
the remaining DNA pellets were dissolved in 50 – 100 µl TE buffer. The samples were gently

vortexed and put on ice. Finally, the DNA content and purity were determined with a
NanoDrop 2000 (Thermo Scientific, Dreieich, Germany).
PBMCs (6 x 10⁶; approximately 70 % T-lymphocytes) in 2.5 ml X-Vivo 15 medium were
exposed to increasing doses of TMZ (50 to 1000 µM) for 2 h at 37 °C. PBMCs were then
transferred into tubes, washed with PBS and centrifuged for 5 min at 300 g. The supernatant
was discarded and the pellets were resuspended in PBS. The cell suspension was
centrifuged at 600 g for 5 min and pellets were processed to isolate genomic DNA as
described above.
In order to isolate genomic DNA from mouse tissue, snap frozen colon and liver (~ 20 mg)
were homogenized with a pestle and samples were processed as described above.
Immuno-slot blot assay (ISB) of O6-MeG adducts
A previously established immuno-slot blot assay (Göder et al. 2015) was used to determine
O6-MeG adduct levels in genomic DNA extracted from TMZ-treated HCT116 cells or AOM-
treated animals. First, 500 ng DNA in TE buffer was denatured by heating for 10 min at 99
°C. 50 µl of 2 M ammonium acetate were then added and samples were vortexed followed by
their immediate vacuum-aspiration onto a positively charged nylon membrane (GE
Healthcare, Munich, Germany). The membrane was fixed for 90 min at 90 °C and incubated
for 60 min with blocking buffer (5 % dry milk in TBS-T). Subsequently, the membrane was
incubated with a primary mouse antibody against O6-MeG (diluted 1:500 in 1 % BSA in TBS-
T) overnight at 4 °C. After several washing steps with TBS-T, the membrane was incubated
with a secondary peroxidase-coupled antibody (G-α-M-HRP, diluted 1:2000 in blocking
buffer; Santa Cruz Biotechnology, Heidelberg, Germany) for 1 h at RT. After several washing
steps with TBS-T, O6-MeG adducts were visualized by enhanced chemoluminescence
detection using Western Lightning® Plus-ECL (Perkin Elmer, Rodgau, Germany).
Densitometric evaluation of blots was conducted by Adobe Photoshop CS5 and analyzed by
GraphPad Prism 7.0 software.

Immunohistochemistry (IHC)
Formalin-fixed, paraffin-embedded (FFPE) colon and liver tissue from AOM-treated mice
were sectioned at 5 µm and processed for immunohistochemistry as reported (Fahrer et al.
2015). Tissue sections were incubated at 60 °C for 30 min in a drying oven, then
deparaffinized in xylene and rinsed in graded ethanol solutions. Following several washing
steps, the sections were immersed in pre-heated antigen retrieval solution (DAKO, Hamburg,
Germany) for 30 min in a steamer. The samples were allowed to cool for 15 min at RT and
washed several times in PBS. This process was followed by a permeabilization step in 0.4 %
Triton X-100 in PBS for 5 min at RT. Sections were then rinsed in PBS and RNA digestion
was performed for 1 h at 37 °C using both RNase A (200 µg/ml) and RNase T (50 U/ml).
After alkaline unwinding of the DNA for 5 min, the sections were carefully washed in PBS
and incubated with Pepsin (60 µg/ml) 30 min at 37 °C. Thereafter, the sections were washed
with PBS and incubated with proteinase K (20 µg/ml) for 30 min at 37 °C. Following another
washing step with 0.2 % glycine-PBS, the sections were incubated for 2 h with blocking
solution (DAKO, Hamburg, Germany) at RT. The sections were then treated with an O6-MeG
antibody (1:100, diluted in 2 % BSA in PBS) overnight at 4 °C. After several washing steps in
PBS-0,1 % Tween, the samples were incubated with the appropriate secondary antibody (G-
α-M-Alexa 488, 1:500 diluted in 2 % BSA in PBS/0.2 % Triton X-100; Life Technologies,
Darmstadt, Germany) for 2 h at RT. The sections were then rinsed thoroughly with PBS-T
0.1 % and a nuclear staining was performed using TO-PRO-3 (1:100 in PBS) for 30 min at
RT. Slides were mounted with Vectashield® medium and analyzed by confocal microscopy
with a Zeiss Axio Observer.Z1 microscope equipped with a LSM710 laser-scanning unit
(Zeiss, Oberkochen, Germany). Images were processed with ImageJ version 1.45 (NIH,
USA).
LC-MS/MS analysis of O6-MeG adducts
DNA hydrolysis

All DNA samples were measured on a Nanodrop 1000 (PeqLab, Rodgau, Germany). The
total number of nucleotides present was calculated based on the average base pair
molecular weight of 650 g/mol. The number of guanine residues was calculated assuming 21
% guanine in the mouse genome, and 20.5 % in the human genome (Ruvinsky and Graves
2005). A minimum of 10 μg of DNA was transferred to new Eppendorf DNA LoBind
microcentrifuge tubes and concentrated to dryness by vacuum centrifugation. Samples were
resuspended and thoroughly vortexed in 500 μL of a 0.1 M HCl solution spiked with 2 nM of
the internal standard (IS), O6-Me-d3-G. To release the purines from the DNA, each sample
was heated for 2 h at 70 °C. Samples were cooled at RT for at least 10 min followed by a 20
s centrifugation pulse at 1000 g. Each sample was neutralized with 15 μL of 15 % aqueous
ammonium hydroxide (NH4OH) and vortexed.
Confirmation of DNA hydrolysis
30 μL from each DNA sample was removed for HPLC analysis to verify complete release of
guanine. Quantification of guanine was carried out on an Agilent Technologies 1200 Series
HPLC (Santa Clara, CA) with a UV-visible detector. The method was adapted from Roy et al.
(Roy et al. 2013). To monitor absorbance, the diode array detector was set to 270 nm and
the reference was set to 360 nm.
Chromatography was performed with a Luna C18 Column (5 µm, 100 Å, 4.6 x 250 mm) from
Phenomenex (Torrance, CA). Mobile phase A was water and mobile phase B was methanol.
The flow rate was 1 mL/min and the column temperature was not controlled. 8 uL of sample
was injected and separated as follows: 1 % B for 3 min, 1–10 % B linear gradient for 7 min, a
wash at 85 % B for 3 min, and re-equilibration at 1 % B for 7 min (20 min total run time).
Guanine eluted at a RT of 8.7 min. Samples were analyzed in duplicate.
A calibration curve for guanine (2-100 μM) was prepared in a 0.1 M HCl, 0.03 % NH4OH
solution. The amount of guanine in each sample was calculated on the basis of guanine peak
area, slope of the calibration curve, and fraction of the total volume injected. The percent
recovery of guanine was calculated using the guanine measured by HPLC compared to the

theoretical amount calculated from the Nanodrop measurement. All samples yielded between
80-120% recovery of released guanine.
Adduct enrichment
Solid phase extraction (SPE) columns (Strata-X 33 μm, 30 mg/1 mL) were preconditioned
with two 1 mL washes with methanol, followed by three separate washes of 1 mL water
each. The entire remaining sample (485 μL) was loaded onto a column for enrichment and
purification. Each column was then washed with 600 μL water, then 600 μL of 3 % methanol.
Elution was performed by adding 600 μL of 60 % methanol. The entire eluent was recovered
and vacuum centrifuged to dryness in 250 µL conical glass HPLC inserts. Samples were
stored at -20 °C. Immediately prior to LC-MS/MS analysis, samples were thawed,
reconstituted in 20 μL water, and sonicated for 10 min.
LC-ESI-MS/MS
Samples were analyzed by LC–MS/MS using a nanoAcquity UPLC system (Waters, Milford,
CA) and Agilent tandem quadrupole mass spectrometer (LCQ Vantage, Thermo Scientific,
Waltham, MA) with an electrospray ionization source (ESI). Mass spectrometry ionization
parameters were optimized by tuning the instrument with 1 μM O6-MeG, O6-d3-MeG, and G
by direct injection. The ESI source was set in positive ion mode with the following
parameters: capillary temperature, 270 °C; spray voltage, 3000 V; sheath gas pressure, 25;
ion sweep gas pressure, 0; aux gas pressure, 5; Q2 CID gas pressure, 1.5 mTorr; collision
gas, argon; scan width, m/z 0.01; scan time, 0.1 s. Optimal collision energies for each
transition are in Table 1.
Chromatography was performed with a Synergi 4 μm Polar-RP column (Phenomenex 80 Å
150 x 0.5 mm). Mobile phases were sonicated for 15 min prior to the run. Mobile phase A
was water with 0.05 % acetic acid, phase B was methanol, and the flow rate was 10 μL/min
at the column temperature was set to 40 °C. The autosampler was cooled to 4 °C, a seal
wash was performed every 30 min, and the injection volume was 1 µL. Samples were

separated as follows: 0 % B for 1 min, 1–40 % B gradient for 14 min, 99 % B for 5 min, and
re-equilibrate for 15 min. The eluent was directed to the MS between 2 min and 14 min,
otherwise the eluent was diverted to the waste. O6-MeG and O6-d3-MeG eluted at 9.8 min.
The single reaction monitoring (SRM) transitions that were monitored are listed in Table 1.
Xcalibur software (Thermo) was used for data acquisition and processing.
Calibration curves
A series of 8 different O6-MeG standards of known concentration (0.5, 1, 2.5, 5, 10, 25, 40,
50 nM) was prepared. A fresh 20 μL aliquot of each prepared standard was concentrated to
dryness by vacuum centrifugation and resuspended in 500 μL of a 0.1 M HCl solution spiked
with 2 nM of the IS as above. Thermal acid hydrolysis and SPE were performed in the same
way as the DNA samples. Standards were reconstituted with 20 μL water for LC-MS/MS
analysis. Each calibrated standard was measured in triplicate. Standards were prepared and
analyzed immediately prior to analysis. The peak area ratio was determined for each
standard by dividing the peak area of the standard by the peak area of the IS. Data were
fitted to a straight line by least-squares (ordinary) in GraphPad Prism 7.0.
Adduct quantification
Each sample was first injected once into the MS to ensure they were within the linear range.
For samples that were higher than the standard curve, a 1:10 dilution was performed in
water. For samples where the O6-MeG was lower than the standard curve, the injection
volume was increased to 4 μL or was analyzed using a nanoAcquity UPLC M-class system
(Waters, Milford, CA) and tandem quadrupole mass spectrometer (TSQ Quantiva, Thermo
Scientific, Waltham, MA) with an electrospray ionization source (ESI) at the Functional
Genomics Center Zürich using the same ionization parameters and chromatography. After
adjusting these samples, at least one more technical replicate was performed. Acceptable
precision for each sample was required, where the relative standard deviations of the
technical triplicates was less than 20 %. The peak area ratio was determined for each

sample by dividing the peak area of the O6-MeG by the peak area of the O6-d3-MeG. The
amount of O6-MeG in each sample was calculated using the peak area ratio, the slope of the
calibration curve, and the fraction of the total volume injected. Sample quantification was
then converted and reported as adducts per 107 total nucleotides.
Statistics
Experiments were performed independently three times, unless otherwise stated. Figures
show representative images. Values are depicted as mean ± standard errors of the mean
(SEM) using GraphPad Prism 7.0 Software. Statistical analysis was performed using two-
sided Student`s t-test and statistical significance was defined as p < 0.05.
Hockey stick dose-response modelling
Dose-response modelling was performed as described (Lutz and Lutz 2009) using R
software (version 3.3.1) (R Development Core Team 2013). The lower confidence interval of
the threshold dose is also reported. It should be noted that confidence intervals of <0 lacks
statistical significance for a threshold.
RESULTS
In this study, levels of O6-MeG resulting from exposure to either the anticancer drug TMZ or
the colonotropic carcinogen AOM were evaluated in CRC cells and different murine tissue
(i.e. liver and colon) by a combination of qualitative immunological assays and quantitative
mass spectrometry (Fig. 1A). AOM requires metabolic activation by the hepatic enzyme
CYP2E1 to generate a reactive methylating agent (Neufert et al. 2007). TMZ, on the other
hand, spontaneously decomposes at neutral pH to deliver a methyl group (Zhang et al.
2012). Both chemicals give rise to DNA reactive methyldiazonium ions that induce the minor
lesion O6-MeG among other DNA methylation adducts. The workflow of sample processing
and subsequent analysis is depicted in Fig. 1B.
Time-dependent formation of O6-MeG in cells challenged with TMZ
First, we investigated the induction and persistence of O6-MeG in a time-dependent manner
over 24 h. To this end, HCT116 CRC cells were pre-incubated with O6-BG for 2 h in order to
inactivate MGMT and then challenged with TMZ for up to 24 h. Confocal IF microscopy
showed a time-dependent formation of O6-MeG with a peak after 4 h, which persisted up to
14 h after exposure to TMZ (Fig. 2A and B). After 24 h, the O6-MeG level declined,
presumably because of resynthesis of MGMT or lesion dilution resulting from cell division. To
quantify the adducts, we used stable isotope dilution mass spectrometry. The results showed
a similar time course of O6-MeG accumulation as compared to the IF analysis (Fig. 2C). 4 h
after treatment with 500 µM TMZ, the basal O6-MeG level (~ 2 lesions per 107 nucleotides)
increased to 116 O6-MeG adducts per 107 nucleotides. After 24 h, the O6-MeG content
decreased to 58 adducts per 107 nucleotides, which is still considerably higher than in
untreated control cells. Representative chromatograms for O6-MeG measurements in TMZ-
treated HCT116 cells are also shown (SI, Fig. 1). In order to illustrate the intrinsic MGMT
repair capacity in HCT116 cells, cells were incubated in the absence or presence of the
MGMT inhibitor O6-BG and challenged with 500 µM TMZ (Fig. 2D). Mass spectrometry
revealed a slightly higher, yet not statistically significant O6-MeG level following TMZ
treatment in cells pre-treated with the MGMT inhibitor (74 vs. 56 adducts per 107
nucleotides), indicating the protection mediated by MGMT against TMZ-induced O6-MeG in
HCT116 cells.
Dose-dependent induction of O6-MeG in cells challenged with TMZ
In order to monitor the dose-dependent formation of O6-MeG adducts, HCT116 cells were
pre-incubated with the pharmacological inhibitor O6-BG to block MGMT activity. The cells
were then exposed to increasing doses of TMZ (0 – 1000 µM) for 2 h, fixed and processed.
O6-MeG was specifically labeled with an antibody followed by confocal microscopy (Fig. 3).
As expected, O6-MeG displayed exclusive nuclear localization. TMZ, at 100 µM, caused a
moderate, significant rise in the O6-MeG level relative to the untreated control (Fig. 3A -C). At
higher dose levels, O6-MeG levels increased dose-dependently (Fig. 3A - C). Subsequently,
we compared the sensitivity of the ISB assay with mass spectrometry-based analysis of O6-
MeG adducts in genomic DNA from TMZ-treated HCT116 cells. By means of the ISB assay,
we were able to detect a dose-dependent O6-MeG DNA adduct formation, reaching statistical
significance only at doses ≥ 500 µM TMZ (Fig. 4A and B). Doses up to 250 µM were hardly
distinguishable from the background level (Fig. 4B). In contrast, UPLC-MS/MS revealed a
significant rise in O6-MeG at a lower dose of 100 µM TMZ with 13 adducts per 107
nucleotides, while the baseline level without TMZ treatment was low (~ 2.5 adducts per 107
nucleotides) (Fig. 4C). This clearly demonstrates the higher sensitivity and specificity of the
mass spectrometry-based approach. It is interesting to note that we were also able to
measure O6-MeG in PBMC following in vitro treatment with 100 µM TMZ (SI Tab. 1). This
experiment was conducted without the MGMT inhibitor O6-BG, i.e. in the presence of intrinsic
MGMT repair activity.
Assessment of O6-MeG in tissue of AOM-treated mice and impact of MGMT
Having extensively characterized the dose- and time-dependent formation of O6-MeG in CRC
cells, we switched to a mouse model using B6/J wild type (WT) and transgenic, MGMT

deficient mice (MGMT-/-). The animals were exposed to AOM, which is a well-established
colonotropic carcinogen. AOM requires metabolic activation in the liver and the colorectum,
involving an interplay of hepatic cytochrome P450 2E1 (CYP2E1)- and UDP-glucuronosyl-
transferase (UGT)-dependent metabolism together with ß-glucuronidase activity from gut
bacteria (Neufert et al. 2007). AOM was administered by intraperitoneal injection in doses
ranging from 0 – 10 mg/kg bw and animals were sacrificed after 24 h to isolate genomic DNA
from liver and colorectal tissue. O6-MeG levels were already assessed in our previous work
using the ISB technique (Fahrer et al. 2015). Both genotypes displayed a dose-dependent
formation of hepatic O6-MeG adducts, with significant higher levels in MGMT k.o. mice that
lack methyl transferase activity towards O6-MeG (Fahrer et al. 2015). In colorectal tissue, no
differences in O6-MeG levels were detected in WT mice challenged with up to 10 mg/kg
AOM, while a dose-dependent increase was observed in MGMT-deficient mice using the ISB
assay (SI Fig. 2A and B). Next, the liver samples were analyzed by mass spectrometry,
resulting in dose-dependent generation of O6-MeG as a function of the repair phenotype (Fig.
5A and C). It should be stressed that O6-MeG levels were about two-fold higher in MGMT-/-
as compared to WT animals at doses of 3 and 5 mg AOM/kg bw (SI Fig. 3A), reaching
statistical significance only for 5 mg. Finally, we studied O6-MeG formation in colorectal
tissue, which is pivotal for DNA alkylation-triggered colorectal carcinogenesis. Intriguingly,
UPLC-MS/MS revealed O6-MeG induction (~ 6 adducts per 107 nucleotides) at the lowest
tested AOM dose (3 mg AOM/kg bw) in WT animals, which was tremendously augmented (~
60 adducts per 107 nucleotides) at the highest AOM dose (10 mg/kg bw) (Fig. 5E). In stark
contrast, MGMT-/- animals displayed a dose-dependent and almost linear formation of O6-
MeG adducts (16, 35, 81 adducts per 107 nucleotides, respectively) (Fig. 5G). Side-by-side
comparison of the induced O6-MeG lesions in colorectal tissue showed significantly higher
levels in MGMT-/- versus WT animals at AOM doses ≤ 5 mg/kg bw (SI Fig. 3B).
Dose-response modeling of O6-MeG adducts and threshold analysis
We performed hockey stick dose-response modeling (Lutz and Lutz 2009) on the in vivo data
following ISB and MS quantification of O6-MeG adducts to identify a potential threshold dose
and assess the dose-response relationship (Fig. 5 B, D, F and H). We only identified a
threshold dose using UPLC-MS/MS quantification, but not via ISB (SI Fig. 4). Interestingly,
the threshold dose of 1.9 mg/kg bw and 4.8 mg/kg bw AOM in the respective liver and colon
of WT mice was absent in the MGMT-deficient genotype (Tab. 2), indicating a change in
dose-response relationship from sub-linear to linear when MGMT-mediated repair of O6-MeG
is lacking.
DISCUSSION
The present work provides a characterisation of the currently available techniques to detect
and quantify O6-MeG adducts in cells and murine tissues, with a focus on their sensitivity and
specificity. Furthermore, the approaches were applied to determine genotoxic thresholds
using the hockey-stick dose-response modeling. First, we showed that IF microscopy allows
for the time- and dose-dependent detection of O6-MeG in cells treated with the methylating
antineoplastic drug TMZ. The procedure itself is relatively fast and not expensive, but
includes critical steps such as the unwinding of DNA at alkaline pH, during which the cells
can detach. Furthermore, the used O6-MeG antibody caused some background signal, which
is particularly prominent in tissue samples (SI, Fig. 5). The digestion of proteins and RNA are
further essential steps to yield specific, nuclear staining of O6-MeG. This method has been
employed to detect O6-MeG in cells and in tissue, particularly liver and colon tissue (Fahrer
et al. 2015; Nyskohus et al. 2013), as it offers the advantage to visualize damage induction in
distinct cell types and regions within a given tissue. Using confocal microscopy, we could
demonstrate the spatial formation of O6-MeG adducts in liver lobuli, with the highest damage
induction in hepatocytes around the central hepatic vein, while no adducts were formed in
the periportal field (SI Fig. 5 and (Fahrer et al. 2015)). Interestingly, O6-MeG staining can
also be combined with the detection of γH2AX, an established marker for DNA DSBs (Fahrer
et al. 2014; Kinner et al. 2008), in paraffin-embedded liver tissue (Fahrer et al. 2015). The IF-
based method proved also to be useful for monitoring the time-dependent induction and
removal of O6-MeG adducts in colon crypts of rats treated with up to 15 mg AOM/kg bw
(Nyskohus et al. 2013). However, IF is a semi-quantitative method and offers moderate
sensitivity as compared to mass spectrometry, which was revealed mainly during the
analysis of tissue samples. For example, our UPLC-MS/MS approach detected O6-MeG in
liver tissue of WT mice at low AOM doses (Fig. 5), whereas IF microscopy did not (Fahrer et
al. 2015).

Second, we employed the ISB assay to detect O6-MeG adducts in genomic DNA isolated
from cells and tissues exposed to methylating agents. The ISB assay allows for the direct
comparison of multiple samples (up to 48) on the same membrane, requiring only little
amount of DNA (≤ 500 ng). Furthermore, it is a very fast and inexpensive method. We
showed a dose-dependent O6-MeG generation in cells challenged with TMZ, however with
only moderate sensitivity. Nevertheless, O6-MeG adducts were monitored in liver DNA form
WT and MGMT-deficient mice exposed to low dose levels of AOM (3 mg/kg bw). It also
should be mentioned that the effect of the different DNA repair phenotype, i.e. MGMT
proficiency and MGMT deficiency, was clearly visible here. In support of its rather moderate
sensitivity, no AOM-dependent formation of O6-MeG was detectable in DNA isolated from
colorectal tissue of WT animals using the ISB assay (SI Fig. 2). The method has also be
applied to measure O6-MeG and O6-ethylguanine in human lymphocytes exposed to
methylnitrosurea (MNU) and ethylnitrosurea (ENU), respectively, at the mM dose range (0.5
– 4 mM) in vitro (Jiao et al. 2007; Stephanou et al. 1996), confirming the limited sensitivity of
ISB. This drawback is also attributable to the background signal, which is observed in
untreated control samples.
Third, we applied UPLC-MS/MS to quantify O6-MeG adduct levels in human cells and murine
tissue samples (liver and colon). This approach was highly sensitive and superior to the other
antibody-based methods (IF and ISB) throughout our experiments. While former studies
using HPLC-MS/MS required moderate to high amounts of DNA (50 µg up to 1 mg)
(Upadhyaya et al. 2009; Vanden Bussche et al. 2012; Zhang et al. 2006), we have optimized
the sample cleanup and subsequent analysis, reducing the amount of DNA needed to below
10 µg. Our UPLC-MS/MS approach is highly sensitive and permitted the detection of O6-MeG
in colorectal tissue of WT mice challenged with only 3 mg/kg bw AOM. This method was also
instrumental for our very recent study dealing with the impact of the DNA repair protein
PARP-1 on alkylation-induced colorectal carcinogenesis (Dörsam et al. 2018).

Furthermore, mass spectrometry revealed moderate differences in O6-MeG levels following
TMZ treatment in the presence or absence of the MGMT inhibitor O6-BG, which were
however not stastitically significant. This finding could be attributable to several factors. First,
HCT116 cells display only moderate MGMT activity (Göder et al. 2015), whereas other CRC
cells such as HT29 have a 4-fold higher MGMT activity (Tomaszowski et al. 2015). Less O6-
BG is thus required to inhibit the cellular MGMT pool in HCT116 cells, attenuating the effects
particularily at a high TMZ dose of 500 µM. Second, it is conceivable that TMZ at high doses
directly alkylates the catayltic Cys residue of MGMT, which could also overshadow the O6-
BG-mediated inhibition. Third, the TMZ exposure time used for this experiment (2 h) might be
not ideal, bearing in mind that O6-MeG induction by TMZ peaks after 4 h (Fig. 2C).
Intriguingly, our measurements revealed a linear, dose-dependent accumulation of adducts
in MGMT deficient mice, whereas adduct levels exhibited non-linearity in WT animals, and
the threshold analysis supports this result (Tab. 2). We found threshold doses of AOM in the
liver and colon of treated mice at 1.93 mg/kg bw and 4.78 mg/kg bw, respectively. The liver
has higher basal levels of the AOM activating enzyme, CYP2E1, than in the colon
(Rosenberg and Mankowski 1994). We could therefore hypothesize that more AOM is
activated in the liver and able to react with DNA, accounting for the lower threshold dose
than in the colon. Caution is urged however, as the dose-responses look sub-linear (due to
vastly higher adduct levels at the highest dose) as oppose to threshold, particularly in the
colon (Figure 5). However, the difference in threshold dose between the repair phenotypes is
intriguing and supports a mechanistic basis for the observed threshold doses (Fahrer et al.
2015; Thomas et al. 2013).
Moreover, it is hypothesised that detoxifying processes can prevent genotoxin activation,
subsequent DNA reaction and adduct formation and, therefore, contribute to a non-linear
DNA adduct relationship (Thomas et al. 2015). The half-life of the DNA adducts (governed by
their removal by repair enzymes, such as MGMT) may influence the relationship observed

depending on the time following treatment when the adducts were quantified. The influence
of DNA repair is evidenced in the absence of threshold doses in the MGMT-deficient
phenotype. While this data is limited and firm conlcusions on the dose-responses are difficult
to draw, it is interesting to speculate particularly, as in this instance, the relationships
correlate to our mechanistic understanding of DNA damage induction and repair. This is
consistent with our previous study dealing with the impact of DNA repair on the dose-
response relationship in alkylation-induced colorectal carcinogenesis (Fahrer et al. 2015) and
illustrates that initial DNA adduct levels may be correlated with later onset of tumorigenesis.
Using this mass-spectrometry-based approach, O6-MeG formation was also quantitatively
assessed in PBMCs isolated from healthy human volunteers following in vitro treatment with
the anticancer drug TMZ. This experiment was conducted without the MGMT inhibitor O6-BG,
i.e. in the presence of intrinsic MGMT activity that amounts to about 105 fmol/106 PBMCs
(Janssen et al. 2001). Interestingly, significant levels of O6-MeG were detected at a dose of
100 µM TMZ, which is comparable to the plasma concentration that can be achieved in
patients after oral administration of the drug (Britten et al. 1999; Hammond et al. 1999). It can
be envisioned that O6-MeG induced by methylating anticancer drugs such as TMZ and DTIC
could be monitored in peripheral blood cells as clinical pharmacodynamic biomarker in the
future, comparable to γH2AX and poly(ADP-ribose) as proposed elsewhere (Redon et al.
2010). This will assist in stratifying patients and monitoring therapeutic efficacy in
personalized medicine, an approach that is also amenable to other DNA damaging
anticancer drugs, including cis-platin and cyclophosphamide (Stornetta et al. 2017). The
advantages and disadvantages of each method used here are summarized in Table 3.
Very recently, novel strategies have been developed to detect O6-MeG in a sequence-
specific context. To this end, artifical nucleotides (benzimidazole-derived 2'-deoxynucleoside-
5'-O-triphosphates) have been synthesized, which are incorporated into DNA opposite O6-
MeG by an engineered KlenTaq DNA polymerase (Wyss et al. 2016). Novel hybridization

probes based on an oligonucleotide with nucleoside analogues conjugated to gold
nanoparticles have also been used to successfully detect O6-MeG within a mutational
hotspot in the KRAS oncogene (Trantakis et al. 2016). These chemical approaches may
open a new avenue to measure O6-MeG levels in a sequence-specific manner at single base
resolution instead of assessing the global O6-MeG load in genomic DNA.
In summary, the UPLC-MS/MS approach allowed for the quantitative, sensitive and specific
detection of critical O6-MeG adducts in cells and tissue. This technique was further pivotal for
the determination of threshold levels for O6-MeG adducts, which were caused by the repair
enzyme MGMT. We envision that this method will be instrumental to monitor the therapeutic
efficacy of alkylating anticancer drugs and to assess dietary and environmental exposure to
O6-MeG-inducing agents.
ACKNOWLEDGEMENT
This work was supported by the University Medical Center Mainz (MAIFOR) and the German
Research Foundation (DFG-FA1034/3-1 and DFG-KA724/29-1). We are indebted to Dr.
Daniel Heylmann (Department of Toxicology, University Medical Center, Mainz, Germany)
for isolating PBMCs from buffy coat. We are also grateful to Dr. Bert Vogelstein (John
Hopkins University, Baltimore, USA) for providing HCT116 cells, to Dr. Leona D. Samson
(MIT, Boston, USA) for providing MGMT knockout animals, and to Dr. Geoffrey P. Margison
(University of Manchester, UK) for providing TMZ. We also thank the FGCZ Functional
Genomics Center Zürich (FGCZ) for LC-MS/MS assistance.
REFERENCES Britten CD, Rowinsky EK, Baker SD, et al. (1999) A Phase I and pharmacokinetic study of
temozolomide and cisplatin in patients with advanced solid malignancies. Clin Cancer Res 5(7):1629-37
Bugni JM, Meira LB, Samson LD (2009) Alkylation-induced colon tumorigenesis in mice deficient in the Mgmt and Msh6 proteins. Oncogene 28(5):734-41 doi:10.1038/onc.2008.426
onc2008426 [pii] Daniels DS, Woo TT, Luu KX, et al. (2004) DNA binding and nucleotide flipping by the human DNA
repair protein AGT. Nat Struct Mol Biol 11(8):714-20 doi:10.1038/nsmb791 Dörsam B, Fahrer J (2016) The disulfide compound alpha-lipoic acid and its derivatives: A novel class
of anticancer agents targeting mitochondria. Cancer Lett 371(1):12-9 doi:10.1016/j.canlet.2015.11.019
Dörsam B, Seiwert N, Foersch S, et al. (2018) PARP-1 protects against colorectal tumor induction, but promotes inflammation-driven colorectal tumor progression. Proc Natl Acad Sci U S A 115(17):E4061-E4070 doi:10.1073/pnas.1712345115
Fahrer J, Frisch J, Nagel G, et al. (2015) DNA repair by MGMT, but not AAG, causes a threshold in alkylation-induced colorectal carcinogenesis. Carcinogenesis 36(10):1235-44 doi:10.1093/carcin/bgv114
Fahrer J, Huelsenbeck J, Jaurich H, et al. (2014) Cytolethal distending toxin (CDT) is a radiomimetic agent and induces persistent levels of DNA double-strand breaks in human fibroblasts. DNA Repair (Amst) 18:31-43 doi:10.1016/j.dnarep.2014.03.002
Fahrer J, Kaina B (2013) O6-methylguanine-DNA methyltransferase in the defense against N-nitroso compounds and colorectal cancer. Carcinogenesis 34(11):2435-42 doi:10.1093/carcin/bgt275
Fu D, Calvo JA, Samson LD (2012) Balancing repair and tolerance of DNA damage caused by alkylating agents. Nat Rev Cancer 12(2):104-20 doi:10.1038/nrc3185
nrc3185 [pii] Georgiadis P, Kaila S, Makedonopoulou P, et al. (2011) Development and validation of a new,
sensitive immunochemical assay for O(6)-methylguanine in DNA and its application in a population study. Cancer Epidemiol Biomarkers Prev 20(1):82-90 doi:10.1158/1055-9965.EPI-10-0788
Glassner BJ, Weeda G, Allan JM, et al. (1999) DNA repair methyltransferase (Mgmt) knockout mice are sensitive to the lethal effects of chemotherapeutic alkylating agents. Mutagenesis 14(3):339-47
Göder A, Nagel G, Kraus A, et al. (2015) Lipoic acid inhibits the DNA repair protein O 6-methylguanine-DNA methyltransferase (MGMT) and triggers its depletion in colorectal cancer cells with concomitant autophagy induction. Carcinogenesis 36(8):817-31 doi:10.1093/carcin/bgv070
Guo J, Yun BH, Upadhyaya P, et al. (2016) Multiclass Carcinogenic DNA Adduct Quantification in Formalin-Fixed Paraffin-Embedded Tissues by Ultraperformance Liquid Chromatography-Tandem Mass Spectrometry. Anal Chem 88(9):4780-7 doi:10.1021/acs.analchem.6b00124
Hammond LA, Eckardt JR, Baker SD, et al. (1999) Phase I and pharmacokinetic study of temozolomide on a daily-for-5-days schedule in patients with advanced solid malignancies. J Clin Oncol 17(8):2604-13 doi:10.1200/JCO.1999.17.8.2604
Heylmann D, Kaina B (2016) The gammaH2AX DNA damage assay from a drop of blood. Sci Rep 6:22682 doi:10.1038/srep22682
Janssen K, Eichhorn-Grombacher U, Schlink K, Nitzsche S, Oesch F, Kaina B (2001) Long-time expression of DNA repair enzymes MGMT and APE in human peripheral blood mononuclear cells. Arch Toxicol 75(5):306-12
Jiao L, Chang P, Firozi PF, Lai D, Abbruzzese JL, Li D (2007) Polymorphisms of phase II xenobiotic-metabolizing and DNA repair genes and in vitro N-ethyl-N-nitrosourea-induced O6-ethylguanine levels in human lymphocytes. Mutat Res 627(2):146-57 doi:10.1016/j.mrgentox.2006.11.001
Kaina B, Christmann M, Naumann S, Roos WP (2007) MGMT: key node in the battle against genotoxicity, carcinogenicity and apoptosis induced by alkylating agents. DNA Repair (Amst) 6(8):1079-99 doi:S1568-7864(07)00124-3 [pii]
10.1016/j.dnarep.2007.03.008 Kaina B, Margison GP, Christmann M (2010) Targeting O(6)-methylguanine-DNA methyltransferase
with specific inhibitors as a strategy in cancer therapy. Cell Mol Life Sci 67(21):3663-81 doi:10.1007/s00018-010-0491-7

Kinner A, Wu W, Staudt C, Iliakis G (2008) Gamma-H2AX in recognition and signaling of DNA double-strand breaks in the context of chromatin. Nucleic Acids Res 36(17):5678-94 doi:10.1093/nar/gkn550
Lutz WK, Lutz RW (2009) Statistical model to estimate a threshold dose and its confidence limits for the analysis of sublinear dose-response relationships, exemplified for mutagenicity data. Mutat Res 678(2):118-22 doi:10.1016/j.mrgentox.2009.05.010
Mikhed Y, Fahrer J, Oelze M, et al. (2016) Nitroglycerin induces DNA damage and vascular cell death in the setting of nitrate tolerance. Basic Res Cardiol 111(4):52 doi:10.1007/s00395-016-0571-4
Mojas N, Lopes M, Jiricny J (2007) Mismatch repair-dependent processing of methylation damage gives rise to persistent single-stranded gaps in newly replicated DNA. Genes Dev 21(24):3342-55 doi:10.1101/gad.455407
Neufert C, Becker C, Neurath MF (2007) An inducible mouse model of colon carcinogenesis for the analysis of sporadic and inflammation-driven tumor progression. Nat Protoc 2(8):1998-2004 doi:nprot.2007.279 [pii]
10.1038/nprot.2007.279 Niture SK, Velu CS, Smith QR, Bhat GJ, Srivenugopal KS (2007) Increased expression of the MGMT
repair protein mediated by cysteine prodrugs and chemopreventative natural products in human lymphocytes and tumor cell lines. Carcinogenesis 28(2):378-89 doi:bgl155 [pii]
10.1093/carcin/bgl155 Nyskohus LS, Watson AJ, Margison GP, et al. (2013) Repair and removal of azoxymethane-induced
O6-methylguanine in rat colon by O6-methylguanine DNA methyltransferase and apoptosis. Mutat Res 758(1-2):80-6 doi:10.1016/j.mrgentox.2013.10.001
Ochs K, Kaina B (2000) Apoptosis induced by DNA damage O6-methylguanine is Bcl-2 and caspase-9/3 regulated and Fas/caspase-8 independent. Cancer Res 60(20):5815-24
Quiros S, Roos WP, Kaina B (2010) Processing of O6-methylguanine into DNA double-strand breaks requires two rounds of replication whereas apoptosis is also induced in subsequent cell cycles. Cell Cycle 9(1):168-78
R Development Core Team (2013) R: A language and environment for statistical computing. R Foundation for Statistical Computing, Vienna, Austria.
Redon CE, Nakamura AJ, Zhang YW, et al. (2010) Histone gammaH2AX and poly(ADP-ribose) as clinical pharmacodynamic biomarkers. Clin Cancer Res 16(18):4532-42 doi:10.1158/1078-0432.CCR-10-0523
Rosenberg DW, Mankowski DC (1994) Induction of cyp2e-1 protein in mouse colon. Carcinogenesis 15(1):73-8
Roy L, Harrell CC, Ryan AS, Thorsteinsson T, Sancilio FD (2013) Development and Validation of a Single HPLC Method for Analysis of Purines in Fish Oil Supplements. Food and Nutrition Sciences 4(12):1255-1259 doi:10.4236/fns.2013.412160
Ruvinsky A, Graves JAM (2005) Mammalian genomics. CABI Pub., Wallingford, UK ; Cambridge, MA Seiler F, Kirstein U, Eberle G, Hochleitner K, Rajewsky MF (1993) Quantification of specific DNA O-
alkylation products in individual cells by monoclonal antibodies and digital imaging of intensified nuclear fluorescence. Carcinogenesis 14(9):1907-13
Stephanou G, Vlastos D, Vlachodimitropoulos D, Demopoulos NA (1996) A comparative study on the effect of MNU on human lymphocyte cultures in vitro evaluated by O6-mdG formation, micronuclei and sister chromatid exchanges induction. Cancer Lett 109(1-2):109-14
Stornetta A, Zimmermann M, Cimino GD, Henderson PT, Sturla SJ (2017) DNA Adducts from Anticancer Drugs as Candidate Predictive Markers for Precision Medicine. Chem Res Toxicol 30(1):388-409 doi:10.1021/acs.chemrestox.6b00380
Thomas AD, Fahrer J, Johnson GE, Kaina B (2015) Theoretical considerations for thresholds in chemical carcinogenesis. Mutat Res Rev Mutat Res 765:56-67 doi:10.1016/j.mrrev.2015.05.001
Thomas AD, Jenkins GJ, Kaina B, et al. (2013) Influence of DNA repair on nonlinear dose-responses for mutation. Toxicol Sci 132(1):87-95 doi:10.1093/toxsci/kfs341
Tomaszowski KH, Schirrmacher R, Kaina B (2015) Multidrug Efflux Pumps Attenuate the Effect of MGMT Inhibitors. Mol Pharm 12(11):3924-34 doi:10.1021/acs.molpharmaceut.5b00341
Trantakis IA, Nilforoushan A, Dahlmann HA, Stauble CK, Sturla SJ (2016) In-Gene Quantification of O(6)-Methylguanine with Elongated Nucleoside Analogues on Gold Nanoprobes. J Am Chem Soc 138(27):8497-504 doi:10.1021/jacs.6b03599
Upadhyaya P, Lindgren BR, Hecht SS (2009) Comparative levels of O6-methylguanine, pyridyloxobutyl-, and pyridylhydroxybutyl-DNA adducts in lung and liver of rats treated chronically with the tobacco-specific carcinogen 4-(methylnitrosamino)-1-(3-pyridyl)-1-butanone. Drug Metab Dispos 37(6):1147-51 doi:10.1124/dmd.109.027078

Vanden Bussche J, Moore SA, Pasmans F, Kuhnle GG, Vanhaecke L (2012) An approach based on ultra-high pressure liquid chromatography-tandem mass spectrometry to quantify O6-methyl and O6-carboxymethylguanine DNA adducts in intestinal cell lines. J Chromatogr A 1257:25-33 doi:10.1016/j.chroma.2012.07.040
Wyss LA, Nilforoushan A, Williams DM, Marx A, Sturla SJ (2016) The use of an artificial nucleotide for polymerase-based recognition of carcinogenic O6-alkylguanine DNA adducts. Nucleic Acids Res 44(14):6564-73 doi:10.1093/nar/gkw589
Xu-Welliver M, Pegg AE (2002) Degradation of the alkylated form of the DNA repair protein, O(6)-alkylguanine-DNA alkyltransferase. Carcinogenesis 23(5):823-30
Zhang F, Bartels MJ, Pottenger LH, Gollapudi BB, Schisler MR (2006) Simultaneous quantitation of 7-methyl- and O6-methylguanine adducts in DNA by liquid chromatography-positive electrospray tandem mass spectrometry. J Chromatogr B Analyt Technol Biomed Life Sci 833(2):141-8 doi:10.1016/j.jchromb.2006.01.035
Zhang J, Stevens MF, Bradshaw TD (2012) Temozolomide: mechanisms of action, repair and resistance. Curr Mol Pharmacol 5(1):102-14

FIGURE LEGENDS Figure 1: Formation of O6-MeG DNA adducts and their analysis by qualitative and
quantitative methods. A Formation of O6-MeG DNA adducts by alkylating agents. The
anticancer drug temozolomide (TMZ) decomposes spontaneously to methyl-(trazen-1-yl)
imidazole-4-carboxamide (MTIC) in aqueous solutions at pH > 7 (top panel). This instable
intermediate gives rise to 5-aminoimidazole-4-carboxamide (AIC) and diazomethane, which
then reacts with nucleophilic centers in DNA, thereby forming O6-MeG DNA adducts. The
colonotropic carcinogen azoxymethane (AOM), which is chemically related with N-nitroso
compounds, requires metabolic activation by hepatic CYP2E1 to methylazoxymethanol
(MAM). Subsequently, this compound undergoes decomposition to diazomethane as DNA
methylating agent (bottom panel). MAM is also biliary excreted as glucuronic acid conjugate
and thereby reaches the colorectum, where it also generates diazomethane (not shown). B
Analysis of O6-MeG in cells and tissues. Please refer to the main text for further
explanations.
Figure 2: Analysis of O6-MeG induction and persistence in CRC cells using
immunofluorescence and mass spectrometry. A HCT116 cells were pre-treated with the
MGMT inhibitor O6-Benzylguanine (O6-BG) for 2 h and then exposed to the anticancer drug
TMZ (500 µM) and incubated for up to 24 h. Representative images are shown. O6-MeG
(green) and nuceli (blue). B Determination of the mean staining intensity by ImageJ. C Mass
spectrometry-based detection of O6-MeG in HCT116 cells treated as described in A.
Genomic DNA was isolated and O6-MeG levels were determined with mass spectrometry
using an isotope-labeled internal standard. Data are depicted as mean ± SEM (n=3). ****,
p<0.0001; *, p<0.05; n.s. not significant. D Induction of O6-MeG adducts by 500 µM TMZ with
or without pre-treatment with the MGMT inhibitor O6-BG. Number of O6-MeG lesions were
assessed by mass spectrometry. Data are shown as mean + SEM (n=3). Ns, not significant.
Figure 3: Detection of O6-MeG adducts in CRC cells by immunofluorescence. A
HCT116 cells were pre-incubated for 2 h with O6-Benzylguanine to block cellular MGMT
repair activity. Cells were then treated with increasing doses of the SN1-alkylating anticancer
drug temozolomide (TMZ; 0 – 1000 µM) for 2 h to allow for damage induction.
Representative images acquired by confocal microscopy are shown. O6-MeG (green) and
nuclei (blue). B Magnification showing pan-nuclear localization of O6-MeG adducts. C
Quantitative evaluation of dose-response samples. Data are presented as mean + SEM
(n=3, ≥ 10 sections per sample). ****, p<0.0001.
Figure 4: Analysis of dose-dependent O6-MeG adduct formation in CRC cells by
immune slot blot detection versus mass spectrometry. A HCT 116 cells were pre-
incubated with the MGMT inhibitor O6-Benzylguanine (O6-BG) for 2 h and then challenged
with increasing doses of the anticancer drug TMZ (0 - 1000 µM) for additional 2 h. O6-MeG
adducts were determined in isolated genomic DNA by an immune slot blot approach. Data
are depicted as mean + SEM (n=3). ***, p<0.001; *, p< 0.05; n.s. not significant. B
Representative immuno-slot blot C Cells were treated as described in A and genomic DNA
was isolated. The number of O6-MeG lesions per 107 nucleotides (nts) was obtained by mass
spectrometry. Data are given as mean + SEM (n=3). ****, p<0.0001; ***, p<0.001; **, p<
0.005; *, p< 0.05.
Figure 5: Analysis of the dose-dependent O6-MeG formation in liver and colorectal
tissue of MGMT-proficient and -deficient mice. Mass-spectrometry-based determination
of hepatic (A and C) and colonic (E and G) O6-MeG lesions in isolated genomic DNA of WT
and MGMT-/- mice. Data with 10 mg AOM/kg bw has been reported previously by our group
(Dörsam et al. 2018). Data is shown as mean + SEM (n = 3 per dose and genotype). ****,
p<0.0001; ***, p<0.001; **, p< 0.005; *, p< 0.05.; n.s. not significant (as compared to the
respective control treated with 0 mg AOM/kg bw). Dose-response modeling to elucidate the
threshold dose for O6-MeG formation in liver (B and D) and colorectal (F and H) tissue of WT

and MGMT-/- mice. Solid line shows the best fit of the model. The broken line shows the 90%
lower confidence interval of the threshold dose for those dose-responses where linearity can
be rejected.
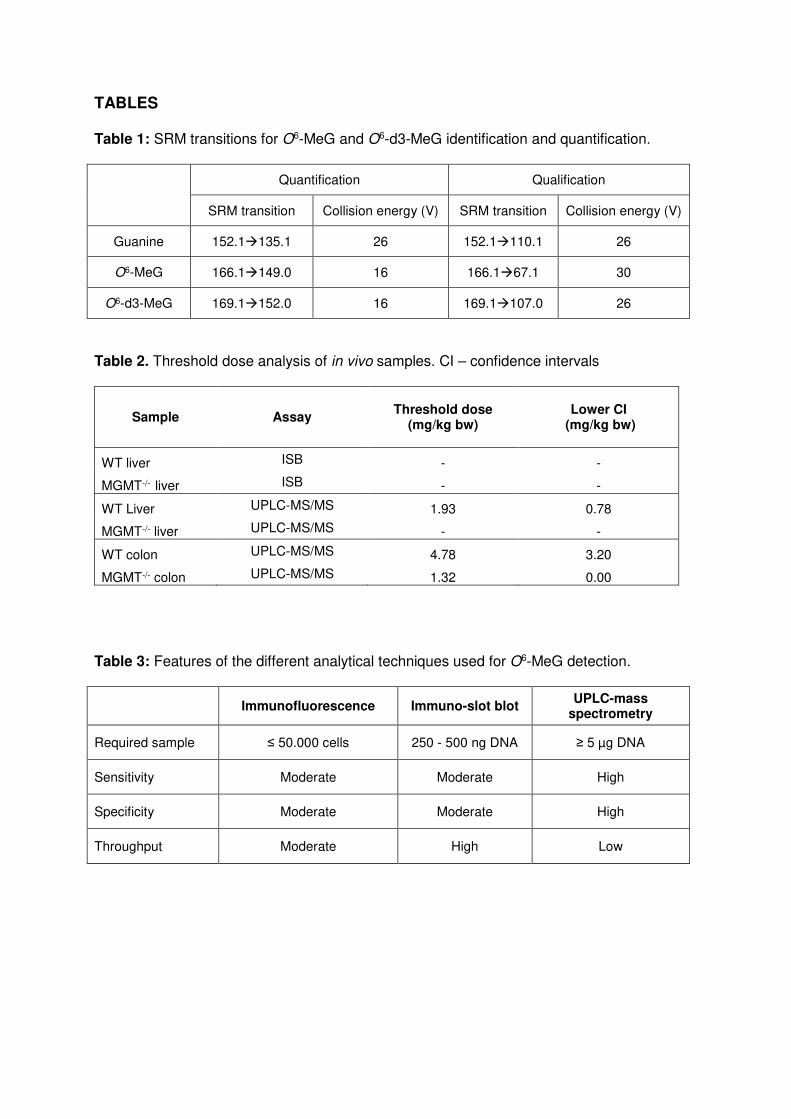
TABLES
Table 1: SRM transitions for O6-MeG and O6-d3-MeG identification and quantification.
Quantification Qualification
SRM transition Collision energy (V) SRM transition Collision energy (V)
Guanine 152.1135.1 26 152.1110.1 26
O6-MeG 166.1149.0 16 166.167.1 30
O6-d3-MeG 169.1152.0 16 169.1107.0 26
Table 2. Threshold dose analysis of in vivo samples. CI – confidence intervals
Sample Assay Threshold dose
(mg/kg bw) Lower CI
(mg/kg bw)
WT liver ISB - -
MGMT-/- liver ISB - -
WT Liver UPLC-MS/MS 1.93 0.78
MGMT-/- liver UPLC-MS/MS - -
WT colon UPLC-MS/MS 4.78 3.20
MGMT-/- colon UPLC-MS/MS 1.32 0.00
Table 3: Features of the different analytical techniques used for O6-MeG detection.
Immunofluorescence Immuno-slot blot
UPLC-mass spectrometry
Required sample ≤ 50.000 cells 250 - 500 ng DNA ≥ 5 µg DNA
Sensitivity Moderate Moderate High
Specificity Moderate Moderate High
Throughput Moderate High Low

FIGURES
Figure 1

Figure 2

Figure 3

Figure 4

Figure 5