impact assessment study on rail noise abatement measures addressing the ... ·...
TRANSCRIPT

1/129
To:
EUROPEAN COMMISSION
DIRECTORATE GENERAL ENERGY AND TRANSPORT
REFERENCE TREN/A1/46-2005
IMPACT ASSESSMENT STUDY ON RAIL NOISE ABATEMENT MEASURES
ADDRESSING THE EXISTING FLEETS
Final Report
December 10, 2007

2/129
EUROPEAN COMMISSION - DIRECTORATE GENERAL ENERGY AND TRANSPORT
IMPACT ASSESSMENT STUDY ON RAIL NOISE ABATEMENT MEASURES ADDRESSING THE EXISTING FLEETS
Table of Contents
1 PROBLEM DEFINITION.......................................................................................................................... 7 1.1 INTRODUCTION.......................................................................................................................................... 7 1.2 RAIL NOISE PROBLEM DEFINITIONS AND ACTIVITIES OF THE COMMISSION................................................. 7
2 CONSULTATION OF INTERESTED PARTIES ................................................................................. 16 2.1 PUBLIC CONSULTATION OF RAIL NOISE .................................................................................................. 16 2.2 AFFECTED POPULATION QUESTIONNAIRE ................................................................................................ 19
3 OBJECTIVES............................................................................................................................................ 20 3.1 GENERAL POLICY OBJECTIVES ................................................................................................................. 20 3.2 SPECIFIC AND OPERATIONAL OBJECTIVES................................................................................................ 20
4 POLICY OPTIONS................................................................................................................................... 21 4.1 SCREENING OF POLICY OPTIONS TO BE ASSESSED .................................................................................... 21 4.2 DESCRIPTION OF SELECTED POLICY OPTIONS ........................................................................................... 24 4.2.1 STATUS QUO (AS BASE LINE SCENARIO).............................................................................................. 24 4.2.2 COMBINED POLICY OPTION C3 + D2: SOV SUBSIDIES FOR RETROFITTING + OPERATING RESTRICTIONS + VOLUNTARY COMMITMENT ........................................................................................................................... 25 4.2.3 COMBINED POLICY OPTION C1 + D3: DEV DIFFERENTIATED TRACK ACCESS CHARGES + NOISE EMISSION CEILING + VOLUNTARY COMMITMENT............................................................................................. 25
5 ANALYSIS OF IMPACTS....................................................................................................................... 27 5.1 IDENTIFICATION OF SECTORS, STAKEHOLDERS AND COUNTRIES AFFECTED ............................................. 27 5.2 CAUSE-EFFECT ANALYSIS ........................................................................................................................ 29 5.2.1 BASELINE CAUSE-EFFECT ANALYSIS ................................................................................................... 29 5.2.2 DEV CAUSE-EFFECT ANALYSIS .......................................................................................................... 31 5.2.3 SOV CAUSE-EFFECT ANALYSIS .......................................................................................................... 33 5.3 IDENTIFICATION OF THE MOST RELEVANT IMPACTS ................................................................................. 34 5.4 RESULTS OF THE IMPACT ASSESSMENT .................................................................................................... 39 5.4.1 MAIN ASSUMPTIONS ........................................................................................................................... 39 5.4.2 QUANTITATIVE DESCRIPTION OF THE BASELINE SCENARIO ................................................................. 40 5.4.3 QUANTIFICATION OF THE IMPACTS OF THE POLICY OPTIONS ............................................................... 44 5.4.4 QUALITATIVE ANALYSIS ..................................................................................................................... 74
6 COMPARING THE OPTIONS ............................................................................................................... 78 6.1 EVALUATION OF THE IMPACTS OF THE PROPOSED POLICY OPTIONS ........................................................ 78
7 SENSITIVITY ANALYSIS ...................................................................................................................... 84 7.1 ANALYSIS ON OPERATIONAL COSTS (K-BLOCKS)..................................................................................... 84 7.2 SENSITIVITY ANALYSIS ON CRITICAL PARAMETERS ................................................................................. 87 7.3 CBA FOR THE “ONLY LL” SCENARIO....................................................................................................... 93 7.4 CONCLUSIONS REGARDING THE SENSITIVITY ANALYSES ......................................................................... 95
8 MONITORING AND EVALUATION .................................................................................................... 96 8.1 CORE MONITORING INDICATORS.............................................................................................................. 96 8.2 MONITORING AND EVALUATION ARRANGEMENTS ................................................................................... 98
9 CONCLUSIONS...................................................................................................................................... 100 9.1 GENERAL REMARKS ON THE INTERPRETATION OF THE RESULTS OF IA .................................................. 100 9.2 SUMMARY OF TECHNICAL CONCLUSIONS............................................................................................... 100 9.3 OPEN ISSUES.......................................................................................................................................... 103

3/129
ANNEX I - QUESTIONNAIRE FOR THE STAKEHOLDER CONSULTATION AND LIST OF RELEVANT STAKEHOLDERS .................................................................................................................... 104
ANNEX II – INVESTMENT AND LIFE CYCLE COST ............................................................................. 108
ANNEX III SCREENING OF THE POLICY OPTIONS............................................................................. 113 Preliminary identification of impacts ........................................................................................................ 113 Screening against assessment criteria ........................................................................................................ 116
ANNEX IV SENSITIVITY TO THE METHOD FOR CALCULATING AFFECTED POPULATION . 124
ANNEX V – REFERENCES............................................................................................................................ 126

4/129
Authors
Alessandro Distefano PricewaterhouseCoopers Advisory
Gaetano Fusco DITS (University of Rome “La Sapienza”)
Francesco Gargani PricewaterhouseCoopers Advisory
Riccardo Licciardello DITS (University of Rome “La Sapienza”)
Carlo Lupi PricewaterhouseCoopers Advisory
Roberto Mascellaro PricewaterhouseCoopers Advisory
Stefano Ricci DITS (University of Rome “La Sapienza”)
Antonio Tieri DITS (University of Rome “La Sapienza”)
PricewaterhouseCoopers Advisory s.r.l.
Contact: Francesco Gargani
Tel: +3906570831
Email: [email protected]

5/129
Disclaimer
PricewaterhouseCoopers Advisory (PwC) presents a study regarding an Impact Assessment on rail noise abatement measures addressing the existing fleets. This study was prepared by PwC for the European Commission of the European Communities, Directorate General for Transport and Energy. PwC does not accept or assume any liability or duty of care for any other purpose or to any other party. PwC shall not be liable in respect of any loss, damage or expense of whatsoever nature which may be caused by any use of this report. The views expressed herein are those of the authors and do not represent any official view of the Commission. PwC does not accept or assume any liability or duty of care regarding the accuracy of the sources of information cited in the study (mentioned in Annex V)

6/129
List of Acronym
Acronyms Description
18-IA 18 Impact Assessment countries (countries whose fleet is considered in the study)
AP Affected Population
BAU Business As Usual
CBA Cost-Benefit Analysis
DEV Combined Option: differentiated track access charges + noise emission ceiling + voluntary commitment
DEV-79 Combined DEV option, wagons entering service from 1979 eligible for retrofitting
DEV-84 Combined DEV option, wagons entering service from 1984 eligible for retrofitting
DTAC Differentiated Track Access Charges
EC European Commission
EU European Union
FO Forwarder
FTE Full Time Equivalent person
IM Infrastructure Manager
IRM Infrastructure-Related Measures for noise abatement
LN Low-Noise
MS Member State
NEC Noise Emission Ceiling
PO Private Wagon Owner
RU Railway Undertaking
SOV Combined Option: subsidies for retrofitting + operating restrictions for noisy wagons + voluntary commitment
SOV-79 Combined SOV option, wagons entering service from 1979 eligible for retrofitting
SOV-84 Combined SOV option, wagons entering service from 1984 eligible for retrofitting
t·km Tons x kilometre
TAC Track Access Charge
tr·km Trains x kilometre
TSC Transport Service Customer
TSI Technical Specifications for Interoperability

7/129
1 Problem definition
1.1 Introduction Noise health effects constitute one of the most widespread public health threats. The Commission intends to provide measures to prevent noises from rail vehicles not only for comfort reasons but also because of important health threats, like cardiovascular effects and cognitive impairment. Since the most important source for rail noise is freight trains that operate around the clock, the problem of noise emission is even more critical.
Despite the introduction of limit values for new and renewed rolling stock including freight wagons through the Noise Technical Specification for Interoperability (TSI), both the long service time of the rolling stock and the logarithmic nature of noise perception would take several years before the overall emission from freight trains could be reduced significantly if no additional measures addressing the existing fleet were introduced.
At present there are no legal obligations in rail practice that would stress the need for financial support and/or economic incentives which adds to the lack of available inexpensive technologies. Therefore the Commission intends to promote the most effective and efficient measures to implement retrofitting at European level.
In the White Paper “European Policy for 2010: Time to decide” the Commission realises that railways are the most environmentally friendly and sustainable means of transportation, both for freight and passenger traffic.
A meta-study considering several analyses at European and national level has demonstrated that measures at the source, e.g. the use of low noise brake blocks to ensure smoothness of the wheel surfaces, are significantly more cost-efficient than noise barriers.
Based on these findings, noise limits for rolling stock used within the European Union have been introduced through the Noise Technical Specifications for Interoperability (TSI). These limit values are applicable for new and renewed rolling stock including freight wagons. New freight wagons have to be equipped with low noise brake-blocks (so called K-blocks).
Since 1998 an action programme has been launched by leading associations of the railway sector (UIC, UIP, CER) to reduce the noise of freight traffic at source. As main achievement, several types of low noise brake blocks have been tested and homologated (K-block) or provisionally homologated (LL-blocks). However, the sector did not provide a commitment to retrofit the existing European freight fleet with low noise brake blocks.
In accordance with the Directive 2002/49/EC aiming to provide a common base to tackle the noise problem across the EU, the Commission intends to analyse in depth the 4 policy options stated in the Task Specification regarding rail noise abatement measures.
The Commission would like to understand: what are the main policy options to achieve the above objective, what are the likely economic and social impacts of these options and what are the advantages and disadvantages of the main options.
1.2 Rail noise problem definitions and activities of the commission
PwC has collected and studied the most relevant European Commission’s documents regarding rail noise abatement in order to have an overview of the sector and a clear overview of what has already been done to date.

8/129
In the White Paper “European Transport Policy for 2010: Time to Decide” the Commission realises that railways are the most environmentally friendly and sustainable means of transportation, both for freight and passenger traffic, that could tackle rising levels of congestion and pollution. It is general political intention to shift short haul air transport to high-speed rail transport and heavy duty road transport to rail freight transport. In some cases however, new railway lines do not get acceptance from the people living near by these new line due to concerns about unacceptable noise level. European Commission Green Paper (Com (96) 540) The framework states that more attention needs to be paid to rail noise where some Member States are planning national legislation and where there is considerable opposition to the expansion of rail capacity due to excessive noise. In addition to supporting research in this field the Commission will investigate the feasibility of introducing legislation setting emission limit values, negotiated agreements with the rail industry on targets for emission values and economic instruments such as a variable track access charge. With the Directive 2002/49/EC of the European Parliament and of the Council relating to the assessment and management of environmental noise, the European Union is for the first time introducing noise reception related legislation. In particular, the following are the main EU policy actions in the field of railway noise reduction. Position Paper on the European strategies and priorities for railway noise abatement (2003) According to the World Health Organisation (WHO) the outside noise levels (Leq) should be less than 55/45 dB (day time/night time) to avoid serious annoyance or sleep disturbances. Three dominant types of railway noise are identified:
rolling noise
noise from traction and auxiliary systems
aerodynamic noise
At low speeds traction noise is predominant, rolling noise becomes dominant up to speeds around 200 km/h, then aerodynamic noise prevails (typically around 250 km/h or more). Rolling noise is the most important noise source and, for its abatement, the first requirement is to apply measures to achieve smooth running surfaces on the wheels and on the tracks (principle of “smooth wheels on smooth rails”); maintenance plays a key role in this, keeping the surface of wheels and rails in good state. Three issues can be pointed out, in order of importance:
Freight wagons: they are the predominant railway noise issue in Europe, because of their braking technology: while on modern coaches disc brakes have replaced old cast iron block brakes (to allow speeds above 140 km/h), freight trains still use cast iron brake shoes and are therefore much more noisy. This problem is still more urgent considering that these trains often operate at night.
High speed trains: they operate during the day and they produce mainly aerodynamic noise.
Urban railway transport, operating in densely populated areas.
The Position Paper states that the noise reduction must be pursued by measures that reduce it at the source. It concentrates therefore on technical measures that should be applied to both new and old vehicles: this requires a European wide retrofitting programme. Measures at the source are those which reduce rolling noise, traction noise and aerodynamic noise. Main obstacles in realising this objective are:

9/129
Rail vehicles have a long life, so it takes a long time to introduce new technologies and retrofitting is very expensive;
There are many differences between the Member States in terms of: magnitude of exposure to noise, legislation, methodologies applied.
Due to the international nature of rail transport, a large amount of the vehicles running on national networks are of foreign origin;
Splitting of responsibility: there are several parties responsible for railway noise abatement that include operators, vehicle owners, maintenance companies, infrastructure managers and infrastructure and vehicle manufacturers;
remaining technical and economic uncertainties regarding some of the proposed technologies. Seventeen instruments have been identified in order to abate railway noise, out of which fourteen are direct instruments, and three are accompanying instruments:
1. Retrofitting of existing railway rolling stock: wheel roughness together with rail roughness are the main source of noise in conventional rail, the main cause of wheel roughness being the use of cast iron brakes. New composite (or similar) brake shoes ("K-Blocks") require changes in the braking system.
- Evaluation: fastest and cost effective noise reduction possible, since the natural replacement of the older vehicles with the new low noise vehicles would take several decades
- Implementation: the Working Group1 (WG) agrees that retrofitting must be promoted as a first priority.
2. Noise reception limits: maximum allowed outdoor levels (Leq) at the receiver: the limit can be achieved by source-related measures (vehicles, tracks), by measures to reduce sound propagation (such as noise screens, insulation windows), by operational measures (such as speed, volume reduction).
- Evaluation: can be the most effective solution for the protection of the community; it exists on a national level in various forms, mainly for new and substantially upgraded lines but does not cover existing lines; level increases due to higher speed or traffic volumes are not considered.
- Implementation: generally rejected by the WG because of the financial implications.
3. Noise emission ceiling: in this case, infrastructure managers may faster the use of vehicles with lower emission to increase the number or the speed of trains without exceeding limits.
- Evaluation: it is an incentive to use low noise vehicles. - Implementation: the WG gives this instrument a low priority.
4. Access restrictions for noisy vehicles: access for noisy vehicles is restricted at certain times or on certain sensitive lines.
- Evaluation: it grants a high level of protection but can hinder the free circulation on railway, it contradicts the EU Transport Policy goal of shifting the transport modes in favour of rail transport.
- Implementation: the WG gives this instrument a low priority
5. Noise emission regulation for vehicles: maximum allowable sound or pressure level for different relevant operating conditions (constant speed, stationary, acceleration…) is defined.
- Evaluation: it is a key control mechanism for noise reduction but currently only used for approval of new vehicles.
1 The European Commission convened a Working Group on railway noise in December 1999 as one of the Working Groups dealing with noise emissions from transport and industry reporting to the Steering Group on Environmental Noise. Members of the Working Group on Railway Noise have been nominated by the Member States of the European Union, NGOs and railway association. Due to the composition of the Working Group, the position paper does not necessarily reflect the position of the European Commission.

10/129
- Implementation: in 1983 an EU document on noise emission for railway vehicles was drafted but abandoned because of problems caused by the international character of railway transport. With the “Technical Specification for Interoperability” (TSI) the Commission is currently enforcing noise emission limits for high speed trains (May 2002) and conventional trains (2004) operating on the Trans-European Network (TEN-T). The application of this instrument to interoperable vehicles has, in parallel with the retrofitting of existing freight wagons, the highest priority. As a first step, the Community should establish a framework for progressively setting standards on interoperability, this will be followed by a second package of measures to consider safety aspects and expand interoperability. For this purpose the European Railway Agency is created as a centre of expertise.
6. Programmes to manage rail roughness - Evaluation: rail roughness is the most relevant noise source; disc-brakes and K-block
brakes bring to an effective noise reduction only if combined with low rail roughness. - Implementation: normal maintenance grinding is already common practice, but its
implementation varies considerably among railway companies. It is important to ensure that grinding is performed with high quality standards and at optimal intervals.
7. Instruments for track upgrading or new design - Evaluation: track design is one of the parameters which influence emission of rolling
noise and it is crucial when noise emissions from the track exceed that of the vehicle. - Implementation: in many countries wooden sleepers are already replaced by concrete
sleepers, rail pads are sometimes replaced by stiffer or softer pads, depending on specific situations. WG members doubt the feasibility and effectiveness of new designs and ask for more information on noise abatement potential, cost and side effects.
8. Regulation for track: track condition and design can be regulated by specifying rail roughness rules (periodic declaration of track maintenance levels) and/or track design rules.
- Evaluation: the successful implementation of quieter railways depends not only on vehicles but also on track quality, both in terms of rail roughness and design.
- Implementation: at the moment a regulation is in force only in Germany. The instrument in general has a low priority in the WG, because it requires testing and classification methods for tracks to be improved or more precisely defined.
9. Specifications for noise emission in procuring/ordering new vehicles and tracks: this instrument means the specifications of permitted noise emission levels in contracts between the railway companies/vehicle owners and the manufacturers.
- Evaluation: infrastructure managers are in general supposed to be responsible for the overall noise exposure, the growing separation between infrastructure and service means that it is necessary to create a mechanism that gives managers control over the specification of vehicle noise.
- Implementation: while noise emission specifications for vehicles are widely applied in railway companies, specifications relative to tracks are not in use. This instrument has a high priority in the WG: procurement specifications should be used to increase new Low-Noise vehicle orders. European, National and regional authorities should link their financing of new equipment to these specifications.
10. Incentives for the use of Low-Noise vehicles - Evaluation: this instrument has the advantage to be effective also for operators outside
the EU and to stimulate retrofitting of vehicles in use, on the other side it requires harmonisation of charges and classification of single vehicle emissions on a European basis.
- Implementation: at present there are no harmonised track access charges in Europe. Incentives for the use of Low-Noise vehicles have a high priority.

11/129
11. Public funding for noise abatement programmes: this instrument means the implementation of noise abatement programs with financial support by the State. These programs should identify: targets for noise abatement, quantity of financial aid, kind of measure that can be financed, and timetable of implementation.
- Evaluation: public funding is necessary to promote the retrofitting of in-use vehicles. - Implementation: those programs are implemented in most European states; the most
advanced is the Swedish one, giving priority to retrofitting of vehicles and including barriers and insulating windows. Public funding has a high priority in the WG, it should focus on measures at the source and it should be coordinated at a European level because of the international character of rail transport.
12. Voluntary agreement: they are voluntary commitments of the parties who are fully or partially responsible for negative environmental effects to fulfil defined environmental targets in exchange of benefits from the legislator.
- Evaluation: voluntary agreements are easier and faster to implement than regulations. - Implementation: in 1998 UIC - CER - UIP started their action plan for the reduction
of freight wagon noise by replacing cast-iron block brakes by composite blocks but the plan was abandoned due to the high cost of new K-Blocks. The WG considers voluntary agreement a medium priority, underlining that it should not only deal with retrofitting but also with maintenance and funding.
13. Member State and EU funding for research and development: public funds are given to industry and research institutions in order to develop innovative solutions for noise control.
- Evaluation: public funds are important in the environmental field, where innovations are not initiated by market forces.
- Implementation: railway noise research is funded by the EU, the Member States and the railways (operators, manufacturers) themselves. In the EU, the Framework Programs are the most important. Research has a high priority and should deal with these topics: understanding of roughness growth, understanding of screech and squeal effects, reduction of aerodynamic noise, maintenance techniques for noise reduction, development of monitoring techniques.
14. Information for stakeholders: in accordance with the principle of shared responsibility, information regarding the abatement of railway noise should be diffused to stakeholders: manufacturers, operators of rolling stock and infrastructures, researchers, politicians, public administration.
- Evaluation: the knowledge of negative impacts of traffic noise and the availability of information on the most effective instruments and measures to reduce is important to support all abatement strategies.
- Implementation: at present national noise abatement research results are not sufficiently spread, in particular, smaller entities have difficulties in retrieving information. This instrument has a medium priority in the WG: the EU should gather, assess and harmonise relevant information.
15. Improved measurement standard for railway exterior noise: internationally accepted standards for measurement of noise emission are necessary to test limits, compare noise emissions, monitor and collect data.
- Evaluation: reliable measurement data standards are essential to monitor noise reductions achieved.
- Implementation: some measurement standards are in use mainly for contractual and legal purposes in some Member States. This instrument has a high priority in the WG.
16. Comprehensive noise prediction scheme: it is a calculation procedure used to predict the average noise level under specific conditions (traffic composition, speeds, tracks, presence of barriers or other obstacles) and used to determine numbers of affected residents and required noise abatement.

12/129
- Evaluation: the emission data are often determined in an empirical way (averages based on statistical data)
- Implementation: national noise prediction schemes exist currently in a number of European countries, they vary in complexity, predicted results and legal status. This instrument has a low priority in the WG.
17. Information and participation to the public: provision of the information to the public on all environmental noise issues (e.g. negative effects of noise, noise legislation, noise abatement instruments)
- Evaluation: participation of the public corresponds to democratic procedure and the Environmental Noise Directive mentions that “information on environmental noise and its effects is made available to the public”.
- Implementation: participation of the public is considered a part of the process for new railway lines. The implementation of the Environmental Noise Directive will improve information to the public.
. Position Paper of the Working Group on Health and Socio-Economic Aspects: Valuation of Noise Policy makers need to balance the costs of reducing noise exposure with the benefits of noise reduction: a cost-benefit analysis is therefore important to evaluate and compare different policy options. The Position Paper aims at identifying an interim money value that represents the benefit of reducing noise exposure, two main methods are pointed out:
stated preference: how much people are willing to pay to reduce their noise exposure;
hedonic pricing: different noise levels have an effect on prices in other markets, in particular on price of housing, noisy houses/apartments will attract a lower rental payment or lower sale price.
Research carried out with both methods above show that the most useful form to value benefits of noise reduction is per dB, per household, per year. The average value people are willing to pay to reduce noise exposure is €25 per household/dB/year. This study does not take in consideration differences between modes of transport: at a given noise level, disturbance can be different. Rail Freight Noise Abatement: a Report on the State of the Art (UIC - 2006) This report, that reflects views of UIC, shows the state of the art in railway noise control. It briefly illustrates the principles and objectives of European traffic policy and legal framework (White Paper, TSI) and gives an overview of studies and actions undertaken by EU and some of the stakeholders (UIC-CER-UIP “Freight Traffic Noise Reduction Action Programme”, EU-UIC study “STAIRRS”) to reduce noise emission. Main conclusions are:
noise abatement should consider specific railway situation: tight competitive environment, many stakeholders, vehicles’ long life;
first priority is given to measures at the source and specifically to the retrofitting of in-use rolling stock with silent braking systems (LL-Blocks and K- Blocks);
K- Block are more effective than LL- Blocks in noise reduction, but: 1. require adapting braking system causing additional costs; 2. may require more maintenance activities (for instance for different frequency of wheel
re-profiling) 3. are more expensive than LL-Blocks.
Therefore K- Blocks will be used for new wagons and LL-Blocks only to retrofit the existing
ones;

13/129
Figure 1-1. Comparison between composite brake blocks
K Blocks LL- Blocks
Rolling noise reduction 8-10 dB same as K-blocks
Retrofitting possibilities Requires adapting braking system No adaptation required
Braking characteristics Independent on velocity Velocity dependent (similar to cast iron brake blocks)
Homologation One type homologated, second type begin 2008
3 types provisionally homologated until 2009
Source 1: PwC Elaboration on UIC & CER Report (Rail freight Abatement)
according to the cost-effectiveness analysis in STAIRRS, combining different measures optimises noise abatement;
among possible noise reduction measures, freight rolling stock improvement has the highest cost-effectiveness, while noise barriers have a low one;
retrofitting requires investments, outside financial help is necessary. EU funding or National funding and/or incentives are different possibilities.
Implementation of Retrofitting Status Report Noise abatement on European Railway Infrastructures (UIC – January 2007 )
According to the “Freight Traffic Noise Reduction Action Programme” published by UIC, noise reduction is achievable by removing cast iron brake shoes and replacing them by synthetic brake shoes. An inquiry was made among all major railways of the European Union with the objective of having an overview on implemented, ongoing or planned noise abatement programs on the European railway infrastructure and this report contains its results. Currently noise legislation in Europe follows the principle to regulate:
noise creation;
noise reception.
The instrument to implement legislation limiting noise creation is the Technical Specification on Interoperability (TSI) for railway vehicles. There are limits in force for high speed trains as well as for conventional railways. Regulation within the TSI is done by fixing the admissible pass-by noise levels, accelerating noise levels or the noise emission at standstill. In order to obtain an overview of the existing noise situation in Europe, the European Union enacted the “Environmental Noise Directive” (END) in 2004. According to the END, all EU Member States must create noise maps of all major traffic noise sources. In all EU countries noise mapping according to the END is currently in progress, but often the mapping process is delegated to the regions, in this framework it will be difficult to reach an overarching noise abatement strategy for the railways and to include the retrofitting as a possibility into the national action programs for noise reduction. The status of railway noise mitigation in Europe can be characterized as follows:
all countries meet all necessary noise protection measures when building new or upgrading existing lines;
with few exceptions (Italy, Switzerland) the laws do not prescribe a direct obligation for noise abatement on the existing networks, but nevertheless in nearly all countries partly extensive programs of noise abatement are in progress; in particular, Switzerland has the most comprehensive noise protection;
at the end of 2005, about 1000 km of noise barriers established and ~60'000 houses or dwellings are isolated against noise, mostly by means of noise protection windows;

14/129
an estimation of the persons protected from railway noise is difficult; in Europe at the end of 2005, 1 million persons are protected by noise barriers and additional ~1/4 million persons are protected with noise protection at the buildings, thus in total a magnitude 1'250'000 persons benefit from a railway noise protection;
adding up, ~150-200 million € are spent annually in Europe for infrastructure related noise protection measures.
even if data of large countries are missing and future estimation for infrastructure related noise protection are not available, the future expenditure for the railway noise protection could reach up to 10 billion €.
According to STAIRRS retrofitting existing rolling stock with new silent brakes is the most efficient noise abatement measure. If it were possible to redirect, from the future infrastructure related noise abatement, investments of about 10 % to a retrofitting of the freight wagons, the cost of further necessary infrastructures measures would decrease more than proportionally. The following table summarises the current situation of 17 European countries’ rail noise programmes2, protection measures and budget information.
Country Status and Noise abatement programme
Austria - 497 communities and roughly 300.000 inhabitants have excessive railway noise levels; - planning process of rail noise abatement projects has been made in 209 communities and
in 152 communities the implementation process has been concluded; - until 2005 some 295 km of noise barriers have been built; - between 2002 and 2005, 128 M€ have been invested for the noise abatement programme.
Belgium - no dedicated abatement noise programme (noise protection measures are only taken within the new infrastructure project;
- about 36 km of noise barriers and some 50 km of noise protection berms have been built; - no budget dedicated to noise abatement measures; - total investment already realised is estimated to about 80 M€.
Czech republic - no dedicated abatement noise programme: noise protection measures are only taken within the new infrastructure projects (two new high speed corridors);
Denmark - Noise abatement was launched in 1986 (it will be finalised in 2010): building noise barriers, providing noise insulation windows and grinding plan for 300 km track/year, house insulation (offer part of the cost to house owners);
- the number of dwellings exposed to noise without protection decreased from 17.500 in 1986 to 3.400 by 2005;
- total investment is 167 M€: 150 M€ for noise barriers, 11 M€ for noise insulation (other 5,5 M€ to finalize the programme).
France - there is a national programme of reduction of the noise of surface transport (rail and road) based on a legislation of 2001: 12.000 km out of 32.000 km of national rail network are included;
- an annual envelope of 15.4 M€ to this programme (by the state and the manager of the infrastructure);
- the mapping of the critical noise areas has been completed in 2003 and 70 communities are the subject of detailed studies (resulting in a total of 2000 m of noise screens).
2 Source: Status report noise abatement on European railway infrastructure

15/129
Country Status and Noise abatement programme
Germany - There is a structured noise abatement programme consisting of 3.500 km of lines and 1.350 cities (a priority list): special care is taken to reduce noise at the source;
- started in 1999, by 2005 195 cities and 285 km of lines have been treated (with 167 km of noise barriers, 27,600 dwellings receive noise insulation windows);
- 110 M€ have been invested, projects with a volume of 25 M€ are in construction, and other 160 M€ are in preparation.
Hungary - There is a noise reduction programme focused on noise prevention, reduction at the source and on passive solutions such as barriers or insulation windows;
- noise protection measures are constructed while upgrading three main corridors (Budapest-Vienna, Budapest-Rumania, Budapest-Slovenia;
- investments are estimated at 1.2-1.4 M€.
Italy - The Italian noise programme is very extensive : 8.000 Km (out of 17.000 Km) of railway line have to be dealt with in order to comply with the legal noise limit;
- 80% of activities are in the planning process and 20% are in progress (only infrastructure solutions);
- the infrastructure owner is currently spending 15 M€/year in infrastructure to reduce rail noise (as noise barriers): total cost of the programme in estimated at 15 billion €.
Luxembourg - There is no known noise abatement programme; - it is known that approx. 10,000 persons are affected by railway noise.
Netherlands - There is an on-going noise abatement programme (started in 1987); - almost 200 km of noise barriers have been installed, test train using K-Blocks and LL-
Blocks are in operation (150 freight wagons in total are tested with a noise reduction at the source of 7-10 dB (A);
- the budget has a magnitude of 5 M€ per year; very high total cost are estimated: 520 M€; - in the framework of the “multi-year programme for infrastructure and transport”, 350 M€
on noise protection measure, 280 M€ for stand alone mitigation, 40 M€ for noise innovation programme (focus on usage of LL-Blocks and K-Blocks).
Norway - The noise abatement programme is set up using: source related measures (rail grinding, replacing noisy rolling stock by silent material, etc…);
- railway noise annoyance has been lowered by some 20% between 1999 and 2004, two noise protection systems have reduced noise in 45 of 150 houses (with an unacceptable indoor noise level) ;
- in the last 5 years approximately 4 M€ have been spent on the existing railway network.
Poland - The rail noise abatement programme considers: abatement at the source with a grinding programme (1000 km/year), limit impact of noise (noise barriers, anti-vibration equipment, etc..), noise emission monitoring and a programme on 6 railway lines;
- Annual budget: 3.9 M€.
Portugal - information not available.
Spain - There is no noise abatement programme in progress; - 700 km of network will be treated with noise abatement solutions.
Sweden - Environmental strategy consist in preventing the emission of noise and vibrations; - between 2000 and 2005, measures have been taken at over 20,000 dwellings; - total costs have been 52 M€ (other 53 M€ are budgeted for the period 2007-2014).
Switzerland - Noise abatement programme considers: wagon retrofitting (1030 passenger coaches and

16/129
Country Status and Noise abatement programme 11.500 freight wagons must be retrofitted), noise barriers, noise insulated windows;
- programme of 38 communities (33 km of noise barriers) was finalised, in 25 communities the work is in progress; 991 coaches and 1.165 freight wagons were retrofitted; 35.000 inhabitants have benefited from significantly reduced railway noise levels;
- overall costs for noise abatement are estimated to some 810 M€ (155 M€ have been already spent).
United Kingdom - No major project in progress.
2 Consultation of interested parties
2.1 Public Consultation of Rail Noise In May 2007, in its Consultation Paper, the Commission presented several policy options to the industry, in particular the railway undertakings, to the other actors (i.e. wagon owners), to the associations representing the rail sector and others concerned as well as to the Member States of the European Union. Different parties showed interest in giving an evaluation and their opinion of the solutions presented in the Consultation paper. According to these needs, the Commission set up an online consultation questionnaire3 to understand the views of the representatives of the European organisations and Member States with regard to the measures to be taken in view of implementing programmes to retrofit existing freight wagons with low-noise brake blocks. 73 total contributions were received, 60% by organisations (such as public sector bodies, private companies, government) and 40% by citizens. Contributions came from 11 EU member states and Switzerland. The following table shows the topics of the questionnaire and the main result of the online consultation4.
Questionnaire topics Main Results
1. Defining and sharing key performance indicators of programme: In questionnaire “number of vehicles retrofitted” and the “percentage of wagon-km run by low noise wagons”
- 58% of contributions in favour of “percentage of wagon-km run by low noise wagons”;
- 33% of contributions in favour of “N° of vehicles retrofitted”;
2. deadline for retrofitting programme (proposal: 2009-2017);
- 56% would like a deadline at or before 2014 (not feasible)
3. minimum residual lifetime of wagons to be retrofitted;
- Highest percentage of contributors (39%) consider suitable value is 5 years
4. minimum residual annual mileage of wagons to be retrofitted;
- Highest percentage of contributors (34%) consider suitable value is 10.000 Km
3 Consultation document of the Commission's services: Rail noise abatement measures addressing the existing fleet. May 2007. http://ec.europa.eu/transport/rail/consultation/2007_rail_noise/doc/rail_noise_consultation_document_en.pdf 4 Cfr. Report on the contributions received serving as input for the impact assessment studies.

17/129
Questionnaire topics Main Results
5. agreement with assessment criteria (for details on assessment criteria see next chapter);
- All criteria receive positive opinion (the agreement ranges from 70% and 90%)
6. list of policy options and instruments:
1. track access charge;
2. subsidies for use of silent wagons;
3. subsidies for retrofitting;
4. loans;
5. limit values;
6. operating restrictions;
7. emission ceiling;
8. tradable permits
- Except one instrument, tradable noise emission permits5, all policy options receive positive view (between 65% and 85% of participants strongly agree with the use of respective instruments);
- additional elements have been suggested from the participants: financial incentives for replacing old wagons before the end of their lifetime.
7. what components should be included in voluntary commitment by the rail sector;
- Legal obligations are inevitable;
- All relevant actors have to be included in voluntary commitment (railway undertaking, infrastructure manager, wagon owners/keepers, national authorities.
- Additional elements have been suggested by participants:
- commitment that the users of the wagons (railway undertakings) will address the wagon owners to provide retrofitted (or other silent) wagons;
- commitment by infrastructure managers to guarantee a high level of smoothness of the rail running surface;
- commitment by national authorities to provide public financial incentives;
- commitment by the European Commission to support (financially) the new Member States;
- contributions by the sector regarding workshop capacities and work forces.
8. Instruments for financial incentives; - subsidies for retrofitting must not distort competition;
- subsidies on a temporary basis combining with implementation of obligatory noise limits for the non retrofitted fleet;
- guarantee that wagon subsidies are actually used on highly frequented tracks.
9. Agreement with legal instruments usage; - Participants propose to combine legal instruments with adequate financial aid and time frame.
10. Need for additional action and suggestions. - financial support for research;
5 This policy option will be eliminated from the Impact Assessment analysis.

18/129
Questionnaire topics Main Results
- instrument of classification for wagons and their noise emission;
- homologation procedures;
- investigation on Life Cycle Costs;
- installation of noise monitoring stations;
- others.
Furthermore, in addition to online consultation standard answers, 12 written contributions were received. Among the main comments and evidences, it has been considered:
potential negative impact of retrofitting on the competitiveness of rail transport (modal shift from rail to road);
timeframe of two maintenance cycles (10-14 years) for the implementation of retrofitting programmes;
suggestion to use part of existing funds of infrastructure-related noise abatement programmes as subsidies for retrofitting programmes (to the wagon owners);
any measure to support or impose retrofitting needs to be technology-neutral;
within the impact assessment study, availability of spare parts through several suppliers and capability of maintenance workshops to retrofit wagons without limiting traffic have to be considered.
Conclusions from the stakeholder consultation Regarding the online consultation and written contributions from different stakeholders, several results have been confirmed, in particular:
retrofitting of all European freight wagons with an annual mileage of at least 10.000 km and a remaining lifetime of 5 years;
Indicator to be used: “percentage of wagon-km performed by low noise wagon”;
completion of the retrofitting programme by 2017 (2014 deadline is considered technically not feasible);
it is widely accepted that an integrated approach would be required as no single measure seems to be able to solve the noise abatement problems;
the temporary implementation of instruments as well as the implementation at a later stage needs to be considered;
industrial capacity of workshops, production of different LL or K blocks and components of braking system have to be considered in the impact assessment process.
An exhaustive description of the different policy options to be assessed will be presented in the next chapter.

19/129
2.2 Affected population questionnaire In order to collect data concerning rail noise affected population with the aim of building a database for the different scenarios of the future EC Communication for rail noise abatement measures, a short questionnaire document has been developed and submitted to 26 countries6. In particular, the questionnaire included requests for the following information (cfr Annex 1):
1. number of people exposed to railway noise: according to the Directive 2002/49/EC (as specified by points 1.5 first paragraph and point 1.6 first paragraph, Annex VI of Directive 2002/49/EC), aggregated for all agglomerations with more than 250,000 inhabitants;
2. number of people exposed to railway noise as specified by point 2.5 first paragraph and
2.6 first paragraph, aggregated for the overall network of major railways with more than 60,000 trains per annum;
3. In the case where these data were not yet available, number of kilometres of railways
where railway noise levels exceed national limit values. PwC has received 11 responses to the questionnaires (roughly 42% of total sent), mainly by the Ministries of Environment of MS. In Annex I the answers received are listed and ranked. Unfortunately, most of the countries stated that noise mapping is in progress but not yet available, neither for the agglomerations nor for the overall network (official reporting deadline for Member States is December 2007). Only Switzerland, Czech Republic and Lithuania have sent structured answers corresponding to our requests. These are the only ones for which it has been possible to use figures and information received. The following figure summarises the different percentages of type of answers: answers have been clustered looking at the way they correspond to the questions in the questionnaire.
60%
4%
14%
11%11%
No Answer CompleteIncomplete Received - data n.a. (Map) WIPReceived - No Major railways or agglom.
6 All Member States were firstly contacted by email and then solicited to reply to the questionnaire by telephone

20/129
3 Objectives
3.1 General policy objectives Following on directly from the analysis of the problems, it is possible to identify the following basic objectives for European Rail Noise abatement measures:
1. to provide measures to reduce noise from rail vehicles (with priority for freight wagons) not only for comfort reasons but also because of health threats;
2. according to the Consultation Document of the Commission, the Commission intends to analyse 4 policy options stated in the Task Specification regarding rail noise abatement measures, in particular:
a. Status quo as base line scenario;
b. Voluntary commitment by the rail noise sector;
c. Financial incentives for retrofitting;
d. Legal measures to impose retrofitting.
3. according to the European Commission Green Paper (Con (96) 540), supporting research in this field to investigate the feasibility of introducing legislation setting emission limit values.
3.2 Specific and operational objectives The purpose of this paragraph is to summarise the specific and operational objectives of the assessment and to underline the relation between these operational objectives and the general policy objectives. As explained above, the main objective of this study is to assess (within the rail noise abatement measure solutions) the impact of the planning and developing of a retrofitting programme on freight wagons that considers the replacement of the current brake system with a more silent solution. Focus on retrofitting of brake systems in freight wagons has been considered, according to the Commission, because:
the most important sources of noise are the freight train;
the rail braking technology used today leads to a roughened the wheel surface and to a high level of vibration of the wheel that produce noise;
as freight trains often usually operate at night, their noise emission is even more critical;
the use of low-noise brake blocks to ensure the smoothness of the wheel surface is probably the most cost-efficient solution (for instance compared with noise barriers), although a confirmation is needed (life cycle cost of both brake blocks and wheels need to be investigated).
The following table summarises the specific and operational objectives of the assessment in relation to the general policy objectives.

21/129
Table 3-1 Specific and operational objectives
Specific / operational objectives Consistency with EU policies
Identifying solutions for rail noise abatement measures ensuring a minimal impact on total cost of rail services
White paper “European transport Policy 2010: time to decide”
Applying measure to achieve smooth running surfaces on the wheels and in the tracks and rails (reduction at the source)
Position Paper on the European strategies and priorities for railway noise abatement (2003);
Art 174 of EC Treaty: “environmental damage should as priority be rectified at source”
Reduction of total noise emission level principally caused by freight trains
Position Paper on the European strategies and priorities for railway noise abatement (2003)
Provide financial assistance to projects promoting rail noise abatement measures
No specific reference
Planning and developing of a retrofitting programme on freight wagon that consider the replacement of brake system with silent solution
Commission decision 2006/66/EC concerning the technical specification for interoperability relating to subsystem rolling stock
Finance investments to maintain retrofitting programme
Position Paper on the European strategies and priorities for railway noise abatement (2003);
Identifying solutions to incentivise the utilisation of vehicles with lower emission (in terms of mileage).
Position Paper on the European strategies and priorities for railway noise abatement (2003)
Long-term reduction of infrastructure-related noise abatement measures
Position Paper on the European strategies and priorities for railway noise abatement (2003).
Identifying solutions to maximise the effectiveness of total noise reduction on affected population.
Position Paper on the European strategies and priorities for railway noise abatement (2003);
“Environmental Noise Directive” (END) 2004;
7th Environmental action programme.
Reduction of total noise emission on affected population and in particular hot spot
Position Paper on the European strategies and priorities for railway noise abatement (2003);
“Environmental Noise Directive” (END) 2004;
Directive 2002/49/EC relating the assessment and management of environmental noise;
7th Environmental action programme.
4 Policy Options
4.1 Screening of policy options to be assessed
In Annex III, a preliminary screening of the policy options is described. This process led to the elimination of a few options as can be seen in Table 4-1 .

22/129
Table 4-1: Policy Options subjected to preliminary screening
Policy option Instrument
A: Status quo (as baseline scenario)
B: Voluntary commitment by the rail sector
C: Financial incentives for retrofitting
C1: Differentiated track access charges
C2: Subsidies for the use of low-noise wagons (eliminated)
C3: Subsidies for retrofitting
C4: Loans at preferential terms (eliminated)
C5: Tax incentives (eliminated)
D: Legal measures to impose retrofitting
D1: Noise limit values for the existing fleet (eliminated)
D2: Operating restrictions for noisy freight wagons
D3: Noise emission ceiling
The option of the creation of a framework for a European noise permits trading scheme had already been ruled out following the examination of the consultation outcome on the basis of the following considerations:
likelihood of long implementation time as today there is no legal basis in place;
high administrative costs;
difficulty to address ‘hot spots’;
highly negative scoring in the public consultation issued by the Commission.
Option C2 was ruled out on account of:
problem of economic advantage to be transferred to wagon keeper;
funding schemes with interface to data on track access charges/ train composition is required (retrofitted Low-Noise wagons have to be distinguished from new Low-Noise wagons); new financial flow from state to keeper: more complex than C1;
probably not suitable for wagons registered in other countries;
in conclusion, this option has the disadvantages of C1 and of C3 plus a greater complication in the acquisition on data on train composition.
Options C4 and C5 consist of financial options allowing to cover only a relatively small fraction of the costs for the railway sector. Thus they are not incentivising unless accompanied by legal measures. This type of solution was ruled out for the following reasons:

23/129
the main objective of EU policy is to reduce railway noise externalities with the constraint of not increasing, and if possible decreasing, all other types of externality, particular those of other transport modes;
EU policy strongly favours the rail mode among terrestrial transport modes;
measures causing the rail sector to bear the cost of noise reduction are fair respect to the principle that the parties causing externalities should pay for their effects (although rail customers should be made to pay in this sense), however they are not fair as they inevitably favour a shift of traffic towards the other less sustainable transport modes.
Option D1 was ruled out as it does not comply with the legal framework for interoperability that does not foresee the instrument of compliance for rolling stock already in use (unless it gets upgraded or renewed).
Finally, a voluntary commitment by the sector is strongly recommendable in any future scenario; it is considered as a part of all policy options assessed.
The resulting list of policy options which was subjected to the detailed impact assessment is shown in the following table.
Table 4-2: Policy Options assessed in the Impact Assessment study
Policy option Instrument
A: Status quo (as baseline scenario)
C: Financial incentives for retrofitting
C1: Differentiated track access charges
C3: Subsidies for retrofitting
D: Legal measures to impose retrofitting
D2: Operating restrictions for noisy freight wagons
D3: Noise emission ceiling
Moreover it has to be considered that it is quite unlikely that a single solution could be suitable, effective and successful, because:
legal options not combined with financial incentives were ruled out due to the excessive burden on the rail sector, for the same reasons which led to the exclusion of options C4, C5 (see above);
financial incentives not combined with legal measures were ruled out since they are not necessarily able to ensure alone a high retrofitting rate.
These were selected on the basis of the following considerations:
It would not be fair to grant funding to one party and burden another party with legal obligations – this rules out combinations such as C1+D2 (funds to IMs, obligations for RUs) and C3+D3 (funds to RUs, obligations for IMs).

24/129
The two selected financial incentives (differentiated access charges and subsidies) are difficult to combine. However, a combination would make it possible to fund both Infrastructure Managers (directly) and owners (directly and indirectly through access charge reduction). A plausible method is to grant subsidies in the first few years of the programme, while the mechanism for differentiated charges is being developed, and then to incentivise through the charges. Both options are necessarily transient (they end once all retrofittable wagons have been completed).
Combination of D2, D3: although probably difficult to implement, the combination of the two selected legal measures (operating restrictions and emission ceiling) is possible and potentially advantageous. Simultaneous application of different instruments could distinguish among lines. Application at different times is also possible.
The following matrix summarises the possible combinations of the selected policy options.
Table 4-2: Summary of the possible combination of the selected policy options
Diff
eren
tiate
d tr
ack
acce
ss
char
ges
Subs
idie
s for
re
trof
ittin
g
Ope
ratin
g re
stri
ctio
n
Noi
se
emis
sion
ce
iling
Differentiated track access charges Low Med. High Financial incentives Subsidies for retrofitting High Med.
Operating restriction for noisy freight wagons Med. Legal measures Noise emission ceiling
According to the assumptions described, within our analysis the detailed impact assessment was carried out on two combinations of policy options:
‘SOV –Subsidies to owners, Operating restrictions, Voluntary commitment’, i.e. C3+D2;
‘DEV – Differentiated access charges, Emission ceiling, Voluntary commitment’, i.e. C1+D3.
In the next paragraph a description of both combined solutions will be considered.
4.2 Description of selected policy options
4.2.1 Status quo (as Base line scenario) The baseline scenario considered in the Impact Assessment is based on the assumption of no EU action to provide incentive for the increase of wagons equipped with LN technology and of the kilometres run by these. A zero retrofitting rate is assumed (the implementation of the END and the Noise TSI is expected to lead to negligible retrofitting rates: not all countries would retrofit according to the different policies implemented, countries with prevalent transit traffic would certainly not be

25/129
incentivised). The reduction of emitted noise derives from the new wagons, all necessarily equipped with LN brake blocks according to the Noise TSI.
4.2.2 Combined policy option C3 + D2: SOV Subsidies for retrofitting +
Operating restrictions + Voluntary Commitment The SOV combined option considered in this study is characterised as follows:
Subsidies are granted on demand to cover retrofitting costs (on presentation of invoices and demonstration of eligibility by owner or with fixed rates per wagon type) and extra administrative and maintenance costs (fixed percentage of retrofitting costs which also takes into account an extra margin to avoid penalising the owner).
Operating restrictions are introduced for hot-spots at the earliest date which allows not to penalise the railway sector; the restrictions consist of prohibition for wagons not equipped with approved LN technology to circulate during the night time (22-6 h) on given lines/nodes/corridors already identified as critical by MS; wagons equipped with approved LN technology are identified by markings.
Voluntary commitment involves RUs (to monitor efficiency of LN wagon management: these wagons should be privileged in terms of load-factor, mileage, use at hot spots) and IMs (to enforce operating restrictions).
The incentive mechanism for retrofitting consists of subsidising owners directly with funds completely covering all added costs so as not to penalise the sector. The incentive mechanism for efficient management derives from the introduction of restrictions at an early date and from sample checks by authorities on fleet management by RUs. Main drivers are the EC and the MS (monitors the evolution of retrofitting in terms of funds used, wagons retrofitted and efficient use of LN wagons).
4.2.3 Combined policy option C1 + D3: DEV Differentiated Track Access Charges + Noise Emission Ceiling + Voluntary Commitment
Differentiated access charges are currently applied in Switzerland and are about to be used in the Netherlands. In both countries they are combined with noise emission ceilings.
The two countries use two different approaches for checking that ceilings are not surpassed. Switzerland relies on 6 measuring stations located so as to cover the major lines in terms of traffic. A noise emission indicator is calculated for each station on a yearly basis and compared with a ceiling established at a fixed date, so as to limit future emission increases.
In the Netherlands, a ceiling is fixed for several control points. Emissions in these points are verified using sound propagation software. In Europe thousand of points would result and calculations would be carried out by different persons with different software.
In Switzerland noisy wagons are not identified. This is probably due to the relatively small dimension of the country itself and consequently of the rail companies. Therefore the reduction of noise is the result of a process based on trust. Such a process is not believed to be feasible at the European level.

26/129
In the Netherlands the wagons are traceable with identification tags. The information of on how to attribute a level of noisiness to each wagon is available via data base.
An emission ceiling needs to be enforced either via measurements or calculations of noise emissions. In this study ceilings are assumed to be verified through measurements (Swiss solution). The number of stations was estimated for each country on the basis of network length and complexity – as a cross-check the network maps of some countries were analysed. The possibility of calculating emission with sound propagation software (as in the Netherlands) was ruled out on account of the difficulty of unifying software or benchmarking different softwares at a European level (EU Rail Noise WG was of the same opinion). Emission may also be estimated as a function of the number of trains running and their composition in terms of LN wagons. This requires a perfect traceability of LN wagons. Two solutions are possible: 1. technological – LN wagons are equipped with transponders and ground stations detect number of
trains, speed and number of wagons; 2. operational – railway personnel records the LN wagons in each train (burdens the operators and
owners). An alternative to emission ceilings are operating restrictions limiting the daily/monthly/yearly amount of non-LN wagons that run on critical lines. The combination of these with DTAC was ruled out since a large part of the burden would lie with RUs, whilst funding would go to IMs. With emission ceilings, the consequent restrictions would derive from an agreement between IMs and RUs.
The DEV combined option considered in this study is thus characterised as follows:
Differentiated access charges are put in place by IMs: a bonus is granted to RUs for each “wagon path” run by a LN wagon, identified with markings and declared by the RU, verified by IM personnel. Automatic legislation, declaration or verification, are required. The entity of the bonus is such as to make retrofitting convenient with mileages that are feasible by the RU and is differentiated between countries after agreements between MS on the harmonisation of charges. Transfer of funds from RUs to POs is to be ensured by making the discounts granted to RUs “transparent” to POs so that the latter feel entitled to claim a discount to the former.
Emission ceilings are fixed at locations equipped with measurement stations (“noise traps”), on the basis of emissions measured before the date of ceiling-enforcement-start (end of retrofitting programme). Noisy wagons are identified with appropriate algorithms yet to be studied. Penalties are imposed by the IM on “noisy” RUs. Penalties are eventually transferred from RUs to POs.
Voluntary commitment by the RUs to transfer funds to POs through discounts on demand and not to increase charges after the noise bonus ceases.
The incentive mechanism consists of RUs retrofitting their own wagons and in turn incentivising POs due to the possibility to fund retrofitting through the decrease in the cost of access charges. Also the introduction of noise emission ceilings at a future date and the possibilities of consequent penalties imposed by the IM may play a role. The IM is incentivised to encourage retrofitting and to enforce ceilings due to the future benefit constituted by the long-term reduction of IRMs. Drivers are the EU and the MS. An important role is played by the IMs.

27/129
5 Analysis of Impacts In order to assess the economic, environmental and social impact of the rail noise abatement measures, the following analyses are proposed in the present chapter:
Identification of the main stakeholders affected, total countries considered and reasons for the elimination of specific countries;
cause-effect analysis (on the baseline scenario and on the DEV and SOV combined policy options): step-by-step approach with the aim to define a possible sequence of actions (activities deriving directly from decisions of stakeholders) and effects (consequences of actions) connected with the implementation of the policy option;
identification and qualitative description of the most relevant impacts resulting from each proposed measure (the impact has been considered on different stakeholder);
summary of the main assumptions considered within the economical, social and environmental analysis to define and evaluate each policy option impact;
quantitative description of the baseline scenario focusing on fleet composition, affected population and operative costs;
quantification of the impacts of policy options with the valuation of total added benefits and costs against the baseline scenario (as cost increase for the retrofitting programme, maintenance cost increase, administrative cost increase).
5.1 Identification of sectors, stakeholders and countries affected
The main actors and sectors which are likely to be affected by the implementation of the different policy options for rail noise abatement are considered in the table below.
Abbr. Stakeholder How affected
EU European Union - “Costs”: Legislation. Funding.
- “Benefits”: Represents beneficiaries.
MS Member State - “Costs”: Legislation. Funding.
- “Benefits”: Represents beneficiaries in terms of reduction of noise affected population and in terms of reduction of external cost for citizens.
IM Infrastructure Manager
- “Costs”: Central role in case of differentiated access charges and emission ceilings: installs necessary infrastructure, manages charging and penalties for noisy RUs. In all cases imposes restrictions to RUs.
- “Benefits”: Long-term reduction of infrastructure-related noise abatement measures (for instance noise barriers).
RU Railway Undertaking
- “Costs”: Retrofits own wagons. Manages the circulation of LN wagons and normal wagons.
- “Benefits”: Benefits from discounts on access charges and/or subsidies.

28/129
PO Private Wagon Owner
- “Costs”: Retrofits own wagons.
- “Benefits”: Transfer of discounts from RUs and/or subsidies.
FO Forwarder - “Costs”: Potential increases in transport service prices.
- “Benefits”: Potential decreases in transport service prices.
TSC Transport Service Customer
- “Costs”: Potential increases in transport service prices.
- “Benefits”: Potential decreases in transport service prices.
BM Brak Block Manufacturer
- “Costs”: extra costs due to increased production
- “Benefits”: increased turnover and revenues
The stakeholders belong to the following sectors:
Government Agencies;
Railway companies;
Logistic companies;
Society (customers). Of the EU-27 countries, only the 18 countries listed in the following table have been considered. In 2005 they accounted for 89.5% of the EU-27 fleet (100% of the standard gauge fleet) and 83.9% of the net t-km transported in the EU-27.
1 Austria 10 Hungary
2 Belgium 11 Italy
3 Bulgaria 12 Luxembourg
4 Czech Republic 13 Netherlands
5 Germany 14 Poland
6 Denmark 15 Romania
7 France 16 Sweden
8 United Kingdom 17 Slovenia
9 Greece 18 Slovak Republic
The countries excluded are listed in the following table.
Country Reason
Cyprus practically no track
Estonia practically no standard gauge track

29/129
Country Reason
Spain practically no standard gauge track for freight
Finland practically no standard gauge track
Ireland practically no standard gauge track
Lithuania practically no standard gauge track
Latvia practically no standard gauge track
Malta practically no track
Portugal practically no standard gauge track
Non-standard gauge countries are not considered since the wagons of their networks cannot run on the large European standard gauge network. Portugal and Spain have interoperable networks, as also the Baltic countries. The methodology applied in this report (which is focused on the “18-IA countries”) can easily be extended to these smaller networks, if the problems are to be addressed at the EC level. Non-EU countries are considered only qualitatively. It is not possible for them to be addressed directly by the EC. The countries sharing the EC network are mainly the Balkan countries (fleet of 4% of that of the 18-IA, 18 Impact Assessment countries), Switzerland (retrofitted by 2015), Norway (fleet of 0.4% of the 18-IA fleet). Effects will be considered in the time-frame 1st January 2009 – 1st January 2024. Not all costs and benefits are in fact quantifiable with confidence after the latter date.
5.2 Cause-effect analysis
5.2.1 Baseline cause-effect analysis The following tables illustrate step-by-step a possible sequence of actions (activities deriving directly from decisions of stakeholders) and effects (consequences of actions) connected with the continuation of current EU policy with no specific incentives for accelerating the retrofitting of older wagons.
Acronym Description
Action Act. Activities deriving directly from decisions of stakeholders
Effect Eff. Consequences of actions Time 0: 2008
Stakeholder Act/Eff. Description
EU Act Oversees END noise mapping and action plans.
MS Act Ensure that no later than 18 July 2008 the competent authorities have drawn up action plans designed to manage, within their territories, noise issues and effects, including noise reduction if necessary for major railways which have more than 60 000 train passages per year and agglomerations with more than 250 000 inhabitants. Such plans shall also aim to protect quiet areas against an increase in noise. Measures and criteria

30/129
Time 0: 2008
Stakeholder Act/Eff. Description for noise abatement are at the discretion of the competent authorities.
Work with national authorities on the action plans for 2013.
IM Eff Collaborate with national authorities to draw up action plans to address priorities (2013 deadline). Current IRMs continue to be implemented. Increased information to the public according to the END will have the effect of increasing pressure on IMs to take action in hot-spots.
RU Eff Collaborate with national authorities to draw up action plans to address priorities (2013 deadline).
PO Eff Eventually collaborate with national authorities to drawing up action plans to address priorities (2013 deadline).
Time 1: 2013
Stakeholder Act/Eff. Description
EU Act Oversees END action plans and updating noise maps.
MS Act According to the European Noise Directive Member States shall ensure that, no later than 18 July 2013, the competent authorities have drawn up action plans notably to address priorities which may be identified by the exceeding of any relevant limit value or by other criteria chosen by the Member States for the agglomerations and for the major roads as well as the major railways within their territories.
IM Eff In the countries in which abatement programmes for the existing infrastructure have not been initiated IMs would eventually start planning new measures for priority areas on the basis of the action plans. Other action may have already been taken to address urgent hot-spots.
RU Eff In countries which have indicated retrofitting in their action plans, retrofitting is budgeted by RUs. Retrofitting may start at a negligible rate compared with that possible if public funds are granted.
PO Eff In countries which have indicated retrofitting in their action plans, retrofitting is budgeted by RUs. Retrofitting may start at a negligible rate compared with that possible if public funds are granted.
BM Eff Business As Usual Time 2: 2016
Stakeholder Act/Eff. Description
EU Eff Noise reduction benefits from IRMs deriving from protection of hot-spots with IRMs are recorded. These are the major benefits. Retrofitting benefits are still low.
MS Eff Noise reduction benefits from IRMs deriving from protection of hot-spots with IRMs are recorded. These are the major benefits. Retrofitting benefits are still low.
IM Eff Implementation of action plans fully under way. Major hot-spots protected.
RU Eff Retrofitting at a low rate (not in all countries).
PO Eff Retrofitting at a low rate (not in all countries).
BM Eff Eventual small production increase to cover retrofitting.

31/129
5.2.2 DEV Cause-effect analysis The following tables illustrate step-by-step a possible sequence of actions (activities deriving directly from decisions of stakeholders) and effects (consequences of actions) connected with the implementation of the DEV option.
Acronym Decryption
Action Act. Activities deriving directly from decisions of stakeholders
Effect Eff. Consequences of actions Time 0: noise emission ceiling legislation + voluntary commitment between MS and IMs + voluntary commitment between MS and RUs – 2008
Stakeholder Act/Eff. Description
EU Act Legislation on application of differentiated track access charges and noise emission ceilings throughout Europe. Study on the harmonisation of track access charges.
MS Act Legislation on Noise Emission Ceilings is created, prohibiting the emission of noise exceeding 2016 limits on protected nodes/corridors/lines starting from 2017. Support to the EU for the harmonisation of track access charges.
MS Act Discounts accorded by the IM to RU and additional management costs for the IM will be compensated by the MS. The compensation will have the necessary duration to to allow RUs and POs to procure LN trains by retrofitting old wagons and buying new wagons.
IM Act Commit voluntarily to apply differentiated access charges on the condition of full compensation of discounts granted and additional management costs.
RU Act Commit voluntarily to transfer part of the access charge discount to POs of LN wagons and keep the part that covers their additional maintenance costs.
Time 1: setting up organisation and necessary infrastructure to be able to start differentiated charges and emission ceilings
Stakeholder Act/Eff. Description
EU Act Monitoring progress.
MS Act Monitoring progress.
IM Act Modifies regulations. Sets up system for identifying noisy wagons. Sets up noise traps. Identifies/hires personnel for new structures. (Incentivation derives also from future reduction of IRMs).
RU Act Monitors current fleet performance in order to understand current and possible mileage. CBA (Cost Benefit Analysis) – decides how many wagons to retrofit. Upgrades fleet management.
PO Act CBA – decides whether or not to retrofit.
BM Act Adapt or plan adaptation of manufacturing capacity according to forecasts of number of wagons to be retrofitted.

32/129
Time 2: start of differentiated charges – 1st January 2012
Stakeholder Act/Eff Description
EU Act Start of monitoring key performance indicators.
MS Act Start of monitoring key performance indicators.
IM Act Begin application of differentiated charges. Bears the initial management costs of the operation.
RU Act Begin retrofitting their wagons on the basis of the discount granted by IMs. Cautious companies may retrofit with an initially low rate until they understand whether the funding is sufficient. Fleet compositions are modified with new and retrofitted wagons. Fleets are managed so as to favour high mileages for LN wagons on the basis of economic considerations. Increases of the w-km of LN wagons respect to that of normal wagons are planned.
PO Act Begin retrofitting their wagons at a chosen rate. Cautious companies may retrofit with an initially low rate until they understand whether the funding is sufficient. Fleet compositions are modified with new and retrofitted wagons. Fleets are managed so as to favour high mileages for LN wagons on the basis of economic considerations. Increases of the use of LN wagons respect to that of normal wagons are planned.
BM Eff Revenues start arising from sales of LN blocks. Time 3: retrofitting fully under way – 1st January 2013
Stakeholder Act/Eff Description
EU Eff Benefits in terms of noise reduction are recorded due to the increase of w-km of LN wagons and to the passage of these in areas with population affected by noise.
MS Eff Costs derive from compensation to IMs. Benefits in terms of noise reduction are recorded.
IM Eff Costs for granting discounts are recorded. Compensation is received from MS at the end of each financial year.
RU Act Fleets are managed so as to favour high mileages for LN wagons. Variations in maintenance costs are incurred. Dismissal of older wagons equipped with LN technology starts. For some: end of retrofitting.
PO Eff Benefits from discounts. Variations in maintenance costs are incurred. For some: end of retrofitting.
FO Eff Eventual small increase of demand if funding is such as to allow price decreases.
TSC Eff Eventual small increase of demand if funding is such as to allow price decreases.
BM Eff Revenues due to sales of LN blocks. Time 4: Noise Emission Ceilings in force – 1st January 2017
Stakeholder Act/Eff Description
EU Eff Benefits in terms of noise reduction are recorded.
MS Eff Costs for compensation cease. Benefits in terms of noise reduction are recorded.
IM Act Ceases bonus on access charges. Interacts with RUs to counteract causes for increase in noise emission (identifies noisy wagons and imposes eventual penalties).
RU Act Benefit deriving from bonus ceases. For all: end of retrofitting.

33/129
Time 4: Noise Emission Ceilings in force – 1st January 2017
Stakeholder Act/Eff Description
PO Eff Possibility to claim discounts from RUs ceases. For all: end of retrofitting.
BM Eff Revenues due to sales of LN blocks decrease abruptly.
5.2.3 SOV Cause-effect analysis The following tables illustrate step-by-step a possible sequence of actions (activities deriving directly from decisions of stakeholders) and effects (consequences of actions) connected with the implementation of the SOV option.
Acronym Decryption
Action Act. Activities deriving directly from decisions of stakeholders
Effect Eff. Consequences of actions Time 0: legislation on subsidies and operating restrictions + voluntary commitment of IMs, RUs, POs – 2008
Stakeholder Act/Eff Description
EU Act Legislation on operating restrictions for noisy wagons starting from 2013. Definition of mechanism for allocation of retrofitting fund (EU funds + MS funds + funds from less sustainable transport modes), time-frame (end date for subsidies), eligibility conditions..
MS Act Legislation on operating restrictions for noisy wagons starting from 2013. Allocation of funds for 2009. Create legal basis for funding, notification to the Commission.
IM Act Voluntary commitment to enforce operating restrictions – future benefit derives from reduction of IRM costs.
RU Act Voluntary commitment to monitor efficiency of LN wagon management.
PO Act Voluntary commitment to monitor efficiency of LN wagon management. Time 1: setting up organisation
Stakeholder Act/Eff Description
EU Act Decide on notification on state aids. Monitors progress.
MS Act Monitors
IM Act Modifies regulations for enforcing operating restrictions.
RU Act Sets up organisation to monitor efficiency of LN wagon management.
PO Act Sets up organisation to monitor efficiency of LN wagon management. .
BM Act Adapt or plan adaptation of manufacturing capacity according to forecasts of number of wagons to be retrofitted.

34/129
Time 2: start of subsidies – 1st January 2010
Stakeholder Act/Eff Description
EU Act Start of monitoring key performance indicators.
MS Act Start of monitoring key performance indicators.
RU Act Begin retrofitting their wagons on the basis of the entity of the subsidies. Fleet compositions are modified with new and retrofitted wagons. Fleets are managed so as to favour high mileages for LN wagons on the basis of voluntary commitment.
PO Act Begin retrofitting their wagons on the basis of the entity of the subsidies. Fleet compositions are modified with new and retrofitted wagons. Fleets are managed so as to favour high mileages for LN wagons on the basis of voluntary commitment.
BM Eff Revenues start arising from sales of LN blocks.
BM Eff Revenues due to sales of LN blocks. Time 3: retrofitting fully under way
Stakeholder Act/Eff Description
EU Eff Benefits in terms of noise reduction are recorded due to the increase of w-km of LN wagons and to the passage of these in areas with population affected by noise.
MS Eff Benefits in terms of noise reduction are recorded.
RU Act Fleets are managed so as to favour high mileages for LN wagons. Dismissal of older wagons equipped with LN technology starts. For some: end of retrofitting.
PO Eff For some: end of retrofitting.
FO Eff Eventual small increase of demand if funding is such as to allow price decreases.
TSC Eff Eventual small increase of demand if funding is such as to allow price decreases. Time 4: Operating Restrictions in force – 1st January 2013
Stakeholder Act/Eff Description
EU Eff Benefits in terms of noise reduction are recorded.
MS Eff Benefits in terms of noise reduction are recorded.
IM Act Enforce operating restrictions.
RU Eff Manages fleet so as to avoid sending non-LN wagons where operating restrictions are in force.
PO Eff Manages fleet so as to avoid sending non-LN wagons where operating restrictions are in force.
BM Eff Revenues due to sales of LN blocks decrease abruptly.
5.3 Identification of the most relevant impacts

35/129
A set of impacts has been identified as possible effects of the proposed policy options.
The list of possible impacts has been developed in order to identify economic, environmental and social impacts of the proposed policy options, in particular:
Economic impacts: cost increase for the retrofitting programme, maintenance cost increase for different wear rate of brake and wheel, administrative cost increase for different stakeholders, potential modal shift for decrease of competitiveness of the rail sector, infrastructure cost for the implementation of monitoring system (monitoring stations).
Social impacts: impact on final price for the access to freight transportation service (freight service price could have an indirect effect on price to final users), creation of new jobs.
Environmental impacts: the modal shift could cause a high increase in road transport externalities; reduction of sound pressure level to which affected population is exposed (reduction of affected population).
The screening of the identified impacts according to with the guidelines suggested by the EU is presented in the following table.
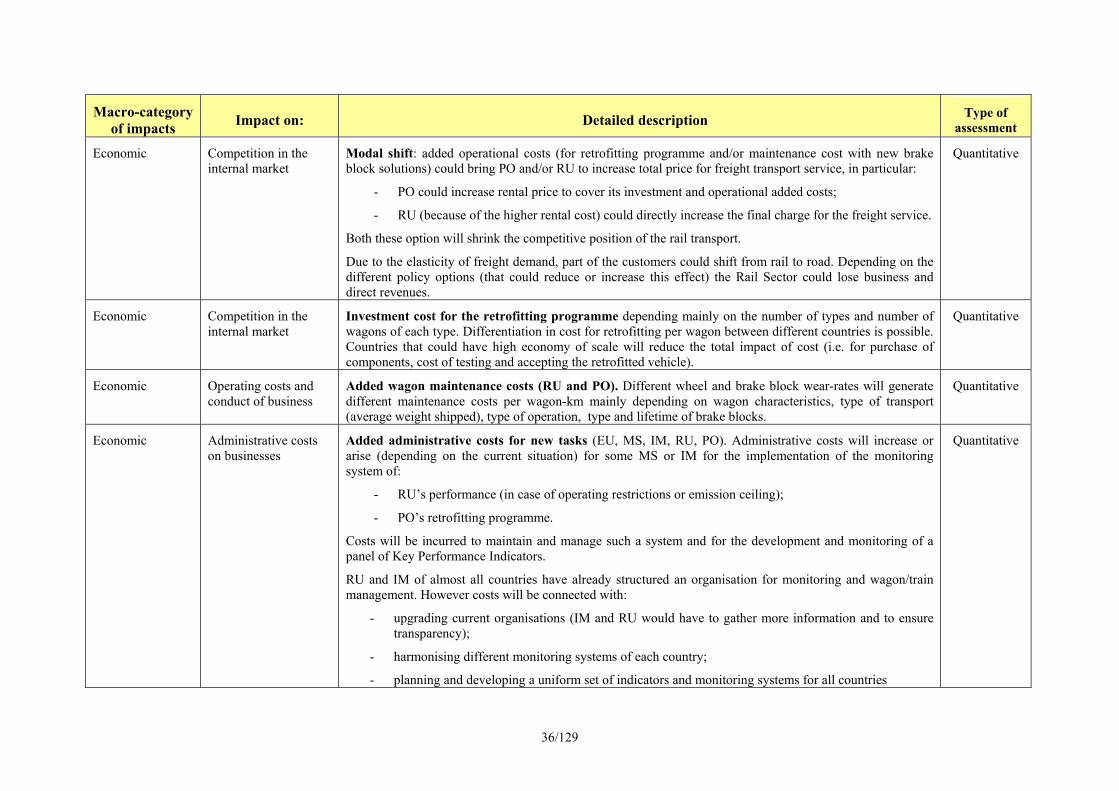
36/129
Macro-category of impacts Impact on: Detailed description Type of
assessment
Economic Competition in the internal market
Modal shift: added operational costs (for retrofitting programme and/or maintenance cost with new brake block solutions) could bring PO and/or RU to increase total price for freight transport service, in particular:
- PO could increase rental price to cover its investment and operational added costs;
- RU (because of the higher rental cost) could directly increase the final charge for the freight service.
Both these option will shrink the competitive position of the rail transport.
Due to the elasticity of freight demand, part of the customers could shift from rail to road. Depending on the different policy options (that could reduce or increase this effect) the Rail Sector could lose business and direct revenues.
Quantitative
Economic Competition in the internal market
Investment cost for the retrofitting programme depending mainly on the number of types and number of wagons of each type. Differentiation in cost for retrofitting per wagon between different countries is possible. Countries that could have high economy of scale will reduce the total impact of cost (i.e. for purchase of components, cost of testing and accepting the retrofitted vehicle).
Quantitative
Economic Operating costs and conduct of business
Added wagon maintenance costs (RU and PO). Different wheel and brake block wear-rates will generate different maintenance costs per wagon-km mainly depending on wagon characteristics, type of transport (average weight shipped), type of operation, type and lifetime of brake blocks.
Quantitative
Economic Administrative costs on businesses
Added administrative costs for new tasks (EU, MS, IM, RU, PO). Administrative costs will increase or arise (depending on the current situation) for some MS or IM for the implementation of the monitoring system of:
- RU’s performance (in case of operating restrictions or emission ceiling);
- PO’s retrofitting programme.
Costs will be incurred to maintain and manage such a system and for the development and monitoring of a panel of Key Performance Indicators.
RU and IM of almost all countries have already structured an organisation for monitoring and wagon/train management. However costs will be connected with:
- upgrading current organisations (IM and RU would have to gather more information and to ensure transparency);
- harmonising different monitoring systems of each country;
- planning and developing a uniform set of indicators and monitoring systems for all countries
Quantitative

37/129
Macro-category of impacts Impact on: Detailed description Type of
assessment
Economic Administrative costs on businesses
Added infrastructure costs for noise monitoring systems (IM). Quantitative
Economic Public authorities Funding for the retrofitting programme. Quantitative
Economic Operating costs and conduct of business
Infrastructure cost decrease (IM). An increase in wagon-km run by Low-Noise wagons will reduce rail noise and so could allow the reduction of infrastructure investment for noise reduction (for instance for noise barriers).
Within the analysis this impact has not been considered because:
- indirect impact: investment structure is “rigid” and there are difficulties to shift budget from IM to RU or PO;
- very high delay of the impact: there are many long period programmes that cannot be rescheduled or reorganised in the mid term.
Qualitative
Economic Third countries and international relations
Influence of restrictions for noisy wagons on non-EU countries. The degree of restriction has the potential to affect cross-border trade with non-EU countries.
Qualitative
Social Consumer Household Cost increase for different stakeholders (PO, RU) could have a direct impact on the final price for the access to freight transportation service in case all or part of the retrofitting programme would be charged without incentives from MS. Freight service price could have a indirect effect on price to final users
Qualitative
Worker Reduction of weight handled by wagon maintenance workers due to lighter blocks. Qualitative Social
Social Increased transparency due to publication of data on noise exposure trends. Qualitative
Environmental Effectiveness Stimulation of increased efficiency in the use of silent wagons (average mileage and load factor). Qualitative
Environmental The likelihood or scale of environmental risks
The options affect the likelihood of fire breaking out due to sparks from the block-tyre interface. Composite brake blocks reduce the risk.
Qualitative
Environmental Mobility (transport modes) and the use of energy
Influence on the modal split between rail and road (environmental effects). Added retrofitting costs lead to an increase in freight transport service prices, thus to a potential shift from rail to road. The modal shift could cause a high increase in road transport externalities. This increase is much higher than the reduction of externalities expected as a result of the decrease of rail traffic.
Quantitative

38/129
Macro-category of impacts Impact on: Detailed description Type of
assessment
Social Affected population Benefits in terms of noise reduction, population affected by freight rail noise and consequent health effects: reduction of sound pressure levels to which affected population is exposed (reduction of affected population by railway noise over 55 dB).
Quantitative
Environmental Noise reduction Reduction of sound pressure levels. These positive effects derive from the increase of the fraction of low-noise wagons respect to the total fleet and from the mileage run by these wagons (on noise-sensitive railway lines). Both the fraction of low-noise wagons and mileage are directly connected with the policy options.
Quantitative

39/129
5.4 Results of the impact assessment
5.4.1 Main assumptions 1. Within the analysis two different scenarios have been considered:
"Retrofitting with K-blocks": the retrofitting programme on freight wagons considers the replacement of brake systems so as to allow the use of K-blocks;
"Retrofitting with K and LL-blocks" the retrofitting programme on freight wagons starts with the replacement of brake systems to allow the use of K-blocks, then switches to simple replacement of cast iron blocks with LL-blocks on 1/1/2011”. This scenario reflects the present uncertainty on when homologation of LL-blocks will take place. It is considered important not to exclude LL-blocks from the analysis due to their potentially significant effect both on costs (no modifications to the brake systems) and benefits (faster creation of the silent fleet).
2. Timeframe for the quantitative assessment will be 2009 – 2024. The effects of the different policy options will be evaluated until 2030. The degree of uncertainty of the monetary values of costs and, most of all, benefits at later dates was reckoned to be too significant for a robust analysis.
3. Two wagon limit birthdates have been considered: 1979 and 1984. These two values, fixed for simplicity so as not to have to consider them as variables in the analysis, have been chosen on the basis of the current age distribution of wagons. A significant number of wagons was procured in the five year period, thus choosing to retrofit wagons built after 1984 would lead to considerable savings in retrofitting costs.
4. Wagon lifetime has been assumed to equal bogie lifetime (frame, major suspension elements). This assumption derives from the lack of precise information on how many bogies live longer than their carbodies and are reused and, viceversa, how many carbodies are mounted after a certain number of years on different bogies.
5. Wagons equipped with LN blocks (K and LL) have a noise emission reduction of 8 dB. This is an assumption subjected to sensitivity analysis on account of the variability which can derive from the use of LN blocks on different types of wagons and, most of all, running on tracks of different geometrical quality.
6. The reduction in sound pressure level (dB) perceived is assumed to equal the reduction in SPL emitted. The propagation of the sound generated from a moving source such as train is a complex phenomenon which requires precise modeling of the characteristics of the surroundings of the source. Moreover these characteristics are extremely variable from place to place. This assumption is made so as to simplify the analysis, considering also that the benefits of sound reduction are presently impossible to quantify accurately on account of the degree of uncertainty on the affected population. It is reasonable to assume that this assumption leads to an overestimation of benefits.
7. A multiplying factor of the theoretical sound level reduction can be used to take into account the different possible strategies for forming trains (no strategy at all – OR – all-or-nothing – OR – at least xx% etc.) and for deciding their mileage; with this factor set to one the following assumptions apply:
LN wagons are assumed to be uniformly distributed in the fleet (and in the trains)
LN wagons are assumed to cover the same number of wagon-km as normal wagons
8. Assumptions on rail noise affected population data:

40/129
Reduction of affected population is calculated on the basis of population exposed to the different dB ranges in the countries for which data is available (11 out of the 18 IA countries).
Missing data are guessed assuming the average of the percentage of population affected in the 11 countries is applicable to the remaining countries.
Calculation of the reduction of affected population as a function of time on the basis of the reduced emissions is thus calculated:
- i) the population is further subdivided into 1 dB ranges;
- ii) the number of persons descending under a perceived level of 55 dB is considered not to be affected any longer by rail noise.
A multiplying factor takes into account the fraction of population affected by freight rail noise – persons affected mostly by passenger trains will not receive any benefit.
5.4.2 Quantitative description of the baseline scenario Fleet The following chart illustrates the predicted evolution of the fleet in the 18-IA countries.
Figure 5-1: predicted evolution of the fleet in the 18-IA countries for the baseline scenario
0
100.000
200.000
300.000
400.000
500.000
600.000
700.000
800.000
2009 2011 2013 2015 2017 2019 2021 2023 2025 2027 2029 2031
total fleet - w<1979total fleet - w<1984Low Noise"retrofitted"total fleetend of time frame
FLEET
Source: PwC elaboration (2007) on UIC statistics
The total fleet was calculated in the following manner:
the fleet at the beginning of 2009 in the 18 Impact Assessment countries (18-IA) was estimated by extrapolating UIC statistics for the years 2000 and 2005;
the average yearly rate at which the fleet decreases (replacement rate, approx. -5,000 wagons/year) was estimated as the difference between an estimated average procurement rate (+20,000 wagons/year) and an estimated average out-of-service-rate (approx. -25,000 wagons/year); the latter is calculated for the period 2005-2024 and derives from the current age distribution (available for UIC wagons for 11 out of 18 countries and extended to all 18 countries; a flat age distribution was assumed for privately owned wagons; see Figure 5-2) assuming an average wagon lifetime for the future of 35 years; the former is the rate which is

41/129
necessary to avoid unrealistic increases in the efficiency in terms of yearly wagon-km/wagon (the resulting efficiency increase is +12% in 2021 if total t-km transported remain constant, +28% if t-km grow according to the most likely partial implementation – scenario B – of White Book measures for the growth of rail freight transport).
Figure 5-2: age distribution assumed for the fleet
0
50.000
100.000
150.000
200.000
250.000
<1970 1970-1979 1980-1989 1990-1999 >2000year of manufacture
tota
l num
ber o
f wag
ons
(UIC
+ P
O)
total number of wagons (2005): ca. 623,000
Source: UIC
Noise reduction benefits Noise reduction benefits are considered entirely derived from the circulation on the network of LN wagons. The other measures for noise abatement are considered to be the same in all scenarios (baseline, SOV and DEV). In reality it is expected that in the long run SOV and DEV will lead to a reduction in IRMs since some areas will exist in which noise reception limits are not surpassed any longer. This reduction may slightly affect benefits since IRMs act not only on freight wagon rolling noise, as retrofitting does. This effect has been neglected. For the purpose of the Impact Assessment the benefits associated with the baseline scenario have been obviously considered zero, since the benefits considered for the other policy options are the additional benefits respect to the baseline. In order to give an idea of the entity of noise reduction and affected population occurring even in the case of no EU action, the following two charts (Figure 5-3 and Figure 5-4) illustrate the difference between the baseline scenario and a hypothetical scenario in which no LN wagons at all are put into service. Both charts show two curves:
the reduction of noise emitted by trains taking into account the w-km run by LN wagons respect to the total (noise reduction is -8 dB when 100% of w-km are run by LN wagons);
the reduction of affected population.

42/129
Figure 5-3: reduction of emitted noise and affected population in the baseline scenario – population calculated on the basis of data from Entec UK Ltd report for DG-ENV (2006)
0
1
2
3
4
5
6
7
8
9
10
2009 2011 2013 2015 2017 2019 2021 2023 2025 2027 2029 2031
dB
0
1
2
3
4
5
6
7
8
9
10
Mpe
rson
s
emitted sound level reduction [dB]
Reduction of Affected population >55dB [Mpers]
REDUCTION OF NOISEAND AFFECTED POPULATION
Source: PwC elaboration (2007)
Figure 5-4: reduction of emitted noise and affected population in the baseline scenario – population according to INFRAS-IWW report (2004)
0
1
2
3
4
5
6
7
8
9
10
2009 2011 2013 2015 2017 2019 2021 2023 2025 2027 2029 2031
dB
0
2
4
6
8
10
12
14
16
18
20
Mpe
rson
s
emitted sound level reduction [dB]
Reduction of Affected population >55dB[Mpers]
REDUCTION OF NOISEAND AFFECTED POPULATION
Source: PwC elaboration (2007)
The difference between the charts lies in the population estimates. Figure 5-3 takes the values from calculations on density of rail-noise-affected population reported in a document for DG-ENV by Entec UK Ltd. and Figure 5-4 takes the values directly from the INFRAS-IWW report. An estimate of the population affected by railway noise is subject to high uncertainty margins and will continue to be at least until the results of the application of the European Noise Directive are completely available. In fact the superposition of the noise maps required by the directive with a population density map appears to be the most suitable method for a top-down estimate of the population affected by railway noise. Since the maps are not yet available, the UIC study developed by INFRAS and IWW on external costs has been used because it is the only European study which contains an estimated value for the population affected by railway noise per country and per sound level range. The comparison between values leaves some doubts on the robustness of the data. For example the fact that in Germany the population subjected to maximum sound levels between 55 and 60 dB amounts to 8.5 million while in France this figure is 220,000 is worth examining. For this reason, a second affected population was estimated.

43/129
On the basis on the EC study “Development of a methodology to assess population exposed to high levels of noise and air pollution close to major transport infrastructure” (Entec UK Limited - April 2006), the population per country living within the limits of 250 metres from major railway lines was estimated. Imposing a sound level of 55 dB at this distance, an average curve of sound propagation from noise source to 250 metres has been assumed. Thus it was possible to obtain a distribution of population affected by railway noise per country and per dB. The EC study is developed on almost 45% of the European network, so the results are projected on all the network. Examining the two charts leads to the following considerations:
different methods for estimating population can lead to very different results – these calculations are thus used only for orders of magnitude to be used for qualitative considerations;
noise emission reduction is less than linear in time – this is due to the nature of noise: 1 wagon on a 20 wagon train has practically no effect, when half the train is composed of LN wagons it emits on average 2.4 dB less than a non-LN train.
benefits due to only new LN wagons come at a slow rate. Costs and economic values For the purpose of the Impact Assessment the costs associated with the baseline scenario are considered zero (total costs have been set to zero). To evaluate the economic impact of different scenarios and to assess the policy options, the added cost of each impact has been calculated (respect to the zero level). However, an order of magnitude of the current total maintenance costs, total costs and revenues incurred by RUs in the 18-IA countries is useful. An estimate is as follows:
an average total cost for RUs of 15,37 € per tr-km7 (maintenance, train staff, energy, infrastructure charges);
average maintenance cost: 1,83 € per tr-km;
an annual cost for RUs of about 15 billion € (tr-km has been estimated by extrapolating UIC statistics for the years 2000 and 2005);
an annual maintenance cost for RU of about 1,8 billion € (tr-km has been estimated by extrapolating UIC statistics for the years 2000 and 2005);
an annual average revenue for RU of 23 € per tr-km, estimated for each country according to UIC statistics8 (tr-km has been estimated by extrapolating UIC statistics for the years 2000 and 2005);
7 PwC evaluation based on analysis of freight international traffic over the corridor Genoa/Milan and Rotterdam/Antwerp (single wagon train, combined transport train and block train) 8 cfr. UIC statistics (41.6; 72.16)

44/129
5.4.3 Quantification of the impacts of the policy options
A) Impact of the policy options on the retrofitting programme The different financial options can act as incentives for retrofitting and thus have a significant effect on the rate of creation of the “silent fleet”. The selected range in terms of duration of the retrofitting programme with the K-block solution is 6-12 years; there is no point considering periods of less than six years (the nominal interval for periodic maintenance) since there would be costs for the unavailability of wagons and a potential saturation of workshop capacity. Since the retrofitting programme with LL-blocks is less expensive in terms of cost and time, the selected range in terms of duration is 3-6 years. There is no point considering periods exceeding twelve years since most of the fleet would be made up of new = Low-Noise wagons after this time. Two main factors connected with the implementation of the policies have an impact in terms of the effect of the rate of creation of the silent fleet:
the total amount of funding for the rail sector: since the funds cover retrofitting and other added costs up to a certain percentage, greater than 100% if modal shift is to be avoided, higher amounts will generally lead to higher retrofitting rates;
the degree to which the funding is targeted: direct funding to the wagon owners (RU and PO) leads to a relatively low dispersion of the financial burden for Member States and the EU; on the other hand, indirect funding (e.g. via IM) could lead to a higher financial burden for MS and EU since a portion for the funds would be retained by the intermediate parties in order to cover their extra administrative costs.
Old wagons may be excluded from the retrofitting programme due to their low residual life and consequent impact on noise abatement. Since the actual age at which wagons are put of of service is highly variable, rather than establishing a limit residual lifetime, two limit “birthdates” (year of putting into service) have been considered:
exclusion from the programme of all wagons built before 1979;
exclusion from the programme of all wagons built before 1984.
The policy options considered have been differentiated according to specific characteristics and parameters in particular the ones listed here.
1. Starting date: year in which the retrofitting programme will start. Both the SOV and DEV options necessitate a relatively long lead-in time. This leads to the consideration of a zero retrofitting rate for the first few years of the time frame.
2. Retrofitting time frame: period between the first and the last retrofitted wagon.
3. Annual retrofitting rate: average number of wagons retrofitted per year.

45/129
4. Time for 100% silent wagons (years): total number of years required to reach a fleet composed totally of retrofitted wagons and new wagons (equipped with K or LL brake blocks).
5. Wagons to be retrofitted: total number of wagons that have to be retrofitted within the period
considered.
6. Mileage of the wagons retrofitted: LN wagons are assumed to run average mileages which are greater than that of non-LN wagons; the multiplying factor “k” used varies according to the policy option.
The following table summarises the results for the values of timing, retrofitting rate, and total wagons to be retrofitted according to the assumptions listed above.
Scenario Starting date for retrofitting
Retrofitting time frame
Average yearly retrofitting
rate
% of silent wagons in
2017
Time for100% of silent
wagons (end year)
Wagons to be retrofitted
Baseline - - 0 38% 21 years (2030) 0 wagons
SOV (1979) 1-2010 7 years 45.700 w/y 100% 7 years (12-2016)
320.000 wagons
SOV (1984) 1-2010 7 years 27.400 w/y 75% 12 years (12-2021)
191.000 wagons
DEV (1979) 1-2012 7 years 38.600 w/y 73% 7 years (12-2018)
270.000 wagons K
SC
EN
AR
IO
DEV (1984) 1-2012 7 years 27.100 w/y 64% 10 years (12-2021)
190.000 wagons
SOV (1979) 1-2010 4 years 99.500 w/y9 100% 12 years (12-2013)
397.400 wagons
SOV (1984) 1-2010 4 years 50.000 w/y 75% 12 years (12-2021)
191.000 wagons
DEV (1979) 1-2012 3 years 124.000 w/y 100% 3 years (12-2014)
372.000 wagons
K+L
L S
CE
NA
RIO
DEV (1984) 1-2012 3 years 64.000 w/y 75% 10 years (12- 2021)
191.000 wagons
Source: PwC elaboration (2007) Retrofitting rates for K-blocks of 50,000 wagons per year are still considered to be within the capacity of workshops. In fact, since roughly 560,000 wagons need to be inspected in 6 years, workshops are currently capable of handling over 90,000 wagons per year. For various reasons, a wagon will however remain in the workshop for a time which is much longer than that necessary for the inspection and eventual intervention. This time was reckoned sufficient for retrofitting and thus possibly used in the case of substantial funding. Retrofitting with LL-blocks can be carried out at much higher rates since it simply requires brake block replacement which can be done outside the workshop. The following graphs show the evolution of the total fleet and of its composition in terms of retrofitted wagons, Low-Noise wagons (new + retrofitted) and non-retrofittable wagons as a function of time.
9 Average retrofitting rate of 50,000 w/y for the first year (K-blocks) and 116,000 w/y for the remaining years (LL-blocks).

46/129
An interesting consideration regards the choice of the limit birthdate. It can be seen that choosing a the year 1984 leads to a significant limitation of wagons to retrofit. This affects the entity of benefits in a crucial period, that of retrofitting.
Figure 5-5: Scenario K - SOV (1979)
0
100,000
200,000
300,000
400,000
500,000
600,000
700,000
800,000
2009 2011 2013 2015 2017 2019 2021 2023 2025 2027 2029 2031
total fleet - w<1979total fleet - w<1984Low Noise"retrofitted"total fleetend of time frame
FLEET
Source: PwC elaboration (2007)
Figure 5-6: Scenario K - SOV (1984)
0
100,000
200,000
300,000
400,000
500,000
600,000
700,000
800,000
2009 2011 2013 2015 2017 2019 2021 2023 2025 2027 2029 2031
total fleet - w<1979total fleet - w<1984Low Noise"retrofitted"total fleetend of time frame
FLEET
Figure 5-7: Scenario K DEV (1979)
0
100,000
200,000
300,000
400,000
500,000
600,000
700,000
800,000
2009 2011 2013 2015 2017 2019 2021 2023 2025 2027 2029 2031
total fleet - w<1979total fleet - w<1984Low Noise"retrofitted"total fleetend of time frame
FLEET
Source: PwC elaboration (2007)

47/129
Figure 5-8: Scenario K DEV (1984)
0
100,000
200,000
300,000
400,000
500,000
600,000
700,000
800,000
2009 2011 2013 2015 2017 2019 2021 2023 2025 2027 2029 2031
total fleet - w<1979total fleet - w<1984Low Noise"retrofitted"total fleetend of time frame
FLEET
Source: PwC elaboration (2007)
Figure 5-9: Scenario K + LL - SOV (1979)
0
100,000
200,000
300,000
400,000
500,000
600,000
700,000
800,000
2009 2011 2013 2015 2017 2019 2021 2023 2025 2027 2029 2031
total fleet - w<1979total fleet - w<1984Low Noise"retrofitted"total fleetend of time frame
FLEET
Source: PwC elaboration (2007)
Figure 5-10: Scenario K + LL - SOV (1984)
0
100,000
200,000
300,000
400,000
500,000
600,000
700,000
800,000
2009 2011 2013 2015 2017 2019 2021 2023 2025 2027 2029 2031
total fleet - w<1979total fleet - w<1984Low Noise"retrofitted"total fleetend of time frame
FLEET
Source: PwC elaboration (2007)

48/129
Figure 5-11: Scenario K + LL DEV (1979)
0
100,000
200,000
300,000
400,000
500,000
600,000
700,000
800,000
2009 2011 2013 2015 2017 2019 2021 2023 2025 2027 2029 2031
total fleet - w<1979total fleet - w<1984Low Noise"retrofitted"total fleetend of time frame
FLEET
Source: PwC elaboration (2007)
Figure 5-12: Scenario K + LL DEV (1984)
0
100,000
200,000
300,000
400,000
500,000
600,000
700,000
800,000
2009 2011 2013 2015 2017 2019 2021 2023 2025 2027 2029 2031
total fleet - w<1979total fleet - w<1984Low Noise"retrofitted"total fleetend of time frame
FLEET
Source: PwC elaboration (2007)
Whilst for the purpose of Impact Assessment calculations two limit birthdates were considered, it could be useful to choose the limit birthdate such as to avoid limiting benefits but at the same time avoiding to retrofit older wagons more than necessary. The following table shows the limit birthdates that can be derived by looking at the above graphs, of course with the degree of approximation of one year. Ideally, the choice would have to be based on the knowledge of the age at which the group of wagons identified will exit the fleet. This is not possible with the current knowledge on wagon age distribution.
Table 5-1: possible choice of a limit birthdate for wagons to be retrofitted on the basis of the criteria of avoiding to affect noise reduction benefits by not retrofitting wagons capable of running during the retrofitting period

49/129
Scenario
Limit birthdate which does not affect
benefits
SOV 1981
K
SCE
NA
RIO
DEV 1982
SOV 1979 K
+LL
SC
EN
AR
IO
DEV 1980
The following charts illustrate the predicted evolution of the wagon-km run by LN wagons in the 18-IA countries. Figures for the chart are calculated assuming that LN wagons are managed so as to run a yearly mileage k times that of non-LN wagons. The factor k may be greater than 1 if practical results are obtained from voluntary commitment, for the case of the SOV option, and greater mileage efficiency so as to earn higher bonus money, for the case of the DEV option. These assumptions represent the incentive to use silent wagons more than others to get early payback investment. A value of 2 for this factor is considered to be quite high on account on the fact that average mileage is highly influenced by commercial issues (e.g. availability of loads, type of loads, origins and destinations) which have nothing to do with noise abatement policies. Practical values are expected not to exceed 1.5; thus this value was assumed for the DEV option, while a value of 1.0 was assumed for the SOV option. The k factor is considered constant over the time frame. This means that in the early stages the average mileage of non-LN wagons will be practically the same as the average mileage of the whole fleet and the LN wagons will run above-average mileages. Towards the end of the time-frame, the average mileage of LN wagons will be practically the same as the average mileage of the whole fleet and the non-LN wagons will run mileages lower than average.
Figure 5-13: wagon-km run by LN wagons compared with the total – K-block scenario
0
5
10
15
20
25
30
2008 2009 2010 2011 2012 2013 2014 2015 2016 2017 2018 2019 2020 2021 2022 2023 2024 2025
year
ly b
illio
n w
agon
-km
LN SOV79
LN SOV84
LN DEV79
LN DEV84
total
wagon-km growth: White Book Partial B scenarioretrofitting with K-blocks
Source: PwC elaboration (2007)

50/129
Figure 5-14: wagon-km run by LN wagons compared with the total – LL-block scenario
0
5
10
15
20
25
30
2009 2010 2011 2012 2013 2014 2015 2016 2017 2018 2019 2020 2021 2022 2023 2024 2025 2026
year
ly b
illio
n w
agon
-km
LN SOV79
LN SOV84
LN DEV79
LN DEV84
total
wagon-km growth: White Book Partial B scenarioretrofitting with LL-blocks
Source: PwC elaboration (2007)
B) Benefits in terms of noise reduction, population affected by freight rail noise and consequent health effects
The benefits deriving from a retrofitting programme consist in a general reduction of the rolling noise emitted by freight trains. This would lead to a reduction of the levels of exposure of the population to rail noise entailing a reduction of health effects, including annoyance and sleep disturbance which according to recent guidelines have long-term effects on health. Recent and current projects show that these can be quite significant. For example, the World Health Organisation (WHO) is currently coordinating the EBD (Environmental Burden of Disease) Noise Project aiming to provide guidelines for the estimation of the disease burden generated by environmental noise, in particular to measure the effects of noise in terms of DALYs (Disability-Adjusted Life Years). The final results of this project will be published at the end of 2007. The health effects investigated in the project are:
Cardiovascular disease;
Sleep disturbance;
Annoyance;
Tinnitus;
Cognitive impairment;
Hearing loss.
The policies presented in this Impact Assessment certainly lead to benefits respect in terms of the effects listed above. However such benefits are currently not all quantifiable to an acceptable degree of confidence. In fact in addition to the uncertainty mentioned in 5.4.2 on the population exposed to rail noise it is important to note that only in the case of sleep disturbance (Position Paper on dose-effect relationships for night time noise, EC WG HSE 2004) and annoyance (Position Paper on dose response relationships between transportation noise and annoyance) studies specifically dedicated to rail noise recognised by the EC are available.

51/129
Regarding cardiovascular disease the studies currently available concern mainly road and air traffic noise (Transportation noise and Cardiovascular Risk – Review and Synthesis of Epidemiological studies – Dose-effect Curve and Risk Estimation). Moreover further studies have to be carried out to distinguish the contributions to this type of disease by air pollution and noise pollution. (Quantifying burden of disease from environmental noise: second technical meeting report, December 2005). The causes that generate tinnitus, cognitive impairment and hearing loss have also been investigated for traffic noise and leisure noise. The study on cognitive impairment and hearing loss in particular, focused on vulnerable groups such as children. For the above reasons, the monetisation used in this Impact Assessment considers the externalities due to annoyance and sleep disturbance, using a value of Willingness-To-Pay deriving from a sensitivity analysis conducted on the data of the main European studies on the calculation of external costs (Infras-Iww, ExternE, Heatco). Such studies show that the sound pressure level under which the population is considered not to be affected by noise, thus not willing to pay for noise reduction, is 55 dB (LAeq). This does not mean that under this level health effects are negligible. In this respect ,the following comments summarise the findings of recent studies (Source: WHO project on night-time noise guidelines,2007):
although individual sensitivities and circumstances differ, it appears that up to a Lnight under 30 dB no substantial biological effects are observed;
from a Lnight,outside of 30 to 40 dB a number of effects are observed to increase; however, even in the worst cases the effects seem modest; it cannot be ruled out that vulnerable groups (for example children, chronically ill, elderly) are affected to some degree;
from a Lnight,outside of 40 to 55 dB there is a sharp increase in adverse health effects, and a substantial proportion of the exposed population is now affected and adapt their lives to cope with the noise; vulnerable groups are now severely affected;
above a Lnight,outside of 55 dB the situation is considered dangerous for public health; adverse health effects occur frequently, a high percentage of the population is highly annoyed, and there is limited evidence that the cardio-vascular system is coming under stress.
Levels are expressed in Lnight,outside mainly for the following reasons:
in the IA the noise reduction which would arise from the implementation of a programme for the gradual retrofitting of freight wagons, through the replacement of cast iron brake blocks with low noise brake blocks (K or LL), has been analysed;
sound emission reduction is 8 dB per wagon; this reduction, concerning only freight wagons, is to be considered mainly reduction of night noise;
• for this reason, the considered sound level reduction is to be reckoned as reduction in terms of Lnight,outside;
it is clear that, with appropriate proxy variables or knowing the sound pressure levels Ld e Le (see END) is ever possible to convert the values into Lden.
The monetary quantification carried out in this Impact Assessment of the benefits deriving from the reductions in persons affected and sound pressure levels is thus purely indicative. However, it will be seen that interesting conclusions can be drawn from the comparison of costs and the benefits thus calculated. The monetary value attributed to the noise reduction benefits has been determined intentionally in the simplest possible manner, taking into account the values available from the literature concerning annoyance and sleep disturbance. In reality recent studies have shown that significant health affects may arise from exposure to noise. In order to keep the analysis simple this has been taken into account through a sensitivity analysis (values: 8 – 10 – 12 €/ dB pers).

52/129
A more thorough analysis may be appropriate when more accurate population data is available (e.g. through noise maps). As considered in 5.4.2, due to the importance of affected population data and to the lack of specific information, two different data bases for affected population have been considered for the purpose of the Impact Assessment, in particular:
population calculated on the basis of data from Entec UK Ltd report for DG-ENV (2006): the reduction of noise emitted by trains taking into account the w-km run by LN wagons respect to the total (noise reduction is -8 dB when 100% of w-km are run by LN wagons); these figures derive from calculations on the density of rail-noise-affected population reported in a document for DG-ENV by Entec UK Ltd (“AP calculation”);
population according to the INFRAS-IWW report (2004): the reduction of affected population is calculated assuming that noise exposure levels are reduced by the same amount as noise emitted (approximation), that the fraction of population affected by rail freight noise respect to that affected by rail noise in general is 80%, that population is distributed according to levels of noise discretised into 1 dB intervals (the discretisation leads to the particular shape of the benefit curves).
Since there are large differences in the figures calculated for affected population (see also Annex IV), the figures themselves have been considered as orders of magnitude and are included in the quantitative analysis. The following charts illustrate the effects of the different policy options on the achievable noise reduction and on the affected population figures.
Figure 5-15: noise reduction, K-scenario
Source: PwC elaboration (2007)

53/129
Figure 5-16: reduction of affected population, AP calculation, K-scenario
Source: PwC elaboration (2007)
Figure 5-17: reduction of affected population, AP INFRAS-IWW, K-scenario
Source: PwC elaboration (2007)

54/129
Figure 5-18: noise reduction, K+LL-scenario
Source: PwC elaboration (2007)
Figure 5-19: reduction of affected population, calculated AP, K+LL-scenario
Source: PwC elaboration (2007)

55/129
Figure 5-20: reduction of affected population, AP INFRAS-IWW, K+LL-scenario
Source: PwC elaboration (2007)
Whilst Figures 5-21 and 5-22 indicate the amount of population no longer exposed to rail freight noise on account of the retrofitting programme, indicative values on the reduction of negative health effects for the population which remains exposed to rail freight noise in spite of the retrofitting programme can be derived from:
the dose-effect relationships of “Position Paper on dose response relationships between transportation noise and annoyance” (EC, February 2002) (Figure 5-21), through which the fraction of persons annoyed (%A) and highly annoyed (%HA) can be estimated as a function of the sound pressure level to which they are exposed; these relationships are expressed using the Lden indicator whilst in this study the Lnight indicator is used; the conversion between these two indicators was conducted simply and conservatively (overestimation of persons annoyed) by subtracting 5 dB from the Lden level to obtain the Ln level10;
the dose-effect relationships of “Position Paper on dose-effect relationships for night time noise” (EC, November 2004) (Figure 5-22), through which the fraction of persons affected by sleep disturbance (low – LSD, moderate – SD, high – HSD).
10 The Lden indicator takes into account the sound pressure level (LAeq) measured during day-time, evening and night-time, with a penalisation of 5 dB for evening noise and 10 dB for night-time noise. The difference between the two indicators depends on the relative importance of day-evening-night noise. In the case of constant sound pressure level throughout the 24 hours this difference is 6.4 dB regardless of the constant level. For day-evening levels lower than the night-time level this difference is no less than 5.2 dB. For day-evening levels that grow higher than the night-time level the problem of night time noise obviously becomes less important. For Lden – Ln > 10 dB it can be seen that night-time noise has practically no influence thus the population subjected to these cases are not considered in this study. This leads to assume practical values of Lden – Ln in the range 5.2 – 10 dB – the lower value is true for cases with very high relative importance of night-time noise, the higher value is true for cases in which night-time noise is less important. The lower value, rounded to 5 dB, was taken for simplicity and for the fact that it leads to an upper bound for the value of persons annoyed.

56/129
Figure 5-21: fraction of persons annoyed (%A) and highly annoyed (%HA) as a function of the sound pressure level to which they are exposed (indicator Ln converted from data in Lden)
0%
5%
10%
15%
20%
25%
30%
35%
40%
45%
50%
45 50 55 60 65 70 75 Lden [dB]
frac
tion
of p
erso
ns s
ubje
cted
to a
nnoy
ance
[%]
HAA
40 45 50 55 60 65 70 Ln [dB] est.
Source: Position Paper on dose response relationships between transportation noise and annoyance (EC, 2002))
Figure 5-22: fraction of persons with low (%LSD,) moderate (%SD) and high (%HSD) sleep disturbance as a function of the sound pressure level to which they are exposed (indicator Ln)
0%
5%
10%
15%
20%
25%
30%
35%
40%
45%
40 45 50 55 60 65 70
Lnight (outside,facade) [dB]
frac
tion
of p
opul
atio
n su
bjec
ted
to s
leep
di
stur
banc
e [%
]
HSDSDLSD
Source: Position Paper on dose-effect relationships for night time noise (EC, 2004)
The calculation of the reduction of health effects for the population which remains exposed to significant noise requires the distribution of affected population according to the different levels of exposure. This is shown in Figures 5–23 and 5–24 for the two levels of affected population calculated as described earlier. The reduction is calculated at the starting date for the retrofitting programme (“Time 0”) and at the year in which the whole fleet is made up of Low-Noise wagons (“Time 1”). This year varies according to the policy option as can be seen in Figures 5–5 to 5–12.

57/129
Figure 5-23: Affected Population classified on the basis of sound pressure level (Ln) - calculated AP
-
1
2
3
4
55-60 60-65 65-70 70-75 >75
sound pressure level - Lnight [dB]
Affe
cted
Pop
ulat
ion
[mill
ions
of p
erso
ns]
Time 0Time 1
Source: PwC elaboration (2007)
Figure 5-24: Affected Population classified on the basis of sound pressure level (Ln) – AP INFRAS-IWW
-123456789
10111213141516
55-60 60-65 65-70 70-75 >75
sound pressure level - Lnight [dB]
Affe
cted
pop
ulat
ion
[mill
ions
of p
erso
ns]
Time 0Time 1
Source: PwC elaboration (2007)
The histograms regarding the affected population indicate that the available data lead to the highest values in the lowest sound pressure level class (55-60 dB Ln). Lower SPL classes would eventually have to start showing lower values of population for obvious reasons. An error would be introduced in the calculation of persons annoyed and subjected to sleep disturbance if these population values were neglected. In fact in the lower classes there is still the possibility that Annoyed / Highly Annoyed or LSD / SD / HSD persons occur. The data on this part of the population is not available. Tables 5–2, 5–3, 5–4 and 5–5 show the results of the indicative calculation. Two versions of calculation have been developed.
Assumptions for version 1. Persons subjected to Ln levels of less than 55 dB are not considered due to the lack of data on affected population at these levels. For each class of sound pressure levels of Figures 5–23, 5–24 a figure for the persons annoyed or disturbed is calculated on the basis of the curves of Figures 5–21, 5–22.
Assumptions for version 2. The total number of persons in the intervals 50-55 and 45-50 is the same as that for the interval 55-60, for which data are available and that the number of persons in the 40-45 interval is zero. For the calculation of persons annoyed this assumption certainly leads to overestimation, since taking Ln = Lden – 5 dB is an additional approximation in the direction of an overestimation. Also in this case for each class of sound pressure levels of

58/129
Figures 5–23, 5–24 a figure for the persons annoyed or disturbed is calculated on the basis of the curves of Figures 5–21, 5–22.
The reduction of the number of persons subjected to annoyance and sleep disturbance due to rail freight noise is clearly visible in Figures 5–2, 5–3, 5–4 and 5–5. The reduction is calculated at the year in which the whole fleet is made up of Low-Noise wagons. This year varies according to the policy option as can be seen in Figures 5–5 to 5–12. A reduction of 60 – 70 % of annoyed and highly annoyed persons is expected respect to the initial situation once the whole fleet is composed of LN wagons. Similarly a reduction of 50 – 70% of persons subjected to sleep disturbance is expected. In addition to higher values for the affected population, the use of the INFRAS-IWW estimates leads also to the calculation of higher values of reduction of annoyance and sleep disturbance. The two different assumptions for the population exposed to less than 55 dB alter the absolute values but the relative ones (percentages of reduction) are altered very little.
Table 5-2: Estimates of the persons subjected to Annoyance (A) and High Annoyance (HA) due to rail freight noise at time 0 (1st January 2009) and at time 1 (end of year in which the whole fleet is Low-Noise) – persons subjected to
less than 55 dB are neglected
Calculated AP [millions of persons] Level of A Time 0 Time 1 Δ [%]
HA 2.361 1.012 -57% A 2.943 1.339 -55%
AP INFRAS-IWW [millions of persons] Level of A Time 0 Time 1 Δ [%]
HA 5.259 1.650 -69% A 6.925 2.262 -67%
Source: PwC elaboration (2007)
Table 5-3: Estimates of the persons subjected to Low Sleep Disturbance (LSD), Sleep Disturbance (SD) and High Sleep Disturbance (HSD) due to rail freight noise at time 0 (1st January 2009) and at time 1 (end of year in which the
whole fleet is Low-Noise) ) – persons subjected to less than 55 dB are neglected. Calculated AP [millions of persons]
Level of SD Time 0 Time 1 Δ [%] HSD 0.663 0.314 -53%
SD 1.480 0.724 -51%
LSD 2.813 1.422 -49%
AP INFRAS-IWW [millions of persons] Level of SD Time 0 Time 1 Δ [%]
HSD 1.618 0.542 -67%
SD 3.728 1.274 -66%
LSD 7.316 2.554 -65% Source: PwC elaboration (2007)

59/129
Table 5-4: Estimates of the persons subjected to Annoyance (A) and High Annoyance (HA) due to rail freight noise at time 0 (1st January 2009) and at time 1 (end of year in which the whole fleet is Low-Noise) ) – the number of persons
subjected to 50-55, 45-50 dB is considered the same as that exposed to 55-60 dB Calculated AP [millions of persons]
Level of A Time 0 Time 1 Δ [%] HA 2.666 1.280 -52% A 3.500 1.827 -48%
AP INFRAS-IWW [millions of persons] Level of A Time 0 Time 1 Δ [%]
HA 6.649 2.335 -65% A 9.465 3.513 -63%
Source: PwC elaboration (2007)
Table 5-5: Estimates of the persons subjected to Low Sleep Disturbance (LSD), Sleep Disturbance (SD) and High Sleep Disturbance (HSD) due to rail freight noise at time 0 (1st January 2009) and at time 1 (end of year in which the
whole fleet is Low-Noise) – the number of persons subjected to 50-55, 45-50 dB is considered the same as that exposed to 55-60 dB
Calculated AP [millions of persons] Level of SD Time 0 Time 1 Δ [%]
HSD 0.824 0.455 -45%
SD 1.913 1.104 -42%
LSD 3.804 2.292 -40% AP INFRAS-IWW [millions of persons]
Level of SD Time 0 Time 1 Δ [%]
HSD 2.353 0.904 -62%
SD 5.703 2.248 -61%
LSD 11.841 4.784 -60% Source: PwC elaboration (2007)
C) Cost increase for the retrofitting programme
One of the main obstacles for a retrofitting programme at a large scale could be of financial nature. Total costs for the retrofitting programme depend not only on unit cost of a retrofitted wagon but also on retrofitting time frame, speed of retrofitting, total number of wagons to be retrofitted and discount rate. The range of all these parameters (described in the previous paragraph) could produce different economic impacts. Specifically, the cost for a single wagon retrofitting, as considered by the main literature, could range from 4.500 € to 13.000 € depending on several factors considered in the Table 5-4 (to better understand the matter described below, see ANNEX II):
1. Number of axles and type of wagon; 2. Purchase of components 3. Labour cost for the replacement (retrofitting programme); 4. The cost of testing and accepting the retrofitted vehicle 5. Cost for temporary withdrawal of the vehicle fromice.

60/129
Table 5-4: Quantitative description of cost factor for retrofitting
Factors Assumption and quantitative description
1. The number of axles and type of wagon
According to the most recent analysis carried out for UIC/UIPUIRR wagons, 30% of the EU-25 fleet has been considered made up of 2-axle wagons and 70% of 4-axle wagons.
2. The purchase of the components to be replaced, in particular:
The price of a K block has been fixed at 23€ per shoe (accordingly with real cost figures given by different RUs). The price of a LL block has been fixed at 50 € per shoe at the start up of the programme; a yearly price decrease has been considered during the programme because a fully developed market could generate a price reduction: for instance, relating to UIC analysis, the USA market (considered fully developed respect to the EU market with only 2 suppliers) maintains lower prices for K-blocks than the EU market). So it been considered that final price of the LL blocks could decrease to 30 € per shoe at 2024.
New brake cylinder: the purchase price of a brake cylinder could range between 700 and 1,000€;
“empty-loaded valve” (replacement could be required replacement when cylinder is replaced): the valve could range between 900 and 1,350 €
cost of the wheel: 800 €
3. Labour cost of the replacement.
Level of labour cost is widely differing in EU; so it has been considered that cost per hour could range from 41 to 53€. Thus the total labour cost ranges between 950 and 2,500 €. For the Impact Assessment the value taken is 1,700 € per wagon with K-blocks; Labour cost for the replacement of LL blocks has bee considered the same of cast iron blocks (the two type of brake block have been considered interchangeable). So for LL blocks no labour costs has been included as the blocks need to be changed anyway (cast iron replacing cast iron, if no retrofitting takes place).
4. The cost of testing and accepting retrofitted vehicle.
According to an AEA Technology report11, the testing cost has been considered only for K brake block retrofitting and has been estimated at 400€ per wagon
5. Cost for withdrawal from service of the vehicle:
Costs for unavailability and transfer will be avoided because the retrofitting programme is considered to be combined with the regular overhaul of wagons that takes place typically every 6-8 years.
Based on the assumptions described in the table before, for the purpose of the Impact Assessment the total cost for retrofitting has been considered:
of 7.000 € per wagon with K-blocks solution;
of 1.360 € per wagon with LL-blocks solution.
Thus retrofitting using LL-Blocks could be significantly less expensive: in the analysis, only direct costs, brake block cost and wheel reprofiling will be considered for LL-Blocks.
D) Variation of LCCs For the purpose of the analysis, two basic options will be considered as alternative solutions: K brake blocks and LL brake blocks.
11 Status and Option for the reduction of noise emissions from the European rail freight Traffic.

61/129
Different researches suggest that composite brake blocks would lead to higher wheel wear (in comparison with cast iron blocks) but would show lower block wear in similar operating conditions. As considered in ANNEX II, the life cycle costs per wagon depend mainly on the life span of the wheel and brake blocks. However to figure all costs relating the life cycle and the annual maintenance programme, one must considered not only technical conclusions but also other issues related to the wagon operative life, in particular:
1. Yearly mileage of wagons 2. Characteristics of wagon operation; 3. Lifetime of wheels; 4. Type and lifetime of brake blocks; 5. Labour cost of replacement; 6. Cost for brake block disposal
1. Mileage of wagons: due to the potential incentives related to the specific policy options (for instance DTAC (Differentiated Track Access Charge) could consider a discount on track access charge per tr-km run with a “silent train”), RUs would strive to increase the utilisation rate of silent wagons. As we will consider later (see sensitivity analysis chapter), the increase of the average mileage per wagon produces an average increase of maintenance cost with a different impact on the total net effect of a policy option.
To evaluate this specific effect, within the analysis for the DEV scenarios it has been considered a different rate of mileage of silent wagons respect to the noisy freight fleet, in particular:
1. SOV scenarios: the average mileage of silent wagons has been considered the same as the average mileage of the noisy fleet;
2. DEV scenarios: the average mileage of silent wagons has been considered as 1.5 times respect to the average mileage of the noisy fleet.
2. Characteristics of wagon operation such as average speed, type of track, average freight weight carried: for instance when long stretches of undisturbed operation are possible (long distance transport), block wear can be lower than where much interference occurs. To consider this specific argument, a sensitivity analysis will be carried out in the chapter 7, related to different wheel and brake block rate.
3. Lifetime of wheels
The lifetime of the wheel depends on:
different brake block solutions used (that cause different wheel wear): it has been considered that composition-brake-blocks would lead to higher wheel wear in comparison with cast iron blocks;
rejection of running surface and wheel defects in general (for instance wheel flats, cracks, wear, tread collapse) that cause wheel reprofiling;
standard reprofiling process: according with the main literature12, it has been considered that the reprofiling rate with the K-Block solution is 35% more than reprofiling rate with cast iron solutions; because of different figures of several sources, it has been considered that the reprofiling rate with the LL-Block solution is the same of the reprofiling rate with cast iron solutions (see Annex II).
12 LLOYD’S REGISTER RAIL EUROPE – Whispering trains - LCC

62/129
The following table shows values of each parameter related to wheel wear rate (different sources have been considered - see Annex II), specific values chosen within the Impact Assessment and scenarios for sensitivity analysis (range between best and worst cases),
Unit of Measure Values for Policy Option IA
WAGON LIFE Years 35 Number of reprofiling during life span N° 5 Wheel changing rate with cast iron blocks n°/ 100,000 km 0.21 Wheel changing rate with K Blocks n°/ 100,000 km 0.29 Wheel changing rate with LL Blocks n° / 100,000 km 0.29 km to wheel reprofiling
A) with cast iron blocks km 350,000 B) with composition K blocks (+35% of A) km 230,000
C) with composition LL blocks (+35% of A) km 230,000 Source: PwC elaboration (2007)
4. Type and lifetime of brake blocks:
K or LL Blocks have a lower block wear than cast iron blocks. According to different sources (see ANNEX II), it has been assumed that:
the wear rate for K Blocks is 3 times less than that of cast iron blocks;
the wear rate for LL Blocks is 4 times less than that of cast iron blocks (however there is no confirmation on the matter: there are no data on the real wear rate);
The following table shows different values of each parameter related to average block wear chosen for the Impact Assessment.
CAST IRON K Blocks LL Blocks
Average block wear mm / 100.000 Km 52 26 17 Source: PwC elaboration (2007)
5. Labour cost of replacement .
The labour for the complete replacement of the brake blocks has been estimated at 2-3 man-h (120 € per wagon per replacement). This value has been considered the same for all types of brake block (not variable according to the brake block solution).
The labour for the complete reprofiling of the wheels has been estimated at 2 man-day (almost 16): 160 € per axle (+ 40% for machinery).
The labour for the complete replacement of the axle (only for wheel changing) has been estimated at 1 man-day per axle (350 € per axle).
Disposal Cost Total disposal cost for K-blocks has been considered 500 € per ton, roughly 1.3 € per K brake block (see ANNEX II).

63/129
According to the statement described above, the following table shows total cost per km with different type of brake blocks.
TOTAL MAINTENANCE COST Cast iron block K-block LL-block
BRAKE BLOCK MAINTENANCE COSTS - per 100,000 km per € 279.93 € 281.60 € 288.06
WHEEL REPROFILING COSTS - per 100,000 km per Wagon € 214.01 € 322.08 € 322.08
WHEEL CHANGING COSTS - per 100,000 km per Wagon € 791.83 € 1,086.09 € 1,086.09
DISPOSAL COSTS - per 100,000 km per Wagon € 15.344 € 11.803 € 15.737
Added Maintenance cost per 100,000 Km per Wagon (respect to cast iron brake block) € 400.46 € 410.46
Average operative cost per km (for Wheel and Brake) € 0.013 € 0.0170 € 0.0171
Source: PwC elaboration (2007) Within the analysis, it has been considered that K and LL blocks have a cost per km of roughly 30% more that cast iron brake blocks.
Figure 5-25: Av. operative cost per km
0,0130,017 0,0171
CI K LL
+32%+31%
Source: PwC elaboration (2007)
The practical information which is available is however not sufficient to base firm conclusions upon it. Therefore, a sensitivity analysis will be made using different assumptions for wheel and block wear, depending on three annual mileage scenarios.
E) External costs: modal shift and environmental impact Modal Shift
According with the previous assumptions, RU or PO will have an added cost because of the retrofitting programme and incremental maintenance costs. To cover this maintenance increase, unless adequately funded RUs will apply a proportional increase to the final customer for the rail transportation services. Theoretically, RU could decide to sustain part of the added cost; however this hypothesis has been considered not practicable and realistic. So within the analysis, it has been considered that added maintenance cost will be totally allocated to the final price (the absolute amount of the extra costs is

64/129
passed onto customers): this total cost increase has been divided by the traffic (train-km) on the rail network in order to estimate the charge increase by train-km. The increase rate in service price has been calculated approximately as the ratio between the total added cost for RU and the total traffic revenues on that network. Even if different types of services (for instance single wagon train, combined wagon train, block train) could have a different figure of this ratio, the estimated increase in percentage has been considered as equally applied to all types of freight traffic. According to the main literature, price changes often affect consumer decisions and transport activities tend to follow this pattern. This has been considered through the elasticity of the demand related to the price change. Even if the elasticity could vary over a wide range depending on the type of freight and the commodity group, it is calculated that this value could range between -0.25 and -0.3513. Within the analysis -0.35 level has been considered (as the worst case): this means that a 10% cost/price increase of the rail transport service reduces rail traffic by 3.5%. It is important to understand that the total amount of charge increase depends on the different policy options. In particular, policy options considering incentives (for instance subsidies or overall reduction of Track Access Charges) will reduce the total effect of decreases in rail freight demand. The following table shows different rail traffic decreases according to different levels of incentives in case of the policy option that minimises the total number of wagons to be retrofitted within the programme (K brake block scenario, SOV 1984 policy option combination, 1984 as wagon limit birthdate); in particular it has been considered:
average K-retrofitting rate over time-frame: 28.000 per year;
wagon limit "birthdate": 1984;
total cost of retrofitting programme and increase of maintenance costs.
Level of incentive 14 Total Price Increase (€/tr-Km)
Average increase in pricing (%)
Expected rail traffic decrease
(%)
Expected rail traffic decrease (Million ton.km)
No Subsidies 0.20 1.09% 0.40% 4,035
50% of costs 0.10 0.57% 0.21% 2,115
75% of costs 0.06 0.31% 0.11% 1,155
100% of costs 0.01 0.05% 0.02% 196 Source: PwC elaboration (2007)
Rail demand reduction has to be satisfied by alternative modes of transport. So it is probable that the variation in rail demand could be followed by an increase in road transport demand. According with the last assumption, a cross-elasticity has been considered to figure the variation of road traffic demand corresponding to variations in rail transport demand. A single value of the cross-elasticity has been chosen for the whole IA-18. The total estimated increase of road traffic, according with this cross-elasticity, will be variable between the 0.02% and 0.31% of the total rail demand.
13 Victoria Transport Policy Institute (http://www.vtpi.org/tdm/); RMH Breugem, DP van Vuuren, B van Wee, “Comparison of global passenger transport models and available literature” 14 The incentive considers only the cost of the retrofitting programme.

65/129
Finally, the increase of total road freight traffic will range between 147 million-ton-km (in case of incentives covering 100% of the costs of the retrofitting programme) and 3.026 million-ton-km (in case of “no incentives” programme) according to the different policy options.
Environmental Impact Emission factors for the most significant pollutants (CO2, NOx, PM) have been applied to the estimated increase of road traffic in order to estimate other environmental costs. The emission factors are derived from the TREMOVE database and have been estimated based on the weighted average of road freight traffic. Load factor values are taken from the TREMOVE database. The following table shows different net effects of increased emission (due to the increase of road traffic) and reduction of emission (due to reduction of rail traffic) in case of the lack of incentives.
Tonn/year
Increase of emission due to the increase of
road traffic
Reduction of emission due to the reduction of
rail traffic
Net effect
NOx +2,998 -483 +2,515
PM 10 +75 -29 +45
CO2 +281,577 -27,235 +254,342
Table 5-5: Potential Impact on Environment (tons/year)
As it possible to understand from the above table, the modal shift could cause a high increase in road transport emissions. This increase is much higher than the reduction of air pollutants and greenhouse gases expected as result of rail traffic decrease. Similar calculations indicate substantial increases in road traffic noise and in fatal accidents.
F) Administrative costs
The implementation of the different policy options will provide the different stakeholders with different added costs finalised at the organisation, planning, development and management of the specific programmes and structures needed. Moreover the different policy options will generate the need (mainly for MS and IM) to create specific monitoring programmes to follow and understand the real effectiveness of the wagon owners’ retrofitting programme and the RUs’ performance (in case of operating restrictions or emission ceilings). Several countries have already structured a noise programme that considers an office focused on rail aspects, however added costs will be considered for:
upgrading the organisation (IM and RU would have to gather more information and to ensure transparency): the introduction of specialised professionals and technicians for coordination and reporting rail noise measurements and/or progress of retrofitting programmes;
harmonising the different monitoring systems of each country (specially for TAC and EC);
defining a uniform mode of wagon classification;

66/129
planning and developing a uniform set of indicators and a monitoring system for all countries;
introducing tracking & tracing system in European railways (TAF SI).
As considered above, the main impact of these costs are on IM (for instance TAC policy option) and on MS, that have to plan an increase of labour costs (measured as FTE, Full Time Equivalent, programme and focused rail noise problem. Within the analysis, the total added administrative cost has been considered to depend on:
Type of network (small and large in terms of network length): large networks will require a more complex structure (and for instance a higher number of FTE);
Yearly tr-km (high or low): regarding the DTAC instrument it can be considered that the number of potential agreements between RU and IM (for instance for receiving a bonus for silent wagons) is proportional to tr-km; in fact an increase of tr-km per country is assumed to increase the number of transactions for TAC discounts.
Time duration of the new upgraded structures, that is related for instance to the particular abatement programme;
Current situation of the effort in each country related to noise abatement: presence of a programme, project or office. To estimate the total amount of added administrative costs for each country, a percentage of reduction on potential FTE persons has been considered according to the actual programme in progress for each country;
The dependencies listed have been considered using corrective factors. All administrative costs have been considered existent only until the year in which the fleet is made up of 100% silent wagons. Taking into account the above assumptions the administrative costs have been estimated in terms of:
the total costs for added FTE persons needed according to each policy option programme calculated as the sum over all 18 countries; in a first step calculation is carried out for an ideal reference country (average network length, tr·km, current effort on noise abatement); in a second step, the values for each of the 18 countries (i.e. the ones that are summed) are estimated by multiplying those for the reference country by the above-mentioned corrective factors;
specifically for the NEC instrument (and the combined solution DEV), a noise monitoring system capable of identifying noisy wagons/trains: total cost for the purchase, installation and maintenance of several noise monitoring stations has been considered.
Assuming a unit cost of €8.000 for each monitoring station and a total number of 160 stations (sum of stations necessary in each country, estimated on the basis of network complexity), it has been calculated for all 18-IA countries:
- a start up cost of 1,64 M€ (purchasing, installation and SW development);
- a yearly cost for maintenance of 0,13 M€ The following tables show the potential activities for each stakeholder relating to each policy option to organise and develop the programme (start up) and during the management process (on-going), in particular:

67/129
Table 5-6: Hypothesis of FTE persons required for programme start-up
Table 5-7: Hypothesis of FTE persons required during the programme
Table 5-8: FTE persons: administrative start-up tasks
Table 5-9: FTE persons: administrative on-going tasks
Table 5-10: Administrative cost estimate

68/129
Table 5-6: Hypothesis of FTE at the start-up of the programme
SOV DEV
SUB OR DTAC NEC
START UP
EU
- Study on the harmonization of Track access system, according to different MS across Europe (for instance, define a unique system for calculating charges on the basis of wagons rather than of trains);
- Define the DTAC guide line whit target of Track Access Agreement between different MSs.
MS Planning and organisation of total national programmes (budgeting modal transfer incentives and timing)
- To write and to “send” rules for operating restriction (based on noise map (internal voluntary commitment);
- Supporting to EU in harmonization of Track access system.
- Defining a national responsibility for each assignment
- Defining the legal action (level of noise emission per period, penalty etc…);
- defining and developing a control system (ceiling);
IM
- According with MS, plan and define the organization of operation verify/control programme
- Supporting to EU in harmonization of Track access system.
- Developing of operational procedure to manage the DTAC system.
- defining and developing an internal control system to:
- help MS in control process; - anticipate potential crossing of the
legal ceiling
RU
- Mapping and classify total fleet in term of noise emission (K, LL Iron coast brake blocks).
- According to IM, define an instrument to quick wagon check.
- According to IM, defining of an instrument to quick wagon control to obtain the final bonus for utilization of silent fleet (monthly).
- Define an organization to maximise the utilization rate of silent fleet.

69/129
Table 5-7: Hypothesis of FTE during the programme
SOV DEV
SUB OR DTAC NEC
ON GOING
MS - Project management: responsible of plan
and management tasks; - Controlling of respect of the programme
and the use of total assigned budget;
- control activity and verification of operating restriction
- Management of the budget dedicated to charge compensation.
- Spot Control of the silent fleet;
IM
- control activity and verification of operating restriction;
- control of wagon and freight train composition;
- Spot Control of self certification and of the silent fleet;
- Management of control system.
RU
- Management of the silent fleet according to operating restriction (i.e. train composition with all silent wagon);
- Management of the cadastre of silent fleet;
- Self-certification of utilization of silent wagon on track with reduction charge;
WO - Coordinator and responsible of
operational activities

70/129
Table 5-8: FTE persons: administrative start-up tasks – ideal reference country Professional Specialized technicians
SUB OR DTAC EC SOV DEV SUB OR DTAC EC SOV DEV
EU 4
MS 1 1 2 1 1 2 0 0
IM 0,5 2 0,5 0,5 2 0 0
RU 1 1 1 1 2 2 0 Stak
ehol
ders
PO 1 0,5 1 0 0 0 0
Table 5-9: FTE persons: administrative on-going tasks – ideal reference country SUB OR TAC NEC SOV DEV
S-N M/L-N S-N M/L-N S-N M/L-N S-N M/L-N S-N M/L-N S-N M/L-N
MS 1 1 0,5 0,5 1 1
IM 0,5 0,5 0,5 1 1 1 0,5 0,5 1 1
RU 1 1 1 1
Spec
ializ
e pr
ofes
sion
as
PO
MS
IM 2 5 0,5 1 2 5 0,5 1
RU 0,5 1 0 0 0,5 1
Stak
ehol
ders
Spec
ializ
ed
tech
nici
ans
PO 1 2 1 2
Based on the above assumptions, the total added administrative costs for all 18 member states range between 2,3 € and 6,5 M€ per year depending on the different policy options; start-up costs range between 2,4 and 8,4 M€. The following table shows different figures for added administrative costs of each policy option:
Table 5-10: Added administrative cost estimate for the 18-IA countries – yearly M€ SUB OR TAC NEC SOV DEV
MS 1,6 M€ 1,6 M€ 3,2 M€ 1,6 M€ 1.6 M€ 3.2 M€
IM 0,8 M€ 3,2 M€ 0,81 M€ 0,8 M€ 3.2 M€
RU 1,6 M€ 1,6 M€ 1.6 M€ 1,6 M€
PO 2,1 M€ 1,2 M€ 0,4 M€ 2,1 M€ 0,4 M€
MONITORING SYSTEM 1,6
STA
RT
UP
TOT 3,7 M€ 5,3 M€ 8,5 M€ 2,8 M€ 8,37 M€ 10,2 M€
MS 1,6 M€ 0,8 M€ 1,6 M€ 3.6 M€
IM 3.6 M€ 1.7 M€ 1,6 M€ 3,6 M€ 1,6 M€
RU 1,6 M€ 0,6 M€ 1,6 M€ 1,2 M€
PO 1,25 M€ 1,25 M€ ON
GO
ING
TOT 2,9 M€ 6,1 2,4 M€ 3,2 M€ 6.5 M€ 6.5 M€

71/129
G) Value of the discount on track access charges (not included in the CBA) In the DEV option, the incentivising mechanism is based on the fact that RUs will benefit from a discount on TACs. These charges are currently imposed by each IM on a train-km basis, with corrections according to the specific situation (e.g. hour of day, passenger or freight train, etc.). According to the political address in the various EU countries regarding financing of track maintenance, the average values of charge per train-km vary from country to country (from under 1 €/tr-km to about 10 €/tr-km). An eventual discount on these charges cannot show large differences across Europe, since its value necessarily reflects the average cost for retrofitting plus additional administrative and maintenance costs in each country. Each single company will decide whether to retrofit and how many wagons to retrofit on the basis of its own cost-benefit analysis. It will use a relatively high discount rate for this calculation (no less than 6%, probably 8% or 10%). It must be taken into account that there needs to be a financial exposure in the first years of the programme since the wagon-km run by LN wagons are not sufficient to finance the number of retrofittings needed. Under the assumption of a single European bonus value for all 18-IA countries, a decision of the value to be taken should be based on the consideration that this value affects the following. 1) The total amount of funding required by IMs from MS (total funding €) = (w-km of LN wagons)
× (bonus € / w-km). Figure 5-26 shows the Net Present Value (January 2009) of total boni transferred to RUs as a function of the European bonus value for different scenarios (retrofitting with K- or LL-blocks, limit birthdate 1979 / 1984), compared with the respective NPV of added costs for retrofitting. The intersections between the horizontal lines representing costs and the other lines, representing boni transferred, indicate the values of European bonus value required to cover 100% of total costs. It can be seen that for all scenarios these values range roughly from 2 to 2.5 cents / w-km.
2) The degree to which owners are incentivised to retrofit their wagons, thus the retrofitting rate. The cost and benefit calculations of this Impact Assessment are carried out under the assumption that the funding scheme incentivises almost 100% of Owners otherwise the programme could not be effective for noise reduction. In order for this assumption to be valid, the European bonus value must be sufficient to incentivise even Owners i) not capable, for various reasons (not only efficiency in fleet management), of running high mileages with their LN wagons; ii) not possessing LN wagons at the start of the programme; iii) sustaining relatively high costs to retrofit their wagons. In Figure 5-27 the values of bonus necessary to incentivise such Owners have been calculated15 assuming average mileages of 10,000-20,000-30,000 km /year for their LN wagons and increments of unit costs for retrofitting of 50%-100% respect to average. The time required for complete return of investment has been taken as 8 years for retrofitting with K-blocks and 4 years for retrofitting with LL-blocks. A sensitivity analysis to this parameter is shown inFigure 5-28..
For each given scenario two values for the European bonus can be calculated:
1) that required to cover 100% of costs; this value is approximately in the range of 2 – 2.5 cents / w-km for all scenarios;
2) that required to incentivise the Owners in the most difficult conditions; this lies in the range of 3 – 9 cents / w-km according to the scenario, provided that all companies are capable of reaching 20,000 km / year on average for their LN wagons.
15 The simplified calculation is as follows. The average added cost per wagon is obtained dividing the total by the number of retrofitted wagons. This cost is incremented by 50 / 100% and divided by the number of years for return of investment to estimate the annual amount required from noise boni, assuming no existing LN wagons other than the retrofitted one. The annual amount is divided by the average mileage of LN wagons to obtain the value for the bonus in € / w-km.

72/129
If the former were adopted many Owners would not retrofit and the programme would be ineffective. The latter has to be chosen for the programme to be effective. It is necessarily higher than the former. The ratio of the two is a measure of the surplus which would be transferred to Owners in average or above-average conditions in terms of mileage, number of LN wagons at programme start, costs. It coincides with the ratio of the funds required from MS to the added costs of retrofitting for Owners. The lowest values for this ratio are obtainable for retrofitting with LL-blocks, assuming average mileage 30,000 km/year, extra costs of 50%, return of investment in 4 years:
1.25 for DEV 79; 1.84 for DEV 84.
These values can decrease to less than 1 for DEV79 and a mileage of 19,000 km/year, meaning that all Owners should easily be incentivised to retrofit, if return on investment is taken to be expected in 8 years.
Figure 5-26: NPV (1-2009) of the yearly amount of boni granted within the retrofitting time-frame, as a function of the European bonus value, compared with the discounted total added costs for the retrofitting programme(lines
marked K79 etc.); the four intersections indicate the value of bonus required to cover 100% of total costs
0
1000
2000
3000
4000
5000
0 0,01 0,02 0,03 0,04 0,05 0,06 0,07
European bonus value [€/w-km]
Net
Pre
sent
Val
ue o
f bon
i at 1
/200
9 [M
€]
DEV79 K (1/2011 - 12/2017)DEV84 K (1/2011 - 12/2017)DEV79 LL (1/2011 - 12/2014)DEV84 LL (1/2011 - 12/2014)
K79
K84LL79
LL84
Source: PwC elaboration (2007)
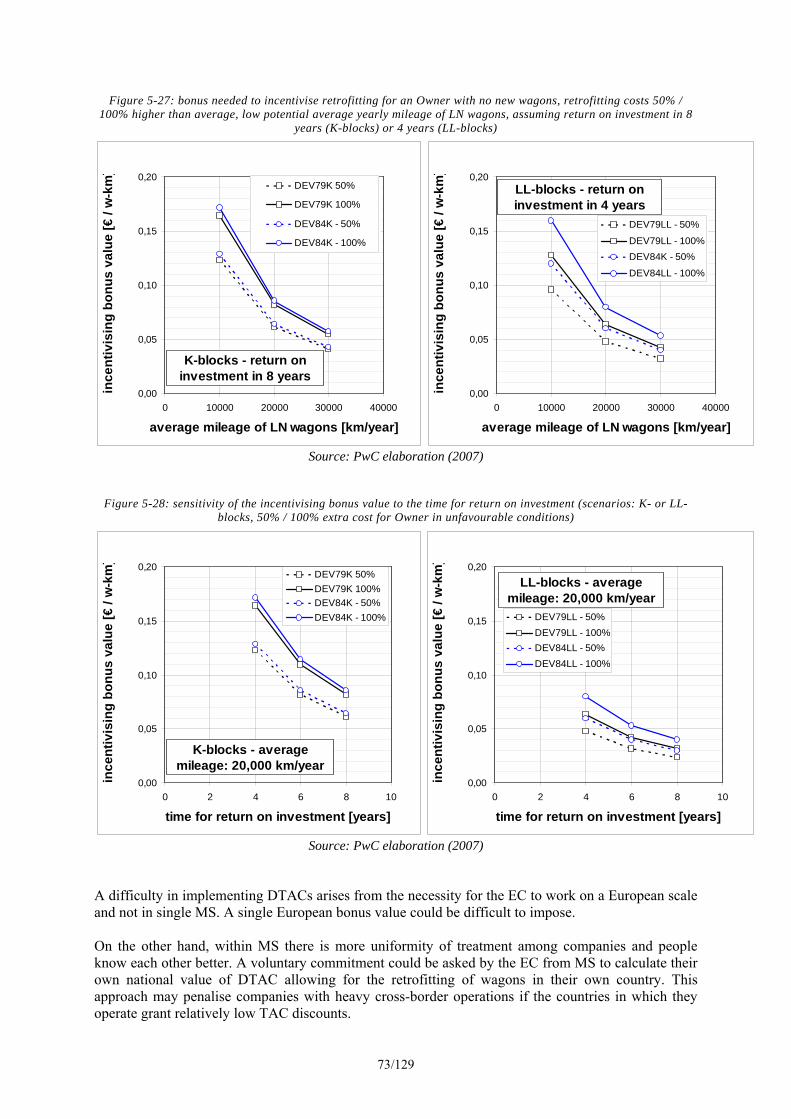
73/129
Figure 5-27: bonus needed to incentivise retrofitting for an Owner with no new wagons, retrofitting costs 50% / 100% higher than average, low potential average yearly mileage of LN wagons, assuming return on investment in 8
years (K-blocks) or 4 years (LL-blocks)
0,00
0,05
0,10
0,15
0,20
0 10000 20000 30000 40000
average mileage of LN wagons [km/year]
ince
ntiv
isin
g bo
nus
valu
e [€
/ w
-km
]
DEV79K 50%
DEV79K 100%
DEV84K - 50%
DEV84K - 100%
K-blocks - return on investment in 8 years
0,00
0,05
0,10
0,15
0,20
0 10000 20000 30000 40000
average mileage of LN wagons [km/year]in
cent
ivis
ing
bonu
s va
lue
[€ /
w-k
m]
DEV79LL - 50%
DEV79LL - 100%DEV84K - 50%
DEV84LL - 100%
LL-blocks - return on investment in 4 years
Source: PwC elaboration (2007)
Figure 5-28: sensitivity of the incentivising bonus value to the time for return on investment (scenarios: K- or LL-blocks, 50% / 100% extra cost for Owner in unfavourable conditions)
0,00
0,05
0,10
0,15
0,20
0 2 4 6 8 10
time for return on investment [years]
ince
ntiv
isin
g bo
nus
valu
e [€
/ w
-km
]
DEV79K 50%DEV79K 100%DEV84K - 50%DEV84K - 100%
K-blocks - average mileage: 20,000 km/year
0,00
0,05
0,10
0,15
0,20
0 2 4 6 8 10
time for return on investment [years]
ince
ntiv
isin
g bo
nus
valu
e [€
/ w
-km
]
DEV79LL - 50%DEV79LL - 100%DEV84LL - 50%DEV84LL - 100%
LL-blocks - average mileage: 20,000 km/year
Source: PwC elaboration (2007)
A difficulty in implementing DTACs arises from the necessity for the EC to work on a European scale and not in single MS. A single European bonus value could be difficult to impose. On the other hand, within MS there is more uniformity of treatment among companies and people know each other better. A voluntary commitment could be asked by the EC from MS to calculate their own national value of DTAC allowing for the retrofitting of wagons in their own country. This approach may penalise companies with heavy cross-border operations if the countries in which they operate grant relatively low TAC discounts.

74/129
H) Funding for the retrofitting programme
The figures shown in point E) above and the firm proposals of EU transport policy to strongly favour the rail mode among terrestrial transport modes leads to the conclusion that funding for the retrofitting programme has to be such as to exclude any possible modal shift. Thus within the analysis it has been considered that MSs will cover all the added maintenance, retrofitting costs and other costs related for instance to administrative tasks and organisation. Expressed in another form:
Total Incentives = = (costs of retrofitting + added maintenance costs + added administrative costs) + incentivation
margin =
= total added costs + incentivation margin
The incentivation margin takes into account the need to incentivise even the “worst performing wagon owner” to retrofit otherwise there would be a substantial risk of not attaining significant benefits. This marginal owner is not necessarily inefficient; poor performance in terms of retrofitting wagons could derive for instance from higher costs and, for the DEV option, from difficulties in attaining high mileages run by LN wagons.
This margin should include:
the number of actors that will contribute to the programme implementation: programmes that consider more than one step or stakeholders will need incremental resources to cover the marginal costs of each stakeholder in each different step. This situation could produce an extra cost and/or a time delay. On the other hand if the incentives will be given directly to the final destination (as in direct subsidies for retrofitting), almost 100% of the effort will be used for the purpose;
a component to cover uncertainties in the cost calculations;
for the DEV option, a component that takes into account a surplus for average/good performers, considering also the eventual existence of an upper limit for discounts that can be granted (e.g. for any single wagon no higher than the average retrofitting cost per wagon multiplied by a certain factor, or by imposing a reasonable limit mileage value);
for the DEV option, a component to cover eventual financial exposure of some owners in the early stages of the programme, when retrofitting costs are incurred but not yet covered by TAC discounts.
It has not been possible to calculate this margin in this Impact Assessment. A thorough stakeholder consultation on the matter is needed. However it is reasonable to assume that direct subsidies (SOV option) lead to a lower incentivation margin (10%-20%) since cost reporting refers directly to the wagons retrofitted. As shown in 5.4.4 H) a much higher incentivation margin (at least 50%) is needed if the DEV option is chosen. However direct subsidies have the disadvantage of not incentivising owners to try to keep their retrofitting costs low whereas with access charge bonuses companies will also strive for low costs so as to maximise economic advantage.
5.4.4 Qualitative analysis

75/129
I) Reduction in existing infrastructure-related noise abatement programmes
The retrofitting programme connected with the SOV and DEV options could allow the reduction of infrastructure investment for noise reduction (for instance for noise barriers by a percentage of programme and/or of total costs). In fact many areas in which population is subjected to noise exceeding national limits would benefit from a decrease in rolling noise due to freight wagons which could in principle lead to noise returning within legal limits, thus avoiding IRMs. This of course depends on the relative importance of the other sources of rail noise (impact-, squeal-, traction-, aerodynamic-, pantograph- noise etc.). However it important to consider that:
to have a higher benefit of noise abatement, a high fraction of the fleet should be LN wagons (that is the total number of LN wagons have to be more than a specific percentage); considering this assumption, a transient period has to be managed (for instance until 2014 or 2015);
investment structures are “rigid” and there are difficulties in changing scheduled investments (or eventually in shifting budget from IM to RU or PO); there are many long-period programmes that cannot be rescheduled or reorganised in the mid-term; a reduction in investments has been assumed possible only after 5-10 years;
infrastructure investments solve problems that are not only related to rolling noise of freight wagons running at night; news on experience in a country in which noise reception limits for the existing infrastructure exist leads to believe that when affected population resorts to legal action the promise of a partial noise reduction (rolling noise of freight trains) to be attained in a number of years will probably not be considered as adequate noise protection.
Moreover it is very difficult to estimate the total reduction for IRM costs and no one has carried out a specific analysis on this matter because of data robustness; in particular:
status reports of noise abatement on European railway infrastructure (for instance UIC status report) are in progress and not completed;
the total infrastructure cost investment, estimated in 10 Billion € in the UIC status report, is a figure based on a forecast on a part of total countries.
An order of magnitude can be estimated on the basis of the results of the EU-project STAIRRS which demonstrate that the same order of benefits in terms of affected population can be achieved, with IRMs, at costs of 2 to 4 times higher than those for retrofitting with K-blocks. This IA has estimated costs for retrofitting with K-blocks of approximately 2,000 M€ (assuming 1979 as the limit birthdate, see 6.1). The same results would be obtained with investments in IRMs of 4,000 – 8,000 M€, leading to savings for MS in the order of 2,000 – 6,000 M€ over the time-frame considered here. It is interesting to compare these figures with the estimates from the UIC status report which considers a value of up to 10,000 M€ in IRM investments. Of these, according to the above calculation 4,000 – 8,000 M€ would be saved, leading to total expenses of 2,000 – 6,000 M€ for IRMs + 2,000 M€ for retrofitting. To summarise, based on the findings of the STAIRRS project on on the estimates of the UIC status report:
with no retrofitting programme the total costs would be approx. 10,000 M€ (IRMs)
with a retrofitting programme the total costs would be approx. 2,000 M€ (retrofitting) + 2,000-6,000 M€ (IRMs) = 4,000-8,000 M€
savings due to a retrofitting programme would amount to approx. 2,000-6,000 M€.

76/129
To better understand this impact, it would be considered the Switzerland noise abatement programme In particular, within the Swiss programme, the retrofitting programme and the use of infrastructure measure (as noise barriers) are developed side by side. The legislation defines the top priority for railway noise abatement in Switzerland as retrofitting the existing passenger and freight fleet. Secondary priority is given to noise barriers with a standard height of 2. However the use of noise barriers is limited by a cost-benefit index relating to the potential amount of noise reduction, population density and cost. Cost-benefit considerations led to optimal mix of measures, in particular:
noise barriers with a cost benefit constraint: the number of noise barrier are calculated and optimized basically according a specific range of cost-benefit index;
retrofitting of all Swiss rolling stock;
insulation windows, where noise thresholds could not be obtained otherwise.
J) Influence of restrictions for noisy wagons on non-EU countries The non-EU States whose wagons can run on the networks of the 18-IA countries (Balkan countries and Norway) account for just over 4% of the total fleet. These States may be incentivised to retrofit their wagons with the DEV option, due to the access charge bonus. However an agreement on their voluntary commitment would be appropriate. A voluntary commitment by these countries is essential for the SOV option.
K) Impact on the final price for the access to freight transportation service and of goods
As considered in paragraph 5.4.3.(E), RU or PO will have an added cost because of the retrofitting programme, incremental maintenance costs, administrative costs. To cover this cost increase, unless adequately funded, RUs will apply a price increase to the final customer for the rail transportation services. Within the analysis, it has been considered that price changes affect consumer decisions. So the consumer could decide to shift from rail transport service to other less expensive types (modal shift). However, in some cases rail demand reduction may not be satisfied by alternative modes of transport or (theoretically) customers may decide to sustain part of the added cost instead of rescheduling their transportation programme. In this case, because of the higher transportation service price, final prices of goods may increase. This increase in final price of goods might depend for instance on:
average load factor or quantity of goods shipped (economy of scale);
type of goods;
type and length of transport.
However this hypothesis has been considered not practicable: variations in transport service prices due to the implementation of the policy options are considered to be negligible since in this study it has been assumed that funding completely covers all added costs for the railway sector.
L) Reduction of weight handled by wagon maintenance workers

77/129
LN brake blocks are made of composite materials resulting in substantially lighter blocks compared with cast iron blocks (typical cast iron block mass: 13 kg, typical composite block mass: 4-8 kg).So K brake blocks and LL Brake blocks result easy and safe to handle. This leads to a positive impact in terms of acceptance by maintenance workers. This impact is not decisive in terms of the choice between the BAU, SOV and DEV options.
M) Increased transparency
The implementation of some instruments connected with the different policy options for retrofitting can lead to the availability of data on noise reduction that would not otherwise be gathered just on the basis of the European Noise Directive. This is true in particular for Noise Emission Ceilings if these are enforced on the basis of measurements.
N) Stimulation of increased efficiency An increase in efficiency in terms of annual t-km / wagon is necessary in particular to attain the growth of freight transport predicted in the White Book as most likely (scenario “Partial B”). It is important, not only for noise reduction issues, that voluntary commitment, in both the SOV and DEV options, is taken to reinforce this trend. In fact benefits of this increased efficiency would be:
a lower number of wagons (most importantly axles) to realise the same traffic in t-km / year, leading to lower noise even in the absence of retrofitting if this efficiency is obtained through increases in t / wagon;
a decrease in the number of wagons to be purchased by the sector of about 5000 wagons / year, which at 90,000 € / wagon for purchase leads to the considerable sum of 450 M€ / year in savings for the rail sector.
Since DTAC offer the possibility of higher bonuses if higher mileages are run, the DEV option may stimulate an improvement of fleet management in terms of know-how on how to obtain high average mileages for a part of the fleet or even the whole fleet. This would boost the impacts described above.
O) Likelihood of fire breaking out due to sparks from the block tyre interface This issue has proved to be relevant in Portugal. In this country the use of composite brake blocks has been stimulated in order to reduce the occurrence of bush fires. Although not a decisive impact, it may have a certain relevance in terms of savings for MS in the countries of Southern Europe which add to the other benefits of retrofitting wagons with composite blocks.

78/129
6 Comparing the options
6.1 Evaluation of the impacts of the proposed Policy Options According to the assumptions of the previous chapters, different figures of costs and benefits for each combined policy option have been calculated. Quantitative impacts have been estimated as the difference between the specific policy option solutions and the baseline scenario in terms of added costs and benefits. The discount rate has been fixed at 4%16 (starting year 2009). Table 6-1 summarises the costs of retrofitting programme, added maintenance and administrative costs, total benefit (INFRAS and DG Env 2006 model) in the different scenarios. All values are expressed in monetary terms and are referred to the period 2010-2024. The net benefit, i.e. total benefits – total added costs, is calculated. It is important to note that this net benefit does not take into account the incentivation margin and the savings on Infrastructure-related measures, which cannot be calculated accurately without further stakeholder consultation. The reader may add personal estimates for these figures on the basis of the quantitative considerations of points G), H), I) above. The following comments arise from the analysis of the table:
composition of the costs
- for all scenarios the investment for retrofitting is the most important cost; added maintenance costs amount to 13-16% of the total (K-blocks) and 32-45% of the total (K+LL-blocks); administrative costs amount to 4-7% of the total (K-blocks) and 7-16% of the total (K+LL-blocks);
- added maintenance costs constitute a significant portion of the total when retrofitting is considered to be done with K and LL-blocks;
- added administrative costs do not appear to be decisive although they refer to essential components of the retrofitting programme;
comparison of K-block and K+LL-blocks scenarios:
- the K+LL scenario always leads to higher net benefits; this is due to the decrease in retrofitting costs and to the increase of benefits (regardless of the value taken for affected population) connected with the much higher attainable retrofitting rates, both due the fact that brake systems do not need to be modified for retrofitting with LL-blocks;
- the elimination of the first year of retrofitting with K-blocks would lead to a further increase in net benefits (see 7.3); a rapid homologation of LL-blocks is thus an important objective for the effectiveness of the retrofitting programme;
comparison of BAU, SOV and DEV options
- the BAU scenario (no EU action) would appear to be the most convenient if the lower values are taken for the affected population; however if savings due to the reduction of
16 EC Standard value (cfr. Annex of IA Guide Line 15 June 2005 with 15 March 2006 updated – section 12 of discount)

79/129
IRM costs are valued at more than 500 M€ and/or higher values for affected population are taken the convenience shifts towards the realisation of a retrofitting programme;
- the evolution in time of discounted costs and benefits (see following charts) leads to a slight advantage for the DEV option in terms of total added costs; however it has been shown that the incentivation margin for the DEV option will probably have to be higher than for the SOV option (5.4.2 G); dividing the SOV/DEV total added cost values in Table 6-1, it can be seen that an incentivation margin for DEV of at the most 130% (K) or 150% (K+LL) that for SOV would lead to equal total funding for the two options SOV / DEV;
comparison of the two limit birthdates, 1979 and 1984
- before going to the quantitative considerations it is important to note that the values for the number of wagons built after 1979 / 1984 are calculated from the available age distributions with a procedure that does not lead to a great accuracy; furthermore it is unknown whether in the future these wagons will last longer than expected (with the consequence of noisy wagons running for a long time) or disappear quickly;
- assuming the figures calculated, the choice of a limit birthdate of 1984 would obviously lead to less costs than the choice of 1979 due to the lower number of wagons to retrofit; however in all scenarios and for all values assumed for affected population it can be seen that a reduction in net benefit ensues; it thus can be concluded that to retrofit the wagons built between 1979 and 1984 (limit birthdate 1979) leads to higher benefits than costs.
In order to further understand the relationships between costs and benefits the following figures depicting the time evolution of the annual environmental benefits and extra costs due to the various options with respect to the no policy one, are useful.

80/129
Table 6-1 Cost Benefit Analysis: Added figure respect to Baseline scenario (discounted at 2009, time frame 2009-2024)
Rif Impact Wagon Limit Birthdate K (2009 – 2024) K+LL (2009 – 2024)
SOV DEV SOV* DEV
1979 1,846.8 M€ 1,440.7 M€ 727.7 M€ 416.0 M€ 1 Investment cost for retrofitting programme
1984 1,102.4 M€ 1,017.9 M€ 487.9. M€ 213.5 M€
1979 317.2 M€ 238.3 M€ 406.2 M€ 347.2 M€ 2 Added maintenance costs (RU and PO)
1984 225.8 M€ 193.3 M€ 268.2 M€ 247.9 M€
1979 3 Added administrative costs for new tasks –
start up (Organization and FTE). 1984 6.1 M€ 8.5 M€ 6.1 M€ 8.5 M€
1979 4 Added administrative costs for new tasks –
start up (Monitoring System) 1984 0.0 M€ 1.6 M€ 0.0 M€ 1.6 M€
1979 5 Added administrative costs for new tasks –
yearly (no start up Cost) 1984 79.1 M€ 80.7 M€ 79.1 M€ 80.7 M€
1979 2,249.2 M€ 1,769.8 M€ 1,219.1 M€ 854.0 M€ 6 = 1+2+3+4+5 TOTAL ADDED COST
1984 1,413.4 M€ 1,301.1 M€ 841.3 M€ 552.2 M€
1979 1718.5 M€ 1393.6 M€ 2321.1 M€ 2067.6 M€ 7A Added BENEFIT on affected population
(“DG ENV Analysis 06”): 1984 970.9 M€ 1044.9 M€ 1040.4 M€ 1225.2 M€
1979 7070.5 M€ 5762.0 M€ 9460.1 M€ 8427.8 M€ 7B Added BENEFIT on affected population
(INFRAS-IWW): 1984 4132.5 M€ 4385.0 M€ 4449.5 M€ 5208.0 M€
1979 -530.7 M€ -376.2 M€ 1002.0 M€ 1213.5 M€ 7A-6 TOTAL NET VALUE (“DG ENV
Analysis 06”): 1984 -442.5 M€ -257.2 M€ 199.1 M€ 672.9M€
1979 4821.3 M€ 3992.1 M€ 8241.0 M€ 7573.7 M€ 7B-6 TOTAL NET VALUE (INFRAS-IWW)
1984 2719.1 M€ 3083.8 M€ 3608.2 M€ 4655.7 M€ Source: PwC elaboration (2007)
* for the first year (LL-blocks not yet homologated) retrofitting is considered to be done with K-blocks

81/129
Figure 6-1: Costs and Benefits Trends against Base Case (K, 1979, SOV)
CBA Analysis for K and 1979 scenario SOV
€ -
€ 100.0
€ 200.0€ 300.0€ 400.0
€ 500.0
€ 600.0€ 700.0
€ 800.0
€ 900.0€ 1,000.0
2009
2010
2011
2012
2013
2014
2015
2016
2017
2018
2019
2020
2021
2022
2023
2024
[mln
€]
Benefit DG Env An'06 Benefit Infras TOT Extra CostMainten. Costs Adm Costs (SOV) Retrof Costs
Source: PwC elaboration (2007)
Figure 6-2: Costs and Benefits Trends against Base Case (K, 1979 DEV)
CBA Analysis for K and 1979 scenario DEV
€ -
€ 100.0
€ 200.0
€ 300.0€ 400.0
€ 500.0
€ 600.0€ 700.0
€ 800.0
€ 900.0€ 1,000.0
2009
2010
2011
2012
2013
2014
2015
2016
2017
2018
2019
2020
2021
2022
2023
2024
[mln
€]
Benefit DG Env An'06 Benefit Infras TOT Extra Cos tMainten. Cos ts Adm Costs (DEV) Retrof Cos ts
Source: PwC elaboration (2007)
Figure 6-3: Costs and Benefits Trends against Base Case (K+LL, 1979, SOV)
CBA Analysis for K+LL and 1979 scenario SOV
-€ 100,0
€ 100,0
€ 300,0
€ 500,0
€ 700,0
€ 900,0
€ 1.100,0
2009
2010
2011
2012
2013
2014
2015
2016
2017
2018
2019
2020
2021
2022
2023
2024
[mln
€]
Benefit DG Env An'06 Benefit Infras TOT Extra CostMainten. Costs Adm Costs (SOV) Retrof Costs
Source: PwC elaboration (2007)

82/129
Figure 6-4: Costs and Benefits Trends against Base Case (K+LL, 1979, DEV)
CBA Analysis for K+LL and 1979 scenario DEV
€ -€ 100,0
€ 200,0€ 300,0€ 400,0€ 500,0
€ 600,0€ 700,0€ 800,0
€ 900,0€ 1.000,0
2009
2010
2011
2012
2013
2014
2015
2016
2017
2018
2019
2020
2021
2022
2023
2024
[mln
€]
Benefit DG Env An'06 Benefit Infras TOT Extra CostMainten. Costs Adm Costs (DEV) Retrof Costs
Source: PwC elaboration (2007)
Figure 6-5: Costs and Benefits Trends against Base Case (K, 1984, SOV)
CBA Analysis for K and 1984 scenario SOV
€ -€ 100.0
€ 200.0
€ 300.0€ 400.0€ 500.0
€ 600.0
€ 700.0€ 800.0
€ 900.0€ 1,000.0
2009
2010
2011
2012
2013
2014
2015
2016
2017
2018
2019
2020
2021
2022
2023
2024
[mln
€]
Benefit DG Env An'06 Benefit Infras TOT Extra CostMainten. Costs Adm Costs (SOV) Retrof Costs
Source: PwC elaboration (2007)
Figure 6-6: Costs and Benefits Trends against Base Case (K, 1984 DEV)
CBA Analysis for K and 1984 scenario DEV
€ -
€ 100.0
€ 200.0
€ 300.0€ 400.0
€ 500.0
€ 600.0€ 700.0
€ 800.0
€ 900.0€ 1,000.0
2009
2010
2011
2012
2013
2014
2015
2016
2017
2018
2019
2020
2021
2022
2023
2024
[mln
€]
Benefit DG Env An'06 Benefit Infras TOT Extra Cos tMainten. Cos ts Adm Costs (DEV) Retrof Cos ts
Source: PwC elaboration (2007)

83/129
Figure 6-7: Costs and Benefits Trends against Base Case (K+LL, 1984, SOV)
CBA Analysis for K+LL and 1984 scenario SOV
€ -€ 100,0
€ 200,0€ 300,0€ 400,0€ 500,0
€ 600,0€ 700,0€ 800,0
€ 900,0€ 1.000,0
2009
2010
2011
2012
2013
2014
2015
2016
2017
2018
2019
2020
2021
2022
2023
2024
[mln
€]
Benefit DG Env An'06 Benefit Infras TOT Extra CostMainten. Costs Adm Costs (SOV) Retrof Costs
Source: PwC elaboration (2007)
Figure 6-8: Costs and Benefits Trends against Base Case (K+LL, 1984, DEV)
CBA Analysis for K+LL and 1984 scenario DEV
€ -€ 100,0
€ 200,0€ 300,0€ 400,0€ 500,0
€ 600,0€ 700,0€ 800,0
€ 900,0€ 1.000,0
2009
2010
2011
2012
2013
2014
2015
2016
2017
2018
2019
2020
2021
2022
2023
2024
[mln
€]
Benefit DG Env An'06 Benefit Infras TOT Extra CostMainten. Costs Adm Costs (DEV) Retrof Costs
Source: PwC elaboration (2007)
Finally, the following figure shows the total benefit/cost ratio for each scenario (K and K+LL) and for different wagon limit birthdates (1979 and 1984). Again, the incentivation margin and the savings due to IRM reduction should be included separately.
Figure 6-9: Total Benefits-Costs ratio
0,76 0,69 0,79 0,80
3,14 2,92 3,26 3,37
0246
81012
SOV 79 SOV 84 DEV 79 DEV 84
K SCENARIO K+LL SCENARIO
DG ENV Analysis 06 INFRAS IWW
1,90 1,242,42 2,22
7,76
5,31
9,87 9,43
02
46
810
12
SOV 79 SOV 84 DEV 79 DEV 84
0,76 0,69 0,79 0,80
3,14 2,92 3,26 3,37
0246
81012
SOV 79 SOV 84 DEV 79 DEV 84
K SCENARIO K+LL SCENARIO
DG ENV Analysis 06 INFRAS IWWDG ENV Analysis 06 INFRAS IWW
1,90 1,242,42 2,22
7,76
5,31
9,87 9,43
02
46
810
12
SOV 79 SOV 84 DEV 79 DEV 84

84/129
7 Sensitivity analysis In order to calculate the sensitivity of the different impacts to the variation of each main parameter, three different steps have been taken:
1. analysis on operational costs (per wagon) for K-blocks, in order to evaluate the percentage of total maintenance cost respect to retrofitting cost
2. sensitivity analysis of critical parameters on DEV and SOV policy options and K and K+LL scenarios with fixed operational cost (retrofitting and maintenance cost);
3. Cost Benefit Analysis on DEV and SOV policy options for “only LL” scenarios (it has been considered that the retrofitting programme starts immediately with LL brake blocks).
7.1 Analysis on operational costs (K-blocks) The currently available practical information relating to K and LL brake blocks is not considered sufficient to base firm conclusions upon it. A sensitivity analysis has thus been conducted using different assumptions for wheel and block wear, depending on three annual mileage scenarios.
As considered in ANNEX II, the average annual maintenance costs depend mainly on the different ranges of:
1. Mileage of wagons; 2. Lifetime of wheels; 3. Type and lifetime of brake blocks; 4. Labour cost of replacement;
1. Annual mileage: since the impact of wagon average mileage on total cost is high, in order to assess the importance of maintenance costs respect to the retrofitting programme three different mileage levels have been considered:
low average mileage : average mileage of 10.000 Km/year;
medium average mileage: average mileage of 50.000 Km/year;
high average mileage (for instance representing private wagons): average mileage of 100.000 Km/year.
2. Characteristics of wagon operation such as average speed, type of track, average freight weight carried: for instance when long stretches of undisturbed operation are possible (long distance transport), block wear can be lower than where much interference occurs.
3. Lifetime of wheels
The lifetime of the wheel depends on:
different brake block solutions used (that cause different wheel wear): according to some documents, it has been considered that composition-brake-blocks would lead to higher wheel wear in comparison with cast iron blocks. It is possible that the use of blocks of a new design could lead to different evolution in time of tread profiles, according also to the different types of track encountered (rail inclination, shape of rail-head etc.). In turn, these unusual tread profiles may lead to higher reprofiling rates for example due to the onset of running instability. Until further information is available on tread profile evolution, for reasons of

85/129
caution the higher values estimated for reprofiling rates will be assumed for the Impact Assessment.
rejection of running surface and wheel defects in general (for instance wheel flats, cracks, wear, tread collapse) that cause wheel reprofiling;
standard reprofiling process: in particular, it has been considered that the reprofiling rate with the K-Block solution is 35% more than the reprofiling rate with cast iron solutions17;
In particular, to evaluate wheel life and different re-profiling rates two different scenarios have been considered:
Frequent wheel defects (FWD) – the reprofiling rate does not depend on the brake block type used (reprofiling every 50.000 km)
Rare wheel defects (RWD) - the reprofiling rate has been considered entirely dependent on the brake block type (no reprofiling for defects)
The following table shows values of each parameter related to wheel wear rate (different sources have been considered), specific values chosen within the Impact Assessment and scenarios for sensitivity analysis (range between best and worst cases),
Values for Policy Option IA Range for Sensitivity Analysis
Best Worst
WAGON LIFE Years 35
Wheel defects (km to reprofiling) Km 100,000 50,000 (Rare Wheel Defects) (Frequent Wheel Defects)
Wheel wear with cast iron blocs mm / 100,000 km 1
Wheel wear with K Blocks mm / 100,000 km 2 1.5 3
Km to wheel reprofiling
with cast iron blocks Km 350,000
With composition K blocks Km 230,000
With composition LL blocks Km 230,000
4. Type and lifetime of brake blocks:
K or LL Blocks have a lower block wear than cast iron blocks. According to different sources, it has been assumed that:
o the wear rate for K Blocks is 3 times less than that of cast iron blocks;
o the wear rate for LL Blocks is 4 times less than that of cast iron blocks (however there is no confirmation on the matter: there are no data on the real wear rate);
The following table shows different values of each parameter related to average block wear (related to different sources – see ANNEX II) and scenarios for the sensitivity analysis (best and worst cases),
17 Source report of Lloyd’s Register: IPG Whispering Trains (Jasper Peen, Bellinzona, 2007)

86/129
Values for Policy
Option IA
Range for Sensitivity Analysis
PO Best Worst
Average block wear
Cast iron blocks mm / 100,000 Km 52 52 52
K blocks mm / 100,000 Km 26 17 33
LL blocks mm / 100,000 Km 17 17 17
5. Labour cost of replacement .
- The labour for the complete replacement of the brake blocks has been estimated at 2-3 man-h (120 € per wagon per replacement). This value has been considered the same for all types of brake block (not variable according to the brake block solution).
- The labour for the complete reprofiling of the wheels has been estimated at 2 man-day (almost 16h): 160 € per axle (+ 40% for machinery).
- The labour for the complete replacement of the axle (only for wheel changing) has been estimated at 1 man-day per axle (350 € per axle).
FINAL EVALUATION: According to the previous assumptions, the following table shows different figures of total annual maintenance cost per wagon per year.
Table 7-1: result of sensitivity analysis (Maintenance annual cost)
Annual MILEAGE (km)
10,000 50,000 100,000
Number of Wheel Reprofilings
2 0.4 2 0.4 2 0.4
Number of Wheel Changes
0.4 0,23(B) 0,29 (W) 0.4 0,23(B) 0,29 (W) 0.4 0,23(B) 0,29 (W) RUNS 1 2 3 4 5 6 7 8 9
LOW
17
-€ 3.4 -€ 192.2 -€ 162.2 € 1,268.7 € 324.9 € 474.7 € 2,858.8 € 971.2 € 1,270.9
PO IA
V
alue
26
€ 6.3 -€ 182.4 -€ 152.5 € 1,317.4 € 373.6 € 523.4 € 2,956.3 € 1,068.7 € 1,368.3
WE
AR
RA
TE
OF
CO
MPO
SIT
E B
RA
KE
B
LO
CK
(mm
x 1
0^5
Km
)
HIG
H
33
€ 13.9 -€ 174.8 -€ 144.9 € 1,355.3 € 411.5 € 561.4 € 3,032.1 € 1,144.5 € 1,444.1
Source: PwC elaboration (2007)
Negative figures mean that the K-brake block solution brings a benefit (in terms reduction of LCC). As it possible to understand from the figure above, total added annual maintenance cost could range from negative values (generates benefit) to 30% of total retrofitting cost.

87/129
In particular, the following table shows different percentage of LCC cost on retrofitting (for retrofitting costs the figures shown in ANNEX II have been considered).
Table 7-2: Percentage of added maintenance cost on total retrofitted cost per wagon per year
RUN % of MAINTENANCE COST respect to RETROFITTING COST (PO IA VALUE)
1 2 3 4 5 6 7 8 9 € 3,668 0.2% -5.0% -4.2% 35.9% 10.2% 14.3% 80.6% 29.1% 37.3%
€ 7,136 0.1% -2.6% -2.1% 18.5% 5.2% 7.3% 41.4% 15.0% 19.2%
€ 8,978 0.1% -2.0% -1.7% 14.7% 4.2% 5.8% 32.9% 11.9% 15.2%
€ 5,556 0.1% -3.3% -2.7% 23.7% 6.7% 9.4% 53.2% 19.2% 24.6% CO
ST fo
r R
ET
RO
F.
€ 10,312 0.1% -1.8% -1.5% 12.8% 3.6% 5.1% 28.7% 10.4% 13.3%
Source: PwC elaboration (2007) Considering the argumentation described before and the impact of different average mileage on total cost, within the analysis different utilisation rates for silent and noise fleet have been considered (retrofitted fleet mileage has been considered up to twice that of the noisy fleet). In particular according to our hypothesis of different scenarios (SOV and DEV), the total maintenance cost will range between 11% and 13% respect to the retrofitting cost.
7.2 Sensitivity analysis on critical parameters The sensitivity analysis has been performed with reference to all policy options. Parameters affecting the magnitude of the different identified impacts have been given a different value, in order to examine their effects on the impact analysis results for each option. The analysis has considered the following variations of parameters affecting the impacts of the policy options as proposed by the Commission:
Average procurement rate over time-frame (no. wagons/year);
Average lifetime of wagons (age at which wagons exit fleet);
Discount rate (%/year);
Average noise emission reduction of Low-Noise Wagons (dB);
External benefit rate (€/(dB x Pers.)). The sensitivity analysis has been carried out considering:
both wagon limit “birthdates”(1979 and 1984)
both sources for calculating the noise affected population: INFRAS and DG ENV Analysis 2006
both scenarios: K and K+LL The following table shows all the parameters set for the sensitivity analysis.

88/129
Parameter Unit Default value Sensitivity Min Max
Time frame start year 2009
Time frame end year 2024
Average procurement rate over time frame wagons/year 20,000 17,500 22,500
N° of Low-Noise wagons at time frame start wagons 30,000
Discount rate % 4
Average age at which wagons exit fleet years 35 33 37
Average number of wagons per train Wagons/train 20
Percentage of population affected by freight rail noise only % 80%
External benefit rate €/dB x Pers 10 8 10
Average sound pressure reduction of K and LL brake block wagons at 7.5 m from track dB 8 6 10
Ratio between mileage silent wagon and mileage silent wagon (only DEVscenario) - 1.5 1 2
1. Average procurement rate over time-frame (no. wagons/year) The following figures and tables show the different impacts related to the sensitivity to average procurement rate that has been set at 17.500, 20.000 (value for policy option impact assessment) and 22.500 wagons per year.
Figure 7-1: Sensitivity of net benefit (Million €) to average procurement rate
Birthdate time limit: 1979; AP Calculated
-800.0-600.0-400.0-200.0
0.0200.0400.0600.0800.0
1,000.01,200.01,400.0
SOV (K) SOV (K+LL) DEV (K) DEV (K+LL)
Birthdate time limit: 1984; AP Calculated
-600.0
-400.0
-200.0
0.0
200.0
400.0
600.0
800.0
SOV (K) SOV (K+LL) DEV (K) DEV (K+LL)
Birthdate time limit: 1979; INFRAS IWW
0.01,000.02,000.03,000.04,000.05,000.06,000.07,000.08,000.09,000.0
SOV (K) SOV (K+LL) DEV (K) DEV (K+LL)
17.52022.5
Birthdate time limit: 1984; INFRAS IWW
0.0500.0
1,000.01,500.02,000.02,500.03,000.03,500.04,000.04,500.05,000.0
SOV (K) SOV (K+LL) DEV (K) DEV (K+LL)
Source: PwC elaboration (2007)

89/129
Table 7-3: Sensitivity of net benefit (Million €) to average procurement rate
Average Proc Rate SOV (K) SOV (K+LL) DEV (K) DEV (LL)
1979 -529.2 1,118.5 -400.3 1,230.5 17.5 TOTAL NET VALUE (“DG ENV Analysis 06”):
1984 -431.2 208.5 -262.7 647.0
1979 4,880.2 8,376.2 3,928.9 7,707.7 17.5 TOTAL NET VALUE (INFRAS-IWW)
1984 2,810.9 3,695.5 3,098.3 4,584.2
1979 -530.7 1,102.0 -376.3 1,213.6 20 TOTAL NET VALUE (“DG ENV Analysis 06”):
1984 -442.5 199.1 -257.2 673.0
1979 4,821.3 8,241.0 3,992.2 7,573.8 20 TOTAL NET VALUE (INFRAS-IWW)
1984 2,719.1 3,608.2 3,083.0 4,655.8
1979 -545.7 1,086.1 -389.8 1,197.3 22.5 TOTAL NET VALUE (“DG ENV Analysis 06”):
1984 -430.8 212.5 -224.4 698.2
1979 4,705.8 8,113.7 3,889.0 7,447.4 22.5 TOTAL NET VALUE (INFRAS-IWW)
1984 2,698.9 3,592.4 3,157.8 4,689.3
2. Age for which the (constant) out-of-service rate is calculated.
The following figures and tables show the different impacts related to the sensitivity to the “Age for which the (constant) out-of-service rate” is calculated that has been set at 33, 35 (value for policy option impact assessment) and 37 years.
Figure 7-2: Sensitivity of the net benefit (Million €) to the “age at which out of service rate is calculated” (Million €)
Birthdate time limit: 1979; AP Calculated
-800.0-600.0-400.0-200.0
0.0200.0400.0600.0800.0
1,000.01,200.01,400.0
SOV (K) SOV (K+LL) DEV (K) DEV (K+LL)
33 y35 y37 y
Birthdate time limit: 1984; AP Calculated
-800.0
-600.0
-400.0
-200.0
0.0
200.0
400.0
600.0
800.0
1,000.0
SOV (K) SOV (K+LL) DEV (K) DEV (K+LL)
33 y35 y37 y
Birthdate time limit: 1979; INFRAS IWW
0.01,000.02,000.03,000.04,000.05,000.06,000.07,000.08,000.09,000.0
SOV (K) SOV (K+LL) DEV (K) DEV (K+LL)
33 y35 y37 y
Birthdate time limit: 1984; INFRAS IWW
0.0
1,000.0
2,000.0
3,000.0
4,000.0
5,000.0
6,000.0
SOV (K) SOV (K+LL) DEV (K) DEV (K+LL)
33 y35 y37 y
Source: PwC elaboration (2007)

90/129
Table 7-4: Sensitivity of the net benefit to the ge for which the (constant) out-of-service rate is calculated (Million €)
Life time of Wagon SOV (K) SOV (K+LL) DEV (K) DEV (LL)
1979 -455.7 1,093.9 -280.3 1,207.5 33 y TOTAL NET VALUE (“DG ENV
Analysis 06”): 1984 -335.5 325.9 -162.2 755.2
1979 4,816.1 8,102.8 4,028.3 7,440.0 33 y TOTAL NET VALUE (INFRAS-
IWW) 1984 3,110.5 4,092.9 3,408.2 4,925.7
1979 -530.7 1,102.0 -376.3 1,213.6 35 y TOTAL NET VALUE (“DG ENV
Analysis 06”): 1984 -442.5 199.1 -257.2 673.0
1979 4,821.3 8,241.0 3,992.2 7,573.8 35 y TOTAL NET VALUE (INFRAS-
IWW) 1984 2,719.1 3,608.2 3,083.0 4,655.8
1979 -579.5 1,096.0 -472.5 1,210.6 37 y TOTAL NET VALUE (“DG ENV
Analysis 06”): 1984 -568.2 71.5 -369.3 536.5
1979 4,634.8 8,238.9 3,684.3 7,606.8 37 y TOTAL NET VALUE (INFRAS-
IWW) 1984 2,225.7 3,103.7 2,667.2 4,125.0
3. Average noise emission reduction of Low-Noise Wagons (dB)
The following figures and tables show the different impacts related to the sensitivity to average noise emission reduction of low-noise wagons that has been set at 6, 8 (value for policy option impact assessment) and 10 dB.
Figure 7-3: Sensitivity of net benefit (Million €) to noise emission reduction
Birthdate time limit: 1979; AP Calculated
-1,500.0
-1,000.0
-500.0
0.0
500.0
1,000.0
1,500.0
2,000.0
SOV (K) SOV (K+LL) DEV (K) DEV (K+LL)
6810
Birthdate time limit: 1984; ; AP Calculated
-1,000.0
-500.0
0.0
500.0
1,000.0
1,500.0
SOV (K) SOV (K+LL) DEV (K) DEV (K+LL)
6810
Birthdate time limit: 1979; INFRAS IWW
0.0
2,000.0
4,000.0
6,000.0
8,000.0
10,000.0
12,000.0
SOV (K) SOV (K+LL) DEV (K) DEV (K+LL)
6810
Birthdate time limit: 1984; INFRAS IWW
0.0
1,000.0
2,000.0
3,000.0
4,000.0
5,000.0
6,000.0
7,000.0
SOV (K) SOV (K+LL) DEV (K) DEV (K+LL)
6810
Source: PwC elaboration (2007)

91/129
Table 7-5: Figure 7-4: Sensitivity of net benefit (Million €) to noise emission reduction
Noise Emission Reduction SOV (K) SOV (K+LL) DEV (K) DEV (LL)
1979 -1,188.2 253.9 -923.2 438.6 6 TOTAL NET VALUE (“DG ENV
Analysis 06”): 1984 -821.5 -196.1 -665.0 185.3
1979 2,344.3 5,078.7 1,923.9 4,711.6 6 TOTAL NET VALUE (INFRAS-
IWW) 1984 1,223.8 2,039.0 1,541.3 2,749.5
1979 -530.7 1,102.0 -376.3 1,213.6 8 TOTAL NET VALUE (“DG ENV
Analysis 06”): 1984 -442.5 199.1 -257.2 673.0
1979 4,821.3 8,241.0 3,992.2 7,573.8 8 TOTAL NET VALUE (INFRAS-
IWW) 1984 2,719.1 3,608.2 3,083.0 4,655.8
1979 -110.4 1,668.8 -39.9 1,742.4 10 TOTAL NET VALUE (“DG ENV
Analysis 06”): 1984 -153.5 507.0 -67.7 1,017.8
1979 6,500.4 10,544.7 5,331.3 9,734.9 10 TOTAL NET VALUE (INFRAS-
IWW) 1984 3,837.5 4,812.9 4,090.9 6,006.9
4. External benefit rate The following figures show the different impacts related to the sensitivity to the external benefit rate that has been set at 8, 10 (value for policy option impact assessment) and 12 €/(dB x pers.).
Figure 7-5: Sensitivity of net benefit (Million €) to the External Benefit Rate
Birthdate time limit: 1979; AP Calculated
-1,000.0
-500.0
0.0
500.0
1,000.0
1,500.0
2,000.0
SOV (K) SOV (K+LL) DEV (K) DEV (K+LL)
8 €10 €12 €
Birthdate time limit: 1984; ; AP Calculated
-800.0
-600.0
-400.0
-200.0
0.0
200.0
400.0
600.0
800.0
1,000.0
SOV (K) SOV (K+LL) DEV (K) DEV (K+LL)
8 €10 €12 €
Birthdate time limit: 1979; INFRAS IWW
0.0
2,000.0
4,000.0
6,000.0
8,000.0
10,000.0
12,000.0
SOV (K) SOV (K+LL) DEV (K) DEV (K+LL)
8 €10 €12 €
Birthdate time limit: 1984; INFRAS IWW
0.0
1,000.0
2,000.0
3,000.0
4,000.0
5,000.0
6,000.0
SOV (K) SOV (K+LL) DEV (K) DEV (K+LL)
8 €10 €12 €
Source: PwC elaboration (2007)

92/129
Table 7-6: Sensitivity of net benefit (Million €) to the External Benefit Rate [€/(dBxpers)]
External Benefit SOV (K) SOV (K+LL) DEV (K) DEV (LL)
1979 -874.4 637.8 -655.0 800.0
8 €
TOTAL NET VALUE (“DG ENV Analysis 06”): 1984 -636.7 -9.0 -466.1 427.9
1979 3,407.2 6,349.0 2,839.8 5,888.2
8 €
TOTAL NET VALUE (INFRAS-IWW) 1984 1,892.6 2,718.3 2,206.0 3,614.2
1979 -530.7 1,102.0 -376.3 1,213.6
10 €
TOTAL NET VALUE (“DG ENV Analysis 06”): 1984 -442.5 199.1 -257.2 673.0
1979 4,821.3 8,241.0 3,992.2 7,573.8
10 €
TOTAL NET VALUE (INFRAS-IWW) 1984 2,719.1 3,608.2 3,083.0 4,655.8
1979 -187.0 1,566.2 -97.5 1,627.1
12 €
TOTAL NET VALUE (“DG ENV Analysis 06”): 1984 -248.3 407.2 -48.2 918.0
1979 6,235.4 10,133.0 5,144.6 9,259.3
12 €
TOTAL NET VALUE (INFRAS-IWW) 1984 3,545.6 4,498.1 3,960.0 5,697.4
5. Ratio between mileage of silent wagons and mileage of noisy wagons The following figures show the different impacts related to the sensitivity to the ratio between mileage of silent wagons and mileage of noisy wagons that has been set at 1.0 (SOV option), 1.5 (DEV option) and 2.

93/129
Figure 7-6: Sensitivity of net benefit (Million €) to the ratio silent/noisy wagon mileage
Birthdate time limit: 1979; AP Calculated
-600.0
-400.0
-200.0
0.0
200.0
400.0
600.0
800.0
1,000.0
1,200.0
1,400.0
DEV (K) DEV (K+LL)
Birthdate time limit: 1984; AP Calculated
-600.0
-400.0
-200.0
0.0
200.0
400.0
600.0
800.0
1,000.0
DEV (K) DEV (K+LL)
Birthdate time limit: 1979; INFRAS IWW
0.0
1,000.0
2,000.0
3,000.0
4,000.0
5,000.0
6,000.0
7,000.0
8,000.0
9,000.0
DEV (K) DEV (K+LL)
1
1.5
2
Birthdate time limit: 1984; INFRAS IWW
0.0
1,000.0
2,000.0
3,000.0
4,000.0
5,000.0
6,000.0
DEV (K) DEV (K+LL)
Source: PwC elaboration (2007)
Table 7-7: Sensitivity of net benefit (Million €) to ratio silent/noisy wagon mileage
External Benefit DEV (K) DEV (LL)
1979 -499.5 1,199.8
1
TOTAL NET VALUE (“DG ENV Analysis 06”): 1984 -405.4 459.3
1979 3,428.9 7,487.3
1
TOTAL NET VALUE (INFRAS-IWW) 1984 2,443.0 3,704.0
1979 -376.3 1,213.6
1.5
TOTAL NET VALUE (“DG ENV Analysis 06”): 1984 -257.2 673.0
1979 3,992.2 7,573.8
1.5
TOTAL NET VALUE (INFRAS-IWW) 1984 3,083.0 4,655.8
1979 -332.6 1,264.1
2
TOTAL NET VALUE (“DG ENV Analysis 06”): 1984 -150.0 788.6
1979 4,216.7 7,819.2
2
TOTAL NET VALUE (INFRAS-IWW) 1984 3,558.0 5,175.8
Source: PwC elaboration (2007)
7.3 CBA for the “only LL” scenario

94/129
This Cost Benefit Analysis has been carried out to analyse the potential savings in the case of an earlier availability of LL blocks homologation. In this case the retrofitting programme could start in 2010 without considering the utilisation of K blocks. This consideration is of course valid only for the SOV option since with the DEV option retrofitting is assumed to start no earlier than 2012. Parameters affecting the magnitude of the different identified impacts have been given a different value, in order to examine their effects on the impact analysis results for each option. The sensitivity analysis has been carried out considering:
both wagon limit “birthdates”(1979 and 1984);
both sources for calculating the noise affected population: INFRAS-IWW and DG ENV Analysis 2006;
scenarios: K and K+LL, and only K.
Table 7-8 summarises the costs of the retrofitting programme, added maintenance and administrative costs, total benefit (INFRAS and DG Env – Analysis 2006 model) in the different scenarios. All values are expressed in monetary terms and are referred to the period 2010-2024.
Table 7-8 Cost Benefit Analysis: Added figure (M€) respect to Baseline scenario (time frame 2010-2024)
Rif Impact WLB SOV (2009 – 2024)
K K+LL LL
1979 1846.8 727.7 485.4
1 Investment cost for retrofitting programme 1984 1102.4 487.9 231.1
1979 317.2 406.2 446.4
2 Added maintenance costs (RU and PO) 1984 225.8 268.2 279.3
1979
3
Added administrative costs for new tasks – Start UP (Organization and FTE). 1984
6.1
1979
4
Added administrative costs for new tasks – Start UP (Monitoring System) 1984
0
1979 5
Added administrative costs for new tasks – yearly (no start Up Cost) 1984
79.1
1979 2249.2 1219.1 1017
6 TOTAL ADDED COST
1984 1413.4 841.3 595.6
1979 1718.5 2321.1 2526.9
7A
Added BENEFIT on affected population (“DG ENV Analysis 06”): 1984 970.9 1040.4 1052.4
1979 7070.5 9460.1 10283.6
7B
Added BENEFIT on affected population (INFRAS-IWW):
1984 4132.5 4449.5 4504.4
1979 -530.7 1102 1509.9
7A-6
TOTAL NET VALUE (“DG ENV Analysis 06”):
1984 -442.5 199.1 456.8
1979 4821.3 8241 9266.6
7B-6
TOTAL NET VALUE (INFRAS-IWW)
1984 2719.1 3608.2 3908.8
Source: PwC elaboration (2007)
Moreover, the following figure shows the difference of total cost between “K+LL” scenario and “only LL” scenario.

95/129
Figure 7-7: Total cost (Billion €)
2,25
1,221,02
1,41
0,840,60
00,5
11,5
22,5
3
K K+LL LL
-29%-29%-17%-17%
SOV
1979 1984 Source: PwC elaboration (2007)
It can be inferred from the figure above that the implementation of the retrofitting programme without K brake blocks for the first years permits a cost decrease of roughly 17% (1979 birthdate) and 29% (1984 birthdate) respect to the hybrid scenario (K+LL). Finally, the percentage of benefit increase of the “only LL” respect to “K+LL” scenario could range from:
37% to 129% in relation to “DG ENV - 2006 Analysis” affected population;
8% to 12% in relation to “INFRAS-IWW” affected population.
7.4 Conclusions regarding the sensitivity analyses The three types of analyses conducted have led to an understanding of which variables are liable to influence the final results the most. The following points summarise the main conclusions for the three analyses.
1. Analysis on operational costs. These costs are calculated on the basis of values that are obviously affected by great uncertainty, since large data series are not yet available. However an analysis of the possible ranges of these costs have led to the conclusion that on average the total maintenance cost will range between 11% and 13% respect to the retrofitting cost.
2. Sensitivity analysis of critical parameters on DEV and SOV policy options, K and K+LL scenarios. The parameters that have proved by far the most critical are the ones regarding benefits: the average noise emission reduction of Low-Noise Wagons (dB) and the external benefit rate (€/ dB person). Added to the extremely uncertain data on affected population, this leads to conclude that the figures on benefits should be used only as indications of possible trends, according to how high the importance accorded to the noise problem (thus the estimate of the population involved) is rated. Average annual procurement rate, age for which out-of-service rate is calculated and, most importantly, the ratio of mileage of LN wagons to that of noisy wagons, are shown to have a minor, though not negligible, effect on the net benefit.
3. Cost Benefit Analysis on DEV and SOV policy options for “only LL” scenarios. An earlier homologation of LL-blocks is shown to have significant effects on the total costs of the retrofitting programme. The scenario with K-block retrofitting in the first year leads to costs in the range of 17% to 29% higher than a scenario in which retrofitting starts with LL-blocks. This is due to the lower costs of the retrofitting operations themselves. Benefits are also higher

96/129
if retrofitting starts with LL-blocks on account of the much higher retrofitting rates possible (no brake system modifications required) and of the consequent rapid increase of the mileage of LN wagons at an early stage in the programme when new wagons, which are also Low-Noise, are only few. According to the remarks on point 2. above, the increase in benefits is not accurately quantifiable. The calculated range was roughly +8% to over 100%.
8 Monitoring and evaluation
8.1 Core monitoring indicators
Within the framework of the Impact Assessment analysis it is important to prepare a monitoring and evaluation system, in order to verify if the policy is being implemented and to what extent it is reaching its objectives. An effective monitoring and evaluating system enables to find out where discrepancies with respect to the policy’s objectives are and what they are due to, for instance: the problem definition has not been accurate, objectives are not relevant and/or attainable, parties have not a full comprehension of the policy or are not able to implement it, etc. Once root causes have been identified it will be possible to adopt corrective measures to re-align results to the primary objectives. Identification and correction of the causes of deviation from the desired objectives should form an iterative process over the policy’s implementation.
The definition of a monitoring and evaluating system starts with the identification of the key indicators. An indicator can be defined as the measurement of an objective to be met, a resource mobilised, an effect obtained, a gauge of quality or a context variable. According to the IA Guidelines, five types of indicators can be identified in relation to the object they measure:
Resource indicators, provide information on the financial, human, material, organisational or regulatory means needed for the implementation of the programme;
Output indicators, that are related to activities and to the deliverables that the programme is expected to produce. They are measured in physical and monetary units (e.g. length of railroad constructed);
Results indicators, that can be referred to the direct and immediate effect of the action plan on direct addresses or recipients;
Impact indicators, that are related to the consequences of the program beyond the immediate effects. Represent the consequences of the programme beyond its direct and immediate interaction with the addresses or recipients. These include the medium-term impact on: the direct addressees or recipients of the programme, people or organisation not directly addressed by the programme, as well as unintended impacts. Two concepts of impact can be defined: • Specific impacts, that are those effects occurring after a certain lapse of time but which
are, nonetheless, directly linked to the action taken and the direct beneficiaries • Global impacts, that are longer-term effects affecting a wider population
Context indicators, apply an entire territory, population or category of population – without distinguishing between those that have been reached by the programme and those that have not.
With regard to the Impact Assessment it is not necessary to create indicators for each and every objective identified, but it is important to focus on the so called “general objectives”, since these will be surely part of whatever policy will be chosen as a result of the Assessment.
The indicators have been identified according to the criterions adopted by the European Commission in the Impact Assessment Guidelines:

97/129
Relevant (closely related to the objectives to be reached; Accepted (by staff, stakeholders); Credible for non expert, unambiguous and easy to interpret; Easy to monitor; Robust against manipulation.
The following table shows the indicators identified within the context of the Rail Noise Action Plan.
Table 8-1 – Table of indicators
Group of actions
Type of actions Actions Level of
objective18 Type of
indicator Indicator
Regulate
Planning and developing of a retrofitting programme for freight wagons to replace current brake systems with Low-Noise solutions
Specific objective
Output indicator
Total number of vehicles retrofitted per country
Finance Finance investments to maintain retrofitting programme
Specific objective
Resource indicator
Average annual cost of retrofitting per wagon (per country and per tr-km)
Regulate
Accelerate the common standard programme to overcome the current lack of silent wagons (respect to the target)
n.a. Resource indicator
New Low-Noise wagons per country (per year)
Develop the retrofitting programme
Regulate Provides measure to prevent noises from rail vehicles (with priority for the freight wagon)
General objective
Output indicator Total silent fleet per country
Reduction of Modal shift Finance
Finance incentives to cover added maintenance cost reducing modal shift effect.
Operational objective
Resource indicators
average annual maintenance cost per wagon per country (per country and per tr.km);
wheel wear rate with K or LL brake blocks:
K or LL average cost
K or LL brake wear rate
Finance Finance incentives to cover added maintenance cost reducing modal shift effect.
Operational objective
Output indicator
percentage of cost covered by financial assistance
Identifying solutions for rail noise abatement measure assuring a minimal impact on total cost of rail services
Specific objective
Impact Indicator
Variation of freight transport costs on key corridors
Variation of freight transport revenues on key corridors
Regulate Identifying solutions to incentive the utilization of vehicle with lower emission (in term of mileage).
Specific objective
Impact Indicator
utilisation rate of silent fleet: percentage of wagon-km run by low noise wagons
Regulate Reduction of total noise emission level principally caused by freight trains
Specific objective
Result Indicator total noise reduction (dB)
Environmental effectiveness of the programmes
Regulate Identifying solutions to maximise the effectiveness of total noise reduction on affected population.
Specific objective
Result Indicator
noise reduction on affected population
18 The Impact Assessment Guidelines identifies there three levels of objectives:
general objectives are the overall goals of a policy and are expressed in terms of its outcome or ultimate impact; specific objectives, that are the immediate objectives of the policy (the target that first need to be reached in order
for the General Objectives to be achieved; operational objectives, that are normally expressed in terms of outputs that the intervention should produce.

98/129
Group of actions
Type of actions Actions Level of
objective18 Type of
indicator Indicator
Regulate Reduction of total emission noise on affected population and on particular Hot Spot
Specific objective
Result Indicator
noise reduction at particular “hot spots”
Monitoring of custom
procedures Regulate
Plan and structure the organization to develop the finance incentive and to monitor the actions plan.
Specific objective
Result indicator
Variation of the administrative costs;
number of people involved and number of people working within the organisation
Promote
Set up a Programme to establish an EU Rail Noise Abatement Measures Framework, involving potential data providers
General objectives
Impact indicator Number of data providers Develop a
statistics data system for rail
noise abatement measures Promote Voluntary statistics contributions from
industry on freight transport General
objectives Impact
indicator
Number of statistics contributions supplied by the stakeholders
Support innovation
RNAM Finance
Direct financing to projects & research activities aiming at RNAM (for instance lower maintenance cost for K and LL brake Blocks)
Operational objectives
Output indicators
Number of projects receiving financial assistance
Setting minimum standards applicable to "silent" labels wagon (for quick verification).
Specific objective
Result indicator
Number of rail freight transport operators that provide transport services with “silent” label wagons
Promoting a unique certification for wagon retrofitted with the replacement of brake system with silent solution
Specific objective
Result indicator
Number of logistics operators with a unique certification
Promote service and
environmental quality
certification
Promote
Establish a standard solution for the noise registration and classification in term of noise (to have a mapping of the silent and noise wagons)
Specific objective
Result indicator
Number of wagon registered
Regulate Harmonise freight train access charge rules along the key freight corridors
Specific objective
Result Indicator
variation of the track access charge (Bonus) per country
Promote
Examine and consult the stakeholders on the options of create a unique system for the differentiation of Track access charge.
n.a. Resource indicators
Number of people involved in the analyses
8.2 Monitoring and evaluation arrangements
According to the Commission’s rules of evaluation, all programmes have to be evaluated on a regular basis, so the second step after the identification of key indicators is to implement a reporting activity that will measure the extent of achievement of policy objectives.

99/129
Figure 8-1 – Monitoring and evaluation system
Translation of the Commission’s Policy into operative actions tobe undertaken by single MemberStatesCarrying out of the actionsabove
and continuous monitoring of Member States’ actions in order to evaluate to whatextent policy’s objectivesare being pursued
Identification of the actionsthe Member States shouldundertake to achieve the settled objectives
Periodic elaboration of reports based on the keyindicators identified in the Impact AssessmentTransmission of the reports to the Commission
Reporting
CONTROL SYSTEM
PlanningControl
3
4
5
Gap analysis betweenobjectives and reports’ resultsIdentification of possiblecausesDefinition of necessaryinterventions in order to fill the gaps and realign results to the objectivesActivities planning adjustment
Translation of the Commission’s Policy into operative actions tobe undertaken by single MemberStatesCarrying out of the actionsabove
Systematic and continuous monitoring of Member States’ actions in order to evaluate to whatextent policy’s objectivesare being pursued
Identification of the actionsthe Member States shouldundertake to achieve the settled objectives
Periodic elaboration of reports based on the keyindicators identified in the Impact AssessmentTransmission of the reports to the Commission
Monitoring
Reporting
CONTROL SYSTEM
Action plan Implementation
PlanningControl
3
4
Evaluation5
Gap analysis betweenobjectives and reports’ resultsIdentification of possiblecausesDefinition of necessaryinterventions in gaps and realign results to the objectivesActivities planning adjustment
11 22Translation of the Commission’s Policy into operative actions tobe undertaken by single MemberStatesCarrying out of the actionsabove
and continuous monitoring of Member States’ actions in order to evaluate to whatextent policy’s objectivesare being pursued
Identification of the actionsthe Member States shouldundertake to achieve the settled objectives
Periodic elaboration of reports based on the keyindicators identified in the Impact AssessmentTransmission of the reports to the Commission
Reporting
CONTROL SYSTEM
PlanningControl
3
4
5
Gap analysis betweenobjectives and reports’ resultsIdentification of possiblecausesDefinition of necessaryinterventions in order to fill the gaps and realign results to the objectivesActivities planning adjustment
Translation of the Commission’s Policy into operative actions tobe undertaken by single MemberStatesCarrying out of the actionsabove
Systematic and continuous monitoring of Member States’ actions in order to evaluate to whatextent policy’s objectivesare being pursued
Identification of the actionsthe Member States shouldundertake to achieve the settled objectives
Periodic elaboration of reports based on the keyindicators identified in the Impact AssessmentTransmission of the reports to the Commission
Monitoring
Reporting
CONTROL SYSTEM
Action plan Implementation
PlanningControl
3
4
Evaluation5
Gap analysis betweenobjectives and reports’ resultsIdentification of possiblecausesDefinition of necessaryinterventions in gaps and realign results to the objectivesActivities planning adjustment
11 22
The reporting package should include periodical issues and should be designed taking into account the following aspects:
information should be provided at different level of analysis report should enable the comparison vs. previous period report should ease the gap analysis vs. the policies’ objectives
In any case, to implement a reporting package is crucial to:
identify what kind of information has to be collected; define how to collect data; analyse soundness and reliability of the proposed methods and instruments for collecting,
storing and processing follow-up data; define the reports’ structure (level of aggregation, layout) settle the timing of the issues identify who will be responsible for collecting and organising data identify who are the final recipients ensure that the monitoring system works from the outset and that adequate legal provisions
are in place to ensure that data from Member States or third parties will be collected reliably and smoothly.
The challenge is to select and to record data that is relevant for the users at different levels or, in other words, not all available information should be transmitted to every level.
In order to establish an indicator system it is necessary to involve to the maximum possible the future suppliers and potential users of information. Already available information and existing monitoring system should be used, while also clarifying what additional, new indicators should be established in order to better meet information needs. The potential users of information are the stakeholders who have their own areas of responsibilities and, therefore, their distinctive information needs. The following table shows the main suppliers of information that should be involved in the monitoring process.
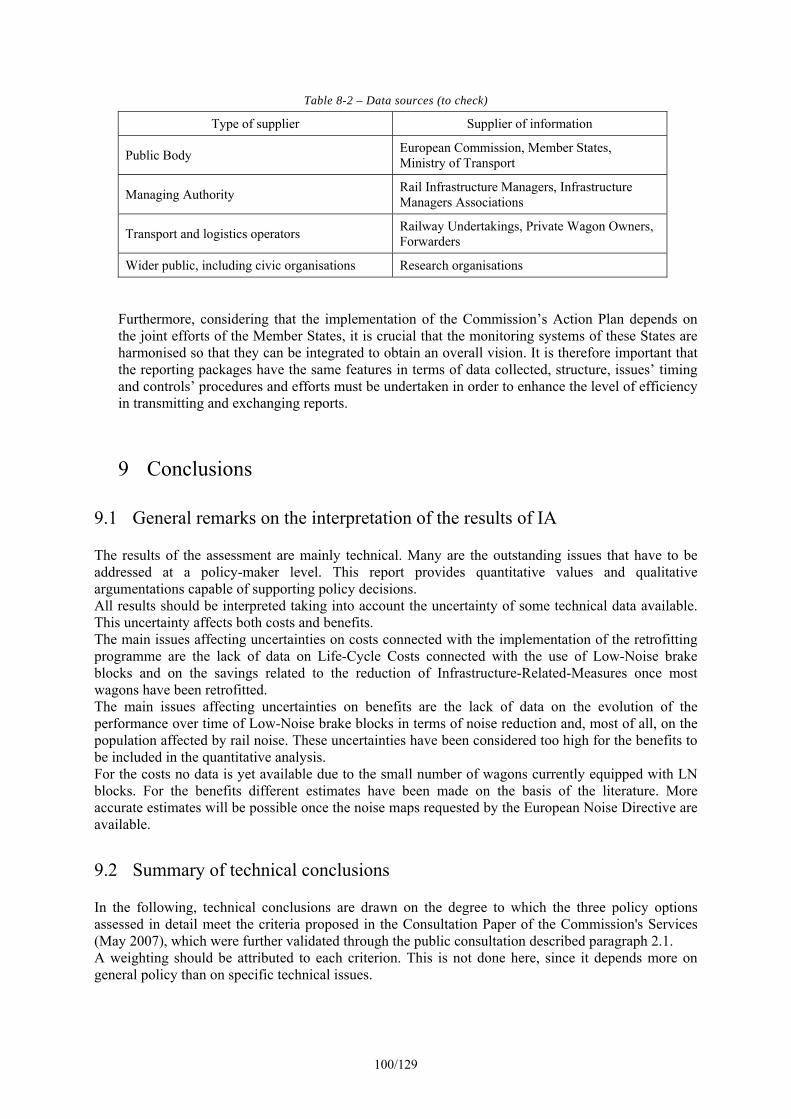
100/129
Table 8-2 – Data sources (to check)
Type of supplier Supplier of information
Public Body European Commission, Member States, Ministry of Transport
Managing Authority Rail Infrastructure Managers, Infrastructure Managers Associations
Transport and logistics operators Railway Undertakings, Private Wagon Owners, Forwarders
Wider public, including civic organisations Research organisations
Furthermore, considering that the implementation of the Commission’s Action Plan depends on the joint efforts of the Member States, it is crucial that the monitoring systems of these States are harmonised so that they can be integrated to obtain an overall vision. It is therefore important that the reporting packages have the same features in terms of data collected, structure, issues’ timing and controls’ procedures and efforts must be undertaken in order to enhance the level of efficiency in transmitting and exchanging reports.
9 Conclusions
9.1 General remarks on the interpretation of the results of IA The results of the assessment are mainly technical. Many are the outstanding issues that have to be addressed at a policy-maker level. This report provides quantitative values and qualitative argumentations capable of supporting policy decisions. All results should be interpreted taking into account the uncertainty of some technical data available. This uncertainty affects both costs and benefits. The main issues affecting uncertainties on costs connected with the implementation of the retrofitting programme are the lack of data on Life-Cycle Costs connected with the use of Low-Noise brake blocks and on the savings related to the reduction of Infrastructure-Related-Measures once most wagons have been retrofitted. The main issues affecting uncertainties on benefits are the lack of data on the evolution of the performance over time of Low-Noise brake blocks in terms of noise reduction and, most of all, on the population affected by rail noise. These uncertainties have been considered too high for the benefits to be included in the quantitative analysis. For the costs no data is yet available due to the small number of wagons currently equipped with LN blocks. For the benefits different estimates have been made on the basis of the literature. More accurate estimates will be possible once the noise maps requested by the European Noise Directive are available.
9.2 Summary of technical conclusions In the following, technical conclusions are drawn on the degree to which the three policy options assessed in detail meet the criteria proposed in the Consultation Paper of the Commission's Services (May 2007), which were further validated through the public consultation described paragraph 2.1. A weighting should be attributed to each criterion. This is not done here, since it depends more on general policy than on specific technical issues.

101/129
1. Effectiveness - Is the instrument suited to achieving the objective of the retrofitting exercise (equipping wagons with low-noise brake blocks, giving priority to vehicles with a high annual mileage)? To what extent? The effectiveness of the baseline scenario is considered to be the lowest. The Low-Noise wagons making up the fleet would be practically all new wagons. Different noise abatement policies would be implemented in the different countries. Retrofitting would be not be carried out in all countries, leading to low benefits in terms of overall noise reduction from this kind of instrument. Most noise abatement would derive from measures with relatively low cost-efficiency such as noise barriers. The SOV and the DEV options are both capable of ensuring the relatively high retrofitting rates (wagons / year) required to bring significant benefits at an early stage, provided sufficient funding is available. The definitive homologation of LL-blocks, for which no modifications to existing vehicles are required, would lead to the highest possible retrofitting rates (100% of LN wagons at the end of 2014 if all wagons built starting 1979 are retrofitted). In case LL-blocks are not homologated, retrofitting wagons built starting 1979 with K-blocks, which requires changes to the braking systems, could be completed within the end of 2016. A limit birthdate for eligibility of wagons to be retrofitted between 1979 and 1984 can be chosen according to the selected policy option so as to avoid limiting benefits in the retrofitting period when they are crucial. Effectiveness is better measured with the wagon-km run by LN wagons. In these terms the DEV option incorporates an incentive to give priority for retrofitting to vehicles with a high annual mileage in the fact that funds for retrofitting reaching a RU are a function of actual mileage. This incentive has to derive from a voluntary commitment of operators in the case of the SOV option. It can be seen however that costs and benefits are not extremely sensitive to this factor (see chapter 7: sensitivity analysis).
2. Suitability for wagons from other Member States - If measures are to be taken at national level, do they address foreign vehicles as well? This issue is not relevant if the EC addresses the noise abatement problem within all 18 countries considered in this Impact Assessment. These countries represent practically 100% of the standard-gauge fleet in Europe (and roughly 90% of the total fleet), thus the remaining Member States practically do not possess wagons capable of running on their networks. The countries with non-standard-gauge track cannot be addressed by the EC. The non-EU States whose wagons can run on the networks of the 18-IA countries (Balkan countries and Norway) account for just over 4% of the total fleet. These States may be incentivised to retrofit their wagons with the DEV option, due to the access charge bonus. However an agreement on their voluntary commitment would be appropriate. A voluntary commitment by these countries is essential for the SOV option.
3. Implementation time - How long will it take before the instrument will deliver tangible benefits? This criterion is strongly connected with effectiveness. It is crucial that benefits are achieved at the earliest possible stage, since the differences introduced by a retrofitting programme respect to the baseline scenario are highest in the early years of the programme, when the number of new wagons (with built-in LN technology) is small. Due to the nature of noise, benefits are tangible only once a large fraction of wagon-km (close to 100%) are run by LN wagons. In the baseline scenario the level of 100% of wagon-km run by LN wagons would probably be attained in the year 2030. The SOV and DEV options are both capable of reaching this target at the end of the year 2016 (K-blocks) and 2013 (LL-blocks), if all wagons built starting 1979 are retrofitted. However the DEV option requires a longer lead-in time for the development of a charging mechanism based on wagon-km instead of train-km and for a step towards harmonisation of charges. 4. Impact on competitiveness of rail transport – Does the instrument create obstacles to the use of rail freight transport, particularly on the main European corridors? Any action leading to a decrease in competitiveness of the rail sector is ruled out in this study (e.g. insufficient funding, excessive restrictions). In fact it is reasonable to assume that a reduction of t-km

102/129
transported by rail would lead to an almost equal amount of t-km on roads. There is a general agreement in the literature on the fact that the marginal external costs of road transport are higher than those of rail transport – thus the quest to reduce rail noise would lead to an increase of overall negative transport externalities (in particular of the overall noise generated by transport activities). The introduction of operating restrictions or noise emission ceilings is assumed to occur at a time in which almost all wagons have been retrofitted thus creating only minimal obstacles to the use, and to the development, of rail freight transport. Positive impacts on the competitiveness of rail transport may arise from the implementation of the policy options. A more efficient use of wagons deriving from voluntary commitment and, for the DEV option, also from economic incentivation connected with the noise bonus, would lead to savings for RUs and POs due to the lower number of wagons necessary to realise the t-km required by the market. The DEV option also incorporates a mechanism through which performant wagon owners could receive more funds than those strictly necessary to finance their retrofitting programmes (see also following point). Such over incentivation could lead to increased competitiveness of these stakeholders. 5. Efficiency - How high is the ratio of noise reduction / number of retrofitted wagons (wagon-km) to the cost of the exercise? The baseline scenario cannot lead to the entity of noise reduction attainable with retrofitting programmes. Retrofitting costs are obviously saved. However it is probable that the sum spent for Infrastructure-Related Measures would exceed the savings on retrofitting costs due to the greater entity of these measures in the absence of measures acting on the main source of noise, i.e. rolling noise of freight wagons. In fact it has been demonstrated that for a given benefit in terms of noise reduction Infrastructure-Related Measures require higher expenditure (EU-project STAIRRS). Regarding the efficiency of the policy options which include a retrofitting programme, for a given total cost for retrofitting (investment, added maintenance costs, added administrative costs) the DEV option leads to the requirement for higher funding than the SOV option, except perhaps in the case of retrofitting with LL-blocks in certain conditions. If the DTAC mechanism is based on a single value of bonus for all 18-IA countries, this value could not simply be calculated on the basis of the sum of the costs for retrofitting for all Owners and on an average yearly mileage of wagons. A large fraction of Owners would not be incentivised to retrofit by such a discount. The worst situation would be that of an Owner not already possessing LN wagons, not able to reach high average yearly mileages (particular service conditions, e.g. low average speeds, type of goods, origins and destinations, etc., not necessarily inefficient though), thus not able to run a sufficient number of “LN wagon-km”, and moreover incurring in relatively high unit costs for retrofitting. In order to incentivise this marginal Owner to retrofit, the value for the TAC bonus would have to be such that practically all other Owners would benefit from a surplus. This surplus could be quite high for Owners with new fleets running long distances. It is quantifiable only through a bottom-up approach examining all or most companies, for which contributions from each MS are required. The figures contained in this report may serve the purpose of supporting the consultation of stakeholders in this respect. A given total cost for retrofitting for both options means roughly the same number of total wagons retrofitted in the same time-frame. In the presence of an effective fleet management ensured by voluntary commitment in the SOV option, the “LN wagon-km” can be considered the same as for DEV. The benefits are thus roughly equal for a given total cost for retrofitting. The difference between the two options thus lies in the different entity of funding required. 6. Administrative feasibility and cost - Does the instrument create an additional administrative burden for the rail sector and what are the related costs? Both SOV and DEV options create additional administrative burdens for the rail sector. These are expected to be compensated by MS and/or EU in order to avoid affecting the competitiveness of the rail sector. The difference in added administrative costs between the DEV and SOV options, in favour of the latter, is negligible in terms of the evaluation of efficiency.

103/129
7. Consistency with the existing legal framework – Does the instrument fit into the existing European and national legal framework? The SOV option is the only one which could present difficulties in the current legal framework. It requires private companies (wagon owners) to be subsidised by MS or the EU to cover 100% of their costs. 8. Traceability of the results – Does the instrument easily allow its effects and costs to be monitored? As far as public funds are concerned, transparency is crucial to the scheme's credibility. With both SOV and DEV options the publishing of the amount of public funds received by stakeholders can be made compulsory. The noise reduction effect can be roughly calculated on the basis of these figures. In the case of noise emission ceilings enforced on the basis of noise measurements, the measured data can be used for monitoring purposes. A small number of measurement stations can be foreseen also within the SOV option. Monitoring of benefits is also possible through a frequent revision of noise maps. 9. Complementary nature – Is it possible to combine two or more instruments without any negative impact on their individual effectiveness and efficiency? No single instrument was believed to reach the required degree of effectiveness. The SOV and DEV options are the result of combinations of instruments. The main criterion used for the selecting the combinations was to avoid burdening one party with obligations while funding another party. 10. Effectiveness for hot spots – Is the instrument effective regarding the noise reduction for the population effected? This is important as retrofitted wagons do not automatically lead to a noise reduction as they have to be used preferably where many people are exposed to high noise levels (“hot spots”). Does the policy option allow a differentiation regarding location and time of day/night? Although not being capable of addressing all types of noise emitted by railway vehicles (as IRMs are), both the SOV and DEV options incorporate mechanisms which are partly effective for hot spots: operating restrictions and noise emission ceilings. However these mechanisms are to be introduced toward the end of the retrofitting programme, thus benefits would not be possible during the programme itself, i.e. when they would be crucial. A possibility to obtain early benefits, connected only with the DEV option, is to foresee differentiated bonus values according to the zones traversed by the LN wagons. Traversing a hot-spot could thus lead, for example, to a higher bonus. With the SOV option the only way to ensure early benefits deriving from abatement at the source is through voluntary commitment of RUs.
9.3 Open issues The following issues are not strictly technical, yet they are crucial for the choice between policy options:
overall importance of the rail noise problem – attribution of a value to the affected population;
coexistence of K-block retrofitted wagons and LL-block retrofitted wagons: this can create practical problems such as lack of incentive to retrofit with K-blocks when the possibility to retrofit with LL-blocks in the future is announced;
the importance of avoiding to subsidise private companies with public funds;
the weighting attributable to the efficiency criterion – an “inefficient” policy favours the rail sector more (White Book), potentially reducing overall negative externalities to a greater extent than an “efficient” policy;
the choice of a limit birthdate for wagons to be retrofitted (e.g. 1979, 1984 or intermediate years) – this influences total costs to a large extent.

104/129
ANNEX I - Questionnaire for the Stakeholder consultation and list of relevant Stakeholders
The purpose of this annex is to show the results of a consultation launched at the end of September 2007 to collect data and drivers (concerning rail noise affected population) for the assessment of the impacts of introducing measures which should reduce rail noise.
The data collection is necessary to build a database for the different scenarios of the future EC Communication for the rail noise abatement measures.
Eleven total contributions were received. Contributions came from 8 EU Member States, Norway and Switzerland.
In particularly a short questionnaire document has been developed and submitted to 28 countries19 in order to obtain basic information for the present study (cfr Annex 1), in particular:
1. number of people exposed to railway noise: according to the Directive 2002/49/EC (as specified by points 1.5 first paragraph and point 1.6 first paragraph, Annex VI of Directive 2002/49/EC), aggregated for all agglomerations with more than 250 000 inhabitants;
2. number of people exposed to railway noise as specified by point 2.5 first paragraph and 2.6
first paragraph, aggregated for the overall network of major railways with more than 60 000 trains per annum;
3. In the case where these data were not yet available, the number of kilometers of railways
where railway noise levels exceed national limit values. In the following table, some main indications coming from different countries are summarised. They were most of all represented by the Ministries of the Environment. In the last column are listed the comments received by some of the contacted Members. In most of the cases they specified the characteristics of their railways (most of all regarding the number of kilometres and the number of people living in the agglomerations) or of the works in progress to complete the noise map.
Table 0-1 Countries to whom the questionnaire was sent
COUNTRIES ANSWER Main Indication from the countries’ responses
AUSTRIA Y As they do not yet have the results for the number of affected people only the total length of the railway network within the scope of the environmental noise directive (>60000 trains per year) has been provided.
BULGARIA N -
BELGIUM Y The noise maps for railway noise in the region of Flanders (part of Belgium) are in the making but not yet available, neither for the agglomerations nor for the overall network.
CZECH REPUBLIC Y No major railways, in agglomerations railways (311km) + tramways (73km)
DENMARK N -
ESTONIA Y No major railways with more than 60 000 trains per annum in Estonia
FINLAND N -
19 All Member States were firstlyc contacted by email and then solicited to reply to the questionnaire by telephone

105/129
COUNTRIES ANSWER Main Indication from the countries’ responses
FRANCE N -
GERMANY Y They’ve sent this reference where is possible to find the measures may be implemented in packages or individually http://www.bmvbs.de/en/Transport/Railways-,2076/Noise-mitigation.htm
GREECE N -
HUNGARY N -
IRELAND N -
ITALY N -
LATVIA Y No major railways
LITHUANIA Y Only data for a single city (Vilnius)
LUXEMBOURG N -
THE NETHERLANDS N -
POLAND N -
PORTUGAL N -
ROMANIA N -
SPAIN N -
SLOVAK REPUBLIC N -
SLOVENIA Y Slovenian noise maps have not been finished yet and that the project is still going on. Slovenia is obliged to make noise maps for major railway E 67 Šentilj - Maribor - Zidani Most, section Celje - Maribor which has the length of 64 km
SWEDEN N -
UNITED KINGDOM Y They haven't yet finished their noise mapping and so they will have some difficulty in completing this
questionnaire at this stage
NORWAY Y
National limit value highlights indoor noise which should not exceed 42 dB. Regarding mapping of noise according to the EU directive (END), only the city of Oslo in Norway has more than 250 000 inhabitants and is subject to mapping. Major railways with more than 60 000 trains per annum are also restricted to the area around Oslo (the county of Akershus). Noise mapping is in progress and we hope that data will be available in December this year.
SWITZERLAND Y See Table 2 and 3
TURKEY N -
In Table 2 are listed the answer received ranked for agglomerations with more than 250.000 inhabitants. Unfortunately just four Countries responded us providing data which can be useful to our aim; the others declared they are in the way to prepare the map noise. Looking at the available data it can be asses that in one case (Czech Republic) people who are exposed to railway noise are more during the day than during the night; in the other case (Lithuania) the data shows an opposite situation. The third case, the Switzerland one, shows an identical situation for day and night. Norway asserts that only the city of Oslo has more than 250 000 inhabitants and as at today is subject to mapping.

106/129
Table 0-2 Responses received clustered for agglomerations with more than 250000 inhabitants
Number of people exposed to RAILWAY NOISE aggregated for all agglomerations with more than 250 000 inhabitants.
DAY NIGHT
Db Range 55-59 60-64 65-69 70-74 >75 50-54 55-59 60-64 65-69 70-74 >75
AT na na na Na na na na Na na na Na CZ 95100 67600 38500 16600 3700 92300 54200 32900 8700 2200 400
EE na na na Na na na na Na na na Na DE na na na Na na na na Na na na na LT 3500 2900 1400 900 200 5400 3600 2400 1400 900 -
SL na na na na na na na Na na na na UK na na na na na na na Na na na na NW na na na na na na na Na na na na CH na na 265000 na 265000
Source: PwC Elaboration (2007) In Table 3 are listed the answer received clustered for the number of people aggregated for the overall network of major railways with more than 60 000 trains per annum. Even for this question few Countries (Lithuania, Switzerland, Norway and Latvia) responded us supplying data. Latvia answered they don’t have major railways. Lithuania shows a higher degree of exposition during the night than during the day and the opposite situation has been shown by the Czech Republic; Switzerland, as before, supplied the same percentage for days and night. Concerning Norway, they do not exceed the national limit value20 anywhere. Austria provided us only the Rail Noise Critical length of line, equal to 603, 9 kilometres.
Table 0-3 Responses received clustered for network of major railways with more than 60 000 trains / year
Number of people exposed to RAILWAY NOISE aggregated for the overall network of major railways with more than 60 000 trains per annum.
DAY NIGHT
Db Range 55-59 60-64 65-69 70-74 >75 50-54 55-59 60-64 65-69 70-74 >75
AT na na na na na na na Na na na na BE na na na na na na na Na na na na
EE na na na na na na na Na na na na
DE na na na na na na na Na na na na
LV na na na na na na na Na na na na
LT 1800 1600 800 500 100 2800 1900 1300 800 500 na
SL na na na na na na na Na na na na
UK na na na na na na na Na na na na
NW NO NO NO NO NO NO NO NO NO NO NO
CH na na 265000 Na 265000
20 Their national limit value highlights indoor noise which should not exceed 42 dB

107/129
Source: PwC Elaboration (2007) Unfortunately as at this stage no conclusion can be met, because of the lacking of the available data.

108/129
ANNEX II – Investment and Life Cycle Cost Relating the cost for retrofitting a single wagon, as considered by the main literatures, could range from 4.500 € to 13.000 € per wagon depending on:
1. Number of axles and type of wagon; 2. Purchase of components 3. Labour cost for the replacement (retrofitting programme); 4. The cost of testing and accepting the retrofitted vehicle 5. Cost for withdrawal of the vehicle for service.
1. The number of axles and type of wagon
According to the most recent analysis carried out for UIC/UIPUIRR wagons, 30% of the EU-25 fleet has been considered made up of 2-axle wagons and 70% of 4-axle wagons;
2. The purchase of the components to be replaced, in particular:
Cost of different brake blocks: the following table shows the different price values considered by different sources. Prices depend on type of brake block (320 mm circumferential with 2bg mode – 2 brake blocks per wheel or 250 mm circumferential with 2bgu mode – 4 brake blocks per wheel).
UIC Noise Action
Programme
Sour
ce 1
21
Sour
ce 2
18
Sour
ce 3
18
Sour
ce 4
18
Sour
ce 5
22
Sour
ce 6
PwC Value
Cast IRON Brake Shoes Bd Size 6 10-11 10-12 7 7 € 7
Bgu Size 5 6 6 € 6
Composition K Brake Blocks Bd Size 28 14-21 31 50-70 23-30 28 € 28,00
Bgu Size 23 23 € 23,00
Composition LL Brake Blocks Bd Size 11 28 € 28,00
Bgu Size 40-50 23 € 40,0023
The price of a K block has been fixed at 23€ per shoe (accordingly with real cost figures given by different Railway undertakings). The price of an LL Brake Block has bees fixed at 40€ per shoe.
New brake cylinder: the purchase price of a brake cylinder could range between 700 and 1000 €;
“empty-load valve” (could require replacement when cylinder is replaced): the valve could range between 900 and 1350 €
21AEA Technology: “Status and Option for the reduction of noise emission from the European rail freight Traffic". 22 Trenitalia S.p.A 23 An annual price reduction has been considered in the analysis.

109/129
3. Labour cost of the replacement.
For the complete retrofit a range between 3 and 6 man-day per wagon and a cost per hour from 41 to 53 € have been considered.
Cost for Man hours Total hours Man-day Tot h Low High Low High 2 Axles 3 24 41 53 984 1272 4 Axles 6 48 41 53 1968 2544
Thus the total labour cost ranges between 950 and 2500. For the Impact Assessment the value taken is 1700 € per wagon.
4. The cost of testing and accepting retrofitted vehicle.
According AEA Technology literature24, the testing cost has been considered of 400€ per wagon
5. Cost for withdrawal from service of the vehicle:
Costs for unavailability and transfer will be avoided because the retrofitting programme is considered to be combined with the regular overhaul of wagons that takes place typically every 6-8 years;
The following table shows different costs of the total retrofitting programme with K-brake blocks for one wagon, considering the differentiation of parameters described above.
% OF WHEEL REPLACEMENT
0% 15% 30%
2 axles 4 axles 2 axles 4 axles 2 axles 4 axles
YES
€ 4,868 € 8,336 € 8,272 € 6,756 € 11,512
Ave
.
€ 3,668 € 7,136 € 7,072 € 5,556 € 10,312
CO
ST F
OR
R
ET
RO
FIT
TIN
G
Bra
ke C
ylin
der
and
Em
pty/
load
val
ve
NO
€ 2,468 € 5,936 € 5,872 € 4,356 € 9,112
On the basis of the above assumptions, for the purpose of the Impact Assessment the total cost for retrofitting with K-blocks has been considered of 7.000 € per wagon.
The following table shows different costs of the total retrofitting programme with LL-brake blocks for one wagon, considering the differentiation of parameters described above.
24 Status and Option for the reduction of noise emissions from the European rail freight Traffic.

110/129
% OF WHEEL REPLACEMENT
0% 15% 30%
2 axles 4 axles 2 axles 4 axles 2 axles 4 axles
€ 545 € 545 € 1,362 € 1,505 € 2,465
On the other hand retrofitting using LL-Blocks could be significantly less expensive: in the analysis, only direct costs (as work and stock), cost for wheel replacement and cost for brake blocks will be considered for LL-Blocks. Thus, the total cost for retrofitting with LL-blocks has been considered of 1.360 € per wagon.
P) LCC and added Maintenance costs Because of importance of ware rate, in this section it will analyse different valuation of the principal factors that influence maintenance, in particular:
1. Mileage of wagons (considered in sensitivity analysis) 2. Characteristics of wagon operation; 3. Lifetime of wheels; 4. Type and lifetime of brake blocks; 5. Labour cost of replacement; 6. Cost for brake blocks disposal
1. Mileage wagon: (considered in sensitivity analysis)
2. Characteristics of wagon operation such as average speed, type of track, average freight weight carried: for instance when long stretches of undisturbed operation are possible (long distance transport), block wear can be lower than where much interference occurs.
3. Lifetime of wheels
The lifetime of the wheel depends on:
different brake block solutions used (that cause different wheel wear): according to some documents, it has been considered that composition-brake-blocks would lead to higher wheel wear in comparison with cast iron brake. It is possible that the use of blocks of a new design could lead to different evolution in time of tread profiles, according also to the different types of track encountered (rail inclination, shape of rail-head etc.). In turn, these unusual tread profiles may lead to higher reprofiling rates for example due to the onset of running instability. Until further information is available on tread profile evolution, for reasons of caution the higher values estimated for reprofiling rates will be assumed for the Impact Assessment.
rejection of running surface and wheel defects in general (for instance wheel flats, cracks, wear, tread collapse) that cause wheel reprofiling;
standard reprofiling process: in particular, it has been considered that the reprofiling rate with the K-Block solution is 35% more that reprofiling rate with cast iron solutions25;
25 Source report of Lloyd’s Register: IPG Whispering Trains (Jasper Peen, Bellinzona, 2007)

111/129
The following table shows values of each parameter related to wheel wear rate (different sources have been considered), specific values chosen within the Impact Assessment.
Source26 Source27 Source28 Source29 Values for Policy Option IA
WAGON LIFE Years 30 40 35
Number of reprofiling during life span N 5,8 4 5 5
Wheel defects (km to reprofiling) Km
Wheel wear with cast iron blocs (red.) mm / 100.000 km 0,5 1 1 1 1
Wheel wear with K Blocks (red.) mm / 100.000 km 3.2 2 1.5 1.65 2
Wheel wear with LL Blocks (red.) No inf.24 2 3 2
km to wheel reprofiling
with cast iron blocks Km 350.000 306.000 306.000 306.000 350.000
With composition K blocks Km 230.000 254.000 277.000 270.000 230.000
With composition LL block Km 230.000 n.d. n.d. n.d. 230.000
4. Type and lifetime of brake blocks:
K or LL Blocks have a lower block wear than cast iron blocks. According to different sources, it has been assumed that:
o the wear rate for K Blocks is 3 times less than that of cast iron blocks;
o the wear rate for LL Blocks is 4 times less than that of cast iron blocks (however there is no confirmation on the matter: there are no data on the real wear rate);
The following table shows different values of each parameter related to average block wear (related to different sources), specific values chosen for the Impact Assessment.
Source 125 Source 226 Source 327 Values for Policy Option IA
PO
Average block wear
cast iron blocks mm / 100.000 Km 52,3 100 52 52
K blocksS mm / 100.000 Km 16,8 33 31 17
LL blocks mm / 100.000 Km
Block wear Limit
cast iron blocks mm 35 35
K and LL blocks mm 40 40 40
5. Labour cost of replacement .
26 LLOYD REGISTER (no influence on wheel wear with LL blocks solution has been considered) 27 SBB/DB/SNCF/MAV 28 Trenitalia S.p.A (Italian Railway Undertaking). 29 Associazione Italiana Acustica: “BETRIEBSERFAHRUNGEN DER HUPAC AG MIT K-SOLEN” (average on different figures)

112/129
- The labour for the complete replacement of the brake blocks has been estimated at 2-3 man-h (120 € per wagon per replacement). This value has been considered the same for all types of brake block (not variable according to the brake block solution).
- The labour for the complete reprofiling of the wheels has been estimated at 2 man-day (almost 16h): 160 € per axle (+ 40% for machinery).
- The labour for the complete replacement of the axle (only for wheel changing) has been estimated at 1 man-day per axle (350 € per axle).
6. Disposal Cost The following table shows different disposal costs.
DISPOSAL COST Unit K block LL block
Mass of new brake blocks (per block) Kg 4,00 8,00
Percentage of mass reduction during service % 67% 67%
Final mass (per shoe) Kg 2,67 5,33
Cost for Disposal (€ per ton) (€ per ton) € 500,00 € 500,00
Total tons per 100.000 Km (per wagon) 0,023 0,031
DISPOSAL total COST - per 100.000 Km per wagon € 11,80 € 15,73

113/129
ANNEX III Screening of the policy options The proposed screening process has been developed in two different independent steps:
1. A preliminary qualitative identification of policy impact focus on the different effect on main stakeholder;
2. a structured screening against assessment specific criteria: the criteria include effectiveness, efficiency and consistency (as recommended by the EC Impact Assessment Guidelines), suitability, implementation time, impact of competitiveness of rail transport, administrative feasibility and cost, traceability of the result, complementary nature, effectiveness for hot spot.
As it is showed in the following figure, from the combination of the two approaches, different policy option will be eliminated.
Figure 0-1: Diagram of qualitative Policy Option screening
• Effectiveness• Suitability• Implementation time• …• …
Structured Screening Criteria
• Impact on main stakeholder
• Preliminary assessment
• …
Preliminary Assessment Process
Policy Option to be Assessed
COMPARISON and
COMBINATION
• Effectiveness• Suitability• Implementation time• …• …
Structured Screening Criteria
• Impact on main stakeholder
• Preliminary assessment
• …
Preliminary Assessment Process
Policy Option to be Assessed
COMPARISON and
COMBINATION
Preliminary identification of impacts The following tables give a qualitative preliminary indication of the policy options screened and their impacts on the most relevant stakeholders.
C: Financial incentives for retrofitting
Policy option Description Impacts on main stakeholders Preliminary assessment
C1. Differentiated Track Access Charges – bonus-malus
charging scheme is modified; TAC increase for ‘noisy’ wagons, TAC decrease for ‘quiet’ wagons
- RU: initial transient cost-increase, steady-state gain;
- IM: initial transient revenue increase, steady-state loss (possibly compensated by cost-reduction for infrastructure related measures) – will not agree if potential initial loss
- MS: possibily no additional costs but it is difficult to avoid
- a charging mechanism based on wagons (not trains) is needed
- legal measures necessary to regulate the changes in charging mechanisms must be temporary
- transfer of retrofitting funds to private owners is a possible problem

114/129
C: Financial incentives for retrofitting
Policy option Description Impacts on main stakeholders Preliminary assessment state intervention
- customers: may shift to other modes in initial stages unless an incremental mechanism for charges is in place and in the long-term if funding is insufficient
- track access mechanism is sensitive and might be difficult to manage
- transient phase is difficult to manage
- stand-alone option only if funds exceed retrofitting costs
C2. Differentiated Track Access Charges – bonus
charging scheme is modified; TAC decrease for ‘quiet’ wagons
- RU: initial and steady-state cost decrease, competitive advantage for ‘quiet’ carriers’
- IM: almost neutral, small administrative costs; IM may accept a slight revenue decrease if compensated by savings in infrastructure related measures, although the railway sector continues to bear the costs of noise reduction – excess funds to be used for infrastructure related measures
- MS: direct financing to IMs
- customers: not initially incentivated to shift towards other modes, initial cost decrease; potential long-term shift if compensation to IMs is too small
a charging mechanism based on wagons (not trains) is needed
legal measures necessary to regulate the changes in charging mechanisms
transfer of retrofitting funds to private owners is a possible problem
stand-alone option only if funds exceed retrofitting costs
C3. Subsidies for the use of low-noise wagons
RU receives funding proportional to the number of new or retrofitted wagons for which a track path is used
- RU: depends on entity of subsidies
- IM: probably neutral – potential reduction in infrastructure-related measures
- MS: direct financing to RUs
- customers: incentivated to shift towards other modes if subsidies are insufficient
addresses wagons coming from outside the EU
voluntary commitment of RUs needed to compel private owners to retrofit
transfer of retrofitting funds to private owners is a possible problem
stand-alone option only if funds exceed retrofitting costs
C4. Subsidies for retrofitting
RU/owners receive funding proportional to the number of retrofitted wagons
- RU: depends on entity of subsidies
- IM: probably neutral – potential reduction in infrastructure-related measures
- MS: direct financing to RUs
- customers: incentive to shift towards other modes if subsidies are insufficient
stand-alone option only if funds exceed retrofitting costs
does not automatically incentive high-mileage wagons
C5. Loans at preferential terms
funds are transferred from a financial institution to wagon
- RU: receive direct funding – costs for retrofitting are borne by RU
least expensive for MS among financial incentives

115/129
C: Financial incentives for retrofitting
Policy option Description Impacts on main stakeholders Preliminary assessment owners; MS compensate for preferential rates
- IM: probably neutral – potential reduction in infrastructure-related measures
- private owners receive direct funding
- MS: compensation for preferential interest rates
- customers: incentivated to shift towards other modes
not incentivated as a stand-alone option
penalising for the railway sector which bears the whole cost of retrofitting
C6. Tax incentives
MS introduces incentives in terms of VAT or revenue tax for RU/owners retrofitting wagons
- RU/private owners: cost increase for retrofitting partially compensated by reduction in tax
- IM: neutral
- MS: decrease in tax
- customers: price increase
relatively inexpensive for MS
not incentivating as a stand-alone option - too penalising for the railway sector which bears a large part of retrofitting costs
D: Legal measures to impose retrofitting
Policy option Description Impacts on main stakeholders Preliminary assessment
D1. Noise limit values for the existing fleet
limits for new wagons are extended to existing ones; type tests are carried out on various wagon types with composite brake blocks and consequent emission limit are fixed; penalties are applied to non-compliant RUs/owners
- RU/wagon owners: should receive funds to retrofit
- IM: possible cost reduction due to decrease in requirements for infrastructure-related measures
- MS: necessarily identifies a funding mechanism
- customers: strong
tests are necessary
if homologation-like processes cannot be avoided the feasibility is strongly reduced for complexity and additional cost
does not preclude other technologies
requires economic incentives
not incentivating as a stand-alone option - too penalising for the railway sector which bears a large part of retrofitting costs
D2. Operating restrictions for noisy freight wagons
wagons not equipped with approved noise reduction devices are not allowed on certain lines (e.g. corridors)
- RU: possible restrictions on train composition which potentially strongly affects fleet management costs; using lines with no restrictions may be more convenient than retrofitting
- IM: possible cost reduction due to decrease in requirements for infrastructure-related measures
restrictions reducing infrastructure capacity may be necessary
the entity of restrictions for lines/hot spots must be carefully calibrated for retrofitting to be incentivated
not incentivating as a stand-alone option - too penalising for the railway sector which bears a large part of retrofitting costs
D3. Noise emission ceiling
measurement sites are installed at hot spots; IM checks
- RU: possible restrictions on train composition which potentially strongly affects fleet
interactions among stakeholders are complex

116/129
D: Legal measures to impose retrofitting
Policy option Description Impacts on main stakeholders Preliminary assessment daily limit and; MS checks enforcement; restrictions to noisy wagons are devised and applied by agreement among stakeholders
management costs;
- IM: possible cost reduction due to decrease in requirements for infrastructure-related measures; costs for measurements and development of algorithms
- MS: checks enforcement
not incentivating as a stand-alone option - too penalising for the railway sector which bears a large part of retrofitting costs
Screening against assessment criteria
The preliminary screening was carried out by assessing the initial list of policy options (Table 0-1) against the criteria listed below. In the subsequent Impact Assessment PwC will develop a description of the attributes of each policy option so that it is possible to start to differentiate between them in terms of how well they are likely to perform against these same criteria.
The criteria include effectiveness, efficiency and consistency, as recommended by the EC Impact Assessment Guidelines. They include also additional criteria specific to the study, all positively rated by the participants to the public consultation issued by the Commission services. As a consequence of the comments received the criterion initially named “Impact on transport policy” was better specified as “Impact on competitiveness of rail transport” and an additional criterion, “Effectiveness for hot spots” was added in consideration of the importance of addressing with high priority geographical areas in which rail noise is particularly disturbing.
Table 0-1: Criteria for Policy Option preliminary screening
N Criterion Description
1 Effectiveness Is the instrument suited to achieving the objective of the retrofitting exercise (equipping wagons with low-noise brake blocks, giving priority to vehicles with a high annual mileage)? To what extent?
2 Suitability for wagons from other Member States
If measures are to be taken at national level, do they address foreign vehicles as well?
3 Implementation time How long will it take before the instrument will deliver tangible benefits?
4 Impact on competitiveness of rail transport
Does the instrument create obstacles to the use of rail freight transport, particularly on the main European corridors?
5 Efficiency How high is the ratio of noise reduction/ number of retrofitted wagons (wagon-km) to the cost of the exercise?
6 Administrative feasibility and cost
Does the instrument create an additional administrative burden for the rail sector and what are the related costs?
7 Consistency with the Does the instrument fit into the existing European and national legal framework?

117/129
existing legal framework
8 Traceability of the results
Does the instrument easily allow its effects and costs to be monitored? As far as public funds are concerned, transparency is crucial to the scheme's credibility.
9 Complementary nature
Is it possible to combine two or more instruments without any negative impact on their individual effectiveness and efficiency?
10 Effectiveness for hot spots
Is the instrument effective regarding the noise reduction for the population effected? This is important as retrofitted wagons do not automatically lead to a noise reduction as they have to be used preferably where many people are exposed to high noise levels (“hot spots”). Does the policy option allow a differentiation regarding location and time of day/night?
The ten following tables illustrate the rating of the policy options for each of the ten criteria.
Table 0-2: Screening of policy options and instruments – Effectiveness
Effectiveness: Is the instrument suited to achieving the objective of the retrofitting exercise (equipping wagons with low-noise brake blocks, giving priority to vehicles with a high annual mileage)? To what extent?
Evaluation Comments
Voluntary commitment -/0 Not legally binding and no economic incentives, however, priority to vehicles with high mileage possible
Differentiated track access charges
0 Only indirect impact, but incentive to give priority to vehicles with high mileage; problem of economic advantage to be transferred to wagon keeper
Subsidies for the use of low-noise wagons
0 Only indirect impact, but incentive to give priority to vehicles with high mileage; problem of economic advantage to be transferred to wagon keeper
Subsidies for retrofitting + High effectiveness due to direct impact; financial aid directly to keeper
Loans at preferential terms - Low economic incentive
Tax incentives - Low economic incentive (tax reduction only provides limited cost reduction)
Noise limit values for the existing fleet
+ Legal measures are in general relatively effective
Operating restrictions for noisy freight wagons
0/+ Legal measures are in general relatively effective; potential problems with enforcement
Noise emission ceiling /+ Legal measures are in general relatively effective; potential problems with enforcement
Table 0-3: Screening of policy options and instruments – Suitability for wagons from other Member States
Suitability for wagons from other Member States. If measures are to be taken at national level, do they address foreign vehicles as well?
Evaluation Comments

118/129
Suitability for wagons from other Member States. If measures are to be taken at national level, do they address foreign vehicles as well?
Evaluation Comments
Voluntary commitment +/0 High in case of commitment at European level
Differentiated track access charges + High (equal treatment of all wagons)
Subsidies for the use of low-noise wagons
0 In theory high, but doubts if subsidies given for foreign wagons
Subsidies for retrofitting -/0 strong doubts if subsidies given for foreign wagons
Loans at preferential terms + High (no restrictions to certain MS)
Tax incentives - Low: only for RUs/ keepers paying taxes in the respective MS
Noise limit values for the existing fleet + If imposed at EU level
Operating restrictions for noisy freight wagons
+ Equal treatment of all wagons
Noise emission ceiling + Equal treatment of all wagons
Table 0-4: Screening of policy options and instruments – Implementation Time
Implementation time. How long will it take before the instrument will deliver tangible benefits?
Evaluation Comments
Voluntary commitment 0 Potentially fast, but missing legal obligations could lead to delays
Differentiated track access charges
0/+ Depends on bonus and strategy of keepers, could accelerate retrofitting if limited in time
Subsidies for the use of low-noise wagons
0/+ Depends on amount of subsidy and strategy of keepers, could accelerate retrofitting if limited in time
Subsidies for retrofitting + Could be fast, depends on design of subsidy scheme and use of existing funds
Loans at preferential terms - Slow implementation could be expected (low incentive)
Tax incentives - Slow implementation could be expected (low incentive)
Noise limit values for the existing fleet
0 Time for adoption of legislation + transition period
Operating restrictions for noisy freight wagons
0/+ Faster to implement than limit values or noise emission ceiling
Noise emission ceiling 0 Development of scheme is rather complex and therefore time-consuming
Table 0-5: Screening of policy options and instruments – Impact of competitiveness of rail freight
Impact on competitiveness of rail freight. Does the instrument create financial burdens for railways/ obstacles to the use of rail freight transport, particularly on the main European corridors?

119/129
Evaluation Comments
Voluntary commitment 0 Ensures competitiveness, but financial contributions of sector would increase costs
Differentiated track access charges 0/+ Depends on system: bonus or bonus/malus scheme (with compensation for IM); mileage of wagons
Subsidies for the use of low-noise wagons
+ Depends on amount of subsidy and mileage of wagons
Subsidies for retrofitting + Could be cost-neutral for sector
Loans at preferential terms - Incentive is rather limited
Tax incentives -/0 significant contribution of sector required
Noise limit values for the existing fleet -/0 High additional costs for sector (only if short transition periods foreseen)
Operating restrictions for noisy freight wagons
- High additional costs for sector, but not as high as for limit values as this instrument is more focussed; limits network capacity
Noise emission ceiling -/0 High additional costs for sector, but flexibility for sector for cost-effective implementation; limits network capacity (but less than operating restrictions do)
Table 0-6: Screening of policy options and instruments – Efficiency
Efficiency. How high is the ratio of noise reduction/ number of retrofitted wagons (wagon-km) to the cost of the exercise? The costs are considered at macro level. Priority to high performing wagons is regarded as contribution to efficiency.
Evaluation Comments
Voluntary commitment + Provides incentives to sector to ensure efficiency (focussed retrofitting; sector's financial contribution avoids overrunning costs)
Differentiated track access charges 0/+ Strong incentive for focussed retrofitting, but risk of 'overcompensation' for high performing wagons
Subsidies for the use of low-noise wagons
0/+ Strong incentive for focussed retrofitting, but risk of 'overcompensation' for high performing wagons
Subsidies for retrofitting -/0 No incentive for focussed retrofitting in case of 100% funding; partly funding ensures efficiency to some extend
Loans at preferential terms + Strong incentive for focussed retrofitting as high contribution of sector required
Tax incentives + Strong incentive for focussed retrofitting as high contribution of sector required
Noise limit values for the existing fleet 0 Requires retrofitting of whole fleet (very in-efficient; only if no transition period foreseen), but scrapping/ replacement of old wagons can be expected; high incentive for sector to limit costs
Operating restrictions for noisy freight wagons
0 Requires retrofitting of significant parts of the fleet (expected to be in-efficient), but scrapping/ replacement of old wagons can be expected; high incentive for sector to limit costs

120/129
Efficiency. How high is the ratio of noise reduction/ number of retrofitted wagons (wagon-km) to the cost of the exercise? The costs are considered at macro level. Priority to high performing wagons is regarded as contribution to efficiency.
Evaluation Comments
Noise emission ceiling + Leaves freedom to sector to optimise composition of fleet
Table 0-7: Screening of policy options and instruments – Administrative feasibility and cost
Administrative feasibility and cost. Does the instrument create an additional administrative burden for the rail sector and what are the related costs?
Evaluation Comments
Voluntary commitment + No bureaucracy to be expected; however, agreement and monitoring scheme required
Differentiated track access charges
0 Additional burdens due to more complex track access charging scheme (likely to be calculated based on single wagons and not on full trains as today); however, existing financial flow can be addressed
Subsidies for the use of low-noise wagons
- Funding schemes with interface to data on track access charges/ train composition required; new financial flow from state to keeper: more complex than C1
Subsidies for retrofitting
0/+ Funding schemes in-line with state aid provisions required; transparency of costs/ reporting system needed
Loans at preferential terms
0 Design of appropriate projects required
Tax incentives + VAT reduction for composite brake blocks without significant administrative burden possible
Noise limit values for the existing fleet
0 Implementation of concept of 'in-use-compliance' required; medium administrative burden if no tests required to demonstrate compliance
Operating restrictions for noisy freight wagons
0 Requires more complex train paths management; difficult enforcement
Noise emission ceiling -/0 Complex calculations for each line, complicated train paths management; measurements required? difficult enforcement
Table 0-8: Screening of policy options and instruments – Consistency with the existing legal framework
Consistency with the existing legal framework. Does the instrument fit into the existing European and national legal framework?
Evaluation Comments
Voluntary commitment + No legal basis needed
Differentiated track access charges
+ Explicitly foreseen in Article 7 (5) of Directive 2001/14/EC
Subsidies for the use of low-noise wagons
0 Could be based on Article 10 of Directive 2001/14/EC; national legal basis to be put in place; compliance with state aid rules to be ensured

121/129
Consistency with the existing legal framework. Does the instrument fit into the existing European and national legal framework?
Evaluation Comments
Subsidies for retrofitting
0 National legal basis to be put in place; compliance with state aid rules to be ensured
Loans at preferential terms
+ No legal basis needed
Tax incentives 0 National legal basis to be put in place
Noise limit values for the existing fleet
-/0 Implementation of concept of 'in-use-compliance' required which is today not foreseen in the legal interoperability framework (however, this might be changed by the cross-acceptance proposal)
Operating restrictions for noisy freight wagons
0 Could be based on Article 8 of Directive 2002/49/EC; national legal basis to be put in place
Noise emission ceiling 0 Could be based on Article 8 of Directive 2002/49/EC; national legal basis to be put in place
Table 0-9: Screening of policy options and instruments – traceability of the result
Traceability of the results. Does the instrument easily allow its effects and costs to be monitored? As far as public funds are concerned, transparency is crucial to the scheme's credibility.
Evaluation Comments
Voluntary commitment 0/+ Monitoring could be part of commitment
Differentiated track access charges
0/+ Track access charges revenues are in principle publicly available; noise reduction effect can be calculated on this basis
Subsidies for the use of low-noise wagons
+ Subsidies need to be published; noise reduction effect can be calculated on this basis
Subsidies for retrofitting + Subsidies need to be published; noise reduction effect can be calculated on this basis
Loans at preferential terms + EIB loans are in principle published; noise reduction effect can be calculated on this basis
Tax incentives + Tax revenues are in principle published; noise reduction effect can be calculated on this basis
Noise limit values for the existing fleet
0 Noise reduction effect can be calculated; no information on financial impact available
Operating restrictions for noisy freight wagons
0 Noise reduction effect can be calculated; no information on financial impact available
Noise emission ceiling 0 Noise reduction effect can be calculated; no information on financial impact available
Table 0-10: Screening of policy options and instruments – Complementary nature
Complementary nature. Is it possible to combine two or more instruments without any negative impact on their individual effectiveness and efficiency?
Evaluation Comments

122/129
Complementary nature. Is it possible to combine two or more instruments without any negative impact on their individual effectiveness and efficiency?
Evaluation Comments Voluntary commitment + Fits well to other options (less to legal instruments)
Differentiated track access charges
0/+ Fits to voluntary and legal instruments, not to subsidies and tradable permits
Subsidies for the use of low-noise wagons
-/0 Fits to voluntary and some legal instruments, not to other financial instruments
Subsidies for retrofitting -/0 Fits to voluntary and some legal instruments, not to other financial instruments
Loans at preferential terms 0/+ Fits to voluntary and legal instruments, not to subsidies
Tax incentives 0/+ Fits to voluntary and legal instruments, not to subsidies
Noise limit values for the existing fleet
0 Fits to some financial instruments, less to other legal instruments and voluntary commitments (depends on transition period foreseen)
Operating restrictions for noisy freight wagons
0 Fits to some financial instruments, less to other legal instruments and voluntary commitments
Noise emission ceiling 0 Fits to some financial instruments, less to other legal instruments and voluntary commitments
Table 0-11: Screening of policy options and instruments – capability to address hot spots
Capability to address hot spots. Is the instrument able to address noise hot spots with priority?
Evaluation Comments
Voluntary commitment + A commitment could focus on certain lines or corridors
Differentiated track access charges
0 Bonus for certain lines or corridors possible, but adds more complexity to the schemes
Subsidies for the use of low-noise wagons
0 Bonus for certain lines or corridors possible, but adds more complexity to the schemes
Subsidies for retrofitting -/0 No direct link to hot spots; however, wagons used on certain corridors could be given priority
Loans at preferential terms -/0 No direct link to hot spots; however, wagons used on certain corridors could be given priority
Tax incentives - No link to hot spots
Noise limit values for the existing fleet
- No link to hot spots
Operating restrictions for noisy freight wagons
+ Restrictions could explicitly focus on hot sport
Noise emission ceiling + Ceilings could explicitly focus on hot sport
In order to get a clear ranking of the policy options assessed, a simple quantification is carried out using following factors and an equal treatment of all criteria:
+: 1.0
0/+: 0.75
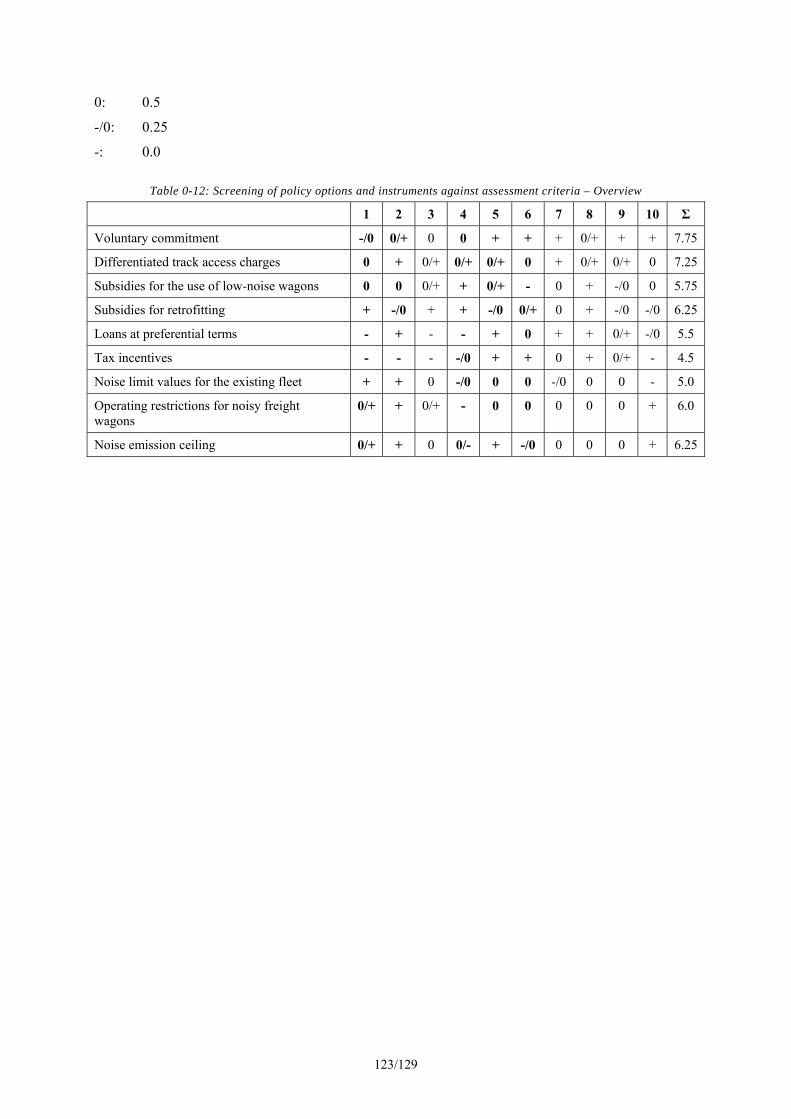
123/129
0: 0.5
-/0: 0.25
-: 0.0
Table 0-12: Screening of policy options and instruments against assessment criteria – Overview
1 2 3 4 5 6 7 8 9 10 Σ
Voluntary commitment -/0 0/+ 0 0 + + + 0/+ + + 7.75
Differentiated track access charges 0 + 0/+ 0/+ 0/+ 0 + 0/+ 0/+ 0 7.25
Subsidies for the use of low-noise wagons 0 0 0/+ + 0/+ - 0 + -/0 0 5.75
Subsidies for retrofitting + -/0 + + -/0 0/+ 0 + -/0 -/0 6.25
Loans at preferential terms - + - - + 0 + + 0/+ -/0 5.5
Tax incentives - - - -/0 + + 0 + 0/+ - 4.5
Noise limit values for the existing fleet + + 0 -/0 0 0 -/0 0 0 - 5.0
Operating restrictions for noisy freight wagons
0/+ + 0/+ - 0 0 0 0 0 + 6.0
Noise emission ceiling 0/+ + 0 0/- + -/0 0 0 0 + 6.25

124/129
ANNEX IV Sensitivity to the method for calculating affected population The purpose of this annex is to show different methods to figure out the net benefit in terms of reduction of noise emission and noise affected population. All the methods proposed are developed on the basis on the main European studies about externality evaluation. All values are related to a scenario with retrofitting rate of 50.000 w/y (6 years for retrofitting - values from calculations on density of rail-noise-affected population reported in a document for DG-ENV by Entec UK Ltd). METHOD 1 (chosen in Impact Assessment): euro/(dB*pers) x the product of the population which yearly is no longer affected by noise due to the noise reduction in the same year.
1. Annual calculation of noise emission reduction (“continuous” value) 2. Annual calculation of reduction of affected population by noise (>55 dB) (“discrete”
calculation, with delta = 1 dB) 3. Multiplication of these two values (social benefit + environmental benefit) 4. Multiplication by a constant [euro/(pers*dB)] 8 or 10 or 12 5. Net Benefit (Meuro) = 1,503.0 or 1,878.7 or 2,254.5
METHOD 2 (“HSE”): euro/(ΔdB*pers) x the product of the population over 55 dB which have a noise reduction of 1 dB by the same noise reduction (1 dB).
1. Annual calculation of noise emission reduction (“discrete” value, with delta = 1 dB) 2. Annual calculation of the persons subjected to a reduction of at least 1dB and anyway
affected by noise over 55 dB (“discrete” calculation, with delta = 1 dB) 3. Multiplication of these two values and sum with the previous year (permanent benefit) 4. Multiplication by a constant [8 euro/(pers*ΔdB)] 5. Net Benefit (Meuro) = 1,979.4
METHOD 3 (“HEATCO”): euro/pers x the population which yearly is no longer affect by noise.
1. Annual calculation of noise emission reduction 2. Annual calculation of reduction of affected population by noise (>55 dB) (“discrete”
calculation, with delta = 1 dB) 3. Multiplication of this by a constant [38 euro/pers (little annoyed)] or [59 euro/pers (annoyed
and highly annoyed)] 4. Net Benefit (Meuro) = 603.0 or 936.2
METHOD 4 (“INFRAS-IWW_1”): euro/(ΔdB*pers) x the product of the population over 55 dB which has a noise reduction of 1 dB by the same noise reduction (1 dB), multiplication with 5 values [euro/(ΔdB*pers)] one per each population class (55-60, 60-65, 65-70, 70-75, >75)
1. Annual calculation of noise emission reduction (“discrete” value, with delta = 1 dB) 2. Annual calculation of reduction of affected population included between 55 and 60 dB,
between 60 and 65 dB, between 65 and 70 dB, between 70 and 75 dB, more of 75 dB 3. Benefits built like method 2, multiplying previous population by 1 or 0 depending on reaching
of 1 dB reduction and adding the benefits of previous year 4. Multiplication by 5 values:

125/129
a. population between 55 and 60 dB [0 euro/(pers*ΔdB)] b. population between 60 and 65 dB [53 euro//(pers*ΔdB)] c. population between 65 and 70 dB [159 euro//(pers*ΔdB)] d. population between 70 and 75 dB [265 euro//(pers*ΔdB)] e. population over 75 dB [371 euro//(pers*ΔdB)] f. Net Benefit (Meuro) = 15,622.2
METHOD 5 (“INFRAS-IWW_2”): euro/(ΔdB*pers) x the population which yearly “goes down” the noise class, multiplication by 4 values (no 5 because in the 55-60 class the WTP is 0) [euro/(ΔdB*pers)] one per each “jump” of population class (in<60, in 60-65, in 65-70, in 70-75)
1. Annual calculation of noise emission reduction (“discrete” value, with delta = 1 dB) 2. Annual calculation of reduction of affected persons which “goes down” the noise class
(classes: 55-60, 60-65, 65-70, 70-75, more of 75 dB) 3. Application to each population of monetary values of the method 4, making the difference
between WTP applied to the different classes:
a. population from 61 to 60 dB [53 euro/pers] b. population from 66 to 65 dB [(159-53) euro/pers] c. population from 71 to 70 dB [(265-159) euro/pers] d. population from 76 to 75 dB [(371-265) euro/pers]
4. Net Benefit (Meuro) = 2,172.7

126/129
ANNEX V – References
Name Source/ web-link
1 IA Guidelines and as up-dated on 15 March 2006 http://ec.europa.eu/governance/impact/key.htm
2 EC - White Paper "European Policy for 2010: Time to decide", 2001 http://ec.europa.eu/transport/white_paper/mid_term_revision/index_en.htm
3 Communication From The Commission To The Council And The European Parliament Keep Europe moving - Sustainable mobility for our continent Mid-term review of the European Commission's 2001 Transport White Paper, 2006
http://ec.europa.eu/transport/transport_policy_review/doc/com_2006_0314_transport_policy_review_en.pdf
4 The Commission Communication of 16th February 2005 Strengthening passengers rights within the EU- "COM(2005) 46 final"
5 Commission Staff Working Paper of 14th July 2005 "Rights of passengers in international bus and coach transport"
http://ec.europa.eu/transport/road/consultations/passengers_rights_en.htm
6 Report and minutes on results of public consultation, Minutes of Stakeholders' meeting held on 29th March 2006 in Brussels
http://ec.europa.eu/transport/road/consultations/passengers_rights_en.htm
7 EU Energy and Transport in Figures, Statistical Pocketbook 2005 http://ec.europa.eu/dgs/energy_transport/figures/pocketbook/2006_en.htm
8 COST Action 349 - Accessibility of Coaches and Long Distances Buses for people with reduced Mobility, October 2005
http://kiewit.oregonstate.edu/ABE60/Resources/COST%20349%20Accessibility%20of%20Coaches%20-%20Final%20Report.pdf
9 EC - Memo on "Transport with a human face" - Passengers' rights in the European Union http://ec.europa.eu/dgs/energy_transport/publication/memos/2005_passenger_rights/2005_03_29_passenger_rights_en.pdf
10 Commission Staff Working Paper - Annex to the Report on the operation and prospects of the Community framework for passenger transport by coach and bus: access to international transport and cabotage markets, safety and rights of passengers, COM(2004)527
11 International Rail Passengers' Rights and Obligations Consultation paper of the Directorate-General for Energy and Transport, 2002 http://ec.europa.eu/transport/rail/research/studies_en.htm

127/129
Name Source/ web-link
12 CEMT/CM(2006)7/FINAL - Access And Inclusion Improving Transport Accessibility For All: Policy Messages http://www.cemt.org
13 COST Action 322 - Low floor buses
14 Study - Evaluation and monitoring of trends with regard to passenger needs on the level of service and treatment of passengers - carried out by NEXUS
15 Opinion of the Energy and Transport Forum on the passenger rights in international transport by coach
http://ec.europa.eu/dgs/energy_transport/forum/works/opinion_group_en.htm
16 Directive 2002/49/EC http://eur-lex.europa.eu/pri/en/oj/dat/2002/l_189/l_18920020718en00120025.pdf
17 The European environment - State and outlook 2005 http://reports.eea.europa.eu/state_of_environment_report_2005_1/en
18 EEA Noise Reports http://www.eea.europa.eu/themes/noise/listfeed?feed=reports_noise
19 UIC Environmental Projects http://www.uic.asso.fr/baseinfo/projet/projet.php?category=&abreviation=&long_name=
20 WG Railway Noise of the European Commission, Brussels 2003 http://ec.europa.eu/transport/rail/ws/doc/position-paper.pdf
21 AEA Technology: Status and Option for the reduction of noise emission the existing European rail freight wagon fleet, January 2004 http://ec.europa.eu/transport/rail/research/doc/aeat-final.pdf
22 UIC&CER Rail Freight Noise Abatement. Report on the state of the art, July 2006 http://www.uic.asso.fr/environnement/article.php3?id_article=6&PHPSESSID=1f10942bd43698a06cf7de0c7d4e7297
23 UIC Status report noise abatement on European Infrastructure, January 2007 http://forum.europa.eu.int/Public/irc/env/noisedir/library?l=/noisesstee
ringsgroupsmee/meeting_20_2007/progress_reports/final-versionpdf/_EN_1.0_&a=d

128/129
Name Source/ web-link
24 Position Paper on noise valuation of the WG on Health and Socio-economic aspects 2003 http://ec.europa.eu/environment/noise/pdf/valuatio_final_12_2003.pdf
25 Workshops on rail noise http://ec.europa.eu/transport/rail/ws/ws_noise_en.htm
26 Workshops on rail noise http://www.uic.asso.fr/environnement/Railways-noise.html
27 Workshops on rail noise http://www.uic.asso.fr/environnement/article.php3?id_article=56.html
28 HEATCO project on economic evaluation of noise http://heatco.ier.uni-stuttgart.de
29 UIC INFRAS IWW external costs in transport
30 Consultation Paper of the Commission's Services on rail noise abatement measures addressing the existing fleet of May 2007
http://ec.europa.eu/transport/rail/consultation/2007_rail_noise/doc/rail_noise_consultation_document_en.pdf
31 Workshops and documents (including Swiss case) http://ec.europa.eu/environment/noise/railway.htm
32 ExternE updated 2005 methodology http://www.externe.info/brussels/methup05.pdf
33 GRACE Generalisation of Research on Accounts and Cost Estimation http://www.grace-eu.org/
34 IMPACT http://www.ce.nl/redirect/Workshop_IECT_index.htm
35 Position Paper on dose Response Relationships between Transportation Noise and Annoyance http://ec.europa.eu/environment/noise/pdf/noise_expert_network.pdf
36 Position paper on Dose-Effect Relationships for Night Time Noise http://ec.europa.eu/environment/noise/pdf/positionpaper.pdf
37 EC noise mapping information http://circa.europa.eu/Public/irc/env/d_2002_49/library
38 EC noise mapping information http://ec.europa.eu/environment/noise/data.htm
39 Standard EN ISO 3095
40 VTI paper on rail noise externalities and charging
41 STAUS REPORT on Noise Trauck Access charge.doc

129/129
Name Source/ web-link
42 Implementation of retrofitting Freight Fleet analysis (Env-10-05-05-hubner.pps)
43 Rilway Noise Abatement in Switzerland (present - env-10-05-06-oertli.pps)
44 2007_05_23_uic_uip_cer_action programme_kettner.pdf
45 ICER BRAKES S.A.pdf
46 Dutch Noise Reduction Policy - Vierling.pdf
47 IPG Whispering Train LCC (brake blocks)- Peen.pdf
48
49 Retrofitting Freight wagon in Switzerland
50 K Brake Blocks - Ass Italiana Acustica
51 wi_bref_0806
52 Methodology to assess population exposed to high levels of noise air pollution close to major transport infrastructure - Report
http://ec.europa.eu/environment/air/pdf/hot_spots/final_report_main.pdf
53 Methodology to assess population exposed to high levels of noise air pollution close to major transport infrastructure - Annex 1
http://ec.europa.eu/environment/air/pdf/hot_spots/final_report_main.pdf