impact d’un système anticollision sur le traitement de l
TRANSCRIPT

HAL Id: tel-00910310https://tel.archives-ouvertes.fr/tel-00910310
Submitted on 27 Nov 2013
HAL is a multi-disciplinary open accessarchive for the deposit and dissemination of sci-entific research documents, whether they are pub-lished or not. The documents may come fromteaching and research institutions in France orabroad, or from public or private research centers.
L’archive ouverte pluridisciplinaire HAL, estdestinée au dépôt et à la diffusion de documentsscientifiques de niveau recherche, publiés ou non,émanant des établissements d’enseignement et derecherche français ou étrangers, des laboratoirespublics ou privés.
Impact d’un système anticollision sur le traitement del’information et le comportement du conducteur
Mercedes Bueno-Garcia
To cite this version:Mercedes Bueno-Garcia. Impact d’un système anticollision sur le traitement de l’information et le com-portement du conducteur. Neurosciences [q-bio.NC]. UNIVERSITE BORDEAUX 2, 2013. Français.�tel-00910310�


Année 2013
Thèse n° 2041
THÈSE
pour le
DOCTORAT DE L’UNIVERSITÉ BORDEAUX 2
Ecole doctorale Science de la Vie et de la Santé
Mention : Sciences, Technologie, Santé
Option : Neurosciences
Présentée et soutenue publiquement
Le 27 septembre 2013
Par Mercedes BUENO GARCÍA
Née le 10 mai 1983 à Úbeda, Jaén (Espagne)
Impact d’un système anticollision sur le traitement de l’information et le comportement du conducteur
Membres du Jury Mr Pierre DENISE , PU-PH, Univ. de Caen ............................................ Rapporteur Mr Michael FALKENSTEIN , Professeur, Univ. de Dortmund ............... Rapporteur Mr Ángel CORREA , Chercheur, Univ. de Grenade ................................. Examinateur Mr Frank MARS , Chercheur CNRS, Univ. de Nantes .............................. Examinateur Mme Colette FABRIGOULE , Directrice de recherche, CNRS, Univ. de Bordeaux .............................................................................................. Directrice Mme Alexandra FORT, Chercheur IFSTTAR, Univ. de Lyon ................. Encadrante


REMERCIEMENTS
…beaucoup de travail, beaucoup d'effort, mais surtout beaucoup de remerciements...
…a lot of work, a lot of effort, but mainly a lot to thank...
…mucho trabajo, mucho esfuerzo, pero sobre todo mucho que agradecer…
Un énorme merci à mes deux directrices Alexandra et Colette. Merci pour toutes les choses que vous m’avez apprises, merci pour votre disponibilité, votre soutien et vos mots d’encouragements. Nous sommes une très bonne équipe, sinon comment serions-nous arrivées à écrire el « artículo de la muerte ? » Alexandra, c’est très difficile d’écrire en deux lignes toutes les choses pour lesquelles je dois te remercier tant au niveau professionnel que personnel. Je suis contente d’avoir eu l’occasion de te l’avoir déjà dit, t’es vraiment géniale ! Colette, cela a été un honneur d’être sous ta direction. J’ai beaucoup grandi professionnellement dans ce parcours. Cela est dû, bien sûr, à beaucoup de travail mais aussi à l’envie d’arriver un jour à avoir une expérience, les qualités de chercheuse et une carrière professionnelle comme la tienne.
Je remercie Franck Mars et Ángel Correa d’avoir accepté d’examiner mon travail, ainsi que Michael Falkenstein et Pierre Denise d’avoir accepté d’être rapporteurs de ma thèse. Merci aussi pour le temps que vous m’avez consacré.
Un grand merci à tout le LESCOT ! Merci à Corinne Brusque et à Hélène Tattegrain pour m’avoir facilité, respectivement, le début et la fin dans ce parcours. Merci à tous ceux qui sont toujours là, Christophe, Vero, Catherine, Joceline, … et ceux qui sont déjà partis, Maud, Marjo, Valerie, Soizick… Merci de m’avoir accueillie aussi chaleureusement au labo, merci pour tous ces moments de détente, merci de m’avoir aidée à améliorer mon français et d’avoir essayé (sans le réussir) de me faire comprendre votre merveilleux système administratif. Merci également à Mathilde François de nous avoir aidées avec la passation et l’analyse des données de notre deuxième expérience. Merci à l’équipe technique Daniel, Philippe, Bruno et Fabien, qu’aurais-je fait sans vous ?
Thank you very much to the whole ADAPTATION team. A very special thanks goes to all senior researchers. Thank you for the time dedicated, for your comments, questions and suggestions, which have undoubtedly enriched this work. And you guys, many thanks! It has been great to share this time with you, all the seminars, the presentations, all the dinners, and some other special moments… I wish you all the best and I hope that one day you can understand finally the examples of my dual task!
Como no, gracias a mi antiguo equipo de la Universidad de Granada, Candi, Sergio y Javi. Gracias por haberme acompañado durante mis primeros pasos como investigadora. Candi, si no hubiera sido por ese pequeño gran empujón que me diste, hoy no estaría aquí. Gracias por todo lo que me has aportado y por haber confiado en mí.
Mari Luz, Pedro, Fátima, Paco, Analy, Chica, Barja, Huertas, Alicia, Taboadas, Javi…sois los mejores, ea! Gracias por las lágrimas de risa que me habéis hecho derramar y las que sé que quedan por venir. Gracias también por haber estado a mi lado cuando las lágrimas no han sido de alegría.
Y gracias también a todas las grandes personas que he conocido en tierras francesas. Alicia, menos mal que al final te encontré. Vero, éste es realmente tu sitio en mis agradecimientos. Christophe, gracias por estar ahí.
Finalmente, gracias a mi familia, a vosotros os lo debo todo. Este trabajo está especialmente dedicado a vosotros.


TABLE DE MATIÈRES
5
Résumé ................................................................................................................................................... 7
Abstract.................................................................................................................................................... 9
Liste des Figures ................................................................................................................................... 11
Liste des Tableaux ................................................................................................................................ 13
Préambule ............................................................................................................................................. 15
1. Introduction Générale ........................................................................................................................ 17
2. Cadre Théorique ................................................................................................................................ 21
2.1. Le système d’alerte anticollision ................................................................................................21
2.1.1. Contexte ......................................................................................................................... 21 2.1.2. Définition, pourcentage et causes des collisions par l’arrière ........................................ 22 2.1.3. Définition et types de systèmes anticollision .................................................................. 23 2.1.4. Modalités du signal avertisseur ...................................................................................... 24 2.1.5. Fonctionnement du système anticollision : Algorithmes................................................. 26 2.1.6. Systèmes réels sur le marché ........................................................................................ 26 2.1.7. Bénéfices du système .................................................................................................... 27 2.1.8. Facteurs influençant l’efficacité des systèmes ............................................................... 29
2.1.8.1. Fiabilité du système ........................................................................................... 30 2.1.8.2. Impact de l’état attentionnel des conducteurs ................................................... 31
2.1.9. Adaptation comportementale au système ...................................................................... 35 2.2. Modèles cognitifs et processus attentionnels en conduite automobile ......................................37
2.2.1. Théories cognitives sur le traitement de l’information .................................................... 38 2.2.1.1. L’attention comme un filtre sélectif .................................................................... 38 2.2.1.2. L’attention comme un réservoir de ressources ................................................. 38
2.2.2. Modèles attentionnels ..................................................................................................... 42 2.2.2.1. Le rôle du signal avertisseur ............................................................................. 43
2.2.3. Modèles cognitifs de la conduite .................................................................................... 45 2.2.4. Quelles sont les conséquences de la distraction au volant ? ......................................... 46
2.2.4.1. Effets de la distraction au niveau comportemental ........................................... 47 2.2.4.2. Effets de la distraction au niveau du traitement de l’information....................... 48
3. Méthodologie ..................................................................................................................................... 51
3.1. Électroencéphalographie et Potentiels Évoqués........................................................................51
3.1.1. Présentation générale de la méthode ............................................................................ 52 3.1.1.1. Définition ........................................................................................................... 52 3.1.1.2. Montage des électrodes .................................................................................... 52 3.1.1.3. Traitement du signal .......................................................................................... 53 3.1.1.4. Avantages et limites .......................................................................................... 55
3.1.2. Composantes des PE analysées .................................................................................... 55 3.1.2.1. La Variation Contingente Négative (VCN) ........................................................ 55 3.1.2.2. La N1 visuelle .................................................................................................... 56 3.1.2.3. La N2 ................................................................................................................. 57 3.1.2.4. La P3 ................................................................................................................. 57
3.1.3. Choix expérimentaux ...................................................................................................... 58 3.2. Les simulateurs de conduite.......................................................................................................59

6
3.2.1. Généralités ..................................................................................................................... 59 3.2.2. Le simulateur de conduite simplifié ................................................................................ 60
3.2.2.1. Description ........................................................................................................ 60 3.2.2.2. Avantages et limites .......................................................................................... 61 3.2.2.3. Scenarios .......................................................................................................... 62
3.2.3. Le simulateur de conduite plus réaliste .......................................................................... 63 3.2.3.1. Description ........................................................................................................ 63 3.2.3.2. Avantages et limites .......................................................................................... 64 3.2.3.3. Scénarios .......................................................................................................... 64
4. Partie Expérimentale ......................................................................................................................... 65
4.1. Expérience 1 : Une étude électrophysiologique de l’impact d’un système d’alerte anticollision dans une tâche de conduite simulée .............................................................................65
4.1.1. Objectif et justification ..................................................................................................... 65 4.1.2. Méthode .......................................................................................................................... 66
4.1.2.1. Population ......................................................................................................... 66 4.1.2.2. Protocole ........................................................................................................... 66
4.1.3. Discussion des principaux résultats ............................................................................... 67 4.2. Article 1 .......................................................................................................................................69
4.3. Expérience 2: Efficacité d’un système d’alerte anticollision en simple et double tâche d’un point de vue électrophysiologique .....................................................................................................81
4.3.1. Objectif et justification ..................................................................................................... 81 4.3.2. Méthode .......................................................................................................................... 81
4.3.2.1. Population ......................................................................................................... 81 4.3.2.2. Protocole ........................................................................................................... 82
4.3.3. Discussion des principaux résultats ............................................................................... 82 4.4. Article 2 .......................................................................................................................................83
4.5. Expérience 3 : Adaptation comportementale et efficacité d’un système d’alerte anticollision en fonction de la tâche secondaire cognitive ....................................................................................89
4.5.1. Objectif et justification ..................................................................................................... 89 4.5.2. Méthode .......................................................................................................................... 90
4.5.2.1. Population ......................................................................................................... 90 4.5.2.2. Protocole ........................................................................................................... 90
4.5.3. Discussion des principaux résultats ............................................................................... 92 4.6. Article 3 .......................................................................................................................................93
5. Discussion Générale ....................................................................................................................... 113
5.1. L’impact du signal avertisseur sur le traitement de l’information .............................................113
5.2. L’impact de la fiabilité du système ...........................................................................................114
5.3. Impact de l’état attentionnel du conducteur .............................................................................115
5.4. Adaptation comportementale au système ................................................................................118
6. Conclusion et Perspectives ............................................................................................................. 121
Références .......................................................................................................................................... 125
Annexes ............................................................................................................................................... 133
Annexe 1 : Chapitre d’ouvrage ........................................................................................................135
Annexe 2 : Liste de publications......................................................................................................153

RÉSUMÉ
7
Résumé
Impact d’un système anticollision sur le traitement de l'information
et le comportement du conducteur
Ce travail de thèse a été centré sur l’analyse de l’impact d’un système d’alerte anticollision sur le
traitement de l’information et le comportement du conducteur en conduite automobile simulée. Les
objectifs de ce travail étaient 1) de déterminer l’impact d’un signal avertisseur associé à un système
d’alerte anticollision sur le traitement de l’information à partir de potentiels évoqués ; 2) d’analyser
l’efficacité d’un tel système en fonction de sa fiabilité ; 3) et en fonction de l’état attentionnel des
conducteurs ; et 4) d’examiner l’adaptation comportementale au système au cours du temps.
Grâce à une double approche comportementale et électrophysiologique, nous avons montré que le
signal avertisseur agit au niveau de l’anticipation et de la préparation à la réponse ainsi qu’au niveau
cognitif du traitement de l’information. Par ailleurs, nous avons confirmé que les systèmes anticollision
ne nécessitent pas d’être complètement fiables pour être efficaces. Nous avons également observé
que l’efficacité du signal avertisseur associé au système anticollision était moindre chez les sujets
distraits, notamment lorsque la charge cognitive associée à la distraction était élevée. Ceci suggère
que le signal avertisseur nécessite des ressources attentionnelles pour être traité et, donc, pour être
efficace. Concernant l’adaptation comportementale au système, les principaux résultats ont montré,
d’une part, que l’introduction immédiate du système a eu un effet positif sur le comportement de
conduite et, d’autre part, que le processus d’adaptation au système à plus long terme peut être affecté
si les conducteurs sont distraits par des tâches secondaires coûteuses en ressources attentionnelles.
Mots clés :
Signal avertisseur, conduite simulée, traitement de l’information, potentiels évoqués, fiabilité,
distraction, adaptation comportementale.


ABSTRACT
9
Abstract
Impact of a collision warning system on information processing
and driver behaviour
This thesis was focused on the analysis of the impact of a collision warning system on information
processing and driver behaviour in simulated driving. The objectives of this work were 1) to determine
the impact of a warning signal associated with a collision warning system on the processing of
information using evoked potentials, 2) to analyse the effectiveness of such a system according to its
reliability, 3) and according to the drivers’ attentional state, 4) to examine the behavioural adaptation to
the system over time.
Using an electrophysiological and behavioural dual approach, we showed that the warning signal acts
at the level of anticipation and response preparation and at the level of cognitive processing.
Moreover, we confirmed that collision warning systems do not need to be completely reliable to be
effective. We also observed that the effectiveness of the warning signal associated with the collision
warning system was lower in distracted subjects, especially when the cognitive load associated with
the distraction was high. This suggests that the warning signal requires attentionnal resources in order
to be processed and, therefore, to be effective. Concerning behavioural adaptation to the system, the
main results showed firstly that the immediate introduction of the system had a positive effect on the
driving behaviour and secondly that the process of adaptation of the system at the longer term may be
affected if drivers are distracted by high demanding secondary tasks.
Keywords:
Warning signal, driving simulator, information processing, event related potentials, reliability,
distraction, behavioural adaptation.


LISTE DES FIGURES
11
Liste des Figures
Figure 1. Modèle cognitif de Norman et Shallice (1986) ....................................................................... 39
Figure 2. Modèle du « centre exécutif » de Baddeley (1974 ; 2000) .................................................... 40
Figure 3. Le modèle de ressources multiples de Wickens (1984) ........................................................ 40
Figure 4. Représentation du montage des électrodes selon le Système International 10-20 sur
l’hémisphère gauche (A) et vue de dessus (B). D’après Jasper (1958). ...............................................53
Figure 5. Représentation de la méthode d’extraction des potentiels évoqués. En haut : signal EEG
enregistré en continu à partir d’une électrode pendant la présentation de stimuli. En bas : PE
obtenu par moyennage de séquences du signal EEG calées sur les stimulations................................54
Figure 6. Représentation typique de la composante de la variation contingente négative. .................. 55
Figure 7. Représentation typique de la composante N1. ...................................................................... 56
Figure 8. Représentation typique de la composante N2. ...................................................................... 57
Figure 9. Représentation typique de la composante P3. ...................................................................... 58
Figure 10. Vue de dessus (gauche) et postérieure (droite) de l’emplacement des 34 électrodes. ....... 59
Figure 11. Contexte expérimental et matériels utilisés pendant les deux premières expériences. ...... 61
Figure 12. Images issues des scénarios et illustrant à gauche la scène de suivi de la moto à une
distance inter-véhiculaire prédéfinie et à droite la décélération de la moto avec le feu arrière allumé
(cible). .....................................................................................................................................................62
Figure 13. Contexte expérimental de la troisième expérience. ............................................................. 63
Figure 14. Schéma illustrant les ressources attentionnelles disponibles pour traiter le signal
avertisseur en simple et en double tâches. ............................................................................................68
Figure 15. Séquence expérimentale pour chaque essai dans les trois conditions de système. ........... 69
Figure 16. Séquence expérimentale pour chaque essai dans les deux conditions de système. .......... 82
Figure 17. Schéma illustrant les ressources attentionnelles disponibles pour traiter le signal
avertisseur en simple tâche et en double tâche difficile et facile. ..........................................................90
Figure 18. Design expérimental montrant les conditions système et distraction pour chacun des
trois groupes pendant les cinq scénarios. ..............................................................................................92


LISTE DES TABLEAUX
13
Liste des Tableaux Tableau 1. Structure générale et contenu de chaque chapitre de la thèse. ......................................... 20
Tableau 2. Récapitulatif des études illustrant les effets du système anticollision chez les
conducteurs distraits. ..............................................................................................................................32
Tableau 3. Récapitulatif des études illustrant les effets du système anticollision chez les
conducteurs distraits et non distraits. .....................................................................................................33


PRÉAMBULE
15
Préambule
Ce travail de thèse a été réalisé dans le cadre du projet européen ADAPTATION (http://adaptation-
itn.eu/) financé par un programme Marie Curie de type Initial Training Network (ITN). Le principal
objectif des programmes ITN est l’entraînement et la formation de jeunes chercheurs par un réseau
d'universités, d'entreprises et d'instituts de recherche autours d’une thématique commune. Cette
formation est basée principalement sur les connaissances scientifiques acquises à partir d’un travail
de recherche individuel pouvant donner lieu à une thèse. En plus, le programme est complété par
d’autres modules de formation complémentaires utiles à la fois dans la réalisation du travail de thèse
et au développement d’une carrière de chercheur.
L’objectif général du projet ADAPTATION est d’étudier l’adaptation comportementale du conducteur
au cours du temps suite à l’usage de systèmes avancés d'assistance au conducteur (regroupés sous
l’acronyme générique anglo-saxon ADAS pour Advanced Driver Assistance Systems). La fonction
principale des ADAS est d'informer, d'avertir et d'intervenir en cas de situations critiques pour le
conducteur. Ces systèmes ont connu un fort développement au cours des dernières années grâce à
leurs effets positifs dans le domaine de la sécurité routière. Toutefois, leur efficacité peut dépendre du
type de système (fonction), des technologies employées (design, fiabilité, etc.) et des caractéristiques
du conducteur (âge, état attentionnel, expérience, etc.). Ces thématiques ont été abordées au travers
des dix travaux de thèse conduits dans le cadre du projet ADAPTATION.


1. INTRODUCTION
GÉNÉRALE
17
1. Introduction Générale
Les travaux de cette thèse portent sur un système particulier d’assistance à la conduite : le système
d’alerte anticollision frontale (regroupés sous l’acronyme générique anglo-saxon FCWS pour Forward
Collision Warning System). Ces systèmes sont conçus pour avertir les conducteurs du risque de
collision existant lorsque le véhicule approche un obstacle. Les travaux de cette thèse portent sur un
système particulier d’assistance à la conduite : le système d’alerte anticollision frontale (regroupés
sous l’acronyme générique anglo-saxon FCWS pour Forward Collision Warning System). Ces
systèmes sont conçus pour avertir les conducteurs du risque de collision existant lorsque le véhicule
approche un obstacle.
L’objectif général de ce travail est d’étudier, en conduite automobile simulée, l’impact d’un FCWS sur
le traitement de l’information et le comportement du conducteur. D’un point de vue cognitif, le FCWS
est composé principalement d'un signal avertisseur qui aide le conducteur à rediriger son attention
vers un danger potentiel sur la route et à se préparer pour initier une réponse adéquate. L’efficacité de
ce signal peut être évaluée en analysant le comportement des conducteurs. Par exemple, vont-ils
réagir plus rapidement lorsque le signal est déclenché ? ou encore, vont-ils adopter des distances de
sécurité plus importantes quand le système anticollision est activé ? Les mesures comportementales
recueillies dans un simulateur de conduite ou sur route réelle (temps de réaction, temps inter-
véhiculaire, vitesse, etc.) constituent un bon reflet de la performance des conducteurs. Toutefois, si
l'analyse du comportement du conducteur a été l'une des mesures les plus fréquemment utilisées, ce
n'est pas le seul moyen d'analyser l'impact des systèmes anticollision. Bien souvent, ces mesures
sont couplées à d'autres techniques telles que l'analyse des informations fournies par les conducteurs
(par exemple, questionnaires ou groupes de discussion) ou encore l'analyse des mesures
physiologiques (par exemple, l’électrooculographie, la réponse galvanique de la peau, la fréquence
cardiaque, l'électroencéphalographie, etc.). Ce dernier type de mesures est beaucoup moins utilisé et
son enregistrement nécessite souvent des contextes plus contrôlés comme les simulateurs de
conduite. Cependant, l’information additionnelle fournie par ces mesures ne peut pas être inférée à
partir des mesures comportementales isolées.

Chapitre 1
18
Dans ce travail, deux approches ont été utilisées pour étudier l'impact du FCWS. Tout d’abord, nous
avons suivi une approche traditionnelle basée sur l'analyse de la performance des conducteurs
(principalement, les temps de réactions). D'autre part, et cela représente l'une des principales
innovations de ce travail, nous avons utilisé une approche électrophysiologique permettant
l'enregistrement de l'activité électrique du cerveau (électroencéphalographie, EEG) et l’analyse des
potentiels évoqués (PE). Cette technique est un outil efficace pour dissocier les stades sensoriels et
cognitifs du traitement de l'information. Ainsi, le premier objectif dans ce travail de thèse a été
d’analyser dans quelle mesure le signal avertisseur d’un FCWS modifie le traitement de l’information
au niveau neural et à quelle étape du traitement intervient cette modification.
Les systèmes anticollision qui sont conçus pour assister le conducteur dans la détection d’information
importante, comme un évènement potentiellement dangereux, ne sont jamais entièrement fiables.
Fausses alarmes et défauts de détection des événements dangereux sont des erreurs qui
apparaissent avec une relative fréquence dans les véhicules équipés de FCWS. Nous pouvons nous
attendre à ce que l’efficacité et l’acceptabilité de ces systèmes puissent varier en fonction de leur
niveau de fiabilité. Le deuxième objectif de cette thèse est donc d'étudier comment différents niveaux
de fiabilité du système vont affecter le traitement de l'information et le comportement des conducteurs.
Par ailleurs, la distraction étant le principal facteur impliqué dans les collisions par l’arrière, ces
systèmes d’alerte anticollision devraient aider particulièrement les conducteurs distraits. Or, leur
efficacité a été principalement démontrée chez les conducteurs non distraits. Nous pouvons dès lors
nous interroger sur l’efficacité de ces systèmes lorsque les conducteurs sont distraits. Par
conséquent, le troisième objectif de ce travail est d’évaluer l’effet d’un système anticollision sur le
comportement et le traitement de l’information selon l’état attentionnel du conducteur (distrait ou non
distrait).
Enfin, le quatrième objectif de ce projet concerne la question de l’adaptation comportementale à ces
systèmes. Plus précisément, il s’agit de déterminer si l’usage des systèmes change le comportement
de conduite des conducteurs au cours du temps. Ces systèmes sont conçus pour aider les
conducteurs lorsque des dangers potentiels sont détectés. Cependant, des effets négatifs initialement
non prévus pourraient apparaître à la suite de l’usage de ces systèmes et en fonction de facteurs
comme le niveau de fiabilité du système.
Pour répondre à ces objectifs, trois expériences ont été conçues et conduites au cours de cette thèse.
Les deux premières expériences ont été effectuées dans un contexte de laboratoire en utilisant un
simulateur de conduite simplifié composé d’un ordinateur, d’un écran, d’un volant et d’un pédalier.
Bien que ce milieu contrôlé soit très différent d’une conduite réelle sur route, il nous a permis
d'enregistrer l'activité électrique du cerveau via les potentiels évoqués.

Introduction Générale
19
L'objectif de la première expérience était d'évaluer l'impact d’un système anticollision sur le
comportement du conducteur et sur le traitement de l’information visuelle pertinente en conduite
(l’illumination du feu arrière du véhicule précédent), d’une part, en fonction de la fiabilité du système,
et d’autre part, en fonction de l’état attentionnel des conducteurs.
Des résultats inattendus dans cette première expérience concernant l’efficacité du signal avertisseur
en condition de distraction nous ont conduits à réaliser une deuxième expérience afin de préciser ces
résultats. Plus précisément, dans la première expérience, l'allumage des feux arrière de la voiture de
devant était toujours précédé d’une décélération. Cette décélération était donc un meilleur prédicteur
du feu stop que le signal avertisseur, et cela pourrait diminuer son efficacité. Ainsi, dans la deuxième
expérience nous avons modifié légèrement le paradigme expérimental précédemment utilisé afin de
mieux analyser l’efficacité du signal comme le seul prédicteur de la cible, en fonction de l’état
attentionnel du conducteur.
Finalement, pour être plus proche d’une situation de conduite réelle, une troisième expérience a été
réalisée sur un simulateur de conduite plus réaliste permettant une immersion plus importante que
dans les expériences précédentes. Cependant, dans ces conditions, le recueil des données
électrophysiologiques n’a pas pu être possible. Cette expérience a été constituée autour de deux
objectifs. D’une part, il s’agissait d’analyser l’adaptation comportementale pendant les premières
utilisations du système, mais aussi après une exposition plus longue au système. D’autre part, il
s’agissait d’analyser l’efficacité du système en condition de distraction. Les recherches précédentes
avaient suggéré que le traitement du signal avertisseur nécessitait des ressources attentionnelles
pour être efficace. Pour tester cette hypothèse, dans cette expérience, nous avons étudié l’efficacité
du signal en fonction de deux niveaux de difficulté de la tâche distractive.
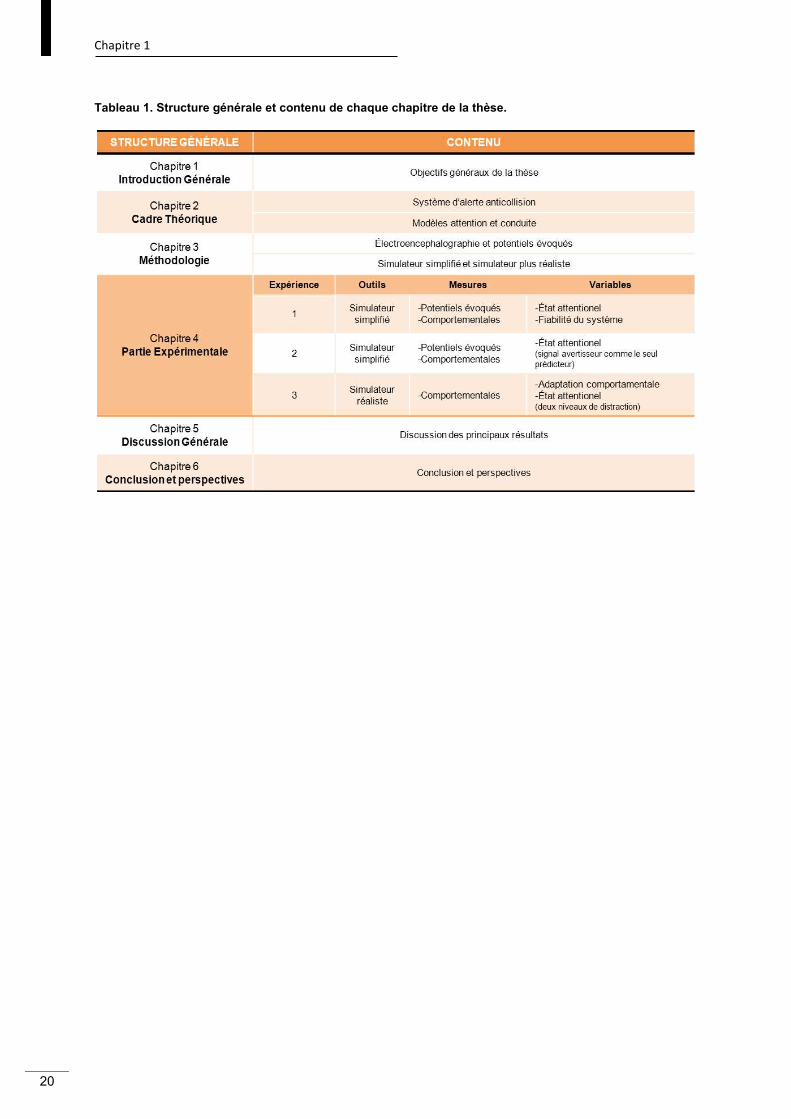
La structure de cette thèse se compose de six chapitres (voir Tableau 1). Après cette introduction
générale, nous allons présenter le cadre théorique dans le chapitre 2. Tout d’abord, nous ferons une
description générale des ADAS, puis nous donnerons une définition plus détaillée des FCWS, de leur
fonctionnement et de leur efficacité. Dans un deuxième temps, nous discuterons certains modèles
cognitifs portant sur l’attention et la conduite automobile. Le troisième chapitre de ce travail sera
consacré à la présentation de la méthodologie utilisée dans ces trois expériences. Tout d'abord, nous
présenterons les techniques de l'électroencéphalographie et l'analyse des potentiels évoqués, puis
nous présenterons les outils de simulation de conduite automobile : le simulateur simplifié et le
simulateur plus réaliste. Le quatrième chapitre se composera des trois expériences qui forment la
partie expérimentale de cette thèse. Chaque expérience sera présentée par un résumé détaillé avec
les questions posées, la méthode et l’interprétation des principaux résultats, ainsi que le papier
correspondant publié ou soumis dans une revue internationale à comité de lecture. Dans le cinquième
chapitre de discussion générale, nous ferons une synthèse des principaux résultats et de leurs
interprétations. Enfin, dans le sixième chapitre nous présenterons des conclusions générales et nous
évoquerons des pistes de recherche pour aller plus loin sur ces questions.
Chapitre 1
20
Tableau 1. Structure générale et contenu de chaque chapitre de la thèse.

2. CADRE
THÉORIQUE
21
2. Cadre Théorique
2.1. Le système d’alerte anticollision1
2.1.1. Contexte
Dans la dernière décennie, le nombre de victimes d’accidents de la route en Europe a diminué
considérablement avec des baisses atteignant plus de 40% (European Commission, 2013). Mais
malgré ces chiffres encourageants, les accidents de la circulation restent l'un des principaux facteurs
contribuant à la mortalité et ils ont été la première cause de décès chez les jeunes âgés de 5 à 29 ans
en 2008 en Europe (World Health Organization, 2011). Ces données indiquent qu’il s’agit d’un
problème non résolu ayant un grand impact humain et socio-économique. L’adoption de nouvelles
stratégies est nécessaire afin d'atteindre l'objectif fixé par la Commission Européenne de réduire de
moitié le nombre de victimes d'accidents de la route en 2020 (European Commission, 2010). Mais cet
objectif n’est pas exclusivement européen. En effet, les Nations Unies ont déclaré la période 2011-
2020 comme la Décennie de l’Action pour la Sécurité Routière (United Nations, 2010). Dans ce
contexte, de nouvelles mesures ont été proposées pour essayer d’améliorer l'éducation et la formation
des utilisateurs, renforcer l'application des règles de sécurité routière, améliorer les infrastructures
ainsi que les services d'urgence et la protection des utilisateurs plus vulnérables (European
Commission, 2010; World Health Organization, 2004). Des progrès en matière de sécurité routière
sont également espérés par le développement de véhicules « intelligents » et plus sûrs (European
Commission, 2010; World Health Organization, 2004). Les systèmes de transport intelligent (ITS pour
1 Cette partie est résumée sous la forme d’un chapitre d’ouvrage (Annexe 1) : Bueno, M., Fabrigoule, C., and Fort, A. (2014). Effectiveness of Forward Collision Warning Systems: a contribution from the cognitive analysis combining behavioural and electrophysiological measures. In A. Stevens, C. Brusque & J. Krems (Eds). Driver adaptation to information and assistance systems. IET published book. ISBN: 978-1-84919-639-0; E-ISBN: 978-1-84919-640-6

Chapitre 2
22
les sigles en anglais Intelligent Transport Systems) sont conçus avec l’objectif d’améliorer la sécurité,
l’efficacité, la mobilité et la productivité dans le domaine du transport (Bayly, Fildes, Regan, & Young,
2007). Différents concepts et catégories ont été adoptés pour définir et classifier les nombreux
systèmes de transport intelligents qui sont apparus dans les dernières années (Bayly et al., 2007;
Wege & Victor, 2010). Les systèmes d’information à bord du véhicule (IVIS pour In-Vehicle
Information Systems) et les systèmes avancés d’assistance au conducteur (ADAS) sont deux
catégories utilisées fréquemment pour classifier les nouveaux systèmes qui ont émergé dans le
domaine du transport. Les premiers ont souvent été associés à des tâches non directement liées à la
conduite (musique, téléphone, etc.), mais ils comprennent aussi des tâches liées à des fonctions de
navigation (par exemple, GPS) et de planification (par exemple, les systèmes d'information sur le
trafic, la météo ou les infrastructures). La fonction principale des ADAS est d’assister le conducteur
dans les tâches liées au contrôle du véhicule et la réalisation de manœuvres (par exemple, contrôle
latéral et longitudinal du véhicule, assistance au stationnement, etc.) (Östlund et al., 2005; Pauzié &
Amditis, 2011). Une taxonomie plus étendue des ADAS peut être faite en fonction du type
d'intervention que ces systèmes offrent au conducteur. Ainsi, nous pouvons parler des systèmes
d'information au conducteur, des systèmes d’avertissement des dangers potentiels et des systèmes
d’intervention qui peuvent prendre le contrôle du véhicule si nécessaire (voir par exemple, Gietelink,
Ploeg, De Schutter, & Verhaegen, 2009; Huth, Bueno, Fort, & Brusque, 2014).
En général, les estimations fournies dans différents rapports concernant les effets des ADAS montrent
un bilan très positif en termes de sécurité routière en soulignant la réduction du nombre de victimes
sur les routes (McKeever, 1998; OECD, 2003). Bien que le but initial des ADAS soit l’amélioration de
la sécurité, l’introduction de ces systèmes et l’interaction avec les conducteurs peut constituer une
importante transformation des pratiques habituelles dans l’activité de conduite. Par conséquent, suite
à l’apparition de ces systèmes sur le marché, une grande partie de la recherche a été concentrée
dans le domaine des facteurs humains afin d’analyser l’impact, à la fois positif mais aussi
potentiellement négatif, de ces systèmes sur le comportement des conducteurs. Au cours de cette
thèse nous nous sommes plus spécifiquement intéressés au système anticollision.
2.1.2. Définition, pourcentage et causes des collisions par l’arrière
Les FCWS ont été développés pour avertir les conducteurs des collisions potentielles avec un
véhicule à l’avant. Ces collisions rentrent dans la catégorie des collisions « par l'arrière », définies par
la Commission européenne (2006) comme une « collision entre deux véhicules circulant dans la
même direction sur la même route. Le premier véhicule a un point de collision par l'arrière, l’autre
véhicule a un point de collision frontale » (p. 10).

Cadre Théorique
23
Ces accidents représentent l'un des types très fréquents de collision dans certaines parties du monde,
comme aux États-Unis, en Russie ou au Japon, expliquant approximativement 30% des accidents
(Ikari, Kaito, Nakajima, Yamazaki, & Ono, 2009; NHTSA, 2009; UNECE, 2007, 2011; Watanabe & Ito,
2007). En Europe, le taux de prévalence de ces accidents est réduit d'environ 13% (Van Kampen,
2003), mais il existe une très grande variabilité entre les différents pays européens, par exemple, ces
accidents représentent 11% des collisions en France et 18% en Espagne (UNECE, 2007). En plus
d’un taux non négligeable de mortalité et de blessures, ces accidents représentent un coût
économique important pour la société et perturbent gravement la circulation.
Les collisions par l’arrière peuvent être causées par des facteurs environnementaux, des facteurs liés
au véhicule et/ou des facteurs humains. La plupart de ces collisions se produisent pendant la journée
(entre 9h30 et 15h30), dans de bonnes conditions météorologiques, sur des lignes droites et lorsque
la surface de la chaussée est sèche et avec des vitesses modérées généralement inferieures à 60
km/h. Par conséquent, les conditions environnementales ne représentent pas un pourcentage très
élevé d’implication dans ces accidents : 11 à 15% des collisions par l’arrière en fonctions des
différentes études (Dingus et al., 2006; Knipling, Wang, & Yin, 1993; Vogel & Bester, 2005). Les
problèmes techniques du véhicule, comme une faille des freins, expliquent environ 10% de ces
collisions (Knipling et al., 1993; Vogel & Bester, 2005). C’est le facteur humain qui est la principale
cause des collisions par l’arrière, expliquant de 75% à 93% des cas selon les études (Dingus et al.,
2006; Knipling et al., 1993; Vogel & Bester, 2005). Parmi les facteurs humains, l’inattention du
conducteur a été identifiée comme étant le premier facteur contributif, impliqué dans environ deux
tiers de ces accidents (Dingus et al., 2006; Knipling et al., 1993). Les jeunes jusqu’à 24 ans
représentent la catégorie la plus impliquée dans ce type de collision (Dingus et al., 2006; Knipling et
al., 1993; Singh, 2003). Concernant le genre, les hommes pourraient être légèrement plus impliqués
dans ce type d’accidents (Dingus et al., 2006; Knipling et al., 1993; Singh, 2003).
2.1.3. Définition et types de systèmes anticollision
Etant donné l’importance du facteur humain dans les collisions par l’arrière, l’utilisation des systèmes
anticollisions peut se présenter comme une contre-mesure pour prévenir ce type de collisions.
Les systèmes d’alerte anticollision (FCWS) sont basés sur des capteurs qui surveillent en continu
certains paramètres tels que la distance, la vitesse relative et la position latérale entre le véhicule
précédent et le véhicule équipé. Lorsqu’un certain seuil est atteint, le système fournit un signal
avertisseur pour prévenir le conducteur de la présence d'un risque potentiel de collision. Dans la
conception des systèmes, il est préconisé que le signal avertisseur prenne fin lorsque la condition de
déclenchement n'est plus remplie ou lorsque le conducteur a initié une réponse appropriée (e.g.,

Chapitre 2
24
freinage) (SAE J2400, 2003). En plus d’avertir les conducteurs de la présence d’une possible collision
au moyen du déclenchement d’une alerte (FCWS), certains systèmes anticollision peuvent également
prendre une part active (Forward Collision Avoidance System, FCAS) dans le processus d’évitement
ou d’atténuation de la collision principalement par la modulation de l'application partielle ou complète
des freins. De plus, une traction sur la ceinture de sécurité peut à la fois avertir d’une collision
potentielle et assurer plus de sécurité en cas de collision. Ces différents types de systèmes actifs
pourraient prévenir ou réduire la gravité de la collision si le conducteur ne réagit pas à temps ou s’il ne
réagit pas du tout, par exemple, en cas de distraction ou de somnolence. Ainsi, un système actif
pourrait être d’un grand bénéfice dans la prévention de collisions, car il a été démontré que la plupart
des conducteurs n’appliquent pas assez de force sur la pédale de frein pour éviter la collision (Breuer,
Faulhaber, Frank, & Gleissner, 2007) et qu'un pourcentage élevé des conducteurs ne relâchent pas la
pédale d'accélérateur ou même ne réagissent pas du tout (Najm, Stearns, Howarth, Koopmann, &
Hitz, 2006) dans ce type de collisions. Cependant, ces systèmes actifs pourraient comporter
également un risque plus grand pour les autres usagers de la route en cas de faux positifs ou fausses
alarmes, c’est-à-dire, quand le système réagit lorsqu’il n’y a pas de danger (Grover et al., 2008).
2.1.4. Modalités du signal avertisseur
Diverses modalités des signaux avertisseurs ont été employées pour alerter les conducteurs : signal
auditif, visuel ou tactile.
En ce qui concerne les signaux auditifs, des recherches ont essayé de déterminer le type signal le
plus approprié pour éviter les collisions par l’arrière. Les signaux auditifs peuvent être présentés sous
la forme d'une tonalité simple (par exemple, un signal à une fréquence de 2000 Hz), une tonalité
spécifique associée à une signification particulière connue de l’usager (par exemple, le son indiquant
la réception d’un message), une icône auditive (par exemple, le klaxon d’une voiture) ou un message
vocal (par exemple, « danger ») (Campbell, Richard, Brown, & McCallum, 2007). En général, les
signaux sonores les plus efficaces en termes de temps de réaction plus rapides correspondent à des
sons simples (Campbell et al., 2007) qui peuvent être plus facilement manipulés pour générer un
sentiment d’urgence (Edworthy, Loxley, & Dennis, 1991). Les icônes auditives ont également prouvé
leur efficacité dans la réduction des temps de réaction des conducteurs (Belz, Robinson, & Casali,
1999; Graham, 1999; Harder, Bloomfield, & Chihak, 2003). Cependant, leur utilisation pourrait être
source de confusion pour les conducteurs qui peuvent avoir des problèmes lorsqu'il s'agit de
distinguer si le son vient de l'extérieur ou de l’intérieur de l’habitacle (Campbell et al., 2007).
La présentation soudaine d’un symbole remarquable est la méthode la plus appropriée pour fournir
des informations de type visuel au conducteur (Campbell et al., 2007). Il est recommandé que les
Cadre Théorique
25
signaux visuels soient situés dans un angle de vision entre 10 et 15°, de façon à ce qu'ils puissent être
détectés facilement sans que le conducteur ait à changer la direction du regard (Campbell et al., 2007;
SAE J2400, 2003). De plus, ces signaux devraient être utilisés pour compléter ou renforcer un signal
primaire de type auditif ou tactile. En effet, l'information pourrait ne pas être perçue par le conducteur
ou pourrait même être une source de distraction si la modalité visuelle est utilisée comme le seul
moyen d'alerte (ISO 15623, 2002; SAE J2400, 2003).
Les signaux tactiles présentés dans les systèmes anticollision peuvent se présenter principalement
comme une vibration dans le volant ou le siège, comme une traction dans la ceinture de sécurité ou
comme une force antagoniste sur la pédale d'accélérateur (Campbell et al., 2007). En général, les
signaux tactiles se sont révélés moins efficaces que les signaux auditifs (Ho, Reed, & Spence, 2007;
Ho & Spence, 2009) et les résultats concernant leur utilisation ne sont pas concluants. Il semblerait
que l'information haptique puisse ne pas être perçue par les conducteurs dans certaines situations,
par exemple, sur certaines surfaces de route ou en fonction de la position et des mouvements du
conducteur (Kiefer et al., 1999). Ainsi, les systèmes utilisant exclusivement le mode tactile comme
moyen d'alerter le conducteur devraient être limités aux situations dans lesquelles le signal auditif
n’est pas complètement efficace (par exemple, lors de l’usage simultané d’autres systèmes d’alerte
auditive, lorsque le conducteur a des problèmes auditifs, etc.) (Campbell et al., 2007).
De nombreuses études ont mis en évidence le bénéfice des signaux multimodaux par rapport aux
signaux unimodaux (Campbell et al., 2007; Ho et al., 2007; Ho & Spence, 2009), les premiers étant
plus facilement perçus par les conducteurs dans des conditions de distraction (Kramer, Cassavaugh,
Horrey, Becic, & Mayhugh, 2007; Spence & Santangelo, 2009).
Certaines préconisations (Campbell et al., 2007; ISO 15623, 2002; SAE J2400, 2003) indiquent que
pour augmenter son efficacité, le système anticollision devrait avertir les conducteurs en deux étapes.
Dans un premier temps, le système devrait fournir un avertissement « préliminaire » à la collision pour
informer le conducteur de la présence de l'obstacle puis dans un second temps, un avertissement
« imminent » à la collision pour informer le conducteur de la nécessité de réagir pour éviter la collision.
De plus, l’usage des signaux auditifs est recommandé en combinaison avec des signaux visuels
(Campbell et al., 2007; Kiefer et al., 1999; Kramer et al., 2007). Ceci permettrait d’améliorer l’efficacité
du signal surtout dans des conditions bruyantes et pourraient également apporter une information
redondante ou supplémentaire au signal auditif (Campbell et al., 2007).

Chapitre 2
26
2.1.5. Fonctionnement du système anticollision : Algorithmes
Le déclenchement du signal avertisseur est déterminé au moyen d'algorithmes qui calculent un seuil
spécifique en fonction de différents paramètres. Bien qu'une grande variété d'algorithmes ait été
conçue pour calculer le moment de déclenchement du signal (voir par exemple, McLaughlin, Hankey,
Dingus, & Klauer, 2009; Seiler, Song, & Hedrick, 1998), la plupart d'entre eux sont basés sur deux
approches générales : une approche cinématique ou une approche perceptuelle (Bella & Russo,
2011; Brown, Lee, & McGehee, 2001). L’approche cinématique détermine la distance minimale
nécessaire pour arrêter le véhicule en conditions de sécurité. Pour cela, cet algorithme calcule
certains paramètres spécifiques aux véhicules impliqués dans la possible collision, comme la vitesse,
la position et la décélération. De plus, il incorpore également une estimation de deux paramètres
spécifiques au conducteur qui peuvent influer considérablement l'efficacité du signal : le temps de
réaction et la force de décélération (McLaughlin, Hankey, & Dingus, 2007). L’approche perceptuelle
est basée sur le temps avant que la collision se produise si la position et la vitesse actuelle des
véhicules restent constantes. Actuellement, il n'y a pas une dominance claire d'un modèle sur l’autre,
ni d’un algorithme sur un autre. Pratiquement chaque modèle de voiture à son propre algorithme ce
qui se traduit par des temps d'alerte qui peuvent varier largement dans des conditions de trafic
similaires. Une étude réalisée sur piste avec trois modèles différents de véhicules équipés d’un FCWS
a estimé le temps à la collision avec le véhicule précédent à partir du moment où le signal avertisseur
est déclenché (Forkenbrock & O'Harra, 2009). Bien que les conditions de simulation aient rempli les
mêmes critères pour les trois véhicules, les prédictions du temps à la collision ont montré des
différences allant jusqu’à 800 ms entre un modèle et un autre.
Le choix des paramètres appropriés dans la conception des systèmes anticollision est décisif pour
l’efficacité du système et, par conséquent, pour le rejet ou l'acceptation par les conducteurs.
2.1.6. Systèmes réels sur le marché
De nombreux systèmes anticollision ont été conçus et introduits sur le marché (Forkenbrock &
O'Harra, 2009; Grover et al., 2008; Schoitsch, 2008). En général, ils apparaissent intégrés à des
systèmes de régulation de vitesse adaptatifs (systèmes qui maintiennent une vitesse et une distance
de sécurité constante, Adaptive Cruise Control) car ils utilisent les informations fournies par les
mêmes capteurs. La plupart des systèmes anticollision intégrés dans les véhicules comportent le
système d’alerte (FCWS) et le système d’évitement de collisions (FCAS). Dans la première phase, le

Cadre Théorique
27
système généralement active un signal auditif et visuel qui est suivie d’une phase de freinage
autonome du véhicule, si le conducteur n’a pas réagi. Cette phase de freinage peut également être
accompagnée de signaux auditifs, visuels voire tactiles (Campbell et al., 2007; Grover et al., 2008).
Actuellement, les capteurs des systèmes anticollision couvrent une distance comprise entre 100 et
200 m de long et détectent des obstacles situés dans un angle d'environ 16° dans le plan horizontal et
4° approximativement dans le plan vertical. Le système est activé à partir d'une certaine vitesse
(autour de 10 ou 15 km/h). Il détecte tous les véhicules stationnaires apparaissant dans la même
trajectoire du véhicule en question ainsi que les véhicules en mouvement, à l'exception de petits
véhicules à deux roues. Le système peut ne pas fonctionner lorsque les capteurs sont totalement ou
partiellement bloqués (par la neige, les salissures, etc.) ou lorsqu’un un défaut est détecté. Dans ces
cas, le système peut informer les conducteurs à travers des signaux visuels et éventuellement auditifs
de cette interruption temporaire du système. De plus, le système peut ne pas être efficace dans
certaines conditions, comme lorsque la distance inter-véhiculaire est trop petite, quand il y a des
décélérations et accélérations brusques ou lors de changements soudains de trajectoire d'un véhicule.
(European Commission, 2011; Grover et al., 2008; ISO 15623, 2002; SAE J2400, 2003).
2.1.7. Bénéfices du système
Au cours des dernières années, les systèmes d'alerte anticollision ont connu un rapide essor grâce à
leur contribution positive dans le domaine de la sécurité routière. Pour cette raison, la Commission
Européenne (2009) a récemment proposé l'installation obligatoire de systèmes avancés de freinage
d’urgence (FCWS et FCAS) dans les véhicules lourds à partir du 1er Novembre 2013. Les véhicules
légers seront exemptés pour le moment car le rapport coûts-bénéfices estimé est à l'heure actuelle
inférieur par rapport aux véhicules lourds.
Bien que la plupart des études sur les systèmes anticollision soulignent leurs effets positifs, le
pourcentage de bénéfices estimé peut varier en fonction des méthodologies utilisées. Ainsi, nous
allons présenter les bénéfices estimés par la modélisation des données d’accidents réels par
différents algorithmes, par des études réalisées sur simulateur de conduite ou sur piste, et par des
données provenant des compagnies d’assurance. Enfin, nous parlerons de l’acceptation de ces
systèmes par les conducteurs.
- Bénéfices estimés par modélisation. Ces techniques appliquent les différents algorithmes sur des
données d’accidents de la vie réelle pour prédire le nombre d'accidents qui auraient pu être évités si le
système avait été disponible. En utilisant cette méthode, Georgi, Zimmermann, Lich, Blank, Kickler et
Marchthaler (2009) ont estimé que le FCWS pourrait éviter 38% des collisions et le FCAS 72%. De

Chapitre 2
28
plus, lorsqu’un accident est inévitable, la vitesse moyenne de collision est réduite de 9% pour le
FCWS et de 25% pour le FCAS. Cependant, en fonction de la base de données utilisée, le bénéfice
des systèmes anticollision peut varier considérablement. Ainsi, selon les données fournies par Zhu
(2001) le pourcentage de réduction des collisions est plus élevé pour le système d'alerte (17%) que
pour le système d'évitement (5%). Si le signal avertisseur est déclenché suffisamment à l’avance, le
conducteur pourrait être capable d’éviter la collision par lui-même sans que le système d’évitement
soit activé, ce qui pourrait expliquer ce résultat. Cependant, le bénéfice potentiel en termes de
réduction de la mortalité reste plus élevé pour le système d'évitement que pour le système d’alerte
(29% versus 24%, respectivement).
- Bénéfices estimés à partir des études sur simulateur de conduite. Les simulateurs de conduite
ont été l'un des outils les plus fréquemment utilisés dans l'évaluation de l’efficacité des FCWS. Les
bénéfices dans ces études ont montré, par exemple, une réduction du nombre de collisions (Lee,
McGehee, Brown, & Reyes, 2002), des temps de réaction au freinage plus rapides suite à la détection
de situations critiques dans des conditions de visibilité normales (Abe & Richardson, 2006) ou réduites
(Harder et al., 2003) et l'adoption de distances de sécurité plus longues et plus sûres (Ben-Yaacov,
Maltz, & Shinar, 2002).
- Bénéfices estimés à partir des études sur piste. L’efficacité de ces systèmes a été aussi analysée
par des études réalisées en conditions plus écologiques. Par exemple, Najm et al. (2006) ont évalué
l'impact d’un système anticollision et d’un système de régulation de la vitesse adaptatif (Adaptive
Cruise Control) pendant quatre semaines lors d’une étude réalisée dans des conditions réelles de
conduite (Field Operational Test). Les résultats ont indiqué que le taux des évènement critiques, tels
que l’exposition à des conflits et quasi-accidents, a été réduit d’environ 20% dans la dernière période
par rapport à la première période d’utilisation du système. Avec les données de cette étude, les
auteurs ont estimé en se basant sur différentes bases de données, que le système pourrait prévenir
environ 10% des collisions par l’arrière.
- Bénéfices estimés à partir des données des compagnies d’assurance. Finalement, une autre
façon d'estimer l'impact des systèmes anticollisions dans le monde réel peut se faire à travers
l'analyse des déclarations faites aux compagnies d'assurance. Ainsi, une étude a analysé l'impact de
plusieurs systèmes d'aide à la conduite sur le marché, en comparant le nombre de déclarations
provenant d’usagers ayant un véhicule équipé de systèmes d'assistance à celles provenant d’usagers
ayant un véhicule non équipé. Le système d'évitement de collisions s'est imposé comme l'un des
systèmes présentant le plus de bénéfices, particulièrement, en termes de réduction des demandes
d'indemnisation de dommages des véhicules. Le système d'alerte anticollision semble également
réduire le taux d'accidents mais à une moindre échelle. Une des explications possibles à ce dernier
résultat serait donnée par les différences entre les caractéristiques des deux systèmes. Par exemple,
le système d’alerte anticollision commence à fonctionner à partir de 32 km/h alors que le système
d'évitement commence à partir de 5 km/h. En général, bien que ces résultats soient positifs au sujet
de l'utilisation de ces systèmes, ces données doivent être interprétées avec prudence en raison de
certaines limitations. Notamment, l’état du système (actif ou inactif) au moment des accidents n’était

Cadre Théorique
29
pas connu. De plus, les données ne rapportaient pas d’information détaillée concernant les conditions
de la collision. Or, il est important de connaître certaines informations comme le point de collision afin
d’estimer l’implication de chaque système dans chaque type de collision (Highway Loss Data Institute,
2012a, 2012b, 2012c).
Que ce soit à travers des études de modélisation des données, des expériences sur simulateur de
conduite ou dans des conditions plus écologiques, ou à partir de données des assurances, tous ces
résultats ont montré que le système anticollision a un effet positif. Le bénéfice fluctue d’environ 5 à
70% en fonction des différentes études, différents systèmes ou différentes caractéristiques des
conducteurs.
- Acceptation des systèmes anticollision par les conducteurs. Le succès des systèmes
anticollision ne dépend pas seulement de leur capacité à prévenir les accidents, mais aussi de
l'acceptation du système par les conducteurs. Certains facteurs critiques comme, par exemple, un
taux élevé de fausses alertes (Najm et al., 2006) ou une activation trop précoce de l'alerte (Abe &
Richardson), peuvent amener les usagers à arrêter d’utiliser ces systèmes. Cependant, en dehors de
ces éléments, l’assistance des systèmes anticollisions est évaluée positivement à la fois dans les
études sur simulateur de conduite (Chun et al., 2012; Itoh, Horikome, & Inagaki) et dans les études
sur route réelle (Najm et al., 2006). Les résultats d'une enquête avec 86 propriétaires de véhicules
équipés d’un système anticollision (système d’alerte plus freinage autonome) ont révélé que 88% des
conducteurs conduisaient toujours avec le système activé (Braitman, McCartt, Zuby, & Singer, 2010).
La plupart ont déclaré avoir reçu au moins un signal avertisseur du système même si une grande
partie de ces signaux n'ont pas été associés par les utilisateurs à un risque d'accident. Il est
intéressant de noter que 46% des propriétaires ont constaté conduire avec des marges de sécurité
plus grandes. Le potentiel de ce système en termes de sécurité et sa capacité à réduire le stress
généré par la situation de conduite a été mis en évidence. Ces résultats ont ensuite été reproduits
dans une autre enquête avec plus de 300 utilisateurs (Eichelberger & McCartt, 2012). Toutefois, dans
ce cas, seulement 12% des conducteurs ont constaté conduire de façon plus sûre en respectant de
plus grandes distances de sécurité.
2.1.8. Facteurs influençant l’efficacité des systèmes
Jusqu’à ici nous avons présenté les caractéristiques principales des systèmes anticollision ainsi que
leurs bénéfices au niveau général. Cependant, l’efficacité de ces systèmes peut être modulée par
certains facteurs. Nous allons maintenant introduire dans ce travail de thèse deux facteurs importants
qui peuvent affecter l’efficacité des systèmes. En premier lieu, nous détaillons l’impact du niveau de

Chapitre 2
30
fiabilité et des erreurs du système sur le comportement des conducteurs. Ensuite, nous allons parler
de l’impact des systèmes en fonction de l’état attentionnel des conducteurs : distraits et non distraits.
2.1.8.1. Fiabilité du système
Il est préconisé que l’information fournie aux conducteurs soit opportune et précise (European
Commission, 1998). Cependant, à ce jour aucun système anticollision n’est fiable à 100%. En effet,
selon le type d'algorithme et de capteur, le système peut mal fonctionner, produisant des défauts de
détection des événements critiques et/ou des fausses alarmes. Les fausses alarmes se réfèrent à des
situations dans lesquelles un signal avertisseur est déclenché en l'absence de risque de collision. Les
défauts de détection se produisent lorsqu'un signal avertisseur n'est pas déclenché bien que la
situation l'exigerait. Par ailleurs, certains signaux avertisseurs déclenchés lorsqu'une collision est
effectivement imminente peuvent être inefficaces si ils sont perçus par les conducteurs comme
inappropriés en raison de leur fréquence, le moment de déclenchement, leur intensité ou leur modalité
(Abe & Richardson; Campbell et al., 2007; Lee et al., 2002; Lees, 2010).
Du fait de leur caractère irritant ou distrayant, un nombre trop élevé de fausses alarmes pourrait avoir
pour conséquence que les utilisateurs ignorent ou réagissent de manière inappropriée à de nouveaux
signaux avertisseurs (Lerner, Dekker, Steinberg, & Huey, 1996). De même, un taux très élevé de
défauts de détections peut devenir critique pour l'acceptation et la confiance dans le système (Abe,
Itoh, & Tanaka, 2002). Toutefois, les fausses alarmes et les non-détections n’ont pas toujours que des
effets négatifs. Par exemple, si un système ne produit jamais de fausses alarmes, le premier
déclenchement d’un signal correspondrait à un risque réel de collision. Puisque la probabilité d’avoir
une collision par l’arrière est relativement faible, les conducteurs pourraient ne pas réagir de façon
appropriée lors de ces situations (Parasuraman, Hancock, & Olofinboba, 1997). D'autre part, si un
système détecte tous les possibles risques de collision, les conducteurs pourraient accorder trop de
confiance au système et devenir vulnérables (Parasuraman et al., 1997), par exemple, si le système
tombait en panne ou si ils devaient conduire un autre véhicule non équipé.
Il est donc nécessaire de trouver un seuil approprié entre le taux de fausses alarmes et de défauts de
détections d’un système. Cependant, les efforts à ce regard n’ont pas été concluants (Kiefer et al.,
1999; Lerner et al., 1996; Parasuraman et al., 1997). Nous ne disposons pas de données chiffrées
claires sur les taux réels de fausses alarmes et de défauts de détection de collisions. Les résultats
obtenus soit par des études réalisées sur piste (Najm et al., 2006; Stein, Solomon, & Ziedman, 1992),
soit par de la modélisation à partir de vrais accidents (McLaughlin, 2007) ont montré une faible
précision du système (entre 32 et 56%) et un pourcentage très élevé de fausses alarmes (environ

Cadre Théorique
31
60%). Sachant qu’il est recommandé que le taux de signaux avertisseurs considérés comme une
nuisance ne dépasse pas un signal pour 322 km parcourus (Kiefer et al., 1999), les données
présentées ci-dessus ne paraissent pas très encourageantes.
D'autres études ont porté sur la fiabilité du système en se concentrant sur le pourcentage des alertes
efficaces, sans préciser le nombre de fausses alarmes ou de défauts de détections. En général, plus
le niveau de fiabilité est haut, meilleurs sont les résultats. Toutefois, le point où le système devient
inefficace reste incertain. Bliss et Acton (2003) ont noté que les participants répondaient plus
fréquemment au signal avertisseur et ils évitaient les collisions de façon plus appropriée lorsque
l'alerte était fiable à 100% que lorsqu’elle était fiable à 75% ou 50%. Cependant, Cummings, Kilgore,
Wang, Tijerine et Kochhar (2007) n’ont trouvé aucune différence dans les temps de réaction aux
signaux déclenchés par un système de fiabilité faible (25% des signaux correctes, 75% de fausses
alarmes) par rapport à un système de haute fiabilité (75% des signaux correctes, 25% de fausses
alarmes). Toutefois, le pourcentage de réponses correctes (réagir à de possibles collisions et ne pas
réagir lorsqu’il s’agit de fausses alarmes) était réduit avec le système moins fiable. Néanmoins, Maltz
et Shinar (2004) et Ben-Yaacov et al. (2002) n'ont pas trouvé de différences entre des systèmes
fiables à 60, 80-85, et 90-95%. Wickens et Dixon (2007) ont effectué une méta-analyse portant sur 22
études qui ont examiné des systèmes d’automatisation imparfaits. Ils ont conclu qu’un niveau de
fiabilité de 70% pourrait être le critère à partir duquel un système peut être considéré comme étant
efficace.
2.1.8.2. Impact de l’état attentionnel des conducteurs
Comme il a été mentionné précédemment, la principale cause des collisions par l’arrière est la
distraction du conducteur. Dans ce type de situations les ressources attentionnelles du conducteur
peuvent être réduites par les demandes de la tâche secondaire. C’est donc dans ces conditions, que
les FCWS devraient être particulièrement utiles pour aider les conducteurs à anticiper des
événements dangereux et à réagir plus rapidement.
La plupart des études présentées plus haut ont évalué les effets de ces systèmes chez les
conducteurs non distraits. Nous pouvons nous interroger maintenant sur les études évaluant
l’efficacité du système uniquement chez les conducteurs distraits. Les données existantes obtenues
sur simulateurs de conduite ont montré que les conducteurs distraits peuvent également bénéficier
des systèmes d'alerte anticollision.

Chapitre 2
32
Tableau 2. Récapitulatif des études illustrant les effets du système anticollision chez les conducteurs
distraits.
En général, ces études ont mis en évidence des résultats positifs du système en utilisant des tâches
secondaires à caractère visuel (voir Tableau 2). Ainsi, les résultats de Maltz et Shinar (2007) ont
montré que les participants distraits qui conduisaient avec l'aide d’un signal avertisseur auditif,
passaient plus de temps avec des marges de sécurité plus sûres (> 1 seconde) et moins avec des
marges moins sûres (< 1 seconde) que les participants qui ne disposaient pas du système. De même,
Chun et al. (2012) ont trouvé que la présence d’un signal tactile aidait les participants distraits à réagir
plus rapidement aux décélérations brusques du véhicule précédent et à éviter plus d’accidents que
lorsque le signal n’était pas disponible. Au contraire, les résultats de Muhrer, Reinprecht et Vollrath
(2012) utilisant un système d’alerte couplé à un système d’évitement des collisions (signal auditif et
visuel), n’ont pas observé de bénéfice avec le système que ce soit au niveau des temps de réaction,
des distances inter-véhiculaires ou des taux de décélérations. Leurs résultats ont montré certains
effets négatifs du système se traduisant par une légère augmentation de la vitesse et une
augmentation de la fréquence des regards vers le tableau de bord. Cependant, l’effet du système a
été globalement positif car aucun accident n’a été signalé pour les participants disposant du système,
contrairement à ceux conduisant sans système. Enfin, Kiefer, Cassar, Flannagan, Jerome et Palmer
(2005) ont montré le bénéfice d’un FCWS composé d’un signal auditif et visuel dans des conditions de
conduite plus réalistes (sur piste). Cependant, leurs résultats dépendent du type de tâche secondaire

Cadre Théorique
33
réalisé par les participants. Le système a été efficace lorsque les participants ont réalisé une tâche de
distraction visuo-motrice. En revanche, le système n’a pas montré d’effets positifs lorsque les
participants réalisaient une tâche de distraction cognitive. Il faut noter, cependant, qu’aucune
intervention par l’expérimentateur n’a été nécessaire dans cette condition.
De façon plus intéressante, en plus d’observer l’efficacité de ces systèmes uniquement chez les
conducteurs distraits, d’autres auteurs ont comparé les effets des systèmes chez les conducteurs
distraits et non distraits. En général, la plupart de ces études menées dans un simulateur ont montré
un bénéfice similaire pour les conducteurs distraits et pour les conducteurs non distraits, mais de
nouveau avec une forte propension à utiliser des tâches secondaires visuelles ou visuo-motrices (voir
Tableau 3).
Tableau 3. Récapitulatif des études illustrant les effets du système anticollision chez les conducteurs
distraits et non distraits.

Chapitre 2
34
Par exemple, Ho et Spence (2009) ont constaté que les participants distraits et non distraits
bénéficiaient de façon similaire du signal d'alerte auditif en termes de temps de réactions et de
réponses correctes. Ces résultats ont été confirmés par l’étude de Kramer et al. (2007) utilisant un
signal auditif et visuel et, de plus, ils ont trouvé un bénéfice en termes de diminution des collisions. De
même, Lee et collaborateurs (2002) ont montré l'effet positif d’un FCWS de type auditif et visuel
lorsque les conducteurs étaient distraits et non distraits. Précisément, leurs résultats ont montré des
marges de sécurité plus larges, des temps de réaction plus rapides et des décélérations plus
progressives lorsque le système était disponible. En outre, le système a également eu un impact en
réduisant le nombre de collisions ainsi que la vitesse à l’impact, ce bénéfice étant plus important pour
les conducteurs distraits que pour les non distraits.
Contrairement à ces résultats, l’étude de Abe, Itoh et Yamamura (2011) a montré des bénéfices d’un
signal auditif uniquement chez les conducteurs distraits. Cependant, les auteurs ont suggéré que ce
résultat pourrait être expliqué par des conditions de trafic intense où la haute fréquence de
déclenchement du signal pourrait être perçue comme non nécessaire. Les données subjectives ont
confirmé cette idée, montrant que les conducteurs non distraits évaluaient les signaux avertisseurs
comme non nécessaires, contrairement aux conducteurs distraits. Ainsi, il semble que les conducteurs
distraits essayaient de compenser leur manque de ressources attentionnelles à l'aide du système
même dans des conditions de trafic intense qui permettaient de mieux anticiper le comportement du
véhicule précédent.
Finalement, l’expérience de Mohebbi, Gray et Tan (2009) est particulièrement intéressante car elle
montre que les bénéfices du système peuvent varier en fonction du type de signal et en fonction du
type de tâche secondaire. À la différence des autres études, ces auteurs ont analysé l'efficacité de
deux signaux avertisseurs différents, un auditif et un autre tactile, mais en utilisant une tâche de
distraction cognitive et non visuelle. De plus, deux niveaux de difficulté de la double tâche (simple et
complexe) ont été manipulés. Leurs résultats ont montré que lorsque les participants étaient engagés
dans une conversation complexe, seul le signal tactile était efficace mais pas le signal auditif. Les
comparaisons entre les différents signaux selon les conditions sans distraction et avec distraction
simple, n’ont pas été détaillées dans l’article. Cependant, graphiquement il semblerait que le bénéfice
soit aussi plus important pour le signal tactile que pour le signal auditif dans la condition de distraction
simple, tandis qu’il n’y aurait pas de différences entre les deux signaux dans la condition sans
distraction.
Au vu de cette revue de la littérature, il semble donc que selon le type de tâche secondaire, différents
signaux d’avertissement n’aient pas les mêmes effets.

Cadre Théorique
35
2.1.9. Adaptation comportementale au système
L'adaptation comportementale a été définie comme « ces comportements qui peuvent survenir suite à
l'introduction de changements dans le système route-véhicule-utilisateur et qui ne sont pas attendus
par l’initiateur du changement » (OECD, 1990). Compte tenu de sa possible répercussion sur la
sécurité routière, l'étude de l’adaptation comportementale à un système s’est focalisée sur les
adaptations ayant un caractère négatif. Cependant, une vision plus large pourrait être adoptée en
tenant compte également de toutes les modifications pertinentes positives liées à l’introduction du
système (Saad et al., 2004).
Les changements de comportement peuvent apparaître au cours des premiers contacts avec le
système (phase d'apprentissage) lorsque les conducteurs apprennent comment fonctionne le
système, mais aussi après une longue période d'exposition (phase d'intégration) une fois que les
conducteurs ont acquis un plus grand niveau d'expérience avec le système (Saad et al., 2004).
Bien que les ADAS aient été conçus pour assister les conducteurs dans la tâche de conduite, ils
peuvent également modifier négativement le comportement des conducteurs. Par exemple, si les
conducteurs accordent trop de confiance au système, ils pourraient réduire la surveillance ou le
contrôle de certaines sous-tâches de la conduite. De plus, ils pourraient s’engager dans plus de
tâches secondaires, voire adopter plus de comportements à risque.
En ce qui concerne l’usage du FCWS, la plupart des résultats ont été obtenus après une brève
exposition au système dans des études à court terme. Comme il a été mentionné antérieurement, les
résultats de ces études ont montré un effet positif global du système. De plus, il semble que les
conducteurs ne montrent pas plus d’engagement dans des tâches secondaires lorsqu’ils conduisent
avec le système. Kidd, Nelson et Baldwin (2010) ont demandé aux participants de conduire à l’aide
d’un système d’alerte anticollision en même temps qu’ils réalisaient une tâche secondaire visuo-
motrice (taper des séquences de chiffres précédemment données sur un écran). Ces auteurs ont
constaté que, contrairement à la période antérieure au déclenchement du signal avertisseur, les
participants ayant reçu un signal ont pris plus de temps à initier de nouveau la tâche secondaire, ainsi
qu’à valider leurs réponses. De plus, Muhrer, Reinprecht et Vollrath (2012) ont conclu à partir d'une
étude réalisée dans un simulateur de conduite que conduire avec un système anticollision (signal
avertisseur plus freinage autonome) n’incite pas plus les conducteurs à s’engager dans une tâche
secondaire. L'analyse des mouvements oculaires ainsi que celle des temps de réaction et du nombre
de réponses à la tâche secondaire n'ont montré aucune différence entre les participants qui ont
conduit avec et sans le système. Cependant, l’adaptation au système peut être affectée par certaines
caractéristiques du système (e.g., le moment de déclenchement du signal avertisseur, le niveau de
fiabilité, etc.) comme il a été montré précédemment. De plus, d’autres facteurs liés au conducteur
peuvent également influencer l’adaptation comportementale à ces systèmes tels que les attitudes et

Chapitre 2
36
traits de personnalité et même les attentes que les conducteurs ont en ce qui concerne le
comportement du véhicule précédent.
Selon le modèle de Rudin-Brown and Noy (2002), l’adaptation comportementale peut être influencée
par des variables de personnalité comme le locus de contrôle (e.g., la tendance à considérer que les
événements qui nous affectent sont le résultat de nos propres actions, locus de contrôle interne ou, au
contraire, qu’ils sont le fait de facteurs externes, locus de contrôle externe), la recherche de
sensations intenses et variées et la prise de risque pour les obtenir. Ainsi, par exemple, une personne
avec un locus de contrôle externe pourrait être plus prédisposée à utiliser le système mais aussi
pourrait être plus vulnérable aux possible défaillances du système car elle s’appuierait moins sur ses
propres habilités, contrairement à une personne avec un locus de contrôle interne. D’autre part, une
personne qui recherche de nouvelles sensations pourrait montrer plus d’adaptations négatives au
système, par exemple, en s’engageant dans plus de tâches secondaires (Rudin-Brown & Parker,
2004). Bien que l’influence du style du conducteur sur l’efficacité du FCWS n’ait été que peu étudiée,
les résultats existants n’indiquent pas une forte influence de ce facteur. Jamson, Lai et Carsten (2008)
ont mené une étude sur simulateur de conduite pour analyser les avantages d'un FCWS en tenant
compte du style du conducteur (recherche de sensations, préférence pour la distance de sécurité et
temps de réactions individuels). Leurs résultats ont indiqué que le style du conducteur a eu peu ou
aucun impact sur la réaction aux décélérations du véhicule précédent. Seuls les conducteurs qui
avaient tendance à conduire avec des marges de sécurité plus petites ont montré des temps de
réaction plus rapides lorsque le système était disponible, les conducteurs qui adoptaient des distances
plus longues n’ayant montré aucune différence.
Finalement, les attentes des conducteurs, en ce qui concerne le comportement du véhicule précédent,
peuvent également influencer leur propre comportement. La plupart des collisions par l’arrière se
produisent dans des circonstances de trafic « normales » (ligne droite, trafic fluide, etc.) dans
lesquelles il est difficile de prévoir un freinage soudain du véhicule précédent. Cela a conduit Muhrer
et Vollrath (2010) à faire l’hypothèse que les conducteurs pourraient ne pas maintenir des marges de
sécurité adaptés à chaque situation, car l'attente d’un freinage brusque du véhicule précédent est très
faible. Cependant, si les conducteurs ont été précédemment exposés à un nombre élevés de
décélérations, ils pourraient modifier leurs attentes quant au comportement du véhicule précédent
(voir par exemple, Abe et al., 2011; Lee et al., 2002; Muhrer & Vollrath, 2010; Murher et al., 2012).
En général, les études présentées ci-dessus sur les facteurs qui peuvent influencer l'adaptation du
conducteur au FCWS ont été réalisées sur de courtes périodes de temps. Elles ont principalement
analysé l’impact du système lors de la phase d'apprentissage, c'est-à-dire, pendant les premières
utilisations du système. Cependant, la plupart de ces études ont utilisé la technique du
contrebalancement au cours de laquelle les périodes avec et sans système sont présentées dans un
ordre aléatoire. Par conséquent, à l'heure actuelle, la façon dont les conducteurs adaptent leur
comportement au système lors des premières utilisations (phase d'apprentissage et d'appropriation),
mais aussi après une utilisation plus prolongée (phase d'intégration) nécessite d’être mieux étudiée.

Cadre Théorique
37
Enfin, au-delà de l’adaptation au système, il est intéressant d’évaluer comment les conducteurs
pourraient réagir si le système n’est plus disponible (par exemple, par un dysfonctionnement du
système) aussi bien après une courte période d'utilisation du système qu’après une longue période
d’utilisation. Si les conducteurs sont devenus dépendants de l’aide du système, ils pourraient être très
vulnérables en cas de dangers potentiels si le système n'est plus disponible. Toutefois, si les
conducteurs considèrent le système comme un assistant et non comme un substitut du conducteur, ils
pourraient être capables de transférer l'effet positif du système, même quand il n'est plus disponible.
Une seule étude à notre connaissance a été réalisée en vue d’examiner l'effet à long terme d'un
FCWS sur le comportement de conduite (Ben-Yaacov et al., 2002). Celle-ci a été réalisée dans des
conditions de conduite réelle. Dans cette étude, les participants devaient conduire dans des conditions
réelles de circulation au cours de 4 périodes : avec (2ème période) et sans le système (1ère et 3ème
périodes et 4ème période six mois plus tard). Les conducteurs ont adopté des marges de sécurité plus
importantes immédiatement après l'exposition au système (3ème période). Fait intéressant, cet effet a
également été observé six mois plus tard, lorsque les participants ont de nouveau été exposés au
même circuit et sans l'assistance du système d’alerte.
2.2. Modèles cognitifs et processus attentionnels en conduite
automobile
Dans cette partie nous allons décrire les modèles classiques et plus actuels de l’attention, incluant la
présentation de la notion de signal avertisseur qui est un concept central dans cette thèse. Par
ailleurs, nous présenterons quelques modèles cognitifs de la conduite ainsi que les conséquences de
la distraction en termes de double tâche dans le domaine de la conduite.

Chapitre 2
38
2.2.1. Théories cognitives sur le traitement de l’information
2.2.1.1. L’attention comme un filtre sélectif
Les premiers modèles cognitifs sur l’attention ont porté sur les aspects sélectifs de l'attention. Ce
concept de sélectivité de l’attention a été illustré pour la première fois dans le modèle de filtre sélectif
de Broadbent (1958). Selon ce modèle, du fait de notre capacité attentionnelle limitée, nous ne
pouvons traiter qu’une seule information à la fois. L’existence d’un filtre est donc essentielle afin de
sélectionner cette information parmi le flux d'information continu que nous recevons en provenance de
notre environnement. Cette information est filtrée en fonction des caractéristiques physiques des
stimuli. Ainsi, le filtre apparaît à un stade précoce du traitement de l'information où seulement
l’information attendue serait filtrée pour être traitée ultérieurement. Ces concepts ont été modifiés par
des modèles postérieurs. Plus précisément, il a été proposé que le processus de sélection de
l’information aurait lieu plus tardivement (au niveau de la réponse) (Deutsch & Deutsch, 1963) et que
le filtre agirait plutôt comme un atténuateur de l'information non pertinente (Treisman, 1964).
Cependant, la notion de sélectivité dans le traitement de l’information, n’a pas été remise en question.
A l’heure actuelle, l’attention sélective (ou focalisée) peut être définie comme la capacité à traiter un
stimulus pertinent pour la tâche en cours tout en inhibant le traitement d’autres stimuli non pertinents
présentés en simultané. Cette définition suggère que l’attention dirigée vers un stimulus se fait au
détriment d’un autre (Coull, 1998).
2.2.1.2. L’attention comme un réservoir de ressources
À partir des années 70, ont émergés une série de modèles considérant l'attention comme un réservoir
de ressources de traitement ayant une capacité limitée. Selon la théorie de Kahneman (1973),
l’attention est un processeur central à capacité limitée. Lorsque les ressources attentionnelles
nécessaires pour la réalisation d'une ou plusieurs tâches sont plus importantes que celles disponibles,
une détérioration de la performance peut être observée. Ainsi, ce modèle met en relation la capacité
des sujets et les caractéristiques de la tâche. Le processeur central est responsable de la distribution
des ressources attentionnelles en fonction des règles permanentes (i.e., motivation, nouveauté), des
intentions momentanées, du niveau de difficulté de la tâche et du niveau d’arousal.

Cadre Théorique
39
Ce modèle a été complété par la notion du contrôle de traitement de l’information et la distinction entre
un traitement automatisé ou un traitement contrôlé. Dans cette ligne, Posner et Snyder (1975) ont
défini le traitement automatique comme un processus involontaire et inconscient qui n’interfère pas
avec toute autre activité mentale continue. A l’inverse, le traitement contrôlé est volontaire, conscient
et interfère avec une activité mentale concurrente. Par la suite, Schneider et Shiffrin (1977) ont ajouté
que le traitement automatique est rapide, parallèle et inflexible et nécessite peu de ressources
attentionnelles, contrairement au traitement contrôlé. Cependant, malgré les différences, ces deux
processus ne sont pas considérés comme indépendants, mais seraient sur un même continuum. Les
tâches de la vie quotidienne présentent toutes un ensemble de composantes automatiques et de
composantes contrôlées.
La notion de contrôle de l’attention a été reprise dans le modèle de Norman et Shallice (1986) (voir
Figure 1). Le centre de ce modèle est occupé par les schémas, qui sont des unités contrôlant les
actions. Ces schémas peuvent être activés à partir des informations en provenance des sources
internes ou externes à l’organisme. Un système de contrôle qui assure la sélection des unités
appropriées est donc nécessaire. Le gestionnaire des priorités de déroulement intervient de façon
passive et s’occupe de la coordination des schémas les plus pertinents dans des situations familières
ou routinières. Il permet de gérer la compétition entre les schémas qui peuvent être activés mais qui
ne sont pas compatibles. Lorsque la sélection des schémas n’est pas suffisante pour satisfaire les
demandes d’une tâche, intervient un deuxième mécanisme appelé le système attentionnel de
supervision (SAS). Ce système est particulièrement important pour répondre à des situations
nouvelles ou très complexes.
Figure 1. Modèle cognitif de Norman et Shallice (1986)
La notion de système attentionnel superviseur comme processeur central est comparable à la notion
de centre exécutif proposée par Baddeley (1974; 2000) (voir Figure 2). Selon ce modèle il existe trois
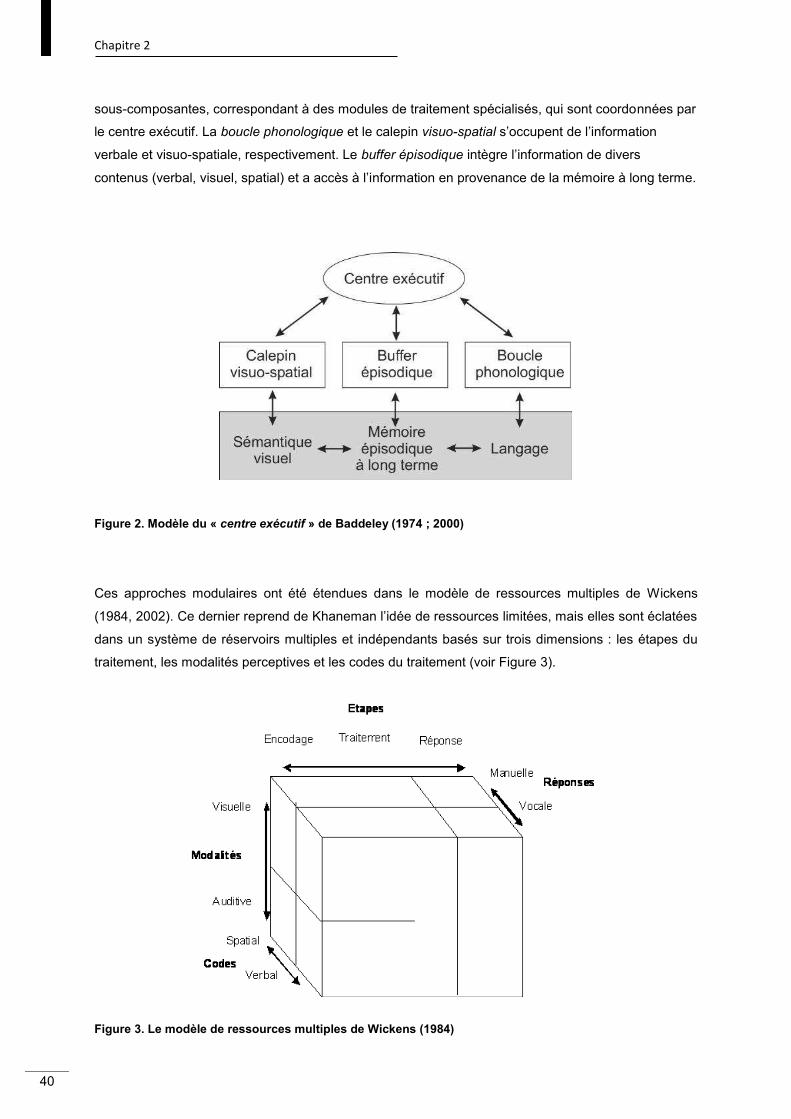
Chapitre 2
40
sous-composantes, correspondant à des modules de traitement spécialisés, qui sont coordonnées par
le centre exécutif. La boucle phonologique et le calepin visuo-spatial s’occupent de l’information
verbale et visuo-spatiale, respectivement. Le buffer épisodique intègre l’information de divers
contenus (verbal, visuel, spatial) et a accès à l’information en provenance de la mémoire à long terme.
Figure 2. Modèle du « centre exécutif » de Baddeley (1974 ; 2000)
Ces approches modulaires ont été étendues dans le modèle de ressources multiples de Wickens
(1984, 2002). Ce dernier reprend de Khaneman l’idée de ressources limitées, mais elles sont éclatées
dans un système de réservoirs multiples et indépendants basés sur trois dimensions : les étapes du
traitement, les modalités perceptives et les codes du traitement (voir Figure 3).
Figure 3. Le modèle de ressources multiples de Wickens (1984)

Cadre Théorique
41
- La dimension des étapes du traitement indique que les ressources utilisées pour les tâches
perceptives et cognitives sont différentes de celles nécessaires pour la sélection et l'exécution de la
réponse. Par exemple, pour un contrôleur aérien, le fait d’ajouter une confirmation vocale ou manuelle
de chaque changement d'état de l'avion (réponse), ne perturberait pas sa capacité à maintenir une
image mentale précise de l'espace aérien (demandes perceptuelle et cognitive). Cependant, selon
cette dimension, il y aurait une plus grande interférence entre les tâches nécessitant des ressources
perceptives et cognitives. En effet, même si elles représentent des stades différents du traitement de
l’information, les deux s'appuient sur des ressources communes. Par exemple, réaliser une tâche de
recherche visuelle et une tâche de rotation mentale pourraient nécessiter les mêmes ressources et
produire donc une plus grande interférence.
- La dimension des modalités est uniquement associée à l’étape perceptive et indique que la
perception auditive utilise des ressources différentes de la perception visuelle. En conséquence, la
présentation inter-modale de deux tâches (par exemple, visuelle et auditive) produira moins
d'interférence qu’une présentation intra-modale (par exemple, deux tâches visuelles ou deux tâches
auditives).
- La dimension des codes de traitement indique que les ressources concernant les activités spatiales
sont différentes de celles qui concernent les activités verbales ou linguistiques aussi bien à un niveau
perceptif, cognitif qu’au niveau de la réponse. La confirmation de cette distinction serait démontrée par
la relative efficacité avec laquelle les réponses manuelles (habituellement de nature spatiale) et
vocales peuvent être réalisées simultanément. Par contre, le contrôle manuel pourrait perturber la
performance des tâches coûteuses au niveau spatial, tandis que le contrôle verbal pourrait perturber
la performance de tâches verbalement coûteuses.
Selon le principe de base de ce modèle, deux tâches concurrentes seront réalisées de manière plus
efficace si elles ne requièrent pas le même niveau d’une dimension donnée que si elles utilisent des
structures communes. Ainsi, le modèle est capable de prévoir le niveau de performance lorsque deux
tâches ou plus sont réalisées simultanément. Cependant, cette interprétation n’implique pas que deux
tâches utilisant différents types de ressources peuvent être réalisées en même temps sans aucune
interférence, en particulier si les demandes en ressources d’une ou des deux tâches sont élevées. En
définitive, selon ce modèle, les ressources nécessaires (niveau de difficulté) comme les multiples
aspects ou dimensions d'une ou plusieurs tâches peuvent affecter la performance.

Chapitre 2
42
2.2.2. Modèles attentionnels
Les modèles sur le traitement de l’information présentés dans la section antérieure ont été à la base
des théories plus récentes sur l’attention. Nous allons privilégier ici deux modèles attentionnels qui ont
exploré l’un des concepts les plus importants dans le cadre de cette thèse : la notion du signal
avertisseur. Nous allons présenter le modèle de Posner et Petersen (1990), d’abord, et le modèle de
Van Zomeren et Brouwer (Van Zomeren & Brouwer, 1994), par la suite.
Le modèle de Posner et Petersen (1990) postule l’existence de trois réseaux neuronaux relativement
indépendants qui seraient à la base du contrôle attentionnel : le réseau du contrôle exécutif, le réseau
d’orientation et le réseau d’alerte.
- Le réseau du contrôle exécutif intervient dans des situations de conflit (Fan, McCandliss, Sommer,
Raz, & Posner, 2002), comme par exemple dans la tâche de Stroop (Stroop, 1935).
- Le réseau d’orientation vise à diriger l’attention sélectivement vers les localisations pertinentes de la
scène visuelle (Callejas, Lupiañez, Funes, & Tudela, 2005). L’une des tâches les plus utilisées pour
évaluer cette fonction consiste en la présentation soudaine d’un signal dans la position où la cible sera
présentée postérieurement (Posner, 2008).
- Le réseau d’alerte est défini comme un état de haute sensitivité aux stimuli à venir qui est
accompagné de changements au niveau physiologique de l’organisme (Posner, 2008). Posner
souligne qu’une importante fonction de ce réseau est la capacité de préparation et de maintenance de
la vigilance pour traiter les signaux pertinents (Posner & Petersen, 1990). Dans ce cadre, deux
niveaux d’alerte ont été proposés, l’alerte tonique et l’alerte phasique :
- L’état d’alerte tonique est modulé par les rythmes circadiens et est souvent mesuré dans des tâches
longues et monotones (Posner, 2008).
- L’alerte phasique, quant à elle, correspond à une préparation de la réponse aux stimuli et ce pendant
une courte durée (Sturm & Willmes, 2000). L’utilisation d’un signal avertisseur (par exemple un signal
sonore) est une méthode permettant d’étudier l’alerte phasique. Le signal avertisseur déclenché avant
la présentation d’une cible produit un changement au niveau de l’organisme qui se prépare pour
donner une réponse rapide (Posner, 2008).
Le modèle de Van Zomeren et Brouwer (1994) est un modèle de l’attention qui intègre des concepts
attentionnels proposés par Posner (Posner & Rafal, 1987), Kahneman (1973) et Norman et Shallice
(1986). Ainsi, les auteurs ont catégorisé l’attention en trois composantes : les aspects d’intensité, de
sélectivité et de contrôle.
- L’intensité, représente l’état d’alerte et inclut la distinction entre alerte phasique et tonique
précédemment décrites, et l’attention soutenue ou vigilance. L’attention soutenue est l’habilité à
maintenir l’attention pendant une durée prolongée. Bien que l’attention soutenue soit souvent utilisée
comme synonyme de vigilance, ces deux concepts peuvent être différenciés par la fréquence de la

Cadre Théorique
43
présentation des cibles : plus faible dans les situations de vigilance et plus élevée dans des tâches
impliquant l’attention soutenue.
- La sélectivité, représente l’attention sélective ou focalisée et l’attention divisée ou partagée qui ont
été précédemment décrites.
- Le contrôle permet de déplacer volontairement l’attention (flexibilité). Cette dimension module les
aspects d’intensité et de sélectivité de l’attention et agit de façon similaire au système attentionnel de
supervision du modèle de Normal et Shallice (1986).
2.2.2.1. Le rôle du signal avertisseur
Le modèle de Posner et Petersen (1990) et le modèle de Van Zomeren et Brouwer (Van Zomeren &
Brouwer, 1994) présentés précédemment, ont introduit la notion d’alerte phasique qui peut être
déclenchée par un signal avertisseur. Ici nous allons décrire plus en détail le fonctionnement de ce
signal ainsi que son rôle spécifique dans le comportement et le traitement de l’information.
L’amélioration des temps de réaction à une cible par la présentation préalable d’un signal avertisseur
a été l’un des phénomènes les plus étudiés en psychologie cognitive (Hackley & Valle-Inclán, 2003;
Rudell & Hu, 2001). Cette amélioration des temps de réaction est accompagnée de changements au
niveau physiologique de l’organisme, en particulier par le neurotransmetteur norépinephrine (Posner,
2008).
La fonction d’activation générée par le signal avertisseur semble dépendre de régions de l’hémisphère
droit (Posner & Petersen, 1990; Sturm & Willmes, 2000). De plus, certaines régions de l’hémisphère
gauche, liées probablement aux processus d’attention sélective ou d’inhibition, pourraient être
également impliquées (Sturm & Willmes, 2000).
L’activation générée par le signal avertisseur déclenché avant la présentation d’une cible semble être
liée au processus d’arousal et d’attente temporelle (Bueno & Ribeiro-do-Valle, 2012). L’arousal est
l’état de réactivité du sujet qui peut varier d’un état d’excitation à un état de sommeil (Coull, 1998).
L’attente temporelle, quant à elle, est un processus de préparation de réponse à la cible qui peut être
modulé par la présentation de signaux temporellement prédictifs de l’apparition de la cible, en fonction
des expériences préalables avec ces signaux (Correa, Triviño, Pérez-Dueñas, Acosta, & Lupiáñez,
2010).
Bien que le rôle du signal avertisseur au niveau comportemental ait été largement démontré, identifier
à quel niveau du traitement de l’information intervient ce signal reste un sujet de polémique. Le débat
porte sur le niveau de traitement qui est influencé par le signal, au niveau sensoriel ou perceptif, au
niveau de la sélection de la réponse, ou encore au niveau moteur (Boulinguez, Jaffard, Granjon, &
Benraiss, 2008; Fecteau & Munoz, 2007; Fischer, Plessow, & Kiesel, 2012; Hackley & Valle-Inclán,

Chapitre 2
44
2003; Rudell & Hu, 2001). Bien que ce débat ne soit pas encore tranché, un certain nombre
d’arguments suggèrent que le rôle du signal avertisseur pourrait agir dans les étapes préalables à la
réponse motrice.
Le bénéfice de la présentation d’un signal avertisseur en termes de temps de réponse plus rapide à la
cible est cependant accompagné par une augmentation du taux des erreurs (Posner & Petersen,
1990). Ainsi, le signal opérerait en accélérant le processus de sélection de la réponse à la cible plutôt
qu’en améliorant l’information en provenance de la cible (Posner, 1994, 2008). Posner a suggéré que
le réseau d’alerte agirait en inhibant le réseau de contrôle exécutif pour « nettoyer la conscience »,
par exemple, des pensées qui pourraient interférer avec la détection de la cible (Posner & Petersen,
1990). L’interaction entre ces deux réseaux a été démontrée à travers des études de neuroimagerie
(Cohen et al., 1988) et des études comportementales (Callejas et al., 2005; Funes & Lupiañez, 2003).
Dans la même idée, d’autres études utilisant la technique de l’électroencéphalographie (EEG) ont
confirmé l’hypothèse selon laquelle le signal avertisseur faciliterait la sélection de la réponse.
Brièvement, l’EEG est une technique d’analyse de l’activité électrique du cerveau qui permet de
dissocier les différentes étapes du traitement de l’information. En utilisant cette méthode, Hackley et
Valle-Inclan (2003) ont analysé le potentiel de préparation latéralisée (Lateralized Readiness
Potential) qui est une composante observée lors de la préparation motrice d’une réponse (Luck,
2005). Leurs résultats ont montré que la présentation d’un signal avertisseur accélérait le traitement
de l’information du stimulus présenté mais pas de la réponse donnée. Ce résultat a été interprété
comme une évidence en faveur de l’intervention du signal dans les étapes préalables au processus de
sélection de la réponse.
Correa, Lupiañez, Madrid et Tudela (2006) après avoir réalisé une revue de la littérature, ont conclu
que l’attente temporelle générée par le signal avertisseur module des composantes tardives liées aux
processus moteurs et à la prise de décision (composantes N2 et P3). Cependant, l’implication du
signal dans des étapes plus précoces du traitement de l’information sensoriel (composantes P1 et N1)
est moins certaine. Ces auteurs ont postulé que l’usage des tâches coûteuses au niveau perceptif
pourrait mettre en évidence l’effet du signal au niveau sensoriel. Ainsi, dans une étude réalisée avec
une tâche de discrimination de lettres, ils sont trouvé un effet modulateur à la fois aux étapes du
traitement sensoriel et au niveau du traitement moteur.

Cadre Théorique
45
2.2.3. Modèles cognitifs de la conduite
La conduite automobile est une activité très complexe impliquant des capacités perceptives, motrices
et cognitives. Le conducteur doit ainsi « monitorer » en permanence l’information en provenance de
l’environnement, de son propre corps et du véhicule, sélectionner les informations pertinentes pour la
tâche de conduite pour, enfin, prendre des décisions adaptées à chaque situation.
Certains modèles du fonctionnement du conducteur ont essayé de clarifier la complexité de l’activité
de conduite. Les principaux modèles proviennent des modèles hiérarchiques du contrôle cognitif et
des modèles motivationnels.
Selon les modèles hiérarchiques, plusieurs niveaux de comportement peuvent être identifiés dans
l’activité de conduite.
Rasmussen (1986) a proposé un modèle dans lequel trois niveaux de comportement sont
différenciés :
- Les comportements basés sur des connaissances permettent l’exécution de tâches nouvelles ou
plus complexes impliquant un contrôle conscient (par exemple, garer la voiture pour un conducteur
débutant ou réaliser un dépassement).
- Les comportements basés sur des règles permettent l’exécution des tâches familières qui impliquent
l’activation de règles précédemment apprises et pour lesquelles un certain niveau de conscience est
nécessaire (par exemple, garer la voiture).
- Les comportements basés sur des compétences permettent l’exécution des tâches routinières ou
bien entrainées et n’impliquent pas un contrôle conscient (par exemple, changer de vitesse).
Selon Michon (1985), la prise de décision peut être réalisée sur trois niveaux différents :
- Le niveau stratégique constitue le niveau le plus haut du modèle. Ce niveau comprend les décisions
concernant la planification du voyage en général, comme le choix de l’itinéraire ou l’heure d’arrivée.
- Le niveau tactique concerne les différentes manœuvres à réaliser pendant la conduite, telles que
réaliser un dépassement ou ajuster la vitesse.
- Le niveau opérationnel comprend les activités de contrôle latéral (maintenir la trajectoire de la voiture
sur la voie) et longitudinal (contrôler les variations de vitesse).
Ces trois niveaux sont caractérisés également en fonction de la pression temporelle impliquée dans
chaque type de décision. Les temps de décisions au niveau tactique sont de l’ordre de quelques
secondes, au niveau opérationnel ils sont de l’ordre de quelques millisecondes. En revanche, la
pression temporelle est relativement faible dans les décisions stratégiques.

Chapitre 2
46
Plus récemment, Brouwer a appliqué le modèle hiérarchique de Michon au problème des déficits
entrainant des difficultés à la conduite, chez des populations présentant des problèmes visuels ou
cognitifs. Ces déficits se traduisent par des difficultés au niveau opérationnel à cause de ses
contraintes temporelles fortes. Mais il souligne que la pression temporelle peut être contrôlée par le
conducteur, car certaines décisions au niveau stratégique et tactique peuvent diminuer la pression
temporelle au niveau opérationnel (Brouwer, 2002). Ainsi, par exemple, le conducteur peut décider de
réduire sa vitesse en passant près d’une école pour diminuer la pression temporelle dans le cas où un
enfant traverserait la route de façon inattendue (Brouwer, 2002). C’est particulièrement au niveau
tactique que le conducteur peut ajuster ses « marges de sécurité ».
Les modèles motivationnels mettent en avant une notion déterminante dans la tâche de conduite : la
perception et la gestion du risque.
L’une des premières théories influentes a été proposée par Wilde dans sa théorie de l’homéostasie du
risque (1982). Selon lui, chaque conducteur a son propre niveau de risque « optimal » déterminé en
fonction des bénéfices et des coûts que le conducteur attend d’une situation. Lorsqu’il y a un
déséquilibre entre le risque réel et le risque subjectif du conducteur, celui-ci essayera de compenser
la différence.
Summala, dans son modèle du risque-zéro (1988) propose aussi que le conducteur a un seuil de
risque. Ce niveau de risque est déterminé par des facteurs motivationnels qui généralement
impliquent des comportements à risque (par exemple, la hâte ou l’irritation) et d’autres qui les inhibent
(par exemple, le sentiment de menace ou la peur). Selon cette théorie, le conducteur essayera de
maintenir le niveau de risque proche de zéro en gardant des « marges de sécurité » appropriées à
chaque situation.
Plus récemment, Fuller (2005) a proposé que ce n’est pas le niveau de risque que les conducteurs
essayent de compenser, mais plutôt le niveau de difficulté de la tâche de conduite. Le niveau de
difficulté est donné par la différence entre les demandes de la tâche de conduite (e.g., vitesse, autres
usagers, etc.) et la propre capacité du conducteur (éducation, niveau d’expérience, etc.). Ainsi, le
conducteur interviendrait sur ces deux niveaux pour maintenir une conduite sécuritaire. Par exemple,
selon ce modèle, le choix de la vitesse est l’une des stratégies que le conducteur peut adopter pour
contrôler le niveau de difficulté expérimentée.
2.2.4. Quelles sont les conséquences de la distraction au volant ?
Comme il a été évoqué précédemment dans les modèles cognitifs du traitement de l’information, le
niveau d’interférence entre deux tâches peut dépendre du niveau des ressources attentionnelles
nécessaires pour chacune des tâches et des modules de traitement impliqués. Ces modèles peuvent

Cadre Théorique
47
être appliqués dans le cadre de la conduite automobile. Spécifiquement, dans ce contexte, plusieurs
tâches sont réalisées en simultanée, liées ou non à la propre activité de conduite.
Ces activités concurrentes peuvent être classées en différents types de distraction en fonction du type
de ressources impliquées : visuelles, auditives, physiques et/ou cognitives (Pettitt, Burnett, & Stevens,
2005). Ces types de distractions se produisent, respectivement, lorsque le conducteur concentre son
attention sur des cibles visuelles, des signaux auditifs, des objets manipulés physiquement et des
pensées, au détriment de la tâche principale de conduite (Young & Regan, 2007).
Nous allons décrire certaines études montrant les effets de la distraction au niveau comportemental et
au niveau du traitement de l’information, mais aussi que certaines stratégies que les conducteurs
peuvent adopter peuvent réduire l’impact négatif de la distraction.
2.2.4.1. Effets de la distraction au niveau comportemental
Comme il a été précédemment mentionné, la quantité de ressources attentionnelles disponibles est
considérablement réduite par la présence d'une tâche compétitive. De plus, si deux tâches partagent
le même type de ressources (par exemple, deux tâches de type visuel), le niveau d'interférence sera
plus élevé (Wickens, 1984). C’est pourquoi les tâches secondaires visuo-spatio-motrices semblent
produire le plus haut niveau d'interférence avec la tâche de conduite qui exige également le même
type de ressources (Horberry, Anderson, Regan, Triggs, & Brown, 2006; Hurts, Angell, & Perez, 2011;
Schömig & Metz, 2013). Les tâches visuelles les plus fréquemment utilisées pour analyser
l'interférence avec la tâche de conduite impliquent la manipulation d'appareils électroniques (et donc
des ressources spatiales et motrices sont également impliquées). Les effets de ces tâches ont été
généralement associés à une augmentation des déviations latérales de la voie (Drews, Yazdani,
Godfrey, Cooper, & Strayer, 2009; Engström, Johansson, & Östlund, 2005; Jamson & Merat, 2005),
du nombre de regards hors de la route (Hurts et al., 2011; Kaber, Liang, Zhang, Rogers, &
Gangakhedkar, 2012), d’une augmentation des temps de réaction au freinage du véhicule précédent
(Drews et al., 2009; Lamble, Kauranen, Laakso, & Summala, 1999) ainsi que d’une réduction de la
distance inter-véhiculaire (Jamson & Merat, 2005; Lamble et al., 1999) et de la vitesse (Engström et
al., 2005; Horberry et al., 2006; Jamson & Merat, 2005).
Les effets de certaines tâches à caractère intermodal (par exemple, tâches auditives ou cognitives)
par rapport à la conduite peuvent dépendre du niveau d’engagement du conducteur à la tâche
secondaire. En général, dans des études réalisées en simulateur ou sur piste, l’écoute passive ou
active des émissions de radio n’interfère pas avec la tâche de conduite (Collet, Clarion, Morel,
Chapon, & Petit, 2009; Ho et al., 2007; Strayer, Drews, Albert, & Johnston, 2001). Cependant, à

Chapitre 2
48
mesure que les tâches auditives exigent un plus haut niveau d’engagement et des ressources
cognitives (opérations de calcul mental ou conversations plus complexes) se produit une plus forte
détérioration de la performance de conduite. La distraction cognitive a montré moins d’effets au
niveau du contrôle latéral du véhicule, des variations de la vitesse (Engström et al., 2005; Horberry et
al., 2006; Jamson & Merat, 2005) et des déviations du regard hors de la route (Engström et al., 2005;
Harbluk, Noy, Trbovich, & Eizenman, 2007; Kaber et al., 2012). Cependant, les tâches cognitives
interfèrent avec le temps de détection des stimuli (Collet et al., 2009; Jamson, Westerman, Hockey, &
Carsten, 2004; Lamble et al., 1999) et le maintien de distances inter-véhiculaires sécuritaires (Jamson
& Merat, 2005; Lamble et al., 1999).
Les tâches visuelles comme les tâches cognitives montrent une détérioration des performances
(Engström et al., 2005; Kaber et al., 2012; Lamble et al., 1999), mais cette détérioration intervient à
différents niveaux. Kaber et al., (2012) ont suggéré que les tâches visuelles (« détourner les yeux de
la route ») interférent à un niveau opérationnel selon le modèle de Michon (1985), ce qui implique les
activités du contrôle latéral et longitudinal du véhicule. Les tâches cognitives (« détourner l’esprit de la
route ») quant à elles affectent le niveau tactique du modèle de Michon au cours duquel le conducteur
doit faire les manœuvres nécessaires en réponse à des conditions de circulation, comme les
intersections, dépassements, etc.
2.2.4.2. Effets de la distraction au niveau du traitement de
l’information
L'effet des tâches secondaires dans la conduite n’a pas seulement été étudié à partir des résultats de
la performance des conducteurs. Des mesures physiologiques ont également permis d’étudier le
niveau de charge mentale imposé par les doubles tâches. Des exemples de telles mesures
comprennent l’analyse des mouvements oculaires (Engström et al., 2005; Kaber et al., 2012; Merat,
Jamson, Lai, & Carsten, 2012; Recarte & Nunes, 2000; Schömig & Metz, 2013), l’activité
électrodermale (Collet et al., 2009; Engström et al., 2005), la fréquence cardiaque (Engström et al.,
2005; Gabaude, Baraca, Jallais, Bonniaud, & Fort, 2012), l’analyse de l’activité électrique du cerveau
à partir des mesures électroencéphalographiques (Bruyas et al., 2006; Raabe, Rutschmann, Schrauf,
& Greenl, 2005; Rakauskas et al., 2005; Strayer & Drews, 2007) ou magnétoencéphalographiques
(Bowyer et al., 2009; Fort et al., 2010) ou encore l’étude des régions cérébrales impliquées dans
l’activité de conduite par imagerie par résonance magnétique fonctionnelle (Schweizer et al., 2013;
Uchiyama et al., 2012)

Cadre Théorique
49
Étant donné le rôle central que la mesure de potentiels évoqués (PE), au travers de
l’électroencéphalographie, occupe dans ce travail de thèse, l’objectif de cette sous-partie sera de
discuter certaines études sur simulateur de conduite ayant utilisé cette technique.
L'analyse des PE a été utilisée dans le contexte de la conduite pour examiner principalement les
effets liés à la fatigue et la vigilance. Cependant, bien que moins nombreuses, certaines études ont
récemment analysé dans des simulateurs de conduite, les effets délétères de la réalisation de tâches
secondaires sur le traitement de l’information. Par exemple, le traitement de l’information lors de la
détection des stimuli non fréquents (paradigme oddball) a été analysé lors de situations de conduite
peu ou hautement coûteuse (conduire sans ou avec une pression temporelle) (Raabe et al., 2005) ou
en augmentant la charge cognitive au moyen d’une tâche distractive (conversation téléphonique)
(Rakauskas et al., 2005). De même, la détection des événements pertinents pour la conduite (comme
l’allumage des feux arrière d’un véhicule) a été étudiée dans des situations de conduite où les
conducteurs étaient engagés dans une conversation téléphonique (Bruyas et al., 2006; Strayer &
Drews, 2007). Ces études ont principalement analysé la composante P3 liée au traitement de plus
haut niveau cognitif et reflétant l’attention allouée au traitement de la cible. Leurs résultats ont montré
un impact négatif de l’augmentation de la charge mentale, due à la tâche distractive, se traduisant par
une diminution de l’amplitude de la composante P3. Ce résultat suggère que la difficulté de la tâche
de conduite, ou la présence d’une tâche distractive, entraîne une diminution de l’attention allouée aux
cibles et détériore leur traitement.
Malgré les effets négatifs des tâches secondaires observés au niveau du comportement et du
traitement de l’information, les conducteurs peuvent adopter certaines stratégies pour réduire ou
essayer de compenser cette interférence. Les théories d’adaptation au risque énoncées
précédemment ont déjà décrits quelques comportements compensatoires, comme la réduction de la
vitesse ou l’adoption de marges de sécurité plus larges.


3. MÉTHODOLOGIE
51
3. Méthodologie
La partie méthodologique de cette thèse est composée de deux techniques différentes qui nous ont
permis de mieux comprendre les effets du système anticollision sur le traitement de l’information et sur
le comportement. L’une des particularités de cette thèse a été de recueillir des mesures
électroencéphalographiques qui n’ont jamais été utilisées auparavant dans l’étude des systèmes
d’alerte anticollision, dans des études sur simulateur de conduite.
Tout d’abord, nous allons présenter les principes généraux de l’électroencéphalographie (EEG), les
composantes des potentiels évoqués (PE) qui ont été analysées, les principaux avantages et
limitations de cette technique, ainsi que les choix expérimentaux liés à ces mesures dans les deux
premières expériences de cette thèse. En second lieu, nous allons décrire les deux types de
simulateurs qui ont été utilisés dans ces expériences en mentionnant leurs principaux avantages et
limitations : le simulateur simplifié présent dans les deux premières expériences et le simulateur plus
réaliste utilisé dans la dernière expérience.
3.1. Électroencéphalographie et Potentiels Évoqués
Dans cette partie nous présenterons la technique générale employée pour recueillir un EEG à partir
d’un ensemble d’électrodes réparties sur le scalp, puis nous présenterons plus en détails les
potentiels évoqués, leur estimation et les composantes des potentiels évoqués qui ont été étudiées
dans ce travail de thèse.

Chapitre 3
52
3.1.1. Présentation générale de la méthode
3.1.1.1. Définition
Le flux de courant existant entre les neurones génère un potentiel électrique qui peut être mesuré de
façon non invasive au moyen d'électrodes placées sur la surface du scalp (Kutas & Dale, 1997).
L'électroencéphalogramme (EEG) reflète les variations de l’activité électrique spontanée du cerveau
liées à différents types d’activité neurale. Cette activité spontanée peut-être contaminée par
différentes sources de bruits comme les interférences dues au réseau de distribution électrique (50 ou
60 Hz) ou des signaux biologiques tels que les activités musculaire et cardiaque (Key, Dove, &
Maguire, 2005). Cet amalgame d’activités peut rendre difficile l’extraction des réponses
neurocognitives isolées. L’activité neurale spécifique associée ou évoquée par un événement
sensoriel, cognitif ou moteur particulier peut, toutefois, être extraite de cette activité globale par une
technique de moyennage permettant d’obtenir un potentiel évoqué (PE) (Luck, 2005).
3.1.1.2. Montage des électrodes
La procédure pour l’obtention d’un EEG et l’estimation des PE associés commence par l’emplacement
des électrodes. L’une des pratiques les plus utilisées est basée sur le « Système International 10-20 »
(Jasper, 1958) qui permet d’assurer la reproductibilité entre les études. Selon ce système, la distance
entre deux électrodes adjacentes correspond à 10% ou 20% de la longueur des lignes
antéropostérieures (du nasion au inion) ou latérales (entre les deux points pré-auriculaires en passant
par le vertex) (voir Figure 4). Les électrodes sont identifiées par des lettres qui font référence à la
région où elles sont placées (F : Frontale, C : Centrale, P : Pariétale, O : Occipitale et T : Temporale)
suivies par la lettre « z » si les électrodes sont situées sur la ligne médiane, par des numéros pairs si
elles sont dans l’hémisphère droit ou impairs si elles sont placées dans l’hémisphère gauche.

Méthodologie
53
Figure 4. Représentation du montage des électrodes selon le Système International 10-20 sur l’hémisphère gauche (A) et vue de dessus (B). D’après Jasper (1958).
L’EEG nécessite une électrode de référence. En effet, l’EEG reflète la différence de voltage entre
l’électrode active et l’électrode de référence et non le voltage d’une seule électrode. L’emplacement
de l’électrode de référence doit correspondre à une zone peu affectée par les changements de
l’activité électrique. Même si il n’y a pas de zones totalement neutres, certains sites comme le bout du
nez, les lobes des oreilles ou les mastoïdes sont souvent utilisées pour placer l’électrode de
référence.
3.1.1.3. Traitement du signal
L’activité électrique recueillie par l’EEG est un signal très faible qui nécessite d’être amplifié pour
pouvoir être mesuré. De plus, comme il a été signalé précédemment, le signal EEG peut être
contaminé par des artéfacts électromagnétiques provenant du réseau électrique ou du corps lui-même
(mouvements oculaires, mouvements moteurs, conductance de la peau, etc.). Pour atténuer cette
activité, des filtres qui ne laissent pas passer les fréquences supérieures ou inferieures à un certain
seuil peuvent être utilisés pendant l’enregistrement du signal EEG (filtre analogique) et ou a posteriori
(filtre digital).
Étant donnée la faible amplitude des PEs (de l’ordre de la dizaine de microvolts) en comparaison avec
l’activité électrique spontanée recueillie dans l’EEG (de l’ordre de la centaine de microvolts), il est
difficile de distinguer le signal associé à un stimulus particulier. Pour cela, il faut répéter un grand
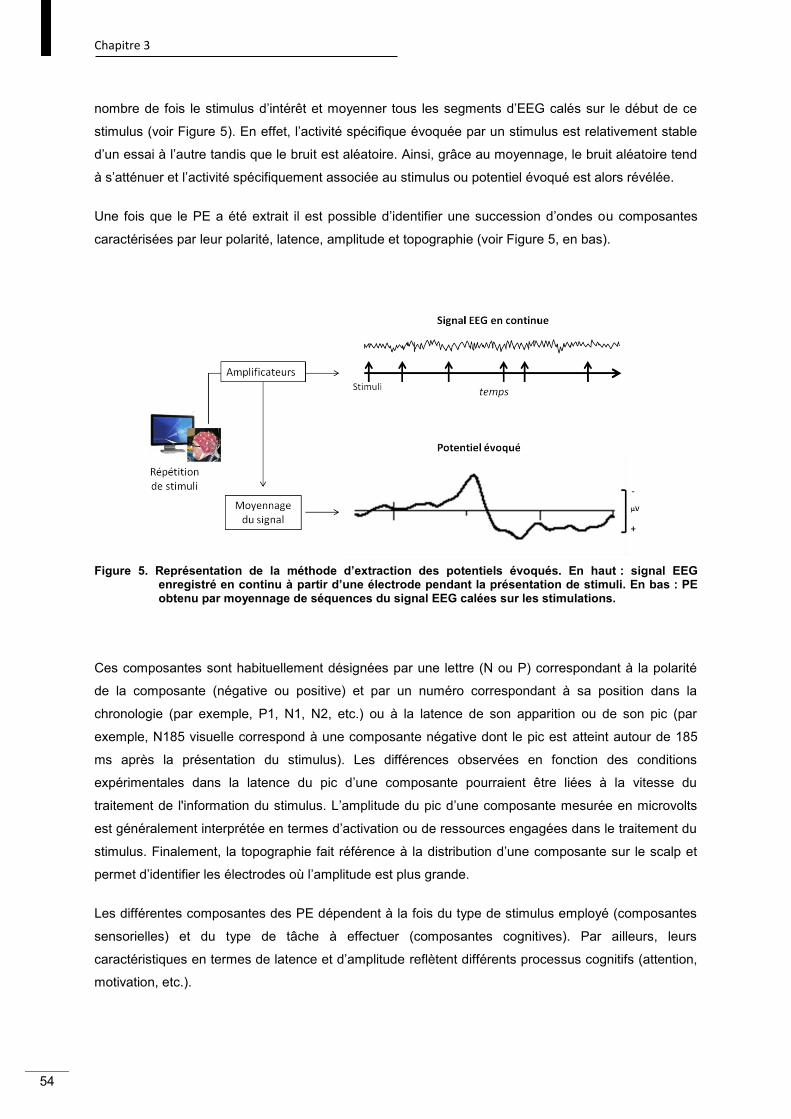
Chapitre 3
54
nombre de fois le stimulus d’intérêt et moyenner tous les segments d’EEG calés sur le début de ce
stimulus (voir Figure 5). En effet, l’activité spécifique évoquée par un stimulus est relativement stable
d’un essai à l’autre tandis que le bruit est aléatoire. Ainsi, grâce au moyennage, le bruit aléatoire tend
à s’atténuer et l’activité spécifiquement associée au stimulus ou potentiel évoqué est alors révélée.
Une fois que le PE a été extrait il est possible d’identifier une succession d’ondes ou composantes
caractérisées par leur polarité, latence, amplitude et topographie (voir Figure 5, en bas).
Figure 5. Représentation de la méthode d’extraction des potentiels évoqués. En haut : signal EEG
enregistré en continu à partir d’une électrode pendant la présentation de stimuli. En bas : PE obtenu par moyennage de séquences du signal EEG calées sur les stimulations.
Ces composantes sont habituellement désignées par une lettre (N ou P) correspondant à la polarité
de la composante (négative ou positive) et par un numéro correspondant à sa position dans la
chronologie (par exemple, P1, N1, N2, etc.) ou à la latence de son apparition ou de son pic (par
exemple, N185 visuelle correspond à une composante négative dont le pic est atteint autour de 185
ms après la présentation du stimulus). Les différences observées en fonction des conditions
expérimentales dans la latence du pic d’une composante pourraient être liées à la vitesse du
traitement de l'information du stimulus. L’amplitude du pic d’une composante mesurée en microvolts
est généralement interprétée en termes d’activation ou de ressources engagées dans le traitement du
stimulus. Finalement, la topographie fait référence à la distribution d’une composante sur le scalp et
permet d’identifier les électrodes où l’amplitude est plus grande.
Les différentes composantes des PE dépendent à la fois du type de stimulus employé (composantes
sensorielles) et du type de tâche à effectuer (composantes cognitives). Par ailleurs, leurs
caractéristiques en termes de latence et d’amplitude reflètent différents processus cognitifs (attention,
motivation, etc.).

Méthodologie
55
3.1.1.4. Avantages et limites
L’un des principaux avantages des potentiels évoqués est l’identification des différentes étapes dans
le traitement de l'information (par exemple, processus d’anticipation, sensoriels et cognitifs) et leur
modification suite à des manipulations expérimentales. De plus, les PE peuvent être enregistrés
indépendamment du fait que le sujet ait à donner une réponse motrice ou non. Enfin ils présentent
une haute résolution temporelle (de l'ordre de la milliseconde).
En ce qui concerne leurs limitations, comme il a été mentionné précédemment, les PE sont très
sensibles aux artefacts en provenance de l’environnement et du propre corps du sujet. De plus, la
faible intensité des PE nécessite de répéter un grand nombre de fois la stimulation d’intérêt (des
dizaines ou des milliers de fois selon la stimulation et les composantes des PE observées). Dans des
conditions de recherche appliquées comme la conduite automobile ceci peut rendre la tâche
monotone, longue et moins réaliste.
3.1.2. Composantes des PE analysées
3.1.2.1. La Variation Contingente Négative (VCN)
La VCN est une onde négative lente apparaissant généralement lorsque deux stimuli ont été
présentés de façon associée, séparés par un intervalle de temps de l’ordre d’une seconde (Walter,
Cooper, Aldridge, McCallum, & Winter, 1964) (Figure 6).
Figure 6. Représentation typique de la composante de la variation contingente négative.

Chapitre 3
56
Ainsi, lorsque le premier stimulus ou signal avertisseur précède le deuxième stimulus ou cible, nous
pouvons observer cette augmentation lente de la négativité qui peut être interprétée comme une
attente liée à un processus de préparation de réponse à la cible. En général, lorsque l’intervalle de
temps entre le signal et la cible est plus grand (plus d’une seconde), nous pouvons distinguer une
onde plus précoce identifiée juste après le signal avertisseur et une autre plus tardive identifiée avant
l’apparition de la cible (Loveless, 1973). La première a une activation maximale sur le cortex frontal et
a été associée au processus d’orientation alors que la deuxième apparait sur le cortex préfrontal et a
été liée au processus d’attente. L’amplitude de la VCN peut être modulée selon différents facteurs tels
que la pression temporelle, l’effort mental (voir Wild-Wall, Hahn, & Falkenstein, 2011) ou l’orientation
temporelle (Correa et al., 2006).
3.1.2.2. La N1 visuelle
Cette composante atteint son amplitude maximale autour de 150-200 ms après la présentation de la
cible au niveau des régions pariétales et occipitales (voir Figure 7).
Figure 7. Représentation typique de la composante N1.
Il s’agit d’une composante sensorielle dont les caractéristiques dépendent en grande partie des
caractéristiques physiques de la stimulation. Elle reflèterait également des processus liés à la
discrimination visuelle (Vogel & Luck, 2000). Il a été observé que l’attention spatiale sélective module
cette composante. Ainsi, des amplitudes plus grandes sont trouvées lorsque les stimuli apparaissent
dans une zone du champ visuel attendue par rapport à une zone non attendue (Clark & Hillyard,
1996).

Méthodologie
57
3.1.2.3. La N2
Le pic de la N2 est généralement atteint entre 180 et 325 ms suivant la présentation de la stimulation
d’intérêt (voir Figure 8).
Figure 8. Représentation typique de la composante N2.
Elle peut être mise en évidence dans des paradigmes expérimentaux de type Oddball dans lesquels
une succession de deux types de stimuli est présentée de façon continue, l’un apparaissant
régulièrement (stimulus fréquent) alors que l’autre apparait de façon peu fréquente (stimulus rare). La
N2 est principalement observée suite au stimulus rare (Näätänen & Picton, 1986 cité dans Patel &
Azzam, 2005). Elle a été catégorisée en plusieurs sous-composantes. La N2a peut être observée
dans des régions frontocentrales et est liée à la détection des stimuli nouveaux ou déviants (stimulus
rare) qui ne sont pas pertinents pour la tâche. La N2b, également identifiée dans des régions
frontocentrales, n’apparait que lorsque les sujets portent attention au stimulus rare. Elle pourrait être
impliquée dans des processus de contrôle cognitif, comme la surveillance et le contrôle de la stratégie
dans une tâche et les processus d’inhibition. La N2c apparait dans des régions plus postérieures et
elle reflèterait l’attention vers des localisations attendues (Folstein & Van Petten, 2008; Kutas & Dale,
1997; Luck, 2005).
Cette composante apparait souvent en combinaison avec la P3 formant ainsi le « complexe N2-P3 ».
3.1.2.4. La P3
La P3 apparait à partir de 300 ms et jusqu’à 900ms après la stimulation d’intérêt (voir Figure 9).

Chapitre 3
58
Figure 9. Représentation typique de la composante P3.
Deux sous-composantes principales ont été identifiées, la P3a et la P3b. Comme la N2, elle est
souvent mise en évidence dans des paradigmes de type Oddball. La première sous-composante, la
P3a, est distribuée frontalement et est induite par des stimuli rares ou nouveaux et non pertinents
tandis que la P3b apparait dans des régions pariétales suite à des stimuli également rares mais
pertinents pour la tâche (attention dirigée vers ces stimuli). Bien que cette composante ait été l’une
des plus étudiées, les processus sous-jacents à l’apparition de cette composante ne sont pas encore
bien compris. Cependant, plusieurs processus qui modulent l’amplitude et la latence du pic de la P3
ont été proposés. D’abord, l’amplitude de la P3 est modulée par la fréquence des stimuli : plus la
fréquence est faible, plus son amplitude est grande. De plus, son amplitude est modulée par le degré
d’attente au stimulus et l’effort investi dans la tâche (Polich, 2007). Ainsi elle peut être utilisée comme
un indicateur de l'allocation des ressources attentionnelles. Finalement, toutes les manipulations qui
retardent le processus de catégorisation d’un stimulus seront reflétées par une augmentation de la
latence de la P3 (Coles & Rugg, 1995; Luck, 2005).
3.1.3. Choix expérimentaux
Nous avons utilisé les mêmes critères méthodologiques pour l’enregistrement et l’analyses des
potentiels évoqués dans nos deux études électrophysiologiques.
L’EEG a été enregistré en continu à partir du système d’acquisition Active Two de Biosemi®
(http://www.biosemi.com/). Nous avons utilisé un bonnet avec 34 électrodes actives réparties sur le
scalp en majorité selon le Système International 10-20 (voir Figure 10). En plus, deux électrodes ont
été placées sur les mastoïdes pour identifier la tension musculaire, une autre électrode sur le coin de
la bouche pour identifier l’activité musculaire liée aux réponses verbales des participants et une
électrode a été placée sur l’angle externe de l’œil droit pour identifier les saccades des yeux.
L’électrode de référence a été placée sur le nez.

Méthodologie
59
Figure 10. Vue de dessus (gauche) et postérieure (droite) de l’emplacement des 34 électrodes.
Les électrodes utilisées étaient des électrodes pré-amplifiées (électrodes actives, impédance= 300
MΩ à 50 Hz (1012Ω // 11 pF)), permettant de travailler plus facilement dans un environnement bruité.
L’échantillonnage du signal était fixé à une fréquence de 1024 Hz et filtré de façon analogique avec un
filtre de bande passante 0-100 Hz.
Les PE ont été obtenus par moyennage pour chaque condition expérimentale à partir du logiciel ELAN
(Aguera, Jerbi, Caclin, & Bertrand, 2011). L’analyse de la VCN a été effectuée sur une fenêtre
temporelle de -1000 ms à 100 ms autour de l’apparition de la cible pour la première expérience et de -
800 ms à 100 ms pour la deuxième expérience. Les PE ainsi obtenus ont été digitalement filtrés à 0-
30 Hz. La fenêtre temporelle concernant l’analyse des PE se situait entre -100 ms et 600 ms pour la
N1, la N2 et la P32. Ces PE ont été digitalement filtrés à 0.2-30 Hz. De plus, les signaux dont
l’amplitude sur au moins une électrode dépassait 200 µV ont été rejetés.
3.2. Les simulateurs de conduite
3.2.1. Généralités
Les simulateurs de conduite sont des outils qui se sont révélés efficaces dans l’étude des systèmes
d’aides à la conduite et, en particulier, en ce qui concerne les systèmes d’alerte anticollision. Compte
tenu du risque pour la sécurité et la difficulté à simuler les collisions par l'arrière dans des situations de
2 Pour une question de simplicité, nous nous référons à ces composantes comme N2 et P3 bien que ce soient les sous-composantes N2b et P3b qui ont été mises en évidence dans nos expériences.

Chapitre 3
60
la vie réelle, une grande partie des recherches dans ce domaine a été menée à l’aide des simulateurs
de conduite. Dans ce contexte de réalité virtuelle, différents scénarios (autoroute, brouillard, densité
du trafic, etc.) peuvent facilement être créés et des situations de collisions peuvent être simulées sans
aucun risque pour les conducteurs. De plus, le même type de mesures comportementales que celles
obtenues dans des conditions réelles de conduite peuvent être recueillies avec les simulateurs de
conduite (par exemple, le temps de réaction au freinage, l'angle du volant ou la vitesse). Reste à
savoir si les comportements observés dans des conditions de conduite de la vie réelle se trouvent
reflétés dans les études sur simulateurs de conduite. Cette question introduit les concepts de validité
absolue et relative (Blaauw, 1982). Le premier implique une correspondance presque parfaite entre
les mesures obtenues en conduite réelle et simulée (par exemple, même vitesse). Le deuxième
implique que les performances observées dans les deux contextes vont dans la même direction
même si elles ne sont pas du même ordre de grandeur. Il semble que la validité relative est suffisante
pour justifier l’usage des simulateurs (Wang et al., 2010). Plusieurs études ont confirmé cette idée en
observant des correspondances entre les comportements observés dans différents types de
simulateurs et en conduite réelle (Santos, Merat, Mouta, Brookhuis, & De Waard, 2005; Wang et al.,
2010)
Cependant, même si les simulateurs de conduite peuvent être un outil efficace pour étudier le
comportement des conducteurs, la sensation de risque dans cet environnement virtuel reste une
notion assez distante de la réalité.
De plus, l’un des principaux problèmes associés aux simulateurs est connu comme le « mal du
simulateur ». Ce mal du simulateur est causé par une discordance entre le mouvement perçu au
niveau visuel et l’absence de mouvement perçu au niveau vestibulaire (Carsten & Jamson, 2011).
Cette incohérence provoque une sensation semblable au mal du transport. Même si tous les
conducteurs ne sont pas sensibles à cet effet, certains types de simulateurs ainsi que certaines
conditions dans lesquelles la perception vestibulaire joue un rôle important (par exemple, les virages
ou les décélérations brusques), peuvent être particulièrement critiques.
3.2.2. Le simulateur de conduite simplifié
3.2.2.1. Description
Le simulateur de conduite simplifié utilisé dans nos études était composé d’un fauteuil, d’un écran
d’ordinateur placé à environ un mètre du visage du participant, d’un volant et d’un pédalier (voir Figure
11). Afin de diminuer les mouvements des bras, la vitesse n’était contrôlée que par la pédale
d’accélérateur (pas de manipulation du levier de vitesse). Les sons propres au véhicule (moteur,

Méthodologie
61
roulement, démarreur) et au système d’alerte anticollision (signal avertisseur) étaient diffusés par des
haut-parleurs. L’environnement virtuel était basé sur l'architecture SIM2 qui s’appuie sur le modèle de
trafic ARCHISIM développé par le Laboratoire Exploitation, Perception, SImulations et Simulateurs de
conduite (LEPSiS) de l’IFSTTAR. Les images de la simulation étaient projetées à une fréquence
moyenne de 58,8 Hz et les données de conduite ont été enregistrées à la même fréquence.
Figure 11. Contexte expérimental et matériels utilisés pendant les deux premières expériences.
3.2.2.2. Avantages et limites
Afin de limiter les interférences motrices pour le recueil des potentiels évoqués au cours des deux
premières expériences, celles-ci ont été réalisées sur ce simulateur de conduite simplifié. En effet, la
simulation projetée sur un seul écran réduit considérablement les mouvements des yeux, ce qui
constitue l’un des principaux artefacts pour l’obtention d’un bon signal électroencéphalographique. Par
ailleurs, le mal du simulateur est très rare dans ce type de simulateurs.

Chapitre 3
62
En revanche, le contexte peu réaliste des simulateurs de conduite simplifiés peut rendre difficile
l’immersion des participants dans des situations de conduite simulées. De plus, les scénarios de
conduite ont été extrêmement simplifiés (voir ci-dessous) pour limiter les mouvements des yeux. Par
conséquent, cet environnement expérimental pourrait favoriser des comportements qui ne sont pas
complètement naturels.
De plus, la validité des résultats obtenus dans ce type de simulateur pourrait être également
questionnée. En effet, la correspondance trouvée entre les études menées sur ce type de simulateur
simplifié et les études sur piste n’est pas retrouvée dans tous les paramètres mesurés (Rudin-Brown &
Noy, 2002; Santos et al., 2005). Ainsi les résultats obtenus sur simulateurs simplifiés doivent être
interprétés avec prudence. Toutefois, nous nous sommes intéressés ici uniquement à des temps de
réaction au freinage et à leurs variations en fonction de différentes conditions expérimentales. Cette
mesure semble montrer une bonne validité relative.
3.2.2.3. Scenarios
Les scénarios de conduite ont été définis principalement pour extraire des processus de
comportement simple (des temps de réaction) et pour limiter la contamination visuelle et donc les
mouvements des yeux (pas de recherche visuelle). Plus précisément, les scénarios étaient composés
d’une route nationale limitée en décor (seulement quelques arbres et maisons) et sans trafic dans le
sens inverse. De plus, les conditions de visibilité étaient dégradées par un brouillard dense pour
justifier les freinages fréquents de la moto (voir Figure 12).
Figure 12. Images issues des scénarios et illustrant à gauche la scène de suivi de la moto à une distance inter-véhiculaire prédéfinie et à droite la décélération de la moto avec le feu arrière allumé (cible).

Méthodologie
63
3.2.3. Le simulateur de conduite plus réaliste
3.2.3.1. Description
Un simulateur de conduite plus réaliste développé par le LEPSiS (IFSTTAR) a été utilisé pour la
troisième expérience de cette thèse. Il est composé d’une cabine Peugeot 308 à base fixe
instrumentée à l’aide de capteurs (voir Figure 13). La vision vers l’avant est fourni par cinq écrans
(220 cm de hauteur par 165 cm de large) qui représentent un champ visuel de 180º dans le plan
horizontal et 47º dans le plan vertical. En plus, trois moniteurs à l’arrière (48 cm de haut x 56 cm de
large), l'un placé à l'intérieur et deux à l'extérieur du véhicule, permettent de refléter l’image de la
scène arrière sur les rétroviseurs. Le son est diffusé dans la cabine et la simulation virtuelle a été
contrôlée par SIM2 et ARCHISIM. Le modèle de voiture simulée fonctionnait avec une boîte de
vitesse manuelle.
Figure 13. Contexte expérimental de la troisième expérience.

Chapitre 3
64
3.2.3.2. Avantages et limites
Le contexte fourni par les simulateurs plus réalistes permet une plus grande immersion des
conducteurs dans les expériences et favorise ainsi des comportements plus naturels.
Toutefois, l’un des principaux problèmes associés aux simulateurs plus réalistes est connu comme le
« mal du simulateur » présenté précédemment.
Enfin, ce contexte plus réaliste peut rendre plus difficile l’enregistrement des mesures
électroencéphalographiques, mesures assez sensibles aux mouvements oculaires et moteurs.
3.2.3.3. Scénarios
Les scénarios de conduite définis dans cette expérience sont assez proches des scénarios des
expériences précédentes mais permettent une conduite plus naturelle (boîte de vitesse manuelle,
contrôle de la vitesse, etc.). Les scénarios étaient composés d’une route nationale avec plus de décor
que dans les expériences antérieures et avec du trafic dans le sens inverse. Cependant, le décor et le
nombre d’intersections ont été volontairement restreints afin de limiter le mal du simulateur. Les
conditions de visibilité étaient également dégradées par un brouillard dense pour justifier les freinages
fréquents du véhicule précédent.
4. PARTIE
EXPÉRIMENTALE
65
4. Partie Expérimentale
4.1. Expérience 1 : Une étude électrophysiologique de l’impact d’un
système d’alerte anticollision dans une tâche de conduite simulée
Bueno, M., Fabrigoule, C., Deleurence, P., Ndiaye, D., and Fort, A. (2012). An
electrophysiological study of the impact of a Forward Collision Warning System in a simulator
driving task. Brain Research, 1470, 69-79.
4.1.1. Objectif et justification
L’objectif de notre première expérience a été d’analyser l’impact sur le comportement et le traitement
de l’information d’un système d’alerte anticollision en fonction de sa fiabilité et de l’état attentionnel
des conducteurs.
Concernant la fiabilité du système, comme nous l’avons mentionné dans la section 2.1.8.1, aucun des
systèmes actuellement sur le marché n’est complètement fiable. De plus, il a été montré que la
performance des conducteurs et l’acceptation du système peuvent varier en fonction de ce niveau de
fiabilité.
Nous avons également étudié l’état attentionnel du conducteur puisque la distraction du conducteur
est la principale cause des collisions par l’arrière. C’est pourquoi il est attendu que les systèmes
anticollision aident particulièrement les conducteurs distraits. Cependant, relativement peu d’études
ont comparé de manière systématique l’efficacité de ces aides chez le conducteur distrait et non

Chapitre 4
66
distrait. Même si différents types de distraction peuvent être simulés, nous avons décidé d’analyser
l’efficacité du système lors de la réalisation d’une tâche de distraction cognitive.
Dans ce type d’études, sont classiquement observés les effets des manipulations expérimentales au
niveau de la performance des conducteurs, comme la vitesse ou la précision d’une réponse. Dans la
présente expérience, au-delà de ces mesures comportementales, nous avons enregistré des mesures
électroencéphalographiques, mesures encore jamais utilisées dans l’étude d’un système d’alerte
anticollision. Ce type de mesures nous a permis d'analyser l'impact de ce type de système sur les
différentes étapes du traitement de l'information.
4.1.2. Méthode
4.1.2.1. Population
Douze hommes de 25 à 35 ans (moyenne d’âge : 30.6 ans) ont participé à cette étude. Tous
possèdent le permis de conduire depuis au moins trois ans et ont conduit au moins 3000 km par an
sur la dernière année (moyenne : 16042 km). Deux tests évaluant le fonctionnement cognitif (le Trail
Making Test, Part A et B et le test de codes de Wechsler) nous ont permis de vérifier qu’aucun
participant n’avait de déficits cognitifs.
4.1.2.2. Protocole
Cette étude a été menée à l’aide d’un simulateur de conduite simplifié (voir section 3.2.2.). La tâche
des participants était de conduire en suivant une moto. Ils devaient maintenir la pédale d’accélérateur
enfoncée au maximum, ce qui correspondait à une vitesse moyenne de 90 km/h. La moto décélérait
fréquemment et les participants devaient lever le pied de l’accélérateur uniquement lorsque le feu
arrière (cible) de la moto s’allumait. Un signal avertisseur de type sonore, déclenché avant l’apparition
de la cible, pouvait aider les participants à anticiper l’apparition de la cible. Pour étudier l’impact de la
fiabilité du système, trois conditions d’alerte ont été manipulées dans cette étude :

Partie Expérimentale
67
- Sans système : le signal n’était jamais disponible.
- Système imparfait : le signal apparaissait avant l’allumage du feu dans 70% des essais. Dans 15%
des essais le signal apparaissait sans être suivi de la cible (fausse alarme) et dans 15% des essais, la
cible apparaissait sans être précédée du signal (défaut de détection).
- Système parfait : le signal apparaissait toujours avant l’allumage du feu arrière.
Deux conditions de conduite ont été utilisées : simple et double tâche. Dans la condition de double
tâche, en plus de la tâche de conduite, les participants ont réalisé une tâche secondaire à caractère
cognitif. Dans cette tâche nommée « le mot mystère », le participant écoutait trois mots sans rapport
direct entre eux et devait trouver un quatrième mot lié à chacun des mots présentés, soit par le biais
d’une expression soit par un lien sémantique. Par exemple, nous avons utilisé la série de trois mots
suivante « Crayon – Rien – Charbon » avec comme réponse possible « Mine » (« mine de crayon »,
« mine de rien » et « mine de charbon »).
La performance des conducteurs a été mesurée en prenant en compte les temps de réaction à la
cible. L’analyse par les potentiels évoqués de l’activité cérébrale liée au traitement de l’information a
été centrée sur les processus d’anticipation (VCN), sensoriels (N1) et cognitifs (N2 et P3).
4.1.3. Discussion des principaux résultats
Concernant l’efficacité du système au niveau comportemental, les résultats ont montré un bénéfice du
système tant dans la condition « système parfait » que dans la condition « système imparfait », mais
uniquement lorsque les participants n’étaient pas distraits. La tâche de distraction cognitive a
augmenté considérablement les temps de réaction à la cible et le système n’a pas été assez efficace
pour compenser cet effet négatif.
Ces résultats ont été partiellement confirmés sur le plan neural. En effet, si nous n’avons pas pu
mettre en évidence d’effet du système imparfait, le système parfait a montré des effets positifs sur le
traitement de la cible en simple tâche. Précisément, le signal avertisseur semble avoir facilité le
traitement cognitif de la cible par une réduction de l’amplitude et de la latence de la N2. Ces résultats
pourraient refléter une facilitation de l’attente temporelle pour les cibles à venir.
Un effet négatif global de la distraction a été mis en évidence à toutes les étapes du traitement de
l’information étudiées (anticipation, traitement sensoriel et cognitif). Même si les différences à ces trois
niveaux de traitement entre les conditions de simple et double tâche ont été moins marquées avec la
présence du système, cela n’a pas été suffisant pour éliminer l’effet négatif de la double tâche.

Chapitre 4
68
En conclusion et contrairement à nos attentes, lorsque les participants étaient distraits par une tâche
cognitive, nous n’avons pas trouvé d’effet positif du système, et ce, aussi bien au niveau
comportemental qu’au niveau neural. Ce pattern de résultats peut être expliqué par deux hypothèses
alternatives.
Selon notre première hypothèse, dans la condition de double tâche, les deux tâches seraient en
compétition pour les ressources attentionnelles disponibles. Le signal avertisseur pourrait ne pas être
traité de façon automatique et donc ne bénéficierait pas du niveau requis de ressources
attentionnelles. En effet, la tâche de conduite était relativement facile. Par conséquent, les participants
non distraits auraient eu assez de ressources pour traiter le signal et bénéficier de son assistance. En
revanche, la tâche secondaire utilisée dans cette étude était une tâche à haute demande cognitive. Il
est alors possible que les ressources attentionnelles restantes aient été insuffisantes pour traiter le
signal avertisseur (voir Figure 14). Cette interprétation est en accord avec les études en psychologie
cognitive portant sur l’effet négatif de la double tâche quand la tâche secondaire nécessite beaucoup
de ressources attentionnelles.
Figure 14. Schéma illustrant les ressources attentionnelles disponibles pour traiter le signal avertisseur en simple et en double tâches.
La deuxième hypothèse pouvant expliquer l’inefficacité du système en condition de distraction
concerne le protocole expérimental. En effet, comme le montre la Figure 15, tous les essais dans
toutes les conditions expérimentales commençaient par une décélération de la moto avant l’apparition
du signal avertisseur et l’allumage du feu. Ainsi, il est possible que les participants aient utilisé cette
information visuelle comme un meilleur prédicteur de la présence de la cible que le signal avertisseur,
celui-ci n’étant pas toujours présent.

Partie Expérimentale
69
Figure 15. Séquence expérimentale pour chaque essai dans les trois conditions de système.
L’étude suivante a été réalisée pour tester l’efficacité du FCWS en éliminant cet artefact expérimental
en simple et double tâches afin de tester cette interprétation alternative de nos résultats.
4.2. Article 1

www.elsevier.com/locate/brainres
Available online at www.sciencedirect.com
Research Report
An electrophysiological study of the impact of a Forward
Collision Warning System in a simulator driving task
Mercedes Buenoa,b,c,n, Colette Fabrigoulec, Philippe Deleurencea,b,Daniel Ndiayed, Alexandra Forta,b
aIFSTTAR, LESCOT, F-69675 Bron, FrancebUniversity of Lyon, F-69622 Lyon, FrancecUniversity of Bordeaux Segalen, USR CNRS 3413 SANPSY, F-33076 Bordeaux, FrancedUniversity of Paris-Est, IFSTTAR, IM, LEPSIS, F-75732 Paris, France
a r t i c l e i n f o
Article history:
Accepted 20 June 2012
Available online 2 July 2012
Keywords:
Forward Collision Warning System
Event Related Potential
Information processing
Driver distraction
Reliability
a b s t r a c t
Driver distraction has been identified as the most important contributing factor in rear-end
collisions. In this context, Forward Collision Warning Systems (FCWS) have been developed
specifically to warn drivers of potential rear-end collisions. The main objective of this work
is to evaluate the impact of a surrogate FCWS and of its reliability according to the driver’s
attentional state by recording both behavioral and electrophysiological data. Participants
drove following a lead motorcycle in a simplified simulator with or without a warning
system which gave forewarning of the preceding vehicle braking. Participants had to
perform this driving task either alone (simple task) or simultaneously with a secondary
cognitive task (dual task). Behavioral and electrophysiological data contributed to revealing
a positive effect of the warning system. Participants were faster in detecting the brake light
when the system was perfect or imperfect, and the time and attentional resources
allocation required for processing the target at higher cognitive level were reduced when
the system was completely reliable. When both tasks were performed simultaneously,
warning effectiveness was considerably affected at both performance and neural levels;
however, the analysis of the brain activity revealed fewer differences between distracted
and undistracted drivers when using the warning system. These results show that
electrophysiological data could be a valuable tool to complement behavioral data and to
have a better understanding of how these systems impact the driver.
& 2012 Elsevier B.V. All rights reserved.
1. Introduction
According to the National Highway Traffic Safety Admin-
istration (2009), rear-end collisions represent approximately
30% of all crashes. Although the proportion of fatalities as a
result of these collisions is relatively low (5.4%), these crashes
are one of the most frequent types of collisions, disturbing
traffic flow and representing an important economic cost for
society.
There are three factors that contribute to rear-end colli-
sions. According to the sources, the environment (e.g. poor
visibility, slick roads) has been identified as a crash
0006-8993/$ - see front matter & 2012 Elsevier B.V. All rights reserved.http://dx.doi.org/10.1016/j.brainres.2012.06.027
nCorresponding author at: IFSTTAR-LESCOT, 25 Avenue Franc-ois Mitterrand, 69675 Bron Cedex, France. Fax: þ33 472 376 837.E-mail address: [email protected] (M. Bueno).
b r a i n r e s e a r c h 1 4 7 0 ( 2 0 1 2 ) 6 9 – 7 9

contributing factor in 5–11% and the vehicle (e.g. brake
system) in 12–20% of the cases. However, the factor that
most frequently contributes to rear-end collisions (from 75%
to 93%) is the driver (Knipling et al., 1993; Kuge et al., 1995;
Vogel and Bester, 2005). Specifically, driver distraction is the
main reason (60%) for these accidents. In this context,
Forward Collision Warning Systems (FCWS) have been devel-
oped to warn drivers of potential rear-end collisions. This
kind of system provides a warning signal (e.g. visual, audi-
tory, and/or tactile) when there is a risk of collision. In
general, the moment for triggering a warning is calculated
as a function of either the time to collision between two
vehicles traveling at their current speed, or the minimum
distance required to stop the vehicle safely (Bella and Russo,
2011). The benefits of these systems for drivers are clear and
it has been demonstrated that a warning system is more
effective than no warning at all. For example, the impact of
the systems on safety can be visible by reducing the number
of collisions (Lee et al., 2002; Zhu, 2001), by returning atten-
tion to the critical direction if necessary (Ho and Spence,
2009), by faster braking reaction times in detecting critical
situations (Abe and Richardson, 2006), and/or, by longer and
safer headways (Ben-Yaacov et al., 2002).
Given its implication in road safety, driver distraction has
been the central issue in numerous scientific reports (e.g.
Regan et al., 2008). Regan et al. (2011, p. 1780) define driver
inattention as ‘‘insufficient or no attention to activities critical
for safe driving’’ whereas driver distraction or driver-diverted
attention is a type of driver inattention where the attention to
activities critical for safe driving is threatened by the diversion
towards another competing activity. Most of the studies
showed a clear benefit from the FCWS when drivers are
undistracted. For instance, Maltz and Shinar (2004) found that
participants driving in a simulator equipped with an FCWS
adopted longer headways than non-equipped drivers. Ho et al.
(2006) also reported safer headways together with faster
reaction times in detecting potential rear-end collisions when
the warning system was available. Nevertheless, even if it is
known that the majority of these collisions are due to distrac-
tion, relatively few studies have focused on the impact of the
FCWS on both undistracted and distracted drivers. The exist-
ing data showed that distracted drivers are those who most
benefited from the warning systems and, in some cases, the
system even completely dissipated the negative effect of being
distracted (Ho and Spence, 2009; Lee et al., 2002). However, the
results could vary depending on the warning modality and the
kind of secondary task carried out (different modalities or
mental workload). For example, Mohebbi et al. (2009) studied
the effectiveness of an auditory and tactile warning in avoid-
ing collisions with the lead vehicle when participants were
distracted by having a simple conversation (demographic and
personal questions) or a complex conversation (mental calcu-
lation and categorization questions). Their results showed that
when participants were engaged in a complex conversation,
only the tactile warning was effective, whereas when engaged
in a simple conversation, both warnings were useful. However,
in this case, only the tactile one completely eliminated the
disruptive effect of the secondary task.
The FCWS is designed to provide assistance and to avoid
accidents or at least mitigate their consequences. However,
these systems are not completely reliable and cannot replace
the driver. It is known that the warning may malfunction,
producing false alarms and/or misses of critical events. False
alarms refer to the situations in which an alert is issued in
the absence of any potential collision. Misses occur when an
alert is not triggered despite the situation requiring it.
Differences in acceptance of the system and, consequently
on driver performance, could be noticed depending on the
missed or false alarm rate given by the system (Sullivan et al.,
2007). Drivers could consider the system as ineffective if the
number of false alarms is too high. Usually, false alarms are
irritating and distracting when unnecessary (Maltz and
Shinar, 2004). Thereby, if false alarms are frequent, users
might ignore the system or might react inadequately to valid
warnings (Lerner et al., 1996). Similarly, drivers could con-
sider the system as ineffective if the threshold for triggering
the warning is too strict. Nevertheless, misses could be seen
in this context as more ‘‘practical’’ and helpful than false
alarms. Indeed, if a system almost never fails to detect a
collision, drivers may over-rely on it and become vulnerable
or not react adequately, when, for example, driving an
unequipped vehicle (Parasuraman et al., 1997). But assessing
which level of false alarms/misses is acceptable is compli-
cated, given that the probability of experiencing a rear-end
collision during a lifetime is very low, and the efforts for
finding out the cut-off point have not been very conclusive as
yet (Kiefer et al., 1999; Lerner et al., 1996).
Other studies have investigated the reliability of the system
focusing on the percentage of true alarms without specifying
the amount of false alarms or misses. In general, higher
levels of reliability result in better performance, but the point
where the system becomes useless remains unclear. Bliss
and Acton (2003) noted that participants responded more
frequently to the warning and maneuvered more appropri-
ately in avoiding collisions when the warning was 100%
reliable. Nevertheless, Maltz and Shinar (2004) and Ben-
Yaacov et al. (2002) did not find differences between systems
reliable at 60%, 80–85% and 90–95%. Subsequently, Wickens
and Dixon (2007), after analyzing a total of 22 studies,
concluded that 70% should be the threshold for considering
a system as reliable.
Simulators have proved to be an excellent tool for the study
of the FCWS, where different scenarios as well as the severity
of collisions can be easily manipulated. Behavioral para-
meters are the measure used most frequently by researchers
in driving simulator studies, as they are certainly a strong
reflection of drivers’ performance, but other techniques can
also be used to obtain additional information that is not
visible through drivers’ performance. For example, the elec-
troencephalography and the associated Event Related Poten-
tial (ERP) are effective tools that enable to dissociate the
different stages of the information processing. Through these
measures, it is possible to obtain information on anticipa-
tion/orienting, sensory and cognitive processes. Specifically,
before the stimulus is presented, processes related to move-
ment preparation and sensory anticipation (Bender et al.,
2004) can be detected through the Contingent Negative
Variation (CNV). Once the stimulus appears, the sensorial
analysis of the stimulus can be reflected by components like
the N1. This component is sensitive to the physical properties
b r a i n r e s e a r c h 1 4 7 0 ( 2 0 1 2 ) 6 9 – 7 970

of the stimulus and to the attention allocated to it (Hillyard
and Anllo-Vento, 1998). The higher cognitive processing is
reflected by the N2 and P3 components. Classically, the N2
component is elicited by tasks involving cognitive control,
novelty stimuli, and perceptual matching and response con-
flict (Folstein and Van Petten, 2008). The P3 component can be
used as a measure of the attentional resources allocation and
working memory updating (Polich, 2007).
Thereby, a neural analysis of the brain electrical activity
in drivers could offer novel and original information in
assessing the effects of the FCWS. Nevertheless, its use in
simulator studies is not widespread due to some con-
straints such as its sensitivity to saccadic or motor move-
ments. Therefore, these types of studies are not very
common in the literature, although those already existing
showed a clear impact of a dual task situation at higher
cognitive levels. For example, Strayer and Drews (2007)
found that in a task where participants had to react to
intermittent lead vehicle decelerations, the P3 amplitude
was reduced and the P3 latency was delayed when they
were engaged in phone conversations. Similarly, Rakauskas
et al. (2005) studied the impact of secondary tasks while
driving and detecting unexpected sounds (oddball para-
digm). They found that the P3 amplitude to novel sounds
was especially reduced by a cognitive secondary task pre-
sented by cell-phone, showing that the processing of novel
information is deteriorated by the dual task.
This study aims to evaluate the impact of a surrogate FCWS
and its reliability on drivers according to their attentional state.
The main innovation of this research has been the recording of
the brain electrical activity in drivers in order to complement
information obtained from behavioral data with information on
the neural stages of information processing, enabling to go
further than existing results in the literature about the cognitive
effects of the FCWS. Participants were required to drive following
a lead motorcycle which braked frequently simulating possible
collisions, while performing a cognitive secondary task (dual
task) or not (simple task). In addition, the impact of the reliability
of the system was analyzed by comparing a perfect system with
a 70% reliable system. It was expected that the system, even
when not perfect, be of benefit to both undistracted and
distracted drivers.
2. Results
2.1. Behavioral results
Reaction times (RTs) were calculated for distraction level and
warning conditions. A 2 (distraction level)�3 (warning con-
ditions) repeated-measures ANOVA showed a significant
main effect of distraction level (F(1,11)¼20.68, p¼.001).
The main effect of warning conditions was not significant
and there were no interaction effects.
The analysis of the simple effects for the distraction
level condition revealed faster RTs when participants were
undistracted than when they were distracted in the three
system conditions: no system (410ms vs. 430ms) (F(1,11)¼
17.49, p¼.002), imperfect system (396ms vs. 424ms) (F(1,11)¼
13.54, p¼.004), and perfect system (397ms vs. 422ms)
(F(1,11)¼14.72, p¼.003). Despite the fact that the main
effect of warning conditions did not reach statistical significance
(F(2,22)¼2.85, p¼.079), further separate analysis showed that
participants reacted faster when they were undistracted and
warned by a perfect (F(1,11)¼5.71, p¼.036) or an imperfect
system (F(1,11)¼7.32, p¼.020) than when they were not warned.
No significant differences were found among the warning
conditions when participants were distracted.
Concerning accuracy data, neither the main effects of distrac-
tion level (5% of errors in simple task and 9% in dual task) and
warning conditions (6%, 6% and 8% of errors in no system,
imperfect system and perfect system condition, respectively),
nor the interaction effect were statistically significant.
2.2. ERP results
The amplitude and latency of the N1, N2, P3, as well as the
amplitude of the N2–P3 complex and the CNV were analyzed
with ANOVA for repeated measures with distraction and
warning conditions as within subject factors (Table 1).
The ANOVA revealed a main effect of distraction level on
the amplitude of all components studied and a main effect of
warning conditions in the N2 component. Concerning the
latency, only a main effect of warning conditions was found
in the P3 component.
Table 1 – ANOVA for repeated measures on the amplitude of the CNV, N1, N2, P3, and N2–P3 complex and the latency ofthe N1, N2, and P3 with distraction level and warning conditions as factors.
Amplitude Latency
Distraction level
F(1,11)
Warning
conditions F(2,22)
Interaction
F(2,22)
Distraction
level F(1,11)
Warning
conditions F(2,22)
Interaction
F(2,22)
CNV F¼6.04, p¼.030� F¼.45, p¼.635 F¼.99, p¼.384
N1 F¼5.17, p¼.044� F¼.83, p¼.440 F¼1.43, p¼.261 F¼.27, p¼.613 F¼.88, p¼.414 F¼1.25, p¼.303
N2 F¼18.56, p¼.001�� F¼3.97, p¼.047
� F¼1.16, p¼.324 F¼.57, p¼.465 F¼3.40, p¼.067 F¼1.06, p¼.352
P3 F¼28.41, p¼.0002��� F¼.64, p¼.522 F¼1.56, p¼.236 F¼.56, p¼.470 F¼5.34, p¼.028
� F¼1.32, p¼.282
N2–P3 F¼49.47, p¼.00002��� F¼3.20, p¼.065 F¼1.02, p¼.372
n po.05.nn po.01.nnn po.001.
b r a i n r e s e a r c h 1 4 7 0 ( 2 0 1 2 ) 6 9 – 7 9 71

For post-hoc analysis, the impact of the distraction level
(Section 2.2.1) and of the warning conditions (Section 2.2.2)
on each component will be presented separately.
2.2.1. Impact of the distraction level (simple task, ST; dual
task, DT)
This part of the results contrasts the ERPs of participants in
ST and DT separately for the three warning conditions
(Table 2 and Figs. 1 and 2).
Preceding the target onset, there was a main effect of
distraction level on the CNV component. Further separate
analysis only revealed a significant increase of the CNV
amplitude in ST compared to DT when the perfect system
was presented (F(1,11)¼7.14, p¼.020) (first column of Table 2
and Fig. 1).
After the target onset and only when no system was used,
the maximum amplitude of the N1 was significantly reduced
in DT compared to ST condition (F(1,11)¼9.06, p¼.012). This
Table 2 – Amplitude data (lV) of the CNV, N1, N2, P3, and N2–P3 components and latency data (ms) of the N1, N2, and P3 inthe ANOVA for repeated measures with distraction level as factor in no system (NS), imperfect system (IS) and perfectsystem (PS) conditions.
CNV N1 N2 P3 N2–P3
ST; DT ST; DT ST; DT ST; DT ST; DT
Amp
NS �5.75; �4.41 �9.83; �7.27� �9.15; �5.53��� 11.71; 8.92�� 16.95; 11.48��
IS �4.75; �3.86 �9.08; �7.98 �8.47; �6.41 12.68; 9.25��
17.49; 12.60��
PS �5.49; �3.18�
�8.76; �7.15 �7.46; �5.01� 10.97; 9.56 14.85; 11.42
��
Lat
NS 213; 207 214; 214 343; 364
IS 214; 213 212; 205 335; 337
PS 209; 211 206; 205 325; 325
n po.05.nn po.01.nnn po.001.
NS PSIS
-1000 0ST DT
10.0 uV
-
+
Fig. 1 – Grand average of the ERP showing the CNV at Cz in ST and DT for no system (NS), imperfect system (IS) and perfect
system (PS) conditions.
N1 N1
N2 N2
P3 P3
N1
N2
P3
ST DT
NS PSIS
6000
Fig. 2 – Grand average of the ERP showing (a) the N1 at P8, (b) the N2 at Cz, and (c) the P3 at PO3 in STand DT for no system (NS),
imperfect system (IS), and perfect system (PS) conditions.
b r a i n r e s e a r c h 1 4 7 0 ( 2 0 1 2 ) 6 9 – 7 972

difference was not significant when a system (perfect or
imperfect) was used (second column of Table 2 and Fig. 2a).
Results showed a reduction of the maximum amplitude in
the time window of the N2 component observed over Cz, in
DT condition compared to ST for no system (F(1,11)¼23.70,
p¼.0005) and for the perfect system (F(1,11)¼8.93, p¼.012). In
the case of the imperfect system, this difference did not
reach the criteria of significance (F(1,11)¼3.71, p¼.080) (third
column of Table 2 and Fig. 2b).
The secondary task significantly reduced the maximum
amplitude of the P3 component when there was no system
(F(1,11)¼14.33, p¼.003) but also when an imperfect system
was presented (F(1,11)¼11.77, p¼.006). Difference when using
a perfect system was marginally significant (p¼.07) (fourth
column of Table 2 and Fig. 2c).
Finally, as illustrated in Fig. 2, it is noteworthy that the
impact of the DTwas less noticeable in the system conditions
than in the no system condition: there were fewer significant
differences when using a system than when no system was
used, and, in particular, no significant difference was
observed at the level of the visual N1 component.
2.2.2. Impact of the warning conditions according to the
reliability (no system, NS; imperfect system, IS; perfect
system, PS)
In this section, the three warning conditions have been
compared in simple (Table 3 and Fig. 3) and in dual task
separately (Table 4 and Fig. 4).
2.2.2.1. In simple task (ST). There were no significant effects
of the warning conditions in the CNV when participants were
undistracted (ST) (first column of Table 3).
Fig. 3 shows the three warning conditions in simple task
once the target has been presented. Regarding the N1 com-
ponent (second column of Table 3 and Fig. 3a), no significant
differences were found in amplitude and latency among the
three warning conditions.
The presence of the PS significantly reduced the peak
amplitude F(1,11)¼7.02, p¼.023 and latency F(1,11)¼13.70,
p¼.003 of the N2 component compared to NS (third column
of Table 3 and Fig. 3b). In the same way, the latency of the N2
was reduced by the presence of the PS compared to the IS
F(1,11)¼6.09, p¼.031.
Table 3 – Amplitude data (lV) of the CNV, N1, N2, P3, and N2–P3 components and latency data (ms) of the N1, N2, and P3 inthe ANOVA for repeated measures with warning conditions (no system, NS; imperfect system, IS; perfect system, PS) as factorin ST.
CNV N1 N2 P3 N2–P3
Amp
NS–PS �5.75; �5.49 �9.83; �8.76 �9.15; �7.46� 11.71; 10.97 16.95; 14.85�
NS–IS �5.75; �4.75 �9.83; �9.08 �9.15; �8.47 11.71; 12.68 16.95; 17.49
PS–IS �5.49; �4.75 �8.76; �9.08 �7.46; �8.47 10.97; 12.68 14.85; 17.49�
Lat
NS–PS 213; 209 214; 207�� 343; 325
NS–IS �213; 214 214; 212 343; 335
PS–IS �209; 214 207; 212� 325; 335
n po.05.nn po.01.
NS PSIS
N1
210 ms-6 µV
N2
220 ms-6 µV
P3
320 ms-10 µV
PSNS IS
6000
Fig. 3 – Topographic maps and grand averages of the ERPs showing (a) the N1, (b) the N2 and (c) the P3 components in ST for
the three warning conditions (no system, NS; imperfect system, IS; perfect system, PS).
b r a i n r e s e a r c h 1 4 7 0 ( 2 0 1 2 ) 6 9 – 7 9 73

The latency of the P3 component (fourth column of Table 3
and Fig. 3c) was reduced by the PS compared to the absence
of system; however, this difference was marginally significant
F(1,11)¼4.78, p¼.051. No other comparisons in this compo-
nent reached statistical significance.
2.2.2.2. In dual task (DT). As for the ST condition, no sig-
nificant differences were found among the three warning
conditions for the amplitude of the CNV component (first
column of Table 4) and for the N1 component in amplitude or
latency (second column of Table 4 and Fig. 4a).
As regards the N2 component (third column of Table 4 and
Fig. 4b), its maximum amplitude was significantly decreased
by the presence of the PS compared to the IS (F(1,11)¼10.13,
p¼.008); however, differences between the PS or IS and the
absence of the system failed to reach statistical significance.
In the same way, for the P3 component (fourth column of
Table 4 and Fig. 4c) no differences were found between the PS or
IS and the absence of the system. Indeed, the peak wave
appeared sooner for the PS than for the NS condition, although
this difference was marginally significant F(1,11)¼4.21, p¼.064.
Only the difference between IS and NS was statistically
significant F(1,11)¼8.04, p¼.016, showing a reduced latency in
the IS compared to the NS.
3. Discussion
The aim of this study was to evaluate the impact of a Forward
Collision Warning System and of its reliability according to
the attentional state of drivers, by recording both behavioral
data and the associated electrical brain responses.
The main findings of this work could be summarized as
follows:
(1) Perfect system had a positive effect at both behavioral and
neural levels. Participants were faster in detecting the
target when the system was completely reliable compared
to no system at all. In addition, the analysis of the neural
activity suggested a reduction of the time and the atten-
tional resources required for processing the target
correctly.
(2) Imperfect system also had a positive effect on partici-
pants’ performance compared to no system, showing
Table 4 – Amplitude data (lV) of the CNV, N1, N2, P3, and N2–P3 components and latency data (ms) of the N1, N2, andP3 . in the ANOVA for repeated measures with warning conditions (no system, NS; imperfect system, IS; perfect system, PS) asfactor in DT.
Warning CNV N1 N2 P3 N2–P3
Amp
NS–PS �4.41; �3.18 �7.27; �7.15 �5.53; �5.01 8.92; 9.56 11.48; 11.42
NS–IS �4.41; �3.86 �7.27; �7.98 �5.53; �6.41 8.92; 9.25 11.48; 12.60
PS–IS �3.18; �3.86 �7.15; �7.98 �5.01; �6.41�� 9.56; 9.25 11.42; 12.60
Lat
NS–PS 207; 211 215; 205 364; 325
NS–IS 207; 213 215; 205 364; 337�
PS–IS 211; 213 205; 205 325; 337
n po.05.nn po.01.
NS PSIS
N1
210 ms-6 µV
N2
220 ms-6 µV
P3
320 ms-10 µV
PSNS IS
6000
Fig. 4 – Topographic maps and grand averages of the ERPs showing (a) the N1, (b) the N2 and (c) the P3 components in DT for
the three warning conditions (no system, NS; imperfect system, IS; perfect system, PS).
b r a i n r e s e a r c h 1 4 7 0 ( 2 0 1 2 ) 6 9 – 7 974

faster reaction times in detecting the braking of the
motorcycle. However, this effect was not found at the
neural level.
(3) The secondary task had a disruptive effect on partici-
pants’ performance and information processing of the
target: reaction times were slower and the amplitude of
N1, N2, and P3 was considerably reduced when partici-
pants were distracted in all warning conditions.
(4) Perfect system was not effective enough to eliminate the
disruptive effect of the dual task at behavioral and
electrophysiological levels. Nevertheless, the analysis of
the participants’ electrical brain responses showed that
the difference between undistracted and distracted dri-
vers was lower when the perfect system was available.
Although the impact of the warning system was clearly
observed at the behavioral level when drivers were undis-
tracted, the only significant difference observed at the neural
level occurred within the N2 component latency range.
This effect corresponded mainly to a decrease of the ampli-
tude and latency of the main component under Cz when the
perfect system was used compared to no system at all. In
addition, when drivers were undistracted, a decrease of this
component was also observed when the perfect system was
used compared to the imperfect system. This result could
reflect a modulation of the neural activity at the level of
the N2 which could be related to cognitive control (monitor-
ing or regulation of strategy) (Folstein and Van Petten, 2008).
The visual N1 and the N2 components presented different
topographies, nevertheless, it is important to note that in our
study, they shared the same time window and consequently
they largely overlapped due to conduction properties: the
visual N1 component spread over the scalp and partly
contributed to the N2 component. Because of that, and
despite some differential effects at the level of N1 and N2,
it was difficult to determine whether the effect observed at
the level of N2 was specifically due to a modulation of this
component or whether it was partially due to a modulation of
the N1 component linked rather to the sensory processing of
the target. This discrepancy with traditional electrophysiolo-
gical experiments using visual stimulations and showing a
clear temporal distinction between the visual N1 and the N2
components might be due to methodological differences
between experimental procedures, such as the use, here, of
a dynamic visual driving scene.
Concerning the impact of the distraction level, the reaction
time data revealed a clear deleterious effect of the secondary
task, suggesting that the cognitive task diverted attention
away from the driving task, regardless of the warning condi-
tion. This behavioral impact was associated with a general
decrease of the amplitude of the event-related potentials
when participants were distracted in the no-system condi-
tion. This result is in accordance with studies examining the
impact of divided attention and could reflect the diminution
of the attentional resources allocated to the target (e.g. Gherri
and Eimer, 2011; Wickens et al., 1983).
Results revealed fewer differences between the event-
related potentials curves recorded in the two distraction
levels when using a perfect warning system than when no
system was used. With all due caution, it can be speculated
that these fewer differences were due to a diminution of N1,
N2, and P3 amplitude in simple task, even if this is significant
only for N2 when using a perfect system compared to no
system. This diminution was not visible on the event-related
potentials obtained in dual task. The same pattern of results
was observed for the imperfect system except at the level of
the P3. This amplitude diminution when participants were
undistracted could have been interpreted as a deterioration
of the target processing following the presentation of the
warning signal which could act as a distracting element.
However, this interpretation seems unlikely due to the fact
that reaction time data revealed a facilitation effect of the
warning signal. An alternative explanation could be that the
significant decrease of N2, as well as the tendency to decrease
N1 and P3 when using a warning system, reflects temporal
expectation. Indeed, in our study, when using the perfect
system, the warning signal was predictive of the time
window in which the target appeared. It is known that
focusing attention on a point in time improves behavioral
performance and increases preparatory activity time-locked
to the expected target occurrence (Seibold et al., 2011). In
addition, it has been shown recently that temporal expecta-
tion attenuates the amplitudes of visual N1 and N2 compo-
nents (Correa et al., 2006; Doherty et al., 2005) and can also
diminish the amplitude of P3 (Correa et al., 2006). We can
assume that the warning improved the time expectancy
already initiated by the visual information related to the
decelerations (as reflected by the analysis of the CNV). The
fact of obtaining fewer differences between the two distrac-
tion conditions at the neural level could be at least partially
due to a facilitation of the information processing by the
warning when participants were undistracted.
The positive impact of the warning system has already
been shown in other studies (i.e. Abe and Richardson, 2006).
For the simple task situation, the relation between behavioral
and electrophysiological data in this study supported this
effect. The perfect system was effective at both behavioral
and electrophysiological levels in warning drivers of the
braking of the motorcycle; the imperfect system was only
effective at behavioral level. However, contrary to expecta-
tions, the effectiveness of the warning system was not
demonstrated when participants were distracted, both at
behavioral and electrophysiological levels. This suggests that
in the dual task situation, the two tasks compete for the
attentional resources available and that the warning was not
automated and required a conscious cognitive control.
Indeed, the driving task was relatively easy; therefore, when
participants were undistracted, they could have enough
attentional resources available to process the warning and
to widely benefit from it. Because the secondary task
consisted on a high cognitive demanding task and required
a strong and continuous effort to solve the enigmas, partici-
pants may not have had enough resources to process the
warning. This result is consistent with data from cognitive
psychology experiments which predict that the disruptive
effect of a secondary task is higher with a high-demanding
task than with a low or medium-demanding task. Certainly,
the difference between these results and the studies which
found a positive effect of these systems in distracted drivers
b r a i n r e s e a r c h 1 4 7 0 ( 2 0 1 2 ) 6 9 – 7 9 75

could be explained by the level of difficulty of the secondary
tasks. Whereas, in our study, the secondary task was high-
demanding resulting in the ineffectiveness of the warning
signal, other works which used less-demanding secondary
tasks found the opposite pattern (i.e. Lee et al., 2002). Never-
theless, this explanation should be considered carefully
because there is little research analyzing the effect of warn-
ing systems on both distracted and undistracted drivers and
even less research comparing the impact of different levels of
demanding secondary tasks on these systems.
Finally, another possible explanation of the warning inef-
fectiveness in distracted drivers in this study could be
attributed to the presence of the other predictor of the target
besides the warning: the deceleration of the motorcycle
before the brake light. Therefore, in our study, participants
could have used this visual information, instead of the
warning signal, as the main predictive information for antici-
pating the target, due to it being more informative than the
warning in the imperfect system condition and of course in
the no system condition. The CNV results supported this
interpretation, showing an anticipation of the target even in
the no warning system condition and in the distraction
condition.
A potential limitation of this study was the visual decelera-
tion of the motorcycle before the brake light was turned on.
This deceleration occurred during all trials and warning
conditions. As already discussed, this could have weakened
the warning efficiency, as participants could rely on this
visual information. Certainly, the deceleration-brake light
sequence might appear very often in real life but decelera-
tions might also occur without brake-light illumination.
Future research should try to dissociate the impact of these
two predictive cues in order to better analyze the impact of a
warning signal in driving.
Another factor which could have contributed to the general
weak impact of the warning may be due to the variable
timing between the warning signal onset and the target (from
1500 to 2300 ms). It is known that the moment when the
warning is given has an impact on the efficiency of the
warning system (Abe and Richardson, 2004). However, in this
task, participants never experienced a real risk of collision.
This is in order to avoid abrupt reactions and due to the fact
that urgent situations are not experienced frequently on the
road. Therefore, there was not a high perceived urgency to
respond to the target even with the later warning signal.
In addition, a complementary analysis comparing the early
and the late warning reaction times showed a general reduc-
tion of the time needed to process the target when the
system was presented than when no system was presented,
regardless of the interval used. This result suggested that the
same processes were involved in the processing of the
warning justifying the joint analysis of the different interval
conditions. However, further research examining the impact
of the different intervals separately could increase the effect
observed in this study particularly when participants were
distracted.
Finally, the objective of this research was the study of a
warning signal in a context that enabled to assess both
behavioral and electrophysiological data. Given the con-
straints of the electroencephalography, the driving task had
to be simplified prioritizing the study of the warning signal in
a more controlled context. Nevertheless, complementary
research should be performed in a more ecological scenario
before these results may be generalized.
4. Conclusion
The current proliferation of in-vehicle technology has ent-
ailed considerable research regarding the benefits of these
systems but also their possible negative effects. It has been
expected that warning systems are of benefit specifically to
distracted drivers but, in light of these results, this benefit
could depend on how much attention is claimed by a
competitive activity. The distractive effect produced by exter-
nal devices such as cell-phones has received considerable
attention. Nevertheless, driver distraction could also be
caused by internalized thoughts unrelated to the driving task
(Regan et al., 2011); this issue has been less considered in the
literature. Data presented in this study supported this impor-
tant notion for road safety showing that being immersed in
high cognitive level internal thoughts can have serious
implications. This may result in a reduction of attentional
resources for processing the relevant information, in longer
reaction times or errors in detecting the relevant information.
In addition, this type of distraction also compromises the
effectiveness of the warning system, whether perfect or
imperfect.
This experiment has been a first step in investigating the
effect of the Forward Collision Warning System and their
reliability according to the distraction level of drivers using
an electrophysiological approach, an innovative and challen-
ging technique in the driving context. Results obtained in this
experiment are promising for future applications; however,
further research is necessary for investigating the effect of
different levels of reliability of the systems and their impact
on drivers distracted by concurrent cognitive tasks of various
attentional loads.
5. Experimental procedures
5.1. Participants
12 Right-handed men from 25 to 35 years old (mean: 30.6)
took part in this experiment. None suffered from any neuro-
logical disorders and all had normal or corrected-to-normal
sight and normal hearing. They had held a driving license for
at least four years and declared that they drove at least
3000 km per year (mean: 16,042 km). 60% of participants
declared that they had experience with driver assistance
systems such as speed limiters (58%), in-vehicle navigation
systems (42%) or cruise control (33%); however, none reported
any kind of experience with Forward Collision Warning
Systems. Written informed consent was obtained from each
participant and they were financially compensated for their
participation. The research protocol was approved by INRETS
(now IFSTTAR) and the French national research ethics
committee (Declaration of Helsinki).
b r a i n r e s e a r c h 1 4 7 0 ( 2 0 1 2 ) 6 9 – 7 976

5.2. Stimuli and procedure
Before the task began, participants were briefly informed
about the procedure of the experiment. All participants were
then given a 5-min practice session to familiarize themselves
with the simulator. Afterwards, the electrodes were posi-
tioned and the experimental phase started.
Participants were required to drive on a simplified simu-
lator composed of a screen, steering wheel and pedals. Their
task was to follow a lead motorcycle located 40 m ahead
while maintaining their lateral position along the road
composed of several curves and intersections. They were
instructed to press the accelerator pedal to its maximum
which corresponded to a speed of 90 km/h. This instruction
enabled to identify the reaction time more easily. No-traffic
and foggy conditions were chosen specifically to reduce
saccadic movements and to justify, to a certain extent, the
frequent decelerations of the motorcycle presented pseudo-
randomly from 6 to 12 s (mean 10 s). Participants had to
remove their right foot from the accelerator pedal as fast as
possible in response to the motorcycle’s brake light (target).
An auditory warning could forewarn participants that the
motorcycle was going to brake soon. This warning was
500 ms long and consisted of five pulses at 2000 Hz frequency
for 80 ms each one with a shorter pause (20 ms) between
them. These parameters were chosen to increase the per-
ceived urgency (Edworthy et al., 1991). The warning was
presented randomly ranging from 1500 to 2300 ms (mean
1900 ms) in steps of 100 ms before the target, simulating
a Forward Collision Warning System. Three warning condi-
tions were designed and presented in separate blocks. In the
no system (NS) condition, no warning was given. In the
imperfect system (IS) condition, the warning was 70% reli-
able, 15% of the trials were false alarms (a warning was given
when no collision was imminent) and the rest (15%) were
misses (no warning was prompted before the visual target)
(Fig. 5). In the perfect system (PS) condition, the visual target
was always preceded by an auditory warning. 120 trials were
presented in each warning condition which was divided into
4 blocks lasting around 6 min and containing 30 trials,
except the imperfect condition which was longer (5 blocks
lasting around 7 min and containing 34 trials) to include the
same number of correct warning trials presented on the
perfect warning condition. Whatever the condition (perfect,
imperfect or no system), participants were instructed to wait
for the visual target before removing their foot from
the pedal.
In different scenarios, participants had either to perform
the visual detection task only (Simple Task, ST) or to per-
form the visual detection task as well as a secondary
cognitive task (Dual Task, DT). Half of the participants
started with the ST condition and half with the DT condition
and they alternated between ST and DT every two scenarios
to avoid monotony and boredom. The secondary task con-
sisted in a problem-solving task called the ‘‘Mystery Word’’
inspired by the Remote Associate Test described by Mednick
(1962). In this task, a set of three words with apparently no
links between them was given orally to the participants who
had to find a fourth word linked to each of the three words.
This association could correspond to a semantic link, an
expression,
a compound word or a synonymy. For example, a set of three
words could be ‘‘necklace – bicycle – reaction’’. In this case,
a solution could be ‘‘chain’’. Participants were told that this
was not a rapidity task. The set of three words was
reproduced once by a computer, leaving around 30 s before
repeating the three words once again if the participant had
not found the solution. After the next 30 s, if the participant
had still not found the solution, the computer gave another
set of three words. This avoided the possibility of the
participants giving up if the problem seemed too hard. This
secondary task was chosen because it minimized the inter-
actions between the experimenter and the participant and
only involved short answers (one word) from the participant.
In this way, electrophysiological muscle artifacts due to the
pronunciation of the answer were minimized. In addition, it
was based on short statements that were easy to remember
and several difficulty levels could be created.
Warning conditions and distraction levels were counter-
balanced across participants. The experiment was conducted
in two sessions with an interval of approximately 15 day.
Each session lasted approximately two and a half hours. The
participants were encouraged to keep as still as possible
throughout the task and to keep eye movements to a mini-
mum. They could take breaks if necessary between blocks to
minimize tiredness and eye movements.
Start of
the trialEnd of the trial
T0 T1.5 T3 to
T3.8
NS
IS
PS
Motocycle’s deceleration
Brake light
Brake light
Brake light
Brake light
Warning signal
Warning signal
Warning signal(Hit)
(FA)
(Miss)
T3.5 to
T4.3
Fig. 5 – Experimental design for the three warning conditions (no system, NS; imperfect system, IS; perfect system, PS).
b r a i n r e s e a r c h 1 4 7 0 ( 2 0 1 2 ) 6 9 – 7 9 77

5.3. Data acquisition
The experimental room where participants carried out the
experiment was equipped with a simplified simulator com-
posed of a PC, a 24 in. screen, speakers, steering wheel and
pedals. The stimulus presentation and response gathering on
the traffic simulation were controlled with the IFSTTAR
(French Institute of Science and Technology for Transport,
Development and Networks) simulator software architecture:
ArchiSim2. The electrophysiological data were recorded using
Biosemi ActiveTwo system (http://www.biosemi.com/).
An electrode cap containing 34 active electrodes with
placement based on the International 10–20 System (Fz, Cz,
Pz, Oz; Fp1, F7, F3, FC1, FC5, T7, C3, CP1, CP5, P7, P3, PO3, O1,
IMa (midway Oz-Ma1)) and their counterpart on the right
hemiscalp; Ma1 and Ma2 (left and right mastoids respec-
tively) was used. Electrooculography activity (EOG) was
recorded from the outer canthus of the right eye. An elec-
trode placed near the corner of the mouth enabled to identify
verbal responses during the secondary task. The reference
electrode was located on the nose. For EEG and EOG, signals
were acquired using ActiveTwos Ad box, 24 bit ADC per
channel sampled at 1024 Hz.
Offline, ERPs were extracted from EEG signals separately for
the three warning conditions and according to the attentional
state of the participant (simple task and dual task) using
ELAN software (Aguera et al., 2011).
The stimulus presentation and data collection for the
secondary task were performed by DMDX software (Forster
and Forster, 2003).
5.4. Data analysis
Behavioral data analyzed was the corrected mean reaction
time (RT) to the target stimuli. For each participant and each
experimental condition, RTs that were faster/slower than
mean value minus/plus three standard deviations were
excluded to calculate the corrected mean RT for this partici-
pant in this block. The remaining RT measures were analyzed
using 3�2 repeated measures ANOVA. The variables were all
manipulated within subjects.
The ERP epochs for the CNV were computed from 1000 ms
before the target to its onset and the signal was baselined
from �1000 to �900 ms. Then, the data were digitally filtered
down 60 dB at 0 Hz and 30 Hz. Concerning N1, N2, and P3, ERP
epochs began 100 ms before the target stimulus and lasted
600 ms after the target onset. The data were baselined to the
pre-stimulus activity and digitally band-pass filtered down
60 dB at .2 Hz and 30 Hz. Epochs were rejected if participants
made no response to the target and if amplitude
exceeded7200 mVat any scalp site as reflecting large artifacts
linked to muscle activity or skin potentials (see Luck, 2005).
Finally, signal was visually screened and any trial showing
artifacts linked to eye movements or blinks was removed
before average ERPs were calculated for target stimuli for
each condition.
In each condition, an index of amplitude of the CNV
component was estimated on electrode site Cz. It corre-
sponds to the sum of the negative value divided by the
number of temporal samples on a temporal window from
500 ms before the target to the onset of the target. The peak
amplitude and the latency of the peak of the visual N1
component were detected in each participant on a time
window from 150 to 275 ms and on electrode sites P7, P8,
O1, O2, Ima, Imb. In the same way, amplitude and latency of
the N2 component were detected on electrode sites Cz, FC1
and FC2 in the time window from 150 to 275 ms; amplitude
and latency of the P3 were detected on a time window from
250 to 500 ms on P3, Pz, P4, PO3, PO4, CP1, and CP2. Finally,
the maximum difference amplitude between the peak of N2
and the peak of P3 was estimated on the time window from
150 to 500 ms on CP1 and CP2. These electrode sites were
chosen based on the scalp topography of each component at
its maximum (see Figs. 3 and 4) and were consistent with
locations observed in the literature (see for example, Folstein
and Van Petten, 2008; Polich, 2007; Vogel and Luck, 2000). All
these measures were submitted to a statistical two-way
analysis of variance (ANOVA) with the distraction level and
the warning conditions as factor and simple effects were
estimated by post-hoc tests.
Acknowledgment
The research leading to these results has received funding
from the European Community’s Seventh Framework Pro-
gramme (FP7/2007–2013) under Grant agreement no. 238833/
ADAPTATION project. http://www.adaptation-itn.eu/.
r e f e r e n c e s
Abe, G., Richardson, J., 2004. The effect of alarm timing on driverbehaviour: an investigation of differences in driver trust andresponse to alarms according to alarm timing. Transp. Res.Part F: Traffic Psychol. Behav. 7, 307–322.
Abe, G., Richardson, J., 2006. Alarm timing, trust and driverexpectation for forward collision warning systems. Appl.Ergon. 37, 577–586.
Aguera, P.E., Jerbi, K., Caclin, A., Bertrand, O., 2011. Elan: asoftware package for analysis and visualization of MED, EEG,and LFP signals. Comput. Intell. Neurosci. 2011, 1–11.
Bella, F., Russo, R., 2011. A collision warning system for rear-endcollision: a driving simulator study. Procedia—Soc. Behav. Sci.20, 676–686.
Ben-Yaacov, A., Maltz, M., Shinar, D., 2002. Effects of an in-vehiclecollision avoidance warning system on short- and long-termdriving performance. Hum. Factors: J. Hum. Factors Ergon.Soc. 44, 335–342.
Bender, S., Resch, F., Weisbrod, M., Oelkers-Ax, R., 2004. Specifictask anticipation versus unspecific orienting reaction duringearly contingent negative variation. Clin. Neurophysiol. 115,1836–1845.
Bliss, J.P., Acton, S.A., 2003. Alarm mistrust in automobiles: howcollision alarm reliability affects driving. Appl. Ergon. 34, 499–509.
Correa, A., Lupianez, J., Madrid, E., Tudela, P., 2006. Temporalattention enhances early visual processing: a review and newevidence from event-related potentials. Brain Res. 1076,116–128.
Doherty, J.R., Rao, A., Mesulam, M.M., Nobre, A.C., 2005. Syner-gistic effect of combined temporal and spatial expectations onvisual attention. J. Neurosci. 25, 8259–8266.
b r a i n r e s e a r c h 1 4 7 0 ( 2 0 1 2 ) 6 9 – 7 978
Edworthy, J., Loxley, S., Dennis, I., 1991. Improving auditorywarning design: relationship between warning sound para-meters and perceived urgency. Hum. Factors 33, 205–232.
Folstein, J.R., Van Petten, C., 2008. Influence of cognitive controland mismatch on the N2 component of the ERP: a review.Psychophysiology 45, 152–170.
Forster, K.I., Forster, J.C., 2003. DMDX: a windows display programwith millisecond accuracy. Behav. Res. Methods, Instrum.Comput. 35, 116–124.
Gherri, E., Eimer, M., 2011. Active listening impairs visual percep-tion and selectivity: an ERP study of auditory dual-task costson visual attention. J. Cogn. Neurosci. 23, 832–844.
Hillyard, S.A., Anllo-Vento, L., 1998. Event-related brain potentialsin the study of visual selective attention. Proc. Natl. Acad. Sci.95, 781–787.
Ho, C., Reed, N., Spence, C., 2006. Assessing the effectiveness of‘‘intuitive’’ vibrotactile warning signals in preventing front-to-rear-end collisions in a driving simulator. Accid. Anal. Prev. 38,988–996.
Ho, C., Spence, C., 2009. Using peripersonal warning signals toorient a driver’s gaze. Hum. Factors: J. Hum. Factors Ergon.Soc. 51, 539–556.
Kiefer, R.J., LeBlanc, D., Palmer, M., Salinger, J., Deering, R.,Shulman, M., 1999. Forward Collision Warning Systems:development and validation of functional definitionsand evaluation procedures for collision warning/avoidancesystems. National Highway Traffic Safety Administration,Washington, DC.
Knipling, R.R., Wang, J.S., Yin, H.M., 1993. Rear-end crashes:problem size assessment and statistical description. NationalHighway Traffic Safety Administration, Washington, DC.
Kuge, N., Ueno, H., Ichikawa, H., Ochiai, K., 1995. A study on thecauses of rear-end collision based on an analysis of driverbehavior. JSAE Rev. 16, 55–60.
Lee, J.D., McGehee, D.V., Brown, T.L., Reyes, M.L., 2002. Collisionwarning timing, driver distraction, and driver response toimminent rear-end collisions in a high-fidelity driving simu-lator. Hum. Factors 44, 314–334.
Lerner, N.D., Dekker, D.K., Steinberg, G.V., Huey, R.W., 1996.Inappropriate alarm rates and driver annoyance. NationalHighway Traffic Safety Administration, Washington, DC.
Luck, S.J., 2005. An introduction to the event-related potentialtechnique. The MIT Press, Cambridge, Massachussetts.
Maltz, M., Shinar, D., 2004. Imperfect in-vehicle collision avoid-ance warning systems can aid drivers. Hum. Factors 46,357–366.
Mednick, S.A., 1962. The associative basis of the creative process.Psychol. Rev. 69, 220–232.
Mohebbi, R., Gray, R., Tan, H.Z., 2009. Driver reaction time totactile and auditory rear-end collision warnings while talking
on a cell phone. Hum. Factors: J. Hum. Factors Ergon. Soc. 51,102–110.
National Highway Traffic Safety Administration, 2009. TrafficSafety Facts 2009: A Compilation of Motor Vehicle Crash Datafrom the Fatality Analysis Reporting System and the GeneralEstimates System. U.S. Department of Transportation,Washington, DC.
Parasuraman, R., Hancock, P.A., Olofinboba, O., 1997. Alarmeffectiveness in driver-centred collision-warning systems.Ergonomics 40, 390–399.
Polich, J., 2007. Updating P300: an integrative theory of P3a andP3b. Clin. Neurophysiol.: Off. J. Int. Fed. Clin. Neurophysiol.118, 2128–2148.
Rakauskas, M.E., Ward, N.J., Bernat, E.M., Cadwallader, M., Patrick,C.J., de Waard, D., 2005. Psychophysiological measures ofdriver distraction and workload while intoxicated. In: Proceed-ings of the 3rd International Symposium on Human Factors inDriver Assessment, Training, and Vehicle Design. Rockport,Maine.
Regan, M.A., Lee, J.D., Young, K.L., 2008. Driver distraction: theory,effects and mitigation. CRC Press, Florida, USA.
Regan, M.A., Hallett, C., Gordon, C.P., 2011. Driver distraction anddriver inattention: definition, relationship and taxonomy.Accid. Anal. Prev. 43, 1771–1781.
Seibold, V.C., Bausenhart, K.M., Rolke, B., Ulrich, R., 2011. Doestemporal preparation increase the rate of sensory informationaccumulation?. Acta Psychol. 137, 56–64.
Strayer, D.L., Drews, F.A., 2007. Multi tasking in the automobile.In: Kramer, A., Wiegmann, D., Kirlik, A. (Eds.), Attention: FromTheory to Practice. Oxford University Press, New York,pp. 121–133.
Sullivan, J.M., Tsimhoni, O., Bogard, S., 2007. Warning reliabilityand driver performance in naturalistic driving. University ofMichigan Transportation Research Institute, Michigan.
Vogel, E.K., Luck, S.J., 2000. The visual N1 component as an indexof a discrimination process. Psychophysiology 37, 190–203.
Vogel, L., Bester, C.J., 2005. A relationship between accident typesand causes. In: Proceedings of the 24th Southern AfricanTransport Conference. South Africa.
Wickens, C., Kramer, A., Vanasse, L., Donchin, E., 1983. Perfor-mance of Concurrent Tasks: A Psychophysiological Analysis ofthe Reciprocity of Information-Processing Resources. Sci. 221,1080–1082.
Wickens, C.D., Dixon, S.R., 2007. The benefits of imperfectdiagnostic automation: a synthesis of the literature. Theor.Issues Ergon. Sci. 8, 201–212.
Zhu, B., 2001. Potential effects on accidentes from forwardcollision warning/avoidance system. Linkoping University,Norrkoping, Sweden.
b r a i n r e s e a r c h 1 4 7 0 ( 2 0 1 2 ) 6 9 – 7 9 79

Partie Expérimentale
81
4.3. Expérience 2 : Efficacité d’un système d’alerte anticollision en
simple et double tâche d’un point de vue électrophysiologique
Bueno, M., Fort, A., Francois, M., Ndiaye, D., Deleurence, P., and Fabrigoule, C. (2013).
Effectiveness of a Forward Collision Warning System in simple and in dual task from an
electrophysiological perspective. Neuroscience Letters, 541, 219-223.
4.3.1. Objectif et justification
Cette deuxième étude visait à analyser l’efficacité du système anticollision en fonction de l’état
attentionnel du conducteur en éliminant le biais d’anticipation provoqué par les décélérations de la
moto.
4.3.2. Méthode
4.3.2.1. Population
Douze hommes de 25 à 35 ans (moyenne d’âge : 28.9 ans) ont participé à cette étude. Tous ont
déclaré avoir eu le permis de conduire depuis au moins trois ans et avoir conduit au moins 3000 km
par an au cours de la dernière année (moyenne : 9792 km). Les deux tests évaluant le
fonctionnement cognitif utilisés dans la première étude nous ont permis de vérifier là encore l’absence
de déficits cognitifs chez nos participants.

Chapitre 4
82
4.3.2.2. Protocole
Cette étude a été également menée dans le simulateur de conduite simplifié. La méthode était très
similaire à l’étude précédente puisque les deux tâches (la tâche de conduite et la tâche de distraction
cognitive) réalisées par les participants étaient identiques. La différence principale réside dans les
décélérations de la moto. En effet, afin d’éliminer la possible valeur prédictive des décélérations
initiales, nous avons ajouté des décélérations simples qui n’étaient suivies ni du signal avertisseur ni
du feu stop Toutefois, seules deux conditions de système ont été testées dans cette expérience :
système imparfait et sans système (voir Figure 16).
Figure 16. Séquence expérimentale pour chaque essai dans les deux conditions de système.
Comme dans l’étude précédente nous avons enregistré des mesures comportementales et des
potentiels évoqués.
4.3.3. Discussion des principaux résultats
Au niveau électrophysiologique, le résultat de la composante VCN (anticipation) montre que la
décélération dans ce nouveau protocole ne permet plus l’anticipation de la cible rendant ainsi possible
l’analyse de l’efficacité du signal avertisseur en simple et double tâches.

Partie Expérimentale
83
Au niveau comportemental, nos résultats montrent un effet global du signal avertisseur ce qui suggère
que le bénéfice est plus important dans cette étude que dans la précédente. La présence du signal a
réduit les temps de réaction. En ce qui concerne les potentiels évoqués, une augmentation de
l’amplitude de la composante VCN et une diminution de la latence de la P3 ont montré que le signal
avertisseur agit au niveau des étapes préparatoires et cognitives du traitement de l’information.
De plus, nos résultats montrent un effet global de la double tâche et pas d’effet d’interaction entre les
conditions système et distraction. Ainsi et bien que le signal semble plus efficace dans cette étude,
l’absence d’interaction semble indiquer que le signal n’est pas capable de compenser l’effet négatif de
la distraction. Il est possible que le niveau de difficulté de la tâche secondaire soit responsable de ce
résultat. Ceci renforce l’hypothèse que le signal avertisseur nécessite des ressources attentionnelles
pour être traité. Afin d’apporter des éléments de réponse à cette question, l’un des objectifs de notre
prochaine étude sera de tester l’efficacité du signal avertisseur en fonction du niveau de la charge
cognitive de la tâche secondaire.
4.4. Article 2

Neuroscience Letters 541 (2013) 219– 223
Contents lists available at SciVerse ScienceDirect
Neuroscience Letters
jou rn al h om epage: www.elsev ier .com/ locate /neule t
Effectiveness of a Forward Collision Warning System in simple and in dual taskfrom an electrophysiological perspective
Mercedes Bueno a,b,c,∗, Alexandra Fort a,b, Mathilde Francoisb, Daniel Ndiayed,Philippe Deleurence a,b, Colette Fabrigoule c
a IFSTTAR-LESCOT, F-69675 Bron, Franceb University of Lyon, F-69622 Lyon, Francec University Bordeaux Segalen, USR CNRS 3413 SANPSY, F-33076 Bordeaux, Franced University of Paris-Est, IFSTTAR, IM, LEPSIS, F-75732 Paris, France
h i g h l i g h t s
◮ The effectiveness of the FCWS was assessed in undistracted and distracted drivers.◮ Behavioural and electrophysiological data (ERP) was recorded in a simulator study.◮ In undistracted drivers, the FCWS accelerated the detection of a potential obstacle.◮ And it improved the anticipation (CNV) and the cognitive process of the target (P3).◮ However, the effectiveness of the FCWS in distracted drivers was limited.
a r t i c l e i n f o
Article history:
Received 10 December 2012
Received in revised form 7 February 2013
Accepted 14 February 2013
Keywords:
Forward Collision Warning System
Cognitive distraction
Anticipation
Event related potential
a b s t r a c t
Forward Collision Warning Systems (FCWS) are expected to assist drivers; however, it is not completely
clear whether these systems are of benefit to distracted drivers as much as they are to undistracted
drivers. This study aims at investigating further the analysis of the effectiveness of a surrogate FCWS
according to the attentional state of participants. In this experiment electrophysiological and behavioural
data were recording while participants were required to drive in a simple car simulator and to react
to the braking of the lead vehicle which could be announced by a warning system. The effectiveness
of this warning system was evaluated when drivers were distracted or not by a secondary cognitive
task. In a previous study, the warning signal was not completely effective likely due to the presence
of another predictor of the forthcoming braking which competes with the warning. By eliminating this
secondary predictor in the present study, the results confirmed the negative effect of the secondary task
and revealed the expected effectiveness of the warning system at behavioural and electrophysiological
levels.
© 2013 Elsevier Ireland Ltd. All rights reserved.
1. Introduction
Forward Collision Warning Systems (FCWS) have been intro-duced in the motor industry to assist drivers in preventing potentialcollisions. It is well known that the effectiveness of the system canstrongly depend on different technical parameters. For example,the timing of the warning, the reliability of the system and/or themodality of the warning signal are some important elements tobe considered when investigating FCWS [1,4,15]. Moreover, driverdistraction could also have an impact on the effectiveness of the
∗ Corresponding author at: IFSTTAR-LESCOT, 25 avenue Franc ois Mitterrand, F-
69675 BRON, France. Tel.: +33 472142433; fax: +33 472376837.
E-mail address: [email protected] (M. Bueno).
system. Indeed, driver distraction has been identified as the maincontributing factor for rear-end collisions [16]. Thus, it could beexpected that these systems are of benefit to distracted drivers inparticular, mitigating the negative effect of the competitive tasksby redirecting attention to the road and/or by promoting a responseto avoid a potential collision [18]. Most research has showed posi-tive effects of FCWS when drivers are undistracted [e.g., 13]. In thecase of distraction, the system also seems to be effective [e.g., 20];however, the impact of the distraction has not been systematicallyassessed by a control group, therefore it is not currently completelyclear whether the warning system is of more benefit to distracteddrivers.
At a more fundamental level, warning signals have also beendemonstrated to be effective in reducing reaction time [25]. More-over, it has been discussed that warning signals affect response
0304-3940/$ – see front matter © 2013 Elsevier Ireland Ltd. All rights reserved.
http://dx.doi.org/10.1016/j.neulet.2013.02.030

220 M. Bueno et al. / Neuroscience Letters 541 (2013) 219– 223
selection and cognitive processes rather than sensory or motorprocesses [12,25]. The fact that dual tasks impair performance hasbeen largely investigated [3,29]; however, whether warning sig-nals are effective in reducing this negative effect and, if this hadbeen true, at which stages of processing, remains less studied toour knowledge. To answer this question, techniques like electroen-cephalography (EEG) and the associated Event Related Potential(ERP) can be very valuable. Indeed, they enable to make a dis-tinction among the different stages of information processing likeanticipation processes (Contingent Negative Variation, CNV), sen-sory analysis of the stimulus (N1 component), and higher cognitiveprocessing (P3 component).
ERPs have been used in order to examine the dual task costsin non-driving studies. For example, Guerri and Eimer [11] foundthat when participants had to perform a visual detection task atthe same time that they had to listen to a story to posteriorlyanswer some questions, the amplitude of the N1, N2, and P3 compo-nents were reduced in comparison to when participants only hadto perform the visual detection task [see also 10]. In the drivingdomain, ERP studies have been used mainly to examine the fatigueeffects and vigilance while driving. There are only a few ERP driv-ing simulator studies showing the disrupting effect of performinga concurrent cognitive secondary task [see, for example, 6, 24]. andthis technique has only been implemented recently in the study ofadvanced driver assistance systems and, specifically, in the studyof FCWS [7].
The present study completes a series of experiments from ourlaboratory investigating the effectiveness of a warning signal byrecording both behavioural and electrophysiological data. In a non-driving study performed on a computer, Fort et al. [10] analysed theeffect of an auditory warning signal on the detection of a simplevisual target according to the attentional state of the participants,distracted or not by a secondary cognitive task. The warning couldprecede the target either in 100% of the cases (perfect condition) orin only 70% of the cases (imperfect condition). The negative effectof the secondary task was evident through behavioural data andERP data at the level of the CNV, the amplitude of the N1, and theamplitude and latency of the P3. In addition, faster reaction timeswhen the warning (perfect and imperfect conditions) was availablewere observed. This result was confirmed by ERP data at the levelof the CNV, the amplitude and latency of the N1, and the latency ofthe P3.
Afterwards, in a “driving” study, Bueno et al. [7] used a similarprotocol adapted on a simplified driving simulator to investigatethe effect of a surrogate FCWS in a driving context. Participantswere required to drive and to react by decelerating when the brakelight (target) of the lead motorcycle was illuminated. The reliabilityof a warning system (perfect, imperfect or no system) in predict-ing the brake light and the drivers’ attentional state (undistractedor distracted by a secondary cognitive task) were manipulated.The results showed a negative effect of the secondary task atbehavioural and ERP levels (CNV, N1, and P3 amplitude). However,unexpectedly and contrary to the previous non-driving study, theresults only showed an effect of the warning signal at the level ofthe P3 latency. A possible explanation could come from the exper-imental design. Indeed, an initial deceleration of the motorcycleoccurred systematically before braking in all trials, with or withoutthe occurrence of the warning signal. Thus, participants may haveused this motorcycle deceleration as a better predictor of the brakelight occurrence than the warning signal which was not alwaysreliable.
Therefore, the current study aims at eliminating the predic-tive value of this motorcycle deceleration for the forthcomingbrake light in order to better evaluate the impact of an FCWSaccording to the drivers’ attentional state. For this, simple decel-eration trials that were not followed by the brake light were
added in a similar protocol than the one used in Bueno et al.[7]. This change in the experimental design should increasethe predictive value of the warning signal and, consequently,its effectiveness. Moreover, this would provide a more realisticcontext as, in real driving conditions, vehicles can also deceler-ate only by releasing the accelerator and without pressing thebrake.
2. Methods
2.1. Participants
12 right-handed men (mean age: 28.9 years, SD: 3.8) took partin the experiment. All participants had at least six years of driv-ing experience and they drove at least 3000 km per year (mean:9792 km). None suffered from any neurological disorders and nonereported any kind of experience with FCWS. Written informed con-sent was obtained from each participant and they were financiallycompensated for their participation.
2.2. Materials/apparatus
This experiment was conducted in a simplified driving simula-tor composed of a PC, a 24 in. screen, steering wheel, and pedals.The stimulus presentation and response gathering on the trafficsimulation were controlled with the IFSTTAR simulator softwarearchitecture, ArchiSim.
The electrophysiological data was recorded with BiosemiActiveTwo system (http://www.biosemi.com/). A cap containing32 active electrodes placed according to the International 10-20System and two additional electrodes placed on the Ma1 and Ma2(left and right mastoids respectively) were used. Electrooculogra-phy activity (EOG) was recorded from the outer canthus of the righteye. An electrode placed near the corner of the mouth enabled toidentify verbal responses during the secondary task. The referenceelectrode was located on the nose. For EEG and EOG, signals wereacquired using ActiveTwo® Ad box, 24 bit ADC per channel sampledat 1024 Hz. Offline, ERPs were extracted from EEG signals sepa-rately for the two warning conditions in simple and in dual taskusing ELAN software [2].
2.3. Procedure
Before the task began, all participants were given a 5 min prac-tice session to familiarise themselves with the driving task on thesimulator and with the secondary cognitive task, separately. After-wards, the electrodes were positioned and the experimental phasestarted.
Participants were required to drive actively on the simulator fol-lowing a lead motorcycle located 40 m ahead. They were instructedto press the accelerator pedal to its maximum which correspondedto a speed of 90 km/h. This instruction enabled to identify the reac-tion time (RT) more easily. Foggy and no-traffic conditions werechosen specifically to reduce saccadic movements and to justify,to a certain extent, the frequent decelerations of the motorcycle(lasting between 2 and 3 s.) presented randomly from 4 to 7 s.Participants had to remove their right foot from the acceleratorpedal as fast as possible in response to the motorcycle’s brake light(target). An auditory warning could forewarn participants that themotorcycle was going to brake soon. This warning was 500 ms longand consisted of five pulses at 2000 Hz frequency for 80 ms each onewith a shorter pause (20 ms) between them. These parameters werechosen to increase the perceived urgency [8]. The warning was pre-sented randomly ranging from 1500 to 2300 ms (mean 1900 ms) in

M. Bueno et al. / Neuroscience Letters 541 (2013) 219– 223 221
Fig. 1. Grand average of ERP showing the CNV at Cz, the N1 at P8, and the P3 at PO3 for no system and for imperfect system condition in simple task (ST) and in dual task
(DT).
steps of 100 ms before the target. Two warning conditions1 weredesigned and presented in separate blocks.
The No System (NS) condition was composed of 318 trials dividedinto six blocks lasting around 5 min. In 62% of the trials (n = 198), thetarget (brake light) was presented preceded by the deceleration ofthe motorcycle. The remaining 38% of the trials were simple decel-eration events that were not followed by the brake light (to removethe predictive value of the motorcycle decelerations). These trialswere excluded from the analysis. The Imperfect System (IS) condi-tion was composed of 424 trials divided into eight blocks lastingaround 6 min. As in the NS condition, 38% of the trials were sim-ple decelerations that were not analysed. In the remaining 62% ofthe trials, the warning was reliable to announce the brake light inabout 76% (n = 200) and non-reliable in about 24% (n = 64) of thetrials (about 12% of the trials were false alarms and about 12% weremisses).
In each warning condition, participants either had to performthe visual detection task only (Simple Task, ST) or to perform thevisual detection task as well as a secondary cognitive task (DualTask, DT). A quarter of the participants started with the no systemcondition in ST and another quarter with the no system condition inDT. Similarly, a quarter of the participants started with the imper-fect system condition in ST and another quarter with the imperfectsystem condition in DT. In addition, ST and DT conditions werealternated every two blocks in the imperfect condition, or everythree blocks in the no system condition, in order to avoid monotonyand boredom. The secondary task consisted in a problem-solvingtask called the “Mystery Word” inspired by the Remote AssociatesTest described by Mednick [21]. In this task, a set of three wordswith apparently no links between them was given orally to the par-ticipants who had to find another word linked to each of the threewords. Further details of this task can be found in Bueno et al. [7].
The experiment was conducted in one session lasting approx-imately 3 h. The participants were encouraged to keep as still aspossible throughout the task and to keep eye movements to a
1 The perfect system condition was excluded from this experiment, as it was con-
sidered that perfect systems are not realistic systems, and in order to reduce the
duration of the study.
minimum. They could take breaks if necessary between blocks tominimize tiredness and eye movements.
2.4. Data analysis
The behavioural data analysed was the corrected mean RT tothe target stimuli: for each participant and each experimental con-dition (false alarms and misses were not analysed). RT that werefaster/slower than mean value minus/plus three standard devia-tions were discarded from the data analysis. The corrected mean RTwas analysed using a 2(distraction level) × 2(warning conditions)repeated measures ANOVA.
The ERP epochs for the CNV were computed from 800 ms beforethe target to its onset and the signal was baselined from −800 to−700 ms. Then, the ERPs from each electrode were digitally filtered(low-pass filter with a 30 Hz cut-off, slope 60 db/octave). Concern-ing N1 and P3, ERP epochs began 100 ms before the target stimulusand lasted 600 ms after the target onset. The data was baselinedto the pre-stimulus activity and digitally band-pass filtered down60 db at 0.2 Hz and 30 Hz. Epochs were rejected if participants madeno response to the target and if amplitude exceeded ±150 �V atany scalp site as reflecting large artefacts linked to muscle activityor skin potentials [see 19]. Finally, signals were visually screenedand any trial showing artefacts linked to eye movements or blinks(detected by Fp1 and Fp2 electrodes) was removed before averageERPs were calculated for target stimuli for each condition.
In each condition, an index of amplitude of the CNV compo-nent was estimated on electrode site Cz. It corresponds to the sumof the negative value divided by the number of temporal sampleson a temporal window from 200 ms before the target to the onsetof the target. The peak amplitude and the latency of the peak ofthe visual N1 component were detected on a time window from150 to 275 ms and on electrode sites P7, P8, O1, O2, Ima, Imb. Inthe same way, amplitude and latency of the P3 were detected on atime window from 250 to 500 ms on Pz, P3, P4, PO3, PO4, CP1, andCP2. These electrode sites were chosen based on the scalp topogra-phy of each component at its maximum and were consistent withlocations observed in the literature [see for example, 9, 23, 28]. Allthese measures were submitted to a statistical two-way analysis ofvariance (ANOVA) with distraction level and warning conditions asfactors.

222 M. Bueno et al. / Neuroscience Letters 541 (2013) 219– 223
Table 1
Amplitude data (�V) of the CNV, N1, and P3, and latency data (ms) of the N1 and P3
components.
CNV N1 P3
NS IS NS IS NS IS
Amplitude (�V)
ST −1.74 −5.26 −12.15 −12.97 12.03 12.46
DT −2.00 −2.78 −8.80 −9.99 8.06 8.07
Latency (ms)
ST 222 216 405 365
DT 218 216 435 372
3. Results
3.1. Behavioural results
The 2 × 2 repeated-measures ANOVA showed a significant maineffect of distraction level (F(1,11) = 44.99, p < .001) indicating thatparticipants reacted significantly faster when they were undis-tracted (466 ms in NS and 439 ms in IS; mean: 452 ms) than whenthey were distracted (524 ms in NS and 490 in IS; mean: 506 ms).The main effect of warning condition (F(1,11) = 8.68, p = .013) wasalso significant showing faster reaction times with the presenceof the warning system (mean: 465 ms) compared to its absence(mean: 494 ms) The two-way interaction failed to reach signifi-cance.
3.2. ERP results
The amplitude of the CNV as well as the amplitude and latencyof the N1 and P3 were submitted to repeated-measures ANOVA.
Regarding the impact of the warning condition (Fig. 1 andTable 1), a main effect in the CNV amplitude (F(1,11) = 5.13, p = .045)and in the P3 latency (F(1,11) = 6.71, p = .025) was found. Indeed,the amplitude of the CNV was larger in the imperfect condition(−4.02 �V) than in the no system condition (−1.87 �V). In addi-tion, the latency of the P3 was reduced in the presence of the system(369 ms) compared to no system (420 ms).
Concerning the impact of the distraction level (Fig. 1 andTable 1), a marginal effect was found on the CNV amplitude(F(1,11) = 4.48, p = .058) and a main effect was obtained on theamplitude of the N1 (F(1,11) = 26.55, p < .001) and of the P3 com-ponents (F(1,11) = 17.09, p = .002). The amplitude of the CNV, N1,and P3 was lower in the DT (−2.39 �V; −9.40 �V; 8.07 �V, respec-tively) than in the ST condition (−3.50 �V; −12.56 �V; 12.25 �V,respectively) and the latency of the P3 was longer in DT (404 ms)than in ST (385 ms). No interaction effects were found between thedistraction levels and the warning conditions.
4. Discussion
The aim of this experiment was to investigate further the effec-tiveness of the FCWS when drivers were distracted eliminating anexperimental bias presented in Bueno et al., [7] i.e. the predictivevalue of the motorcycle decelerations related to the forthcomingoccurrence of the brake light. The result showing that decelera-tions were no longer predictive of the brake light comes from theneuroimaging results. Specifically, CNV data showed that no antic-ipation of the brake light occurred when no warning system wasavailable. At the behavioural level, the presence of the warning sys-tem reduced the RTs compared to no system at all. At the ERP level,no differences between the two warning conditions were foundconcerning the N1 component, indicating that the warning systemdid not seem to facilitate the sensory processing of the target, butthe presence of the system seemed to reduce the peak latency of
the P3 component compared to no system at all. This result couldbe interpreted as a diminution of the time required to process thetarget at higher cognitive level.
Although the warning system proved to be effective in a non-driving study conducted in our lab [10], it appeared to be ineffectivein our previous “driving” study [7]. We hypothesized that this dis-crepancy came from the presence of another predictor to the brakelight which competes with the warning signal: the decelerationof the motorcycle which was always linked to the brake light inthe “driving” study [7]. After removing the predictive value of thisdeceleration by adding decelerations trials not linked to the brakelight, results revealed the effectiveness of the warning system. Itis interesting to note that the trials analysed in this study andthose analysed in the previous one were very similar. They all werecomposed of a deceleration followed by the brake light. The differ-ence came only from the context since trials with decelerations notlinked to the brake light were introduced only in the present study.Braver and Barch [5] highlighted the importance to present theinformation relevant to the task. When two or more events competefor the same response, the relevant information will be processedover other competing sources of information. In our previous “driv-ing” study, the motorcycle deceleration was more relevant becauseit was always predictive of the brake light; in contrast, the warningsignal was less relevant because of the presence of the false alerttrials.
At ERP level, the main difference between the two “driving”experiments was evidenced through CNV data. As mentionedabove, when decelerations were no longer predictive of the target,drivers’ capacity to anticipate the target when no warning systemwas available was drastically reduced as reflected by the ampli-tude decrease of the CNV by about 70%. Consequently, an increaseof the predictive value and the effectiveness of the warning systemhas been observed in this study by faster RTs, by an increase of theamplitude at the level of the CNV, and by a reduction of the peaklatency of the P3 in the presence of the warning system.
Findings from this study evidenced that the warning signal oper-ates at preparatory (CNV) and higher cognitive (P3) stages. Theseresults are consistent with Hackley and Valle-Inclán [12] who foundin a non-driving context that the warning signal accelerated thelateralized readiness potential, a component also involved in theprocess of motor preparation as for the CNV. Concerning the influ-ence of the warning signal at the level of the P3, our results arecongruent with non-driving studies showing a reduction of thelatency of the P3 by the warning [12,25].
Consistently with previous research works in non-driving [11]as in driving domain [6], a robust negative impact of the sec-ondary task at behavioural and electrophysiological levels has beenobserved in this study as in our two previous studies [7,10]. How-ever, as no interaction was observed in this study, it seems thatthe warning signal was not able to compensate the negative effectof the dual task. What has to be further examined is whether thewarning system is able to eliminate or at least to reduce the impactof the secondary tasks. To our knowledge, there are not a lot ofstudies investigating the impact of a warning signal in a dual task.Therefore, further research should be done to investigate this phe-nomenon at a fundamental level in a non-driving context but alsospecifically in a driving context, since warning systems are sup-posed to be helpful especially for distracted drivers.
It could be possible that the effectiveness of the warning isaffected by the difficulty level of the secondary task as well as thetype of warning system. According to the literature, auditory andvisual-auditory warnings seem to be effective in helping driversto detect potential collisions when they are distracted by a visualsecondary task [15,17]. In this experiment, visual warnings wereavoided in order to limit the eye movements (artefact to the ERP);however, given that the secondary task had an auditory component

M. Bueno et al. / Neuroscience Letters 541 (2013) 219– 223 223
and the warning signal was also auditory, a multimodal warningcould have been more effective than the auditory one [22,27]. Thisis consistent with results of behavioural studies in driving simulator[14] and also ERP studies in non-driving related context [26], show-ing that multimodal warnings are more effective than unimodalwarnings.
Finally, the complementarity of the behavioural and ERP dataobserved in these studies encourages further investigations intothe effectiveness of some driver assistance systems by consideringthe use of electrophysiological data in simulators.
Acknowledgement
The research leading to these results has received fundingfrom the European Community’s Seventh Framework Programme(FP7/2007–2013) under grant agreement No. 238833/ADAPTATIONproject. www.adaptation-itn.eu.
References
[1] G. Abe, J. Richardson, The effect of alarm timing on driver behaviour: an inves-tigation of differences in driver trust and response to alarms according to alarmtiming, Transp. Res. Part F: Traffic Psychol. Behav. 7 (2004) 307–322.
[2] P.E. Aguera, K. Jerbi, A. Caclin, O. Bertrand, Elan A software package for analysisand visualization of MED, EEG, and LFP signals, Comput. Intell. Neurosci. 2011(2011) 1–11.
[3] A.D. Baddeley, Exploring the central executive, Q. J. Exp. Psychol. 49A (1996)5–28.
[4] J.P. Bliss, S.A. Acton, Alarm mistrust in automobiles: how collision alarm relia-bility affects driving, Appl. Ergon. 34 (2003) 499–509.
[5] T.S. Braver, D.M. Barch, A theory of cognitive control, aging cognition, andneuromodulation, Neurosci. Biobehav. Rev. 26 (2002) 809–817.
[6] M.P. Bruyas, A. Chapon, T. Lelekov-Boissard, D. Letisserand, M. Duraz, I. Aillerie,Evaluation de l’impact de communications vocales sur la conduite automobile,Recherche Transports Sécurité 91 (2006) 99–119.
[7] M. Bueno, C. Fabrigoule, P. Deleurence, D. Ndiaye, A. Fort, An electrophysiolog-ical study of the impact of a Forward Collision Warning System in a simulatordriving task, Brain Res. 1470 (2012) 69–79.
[8] COMSIS Corporation, Preliminary Human Factors Guidelines for Crash Avoid-ance Warning Devices COMSIS, 1996.
[9] J.R. Folstein, C. Van Petten, Influence of cognitive control and mismatch on theN2 component of the ERP: a review, Psychophysiology 45 (2008) 152–170.
[10] A. Fort, B. Collette, M. Bueno, P. Deleurence, A. Bonnard, Impact of totallyand partially predictive alert in distracted and undistracted subjects: an eventrelated potential study, Accid. Anal. Prev. 50 (2013) 578–586.
[11] E. Guerri, M. Eimer, Active listening impairs visual perception and selectivity:an ERP study of auditory dual-task costs on visual attention, J. Cogn. Neurosci.23 (2011) 832–844.
[12] S.A. Hackley, F. Valle-Inclán, Which stages of processing are speeded by a warn-ing signal? Biol. Psychol. 64 (2003) 27–45.
[13] C. Ho, N. Reed, C. Spence, Assessing the effectiveness of intuitive vibrotactilewarning signals in preventing front-to-rear-end collisions in a driving simula-tor, Accid. Anal. Prev. 38 (2006) 988–996.
[14] C. Ho, N. Reed, C. Spence, Multisensory in-car warning signals for collisionavoidance, Hum. Factors 49 (2007) 1107–1114.
[15] C. Ho, C. Spence, Using peripersonal warning signals to orient a driver’s Gaze,Hum. Factors 51 (2009) 539–556.
[16] R.R. Knipling, J.S. Wang, H.M. Yin, Rear-end crashes: problem size assessmentand statistical description, National Highway Traffic Safety Administration,Washington, DC, 1993.
[17] J.D. Lee, D.V. McGehee, T.L. Brown, M.L. Reyes, Collision warning timing, driverdistraction, and driver response to imminent rear-end collisions in a high-fidelity driving simulator, Hum. Factors 44 (2002) 314–334.
[18] J.D. Lee, M.L. Ries, D.V. McGehee, T.L. Brown, M. Perel, Can Collision Warn-ing Systems Mitigate Distraction Due to In-Vehicle Devices? NHTSA DriverDistraction Internet Forum, Rockville, Maryland, 2000.
[19] S.J. Luck, An introduction to the Event-Related Potential technique, The MITPress, Cambridge, Massachussetts, 2005.
[20] M. Maltz, D. Shinar, Imperfect in-vehicle collision avoidance warning systemscan aid distracted drivers Transp. Res. Part F Traffic Psychol. Behav. 10 (2007)345–357.
[21] S.A. Mednick, The associative basis of the creative process, Psychol. Rev. 69(1962) 220–232.
[22] R. Mohebbi, R. Gray, H.Z. Tan, Driver Reaction Time to Tactile and AuditoryRear-End Collision Warnings While Talking on a Cell Phone, Hum. Factors 51(2009) 102–110.
[23] J. Polich, Updating, P300: an integrative theory of P3a and P3b, Clin. Neuro-physiol. 118 (2007) 2128–2148.
[24] M.E. Rakauskas, N.J., Ward, E.M., Bernat, M., Cadwallader, C.J., Patrick, D. deWaard, Psychophysiological measures of driver distraction and workload whileintoxicated 3rd International Symposium on Human Factors in Driver Assess-ment, Training, and Vehicle Design, Rockport, Maine, 2005.
[25] A.P. Rudell, B. Hu, Does a warning signal accelerate the processing of sensoryinformation? Evidence from recognition potential responses to high and lowfrequency words, Int. J. Psychophysiol. 41 (2001) 31–42.
[26] V. Santangelo, R. Van der Lubbe, M. Olivetti Belardinelli, A. Postma, Multisen-sory integration affects ERP components elicited by exogenous cues, Exp. BrainRes. 185 (2008) 269–277.
[27] United Nations, Guidelines on establishing requirements for high-prioritywarning signals, Economic Commission for Europe, Geneva, 2011.
[28] E.K. Vogel, S.J. Luck, The visual N1 component as an index of a discriminationprocess, Psychophysiology 37 (2000) 190–203.
[29] C. Wickens, The structure of attentional resources, in: R. Nicker-son (Ed.), Attention and Performance, Erlbaum, Hillsdale, NJ, 1980,pp. 239–257.

Partie Expérimentale
89
4.5. Expérience 3 : Adaptation comportementale et efficacité d’un
système d’alerte anticollision en fonction de la tâche secondaire
cognitive
Bueno, M., Fabrigoule, C., Ndiaye, D., and Fort, A. (soumis). Behavioural adaptation and
effectiveness of a Forward Collision Warning System depending on secondary cognitive task.
Transportation Research Part F: Traffic Psychology and Behaviour.
4.5.1. Objectif et justification
Les deux expériences précédentes ont porté sur l’impact du signal avertisseur sur l’analyse du
traitement de l’information lors de l’utilisation d’un système anticollision. À l’aide de mesures de
potentiels évoqués nous avons pu préciser les étapes du traitement qui sont influencées par le signal
avertisseur. Cependant, l’utilisation de cette technique nous a contraints à utiliser un simulateur et des
scénarios de conduite extrêmement simplifiés. Dans cette troisième étape, nous avons souhaité
regarder, à l’aide d’un simulateur de conduite plus réaliste, l’adaptation comportementale au système.
Des changements comportementaux lors de l’utilisation du système peuvent survenir pendant les
premières utilisations (phase d’apprentissage), mais aussi après une exposition plus longue au
système (phase d’intégration) (Saad et al., 2004). En général, les systèmes anticollision ont montré
des bénéfices pendant la phase d’apprentissage. Cependant, les effets à plus long terme mais aussi
les conséquences de l’absence du système après la phase d’intégration ont été moins étudiés.
Par ailleurs, les résultats des expériences précédentes ont suggéré que le signal avertisseur
nécessitait des ressources attentionnelles pour être traité et, en conséquence, sa faible efficacité dans
les expériences antérieures pourrait être liée à la haute charge cognitive de la tâche secondaire
employée. Selon l’hypothèse formulée dans la Figure 17, le signal avertisseur pourrait être plus
efficace si la tâche secondaire est moins demandante cognitivement. Ainsi, cette expérience a pour
second objectif d’étudier l’efficacité du signal en fonction de deux niveaux de difficulté de la tâche
secondaire cognitive.

Chapitre 4
90
Figure 17. Schéma illustrant les ressources attentionnelles disponibles pour traiter le signal avertisseur
en simple tâche et en double tâche difficile et facile.
4.5.2. Méthode
4.5.2.1. Population
36 conducteurs de 25 à 40 ans (50% d’hommes ; moyenne d’âge : 31.1 ans) ont participé à cette
étude. Ils avaient obtenu leur permis de conduire depuis au moins trois ans et avaient conduit au
moins 3000 km par an au cours de la dernière année (moyenne : 14883 km). Les deux tests
d’évaluation des fonctions cognitives nous ont permis de vérifier l’absence de déficits cognitifs chez
ces participants.
4.5.2.2. Protocole
L’absence de mesures des potentiels évoqués nous a permis de réaliser cette étude sur un simulateur
de conduite plus réaliste (voir section 3.2.3.). Ainsi, le contexte fourni par la cabine de simulation et les
écrans, mais aussi la tâche de conduite, plus proche d’une conduite réelle (gestion plus libre de la
vitesse, décor plus riche, trafic, etc.), ont contribué à favoriser une plus grande immersion des
participants dans cette expérience que dans les précédentes.

Partie Expérimentale
91
La tâche des participants était de suivre un véhicule et d’éviter, en décélérant et en freinant si
nécessaire, les possibles collisions. Les participants ont été répartis en trois groupes :
- Le groupe SF a conduit avec le système et a réalisé une tâche de faible charge cognitive.
- Le groupe SH a conduit avec le système et a réalisé une tâche de haute charge cognitive.
- Le groupe SSF ou groupe contrôle a conduit sans le système et a réalisé une tâche de faible charge
cognitive.
Le système anticollision était fiable à 75%. Pendant la condition de double tâche, les participants ont
réalisé la tâche du « mot mystère » avec des associations entre les trois mots plus ou moins
évidentes à trouver selon le groupe (distraction cognitive faible ou haute définies à partir des taux de
réussite aux énigmes).
Comme le montre la Figure 18, cinq scénarios de conduite consécutifs ont été définis. L’ensemble des
participants ont conduit sans le système pendant la première phase (scénario 1) pour obtenir la ligne
de base. Ensuite, pendant la deuxième phase d’apprentissage et intégration, seuls les groupes SF et
SH conduisaient avec le système. Le groupe SSF continuait à conduire sans système. Cette
deuxième phase était composée successivement de trois scénarios :
- Scénario 2 : permettant d’évaluer les effets d’apprentissage du système (groupes SF et SH).
- Scénario 3 : permettant d’évaluer l’efficacité du système en fonction du niveau de difficulté de la
tâche secondaire (groupes SF et SH) et impact de la double tâche (groupes SF et SSF).
- Scénario 4 : permettant d’évaluer les effets d’intégration du système et les effets résiduels dus à la
distraction préalable.
Enfin, dans la troisième phase « système inactif » (scénario 5), le système n’était plus disponible pour
les groupes SF et SH dans le but d’analyser les conséquences de l’arrêt du système après une brève
adaptation.

Chapitre 4
92
Figure 18. Design expérimental montrant les conditions système et distraction pour chacun des trois groupes pendant les cinq scénarios.
4.5.3. Discussion des principaux résultats
L’analyse des données de cette expérimentation a montré que le groupe contrôle présentait un profil
de résultats particulier. En effet, ce groupe a montré une modification progressive des performances,
avec, par exemple, des temps de réaction de plus en plus lents ou des distances de sécurité de plus
en plus courtes du premier au dernier scénario. Cette détérioration a été interprétée comme une
adaptation progressive à la tâche de conduite sur simulateur qui est restée constante tout au long de
l’expérience.
Concernant l’adaptation comportementale au système, nos données ont montré que l’introduction du
système a eu un effet positif pendant la phase d’apprentissage avec des temps de réaction plus
rapides et des distances de sécurité plus longues notamment.
La réalisation de la tâche secondaire, facile comme difficile, a eu un effet délétère sur la performance
des participants. Cependant, cet effet n’a pas été équivalent en fonction du niveau de la charge
cognitive de la tâche secondaire. L’effet négatif de la tâche de distraction facile a été partiellement
compensé par le système, les performances montrant toujours un bénéfice du système par rapport à
la ligne de base. En revanche, avec la tâche de distraction difficile, le système n’a pas permis
d’améliorer les performances par rapport à la ligne de base. Ainsi, la moindre efficacité du système
lorsque la tâche secondaire est difficile (demande en ressources plus coûteuse) est en accord avec
notre hypothèse stipulant que le traitement du signal avertisseur nécessiterait des ressources
attentionnelles.

Partie Expérimentale
93
Une fois la tâche secondaire arrêtée, les performances des groupes conduisant avec le système ont
été légèrement améliorées. Mais nous avons de nouveau trouvé des effets différents en fonction du
niveau antérieur de difficulté de la double tâche. En effet, le groupe ayant réalisé auparavant la tâche
de distraction facile a montré des performances similaires à celles obtenues lors de la phase
d’apprentissage. En revanche, le groupe ayant réalisé auparavant la tâche difficile n’a pas récupéré
ce niveau et son niveau de performance est plus similaire à celui correspondant à la ligne de base.
Ainsi, ce résultat suggère que l’efficacité du système est affectée par la réalisation d’une tâche à
haute charge cognitive, non seulement de façon immédiate mais aussi que cela affecte la phase
d’intégration.
Enfin, quand le système n’était plus disponible, après la phase d’intégration, nous n’avons pas
observé d’effet de transfert. Cependant, la performance des deux groupes avec le système est
similaire à celle correspondant au niveau de la ligne de base montrant qu’il n’y a pas eu non plus
d’adaptation négative au système.
4.6. Article 3
Behavioural adaptation and effectiveness of a Forward Collision Warning System depending on a
secondary cognitive task. Soumis à Transportation Research Part F: Traffic Psychology and
Behaviour.
Mercedes Buenoa,b,c,*, Colette Fabrigoulec, Daniel Ndiayed, and Alexandra Forta,b,
a IFSTTAR-TS2-LESCOT, Cité des Mobilités, 25 avenue François Mitterrand, case 24, F-69675 Bron, France b University of Lyon, F-69622 Lyon, France c University Bordeaux Segalen, USR CNRS 3413 SANPSY, CHU Pellegrin, F-33076 Bordeaux, France d University of Paris-Est, IFSTTAR, COSYS, LEPSIS, F-77447 Marne la Vallée, France
* Corresponding author at IFSTTAR-TS2-LESCOT, Cité des Mobilités, 25 avenue François Mitterrand, case 24, F-69675, Bron, France. Tel: +33472142433 Fax: +33472376837 E-mail: [email protected] Abstract
Forward Collision Warning Systems (FCWS) have been designed to enhance road safety by reducing
the number of rear-end collisions. Nevertheless, little is known about how drivers adapt their behaviour

Chapitre 4
94
over time when using this kind of system. In addition, these systems are expected to aid particularly
distracted drivers. However, previous research has suggested that the effectiveness of the system
could depend on the difficulty level of the secondary task. The objective of this study on driving
simulator was twofold. Firstly, it consisted in evaluating the behavioural adaptation to an FCWS as well
as analysing the possible consequences of driving without the system after a short period of
adaptation. Secondly, it was to evaluate the effectiveness of the system according to two different
difficulty levels of a cognitive secondary task. The results showed that drivers adapted their behaviour
positively when the system was introduced. Nevertheless, both the effectiveness and the behavioural
adaptation in the short term were dependent on the cognitive load induced by the secondary task.
These findings suggest that the warning needs some attentional resources to be processed. Finally,
no negative or transfer effect was observed following the removal of the system after a short period of
adaptation.
Keywords
Driving simulator; Forward Collision Warning System; Behavioural adaptation; Distraction; Cognitive
load; Attentional resources
1. Introduction
The increasing development of Advance Driver Assistance Systems (ADAS) and In-Vehicle
Information Systems (IVIS), as well as the progressive availability of equipped vehicles, are having an
impact on driving safety. These systems are expected to induce positive and safer behaviours in
driving, especially when providing assistance to drivers in critical situations. But even if these systems
are designed to facilitate the driving task, they could also modify drivers’ behaviour negatively. Some
examples concerning expected and unexpected behavioural changes related to the use of ADAS are
found in the literature. For example, the use of an Intelligent Speed Adaptation system in a simulator
study resulted in positive effects since drivers reduced their maximum speed in low speed limit areas
compared to participants driving without the system (Comte, 2000). Nevertheless, more risky
behaviour was also associated with the presence of this system, such as accepting smaller gaps when
merging onto a road with approaching traffic and spending more time at short headways. Concerning
the Lane Departure Warning, it seems that both accurate and less accurate systems could improve
lane-keeping performance compared to a control group receiving no warning. However, those
participants who initially drove with the accurate system kept a high rate of trust in the system even
when it became inaccurate (Rudin-Brown & Noy, 2002). These are only a few examples of the positive
and negative behavioural changes associated with the use of some ADAS. But literature has often
showed contradictory results regarding the same system type (for review, see Saad et al., 2004) which
could be due, among other factors, to different methodologies (driving simulator, on-road tests, etc.).
This underlines the need for more research on this topic.

Partie Expérimentale
95
This study is focused on the behavioural adaptation to a particular assistance system, the Forward
Collision Warning System (FCWS). Such a system has been designed to reduce and/or to avoid rear-
end collisions by warning drivers when forward obstacles are detected.
Certainly, behavioural changes could appear during the first contacts with the system (learning phase)
when drivers are learning how the system works, but also after a longer period of exposure
(integration phase) once drivers have acquired a higher level of experience with the system (Saad et
al., 2004). In general, the results concerning FCWS have been obtained after a brief exposure to the
system in short-term studies. These studies have shown the positive value of the FCWS reflected, for
example, by a reduction of the number of collisions (Lee et al., 2002), by faster braking reaction times
following the detection of critical situations (Abe & Richardson, 2006), by the adoption of longer and
safer headways (Ben-Yaacov et al., 2002), and by returning attention to the critical direction when
necessary (Ho & Spence, 2009). These results provide evidence of the positive impact of the system
during the learning phase. However, most of the past experimental studies counterbalanced periods
with and without the system. Therefore, it is not possible to fully understand the effect of introducing
the system for the first time. In addition, some authors insist on the fact that these systems also have
longer-term effects on drivers’ behaviours. However, with regard to the FCWS, there is a gap in
knowledge concerning the behavioural adaptation effects in the integration phase. Another important
issue is to observe how drivers could react if the system is switched off (for example, because of a
malfunctioning of the system) after a short or longer use. If drivers become dependent on the aid of
the system, then they could be very vulnerable in the case of potential hazards if the system is no
longer available. However, if drivers consider the system as an assistant and not as a surrogate driver,
then they could transfer the positive effect of the system even if it is no longer available.
This issue of potential transfer effects of an FCWS in the short term and in the long term were
examined in the Ben-Yaacov et al. (2002) study, conducted in a field operation test. In this study,
participants had to drive in real traffic conditions, firstly without (1st trial) and afterwards with the FCWS
(2nd trial). In addition, the authors investigated the immediate effects of switching off the system in a
third trial as well as the long-term effects of switching off the system in a fourth trial conducted six
months later. The results showed that participants adopted safer headways when they were driving
with the system (2nd trial) and that they were able to transfer this positive effect when the warning
assistance was no longer available (3rd trial). Interestingly, this effect was also observed six months
later (4th trial). To our knowledge, the work of Ben-Yaacov et al. (2002) is the only study examining the
behavioural effects of switching off an FCWS over time.
FCWS are expected to be of benefit to distracted drivers in particular. In general, the studies
comparing the effectiveness of the system between undistracted and distracted drivers showed that
undistracted drivers benefited as much as distracted drivers (see for example, Ho & Spence, 2009;
Kramer et al., 2007; Lee et al., 2002). However, among these studies, the focus is mainly put on the
effectiveness of the system when drivers were visually distracted. It could be possible that the system
may have different effects according to the modality of the distraction task. For example, Mohebbi,
Gray, and Tan Mohebbi et al. (2009) found that when participants were involved in complex
conversations (mental calculation and categorization questions), only a tactile warning was effective
but not an auditory warning. In addition, previous experiments on a simplified simulator (Bueno,

Chapitre 4
96
Fabrigoule, Deleurence, Ndiaye, & Fort, 2012; Bueno et al., 2013) showed that an FCWS (auditory
warning) was not able to compensate for the negative effects of a cognitive secondary task on brake
RT. From this result, it was hypothesised that the warning signal may need some attentional resources
to be processed. In order to test this hypothesis in this study, the effect of the cognitive secondary task
load was analysed. In a broader sense, it is known that the amount of attentional resources available
is considerably reduced by the presence of a competitive task (A. D. Baddeley, 1996; Wickens, 1980).
Moreover, if the primary or the secondary task (or both tasks) are highly demanding, participants might
not have enough attentional resources to treat them. Thus, in a driving context, dealing with a
demanding cognitive secondary task may result in a deterioration of the driving behaviour. In this
regard, Harbluk, Noy, Trbovich, and Eizenman (2007) investigated the effects of different difficulty
levels of a cognitive secondary task while participants drove in an on-road experiment. Their results
showed that the driving behaviour was negatively affected, as the secondary task difficulty increased:
participants spent more time looking towards the central areas of the road, less time looking at the
peripheral areas and mirrors, and more hard braking trials occurred. Similarly, Jamson and Merat
(2005) found in a simulator study that, as the demands of both a visual and a cognitive secondary task
increased, the safety margins were gradually reduced and participants reduced the driving speed.
Concerning the effect of an FCWS, if the warning signal needs attentional resources to be treated, it
would be expected that high demanding secondary tasks could reduce the effectiveness of the
system.
The objective of this study was twofold. Firstly, this work aimed at evaluating the behavioural
adaptation to an auditory FCWS on the first uses, after a short-term period, and when driving without
the system after this short period of adaptation. Secondly, the effectiveness of the FCWS was
analysed according to different difficulty levels of a cognitive secondary task. We hypothesised that
the system would only be effective when the secondary task was less cognitively demanding.
For this, participants were required to drive in a driving simulator during five consecutive scenarios.
The FCWS was not available during the first scenario (baseline). Then, an incompletely reliable
system was introduced in the second, third, and fourth scenarios in order to evaluate the immediate
effect of introducing an FCWS as well as the behavioural adaptation to the system in the short term.
Moreover, during the third scenario, participants had to drive and perform a slightly or a highly
demanding secondary task. Finally, the consequences of switching off the system after a short period
of adaptation were analysed during the fifth scenario where the system was no longer available.
2. Method
2.1. Participants
36 participants (18 men, 18 women) from 25 to 40 years old (mean 31.1) took part in this experiment.
14 additional participants were unable to complete the experiment because of simulator sickness.
Participants were divided into three groups: group SL (System, Low distraction) drove with the FCWS
and carried out a low difficulty secondary task; group SH (System, High distraction) also drove with the

Partie Expérimentale
97
FCWS but performed a high difficulty secondary task; and group NL (No system, Low distraction)
drove without the system and performed a low difficulty secondary task.
None suffered from any neurological disorders and all had normal or corrected-to-normal sight and
normal hearing. They had held a driving licence for at least five years and declared regular driving
(mean: 14883 km/year). 61% of participants had experience with driver assistance systems such as
in-vehicle navigation systems (42%), cruise control (33%) or speed limiters (22%), but none reported
any kind of experience in using Forward Collision Warning Systems. Written informed consent was
obtained from each participant and they were financially compensated for their participation. The
research protocol was approved by the ethics committee of the French Institute of Science and
Technology for Transport, Development and Networks (IFSTTAR).
2.2. Apparatus
The experiment was performed in the fixed-base car driving simulator of the Laboratory for Road
Operations, Perception, Simulators and Simulations (LEPSiS) at IFSTTAR. The simulator was
composed of a Peugeot 308 vehicle cab and five screens (220 cm high x 165 cm wide) providing a
180º horizontal and 47º vertical forward field of view. Three monitors (48 cm high x 56 cm wide), one
placed at the interior and two at the exterior of the vehicle, enabled participants to monitor the rear
view through the rear mirrors.
Road images were projected at an average frequency of 58.8 Hz, and driving data were recorded at
the same frequency.
2.3. Driving scenario
The driving task was divided into five scenarios along different two-lane rural roads with medium traffic
flow. The speed limit was set at 90 km/h and the visibility conditions were reduced due to fog.
Participants were required to drive at 90 km/h following a lead vehicle and they were instructed to
avoid the possible collisions by decelerating. Overtaking manoeuvres were not allowed. The lead
vehicle was located at 50 m headway which corresponded to 2 s headway at a driving speed of 90
km/h.
The FCWS could help participants to anticipate the possible collisions by an auditory alert reliable at
75%. This reliability level was chosen as it has been demonstrated that 70% could be the criteria from
which a system can be considered as an aid for drivers (Wickens & Dixon, 2007). The warning was
500 ms long and consisted of five pulses at 2000Hz frequency for 80 ms each one with a shorter
pause (20 ms) between them. These parameters were chosen to increase the perceived urgency of
the alert (Edworthy et al., 1991).
Different braking trials were designed in each scenario:
- Firstly, in the less hazardous trials, the lead vehicle decelerated for 3 s until reaching a minimal
headway of 0.8 s. When the FCWS was available, the warning was triggered at 911 ms after the onset

Chapitre 4
98
of the trial, which corresponded to the start of the lead vehicle deceleration, and at the same time the
brake lights were illuminated. This timing corresponded to 1.64 s headway if the driving speed at the
onset of the trial was set at 90 km/h.
- Secondly, during the more hazardous trials, the lead vehicle decelerated for 2.5 s to reach a minimal
headway of 0.8 s. The warning was prompted (when available) and the brake lights were illuminated
at 486 ms (1.77 s headway) after the onset of the trial. The warning timing in both types of trials was
calculated by the Stop Distance Algorithm (ISO 15623, 2002).
- Thirdly, because the FCWS was reliable at 75%, two types of system failures were included in the
scenarios where the FCWS was activated. Miss trials were defined as a failure of the system to
prompt the warning when the situation required it, and false alert trials were characterized by the
presence of a warning when no collision was imminent.
- In addition, in order to avoid participants finding out that no collision with the lead vehicle was
possible (as the minimal headway was always set at 0.8 s to minimize strong braking and therefore
simulator sickness), one critical braking trial was added in which the minimal headway was reduced to
0.68 s. For this trial, the warning timing (when the system was available) was set at 486 ms and brake
lights were illuminated at the same time. As the purpose of this trial was not relevant for the research
questions of this study, it was excluded from the analysis.
- Finally, no critical braking trials were included where the lead vehicle decelerated slightly only for 911
ms without brake lights and without warning. The purpose of these trials was to avoid the initial
deceleration of the vehicle being predictive of the dangerousness of the trial and participants
responding systematically without evaluating the risk of each situation. These trials were also
excluded from the analysis.
During the first and fifth scenarios, lasting around 10 min each, the FCWS was not activated. In each
scenario, 34 braking trials were presented pseudo randomly every 12 to 22 s (mean 17 s): 12 less
hazardous (50%), 12 more hazardous (50%), 1 critical braking and 9 uncritical braking trials.
The second, third, and fourth scenarios lasted around 15 min each and 45 braking trials, presented
pseudo randomly every 12 to 22 s, were included. Groups SL and SH driving with the FCWS received
12 less hazardous (37.5%), 12 more hazardous (37.5%), 4 misses (12.5%), 4 false alerts (12.5%), 1
critical braking and 12 uncritical braking trials. Group NL driving without the FCWS received 14 less
hazardous (50%), 14 more hazardous (50%), 1 critical braking and 16 uncritical braking trials.
2.4. Secondary task
The secondary task consisted in a problem-solving task called the ‘‘Mystery Word’’ inspired by the
Remote Associate Test described by (Mednick, 1962). In this task, a set of three words with
apparently no links between them was given to the participants who had to figure out a fourth word
linked to each of the three words. This association could correspond to a semantic link, an expression,
a compound word or a synonymy. For example, an enigma could be ‘‘cream – skate – water’’. In this
case, a solution could be ‘‘ice”. Participants were told that this was not a rapidity task. The enigma was
reproduced once by a computer, leaving about 30 s before repeating the three words once again if the

Partie Expérimentale
99
participant had not found the solution. After the next 30 s, if the participant had still not found the
solution, the computer gave another enigma. This task is thought to induce cognitive distraction to the
participants and one of its advantages is that different difficulty levels could be created. Thus, two lists
with different difficulty levels were elaborated based on the percentage of correct responses given by
participants in previous experiments (Bueno et al., 2012; Bueno et al., 2013; Fort, Collette, Bueno,
Deleurence, & Bonnard, 2013). The low difficulty list was mostly composed of low difficulty enigmas
(the percentage of correct responses ranged from 70 to 100% in previous experiments) although 38%
medium difficulty enigmas (40 to 70% of correct responses) were interspersed among them. The high
difficulty list was mostly composed of high difficulty enigmas (0 to 40% of correct responses) and 28%
medium and low difficulty enigmas were also included in the list to avoid participants being frustrated
and giving up if they could not find any solution.
2.5. Experimental design and procedure
12 participants were randomly assigned to each of the three experimental groups which differed in
system condition (system/no system) and/or distraction condition (low distraction/high distraction) (see
Table 1). Before the task began, participants were briefly informed about the procedure of the
experiment. All participants were given a 5-10 min training session for both the secondary task and the
driving task separately. The driving scenario in this session was similar to the scenarios described
above and no warning was available at this stage.
Table 1. Experimental design showing the system and distraction conditions for each of the three
groups along the five scenarios.
1st Phase
Baseline
2nd Phase
System Learning and Adaptation
3rd Phase
“System off”
Scenario 1 Scenario 2 Scenario 3 Scenario 4 Scenario 5
Group SL
No system
System
System + Low
distraction System
No system Group SH System + High
distraction
Group NL No system No system + Low
distraction No system
10 min 15 min 15 min 15 min 10 min
Duration
After the training session, the first experimental phase started and the three groups drove without the
system and without any distraction during scenario 1 to obtain the baseline.

Chapitre 4
100
The second phase of the experiment (system learning and adaptation phase) was composed of
scenarios 2, 3, and 4. The two groups driving with the FCWS activated (groups SL and SH) received
warnings at this stage, contrary to the control group (group NL). Groups SL and SH were informed that
the system could help them to anticipate the possible collisions although, occasionally, it could
malfunction. No information about the reliability level of the system was given to the participants. The
immediate effects of introducing the system were observed during scenario 2 for the two system
groups. The secondary task was only performed concurrently to the driving task during scenario 3.
The high difficulty secondary task was carried out by group SH and the low difficulty secondary task
was carried out by groups SL and NL. Thus, the effectiveness of the system according to different
difficulty levels of the secondary task was examined by comparing performances of groups SL and
SH. The impact of the system when drivers were distracted by a low secondary task was evaluated by
comparing performances of groups SL and NL. The impact of the system when drivers were distracted
by a high difficulty task was not studied in this experiment in order to reduce the number of
experimental groups. Moreover, it was assumed that if the low secondary task has a negative effect,
this result would also be expected with the high secondary task. During scenario 4, groups SL and SH
continued to drive with the system in simple task condition to extend the adaptation to the system and
to evaluate its effects after being distracted.
The last phase of the experiment (scenario 5) was dedicated to investigating the immediate effects of
driving without the system assistance after a short period of using it.
The control group (group NL) drove during the whole experiment without the FCWS in order to
analyse the system effects by comparing its performance with the other two system groups. In
addition, it also took into account the adaptation to the simulator and the fatigue effects.
Participants had a break after the first phase (baseline) and the second one (system learning and
adaptation) although they were told that they could take more breaks if needed. In order to discard
possible cognitive deficits, two paper and pencil cognitive tests: the Trail Making Test, part A and B
(Reitan, 1958) and the Digit Symbol Substitution Test (Wechsler, 1981) were administrated to the
participants during the breaks. Moreover, a task load index was estimated using an adaptation of the
NASA TLX (Hart & Staveland, 1988) after each scenario. Finally, at the end of the second phase of
the experiment, groups SL and SH completed the French version of the Acceptance Scale for the
system (Van der Laan, Heino, & De Waard, 1997) and they also indicated the estimated level of trust
in the system on a scale from 0 to 100%.
The total duration of the experiment was approximately 2 and a half hours.
The dependent variables recorded in this experiment were:
- Brake reaction time defined as the time between the onset of the trial (start of the lead vehicle
deceleration) and the braking. Trials in which participants braked before 350 ms were considered as
premature responses and were excluded from the analysis.
- Time to collision (TTC) defined as the distance between the lead and the following vehicles divided
by their relative speeds.
- Maximum deceleration time corresponding to the time elapsed between the initial and the maximum
brake press.

Partie Expérimentale
101
- Mean deceleration calculated as the difference between the maximum and the minimum speed on
each trial divided by the time taken.
- Driving speed was the average speed from the onset to the end of each scenario excluding
intersection sections, where no trials were presented.
- Task load index resulted in six ordinal variables: mental demand, effort, discouragement, irritation,
stress, and annoyance on a 5-point Likert scale (from a little to a lot).
- Acceptance of the system composed of nine questions resulting in two scores: satisfying and
usefulness on a 5-point Likert scale (from -2 to +2).
- Trust in the system estimated by a 10-point Likert scale (from 0 to 100%).
2.6. Data analysis
Non-parametric tests were used since most of the variables were not normally distributed. The
Kruskal-Wallis and the Mann Whitney tests were used to compare the performances between the
groups in the different scenarios and the Wilcoxon test was used to compare the performances of
each group between the different scenarios.
In order to eliminate individual differences among the three groups at the baseline, difference scores
were calculated by subtracting the baseline score (scenario 1) from the score in each of the following
scenarios (scenarios 2, 3, 4, and 5).
3. Results
The analysis of the data was carried out taking into account the more hazardous trials only. The less
hazardous trials were not analysed because the deceleration response of the participants was initiated
on average (groups SL and SH mean: 828 ms) before the alert was triggered (911 ms).
No significant differences were found in terms of age, gender, and driving experience among the three
groups and no participant was excluded based on the results of the performances in the cognitive
tests.
3.1. Analysis of the secondary task performance
The percentage of correct responses given by the participants during the secondary task confirmed
that the high distraction task was more difficult than the low distraction task. Indeed, participants in
group SH spent more time trying to resolve the enigmas and they received fewer enigmas (mean =
21) than groups SL (mean = 35) or NL (mean = 34). Moreover, the percentage of correct responses
was 32.9% for the high distraction task (group SH), 67.6% and 68.2% for the low distraction task
performed in group SL and in group NL, respectively.

Chapitre 4
102
3.2. Analysis of the driver performance
The results of the difference scores from the baseline concerning the driver performances through the
five variables recorded in this experiment can be observed in Table 2 and Figure 1.
Table 2. Mean and standard deviation (SD) of the brake RT, TTC, maximum deceleration time, mean
deceleration, and driving speed (differences from the baseline) for the groups SL (System, Low
distraction), SH (System, High distraction), and NL (No system, Low distraction) during the different
scenarios.
Dependent
variable
Group Scenario 2
mean (SD)
Scenario 3
mean (SD)
Scenario 4
mean (SD)
Scenario 5
mean (SD)
RT (ms)
Group SL -152 (±99) -74 (±96) -117 (±97) 64 (±122)
Group SH -122 (±127) -15 (±167) -67 (±98) 69 (±179)
Group NL 63 (±119) 104 (±163) 122 (±124) 180 (±128)
TTC (s)
Group SL 0.77 (±0.70) 0.32 (±0.51) 0.57 (±0.66) -0.39 (±0.68)
Group SH 0.92 (±1.00) -0.30 (±1.01) 0.08 (±0.77) -0.65 (±1.25)
Group NL -0.36 (±0.74) -0.42 (±1.64) -0.68 (±1.12) -0.76 (±0.77)
Maximum
deceleration
time (s)
Group SL 0.09 (±0.07) 0.09 (±0.10) 0.07 (±0.16) -0.04 (±0.18)
Group SH 0.06 (±0.13) 0.04 (±0.16) 0.02 (±0.11) -0.13 (±0.15)
Group NL -0.02 (±0.14) -0.11 (±0.08) -0.12 (±0.10) -0.16 (±0.10)
Mean
deceleration
(m/s)
Group SL 0.09 (±0.53) -0.09 (±0.62) -0.11 (±0.75) -0.29 (±0.79)
Group SH 0.11 (±0.48) -0.08 (±0.68) 0.27 (±0.76) 0.03 (±0.97)
Group NL -0.19 (±0.41) -0.43 (±0.62) -0.69 (±0.46) -0.64 (±0.67)
Driving
speed
(km/h)
Group SL 3.1 (3.0) 0.8 (±3.2) 4.4 (±4.4) 4.5 (±6.2)
Group SH 2.2 (±3.1) 0.6 (±5.1) 3.7 (±3.5) 3.3 (±3.9)
Group NL 2.8 (±2.1) 3.1 (±3.8) 5.5 (±3.0) 5.1 (±3.3)

Partie Expérimentale
103
Figure 1. Mean brake RT, TTC, maximum deceleration time, mean deceleration, and driving speed
(differences from the baseline) for the groups SL (System, Low distraction), SH (System, High
distraction), and NL (No system, Low distraction) during the five scenarios.
3.2.1. Impact of introducing the system
The results obtained in this section compare drivers’ performances between scenarios 1 and 2 and
drivers’ performances between the three groups in scenario 2.
Firstly, with the introduction of the system during scenario 2, the system group performing the low
distraction task (group SL) braked faster than in scenario 1 (Z = -3.059, p = 0.002), increased the TTC
(Z = -2.903, p = 0.004) and the maximum deceleration time (Z = -2.824, p = 0.005). The system group
performing the high distraction task (group SH) also showed faster RT (Z = -2.667, p = 0.008) and
longer TTC (Z = -2.510, p = 0.012). Although it seemed that they increased the time needed to
achieve the maximum deceleration, this result was not significant. As expected, no significant
differences regarding these variables were observed for the control group (group NL). The three
groups significantly increased their driving speed between the first and second scenarios (group SL: Z

Chapitre 4
104
= -2.510, p = 0.012; group SH: Z = -2.118, p = 0.034; group NL: Z = -3.059, p = 0.002) indicating that
the introduction of the system did not seem to affect the driving speed variable.
Secondly, when comparing performances of the three groups in scenario 2, significant group
differences were observed in terms of brake RT (H = 15.947, p < 0.001) and TTC (H = 13.410, p =
0.001), a tendency was found in the maximum deceleration time (H = 5.275, p < 0.072), but no
significant differences were found regarding the mean deceleration and driving speed variables. More
specifically, the two system groups (groups SL and SH) differed from the control group (group NL)
showing faster brake RT (U = 7, p < 0.001; U = 22, p = 0.004, respectively), longer TTC (U = 13, p =
0.001; U = 22, p = 0.004, respectively), and longer maximum deceleration time (group SL: U = 37, p =
0.045; a tendency was found for group SH: U = 43, p = 0.094). Groups SL and SH did not differ
significantly in any variable.
3.2.2. Impact of introducing the distraction task according to its difficulty levels
In this part, drivers’ performances during scenario 3 are compared to drivers’ performances in
scenarios 2 and 1 and the three groups were compared between each other in scenario 3.
In scenario 3 compared with scenario 2, the introduction of both low and high secondary tasks
seemed to have a negative effect on performances of groups driving with the system. The results
showed a significant increment of the brake RT (group SL: Z = -2.589, p = 0.010; group SH: Z = -
2.275, p = 0.023) and a significant reduction of the TTC (group SL: Z = -2.667, p = 0.008; group SH: Z
= -2.746, p = 0.006). The introduction of the low distraction task for the control group (group NL) only
affected drivers’ performances in terms of faster maximum deceleration time (Z = -2.040, p = 0.041).
Although the two system groups reduced the driving speed when they were carrying out the distraction
task, the difference between scenarios 2 and 3 was only significant for group SL (Z = -2.197, p =
0.028).
However, when comparing drivers’ performances between scenario 3 and the baseline, it seemed that
the system was able to improve drivers’ performances for group SL. Specifically, the brake RT was
faster (Z = -2.275, p = 0.023) and the TTC (Z = -1.961, p = 0.050) and the maximum deceleration time
was longer (Z = -2.353, p = 0.019) for group SL. Performance of group SH came back to the baseline
levels as no significant differences between the first and third scenarios were found for any variables
studied for this group. However, group NL showed a significant increment of the brake RT (Z = -2.040,
p = 0.041), a reduction of the maximum deceleration time (Z = -2.903, p = 0.004) and the mean
deceleration (Z = -2.040, p = 0.041), and an increment of the driving speed (Z = -2.197, p = 0.028).
Finally, during scenario 3, the three groups differed significantly with regard to the brake RT (H =
9.483, p = 0.009) and the maximum deceleration time (H = 14.686, p = 0.001) and there was a
tendency regarding the TTC variable (H = 5.722, p = 0.057). Concretely, group SL differed significantly
from group NL in terms of faster brake RT (U = 21, p = 0.003), longer TTC (U = 33, p = 0.024), and
longer maximum deceleration time (U = 9, p < 0.001). This group tended to show faster RT and longer
TTC compared to group SH although these differences were only marginal (U = 39, p = 0.060; U = 40,

Partie Expérimentale
105
p = 0.068, respectively). Group SH showed longer maximum deceleration times compared to group
NL (U = 26, p = 0.008).
3.2.3. Impact of removing the distraction task
These results analyse drivers’ performances between scenarios 4 and 3 and also drivers’
performances between the three groups in scenario 4. Firstly, when comparing drivers’ performances
between scenarios 4 and 3, only the driving speed variable increased significantly for the three groups
(group SL: Z = -2.589, p = 0.010; group SH: Z = -2.432, p = 0.015; group NL: Z = -2.589, p = 0.010). In
addition, group NL reduced the mean deceleration (Z = -1.961, p = 0.050). It seemed that after
removing the secondary task, drivers’ performances improved for the two system groups (group SL
and SH) by faster brake RT and longer TTC; however, these differences did not reach statistical
significance.
Secondly, drivers’ performance among the three groups was different with regard to the variables of
brake RT (H = 16.474, p < 0.001), TTC (H = 8.335, p = 0.015), maximum deceleration time (H = 10.572,
p = 0.005), and mean deceleration (H = 10.410, p = 0.005). No significant differences were found
regarding the driving speed. More specifically, groups SL and SH compared to group NL showed
faster brake RT (U = 11, p < 0.001; U = 15, p = 0.001, respectively), longer TTC (significant between
groups SL and NL: U = 22, p = 0.004; tendency between groups SH and NL: U = 43; p = 0.094),
longer maximum deceleration time (U = 24, p = 0.006; U = 25, p = 0.007, respectively), and an
increase of the mean deceleration (U = 36, p = 0.038; U = 19, p = 0.002, respectively). Groups SL and
SH did not differ significantly.
3.2.4. Behavioural adaptation to the system
The results presented in this section contrast drivers’ performances between scenarios 4 and 2 and
between scenarios 4 and 1. Firstly, when comparing the behavioural adaptation to the system before
and after the secondary task, all variables studied in this experiment remained stable for group SL.
The performances for group SH deteriorated in terms of longer brake RT (Z = -2.040, p = 0.041) and
shorter TTC (Z = -2.667, p = 0.008). Group NL experienced longer brake RT (Z = -2.040, p = 0.041),
faster maximum deceleration time (Z = -2.589, p = 0.010), a reduction of the mean deceleration (Z = -
2.353, p = 0.019), and an increase of the driving speed (Z = -3.059, p = 0.002).
Secondly, when comparing the adaptation to the system after driving with the system for 45 min in
scenario 4 with the baseline, group SL still showed faster brake RT (Z = -3.059, p = 0.002) and longer
TTC (Z = -2.510, p = 0.012). Group SH tended to reduce the brake RT (Z = -1.883, p = 0.060) while
group NL significantly increased the brake RT (Z = -2.510, p = 0.012), significantly reduced the
maximum deceleration time (Z = -2.824, p = 0.005), the mean deceleration (Z = -2.903, p = 0.004) and
marginally the TTC (Z = -1.883, p = 0.060). Concerning the driving speed, a generalized increment

Chapitre 4
106
was observed in the three groups (group SL: Z = -2.510, p = 0.012; group SH: Z = -2.667, p = 0.008;
group NL: Z = -3.059, p = 0.002).
3.2.5. Impact of driving with the system off
The following data compare drivers’ performances between scenarios 5 and 4, between scenarios 5
and 1, and between the three groups in scenario 5. The transition between scenarios 4 and 5 for the
two system groups was characterized by longer brake RT (group SL: Z = -3.059, p = 0.002; group SH:
Z = -2.510, p = 0.012), shorter TTC (group SL= -3.059, p = 0.002; group SH: Z = -2.353, p = 0.019),
and faster maximum deceleration time (group SL: Z = -2.510, p = 0.012; group SH: Z = -2.667, p =
0.008). The control group (group NL) did not experience significant changes at this stage except for a
significant increase of the brake RT (Z = -2.040, p = 0.041).
When comparing scenarios 5 and 1 (when no system was available for any group), drivers’
performances for the two system groups were not significantly different except for an increment of the
driving speed (group SL; Z = -2.040, p = 0.041; group SH: Z = -2.040, p = 0.041) and faster maximum
deceleration time observed only in group SH (Z = -2.275, p = 0.023). The control group (group NL)
changed significantly at the level of all the variables studied, showing longer brake RT (Z = -3.059, p =
0.002), shorter TTC (Z = -2.746, p = 0.006), shorter maximum deceleration time (Z = -2.981, p =
0.003), shorter mean deceleration (Z = -2.589, p = 0.010), and faster driving speed (Z = -2.981, p =
0.003).
Comparing the three groups’ performances in this last scenario, no significant differences were found
in any variable studied.
3.3. Analyse of the subjective measures
3.3.1. Task load index
In general, with the introduction of the secondary task in scenario 3 compared to scenario 2, the three
groups scored higher in the variables of mental demand (group SL: Z = -2.722, p = 0.006; group SH: Z
= -3.082, p = 0.002; group NL: Z = -3.134, p = 0.002), effort (group SL: Z = -2.414, p = 0.016; group
SH: Z = -2.626, p = 0.009; group NL: Z = -2.970, p = 0.003), discouragement (group SL: Z = -2.333, p
= 0.020; group SH: Z = -2.850, p = 0.004), irritation (group SL: Z = -2.333, p = 0.020; group SH: Z = -
2.911, p = 0.004) and stress (group SH: Z = -2.530, p = 0.011), and they scored lower regarding the
annoyance variable (group SL: Z = -2.565, p = 0.010; group NL: Z = -2.333, p = 0.020). Figure 2
illustrates the different difficulty levels of the secondary tasks estimated by the participants in terms of
mental demand.

Partie Expérimentale
107
Figure 2. Subjective ratings on mental demand (1: low; 5: high) for groups SL (System, Low
distraction), SH (System, High distraction), and NL (No system, Low distraction) during the five
scenarios.
Comparing the three groups during scenario 3, significant differences were found regarding mental
demand (H = 8.014, p = 0.018), discouragement (H = 18.383, p < 0.001), and irritation (H = 15.611, p <
0.001). Particularly, the highest scores were obtained for group SH (System, High distraction) which
was significantly different from group SL (System, Low distraction) in terms of mental demand (U = 31;
p = 0.014) and discouragement (U = 27; p = 0.007) and from group NL (No system, Low distraction)
concerning mental demand (U = 31.5; p = 0.015), discouragement (U = 9; p < 0.001), and irritation
variables (U = 11; p < 0.001). Group SL scored higher than group NL in discouragement (U = 33; p =
0.011) and irritation (U = 32; p = 0.009).
3.3.2. Acceptance of the system
The mean score for the satisfying scale was 0.16 (-2 to +2) and 0.68 for the usefulness scale. The
Mann-Whitney test did not reveal any significant differences between the two groups driving with the
system.
3.3.3. Trust in the system
The mean trust in the system estimated by group SL was 61.3% and 55% for group SH. No significant
differences between these two groups were obtained.
4. Discussion
The two objectives of this study were to examine the immediate and short-term behavioural adaptation
to an FCWS reliable at 75% and to study the impact of the two difficulty levels of a secondary task on
the effectiveness of and on the behavioural adaptation to the system.

Chapitre 4
108
It is interesting to start describing the performances of the control group which showed a particular
profile of response throughout the experiment compared to both system groups. Specifically, when
looking at the transition from one scenario to another, the control group’s performances remained
relatively stable for most of the variables. However, when looking at the complete sequence of the five
scenarios, a progressive and directional modification of the driving behaviour was observed, that
resulted in large differences between the baseline and the last scenario. Thus, compared to the
baseline, the control group exhibited slower braking reaction times, shorter headways, faster
depressions of the brake pedal, smaller decelerations, and faster driving speed in the last scenario.
This progressive deterioration of the performance could be interpreted as a progressive adaptation to
the driving task which remains homogeneous throughout the experiment. A similar effect was detected
by Maltz and Shinar (2007) who found that the control group driving without the system increased the
time spent in danger zones (<0.5 s headway). The authors interpreted this result as a higher familiarity
with the simulation.
Concerning the behavioural adaptation to the system, the results showed that during the learning
phase, the introduction of the system induced positive changes in drivers’ performances. Specifically,
compared to the first scenario, drivers tended to react faster to the lead vehicle decelerations and they
also showed safer behaviours maintaining longer headways and braking more progressively when
they were driving with the system for the first time. As already demonstrated (Abe & Richardson, 2006;
Ben-Yaacov et al., 2002; Ho & Spence, 2009; Lee et al., 2002), these results are further proof of the
benefits of this type of system on drivers’ performances under simple task conditions.
With regard to the effect of the secondary task, the results showed that performing both slightly and
highly demanding secondary tasks deteriorated the performances for the two system groups in terms
of slower reaction times and shorter safety margins. However, the extent of this deterioration depends
on the cognitive load of the secondary task. Indeed, the negative effect of the low demanding task was
partially compensated by the system and participants still showed a benefit from the system compared
to the baseline (without the system). This benefit resulted in faster reaction times, safer headways,
and more progressive decelerations. However with the high demanding secondary task, the positive
effects obtained when driving with the system for the first time disappeared and drivers’ performances
returned to the baseline level. Subjective data also revealed a different impact between the two
difficulty levels. Indeed, participants carrying out the high demanding secondary task reported higher
mental demands and were more discouraged than the participants carrying out the low demanding
secondary task. These results are in accordance with our hypothesis that the warning signal needs
some attentional resources to be processed. Therefore, the system could not be as effective as
expected if drivers are distracted by highly demanding secondary tasks.
Furthermore, still regarding the effectiveness of the system when drivers are distracted, it is interesting
to compare the effect of the low demanding secondary task between the control group and the system
group. This low demanding secondary task was perceived as equally demanding for the two groups.
Regarding the objective data, both reaction times and safety margins were clearly deteriorated for the
system group by this secondary task. Concerning the control group, as already mentioned, it showed
a progressive deterioration of the performance throughout the experiment. Therefore, it is not possible
to conclude on the impact of the secondary task on the drivers’ performances in this group. However,

Partie Expérimentale
109
only the speed of the system group was reduced by the secondary task compared to the previous
scenario without distraction. It has been shown that reducing the driving speed could be a
compensatory strategy to reduce the mental effort of a complex driving situation (see for example,
Fuller, 2005; Jamson & Merat, 2005). Consequently, this result suggests that driving with the
secondary task and the system would engage more mental effort than driving with the secondary task
but without the system. Overall, these results represent another element supporting our hypothesis
that the system could need some attentional resources to be processed.
Once the secondary task was over, drivers’ performances with the FCWS tended to improve slightly
and participants adapted their performance to the less demanding situation (only driving) by increasing
the driving speed. However, it seems that the secondary tasks experienced during the previous
scenario affected the behavioural adaptation to the system differently, depending on its difficulty level.
Indeed, the group having performed the low demanding secondary task just before recovered the
performance level obtained when the system was introduced for the first time. Accordingly, the
comparison with the baseline resulted in an improvement of the drivers’ performances in terms of
faster reaction times and safer headways. Regarding the group having performed the high demanding
secondary task, the effectiveness of the system was less evident. Specifically, this group did not
recover the performance level obtained when the system was introduced for the first time and it
returned to the performance level obtained in the baseline. These results strongly suggest that,
beyond this immediate negative effect, performing a highly demanding secondary task can also impact
the integration phase by decreasing the benefit of the system.
Finally, in this experiment, no transfer effects after the integration phase were observed when the
system was no longer available. Both system groups showed riskier behaviours compared to the
previous scenario and drivers’ performances were more similar to the control group. Nevertheless, it
should be mentioned that, in general, drivers’ performances of the two system groups returned to
baseline levels indicating that there was not a negative behavioural adaptation. The absence of
transfer effects in this experiment contrasted with the results obtained by Ben-Yaacov et al. (2002) in
an on-road experiment. These authors observed that the participants were able to maintain safer
behaviours after a brief exposure to the system and even six months later. It could be possible that the
lower risk perception experienced in a driving simulator could explain why no transfer effects were
found in our experiment contrary to Ben-Yacoov et al.’s experiment.
A possible limitation of this study was the high number of repetitions of the braking trials and therefore
of the warnings in the system groups, in order for the system to become familiar for the drivers. It
could be possible that these warnings produce a general increment of the vigilance throughout the
scenario and not only for the particular braking event. On the contrary, driving without the system
could result in a very monotonous task for the control group which could explain its results pattern.
Further studies with fewer exposures to the collisions but also longitudinal studies in more ecological
contexts would be necessary to investigate how drivers adapt their behaviour to the system during the
learning phase, and also the effects of driving with and without the system after the integration phase.
To summarise, results of this experiment showed that both the adaptation to the system and the
system effectiveness were dependent on drivers’ cognitive load. Drivers adapted their behaviour
positively when driving with the system during the learning phase. In addition, in the case of

Chapitre 4
110
distraction, our results revealed that the system was only effective when the secondary task was less
demanding. These results are consistent with the hypothesis that the system needs some attentional
resources to be processed. Moreover, the fact of having added the distraction task seemed to have
disrupted the integration phase when the cognitive demands were high and not low. These results
showed that even if the system induced safer driving behaviours during the learning phase, the high
demanding task could disrupt the integration process of the system. FCWS are specially designed to
assist distracted drivers. However, in light of these results, caution should also be taken when driving
with new assistance systems and engaging in highly demanding secondary tasks.
Acknowledgement
The research leading to these results has received funding from the European Community's Seventh
Framework Programme (FP7/2007-2013) under grant agreement no.238833/ ADAPTATION project.
www.adaptation-itn.eu. The authors would like to thank Joceline Rogé for her help in the design of a
program for the data analysis, Stéphane Caro for his help in the calculation of the timing of the
warning system, and Myriam Hugot for advice on statistics.
References
Abe, G., & Richardson, J. (2006). Alarm timing, trust and driver expectation for forward collision warning systems.
Applied Ergonomics, 37(5), 577-586.
Baddeley, A. D. (1996). Exploring the central executive. The Quarterly Journal of Experimental Psychology, 49A(1), 5-28.
Ben-Yaacov, A., Maltz, M., & Shinar, D. (2002). Effects of an In-Vehicle Collision Avoidance Warning System on Short- and Long-Term Driving Performance. Human Factors: The Journal of the Human Factors and Ergonomics Society, 44(2), 335-342.
Bueno, M., Fabrigoule, C., Deleurence, P., Ndiaye, D., & Fort, A. (2012). An electrophysiological study of the impact of a Forward Collision Warning System in a simulator driving task. Brain Research, 1470, 69-79.
Bueno, M., Fort, A., Francois, M., Ndiaye, D., Deleurence, P., & Fabrigoule, C. (2013). Effectiveness of a Forward Collision Warning System in simple and in dual task from an electrophysiological perspective. Neuroscience Letters, 541, 219-223.
Comte, S. L. (2000). New systems: new behaviour? Transportation Research Part F: Traffic Psychology and Behaviour, 3(2), 95-111.
Edworthy, J., Loxley, S., & Dennis, I. (1991). Improving auditory warning design: relationship between warning sound parameters and perceived urgency. Human Factors: The Journal of the Human Factors and Ergonomics Society, 33, 205-232.
Fort, A., Collette, B., Bueno, M., Deleurence, P., & Bonnard, A. (2013). Impact of totally and partially predictive alert in distracted and undistracted subjects: An event related potential study. Accident Analysis & Prevention, 50, 578-586.
Fuller, R. (2005). Towards a general theory of driver behaviour. Accident Analysis & Prevention, 37(3), 461-472.
Harbluk, J. L., Noy, Y. I., Trbovich, P. L., & Eizenman, M. (2007). An on-road assessment of cognitive distraction: Impacts on drivers’ visual behavior and braking performance. Accident Analysis & Prevention, 39(2), 372-379.
Hart, S. G., & Staveland, L. E. (1988). Development of NASA-TLX (Task Load Index): Results of empirical and theoretical research. In P. A. H. a. N. Meshkati (Ed.), Human Mental Workload. Amsterdam: North Holland Press.
Ho, C., & Spence, C. (2009). Using peripersonal warning signals to orient a driver's gaze. Human Factors: The Journal of the Human Factors and Ergonomics Society, 51(4), 539-556.
ISO 15623. (2002). Transport information and control systems - Forward vehicle collision warning systems - Performance requirements and test procedures.

Partie Expérimentale
111
Jamson, A. H., & Merat, N. (2005). Surrogate in-vehicle information systems and driver behaviour: Effects of visual and cognitive load in simulated rural driving. Transportation Research Part F: Traffic Psychology and Behaviour, 8(2), 79-96.
Kramer, A. F., Cassavaugh, N., Horrey, W. J., Becic, E., & Mayhugh, J. L. (2007). Influence of Age and Proximity Warning Devices on Collision Avoidance in Simulated Driving. Human Factors: The Journal of the Human Factors and Ergonomics Society, 49(5), 935-949.
Lee, J. D., McGehee, D. V., Brown, T. L., & Reyes, M. L. (2002). Collision Warning Timing, Driver Distraction, and Driver Response to Imminent Rear-End Collisions in a High-Fidelity Driving Simulator. Human Factors: The Journal of the Human Factors and Ergonomics Society, 44(2), 314-334.
Maltz, M., & Shinar, D. (2007). Imperfect in-vehicle collision avoidance warning systems can aid distracted drivers. Transportation Research Part F: Traffic Psychology and Behaviour, 10(4), 345-357.
Mednick, S. A. (1962). The associative basis of the creative process. Psychological Review, 69, 220-232.
Mohebbi, R., Gray, R., & Tan, H. Z. (2009). Driver Reaction Time to Tactile and Auditory Rear-End Collision Warnings While Talking on a Cell Phone. Human Factors: The Journal of the Human Factors and Ergonomics Society, 51(1), 102-110.
Reitan, R. (1958). Validity of the trail making test as an indicator of organic brain damage. Perceptual and Motor Skills, 8, 271-276.
Rudin-Brown, C. M., & Noy, Y. I. (2002). Investigation of behavioral adaptation to lane departure warnings. Transportation Research Record, 1803, 30-37.
Saad, F., Hjälmdahl, M., Cañas, J., Alonso, M., Garayo, P., Macchi, L., Bekiaris, E. (2004). Literature review of behavioural effects AIDE Project, Deliverable D1.2.1. Brussels: Information Society Technologies.
Van der Laan, J. D., Heino, A., & De Waard, D. (1997). A simple procedure for the assessment of acceptance of advanced transport telematics. Transportation Research Part C: Emerging Technologies, 5(1), 1-10.
Wechsler, D. (1981). Wechsler Adult and Intelligence scale Revised. New-York: Psychological Corporation.
Wickens, C. D. (1980). The structure of attentional resources. In R. Nickerson (Ed.), Attention and performance (pp. 239-257). Hillsdale: NJ Erlbaum.
Wickens, C. D., & Dixon, S. R. (2007). The benefits of imperfect diagnostic automation: a synthesis of the literature. Theoretical Issues in Ergonomics Science, 8(3), 201-212.


5. DISCUSSION
GÉNÉRALE
113
5. Discussion Général
5. Discussion Générale
Ce travail de thèse a été centré sur l’analyse de l’impact d’un système d’alerte anticollision sur le
traitement de l’information et le comportement du conducteur en conduite automobile simulée.
L’ensemble des travaux expérimentaux menés au cours de cette thèse nous a permis d’apporter des
éléments de réponse aux questions qui ont été soulevées en introduction. Plus précisément, nous
avons formulé quatre objectifs spécifiques :
1. Déterminer l’impact d’un signal avertisseur associé à un système d’alerte anticollision sur le
traitement de l’information à partir de mesures électrophysiologiques ;
2. Analyser l’efficacité d’un tel système en fonction de sa fiabilité ;
3. Analyser l’efficacité d’un tel système en fonction de l’état attentionnel des conducteurs ;
4. Examiner l’adaptation comportementale au système au cours du temps.
Dans cette dernière partie de la thèse, nous allons rappeler les principaux résultats de ce travail en
fonction de chacun des objectifs, et nous les discuterons en relation avec les résultats de la littérature.
5.1. L’impact du signal avertisseur sur le traitement de l’information
Dans nos deux premières expériences, nous avons examiné, en utilisant pour la première fois
l’approche électrophysiologique, le rôle du signal avertisseur dans le traitement d’un stimulus visuel
pertinent dans le contexte de la conduite : l’allumage du feu stop du véhicule précédent.
L’enregistrement de l’activité électrique cérébrale nous a permis de dissocier et d’analyser les
différentes étapes impliquées dans le traitement de la cible visuelle suite au déclenchement ou non

Chapitre 5
114
d’un signal avertisseur. Plus précisément, nous avons centré nos analyses autours des processus
anticipatoires (VCN), sensoriels (N1) et de plus haut niveau cognitif (N2 et P3).
Nos résultats ont montré que le signal avertisseur était associé à une VCN, mettant en avant son rôle
d’anticipation de la cible et de la préparation à la réponse. De plus, nous avons trouvé que la
présence du signal avertisseur modulait le traitement de plus haut niveau cognitif à travers une
réduction de l’amplitude de la N2 et de la latence de la P3. Ce résultat pourrait suggérer une
intervention du signal dans des processus de contrôle cognitif (e.g. supervision, contrôle de la
stratégie, processus d’inhibition) (Folstein & Van Petten, 2008), ainsi qu’une amélioration de l’attente
temporelle (Correa et al., 2006) et une accélération du traitement de la cible. Ces résultats sont
consistants avec les données de la littérature montrant que le signal avertisseur agit au niveau de la
sélection de la réponse (Correa et al., 2006; Hackley & Valle-Inclán, 2003; Rudell & Hu, 2001).
En ce qui concerne les étapes plus précoces du traitement de l’information (N1), nous n’avons pas
mis en évidence un effet du signal avertisseur ce qui indique que, dans nos expériences, ce signal ne
semble pas faciliter le traitement sensoriel de la cible. Néanmoins, nous avons remarqué que dans
nos conditions expérimentales, l’amplitude maximale de la N1 apparaissait tardivement (plus de 200
ms) et présentait une propagation de l’activité électrique vers des régions qui sont modulées par la
N2. Si il est possible de clairement dissocier les deux composantes sur la base de leur distribution
spatiale et de la latence de leur pic, il est difficile de déterminer comment une modulation de l’une peut
impacter l’autre. Ainsi à partir de ces résultats, l’hypothèse d’une implication du signal au niveau
sensoriel ne peut pas être complètement exclue, car il est difficile de savoir si l’effet trouvé au niveau
de la N2 a été spécifiquement dû à une modulation de cette composante ou bien s’il est partiellement
dû à une modulation de la N1. Toutefois, selon la littérature, l’implication du signal avertisseur au
niveau du traitement sensoriel a été moins mise en évidence qu’à un niveau plus cognitif et pourrait
dépendre du type de tâche à réaliser (Correa et al., 2006).
5.2. L’impact de la fiabilité du système
Sachant que les systèmes anticollision actuellement sur le marché ne sont pas complètement fiables,
le deuxième objectif de cette thèse visait à examiner dans quelle mesure le niveau de fiabilité d’un
système peut affecter le traitement de l’information et le comportement des conducteurs. Nous avons
utilisé dans nos expériences un niveau de fiabilité à 100% d’une part, et un niveau de fiabilité situé
entre 70 et 76% d’autre part, critère à partir duquel un système pourrait être considéré comme étant
efficace (Wickens & Dixon, 2007). Le pourcentage d’erreurs du système était réparti à proportions
égales entre des fausses alarmes et des défauts de détection.

Discussion Générale
115
Au niveau neural, nous avons observé que lorsque le signal avertisseur n’était pas le seul prédicteur
de la présence de la cible, comme dans le cas de notre première expérience, seul le système
entièrement fiable était efficace et entrainait une facilitation du traitement cognitif de la cible.
Cependant, si le signal devenait le meilleur indicateur de la présence de la cible, même si il n’était pas
complètement fiable, comme dans le cas de notre deuxième expérience, il avait un effet positif au
niveau des processus anticipatoires et du traitement de plus haut niveau cognitif.
Au niveau comportemental, nos résultats ont montré que les systèmes anticollision imparfaits étaient
utiles dans la détection de possibles collisions. Nous avons trouvé un effet positif à la fois dans les
conditions de simulation simplifiées comme dans la condition de simulation plus réaliste. L’efficacité
de systèmes anticollision imparfaits a été montrée également par d’autres études réalisées sur
simulateurs de conduite (Maltz & Shinar, 2004) ou dans des situations de conduite réelles (Ben-
Yaacov et al., 2002). En effet, la présence de fausses alarmes et de défauts de détection de
potentielles collisions n’amoindrit pas nécessairement l’efficacité de ces systèmes. De plus, certains
auteurs soulignent que ces erreurs pourraient même avoir un effet positif dans le comportement des
conducteurs, dans la mesure où ils pourraient empêcher les conducteurs d’accorder un excès de
confiance au système (Parasuraman et al., 1997). Néanmoins, un pourcentage trop élevé d’erreurs du
système peut être critique dans l’acceptation et l’efficacité du système (Abe et al., 2002; Lerner et al.,
1996).
La psychologie de l'apprentissage pourrait permettre de comprendre pourquoi les systèmes non
fiables peuvent être efficaces. L'association entre le signal avertisseur (stimulus 1) et le risque
(stimulus 2) est produite dans des contextes très différents (par exemple, trafic dense ou faible,
conditions météorologiques bonnes ou mauvaises, tâches secondaires ou non, etc.). En outre, les
conducteurs apprennent que la relation causale entre les deux stimuli n'est pas parfaite. En effet,
comme nous l'avons vu dans l'introduction, le système parfait n'existe pas. La présence de fausses
alarmes et de défauts de détection produit un renforcement intermittent du signal avertisseur et, par
conséquent, une plus grande résistance à l'extinction (Mackintosh, 1974).
5.3. Impact de l’état attentionnel du conducteur
La distraction est le principal facteur contributif identifié dans les collisions par l’arrière. De fait, il est
attendu que les systèmes anticollision aident particulièrement les conducteurs distraits à rediriger
l’attention vers la route si nécessaire et à réagir plus rapidement. Pour mieux comprendre comment la
distraction interfère avec le comportement des conducteurs dans des situations potentielles de
collision, l’impact du système devrait être analysé dans des conditions de distraction comparées à des
situations contrôles sans distraction.

Chapitre 5
116
Dans notre travail, l’efficacité d’un système anticollision selon l’état attentionnel du conducteur, distrait
ou non, a été examinée par le biais d’une tâche cognitive, sur le traitement de l’information et le
comportement des conducteurs. Bien que moins étudiée que les distractions visuelles ou visuo-
motrices, il a été montré, que ce type de distraction peut également avoir des conséquences
négatives pour la sécurité (Collet et al., 2009; Jamson et al., 2004; Lamble et al., 1999).
Au niveau neural, nos résultats ont montré un effet robuste de la distraction. En particulier, lorsque les
participants étaient distraits par la tâche cognitive, nos résultats indiquent une moindre capacité
d’anticipation ainsi qu’une détérioration du traitement de la cible aux différentes étapes du traitement
de l’information. Nous avons observé dans notre première expérience que, bien que le système
avertisseur ait réduit partiellement l’effet négatif de la tâche secondaire, il n’avait pas été capable de
l’éliminer complètement. Avec notre deuxième étude, dans laquelle le signal avertisseur était le
meilleur prédicteur de la cible, nous avons observé que, contrairement à nos attentes, le signal
avertisseur n’avait pas non plus été capable de compenser complètement l’effet de la distraction.
L’effet négatif d’une tâche secondaire dans le cadre de la conduite automobile avait aussi été mis en
évidence à travers d’autres études électrophysiologiques mais seulement au niveau du traitement
cognitif de plus haut niveau (Bruyas et al., 2006; Raabe et al., 2005; Rakauskas et al., 2005; Strayer &
Drews, 2007).
Au niveau comportemental, dans la première expérience, les résultats ont également montré un fort
effet négatif de la distraction que le système n’était pas capable de compenser. Dans la deuxième
expérience, dans laquelle le signal est le meilleur prédicteur de la cible, cet effet négatif de la
distraction n’a pas été compensé. Dans la troisième expérience, l’effet de la distraction n’a été
délétère sur l’efficacité du signal avertisseur que lorsque la tâche secondaire était de haute difficulté
cognitive et non dans le cas où elle était de faible difficulté cognitive.
Les résultats inattendus, obtenus à la fois au niveau neural et au niveau comportemental, nous ont
amené à nous questionner sur les facteurs qui influencent l’efficacité du système anticollision en cas
de distraction : en particulier, dans quelle mesure elle dépend du type du signal avertisseur et/ou du
type de tâche secondaire.
Selon la littérature, les signaux avertisseurs de type multimodal (par exemple, signal visuo-auditif)
pourraient avoir un effet plus puissant que les signaux unimodaux (Campbell et al., 2007; Ho et al.,
2007; Ho & Spence, 2009), particulièrement dans le cas de distraction (Kramer et al., 2007; Spence &
Santangelo, 2009). Ce résultat a été trouvé tant dans des études sur simulateur de conduite (Ho et al.,
2007) que dans des études hors du contexte de la conduite utilisant des potentiels évoqués
(Santangelo, Van der Lubbe, Olivetti Belardinelli, & Postma, 2008).
Dans nos expériences, nous avons choisi de tester un signal avertisseur unimodal auditif qui permet
de générer un sentiment d’urgence fort. L’utilisation d’un signal visuel dans nos deux premières
études aurait pu engendrer des saccades oculaires qui auraient contaminé le signal
électroencéphalographique.

Discussion Générale
117
Selon le modèle cognitif de ressources multiples de Wickens (1980), deux tâches concurrentes seront
réalisées de façon plus efficaces si elles ne s’appuient pas sur le même niveau d’une dimension
donnée du modèle. Ce modèle prédit une plus grande interférence si deux tâches concurrentes
nécessitent la même étape de traitement perceptif ou cognitif (dimension des étapes du traitement) et
si, de plus, elles utilisent la même modalité (dimension des modalités). Dans nos expériences nous
avons utilisé un signal avertisseur de type auditif, impliquant donc un encodage auditif et, une tâche
secondaire cognitive, impliquant un encodage auditif et un traitement cognitif. En accord avec le
modèle de Wickens, ces conditions pourraient avoir contribué à diminuer l’efficacité du signal
avertisseur. D’autres résultats de la littérature sont en accord avec ce modèle et montrent que les
signaux auditifs et visuo-auditifs semblent être efficaces pour aider les conducteurs à détecter les
collisions potentielles lorsqu’ils sont distraits par une tâche secondaire visuelle (Ho & Spence, 2009;
Kramer et al., 2007; Lee et al., 2002). De même, l’étude de Mohebbi et al. (2009) montre que, lors
d’une distraction audio-cognitive (maintenir une conversation plus ou moins compliquée), un signal
avertisseur de type auditif est moins efficace qu’un signal de type tactile.
Enfin, les résultats des deux premières expériences concernant l’incapacité du signal à compenser
l’effet négatif de la distraction avaient suggéré que le signal avertisseur pourrait nécessiter des
ressources attentionnelles pour être traité. Il serait donc moins efficace dans des conditions qui
requièrent un haut niveau d’investissement de ressources (comme dans notre tâche secondaire
cognitive). Nous avons testé cette hypothèse dans la troisième expérimentation menée dans un
contexte de conduite plus réaliste. De façon plus précise, nous avons évalué l’efficacité du signal
avertisseur en fonction de deux niveaux de difficulté de la tâche secondaire de distraction cognitive.
Nous savons à partir des premiers modèles de capacité que notre attention est limitée (Broadbent,
1958; Kahneman, 1973). Certains modèles (Baddeley & Hitch, 1974; Norman & Shallice, 1986) ont
postulé l’existence d’un processeur central qui a une fonction de contrôle et de coordination des
ressources attentionnelles. Ainsi, cette composante interviendrait lors des situations plus coûteuses
au niveau des ressources attentionnelles engagées comme dans des situations non automatisées,
nouvelles ou plus complexes. Cependant, lorsque la réalisation d’une ou plusieurs tâches nécessitent
plus de ressources attentionnelles que celles qui sont disponibles, une détérioration de la
performance pourrait être observée.
En accord avec cette hypothèse, nos résultats ont montré une moindre efficacité des systèmes
lorsque la tâche cognitive était plus coûteuse en ressources. Nos résultats sont consistants avec
l’étude de Mohebbi et al. (2009) qui est, à notre connaissance, la seule étude qui a aussi évalué
l’efficacité d’un système anticollision en fonction de différents niveaux de difficulté d’une tâche
cognitive. Bien que l’intérêt principal des auteurs ait été centré sur l’efficacité de deux modalités
différentes du signal avertisseur (tactile et auditif), leurs résultats ont montré un plus grand bénéfice
du système (tactile) lors de la réalisation d’une tâche moins coûteuse en ressources attentionnelles.
D’autres travaux, hors du contexte des systèmes d’aide à la conduite, ont montré dans des études
réalisées en simulateur de conduite (Jamson & Merat, 2005) ou sur piste (Harbluk et al., 2007) que la
performance du conducteur est négativement affectée lorsque le niveau de difficulté des tâches
secondaires cognitives augmente.

Chapitre 5
118
Il est intéressant de souligner qu’en condition de distraction les conducteurs ont considérablement
réduit leur vitesse. Ceci pourrait être interprété selon la théorie de Fuller (2005) comme une tentative
de réduction de l’effort mental nécessaire pour réaliser en même temps la tâche de conduite et la
tâche secondaire.
5.4. Adaptation comportementale au système
Comme nous l’avons vu, l’adaptation aux systèmes d’aide à la conduite peut changer au cours du
temps (Saad et al., 2004), lors des premières utilisations du système (phase d’apprentissage) comme
après une plus grande expérience avec le système (phase d’intégration). De plus, il est aussi
important de considérer les possibles transferts négatifs (vulnérabilité du conducteur) ou positifs qui
peuvent apparaître lors d’une conduite sans le système suivant une utilisation prolongée. Dans ce
cadre, notre dernier objectif vise à examiner l’adaptation comportementale à ces systèmes dans des
contextes plus proches de la conduite réelle. Plus précisément, il s’agit d’analyser comment les
conducteurs s’adaptent au système pendant les premiers usages et après une courte période de
temps, et comment ils s’adaptent lorsque le système est inactif après cette courte période
d’adaptation au système.
Concernant la phase d’apprentissage, nos résultats ont montré que les conducteurs adaptent
positivement leur comportement au système. Nous pouvons extraire ce résultat de nos deux
premières expériences réalisées dans des conditions de conduite très simplifiées, bien que l’étude de
l’adaptation immédiate au système n’ait pas été posée comme objectif. De même, la plupart des
études réalisées après une courte exposition au système montrent des effets positifs (Abe &
Richardson, 2006; Lee et al., 2002; Mohebbi et al., 2009). Cependant, ces études ainsi que nos deux
premières expériences avaient utilisé la technique du contrebalancement des périodes avec et sans
système. Ainsi, l’information sur l’effet de l’introduction du système sur le comportement du
conducteur n’avait pas été directement mesurée.
Dans la troisième expérience, dans des conditions plus réalistes et sans contrebalancement des
périodes, nous avons de nouveau pu observer une adaptation très rapide lors de la phase
d’apprentissage. Concernant la phase d’intégration, nous avons également observé des effets positifs.
Lorsque la distraction est introduite, la distraction difficile annule l’effet positif du système alors que la
distraction facile diminue cet effet. Lorsque la distraction est supprimée, les conducteurs qui ont
réalisé précédemment une tâche de distraction facile retrouvent les effets positifs du système mais,
étonnamment, le système reste moins efficace dans le cas où ils ont réalisé précédemment une tâche
de distraction difficile. Ainsi, nos résultats soulignent que le processus d’intégration du système peut
être affecté si les conducteurs sont distraits par des tâches secondaires coûteuses en ressources
attentionnelles. Les distractions au volant étant très fréquentes, nos résultats suggèrent que

Discussion Générale
119
l’intégration du système dans des situations réelles de conduite puisse être affectée si le conducteur
s’engage dans des tâches secondaires cognitivement difficiles.
Enfin, nos résultats ne montrent pas d’effets de transfert positif après la phase d’intégration lorsque le
système était inactif, contrairement à l’étude réalisée sur route par Ben-Yaacov et al. (2002). Dans
cette étude, des effets de transfert étaient observés après une courte exposition au système et même
six mois plus tard. Il est possible que la notion subjective de risque soit moins élevée dans les
simulateurs de conduite que sur route réelle, ce qui pourrait expliquer les différences entre ces deux
études. Cependant, bien que les effets positifs du système dans notre étude disparaissent, nous
n’avons pas observé d’adaptation comportementale négative.


6. CONCLUSION ET
PERSPECTIVES
121
6. Conclusion et Perspectives
Ce travail de recherche a été réalisé dans le cadre d’un projet Européen Marie Curie, ADAPTATION,
visant à analyser l’impact de différents systèmes d’aide à la conduite sur le comportement du
conducteur. Nous avons voulu avec cette thèse apporter de nouvelles connaissances sur le traitement
de l’information et l’adaptation associés à un système particulier : le système d’alerte anticollision.
L’originalité de ce travail est double. D’une part, nous avons utilisé deux approches expérimentales
complémentaires : une approche électrophysiologique et une approche comportementale. En
particulier, l’enregistrement de l’activité électrique cérébrale a constitué l’un des principaux apports de
cette thèse à l’étude des systèmes anticollision. Cela nous a permis d’analyser plus en profondeur
l’impact d’un signal avertisseur sur le traitement de l’information et de mieux comprendre les
mécanismes sous-jacents aux changements comportementaux. Ainsi, nous avons conclu que le
signal avertisseur agit au niveau de l’anticipation et de la préparation à la réponse et au niveau
cognitif. Malgré les limitations de cette technique, les études électroencéphalographiques présentent
un atout dans l’analyse de l’efficacité des systèmes anticollision.
D’autre part, la démarche suivie dans la construction de nos expériences nous a permis d’examiner
tout d’abord les effets des systèmes dans des contextes très contrôlés mais très simplifiés, et d’utiliser
par la suite un contexte de conduite plus réaliste. Cependant, les conditions expérimentales de nos
travaux sont encore loin des conditions de conduite réelles. L’une des principales limites de nos
expériences est la faible notion subjective de risque dans les environnements virtuels, par rapport à
des conditions de conduite sur route réelle. De plus, le grand nombre de répétitions des événements
de freinage de nos expériences peut en diminuer la validité écologique. Cette manipulation a été une
condition nécessaire dans nos expériences électrophysiologiques afin d’obtenir un rapport signal sur

Chapitre 6
122
bruit acceptable pour l’estimation des potentiels évoqués. Dans notre dernière expérience réalisée
dans un simulateur plus réaliste, la quantité des stimulations a été fortement réduite par rapport aux
premières expériences. Cependant, un nombre non négligeable d’événements a été nécessaire afin
d’analyser les effets de l’adaptation au système. Ceci pourrait donc avoir contribué à réduire la
sensation de risque, qui reste un facteur fondamental dans des situations potentielles de collision. En
effet, la probabilité d’avoir une collision par l’arrière dans la vie réelle est relativement faible. Ces
questions gagneraient donc à être approfondies dans des conditions de conduite réelle sur piste ou
sur route.
L’efficacité du système anticollision a été mesurée en faisant varier deux facteurs : la fiabilité du
système et l’état attentionnel du conducteur. Par ailleurs nous avons étudié l’adaptation
comportementale au système.
Concernant l’impact de la fiabilité du système nous avons confirmé que les systèmes anticollision ne
nécessitent pas d’être complètement fiables pour être efficaces. Cependant, un aspect qui resterait à
étudier dans nos travaux concerne l’effet immédiat ou global des erreurs du système sur le
comportement des conducteurs. En effet, bien que les systèmes imparfaits puissent être efficaces de
façon globale, l’effet ponctuel d’une fausse alarme ou d’un défaut de détection peut réduire
l’acceptation du système par le conducteur et avoir un impact critique pour la sécurité. Par exemple,
les fausses alarmes semblent induire des réponses de décélération qui ne sont pas nécessaires
(Maltz & Shinar, 2004). Ceci, pourrait ne pas avoir de graves conséquences si le trafic est faible, en
revanche, lors de conditions de circulation dense, cela pourrait générer des réactions de freinage en
chaîne (Cummings et al., 2007). Les défauts de détections, pour leur part, pourraient entraîner une
augmentation des temps de réaction aux événements critiques, ces temps de réaction pouvant même
être plus longs qu’en l’absence de système dans le véhicule (Abe et al., 2002).
La question de la distraction nous a accompagnés tout au long de ce travail de thèse. Notre premier
résultat, sur l’incapacité du signal avertisseur à compenser l’effet négatif de la distraction, nous a
amenés à nous interroger plus en détail sur cet effet inattendu. Pour essayer de comprendre ce
résultat, nous avions proposé deux hypothèses différentes. Notre première hypothèse concernant la
présence d’un meilleur prédicteur de la cible a été testée dans la deuxième expérience mais elle ne
suffisait pas à expliquer l’inefficacité du signal avertisseur en condition de distraction. Par la suite,
nous avons testé et confirmé avec les résultats de notre troisième expérience notre deuxième
hypothèse stipulant que le traitement du signal avertisseur n'est pas une tâche automatisée et
nécessite des ressources attentionnelles pour être efficace, ressources qui peuvent ne pas être
disponibles en cas de tâche secondaire. Plus la tâche est coûteuse en ressources attentionnelles
moins le système est efficace.
Concernant l’adaptation comportementale, nous avons montré des effets d’apprentissage quasi-
immédiats lorsque le système est introduit. La phase d’intégration a été étudiée en situation de
distraction. Dans ce cas, l’intégration est perturbée lorsque la distraction est coûteuse en ressources

Conclusion et Perspectives
123
attentionnelles et beaucoup moins lorsque la distraction demande moins de ressources. Enfin lorsque
le système est inactif, nous n’avons pas observé de transfert ni positif ni négatif.
Tous ces résultats et leurs interprétations ouvrent de nombreuses pistes de recherche pour aller plus
loin dans l’étude comportementale et électrophysiologique des systèmes anticollision.
Comme nous l’avons déjà suggéré, des études réalisées dans des conditions de conduite plus
réalistes, que ce soit sur piste ou sur route réelle, pourraient apporter des réponses à certaines
questions que nous avons soulevées. En particulier, il serait important de comprendre l’impact du
risque perçu sur le comportement du conducteur dans l’utilisation d’un système anticollision.
Concernant l’effet de la distraction, il serait intéressant d’analyser l’impact des différents niveaux de
difficulté des tâches secondaires à partir d’une approche électroencéphalographique. De plus, il serait
également intéressant d’examiner l’impact sur l’efficacité du système d’autres types de tâches
secondaires cognitives (par exemple, plus naturelles comme l’écoute de livres audio) ainsi que
d’autres tâches de modalités différentes.
Dans nos études nous avons manipulé le niveau de charge mentale en augmentant uniquement la
difficulté de la tâche secondaire. Mais le niveau global de charge mentale de la situation pourrait aussi
être manipulé en complexifiant la tâche de conduite ou en créant des situations stressantes, pour voir
dans quelle mesure nous observerions des résultats comparables.
Par ailleurs, nous avons étudié la première phase de l’apprentissage du système en condition sans
distraction. Il serait intéressant d’examiner comment cet apprentissage serait impacté par différents
types et niveaux de distraction.
Concernant l’adaptation, des études longitudinales et en condition de conduite réelle sur des périodes
de plusieurs mois sont nécessaires afin de mieux comprendre comment les conducteurs s’adaptent à
ces systèmes à plus long terme.
Enfin, dans ce travail de thèse nous avons étudié seulement deux des nombreux facteurs qui peuvent
influencer l’efficacité du système : la fiabilité du système et l’état attentionnel du conducteur.
Cependant, d’autres facteurs peuvent aussi jouer un rôle sur cette efficacité. D’une part, comme nous
l’avons mentionné dans le cadre théorique, certains aspects relatifs au design du système comme le
moment de déclenchement de l’alerte ou la modalité de l’alerte sont des éléments critiques à prendre
en considération. Mais même le «meilleur» des systèmes en termes de design pourrait ne pas être
approprié pour certains conducteurs. Ici nous avons montré que l’efficacité du système peut varier en
fonction de l’état attentionnel du conducteur. Sachant que les ressources attentionnelles diminuent
avec l’âge et encore plus dans beaucoup de pathologies du système nerveux, il serait intéressant
d’étudier comment ces populations peuvent s’adapter au système d’alerte anticollision. Par ailleurs
d’autres facteurs liés au conducteur pourraient également être des facteurs modulateurs de
l’adaptation au système anticollision comme le style de conduite, ou l'expérience des conducteurs.

Chapitre 6
124
Outre ces perspectives de recherche, nos résultats nous permettent également de proposer quelques
recommandations qui pourraient être utiles aux concepteurs et aux utilisateurs de ce type de
systèmes.
Selon nos résultats, le traitement du signal avertisseur n’est pas automatisé et nécessite des
ressources attentionnelles pour être efficace. En conséquence, une sensibilisation auprès des
usagers pourrait être faite afin de les avertir des précautions nécessaires lors des phases
d’introduction et d’intégration des systèmes. Notamment, il est important de souligner que la
réalisation de tâches secondaires difficiles au cours de ces périodes peut être préjudiciable. Par
ailleurs, il serait intéressant d’étudier si certains programmes d’entraînement visant à automatiser le
traitement du signal avertisseur pourraient contribuer à améliorer son efficacité en diminuant les
ressources attentionnelles nécessaires.
Enfin, étant donné la grande variabilité interindividuelle chez les conducteurs, nous recommandons le
développement de systèmes adaptatifs qui pourraient tenir compte de certaines caractéristiques des
conducteurs. Références

RÉFÉRENCES
125
Références
Abe, G., Itoh, M., & Tanaka, K. (2002). Dynamics of drivers' trust in warning systems. Paper presented at the 15th IFAC World Congress, Barcelona, Spain.
Abe, G., Itoh, M., & Yamamura, T. (2011). Visual distraction when driving and its influence on driver response to a forward collision warning system. Paper presented at the SICE Annual Conference, Tokyo, Japan.
Abe, G., & Richardson, J. (2004). The effect of alarm timing on driver behaviour: an investigation of differences in driver trust and response to alarms according to alarm timing. Transportation Research Part F: Traffic Psychology and Behaviour, 7(4-5), 307-322.
Abe, G., & Richardson, J. (2006). Alarm timing, trust and driver expectation for forward collision warning systems. Applied Ergonomics, 37(5), 577-586.
Aguera, P. E., Jerbi, K., Caclin, A., & Bertrand, O. (2011). ELAN: A Software Package for Analysis and Visualization of MEG, EEG, and LFP Signals. Computational Intelligence and Neuroscience, 1-11.
Baddeley, A., & Hitch, G. J. (1974). Working memory. In G. H. Bower (Ed.), The psychology of learning and motivation: Advances in research and theory. Vol 8. (pp. 47-89). New York: Academic Press.
Baddeley, A. D. (1996). Exploring the central executive. The Quarterly Journal of Experimental Psychology, 49A(1), 5-28.
Baddeley, A. D. (2000). The episodic buffer: a new component of working memory? Trends in Cognitive Science, 4(11), 417-423.
Bayly, M., Fildes, B., Regan, M., & Young, K. (2007). Review of crash effectiveness of Intelligent Transport Systems. Project No. 027763 – TRACE.
Belz, S. M., Robinson, G. S., & Casali, J. G. (1999). A new class of auditory warning signals for complex systems: auditory icons. Human Factors: The Journal of the Human Factors and Ergonomics Society, 41(4), 608-618.
Bella, F., & Russo, R. (2011). A Collision Warning System for rear-end collision: a driving simulator study. Procedia Social and Behavioral Sciences, 20, 676-686.
Ben-Yaacov, A., Maltz, M., & Shinar, D. (2002). Effects of an In-Vehicle Collision Avoidance Warning System on Short- and Long-Term Driving Performance. Human Factors: The Journal of the Human Factors and Ergonomics Society, 44(2), 335-342.
Blaauw, G. J. (1982). Driving Experience and Task Demands in Simulator and Instrumented Car: A Validation Study. Human Factors: The Journal of the Human Factors and Ergonomics Society, 24(4), 473-486.
Bliss, J. P., & Acton, S. A. (2003). Alarm mistrust in automobiles: how collision alarm reliability affects driving. [doi: DOI: 10.1016/j.apergo.2003.07.003]. Applied Ergonomics, 34(6), 499-509.
Boulinguez, P., Jaffard, M., Granjon, L., & Benraiss, A. (2008). Warning Signals Induce Automatic EMG Activations and Proactive Volitional Inhibition: Evidence From Analysis of Error Distribution in Simple RT. Journal of Neurophysiology, 99(3), 1572-1578.
Bowyer, S. M., Hsieh, L., Moran, J. E., Young, R. A., Manoharan, A., Liao, C.-c. J., . . . Tepley, N. (2009). Conversation effects on neural mechanisms underlying reaction time to visual events while viewing a driving scene using MEG. Brain Research, 1251, 151-161.

Références
126
Braitman, K. A., McCartt, A. T., Zuby, D. S., & Singer, J. (2010). Volvo and Infiniti drivers' experiences with select crash avoidance technologies. Traffic Injury Prevention, 11(3), 270-278.
Breuer, J. J., Faulhaber, A., Frank, P., & Gleissner, S. (2007). Real world safety benefits of brake assistance systems. Paper presented at the 20th International Technical Conference on the Enhanced Safety of Vehicles (ESV), Lyon, France.
Broadbent, D. (1958). Perception and communication. Londres: Pergamon Press. Brouwer, W. H. (2002). Attention and driving: A cognitive neuropsychological approach. In P.
Zimmermann & M. Leclercq (Eds.), Applied Neuropsychology of Attention (pp. 223-248). Hove: Psychology Press.
Brown, T. L., Lee, J. D., & McGehee, D. V. (2001). Human Performance Models and Rear-End Collision Avoidance Algorithms. Human Factors: The Journal of the Human Factors and Ergonomics Society, 43(3), 462-482.
Bruyas, M. P., Chapon, A., Lelekov-Boissard, T., Letisserand, D., Duraz, M., & Aillerie, I. (2006). Evaluation de l’impact de communications vocales sur la conduite automobile. [An evaluation of the impact of vocal communication on the driving task]. Recherche Transports Sécurité, 91, 99-119.
Bueno, M., Fabrigoule, C., Deleurence, P., Ndiaye, D., & Fort, A. (2012). An electrophysiological study of the impact of a Forward Collision Warning System in a simulator driving task. Brain Research, 1470, 69-79.
Bueno, M., Fort, A., Francois, M., Ndiaye, D., Deleurence, P., & Fabrigoule, C. (2013). Effectiveness of a Forward Collision Warning System in simple and in dual task from an electrophysiological perspective. Neuroscience Letters, 541, 219-223.
Bueno, V. F., & Ribeiro-do-Valle, L. E. (2012). Facilitatory effects of an auditory warning stimulus in a visual location identification task and a visual shape identification task. Brazilian journal of medical and biological research, 45, 1037-1044.
Callejas, A., Lupiañez, J., Funes, M. J., & Tudela, P. (2005). Modulations among the alerting, orienting and executive control networks. Experimental Brain Research, 167, 27-37.
Campbell, J. L., Richard, C. M., Brown, J. L., & McCallum, M. (2007). Crash Warning System Interfaces: Human Factors Insights and Lessons Learned Washington, DC National Highway Traffic Safety Administration
Carsten, O., & Jamson, H. (2011). Driving simulators as research tools in traffic psychology. In B. E. Porter (Ed.), Handbook of traffic psychology (pp. 87-96). UK, USA: Academic press.
Clark, V. P., & Hillyard, S. A. (1996). Spatial selective attention affects early extrastriate but not striate components of the visual evoked potential. Journal of Cognitive Neuroscience, 8(5), 387-402.
Cohen, R. M., Semple, W. E., Gross, M., Holcomb, H. J., Dowling, S. M., & Nordahl, T. E. (1988). Functional localization of sustained attention. Neuropsychiatry, Neuropsychology and Behavioral Neurology, 1, 3-20.
Coles, M. G. H., & Rugg, M. D. (1995). Event-related brain potentials: an introduction. In M. D. Rugg & M. G. H. Coles (Eds.), Electrophysiology of Mind: Event-Related Brain Potentials and Cognition (pp. 1-26). New York: Oxford University Press.
Collet, C., Clarion, A., Morel, M., Chapon, A., & Petit, C. (2009). Physiological and behavioural changes associated to the management of secondary tasks while driving. Applied Ergonomics, 40(6), 1041-1046.
Comte, S. L. (2000). New systems: new behaviour? Transportation Research Part F: Traffic Psychology and Behaviour, 3(2), 95-111.
Correa, Á., Lupiáñez, J., Madrid, E., & Tudela, P. (2006). Temporal attention enhances early visual processing: A review and new evidence from event-related potentials. Brain Research, 1076(1), 116-128.
Correa, Á., Triviño, M., Pérez-Dueñas, C., Acosta, A., & Lupiáñez, J. (2010). Temporal preparation, response inhibition and impulsivity. Brain and Cognition, 73(3), 222-228.
Coull, J. T. (1998). Neural correlates of attention and arousal: insights from electrophysiology, functional neuroimaging and psychopharmacology. Progress in Neurobiology, 55(4), 343-361.
Cummings, M. L., Kilgore, R. M., Wang, E., Tijerina, L., & Kochhar, D. S. (2007). Effects of Single Versus Multiple Warnings on Driver Performance. Human Factors: The Journal of the Human Factors and Ergonomics Society, 49(6), 1097-1106.
Chun, J., Han, S. H., Park, G., Seo, J., lee, I., & Choi, S. (2012). Evaluation of vibrotactile feedback for forward collision warning on the steering wheel and seatbelt. International Journal of Industrial Ergonomics, 42(5), 443-448.
Deutsch, J. A., & Deutsch, D. (1963). Attention: Some theoretical considerations. Psychological Review, 7, 80-90.

Références
127
Dingus, T. A., Klauer, S. G., Neale, V. L., Petersen, A., Lee, S. E., Sudweeks, J., . . . Knipling, R. R. (2006). The 100-Car Naturalistic Driving Study, Phase II – Results of the 100-Car Field Experiment Washington, DC National Highway Traffic Safety Administration.
Drews, F. A., Yazdani, H., Godfrey, C. N., Cooper, J. M., & Strayer, D. L. (2009). Text Messaging During Simulated Driving. Human Factors: The Journal of the Human Factors and Ergonomics Society, 51(5), 762-770.
Edworthy, J., Loxley, S., & Dennis, I. (1991). Improving auditory warning design: relationship between warning sound parameters and perceived urgency. Human Factors: The Journal of the Human Factors and Ergonomics Society, 33, 205-232.
Eichelberger, A. H., & McCartt, A. T. (2012). Volvo Drivers’ Experiences with Advanced Crash Avoidance and Related Technologies. Arlington,: Insurance Institute for Highway Safety.
Engström, J., Johansson, E., & Östlund, J. (2005). Effects of visual and cognitive load in real and simulated motorway driving. Transportation Research Part F: Traffic Psychology and Behaviour, 8(2), 97-120.
European Statement of Principles on Human Machine Interface for In-Vehicle Information and Communication Systems (1998).
European Commission. (2006). CARE - GLOSSARY ( EU road accidents database) from http://ec.europa.eu/transport/road_safety/specialist/statistics/care_reports_graphics/care_what_is_it/index_en.htm
European Commission. (2010). Communication from the Commission to the European Parliament, the Council, the European Economic and Social Committee and the Committee of the Regions. Towards a European road safety area: policy orientations on road safety 2011-2020. Brussels,: European Commision.
Implementing Regulation (EC) No 661/2009 of the European Parliament and of the Council with respect to type-approval requirements for certain categories of motor vehicles with regard to advances emergency braking systems, D5 682417 C.F.R. (2011).
European Commission. (2013). EU road fatalities Retrieved 29 April, 2013, from http://ec.europa.eu/transport/road_safety/pdf/observatory/trends_figures.pdf
Regulation (EC) No 661/2009 of the European Parliament and of the Council of 13 July 2009 concerning type-approval requirements for the general safety of motor vehicles, their trailers and systems, components and separate technical units intended therefor (2009).
Fan, J., McCandliss, B. D., Sommer, T., Raz, A., & Posner, M. I. (2002). Testing the Efficiency and Independence of Attentional Networks. Journal of Cognitive Neuroscience, 14(3), 340–347.
Fecteau, J. H., & Munoz, D. P. (2007). Warning signals influence motor processing. Journal of neurophysiology, 97, 1600-1609.
Fischer, R., Plessow, F., & Kiesel, A. (2012). The effects of alerting signals in action control: activation of S–R associations or inhibition of executive control processes? Psychological Research, 76(3), 317-328.
Folstein, J. R., & Van Petten, C. (2008). Influence of cognitive control and mismatch on the N2 component of the ERP: a review. Psychophysiology, 45(1), 152-170.
Forkenbrock, G. J., & O'Harra, B. C. (2009). A Forward Collision Warning (FCW) performance evaluation. Paper presented at the 21st International Technical Conference on the Enhanced Safety of Vehicles (ESV), Stuttgart, Germany.
Fort, A., Collette, B., Bueno, M., Deleurence, P., & Bonnard, A. (2013). Impact of totally and partially predictive alert in distracted and undistracted subjects: An event related potential study. Accident Analysis & Prevention, 50, 578-586.
Fort, A., Martin, R., Jacquet-Andrieu, A., Combe-Pangaud, C., Foliot, G., Daligault, S., & Delpuech, C. (2010). Attentional demand and processing of relevant visual information during simulated driving: A MEG study. Brain Research, 1363, 117-127.
Fuller, R. (2005). Towards a general theory of driver behaviour. [doi: DOI: 10.1016/j.aap.2004.11.003]. Accident Analysis & Prevention, 37(3), 461-472.
Funes, M. J., & Lupiañez, J. (2003). La teoría atencional de Posner: una tarea para medir las funciones atencionales de Orientación, Alerta y Control Cognitivo y la interacción entre ellas. Psicothema, 15(2), 260-266.
Gabaude, C., Baraca, B., Jallais, C., Bonniaud, M., & Fort, A. (2012). Cognitive load measurement while driving. Paper presented at the Human Factors: a view from an integrative perspective, Toulouse, France.
Georgi, A., Zimmermann, M., Lich, T., Blank, L., Kickler, N., & Marchthaler, R. (2009). New approach of accident benefit analysis for rear end collision avoidance and mitigation systems. Paper presented at the 21st International Technical Conference on the Enhanced Safety of Vehicles, Stuttgart, Germany.

Références
128
Gietelink, O. J., Ploeg, J., De Schutter, B., & Verhaegen, M. (2009). Development of a driver information and warning system with vehicle hardware-in-the-loop simulations. Mechatronics, 19(7), 1091-1104.
Graham, R. (1999). Use of auditory icons as emergency warnings: evaluation within a vehicle collision avoidance application. Ergonomics, 42(9), 1233-1248.
Grover, C., Knight, I., Okoro, F., Simmons, I., Couper, G., Massie, P., & Smith, B. (2008). Automated Emergency Brake Systems: Technical requirements, costs and benefits: TRL Limited.
Hackley, S. A., & Valle-Inclán, F. (2003). Which stages of processing are speeded by a warning signal? Biological Psychology, 64(1-2), 27-45.
Harbluk, J. L., Noy, Y. I., Trbovich, P. L., & Eizenman, M. (2007). An on-road assessment of cognitive distraction: Impacts on drivers’ visual behavior and braking performance. Accident Analysis & Prevention, 39(2), 372-379.
Harder, K. A., Bloomfield, J., & Chihak, B. J. (2003). The Effectiveness of Auditory Side- and Forward-Collision Warnings in Winter Driving Conditions. Minnesota: University of Minnesota.
Hart, S. G., & Staveland, L. E. (1988). Development of NASA-TLX (Task Load Index): Results of empirical and theoretical research. In P. A. H. a. N. Meshkati (Ed.), Human Mental Workload. Amsterdam: North Holland Press.
Highway Loss Data Institute. (2012a). Acura collision avoidance features: initial results. Bulletin 28(21), 1-8.
Highway Loss Data Institute. (2012b). Mercedes-Benz collision avoidance features: initial results. Bulletin 29(7), 1-22.
Highway Loss Data Institute. (2012c). Volvo collision avoidance features: initial results. Bulletin, 29(5), 1-11.
Ho, C., Reed, N., & Spence, C. (2007). Multisensory In-Car Warning Signals for Collision Avoidance. Human Factors: The Journal of the Human Factors and Ergonomics Society, 49(6), 1107-1114.
Ho, C., & Spence, C. (2009). Using peripersonal warning signals to orient a driver's gaze. Human Factors: The Journal of the Human Factors and Ergonomics Society, 51(4), 539-556.
Horberry, T., Anderson, J., Regan, M. A., Triggs, T. J., & Brown, J. (2006). Driver distraction: The effects of concurrent in-vehicle tasks, road environment complexity and age on driving performance. Accident Analysis & Prevention, 38(1), 185-191.
Hurts, K., Angell, L. S., & Perez, M. A. (2011). The Distracted Driver Mechanisms, Models, and Measurement. Reviews of Human Factors and Ergonomics, 7(1), 3-57.
Huth, V., Bueno, M., Fort, A., & Brusque, C. (2014). Synthesis of new knowledge on drivers’ adaptation processes in response to ADAS issued from the ADAPTATION project. In A Stevens, C Brusque & J Krems (Eds). Driver adaptation to information and assistance systems. IET published book. ISBN: 978-1-84919-639-0; E-ISBN: 978-1-84919-640-6
Ikari, T., Kaito, K., Nakajima, T., Yamazaki, K., & Ono, K. (2009). Japan new car assessment program for minor neck injury protection in rear end collisions. Paper presented at the 21st International Technical Conference on the Enhanced Safety of Vehicles Conference (ESV), Stuttgart, Germany.
ISO 15623. (2002). Transport information and control systems - Forward vehicle collision warning systems - Performance requirements and test procedures.
Itoh, M., Horikome, T., & Inagaki, T. (2013). Effectiveness and driver acceptance of a semi-autonomous forward obstacle collision avoidance system. Applied Ergonomics, 44(5), 756-763.
Jamson, A. H., Lai, F. C. H., & Carsten, O. M. J. (2008). Potential benefits of an adaptive forward collision warning system. Transportation Research Part C: Emerging Technologies, 16(4), 471-484.
Jamson, A. H., & Merat, N. (2005). Surrogate in-vehicle information systems and driver behaviour: Effects of visual and cognitive load in simulated rural driving. Transportation Research Part F: Traffic Psychology and Behaviour, 8(2), 79-96.
Jamson, A. H., Westerman, S. J., Hockey, G. R., & Carsten, O. M. (2004). Speech-based E-mail and driver behavior: effects of an in-vehicle message system interface. Human Factors: The Journal of the Human Factors and Ergonomics Society, 46(4), 625-639.
Jasper, H. H. (1958). The ten twenty electrode system of the international federation. Electroencephalography and Clinical Neurophysiology, 10, 371-375
Kaber, D. B., Liang, Y., Zhang, Y., Rogers, M. L., & Gangakhedkar, S. (2012). Driver performance effects of simultaneous visual and cognitive distraction and adaptation behavior. Transportation Research Part F: Traffic Psychology and Behaviour, 15(5), 491-501.
Kahneman, D. (1973). Attention and Effort. Londres: Prentice Hall.

Références
129
Key, A. P. F., Dove, G. O., & Maguire, M. J. (2005). Linking Brainwaves to the Brain: An ERP Primer. Developmental neuropsychology, 27(2), 183–215.
Kidd, D. G., Nelson, E. T., & Baldwin, C. L. (2010). The Effects of Repeated Exposures to Collision Warnings on Drivers' Willingness to Engage in a Distracting Secondary Task. Paper presented at the Proceedings of the Human Factors and Ergonomics Society 54
th Annual
Meeting, Santa Monica, CA. Kiefer, R., LeBlanc, D., Palmer, M., Salinger, J., Deering, R., & Shulman, M. (1999). Development and
validation of functional definitions and evaluation procedures for collision warning/avoidance systems. Washington DC: National Highway Traffic Safety Administration.
Kiefer, R. J., Cassar, M. T., Flannagan, C. A., Jerome, C. J., & Palmer, M. D. (2005). Surprise Braking Trials, Time-to-Collision Judgments, and “First Look” Maneuvers Under Realistic Rear-End Crash Scenarios. Michigan: Crash Avoidance Metrics Partnership.
Knipling, R. R., Wang, J. S., & Yin, H. M. (1993). Rear-end Crashes: Problem size assessment and statistical description. Washington, DC: National Highway Traffic Safety Administration.
Kramer, A. F., Cassavaugh, N., Horrey, W. J., Becic, E., & Mayhugh, J. L. (2007). Influence of Age and Proximity Warning Devices on Collision Avoidance in Simulated Driving. Human Factors: The Journal of the Human Factors and Ergonomics Society, 49(5), 935-949.
Kutas, M., & Dale, A. (1997). Electrical and magnetic readings of mental functions. In M. D. Rugg (Ed.), Cognitive Neuroscience (pp. 197-241). Hove East Sussex, UK: Psychology Press.
Lamble, D., Kauranen, T., Laakso, M., & Summala, H. (1999). Cognitive load and detection thresholds in car following situations: safety implications for using mobile (cellular) telephones while driving. Accident Analysis & Prevention, 31(6), 617-623.
Lee, J. D., McGehee, D. V., Brown, T. L., & Reyes, M. L. (2002). Collision Warning Timing, Driver Distraction, and Driver Response to Imminent Rear-End Collisions in a High-Fidelity Driving Simulator. Human Factors: The Journal of the Human Factors and Ergonomics Society, 44(2), 314-334.
Lees, M. (2010). Context conditions drivers' disposition towards alarms. Philosophy degree in Industrial Engineering, University of Iowa, Iowa.
Lerner, N. D., Dekker, D. K., Steinberg, G. V., & Huey, R. W. (1996). Inappropriate Alarm Rates and Driver Annoyance. Washington, DC National Highway Traffic Safety Administration.
Loveless, N. E. (1973). The contingent negative variation related to preparatory set in a reaction time situation with variable foreperiod. Electroencephalography and Clinical Neurophysiology, 35(4), 369-374.
Luck, S. L. (2005). An introduction to the Event-Related Potential technique. Cambridge, Massachussetts: The MIT Press.
Mackintosh, N. J. (1974). The psychology of animal learning. New York: Academic Press. Maltz, M., & Shinar, D. (2004). Imperfect in-vehicle collision avoidance warning systems can aid
drivers. Human Factors: The Journal of the Human Factors and Ergonomics Society, 46(2), 357-366.
Maltz, M., & Shinar, D. (2007). Imperfect in-vehicle collision avoidance warning systems can aid distracted drivers. Transportation Research Part F: Traffic Psychology and Behaviour, 10(4), 345-357.
McKeever, B. B. (1998). Working Paper: Estimating the Potential Safety Benefits of Intelligent Transportation Systems. Washington: Mitretek Systems.
McLaughlin, S. B. (2007). Analytic Assessment of Collision Avoidance Systems and Driver Dynamic Performance in Rear-End Crashes and Near-Crashes PhD Virginia Polytechnic Institute and State University Virginia
McLaughlin, S. B., Hankey, J. M., & Dingus, T. A. (2007). A method for evaluating collision avoidance systems using naturalistic driving data. Accident Analysis & Prevention, 40(1), 8-16.
McLaughlin, S. B., Hankey, J. M., Dingus, T. A., & Klauer, S. G. (2009). Development of an FCW Algorithm Evaluation Methodology With Evaluation of Three Alert Algorithms. Virginia: Virginia Tech Transportation Institute.
Mednick, S. A. (1962). The associative basis of the creative process. Psychological Review, 69, 220-232.
Merat, N., Jamson, A. H., Lai, F. C., & Carsten, O. (2012). Highly automated driving, secondary task performance, and driver state. Human Factors: The Journal of the Human Factors and Ergonomics Society, 54(5), 762-771.
Michon, J. A. (1985). A critical view of driver behavior models: What do we know, what should we do? In L. A. Evans & R. Schwing (Eds.), Proceedings of the International Symposium on Driver Behavior and Traffic Safety. General Motors Research Laboratories (pp. 485-520). New-York: Plenum Press.

Références
130
Mohebbi, R., Gray, R., & Tan, H. Z. (2009). Driver Reaction Time to Tactile and Auditory Rear-End Collision Warnings While Talking on a Cell Phone. Human Factors: The Journal of the Human Factors and Ergonomics Society, 51(1), 102-110.
Muhrer, E., & Vollrath, M. (2010). Expectations while car following--the consequences for driving behaviour in a simulated driving task. Accident Analysis & Prevention, 42(6), 2158-2164.
Murher, E., Reinprecht, K., & Vollrath, M. (2012). Driving With a Partially Autonomous Forward Collision Warning System: How Do Drivers React? Human Factors: The Journal of the Human Factors and Ergonomics Society, 54(5), 698-708.
Näätänen, R., & Picton, T. W. (1987). N2 and automatic versus controlled processes. Electroencephalography and Clinical Neurophysiology 38, 169-186.
Najm, W. G., Stearns, M. D., Howarth, H., Koopmann, J., & Hitz, J. (2006). Evaluation of an automotive rear end collision avoidance system. Cambridge: U.S. Department of Transportation.
NHTSA. (2009). Traffic safety facts 2009: A compilation of motor vehicle crash data from the fatality analysis reporting system and the general estimates system. Washington: National Highway Traffic Safety Administration.
Norman, D. A., & Shallice, T. (1986). Attention to action: willed and automatic control of behavior. In R. J. Davidson, G. E. Schwartz & D. Shapiro (Eds.), Consciousness and Self-Regulation (Vol. 4, pp. 1-18). New York and London: Plenum Press.
OECD. (1990). Behavioural adaptations to changes in the road transport system. Paris. OECD. (2003). Road Safety: Impact of new technologies: Organisation for Economic Co-operation
and Development. Östlund, J., Peters, B., Thorslund, B., Engström, J., Markkula, G., Keinath, A., . . . Foehl, U. (2005).
Driving performance assessment methods and metrics Project no IST-1-507674-IP. Parasuraman, R., Hancock, P. A., & Olofinboba, O. (1997). Alarm effectiveness in driver-centred
collision-warning systems. Ergonomics, 40(3), 390-399. Patel, S. H., & Azzam, P. N. (2005). Characterization of N200 and P3000: selected studies of the
event-related potential. International Journal of Medical Sciences, 2, 147-154. Pauzié, A., & Amditis, A. (2011). Intelligent Driver Support System functions in cars and their potential
consequences on safety. In Y. Barnard, R. Risser & J. Krems (Eds.), Safety of Intelligent Driver Support Systems: Design, Evaluation, and Social perspectives (pp. 7-25): Ashgate Publishing Limited.
Pettitt, M., Burnett, G., & Stevens, A. (2005). Defining driver distraction. Paper presented at the 12th World Congress on ITS, San Francisco, US.
Polich, J. (2007). Updating P300: An integrative theory of P3a and P3b. Clinical Neurophysiology, 118, 2128-2148.
Posner, M. I. (1994). Attention: The mechanisms of consciousness. Proceedings of the National Academy of Sciences of the United States of America, 91, 7398–7403.
Posner, M. I. (2008). Measuring alertness. Annals of the New York Academy of Sciences, 1129, 193-199.
Posner, M. I., & Petersen, S. E. (1990). The attention system of the human brain. Annual Review of Neuroscience, 13, 25-42.
Posner, M. I., & Snyder, C. R. (1975). Attention and cognitive control. In R. L. Solso (Ed.), Information processing and cognition. Hillsdale, NJ: Erlbaum.
Raabe, M., Rutschmann, R. M., Schrauf, M., & Greenl, M. W. (2005). Neural Correlates of Simulated Driving: Auditory Oddball Responses Dependent on Workload Paper presented at the HCI International, Las Vegas, Nevada (USA).
Rakauskas, M. E., Ward, N. J., Bernat, E. M., Cadwallader, M., Patrick, C. J., & de Waard, D. (2005). Psychophysiological measures of driver distraction and workload while intoxicated. Paper presented at the 3rd International Symposium on Human Factors in Driver Assessment, Training, and Vehicle Design, Rockport, Maine.
Rasmussen, J. (1986). Information processing and human-machine interaction. Amsterdam: Elsevier. Recarte, M. A., & Nunes, L. M. (2000). Effects of verbal and spatial-imagery tasks on eye fixations
while driving. Journal of Experimental Psychology: Applied, 6(1), 31-43. Reitan, R. (1958). Validity of the trail making test as an indicator of organic brain damage. Perceptual
and Motor Skills, 8(271-276). Rudell, A. P., & Hu, B. (2001). Does a warning signal accelerate the processing of sensory
information? Evidence from recognition potential responses to high and low frequency words. International Journal of Psychophysiology, 41(1), 31-42.
Rudin-Brown, C. M., & Noy, Y. I. (2002). Investigation of behavioral adaptation to lane departure warnings. Transportation Research Record, 1803, 30–37.

Références
131
Rudin-Brown, C. M., & Parker, H. A. (2004). Behavioural adaptation to adaptive cruise control (ACC): implications for preventivestrategies. Transportation Research Part F: Traffic Psychology and Behaviour, 7, 59-76.
Saad, F., Hjälmdahl, M., Cañas, J., Alonso, M., Garayo, P., Macchi, L., . . . Bekiaris, E. (2004). Literature review of behavioural effects AIDE Project, Deliverable D1.2.1. Brussels: Information Society Technologies.
SAE J2400. (2003). Human Factors in Forward Collision Warning Systems: Operating Characteristics and User Interface Requirements: SAE International Surface Vehicle Information Report.
Santangelo, V., Van der Lubbe, R. H., Olivetti Belardinelli, M., & Postma, A. (2008). Multisensory integration affects ERP components elicited by exogenous cues. Experimental Brain Research, 185(2), 269-277.
Santos, J., Merat, N., Mouta, S., Brookhuis, K., & De Waard, D. (2005). The interaction between driving and in-vehicle information systems: Comparison of results from laboratory, simulator and real-world studies. Transportation Research Part F: Traffic Psychology and Behaviour, 8(2), 135-146.
Schneider, W., & Shiffrin, R. M. (1977). Controlled and automatic human information processing: Detection, search and attention. Psychological Review, 84(1), 1-126.
Schoitsch, E. (2008). Analysis and assessment of potential scenarios. Deliverable D1.1 ADOSE - Project no 216049
Schömig, N., & Metz, B. (2013). Three levels of situation awareness in driving with secondary tasks. Situation Awareness and Safety, 56, 44-51.
Schweizer, T. A., Kan, K., Hung, Y., Tam, F., Naglie, G., & Graham, S. J. (2013). Brain activity during driving with distraction: an immersive fMRI study. Frontiers in human neuroscience, 7(53), 1-11.
Seiler, P., Song, B., & Hedrick, J. K. (1998). Development of a Collision Avoidance System. Paper presented at the Society of Automotive Engineers, International Congress & Exposition.
Singh, S. (2003). Driver Attributes and Rear-end Crash Involvement Propensity. Washington: National Highway Traffic Safety Administration
Spence, C., & Santangelo, V. (2009). Capturing spatial attention with multisensory cues: A review. Hearing Research, 258(1-2), 134-142.
Stein, A. C., Solomon, R. A., & Ziedman, D. A. (1992). Field Evaluation of the Radar Control Systems (RCS) Radar Anti-Collision Warning System. Hawthorne, CA: Systems Technology, Inc.
Strayer, D. L., & Drews, F. A. (2007). Multitasking in the automobile. In A. Kramer, D. Wiegmann & A. Kirlik (Eds.), Attention: From Theory to Practice. New York: Oxford University Press.
Strayer, D. L., Drews, F. A., Albert, R. W., & Johnston, W. A. (2001). Cell phone induced perceptual impairments during simulated driving. Paper presented at the First International Driving Symposium on Human Factors in Driver Assessment, Training and Vehicle Design, Aspen, Colo.
Stroop, J. R. (1935). Studies of interference in serial verbal reactions. Journal of Experimental Psychology, 18, 643-662.
Sturm, W., & Willmes, K. (2000). On the functional neuroanatomy of intrinsic and phasic alertness. Neuroimage, 14(1), S76-S84.
Summala, H. (1988). Risk control is not risk adjustment: the zero-risk theory of driver behaviour and its implications. Ergonomics, 31(4), 491-506.
Treisman, A. M. (1964). Verbal cues, language and meaning in selective attention. The American Journal of Psychology 77(2), 206-219.
Uchiyama, Y., Toyoda, H., Sakai, H., Shin, D., Ebe, K., & Sadato, N. (2012). Suppression of brain activity related to a car-following task with an auditory task: An fMRI study. Transportation Research Part F: Traffic Psychology and Behaviour, 15(1), 25-37.
UNECE. (2007). Statistics of road traffic accidents in Europe and North America (Vol. LI). New York and Geneva: United Nations Economic Commission for Europe.
UNECE. (2011). Statistics of road traffic accidents in Europe and North America (Vol. LII). New York and Geneve: United Nations Economic Commission for Europe.
United Nations. (2010). Resolution adopted by the General Assembly. Retrieved 29 April, 2013, from http://www.who.int/violence_injury_prevention/publications/road_traffic/UN_GA_resolution-54-255-en.pdf
Van der Laan, J. D., Heino, A., & De Waard, D. (1997). A simple procedure for the assessment of acceptance of advanced transport telematics. Transportation Research Part C: Emerging Technologies, 5(1), 1-10.
Van Kampen, B. (2003). Case study: rear end or chain accidents. The Netherlands: SWOV Institute for Road Safety Reserch.

Références
132
Van Zomeren, A. H., & Brouwer, W. H. (1994). Clinical neuropsychology of attention. New York: Oxford University Press.
Vogel, E. K., & Luck, S. J. (2000). The visual N1 component as an index of a discrimination process. Psychophysiology, 37(2), 190-203.
Vogel, L., & Bester, C. J. (2005). A relationship between accident types and causes. Paper presented at the 24th Southern African Transport Conference, South Africa.
Walter, W. G., Cooper, R., Aldridge, V. J., McCallum, W. C., & Winter, A. L. (1964). Contingent negative variation: An electric sign of sensorimotor association and expectancy in the human brain. Nature 25(203), 380-384.
Wang, Y., Mehler, B., Reimer, B., Lammers, V., D'Ambrosio, L. A., & Coughlin, J. F. (2010). The validity of driving simulation for assessing differences between in-vehicle informational interfaces: A comparison with field testing. Ergonomics, 53(3), 404-420.
Watanabe, Y., & Ito, S. (2007). Influence of vehicle properties and human attributes on neck injuries in rear-end collisions. Paper presented at the 20th International Technical Conference on the Enhanced Safety of Vehicles (ESV), Lyon, France.
Wechsler, D. (1981). Wechsler Adult and Intelligence scale Revised. New-York: Psychological Corporation.
Wege, C., & Victor, T. (2010). ADAS function selection, benchmark, behavioural adaptation effects, research questions, hypotheses, and conceptual framework development. Project no 238833 - ADAPTATION
Wickens, C. D. (1980). The structure of attentional resources. In R. Nickerson (Ed.), Attention and performance (pp. 239-257). Hillsdale: NJ Erlbaum.
Wickens, C. D. (1984). Processing resources in attention. In R. Parasuraman & D. R. Davies (Eds.), Varieties of attention. London: Academic Press.
Wickens, C. D. (2002). Multiple resources and performance prediction. Theoretical Issues in Ergonomical Science, 3, 159-177.
Wickens, C. D., & Dixon, S. R. (2007). The benefits of imperfect diagnostic automation: a synthesis of the literature. Theoretical Issues in Ergonomics Science, 8(3), 201-212.
Wild-Wall, N., Hahn, M., & Falkenstein, M. (2011). Preparatory processes and compensatory effort in older and younger participants in a driving-like dual task. Human Factors: The Journal of the Human Factors and Ergonomics Society, 53(2), 91-102.
Wilde, G. J. S. (1982). The theory of risk homeostasis: implications for safety and health. Risk Analysis, 2(4), 209-225.
World Health Organization. (2004). World report on road traffic injury prevention. Geneva. World Health Organization. (2011). Causes of death 2008. Retrieved 29 April 2013, from
http://www.who.int/evidence/bod Young, K., & Regan, M. A. (2007). Driver distraction: A review of the literature. In I. J. Faulks, M.
Regan, M. Stevenson, J. Brown, A. Porter & J. D. Irwin (Eds.), Distracted driving (pp. 379-405). Sydney, NSW: Australasian College of Road Safety.
Zhu, B. (2001). Potential Effects on Accidents from Forward Collision Warning/Avoidance System. Master Thesis, Linköping University, Sweden.

ANNEXES
Annexes


ANNEXE 1
135
Annexe 1 : Chapitre d’ouvrage Dans le cadre du projet ADAPTATION, un livre collectif synthétisant l’ensemble des travaux
individuels de recherche a été réalisé. L’annexe 1 présente le chapitre 12 de cet ouvrage qui résume
la section 2.1. de l’introduction de cette thèse.
Effectiveness of Forward Collision Warning Systems: a contribution from the
cognitive analysis combining behavioural and electrophysiological measurements.3
Mercedes Bueno1, 2, 3, Colette Fabrigoule3 and Alexandra Fort1, 2
1 IFSTTAR-LESCOT, 25 avenue François Mitterrand, F-69675 Bron, France 2 University of Lyon, F-69622 Lyon, France 3 University Bordeaux Segalen, USR CNRS 3413 SANPSY, Hôpital Pellegrin, 13éme étage, Place Amélie Raba Léon, F-33076 Bordeaux, France
Abstract
This chapter discusses Forward Collision Warning Systems (FCWS), describing the characteristics
and the functions of some of the systems currently on the market and presents an overview of
3 Bueno, M., Fabrigoule, C., and Fort, A. (2014). Effectiveness of Forward Collision Warning Systems: a contribution from the cognitive analysis combining behavioural and electrophysiological measures. In A Stevens, C Brusque & J Krems (Eds). Driver adaptation to information and assistance systems. IET published book. ISBN: 978-1-84919-639-0; E-ISBN: 978-1-84919-640-6

Annexe 1
136
behavioural studies evaluating the effectiveness of these systems on road and in simulators. Results
are presented from recent studies using electroencephalography and the associated Event Related
Potentials allowing, through the analysis of brain activity, a more in-depth understanding of the nature
of the cognitive processes in the context of FCWS. These studies address three important questions:
1. Are FCWS as effective as they are expected to be when drivers are distracted?
2. What are the consequences of driving with a system that is not completely reliable?
3. Is there any behavioural adaptation to the FCWS over their use in time? Are the consequences of
this adaptation positive or negative?
The chapter shows that FCWS provides potential benefits for road safety, but certain factors such as
the attentional state of drivers but the reliability level of the system can mitigate its effectiveness.
12.1 Introduction
Advanced driver assistance systems (ADAS) have experienced a rapid development in recent years to
optimise their potential benefits on road safety. It has been estimated that these systems contribute to
reducing the number of casualties on the roads. Because of this, the European Commission has
recently proposed the mandatory installation of some ADAS such as the lane departure warning
system and the collision warning system in heavy vehicles from 1st November 2013 [1]. Nevertheless,
light vehicles will be exempted at present because of the lower benefit-to-cost ratio compared to heavy
vehicles.
Since ADAS have appeared on the market, research in the field of human factor has been promoted
to investigate the impact of both the benefits of these systems on drivers’ behaviour and their potential
failures or limitations. Some of these systems warn drivers by an audible, visual or/and haptic signal
when inappropriate behaviour is detected, either because an action is required but is not carried out or
because the action carried out is not the right one. This chapter presents a review of the literature
focused on a particular ADAS, the Forward Collision Warning System (FCWS). Nevertheless, some of
the questions and discussions considered here could be applied to other warning systems.
FCWS are designed to reduce the number and/or to avoid rear-end collisions by providing warning to
drivers. Traditional behavioural measures obtained in driving simulators and field operational tests are
useful tools for evaluating the effectiveness of such systems, but they are not the only ones.
Physiological data obtained through the event related potential technique can complement behavioural
data. Reporting on data from these different methodological approaches, we discuss whether the
system reaches one of its main objectives, i.e. to assist distracted drivers, and then how the system
reliability affects the efficiency of the system and driver’s acceptance. Finally, in the last section of this
chapter certain studies examining the behavioural adaptation to the system are presented.
Specifically, the effects on behaviour due to driving with the system over the time (from the
introduction of the system to long term effects of ADAS use) and the consequences of driving without
the system after a period of habituation to the system are discussed.

Chapitre d’ouvrage
137
12.2 The utility of FCWS
As mentioned above, FCWS have been developed to warn drivers of potential rear-end collisions.
Although the percentage of these collisions resulting in fatalities is relatively low compared to the
percentage of injuries [2], these accidents are one of the most prevalent types of collision, disturbing
traffic flow and representing an important economic cost for society. The environment (e.g. poor
visibility, road type) and the vehicle (e.g. defective brakes) are some of the contributing factors to the
rear-end collisions, in 5 - 11% and 12 - 20% of these accidents, respectively. However, the factor that
most frequently contributes to rear-end collisions is the driver, accounting for between 75 - 93% of the
cases. More precisely, inside the driver category, distraction has been involved in about 60% of the
rear-end collisions [3, 4].
FCWS are based on sensors which continuously monitor certain parameters such as the relative
speed, lateral position and distance between two vehicles. Although a wide variety of algorithms have
been designed to calculate the moment for triggering the warning, most of them are based either on
the time to collision between the obstacle and the following vehicle or on the minimum distance
required to stop the vehicle safely [5]. When a certain threshold value is reached, predicting a potential
risk of collision, the system provides a warning signal (e.g. visual, auditory, and/or tactile) to alert the
driver.
The system, as well as providing assistance by warning the driver (Forward Collision Warning
Systems), can also take an active part in the braking process by preparing and/or by applying partial
or full braking automatically (Forward Collision Avoidance Systems). This active avoidance module
could prevent or reduce the severity of the collision should the driver not react in time or not react at
all. Moreover, the active avoidance system has become more relevant in preventing collisions since it
has been demonstrated that most drivers do not apply enough force on the brake pedal [6] and that a
high percentage of drivers only release the accelerator pedal or even do not react at all [7].
Driving simulators have been one of the most frequent tools used in the evaluation of FCWS and most
research has shown positive effects of the system when drivers are undistracted. This benefit has
been demonstrated, for example, by a reduction of the number of collisions [8], by faster braking
reaction times following the detection of critical situations [9], and by the adoption of longer and safer
headways [10]. Other studies such as Georgi et al. [11], have estimated the benefits of the system by
developing models which apply the algorithm used by the system in real-life accidents. They
categorized three different types of driver: lethargic drivers with the longest reaction times and lowest
decelerations, realistic drivers as an intermediate level, and best drivers with the fastest reaction times
and highest decelerations. According to their predictions, FCWS prevented 74% of collisions for best
drivers, 38% for realistic drivers and 1% for lethargic drivers. In a more ecological context, using a field
operational test, Najm et al. [7] assessed the impact of FCWS and advance cruise control (ACC)
systems for four weeks. 66 drivers drove without the system during the first week to obtain the
baseline and with the system during the remaining three weeks. The results indicated that the
exposure to conflicts (brake or steer at the last-second at a comfortable deceleration), near-crashes

Annexe 1
138
(brake or steer at the last-second at a hard deceleration), and severe near-crashes (minimum time to
collision less or equal to 3s and maximum deceleration greater than 0.3g) in the last period of the test
were reduced in about 20% compared to the first period. Based on different rear-end collision
databases, these authors estimated that the system could prevent about 10% of these accidents.
These studies show a range of benefit from these systems which fluctuates from 10% to 70%
approximately [12]. This wide range could be explained by the different variables considered in these
studies such as the type of system used and its limitations, the methodological approach chosen, the
characteristics of drivers or the weather conditions. Moreover, it is necessary to consider other factors
which can have a direct impact on the effectiveness of the system. In this chapter, the impact of the
system according to the attentional state of drivers as well as the impact of the system as a function of
its reliability level will be analysed. Furthermore, in order to shed light on this aspect, we are going to
consider an alternative research method to the classical behavioural data such as the
electroencephalography and the associated event related potentials.
12.3 A new approach for evaluating the effectiveness of FCWS
Different tools are available for investigating the effect of this kind of assistance system, from the most
fundamental techniques such as simplified simulator experiments conducted in a laboratory, to more
realistic contexts using driving simulators and to almost or real driving conditions such as field
operational tests and naturalistic driving experiments. Among these studies we can highlight the
classical trade-off between experimental control and ecological validity.
Given the difficulty in simulating rear-end collisions in real-life situations, most studies are employing
driving simulators where different scenarios as well as the severity of collisions can easily be
manipulated. Behavioural measures (e.g. reaction time, steering wheel angle, speed) are used most
frequently by researchers in these studies. Not only behavioural data can be recorded in driving
simulators. Often, these measures can be enhanced by other complementary techniques such as the
analysis of information given by drivers (i.e. questionnaires, in-depth interviews) or the analysis of
physiological measures (i.e. electrooculography, galvanic skin response, heart rate,
electroencephalography). Although physiological measures are still not very frequent in driving
simulators, they provide complementary and additional information that in some cases is not
observable in drivers’ behavioural performance. In this part, we therefore will focus on the
electroencephalography (EEG) and the associated Event Related Potential (ERP) techniques.
Electroencephalography is the study of the spontaneous electrical activity of the brain that can be
recorded by electrodes placed on the scalp. Event Related Potentials are obtained from the
electroencephalogram by filtering and averaging the activity time-locked to the stimulus of interest.
The stimulus of interest is repeated a great number of time. The averaging allows reducing the
random noise (i.e. movement artefacts), and so extracting the specific response to the target stimulus.
As a result, a different succession of waves or components appears, depending on the type of
stimulus presented and the nature of the task carried out. These components are usually designated

Chapitre d’ouvrage
139
by a letter (N or P) corresponding to the polarity of the component (Negative or Positive) and a
number corresponding to its position in the chronology (i.e. P1, N1, N2, P2, P3) or the classical
latency of the peak (i.e. N185 corresponds to a negative component peaking around 185 ms following
the stimulus of interest) (see Figure 12.1).
Figure 12.1 Example of a grand-average ERP showing a typical P3 component at parietal areas
This technique presents a high temporal resolution (on the order of milliseconds) which enables the
identification of the different stages of information processing. The first stage of the neural processing
chain can be identified even before the stimulus appears, reflecting the anticipation of a stimulus. For
example, the contingent negative variation (CNV) is a slow negative wave appearing typically when
two stimuli have been presented associated (Figure 12.2). Thus, when the first stimulus or warning
always precedes the second or target stimulus, participants can expect the target stimulus and
prepare their responses due to the appearance of the warning stimulus [13].
Figure 12.2 Example of a grand-average ERP showing a typical CNV component at central areas
In the 200 ms following the stimulus presentation, ERP components such as P1 and N1 have been
linked to sensory processes as well as to the discriminative processing and are mainly modulated by
physical attributes of the stimuli [14]. After about 200 ms, the later ERP components such as N2/P3
are thought to reflect higher cognitive processes. The N2 component is elicited by tasks involving
cognitive control, novelty stimuli, perceptual matching and response conflict, and the attention required
for the processing [15]. The P3 component can be used as an indicator of the attentional resources
allocation and working memory updating [16, 17]. In general, it is possible to identify differences
between experimental conditions by analysing the differences in ERP in terms of peak amplitude
and/or peak latency of the ERP components of interest. In a broader sense, differences in peak
amplitude of the wave could indicate the different degree of attentional resources engaged in the

Annexe 1
140
processing of the stimulus, and differences in peak latency of the wave (earlier or later occurrence in
time) could be related to the speed of stimulus information processing.
The implementation of the ERP technique in driving studies is not widespread due to some
constraints, such as the high saccadic and motor movement sensitivity and the high number of trial
repetitions required in order to reach an acceptable signal-to-noise ratio. Despite these constraints,
there are a few ERP simulator studies which mainly investigate the negative effect of performing a
concurrent cognitive task while driving [18, 19]. Nevertheless this technique has been implemented
only recently in the study of advanced driver assistance systems and, specifically, in the study of
FCWS [20].
12.4 Are FCWS effective for distracted drivers?
The major contributing factor to rear-end collisions is driver distraction or inattention. Therefore, if
FCWS are expected to help distracted drivers in particular, the effectiveness of these systems should
be evaluated according to the attentional state of the drivers, distracted or not.
Regan et al. [21] define driver inattention as ‘insufficient or no attention to activities critical for safe
driving (p.5)’. Driver distraction, or driver-diverted attention, is a type of driver inattention where the
attention to activities critical for safe driving is threatened by the diversion towards another competing
activity. These competing activities can require cognitive, perceptual (i.e. visual, auditory), and/or
motor resources, identifying the different distraction categories. Secondary visuo-motor tasks seem to
produce the higher degree of interference with the driving task, although this could be mitigated by
compensatory strategies. For example, visual concurrent tasks tend to impair lane keeping
performance and increase the number of off-road glances but also induce speed reductions, whereas
cognitive tasks generally provoke the opposite effect of visual concurrent tasks [22, 23].
Several reports have focused on the impact of FCWS on distracted drivers, but few studies have
compared the distraction condition with the control situation (without any distraction); that is, assessing
the impact of FCWS on distracted and also undistracted drivers. Data obtained in simulators show that
distracted drivers also benefit from the warning systems by the reduction of the number of collisions
[8], by faster braking reaction times in detecting critical situations [24], and/or by longer and safer
headways [25]. Moreover, in some cases, the system even completely dissipates the negative effect
of the secondary task [8, 26].
Electrophysiological studies have been recently conducted in driving contexts in order to assess the
impact of secondary tasks. For example, Strayer and Drews [18] found that in a task where
participants had to react to intermittent lead vehicle decelerations, the P3 amplitude was reduced and
the P3 latency was delayed when they were engaged in phone conversations, suggesting a negative
impact on the driving task when the memory load increased. Similarly, Rakauskas et al. [19] studied
the impact of secondary tasks while driving and detecting unexpected sounds (oddball paradigm).

Chapitre d’ouvrage
141
They found that the P3 amplitude to novel sounds was especially reduced by a cognitive secondary
task presented by cell-phone, showing that the processing of novel information is deteriorated by the
dual task. In the context of FCWS, the ERP technique was introduced only recently by Bueno et al.
[20]. These authors conducted an ERP study in a simplified driving simulator to evaluate the impact of
a surrogate FCWS according to the attentional state of the participants, distracted or not by a
secondary cognitive task. Participants were instructed to follow a lead motorcycle and they had to
react by decelerating when the brake light (target) of the lead motorcycle was lit up. An auditory
warning could forewarn participants that the motorcycle was going to brake soon. The results showed
that the warning system reduced the reaction time when participants were undistracted but not when
they were distracted. ERP data showed a benefit from the warning system at higher cognitive level
(N2) suggesting that the warning could enhance the temporal expectancy regarding the target.
However, and in parallel to behavioural data, this effect was only observed in simple task condition
and not when participants were distracted. A possible explanation for this unexpected result could
come from the experimental design. Indeed, an initial deceleration of the motorcycle occurred
systematically before braking in all trials, whether or not the braking was preceded by the warning
signal. Thus, participants may have used this motorcycle deceleration as an additional and better
predictor of the brake light occurrence instead of the warning signal which was not always reliable.
Therefore, in a recent study, Bueno et al [27] eliminated the predictive value of this motorcycle
deceleration for the forthcoming brake light in order to increase the effectiveness of the FCWS under
dual task conditions. The results indicated that participants were faster when they had available the
warning signal compared to when no warning signal was given. At the electrophysiological level, this
warning effect occurred at preparatory (increase of the amplitude of the CNV) and higher cognitive
level (reduction of the peak latency of the P3). In addition, a strong negative impact of the secondary
task was observed at behavioural and electrophysiological level with or without the system. This result
suggests that the presence of the warning was not enough to compensate the negative effect of the
dual task.
These last two studies have contributed to an increase in the knowledge about the processing of
warning signals in driving. According to these results, it seems that the warning signal intervenes in
motor preparation process (CNV) and higher cognitive processing (P3). These findings are also
consistent with the findings of earlier non-driving studies showing warning signal operates in the stage
of response selection [28] and that it could reduce the peak latency of the P3 [29].
Contrary to the positive effects on distracted drivers presented at the beginning of this section, the last
two studies analysed here [20, 27] showed that the warning system was not always effective when
drivers were distracted. Therefore, at present it is not clear whether these systems achieve their main
purpose of mitigating the negative effects of the distraction. Although conclusions could not be drawn
due to the limited number of studies evaluating the impact of the FCWS in distracted and undistracted
drivers and their diverse methodology employed, there are some relevant questions to be considered.

Annexe 1
142
Firstly, given that secondary tasks can differ in modality (visual, auditory, cognitive, etc.) and
complexity level, the effectiveness of the system could vary depending on the type and difficulty of the
secondary task. It could be possible that the dual task interferes with the warning signal when both
warning and secondary task share the same modality. It is known that in dual task paradigms, the
likelihood of interference produced when performing two tasks from the same modality (e.g. both tasks
are auditory) is higher than when these tasks belong to different modalities (e.g. visual and auditory)
[30]. As a result, the effectiveness of an auditory warning could see reduced if, for example, drivers
are distracted by a secondary auditory task. Thus, auditory and visual-auditory warnings seem to be
effective in helping drivers to detect potential collisions when they are distracted by a visual secondary
task [8, 24, 26]. However, when the nature of the secondary task is auditory (i.e. phone conversations)
and also when the complexity of the task increases (i.e. mental mathematics and categorisation
questions), an auditory warning seems less effective than a tactile warning [31].
Secondly, from research using driving simulators [32] or ERP approach (but in non-driving related
contexts [33]), multimodal warnings seem to be more effective that unimodal warnings. Indeed,
receiving redundant warnings from two different modalities could be advantageous in the case of
distraction or in the case of warning failures.
Finally, the difficulty level of the secondary task could also undermine the effectiveness of the warning
system. It is known that the amount of attentional resources available is considerably reduced by the
presence of another competitive task [30, 34]. When secondary tasks are highly demanding on a
cognitive level, it might be possible that participants need to invest a lot of attentional resources to
dealing with both tasks at the same time. Consequently, it is possible that the warning signal cannot
be completely processed given the lack of attentional resources available, as could have occurred in
the study of Bueno et al. [20]. In another study conducted in our laboratory, we investigated the impact
of the difficulty of the secondary task on the effectiveness of the warning system. In this study in a
driving simulator, only behavioural measures were recorded. The results showed an increase in the
reaction time (RT) when participants were distracted by a high difficulty cognitive secondary task, but
also when they were distracted by a low difficulty secondary task. However, when the warning system
was available, RTs were shorter than the baseline (no warning, no distraction) only in the condition of
low difficulty distraction, suggesting that the benefit from the system, at least partly, depends on the
drivers’ attentional resources available (manuscript in preparation). This result could support the
hypothesis that warning signals are not treated automatically and need attentional resources to be
processed.
12.5 Does the reliability of the system affect its effectiveness?
Besides drivers' attentional state, the effectiveness and acceptance of the system and driver
behaviour may also be affected by the reliability level of the system. Indeed, depending on the type of
algorithm and scan sensor, the system may malfunction, producing false alerts and/or misses of
critical events. False alerts refer to the situations in which an alert is issued in the absence of any

Chapitre d’ouvrage
143
potential collision, for example, when there are highly reflective objects. Nuisance alerts can be
defined as alerts triggered in an appropriate situation but perceived by drivers as inappropriate
because of their frequency, timing, intensity or modality [35]. Nuisance alerts can also be considered
as alerts triggered in an inappropriate situation but whose origin could be justified by the presence of a
potential threat (i.e. an alert triggered by a stationary vehicle placed out of or near the driver’s line)
[36]. Misses occur when an alert is not triggered despite the situation requiring it. Such failures are
due to the fact that the capacity to detect obstacles could be limited in situations such as bad weather,
detecting two-wheeled vehicles, pedestrians, stationary obstacles or very slow-moving vehicles,
swerving vehicles or vehicles in bends, abrupt accelerating or decelerating. Because of these
limitations, no FCWS currently works perfectly.
Real data about the false alert and miss rates are not frequent in the literature, but the existing data
suggests that this rate is still far from acceptable. As already mentioned, Najm et al. [7] collated data
from drivers who drove with a vehicle fitted with Advance Cruise Control and FCWS during one month.
Their results showed that 44% of the alerts were false alerts and only 56% of all warnings were
triggered by in-path targets (whether all of these alerts were necessary or not is unknown).
McLaughlin et al. [37] evaluated the algorithm used in the previous study using real-crash data and
compared it with two other algorithms. Their results showed a benefit from the first system of about
60%. However, this algorithm also accounted with the higher warning frequency, 87 alerts per 161 km
driven, compared to the two other algorithms, 83 and 8 alerts per 161 km driven, respectively. Taking
into account the recommendation that no more than one nuisance alert per 322 km would be an
acceptable rate [38], the data presented above is not very encouraging.
Drivers’ trust in the warning system could be considerably undermined if the number of nuisance or
false alerts is too high, because these alerts are irritating and distractive [39]. As a result, the
acceptance of the warning could be reduced and, therefore, it is likely that users ignore or react
inadequately to further warnings, whether or not they are valid [40]. Moreover, concerning behavioural
changes in drivers’ performance, false alerts seem to lengthen the braking reaction time [41] and to
induce unnecessary deceleration responses [39]; however, a higher false alerts rate could be
associated with increases in the speed since drivers would tend to ignore the warning [42]. Misses are
also critical for the acceptance and trust in the system and drivers’ performance could be affected by
longer reaction times, even longer than driving with no system at all [41]. In addition, the speed could
decrease with the increase of the misses which has been interpreted as a reduction of drivers’ trust on
the system [43].
Besides the rate of false alerts and misses, hit alerts (alerts delivered when a potential collision is
imminent) could also be considered as ineffective depending on the timing in which the alert is
triggered. In general, early alerts are more effective and account with a higher acceptance level by
drivers than late alerts, but if they are prompted too early, they can be considered as nuisance or false
alerts [44].

Annexe 1
144
However not all false alerts and misses have negative effects. For example, nuisance alerts can
improve the knowledge that drivers have about the way the system functions [36]. In addition, if a
system never triggers a false alert, drivers could fail to react adequately when the first hit alert occurs
[45]. On the other hand, if a system almost never fails to detect a potential collision, drivers may over-
rely on it and become vulnerable or not react adequately, when, for example, driving another
unequipped vehicle [45]. It is complicated to assess which level of false alerts/misses is acceptable,
given that the probability of experiencing a rear-end collision is quite low, and the efforts for finding out
the cut-off point have not been very conclusive as yet [38, 40].
Other studies have investigated the reliability of the system focusing on the percentage of true alerts
without specifying the rate of false alerts or misses. In general, higher levels of reliability result in
better performance, but the point where the system becomes useless remains uncertain. Bliss and
Acton [46] noted that participants responded more frequently to the warning and manoeuvred more
appropriately in avoiding collisions when the warning was 100% reliable. Nevertheless, Maltz and
Shinar [39] and Ben-Yaacov et al. [10] did not find any differences between systems reliable at 60, 80-
85, and 90-95%. Subsequently, Wickens and Dixon [47] carried out a meta-analysis of twenty two
studies and concluded that a reliability level of 70% could be the criterion from which a system can be
considered as an aid in avoiding rear-end collisions.
Finally, it should be noted that failures of the system could have different effects depending on certain
driver characteristics such as age, driving experience [36], or attentional state. For example, an alert
triggered too early could be considered as a nuisance alert for an undistracted driver but it could be a
hit alert for a distracted driver. Abe et al. [25] discovered that drivers rated alerts as less unnecessary
when they were distracted by a secondary visual task than when they were undistracted. Thus, it
seems that distracted drivers try to compensate their lack of attentional resources by the aid of the
system. Maltz and Shinar [48] did not find any differences in distracted groups with regard the
percentage of the time spent in a danger or safe zone according to the reliability of the system (high,
medium, and low reliability or 1, 4, and 8 errors per minute, respectively). Nevertheless, the analysis of
drivers’ performance in case the system failed to deliver an alert showed a higher rate of deceleration
responses in the danger zone by the low reliability group compared to the medium and high reliability
groups and control group. This result could suggest that even when distracted, drivers can adopt a
safe behaviour when the system frequently fails in detecting the hazard; however, when the system is
highly reliable, drivers did not compensate the error of the system. As in the Malt and Shinar study
[48], Bueno et al. [20] analysed the reliability level of an FCWS (100% or 70% reliable) in drivers
distracted by a secondary cognitive task but they also analysed this in undistracted drivers.
Behavioural data showed that reliable and unreliable systems only reduced RT when drivers were
undistracted but not when they were distracted. However, the analysis of the electrical activity of the
brain revealed a slightly different pattern of results. ERP data showed a reduction in the amplitude and
the latency of the N2 by the reliable system in simple task condition; whereas the unreliable system
reduced the latency of the P3 in dual task condition. These results could be interpreted as an increase
of the expectancy of the target in the first case and a diminution of the time required for processing the

Chapitre d’ouvrage
145
target at higher cognitive level, in the second case. In parallel to Maltz and Shinar’s study [48] but with
all due caution, it could be speculated that less reliable systems are more effective than more reliable
systems in dual task situations. Nevertheless, further research is needed to shed light on these
phenomena.
As it has been discussed here, the cut-off between a reliable and an unreliable system does not seem
to be determined exclusively by the characteristics of the system (level of reliability, type of warning
signal, etc.) but also by some driver characteristics such as the attentional state.
12.6 Behavioural adaptation to the system
The last factor addressed in this chapter is the behavioural adaptation defined as “those behaviours
which may occur following the introduction of changes to the road-vehicle-user system and which
were not intended by the initiators of the change (p.23)” [49]. Given its repercussion for road safety,
the behavioural adaptation to the assistance system has a market negative connotation, although a
wider vision could be adopted by considering all relevant changes associated to the introduction of the
assistance system [50].
To our knowledge, there are no studies evaluating the behavioural adaptation to the FCWS using ERP
data; therefore, only behavioural studies will be considered in this section.
As previously discussed, the introduction of an FCWS can produce different effects on drivers’
behaviour. Some of them are positive, such as faster reaction times and the reduction of collisions.
However, undesirable behavioural changes can also appear, sometimes as a consequence of the
interaction with other factors such as the attentional state of the driver or the reliability level of the
system. For example, drivers could engage in more secondary tasks or even assume more risky
behaviours by delegating the danger monitoring task to the system (compensatory effects). This could
have unintended consequences such as an increase in the brake reaction time in the case of a real
collision or in the case of the system failing to warn drivers. Concerning the failures of the system,
false alerts could increase the driving speed and reaction times and a reduced miss rate could lead to
over-relying on the system.
In general, FCWS have been analysed in short-term studies and, in most of the cases, the effect of
introducing the system could not have been assessed in experimental studies because the order
effects were eliminated by the counterbalancing. Therefore, at present it is not fully understood how
drivers adapt their behaviour to the system in the first-time uses (learning and appropriation phase),
nor after a prolonged use during a long period of time (integration phase) [51]. Moreover, other factors
could have an influence on the adaptation to the system, such as traffic conditions, driver
characteristics and some attitudes and personality traits like driving style, sensation seeking, and the
locus of control (internal or external responsibility attribution for the outcome of events). Jamson et al.
[51] conducted a driver simulator study to analyse the benefits of an FCWS taking into account the

Annexe 1
146
driver style, with higher or lower sensation seekers. Their results showed a positive effect of the
system compared to the baseline; however, the driver style had little or no impact.
To our knowledge, only one study has been carried out showing the behavioural effect of an FCWS in
the long term in a field operation test [10]. In this study, participants had to drive in real traffic
conditions with the system (2nd trial) and without it (1st and 3rd trials, and 4th trial six months later).
Safer time headway was observed immediately after exposure to the system (3rd trial). Interestingly,
this effect was also observed six months later when participants were exposed again to the same
drive without the warning assistance. We have also analysed the behavioural effect of an FCWS in the
short term in a driving simulator study. Participants were required to drive without the system during
the first session (baseline). Then, the system was introduced in the second, third, and fourth sessions
in order to evaluate the immediate effect of introducing an FCWS and the behavioural adaptation to
the system in the short term. Finally, participants drove without the system during the fifth l session to
analyse the consequences of switching off the system after a short period of habituation. The results
showed that the introduction of the system drastically reduced the reaction time during the second
session compared with the control group who drove without any assistance. During the integration
phase (sessions two and three), reaction times were also faster for the system group than for the
control group. Finally, results showed longer reaction times during the last session (with the system
switched off), with an increase especially noticeable for the system groups. This last result may
provide evidence for the disruptive effect of driving without the warning system, for example, by a
system breakdown, once the driver is accustomed to driving with the system. Nevertheless, the control
group showed a progressive increment of the reaction time along the five sessions which could be
interpreted as a practice and/or fatigue effect. Therefore, it was not possible to conclude whether the
longer reaction times for the system groups were completely explained by the absence of the system.
As there are not many studies in this respect, further research would be necessary to investigate the
effects of driving with or without the system after the integration phase.
Although the number of studies and the situations evaluated are not sufficient to draw final
conclusions, it is interesting to observe that among these studies no negative behavioural adaptation
effects were evidenced. It could be possible that compensatory effects when driving with an FCWS
are more difficult to reproduce than when driving with other systems. Rear-end collisions are relatively
infrequent situations compared to, for example, monitoring excessive speed or lane departure.
Moreover, given the safety risk involved in these collisions, it could be more difficult for drivers to rely
completely on the system. Certainly the reliability level can have a strong impact on the behavioural
adaptation to the system. However it has been demonstrated that unreliable systems can also be
useful in terms of assistance for drivers.
Psychology of learning could enable interpretation of why unreliable systems can be effective. The
association between the warning (stimulus 1) and the hazard (stimulus 2) is produced in very different
contexts (i.e. high traffic flow, good or bad weather conditions, secondary tasks, etc.). Moreover,
drivers learn that the causal relation between the two stimuli is not perfect. Indeed, as discussed

Chapitre d’ouvrage
147
earlier, the perfect system does not exist. Therefore, the presence of false alerts and misses produces
an intermittent reinforcement of the warning and, consequently, more resistance to extinction [52].
Nevertheless, given the limited number of studies in this regard, further research would be necessary
in order to determine the positive and negative effects of FCWS used in the short and long term.
12.7 Conclusions
This chapter aimed at reviewing literature assessing the effectiveness of FCWS. Although it has been
shown that the system provides potential benefits for road safety, certain factors such as the
attentional state of drivers and the reliability level of the system can mitigate its effectiveness. Further
research seems necessary to clarify whether the system helps distracted drivers by manipulating the
difficulty level of the secondary tasks and the type of warnings. If, as it has been hypothesised here,
the processing of the warning information is not an automated task and needs some attentional
resources, it is possible that a training program could optimise drivers’ performance when driving with
the system.
The reliability of the system is likely to be one of the most critical factors for the acceptance of the
system by drivers. Although failures of the system can have a positive impact for road safety, it is
necessary to find a good balance to avoid drivers deciding not to use it. Probably one of the most
negative effects of behavioural adaptation could be over-reliance. The studies presented in this
chapter did not show evidence of this phenomenon in drivers; however, currently there are only a few
studies and, therefore, more research assessing behavioural adaptation after short and long-term use
needs to be conducted.
Finally, ERP studies have shown to be promising in the analysis of the effectiveness of FCWS. Until
now, FCWS had been mainly studied by recording measures of driver performance and, eventually, by
analysing the visual behaviour of drivers. The ERP technique permits to elucidation and dissociation of
the different stages of the information processing, some of which are not observable in open
behaviour. Thus, the results showed in the studies presented above revealed that the warning signal
could operate at preparatory (CNV) and higher cognitive stages (P3).
Throughout this chapter, it has been shown that the effectiveness of the FCWS and its acceptance by
drivers depend on numerous factors. On the one hand, factors that directly affect the effectiveness of
the system can come from the system itself. For instance, the moment for triggering the warning, the
reliability level of the system or the modality of the warning (visual, auditory) are critical elements to
take into consideration. But even the “best” of the systems in terms of technical parameters could not
be appropriated for certain drivers. It has been demonstrated that the effectiveness of the system
could vary according to the attentional state of the driver. The different driving style, age, experience
or health status of drivers should also be considered in order to insure that specific populations, for
example, older drivers, could benefit as expected from these systems. Moreover, one of the issues
evidenced in some of the studies above presented has been the large inter-individual variability

Annexe 1
148
observed among the same type of drivers. Therefore, we strongly recommend developing adaptive
FCWS which take such characteristics into account.
Acknowledgements
The research leading to these results has received funding from the European Community's Seventh
Framework Program (FP7/2007-2013) under grant agreement n°238833/ ADAPTATION project.
www.adaptation-itn.eu
References
1 'Regulation (EC) No 661/2009 of the European Parliament and of the Council of 13 July 2009
concerning type-approval requirements for the general safety of motor vehicles, their trailers and
systems, components and separate technical units intended therefor'. 2009
2 United Nations. Statistics of road traffic accidents in Europe and North America. Geneva, 2007
3 Knipling R.R., Wang J.S., Yin H.M. Rear-end Crashes: Problem size assessment and statistical
description. Washington, DC: National Highway Traffic Safety Administration, DOT HS 807-994,
1993
4 Vogel L., Bester C.J. 'A relationship between accident types and causes'. 24th Southern African
Transport Conference; South Africa, 2005
5 Bella F, Russo R. A Collision Warning System for rear-end collision: a driving simulator study.
Procedia - Social and Behavioral Sciences. 2011;20(0):676-86
6 Breuer J.J., Faulhaber, A., Frank, P., Gleissner, S. 'Real world safety benefits of brake assistance
systems'. 20th International Technical Conference on the Enhanced Safety of Vehicles (ESV);
Lyon, 2007
7 Najm W.G., Stearns M.D., Howarth H., Koopmann J., Hitz J. 'Evaluation of an automotive rear end
collision avoidance system'. Cambridge: National Highway Traffic Safety Administration. 2006
8 Lee J.D., McGehee D.V., Brown T.L., Reyes M.L. 'Collision Warning Timing, Driver Distraction, and
Driver Response to Imminent Rear-End Collisions in a High-Fidelity Driving Simulator'. Human
Factors: The Journal of the Human Factors and Ergonomics Society. 2002;44(2):314-34
9 Abe G., Richardson J. 'Alarm timing, trust and driver expectation for forward collision warning
systems'. Applied Ergonomics. 2006;37(5):577-86
10 Ben-Yaacov A., Maltz M., Shinar D. 'Effects of an In-Vehicle Collision Avoidance Warning System
on Short- and Long-Term Driving Performance'. Human Factors: The Journal of the Human Factors
and Ergonomics Society. 2002;44(2):335-42
11 Georgi A., Zimmermann, M., Lich, T., Blank, L., Kickler, N., Marchthaler, R. 'New approach of
accident benefit analysis for rear end collision avoidance and mitigation systems'. 21st International
Technical Conference on the Enhanced Safety of Vehicles; Germany, 2009
12 Anderson R.W.G., Doecke S.D., Mackenzie J.R.R., Ponte G., Paine D., Paine M. Potential benefits
of forward collision avoidance technology. South Australia: Centre for Automotive Safety Research,
CASR0106, 2012

Chapitre d’ouvrage
149
13 Loveless N.E. 'The contingent negative variation related to preparatory set in a reaction time
situation with variable foreperiod'. Electroencephalography and Clinical Neurophysiology.
1973;35(4):369-74
14 Vogel E.K., Luck S.J. 'The visual N1 component as an index of a discrimination process'.
Psychophysiology. 2000;37(2):190-203
15 Folstein J.R., Van Petten C. 'Influence of cognitive control and mismatch on the N2 component of
the ERP: A review'. Psychophysiology. 2008;45(1):152-70
16 Polich J. 'Updating P300: an integrative theory of P3a and P3b'. Clinical Neurophysiology.
2007;118(10):2128-48
17 Kok A. 'On the utility of P3 amplitude as a measure of processing capacity'. Psychophysiology.
2001;38(3):557-77
18 Strayer D.L., Drews F.A. 'Multi-tasking in the automobile' in Kramer A, Wiegmann D, Kirlik A.
(eds.). Applied Attention: From Theory to Practice. New York: Oxford University Press; 2007. pp.
121-33
19 Rakauskas M.E., Ward N.J., Bernat E.M., Cadwallader M., Patrick C.J., de Waard D.
'Psychophysiological measures of driver distraction and workload while intoxicated'. 3rd
International Symposium on Human Factors in Driver Assessment, Training, and Vehicle Design;
Rockport, Maine, 2005
20 Bueno M., Fabrigoule C., Deleurence P., Ndiaye D., Fort A. 'An electrophysiological study of the
impact of a Forward Collision Warning System in a simulator driving task'. Brain Research.
2012;1470:69-79
21 Regan M.A., Hallett C., Gordon G.P. 'Driver distraction and driver inattention: Definition,
relationship and taxonomy'. Accident Analysis and Prevention. 2011;43:1771-1781
22 Engström J., Johansson E., Östlund J. 'Effects of visual and cognitive load in real and simulated
motorway driving'. Transportation Research Part F: Traffic Psychology and Behaviour.
2005;8(2):97-120
23 Kaber D.B., Liang Y., Zhang Y., Rogers M.L., Gangakhedkar S. 'Driver performance effects of
simultaneous visual and cognitive distraction and adaptation behavior'. Transportation Research
Part F: Traffic Psychology and Behaviour. 2012;15(5):491-501
24 Kramer A.F., Cassavaugh N., Horrey W.J., Becic E., Mayhugh J.L. 'Influence of Age and Proximity
Warning Devices on Collision Avoidance in Simulated Driving'. Human Factors: The Journal of the
Human Factors and Ergonomics Society. 2007;49(5):935-49
25 Abe G., Itoh M., Yamamura T. 'Visual distraction when driving and its influence on driver response
to a forward collision warning system'. SICE Annual Conference 2011; Tokyo, Japan, 2011
26 Ho C., Spence C. 'Using peripersonal warning signals to orient a driver’s gaze'. Human Factors:
The Journal of the Human Factors and Ergonomics Society. 2009;51(4):539-56
27 Bueno M., Fort A., Francois M., Ndiaye D., Deleurence P., Fabrigoule C. 'Effectiveness of a
Forward Collision Warning System in simple and in dual task from an electrophysiological
perspective'. Neuroscience Letters. 2013;541:219-23
28 Hackley S.A., Valle-Inclán F. 'Which stages of processing are speeded by a warning signal?'.
Biological Psychology. 2003;64(1–2):27-45

Annexe 1
150
29 Rudell A.P., Hu B. 'Does a warning signal accelerate the processing of sensory information?
Evidence from recognition potential responses to high and low frequency words'. International
Journal of Psychophysiology. 2001;41(1):31-42
30 Wickens C. 'The structure of attentional resources' in Nickerson R. (ed.). Attention and
performance. Hillsdale, NJ: Lawrence Erlbaum; 1980. pp. 239-57
31 Mohebbi R., Gray R., Tan H.Z. 'Driver Reaction Time to Tactile and Auditory Rear-End Collision
Warnings While Talking on a Cell Phone'. Human Factors: The Journal of the Human Factors and
Ergonomics Society. 2009;51(1):102-10
32 Ho C., Reed N., Spence C. 'Multisensory In-Car Warning Signals for Collision Avoidance'. Human
Factors: The Journal of the Human Factors and Ergonomics Society. 2007;49(6):1107-14
33 Santangelo V., Van der Lubbe R., Olivetti Belardinelli M., Postma A. 'Multisensory integration
affects ERP components elicited by exogenous cues'. Experimental Brain Research.
2008;185(2):269-77
34 Baddeley A.D. 'Exploring the central executive'. The Quarterly Journal of Experimental Psychology.
1996;49A(1):5-28
35 Campbell J.L., Richard C.M., Brown J.L., McCallum M. Crash Warning System Interfaces: Human
Factors Insights and Lessons Learned Washington, DC National Highway Traffic Safety
Administration, 2007
36 Lees M. Context conditions drivers' disposition towards alarms. PhD thesis. Iowa: University of
Iowa; 2010
37 McLaughlin S.B. Analytic Assessment of Collision Avoidance Systems and Driver Dynamic
Performance in Rear-End Crashes and Near-Crashes Virginia Virginia Polytechnic Institute and
State University; 2007
38 Kiefer R.J., LeBlanc D., Palmer M., Salinger J., Deering R., Shulman M. Forward Collision Warning
Systems: Development and Validation of Functional Definitions and Evaluation Procedures for
Collision Warning/Avoidance Systems. Washington, DC: National Highway Traffic Safety
Administration, DOT HS 808-964, 1999
39 Maltz M., Shinar D. 'Imperfect in-vehicle collision avoidance warning systems can aid drivers'.
Human Factors. 2004;46(2):357-66
40 Lerner N.D., Dekker D.K., Steinberg G.V., Huey R.W. Inappropriate Alarm Rates and Driver
Annoyance. Washington, DC National Highway Traffic Safety Administration, DOT HS 808-533,
1996
41 Abe G., Itoh M., Tanaka K. 'Dynamics of drivers' trust in warning systems'. 15th IFAC World
Congress; Barcelona, Spain, 2002
42 Cotté N., Meyer J., Coughlin J.F. 'Older and Younger Drivers' Reliance on Collision Warning
Systems'. Human Factors and Ergonomics Society Annual Meeting Proceedings. 2001;45:277-80
43 Yamada K., Kuchar J.K. 'Preliminary study of behavioral and safety effects of driver dependence
on a warning system in a driving simulator'. Systems, Man and Cybernetics, Part A: Systems and
Humans, IEEE Transactions on. 2006;36(3):602-10

Chapitre d’ouvrage
151
44 Abe G., Richardson J. 'The effect of alarm timing on driver behaviour: an investigation of
differences in driver trust and response to alarms according to alarm timing'. Transportation
Research Part F: Traffic Psychology and Behaviour.2004;7(4-5):307-22
45 Parasuraman R., Hancock P.A., Olofinboba O. 'Alarm effectiveness in driver-centred collision-
warning systems'. Ergonomics. 1997;40(3):390-99
46 Bliss J.P., Acton S.A. 'Alarm mistrust in automobiles: how collision alarm reliability affects driving'.
Applied Ergonomics. 2003;34(6):499-509
47 Wickens C.D., Dixon S.R. 'The benefits of imperfect diagnostic automation: a synthesis of the
literature'. TTIE. 2007;8(3):201-12
48 Maltz M., Shinar D. 'Imperfect in-vehicle collision avoidance warning systems can aid distracted
drivers'. Transportation Research Part F: Traffic Psychology and Behaviour. 2007;10(4):345-57
49 OECD. Behavioural adaptations to changes in the road transport system. Paris: Organisation for
Economic Co-operation and Development, 1990
50 Saad F., Hjälmdahl M., Cañas J., Alonso M., Garayo P., Macchi L., et al. Literature review of
behavioural effects. Brussels: Information Society Technologies, 2004
51 Jamson A.H., Lai F.C.H., Carsten O.M.J. 'Potential benefits of an adaptive forward collision
warning system'. Transportation Research Part C: Emerging Technologies. 2008;16(4):471-84
52 Mackintosh N.J. The psychology of animal learning. New York: Academic Press; 1974


ANNEXE 2
153
Annexe 2 : Liste de publications
ARTICLES DANS DES REVUES INTERNATIONALES
Bueno, M., Fabrigoule, C., Ndiaye, D., and Fort, A. (soumis). Behavioural adaptation to a Forward Collision Warning System: learning and distraction effects. A soumettre à Transportation
Research Part F: Traffic Psychology and Behaviour
Bueno, M., Fort. A., Francois, M., Ndiaye, D., Deleurence, P., and Fabrigoule, C. (2013). Effectiveness of a Forward Collision Warning System in simple and dual task from an electrophysiological perspective. Neuroscience Letters, 541, 219-223
Fort, A., Collette, B., Bueno, M., Deleurence, P., and Bonnard, A. (2013). Impact of totally and partially predictive alert in distracted and undistracted subjects: An event related potential study. Accident Analysis & Prevention, 50, 578-586.
Bueno, M., Fabrigoule, C., Deleurence, P., Ndiaye, D., and Fort, A. (2012). An electrophysiological study of the impact of a Forward Collision Warning System in a simulator driving task. Brain
Research, 1470, 69-79
OUVRAGES SCIENTIFIQUES
Bueno, M., Fabrigoule, C., and Fort, A. (2014). Effectiveness of Forward Collision Warning System: a contribution from the cognitive analysis combining behavioural and electrophysiological measure. In A Stevens, C Brusque & J Krems (Eds). Driver adaptation to information and
assistance systems. IET published book. ISBN: 978-1-84919-639-0; E-ISBN: 978-1-84919-640-6
Huth, V., Bueno, M., Fort, A., and Brusque, C. (2014). Synthesis of new knowledge on driver’s adaptation processes in response to ADAS issued from the ADAPTATION project. In A Stevens, C Brusque & J Krems (Eds). Driver adaptation to information and assistance
systems. IET published book. ISBN: 978-1-84919-639-0; E-ISBN: 978-1-84919-640-6

Annexe 2
154
COMMUNICATIONS AVEC ACTES DANS UN CONGRES INTERNATIONAL
Bueno, M., Fort, A., Deleurence, P., Ndiaye, D., and Fabrigoule, C. (2012). Evaluation of a surrogate Forward Collision Warning System in an electrophysiological perspective. In: Valero, P., Pace, J.P., Mendoza, L. (eds.) Proceeding of European Conference on Human Centred Design for
Intelligent Transport Systems, pp. 267-273. Humanist Publications
COMMUNICATIONS SANS ACTES DANS UN CONGRES INTERNATIONAL
Bueno, M., Fort, A., Ndiaye, D., Deleurence, P., Francois, M., and Fabrigoule. C. Effect of Forward Collision Warning System on information processing: Electrophysiological approach. 5
th
International Conference on Traffic and Transport Psychology (ICTTP), Groningen (The Netherlands), August, 29-31, 2012
Bueno, M., Fort, A., Collette, B., Deleurence, P., Bonnard, A., and Fabrigoule. C. Impact of simulated Forward Collision Warning System while driving: an event related potential study. 2
nd
International Conference on Driver Distraction and Inattention, Göteborg, September, 5-7, 2011


IMPACT D’UN SYSTEME ANTICOLLISION SUR LE TRAITEMENT DE L'INFORMATION
ET LE COMPORTEMENT DU CONDUCTEUR
Ce travail de thèse a été centré sur l’analyse de l’impact d’un système d’alerte anticollision sur
le traitement de l’information et le comportement du conducteur en conduite automobile
simulée. Les objectifs de ce travail étaient 1) de déterminer l’impact d’un signal avertisseur
associé à un système d’alerte anticollision sur le traitement de l’information à partir de potentiels
évoqués ; 2) d’analyser l’efficacité d’un tel système en fonction de sa fiabilité ; 3) et en fonction
de l’état attentionnel des conducteurs ; et 4) d’examiner l’adaptation comportementale au
système au cours du temps.
Grâce à une double approche comportementale et électrophysiologique, nous avons montré
que le signal avertisseur agit au niveau de l’anticipation et de la préparation à la réponse ainsi
qu’au niveau cognitif du traitement de l’information. Par ailleurs, nous avons confirmé que les
systèmes anticollision ne nécessitent pas d’être complètement fiables pour être efficaces. Nous
avons également observé que l’efficacité du signal avertisseur associé au système
anticollision était moindre chez les sujets distraits, notamment lorsque la charge cognitive
associée à la distraction était élevée. Ceci suggère que le signal avertisseur nécessite des
ressources attentionnelles pour être traité et, donc, pour être efficace. Concernant l’adaptation
comportementale au système, les principaux résultats ont montré, d’une part, que l’introduction
immédiate du système a eu un effet positif sur le comportement de conduite et, d’autre part,
que le processus d’adaptation au système à plus long terme peut être affecté si les conducteurs
sont distraits par des tâches secondaires coûteuses en ressources attentionnelles.
Mots clés :
Signal avertisseur, conduite simulée, traitement de l’information, potentiels évoqués, fiabilité,
distraction, adaptation comportementale.