impact evaluation of three types of early...
TRANSCRIPT

Policy Research Working Paper 6540
Impact Evaluation of Three Types of Early Childhood Development Interventions
in CambodiaAdrien Bouguen
Deon FilmerKaren MacoursSophie Naudeau
The World BankDevelopment Research GroupHuman Development and Public Services Team &Education TeamEast Asia and Pacific RegionJuly 2013
WPS6540P
ublic
Dis
clos
ure
Aut
horiz
edP
ublic
Dis
clos
ure
Aut
horiz
edP
ublic
Dis
clos
ure
Aut
horiz
edP
ublic
Dis
clos
ure
Aut
horiz
edP
ublic
Dis
clos
ure
Aut
horiz
edP
ublic
Dis
clos
ure
Aut
horiz
edP
ublic
Dis
clos
ure
Aut
horiz
edP
ublic
Dis
clos
ure
Aut
horiz
ed

Produced by the Research Support Team
Abstract
The Policy Research Working Paper Series disseminates the findings of work in progress to encourage the exchange of ideas about development issues. An objective of the series is to get the findings out quickly, even if the presentations are less than fully polished. The papers carry the names of the authors and should be cited accordingly. The findings, interpretations, and conclusions expressed in this paper are entirely those of the authors. They do not necessarily represent the views of the International Bank for Reconstruction and Development/World Bank and its affiliated organizations, or those of the Executive Directors of the World Bank or the governments they represent.
Policy Research Working Paper 6540
Scaling up early childhood development services has the potential to increase children’s cognitive and socio-emotional development and promote school readiness in a large segment of the population. This study used a randomized controlled trial approach to evaluate three scaled-up programs designed to widen access to early childhood development services: formal preschools, community preschools, and home-based services. The impacts of all three programs fell short of expectations because of two key flaws in how they were scaled up. First, implementation did not receive due attention; as a result, school facilities were not completed as planned, community-based programs were not always
This paper is a product of the Human Development and Public Services Team, Development Research Group; and the Education Team, East Asia and Pacific Region. It is part of a larger effort by the World Bank to provide open access to its research and make a contribution to development policy discussions around the world. Policy Research Working Papers are also posted on the Web at http://econ.worldbank.org. The authors may be contacted at [email protected] or [email protected].
established, and low, irregular stipends created difficulties in hiring and retaining teachers. Second, the services that were available were not promoted and thus not used as widely as anticipated. The results imply that the quality of programs supplied is critical, as is attention to the demand side of the problem. The finding that these programs fell short of expectations does not mean that interventions such as these are ineffective. Rather, it indicates that quality and demand require careful attention in attempts to scale up early childhood development interventions, and any problems should be addressed prior to evaluating effectiveness.

Impact Evaluation of Three Types of Early Childhood Development Interventions in Cambodia
Adrien Bouguen*, Deon Filmer**, Karen Macours***, Sophie Naudeau**1
* J-Pal Europe and the Paris School of Economics; ** World Bank; *** Paris School of Economics and INRA. JEL Codes: I21; I25; I28 Sector Board: EDU
1 We thank Luis Benveniste, Norbert Schady, Beng Simeth, Tsuyoshi Fukao, and members of Early Child Development Department of the Royal Government of Cambodia’s Ministry of Education for input and assistance in carrying out this work, and David Evans and Emanuela Galasso for useful comments on an earlier version of this paper. Ella Humphry and Alison Whyte provided valuable research assistance. The authors are responsible for any errors. This work benefited from funding from the World Bank, the EPDF Trust Fund (TF095369), and the Spanish Impact Evaluation Fund (TF097107). The findings, interpretations, and conclusions expressed in this paper are those of the authors and do not necessarily represent the views of the World Bank, its Executive Directors, or the governments they represent.

2
1. Introduction and motivation At least 200 million children in the developing world fail to achieve their potential in terms of
cognitive and overall development (Grantham-McGregor et al. 2007). Cognitive development
in childhood is an important marker of welfare in its own right. In addition, low levels of
cognitive development are often associated with inadequate school readiness and can
condemn children to poor school performance, which in turn can undermine their future
economic success. Studies from developed countries that have tracked children into adulthood
show that healthier and taller children do better on tests of cognitive ability; these children
have higher school attainment, grow into taller adults, and earn significantly higher wages
(Case and Paxson 2008). In the developing world, small-scale studies suggest that children
with low levels of cognitive development in early childhood do poorly in school in Guatemala
(Stith, Gorman, and Choudhury 2003), South Africa (Liddell and Rae 2001), and Jamaica
(Walker et al. 2005).
Steep socioeconomic gradients in early childhood cognitive development are common in
developing countries—children from poorer households show significantly worse outcomes
from an early age (see, for example, Halpern et al. 1996; Ghuman et al. 2005; Grantham-
McGregor et al. 2007; Naudeau et al. 2011; Fernald et al. 2012; and Schady et al. 2012).
Since poorer children generally receive a lower-quality school education, these differences are
likely to be magnified as they enter school. Policies that improve cognitive outcomes in
childhood may help break the intergenerational transmission of poverty and inequality.
An added consideration is that a number of studies indicate that the non-cognitive dimensions
of early childhood development (ECD), particularly socio-emotional development, are also
important in predicting success later in life (Heckman 2007). One cannot assume that
interventions that improve children’s cognitive development also improve their socio-
emotional development, however; in fact, sometimes the contrary appears to be true. For
instance, Baker, Gruber, and Milligan (2008) found that long hours in center-based care led to
improved cognitive development but also to lower social skills (including higher levels of
aggression) among a sample of Quebecois children. The most effective child development
interventions are likely to be those that improve children’s overall development, including
their cognitive and socio-emotional development.

3
The impact of early childhood interventions in developed countries has been studied relatively
thoroughly. A number of recent papers clearly indicate the potential in developing countries
of interventions in early childhood to improve cognitive and/or socio-emotional development
(for example, Martinez, Naudeau, and Pereira 2012; Macours, Schady, and Vakis 2012), but
many questions remain regarding the optimal design of such interventions, including their
duration and time of exposure (King and Behrman 2009). Few experiments have rigorously
compared different types of interventions in similar contexts, especially beyond the level of
small-scale pilots.
To begin to address this gap, this paper presents results from an analysis of the impact of three
early childhood interventions implemented in rural Cambodia: formal preschool, informal
community preschool, and informal home-based early childhood programs. All three
programs had moved beyond their initial pilot phase and were being implemented on a large
scale. The next two sections discuss the interventions and the experimental design. Section 4
presents the findings on implementation and take-up, and Section 5 summarizes the findings
of the main impact evaluation. Section 6 draws conclusions and related policy
recommendations.
2. The three interventions Under an Education Fast Track Initiative Catalytic Fund (FTI-CF) Grant for 2008–11, the
Royal Government of Cambodia aimed to improve its delivery of preschool services. The
FTI-funded program planned to double the number of public preschool slots available in
Cambodia by 2010 and to enhance the quality of existing and new services. The specific
programs implemented between 2009 and 2011 to support this effort were:
- The construction of approximately 650 new formal Early Childhood Care and Development (ECCD) classrooms (formal preschools) within newly renovated/upgraded primary schools in disadvantaged areas. Each ECCD classroom was to be staffed by a trained teacher whose efforts would reach about 25–35 children ages 3–5 and their families.
- The creation of 480 new community preschools, each targeting about 18–25 children ages 3–5 and their families.
- The creation of 450 new home-based programs, each targeting an average of 25–30 families of children ages 3–5 (although these programs might include younger children).

4
The formal state preschool system was to be expanded in primary schools where the
government had planned to build new classrooms (a new block for grades 4, 5, and 6). These
schools are located in some of the most disadvantaged areas across Cambodia. The expansion
of informal services—the community-based and home-based programs—took place in 10
provinces where those services were not offered and was targeted to the poorest communities.
The villages where formal and informal services were being expanded did not overlap.
Each of the three interventions built on prior experiences in Cambodia. The Early Childhood
Education (ECE) Department of the Ministry of Education had implemented formal preschool
interventions across the country, although mostly in urban and peri-urban areas, while
UNICEF and Save the Children Norway had supported implementation of community-based
and home-based models in several provinces. The goal in scaling up these three models and
evaluating their respective impacts was not to experiment with new models but to get
systematic evidence on which of the piloted models worked best when implemented on a
larger scale. Because the three approaches differed in significant ways, a comparison of their
impact could provide useful insights into which model(s) might be best fitted to a given
context. The programs were designed as follows:
- Formal preschool activities take place within primary schools, primarily with children
ages 3–5, for four hours a day (from 7:00 to 11:00 a.m.), five times a week. Formal preschool teachers receive two years of post-secondary training and are enrolled in the government payroll system. In addition to their daily center-based work, teachers are expected to hold monthly meetings with parents of children ages 0–5 from the community to discuss a variety of parenting topics, including nutrition, language development, and early stimulation.
- Community based preschools provide center-based activities for children ages 3–5, for two to three hours a day (from 7:00 to 9:00 or 10:00 a.m.), five days a week. Community teachers are community members who receive initial and ongoing training from the Provincial Department of Education.2 They are considered volunteers, but a small monthly stipend for their services was planned, to be financed through the Commune Council budget. Community teachers are also expected to hold monthly meetings with parents of children ages 0–5 from the community to discuss a variety of parenting topics (including nutrition, language development, and early stimulation).
- Home-based programs target parents of children ages 0–5 and do not include center-based activities. These programs are run by local “core mothers” who receive initial and ongoing training from the Department of Education at the Provincial and District levels. Core mothers are responsible for leading monthly meetings with parents and children ages 0–5 from the community, during which they share information on
2 Until 2010, only 10 days of pre-service training were provided to community teachers and core mothers. In 2011, in part as a result of the preliminary findings from the impact evaluation, it was decided that all new community teachers and core mothers would receive 35 days of pre-service training and 25 days of in-service training.

5
parenting (including nutrition, language development, and early stimulation) and discuss simple, developmentally appropriate activities that mothers can pursue at home with their children. Core mothers are volunteers who receive stipends only while in training.
3. Experimental design and data Randomization is the identification strategy used to evaluate the impacts of the three
approaches. The randomization was done separately for the formal preschools and for the
community- and home-based programs, because different criteria were used to identify which
communities would receive formal preschools (specifically, communities where the existing
primary school needed to be expanded) and which would receive the informal community-
and home-based ECD services (specifically, poor communities with high numbers of children
ages 0–5).
For the formal preschools (FPSs), the evaluation was based on randomized phase-in: The
incomplete schools would be upgraded over three years because of constraints on construction
capacity. Among the 138 schools identified by the Department of Material and State
Properties of the Ministry of Education as eligible for upgrading in the first year, 19 were
randomly selected to serve as a control group and would not be upgraded until the third year.
Although all schools would eventually be upgraded, this phased approach ensured that one
age-cohort in the treatment and control groups could always be compared. Baseline and
follow-up surveys were conducted in 26 treatment villages and 19 randomly selected control
villages for the formal preschool program, for a total of 1,553 households (henceforth referred
to as the “formal sample”).
In the 10 provinces which had not received assistance with establishing community-based
preschools (CBPs) and home-based programs (HBPs), 450 villages meeting specific
Baseline survey: FPSs
Endline survey: FPSs
June 2011
Baseline survey: CBPs and HBPs
May 2008
December 2008
Endline survey: CBPs and HBPs
January 2011

6
criteria (villages that had at least 100 children ages 0–5 and were located in a rural commune
where the poverty rate exceeded 30 percent) were randomly selected to participate in the first
year of the program. Each of the 450 eligible villages was allocated to one of three groups:
150 would receive a CBP, 150 would receive an HBP, and 150 would serve as the control
group. Comparisons across these three groups would allow impacts to be identified. The
evaluation relied on data collected in 32 villages randomly selected for CBPs, 32 villages
randomly selected for HBPs, and 32 control villages (3,807 households, henceforth referred to
as the “informal sample”).
The baseline data were collected in control and treatment communities for CBPs and HBPs
beginning in May 2008 and for FPSs in December 2008. In each village, up to 40 households
with at least one child between the ages of 2 and 4 at baseline (24–59 months) were sampled.
If a village had more than 40 such households, households were randomly selected to be
included in the baseline. Follow-up surveys were conducted in January 2011 for the informal
sample and in June 2011 for the formal sample.
Both at baseline and at follow-up, a household survey, a mother/caregiver survey, and a child-
specific survey instrument were implemented. Detailed data on different aspects of early
childhood cognitive and non-cognitive development were collected for the targeted children,
including a measure of the overall development of the child (the Ages and Stages
Questionnaire—ASQ,3 including measures of cognitive, socio-emotional, linguistic, gross
motor, and fine motor skills) as well as more specific tests assessing receptive vocabulary
(Peabody Vocabulary test—TVIP), associative memory (Woodcock Johnson Memory for
Names—WJ) and behavior (Strengths and Difficulties Questionnaire—SDQ). In addition, the
Early Development Instrument (EDI) was implemented in first grade of primary school.4
Together, these tests provide a good indication of a child’s school readiness. The evaluation
also collected information on other outcomes in early childhood, such as measures of
anthropometric status and child health. Finally, the evaluation collected information on a
number of possible intervening variables, including household socioeconomic characteristics
(including adults’ education), household labor supply (including maternal), maternal mental
health and cognitive ability, and parenting “quality.” The quantitative data collection was
3Ages & Stages Questionnaires® (ASQ), Second Edition: A Parent-Completed, Child-Monitoring System, by Diane Bricker and Jane Squires. Copyright © 1999 by Paul H. Brookes Publishing Co., Inc. www.agesandstages.com. Used with permission of the publisher. 4 As the children for whom the EDI was conducted could not be matched directly to the children in the sample, the EDI is not considered in this report.

7
complemented with monitoring and qualitative data collection both during and after program
implementation. First, systematic quantitative “monitoring” data were collected during
implementation (prior to endline survey) with information on program rollout. Second, semi-
structured interviews with parents, teachers, school directors, and implementers in a small
random set of treatment and control villages (of each type) were conducted after an initial
round of data analysis to explore hypotheses that emerged.
4. Main evaluation findings: Implementation and participation 4.1. Implementation and compliance with experimental design When evaluating larger-scale programs scaled up from small pilots, a key question is whether
the scaling-up is implemented in ways that affect the experimental design. In this case,
deviations from the experimental design resulted from contamination of the control villages
and uneven implementation of the interventions in the treatment villages. Deviations from the
experimental design affected all three programs but were particularly severe among the HBPs
and CBPs.
FPSs Implementation of the FPSs was relatively good. By June 2011, 82 percent of treatment
villages had access to a preschool (Table 1). Because some control villages also benefited
from construction of a preschool (13.1 percent of control students lived in a village with
access to preschool), differential take-up at the village level5 fell below 70 percent. Interviews
with technical staff of the Construction Department revealed that the random assignment of
control and treatment villages was not easily accepted by the teams responsible for building
the primary schools and was not respected in two instances. In all, 3 control villages were
treated.
Importantly, while some schools were supposed to be at least partly finished for the start of
the 2009/10 school year, in reality no new primary school (with a preschool attached) was
finished before October 2010, the beginning of 2010/11 school year. Some were finished even
later during that school year. The endline data were collected at the end of that school year
5 This does not account for individual take up rates

8
(June 2011), so treated children in the treatment villages had 9 months of preschool
participation on average, with some children having only a few months of exposure.
Table 1: Village participation—formal sample (village survey)
N Av C T T-C SE P
Presence of a primary school in the village 1,549 1 1 1 0 . 0
Preschool was constructed in the village 1,731 .548 .131 .817 0.686*** (.125) 0
Preschool classes were given in the village 1,731 .504 .09 .772 0.682*** (.105) 0
Presence of a community-based preschool 1,549 .094 .167 .047 -0.12 (.103) .252
Presence of an HBP in the village 1,549 .17 .135 .193 0.058 (.12) .634 Note: Column T-C corresponds to results of the regression of the dependent variable on the treatment status (FPS); N presents the number of observations; Av, the average in the whole sample; T, the average in the treatment group; and C, the average in the control group. Each regression is robust to the heteroskedasticity and accounts for intra-village correlation (109 clusters in total). * 10% significance; ** 5% significance; *** 1% significance.
CBPs Deviations from the experimental design in the informal sample severely limited the statistical
power and ability to draw clear conclusions on program impacts (Table 2).6 In control
villages, 28 percent of households had access to HBPs, while 11 percent had access to a CBP.
Monitoring data show that only 56 percent of CBP villages actually benefited from a CBP
treatment. These problems result in part from the failure to comply with assignment to control
and treatment groups, as villages originally designated as control villages became treatment
villages. To understand why the quality of implementation suffered, it is important to note
that CBP teachers were not paid the planned stipend during the first year of the evaluation
(2009/10), and some were not paid until the beginning of the second school year (2010/11).
Follow-up data for the informal sample were collected around January 2011, at which time
CBP teachers had been paid only for a few months at most. Qualitative interviews further
revealed that CBP teachers left either during or at the end of the 2009/10 school year because
they were not paid. Some villages had trouble finding substitutes, possibly because the stipend
was so low (US$ 8 a month). The small size of the stipend and its delayed, irregular payment
seem to have limited children’s ability to participate in CBPs.
6 The data in table 2 reflect parents’ assessments of different preschool services during the intervention, and owing to confusion among the respondents, the numbers should be interpreted with caution. For example, parents tended to confuse CBPs and FPSs, especially when CBPs used the primary school premises or were held in the village pagoda. This confusion may explain the numbers in the second row; the “presence of a preschool in the village” should be balanced across all treatment groups, but it is higher for CBPs, probably because some parents said they had access to an FPS when in fact they had access to a CBP.
9
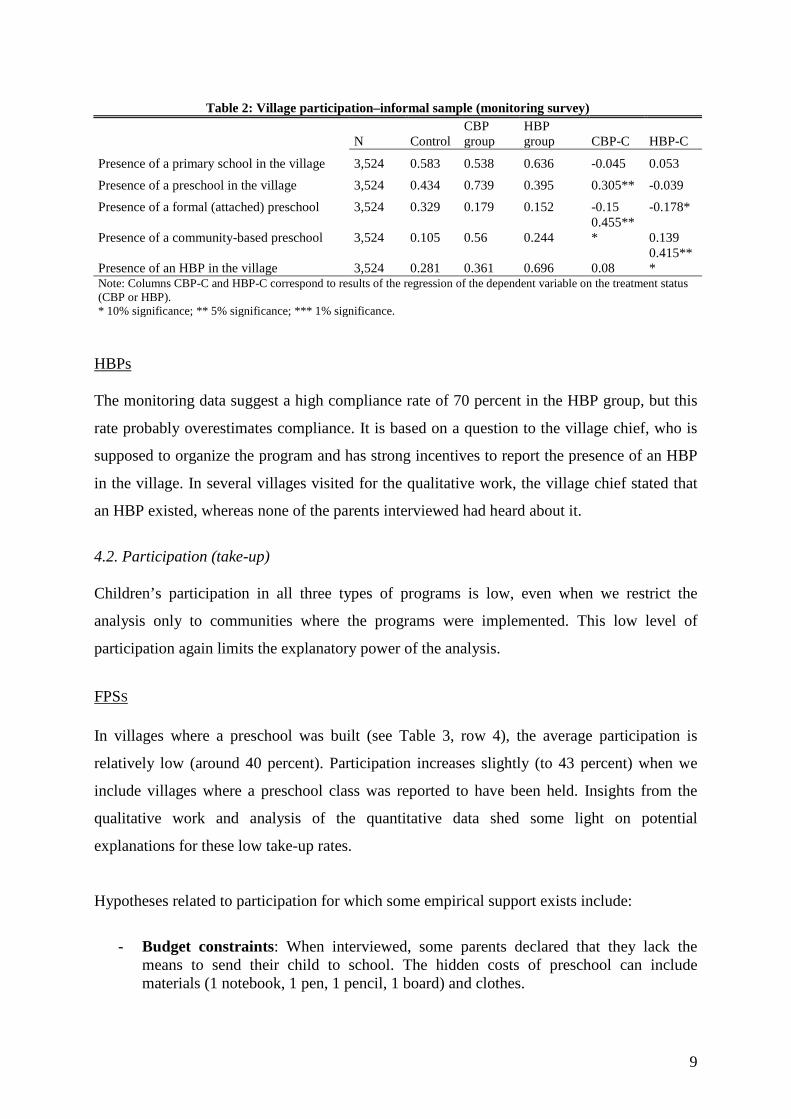
Table 2: Village participation–informal sample (monitoring survey)
N Control
CBP group
HBP group CBP-C HBP-C
Presence of a primary school in the village 3,524 0.583 0.538 0.636 -0.045 0.053
Presence of a preschool in the village 3,524 0.434 0.739 0.395 0.305** -0.039
Presence of a formal (attached) preschool 3,524 0.329 0.179 0.152 -0.15 -0.178*
Presence of a community-based preschool 3,524 0.105 0.56 0.244 0.455*** 0.139
Presence of an HBP in the village 3,524 0.281 0.361 0.696 0.08 0.415***
Note: Columns CBP-C and HBP-C correspond to results of the regression of the dependent variable on the treatment status (CBP or HBP). * 10% significance; ** 5% significance; *** 1% significance. HBPs The monitoring data suggest a high compliance rate of 70 percent in the HBP group, but this
rate probably overestimates compliance. It is based on a question to the village chief, who is
supposed to organize the program and has strong incentives to report the presence of an HBP
in the village. In several villages visited for the qualitative work, the village chief stated that
an HBP existed, whereas none of the parents interviewed had heard about it.
4.2. Participation (take-up) Children’s participation in all three types of programs is low, even when we restrict the
analysis only to communities where the programs were implemented. This low level of
participation again limits the explanatory power of the analysis.
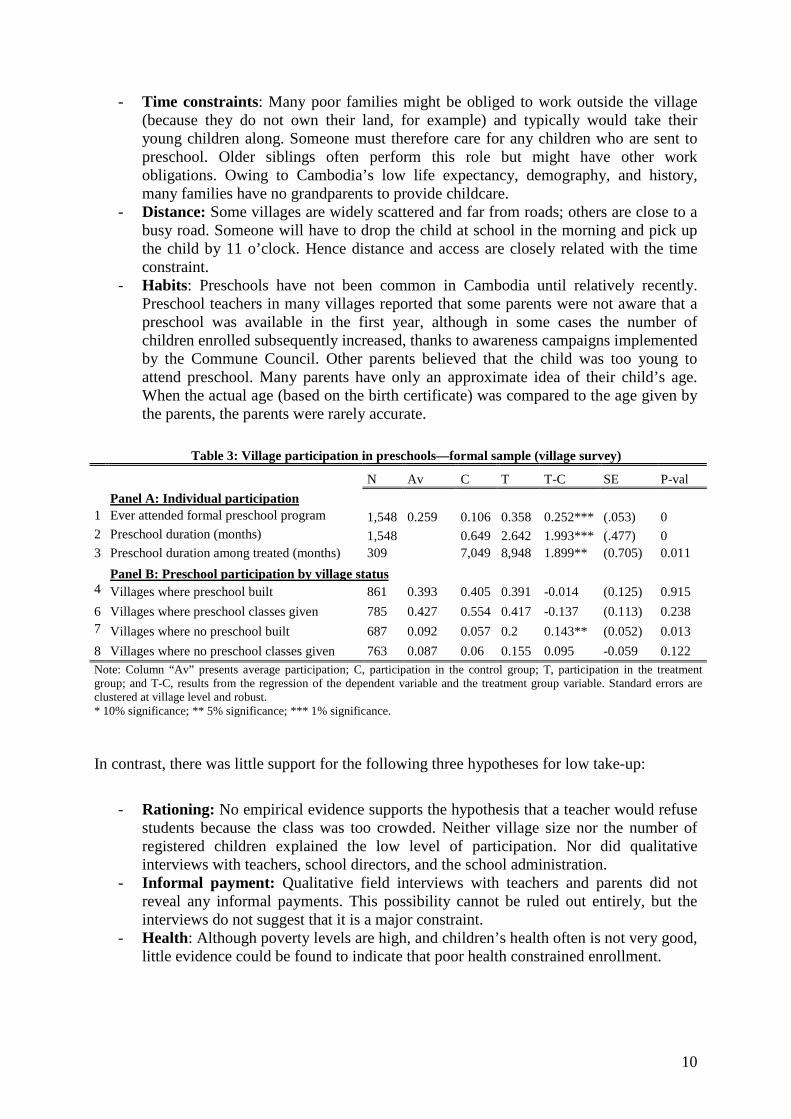
FPSS In villages where a preschool was built (see Table 3, row 4), the average participation is
relatively low (around 40 percent). Participation increases slightly (to 43 percent) when we
include villages where a preschool class was reported to have been held. Insights from the
qualitative work and analysis of the quantitative data shed some light on potential
explanations for these low take-up rates.
Hypotheses related to participation for which some empirical support exists include:
- Budget constraints: When interviewed, some parents declared that they lack the
means to send their child to school. The hidden costs of preschool can include materials (1 notebook, 1 pen, 1 pencil, 1 board) and clothes.
10
- Time constraints: Many poor families might be obliged to work outside the village (because they do not own their land, for example) and typically would take their young children along. Someone must therefore care for any children who are sent to preschool. Older siblings often perform this role but might have other work obligations. Owing to Cambodia’s low life expectancy, demography, and history, many families have no grandparents to provide childcare.
- Distance: Some villages are widely scattered and far from roads; others are close to a busy road. Someone will have to drop the child at school in the morning and pick up the child by 11 o’clock. Hence distance and access are closely related with the time constraint.
- Habits: Preschools have not been common in Cambodia until relatively recently. Preschool teachers in many villages reported that some parents were not aware that a preschool was available in the first year, although in some cases the number of children enrolled subsequently increased, thanks to awareness campaigns implemented by the Commune Council. Other parents believed that the child was too young to attend preschool. Many parents have only an approximate idea of their child’s age. When the actual age (based on the birth certificate) was compared to the age given by the parents, the parents were rarely accurate.
Table 3: Village participation in preschools—formal sample (village survey) N Av C T T-C SE P-val Panel A: Individual participation 1 Ever attended formal preschool program 1,548 0.259 0.106 0.358 0.252*** (.053) 0 2 Preschool duration (months) 1,548
0.649 2.642 1.993*** (.477) 0
3 Preschool duration among treated (months) 309 7,049 8,948 1.899** (0.705) 0.011 Panel B: Preschool participation by village status 4 Villages where preschool built 861 0.393 0.405 0.391 -0.014 (0.125) 0.915 6 Villages where preschool classes given 785 0.427 0.554 0.417 -0.137 (0.113) 0.238 7 Villages where no preschool built 687 0.092 0.057 0.2 0.143** (0.052) 0.013 8 Villages where no preschool classes given 763 0.087 0.06 0.155 0.095 -0.059 0.122 Note: Column “Av” presents average participation; C, participation in the control group; T, participation in the treatment group; and T-C, results from the regression of the dependent variable and the treatment group variable. Standard errors are clustered at village level and robust. * 10% significance; ** 5% significance; *** 1% significance. In contrast, there was little support for the following three hypotheses for low take-up:
- Rationing: No empirical evidence supports the hypothesis that a teacher would refuse
students because the class was too crowded. Neither village size nor the number of registered children explained the low level of participation. Nor did qualitative interviews with teachers, school directors, and the school administration.
- Informal payment: Qualitative field interviews with teachers and parents did not reveal any informal payments. This possibility cannot be ruled out entirely, but the interviews do not suggest that it is a major constraint.
- Health: Although poverty levels are high, and children’s health often is not very good, little evidence could be found to indicate that poor health constrained enrollment.
11
CBPS In villages that reported having a CBP, 34 percent of children in the target age group reported
having been to a preschool. Take-up appears to be lower in the CBP program than in the
FPSs, perhaps because fewer teachers were willing to accept the low and irregularly paid
stipend, and teachers were also likely to leave their jobs during the school year. The
qualitative work for CBPs indicated that rationing may have been more of a constraint to
participation in CBPs than in FPSs. The maximum class size is 25 children, and the space
available (in the teacher’s or another villager’s house, for example) is limited. Some parents
indicated that they were rejected by the CBP because it was too crowded. In addition to these
factors, the constraints related to budget, time, distance, and habits described earlier for FPSs
also apply to CBPs.
HBPS The precise reasons for low participation in HBPs are difficult to identify. Not only did
village chiefs and core mothers tend to exaggerate the frequency of the meetings, but parents
often confused HBPs with similar programs on education, health, and ecology, among others.
Even so, the very low overall take-up rate (12 percent in the treatment group, which is 8
percent of differential take-up) is consistent with qualitative observations. For example,
among four villages visited in May 2012 where an HBP was supposed to have been held, only
one village appeared to have a program in place. Given that the ECE department had arranged
the visit to the village with the HBP, it is possible that the HBP session was organized
specifically for the visit.
5. Main evaluation findings: Impacts 5.1. Impact on primary school enrollment: In villages with formal preschools, children register later in primary school When assessing the impact of preschools, enrollment in primary school is an important first
outcome variable to consider. Interestingly, the presence of a formal preschool in a village
delayed entry into primary school, as shown in Figure 1.

12
Figure 1: Enrollment in primary school by age (months)
In Cambodia, children aged 70 months when school starts in October are supposed to register
in primary school. No-one below this threshold should be officially registered. A birth
certificate is necessary for official registration in primary school, but only about two-thirds of
the children in a typical classroom are officially registered; the others attend informally.
Consequently, many children are enrolled before they are 70 months old, others are registered
at a later age, and classrooms have a mix of age groups. Figure 1 shows that in villages where
no preschool is available, 55 percent of children register in primary school before the age of
70 months (solid line).
In villages where a preschool is available, there is a clear shift in enrollment age: Only 40
percent of children are below 70 months when they enter primary school (dashed line). The
average age of entry moves from 68 months in villages without a preschool to 71 months in
villages with a preschool. The shift primarily results from young children enrolling later in
primary school, not from older children behaving differently (both curves display a similar
pattern after month 75). The qualitative fieldwork revealed potential explanations for this
impact:
Although some parents confirmed that it was still possible to register informally, the
registration age limit seemed to be enforced more in villages with a new preschool/primary
school compound. In such villages, the school administration might have become more aware
of the enrollment rule and more willing to enforce it, perhaps because officials from the ECE
0.0
1.0
2.0
3.0
4.0
5
40 50 60 70 80age at school entry october 2010
Village with preschool village without preschool
Kernel Density
enrolment age in primary school

13
department and primary school department visit when a school building project is completed.
In treatment villages, the presence of the preschool may have given teachers additional
leverage to enroll children younger than five years in the preschool instead of the primary
school. In control villages, parents who want to send their five-year-olds to school simply
enroll them informally in the primary school.
5.2. Impact of exposure to formal preschool on cognitive development (test scores) Results from the full sample A large impact on cognitive development is not expected from exposure to formal preschool,
given the low take-up rate, the brief time on average that children in treatment villages
attended formal preschool (the difference between control and treatment groups was only 2
months; see Table 3), and the effect of formal preschool on age of primary school enrollment.
For the full sample of children (not disaggregated by age; see the next section), we estimate
both intent-to-treat (ITT) and treatment-on-the-treated (TOT) (Table 4). ITT reflects the
overall impact on the target group, without adjusting for the fact that some of the target
population did not participate in the formal preschool program. TOT reflects the impact only
on those who actually took up the program. Given the relatively low compliance rate, the
TOT point estimates often have high values, but it is important to note that these are not
precisely estimated.
Results are not distinguishable from zero: Of 16 measured indicators, results are significant
only for 2 (at the 10 percent and 5 percent levels) and, if anything, point toward negative
effects. Overall results are very close to zero for receptive vocabulary and memory tests
(TVIP and WM), anthropometrics, and caregiver mental health. Results for the ASQ are more
ambiguous: One domain, gross motor, is almost positive (depending on the set of controls
used, this competence is sometimes positive and significant) but of small size (less than 10
percent of a standard deviation). Note however that the variation upon which these effects are
estimated is small, as at that age (72 months on average), children are supposed to have
acquired all gross motor competences evaluated by the ASQ (the average gross motor score
reaches 57 out of 60 points). Inversely, a domain that is often thought to be stimulated by
preschool interventions, “problem solving,” is negative and significant. Another interesting
result is the negative effect of preschool on pro-social competences (the magnitude of the
effect is small, however).

14
Table 4: Impact of formal preschool (children ages 2–5 years at baseline)
ITT
TOT
N C
T-C SE
P-val
N T-C SE
P-val
Peabody Vocabulary test TVIP: Raw score 1536 1.785 0.02 (0.060) 0.736 1535 0.09 (0.250) 0.719
TVIP: Age equivalent 1528 3.156
0.001 (0.060) 0.99
1527 0.003 (0.253) 0.989 TVIP: Age equivalent – age 1528 -0.99
0 (0.069) 0.997
1527 0.001 (0.290) 0.997
Ages and stages ASQ communication 1527 5.219
-0.07 (0.076) 0.339
1526 -0.332 (0.361) 0.358
ASQ gross motor 1525 7.606
0.078 (0.054) 0.151
1524 0.354 (0.256) 0.167 ASQ fine motor 1526 3.837
0.004 (0.059) 0.942
1525 0.02 (0.257) 0.939
ASQ problem solving 1525 4.14
-0.15** (0.060) 0.013
1524 -0.682** (0.296) 0.021 Woodcock Johnson
WJ: Raw score, out of 72 1528 1.522
-0.02 (0.061) 0.77
1527 -0.081 (0.266) 0.761 WJ: % answers correct 1528 3.383
-0.08 (0.065) 0.247
1527 -0.344 (0.279) 0.218
Strength and difficulties SDQ emotion 1539 2.483
-0.05 (0.056) 0.359
1538 -0.226 (0.240) 0.346
SDQ conduct 1539 1.673
0.053 (0.080) 0.508
1538 0.235 (0.329) 0.475 SDQ hyperactivity 1539 3.828
0.089 (0.076) 0.238
1538 0.394 (0.312) 0.207
SDQ peer 1539 1.983
-0.01 (0.069) 0.921
1538 -0.03 (0.292) 0.917 SDQ pro-social 1539 2.761
-0.122* (0.072) 0.091
1538 -0.539 (0.341) 0.115
Anthropometrics Height for age z score 1519 -1.81
-0.03 (0.046) 0.469
1519 -0.152 (0.204) 0.458
Weight for age z score 1523 -1.68
0.026 (0.058) 0.652
1523 0.119 (0.255) 0.641 Caregiver mental health
1391 -0.093 (0.444) 0.834
CESD (caregiver) 1392 1.587
-0.02 (0.105) 0.841
1535 0.09 (0.250) 0.719 Note: For ITT columns, "T-C" presents results of the regression of the dependent variable on the treatment group. For TOT columns, "T-C" presents results of the regression of the dependent variable and the treatment status instrumented by the treatment group. “ITT” is intent to treat, “TOT” the treatment on the treated. Standard errors are always robust to heteroskedasticity and account for intravillage correlation (max. 45 clusters). All test score are standardized using the standard error of the control group. All regressions include age, sex, age sex interaction dummies, height for age at baseline, and geographic fixed effect. * 10% significance; ** 5% significance; *** 1% significance.
As the individual estimates point in different directions, the few coefficients that happen to be
significant are most likely not very meaningful. To draw more robust conclusions, we created
an index of all test scores (“all scores” in Table 5), accounting for all estimated treatment
effects. That index is divided into several subindices deemed to capture the main outcomes
that participation in preschool is expected to stimulate. The “ASQ” index encompasses all
ASQ scores; “MOTOR” encompasses the gross motor, fine motor, and anthropometric
estimates; “COGNITIVE” encompasses the TVIP, WJ, and cognitive competences of the

15
ASQ (“problem solving” and communication”); “NON COGNITIVE” encompasses the
competencies of the SDQ questionnaire, and “COG+NONCOG” encompasses all scores
excluding anthropometrics. Following Kling and Liebman (2004), we estimated the results by
standardizing all outcomes, calculating the mean of all outcomes, and estimating the standard
errors using the seemingly unrelated regression model. The results are close to zero and not
significant (Table 5).
Table 5: Impact of formal preschool, Seemingly Unrelated Regression estimation
(children ages 2–5 years at baseline)
Variable N IMPACT SE P-val All scores 1,543 -0.014 (0.022) 0.524 ASQ 1,528 -0.035 (0.041) 0.388 MOTOR 1,541 0.019 (0.031) 0.549 COGNITIVE 1,536 -0.055 (0.045) 0.223 NON COGNITIVE 1,539 -0.007 (0.032) 0.815 COG+NON COG 1,541 -0.029 (0.026) 0.27
Note: “All scores” represents all test scores; “ASQ,” all subsections of ASQ; and “MOTOR,” all estimates for gross motor, fine motor, weight for age, and height for age. “COGNITIVE” is an index of all cognitive tests (TVIP, WJ, and problem-solving and communication subsections from ASQ), and “NON COGNITIVE” is an index of the strength and difficulties questionnaire. "IMPACT" column presents coefficients from the SUR model. Standard errors (SE) are robust to heteroskedasticiy and intra-village correlation and estimated using Seemingly Unrelated Regression (SUR). Results by age group: Enrollment into primary school and cognitive development Given the effects of primary school enrollment on measures of cognitive development, it
seems important to understand how those effects play out by age group. We divided the
sample into three groups by age at endline and considered ITT results for each group (Table
6).
While results are not significant and very close to zero for the youngest and oldest age group,
very strong and significant negative effects emerge for children between 66 and 78 months.
Note that all effects are reduced form (ITT) estimates, estimated with a differential take-up of
around 30 percent for that age group. Effects are thus large for compliers. The largest effect is
found for the cognitive index (-.20 of a standard deviation), but the ASQ and the summary
index for all scores are also negative and significant. In addition, the results for children
between 66 and 78 months are robust to several alternative specifications. Baseline
characteristics for that age group are also balanced between treatment and control at baseline,
and there is no differential attrition.

16
Table 6: Impact of formal preschool, Seemingly Unrelated Regression estimation by age at endline
N IMPACT SE P-val Age < 66 months
All scores 484 -0.018 (0.054) 0.741 ASQ 479 0.049 (0.069) 0.48 MOTOR 482 0.068 (0.057) 0.234 COGNITIVE 481 -0.064 (0.067) 0.346 NON COGNITIVE 484 -0.03 (0.073) 0.679 COG+NON COG 484 -0.047 (0.053) 0.377
Age > 66 and < 78 months All scores 537 -0.091** (0.040) 0.023 ASQ 531 -0.155** (0.068) 0.023 MOTOR 537 -0.03 (0.053) 0.564 COGNITIVE 534 -0.227*** (0.078) 0.004 NON COGNITIVE 533 0.034 (0.057) 0.55 COG+NON COG 535 -0.096** (0.044) 0.028
Age > 78 months All scores 522 0.015 (0.035) 0.679 ASQ 518 -0.004 (0.041) 0.93 MOTOR 522 0.025 (0.035) 0.479 COGNITIVE 521 0.073 (0.064) 0.257 NON COGNITIVE 522 -0.06 (0.057) 0.291 COG+NON COG 522 0.007 (0.051) 0.898 Note: “All scores” represents all test scores; “ASQ,” all subsections of ASQ; and “MOTOR,” all estimates for gross motor, fine motor, weight for age, and height for age. “COGNITIVE” is an index of all cognitive tests (TVIP, WJ, and “problem-solving” and “communication” subsections from ASQ), and “NON COGNITIVE” is an index of the strength and difficulties questionnaire. "IMPACT" column presents coefficients from the SUR model. Standard errors (SE) are robust to heteroskedasticiy and intravillage correlation and estimated using Seemingly Unrelated Regression (SUR). ** 5% significance; *** 1% significance. Interpretation The robust negative impact of preschool exposure on the middle cohort is striking, and clearly
it is important to understand the underlying mechanisms at work. A number of potential
explanations are worth highlighting.
First, the cohort between 66 and 78 months is the one in which children in the treatment group
are more likely to enter primary school at the right age, whereas children in the control group
tend to enter primary school earlier, as discussed in Section 5.1. The ITT estimates show that
treatment reduces enrollment in primary school by 20 percentage points in this specific age
group. In contrast, for children older than 78 months (and up to 90 months)—an age group for
which no differential primary school enrollment can be measured—no negative impacts on
cognition are found.
Figure 2 shows that there is a significant difference in primary school enrollment between the
control and treatment groups from the age of 65 months at endline (that is, 35 months at
baseline) until the age of 75 months (45 months at baseline). One potential explanation for the
negative effect of preschool on cognitive development could be that, for this specific age-

17
cohort, enrollment in primary school may lead to larger gains in cognition than enrollment in
preschool, for a variety of reasons. For example, the primary school curriculum may be better
suited for five-year-olds than the preschool curriculum. Preschool teachers may be less
experienced or skilled than their primary school counterparts. Another factor could be that
children ages 3–5 are taught together in preschool, and teachers may have prioritized the
youngest learners in the classroom to the detriment of the five-year-olds. Preschool, as
implemented in this program, may not be adapted to the needs of five-year-old children.
Figure 2: Age-enrollment patterns in formal treatment versus control groups
These findings raise the question of whether preschool, by ensuring that five-year-olds do not
enter primary school prematurely, can help to reduce the age variation in first-grade
classrooms and enable first-grade students to receive better and more age-appropriate
instruction as a result. Such an effect was not evident for the cohort in the sample that is older
than 78 months, but further analysis will focus on age variation and class size in primary
school.
Selection bias could be another but related explanation for the results on cognitive
development. Certain types of children (such as the most skilled and motivated, or those
whose parents are most involved in their education or most influential at the community level)
may be able to enter primary school early in the control group, while the same type of
children may not be able to do so in the treatment group (or can do so with greater difficulty).
These particular children may learn little in preschool, whereas their counterparts in the
control group gain a great deal from the primary school curriculum. Initial analysis of the
observed characteristics of children going to preschool and primary school in treatment and
control villages does not support this alternative explanation, however.

18
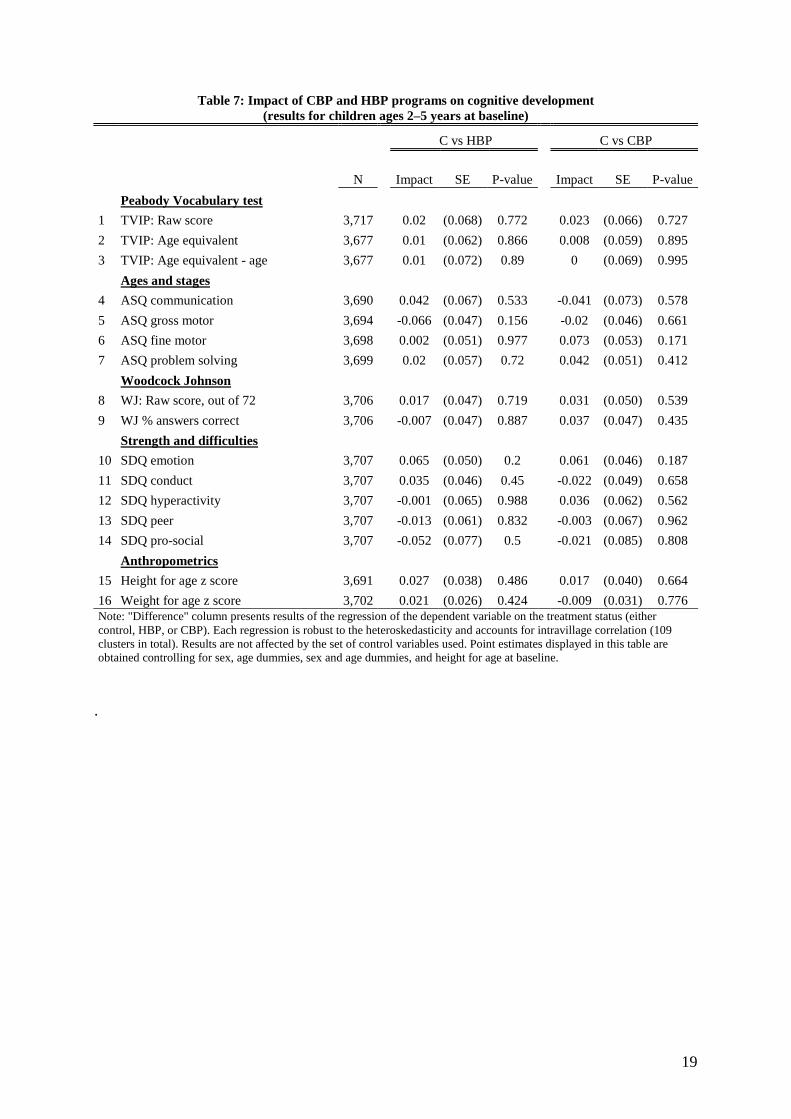
5.3. Impacts of HBPs and CBPs: No/few effects of HBPs or CBPs, likely due to low take-up and implementation issues Table 7 presents the ITT results for the HBP and CBP programs. No results are significantly
different from zero, and the effects are very small. Note that all results are ITT estimates
based on a differential take-up that is relatively low (33 percent for the CBPs, for instance).
TOT results show larger but insignificant effects. Given the low take-up of these programs as
well as the implementation concerns discussed earlier, these results are not surprising,
particularly for the HBPs.
The estimations are based on the full sample. As the participation in CBPs was higher for
children aged above 48 months at baseline, we may find stronger effects for the oldest
children. For this sample, we can, in addition, use scores for the baseline tests, which were
administered to children aged above 36 months at the time. This should improve precision of
the estimate.
Table 8 presents results for this subsample. Results for HBPs remain unchanged; CBPs show
one positive result in fine motor competence, a competence that is often said to be stimulated
by preschool.7 For the TOT estimates, the effect is relatively large—34 percent of a standard
deviation. The estimation is not very precise, however, and we cannot exclude that it is the
result of chance (1 result significant at a level of 10 percent, out of 10 results estimated).
CBPs do not seem to stimulate any other cognitive skills. Given that implementation of the
program significantly deviated from the plan, the statistical power of the data and the duration
of the program may have been too small to detect other significant results.
7 Fine motor competence corresponds to the ability to effectively draw shapes, lines, geographic figures using a pen or a pencil.
19
Table 7: Impact of CBP and HBP programs on cognitive development (results for children ages 2–5 years at baseline)
C vs HBP
C vs CBP
N
Impact SE P-value
Impact SE P-value
Peabody Vocabulary test
1 TVIP: Raw score 3,717
0.02 (0.068) 0.772
0.023 (0.066) 0.727 2 TVIP: Age equivalent 3,677
0.01 (0.062) 0.866
0.008 (0.059) 0.895
3 TVIP: Age equivalent - age 3,677
0.01 (0.072) 0.89
0 (0.069) 0.995
Ages and stages
4 ASQ communication 3,690
0.042 (0.067) 0.533
-0.041 (0.073) 0.578 5 ASQ gross motor 3,694
-0.066 (0.047) 0.156
-0.02 (0.046) 0.661
6 ASQ fine motor 3,698
0.002 (0.051) 0.977
0.073 (0.053) 0.171 7 ASQ problem solving 3,699
0.02 (0.057) 0.72
0.042 (0.051) 0.412
Woodcock Johnson
8 WJ: Raw score, out of 72 3,706
0.017 (0.047) 0.719
0.031 (0.050) 0.539 9 WJ % answers correct 3,706
-0.007 (0.047) 0.887
0.037 (0.047) 0.435
Strength and difficulties
10 SDQ emotion 3,707
0.065 (0.050) 0.2
0.061 (0.046) 0.187 11 SDQ conduct 3,707
0.035 (0.046) 0.45
-0.022 (0.049) 0.658
12 SDQ hyperactivity 3,707
-0.001 (0.065) 0.988
0.036 (0.062) 0.562 13 SDQ peer 3,707
-0.013 (0.061) 0.832
-0.003 (0.067) 0.962
14 SDQ pro-social 3,707
-0.052 (0.077) 0.5
-0.021 (0.085) 0.808
Anthropometrics
15 Height for age z score 3,691
0.027 (0.038) 0.486
0.017 (0.040) 0.664 16 Weight for age z score 3,702 0.021 (0.026) 0.424 -0.009 (0.031) 0.776 Note: "Difference" column presents results of the regression of the dependent variable on the treatment status (either control, HBP, or CBP). Each regression is robust to the heteroskedasticity and accounts for intravillage correlation (109 clusters in total). Results are not affected by the set of control variables used. Point estimates displayed in this table are obtained controlling for sex, age dummies, sex and age dummies, and height for age at baseline. .

20
Table 8: ITT tested children + baseline score
ITT
TOT
C vs. HBP
C vs. CBP
CBP vs. HBP
C vs. HBP
C vs. CBP
CBP vs. HBP
Dependent variable N Difference P-value Difference P-value Difference P-value Difference P-value Difference P-value Difference P-value
TVIP Raw score 2565
0.012 .867
0.001 .994
-0.007 .93
0,164 0,86
0,039 0,883
-0,035 0,86
Age equivalent 2148
-0.012 .874
-0.029 .696
-0.001 .984
-0,038 0,967
-0,045 0,861
-0,017 0,967 Age equivalent - age 2148
-0.019 .821
-0.045 .596
0.005 .956
-0,137 0,897
-0,092 0,755
0,075 0,897
ASQ ASQ communication 2547
0.079 .314
-0.048 .566
0.127 .112
0,86 0,377
-0,176 0,545
1,661 0,377
ASQ gross motor 2548
-0.005 .897
0.02 .576
-0.019 .504
-0,122 0,775
0,061 0,613
-0,285 0,775 ASQ fine motor 2556
0.037 .471
0.103** .04
-0.061 .242
0,443 0,495
0.335* 0,078
-0,845 0,495
ASQ problem solving 2556
0.047 .454
0.032 .552
0.013 .809
0,573 0,45
0,058 0,747
0,12 0,45 WJ
Raw score 2564
0.028 .613
0.003 .954
0.025 .639
0,184 0,779
0,013 0,948
0,273 0,779 % answers correct 2564
0.021 .693
0.027 .624
-0.008 .881
0,092 0,887
0,097 0,602
-0,181 0,887
Anthropometrics hfa(z score) 2543
0.055 .208
0.023 .603
0.009 .807
0,31 0,496
0,068 0,65
0,1 0,496
Note: "Impact" column presents results of the regression of the dependent variable on the treatment status (either control, HBP, or CBP); C vs. HBP, results of the HBP treatment; C vs. HBP, results of the CBP treatment; and CBP vs. HBP, results of the HBP treatment versus the CBP treatment. Each regression is robust to the heteroskedasticity and accounts for intra-village correlation (109 clusters in total). “ITT” is intent to treat, “TOT” the treatment on the treated. All results are controlled for sex, age dummies, sex and age dummies interaction, and the baseline test score of each dependent variable. Since baseline test scores are available only for children aged above 36 months at baseline, only 2/3 of the oldest children are included in these estimations. ** 5% significance.

21
6. Conclusions and policy implications Policy makers are very interested in the potential for preschool and other early childhood
interventions to positively influence children’s overall development (including their
physical, cognitive, linguistic, and socio-emotional development) in order to improve
schooling outcomes, as well as success later in life. Surprisingly few evaluations have
used a randomized controlled trial approach to examine the consequences of introducing
preschool programs in developing countries. Little is known about the optimal modalities
for preschool programs, which are generally implemented as small pilot projects. Even
less evidence is available regarding their impact when they are scaled up as part of
national education programs.
This randomized evaluation of three preschool modalities implemented on a large scale in
Cambodia provides interesting, new, and important insights. The evaluation found no
significant positive short-run effects for any of the three modalities tested: formal
preschool, community-based preschool, and a home-based program. This disappointing
finding is cause for concern and food for thought, particularly for future attempts to scale
up early childhood interventions such as these.
The lack of positive results most likely arises from severe deficiencies in implementation,
low take-up rates, and the limited time that children participated in the programs before
the evaluation was done. The implementation constraints are highly relevant here,
because they affected the scaling up of all three programs. Delays in building facilities,
limited incentives for teachers and volunteers, and low and irregular stipends for
volunteer CBP teachers all seem to have limited the programs’ effectiveness. This
conclusion on the importance of implementation may not be surprising, but the results
presented here demonstrate that problems in implementing a scaled-up intervention can
be sufficiently large to prevent virtually all of the expected positive effects from
materializing. Problems with implementation affected all three modalities but were the
most severe for HBPs, perhaps indicating that such programs might be particularly
challenging for governments to implement on a large scale in the absence of (i) previous
smaller-scale and government-led experiences of this kind and/or (ii) the active

22
involvement of civil society organizations in implementation. The development of strong
monitoring systems for ECD programs as well as the timely use of monitoring data to
make adjustments along the way will be vital for ensuring better implementation and
interventions of higher quality in the future.
The lessons associated with low-take up rates are probably equally important. The three
ECD modalities all address supply constraints, but they will not fulfill their potential if
demand constraints are not addressed as well. The limited demand for preschool services
in the treatment villages may have been related to the low quality or relevance (in terms
of location, hours of operation, and/or intensity) of the programs provided. Yet
qualitative evidence indicates that other demand-side constraints—such as the lack of
time to take children to school and pick them up, families’ limited resources to absorb the
costs associated with preschool (such as new clothing or school supplies), and/or the lack
of information on the benefits of preschool—are also likely to have limited participation
in the programs. To inform the design and implementation of future ECD programs, such
demand-side constraints and the choices that families make for their children in the
absence of ECD programs must be more thoroughly documented. Options for additional
interventions may include, among others, communication campaigns aimed at increasing
parents’ awareness of the benefits of preschool, the use of conditional cash transfers for
preschools to alleviate potential financial constraints to attendance, and/or creative pick-
up/drop-off strategies at the community level to reduce the time burden on individual
families. The low take-up rates identified through this evaluation also indicate that it
might be advantageous, in the future, to perform implementation pilots prior to evaluating
impacts, so that operational issues can be addressed at an early stage.
Beyond the lack of positive overall effects, this evaluation found that exposure to formal
preschool negatively affected the cognitive development of five-year-old children. This
surprising result seems to be related to the fact that children in the treatment group
entered primary school closer to the official entry age, whereas children in the control
group tended to enter earlier. In practice, and for this particular age group, the preschool
intervention substituted for an existing primary school “intervention” that was informally
available to children below the official entry age. Even though the preschool program

23
was supposed to include the five-year-olds, at this age a large proportion of children (55
percent in villages without preschools) were already enrolled in primary school. The
resulting lower scores on cognitive tests among children in the treatment group may
represent only a short-term impact, and it is possible that preschool attendance would
yield advantages for this cohort that would only materialize over the longer run.
Nevertheless this finding raises valid questions on the content and relevance of the
preschool curriculum for various age groups within the target population of children ages
3–5.
A large body of international evidence indicates that ECD services increase children’s
cognitive and socio-emotional development and promote school readiness, school
success, and productivity. For this reason, the lack of significant, positive outcomes
reported in this study should not discourage future attempts to scale up cost-effective
ECD programs in Cambodia and similar contexts. Nor should it lead to less rigorous
evaluations of the impact of those programs. Rather, the results of this study emphasize
the critical importance of two key determinants of success for ECD programs. First, it is
essential to give careful attention to implementation (the capacity to provide services of
acceptable quality must be in place); second, it is essential to ensure that the services that
are available are actually used. In addition, linkages with relevant policies or programs
(for example, policies on the official age of primary school enrollment, programs for
early childhood nutrition, and so forth) are also important. As new programs are
developed to realize the potential of ECD, close attention must be given to these
important determinants of success.

24
References Baker, M., J. Gruber, and K. Milligan. 2008. “Universal Childcare, Maternal Labor
Supply, and Family Well-being.” Jounal of Political Economy 116(4): 709–45.
Case, A., and C. Paxson. 2008. “Stature and Status: Height, Ability, and Labor Market Outcomes.” Journal of Political Economy 116(3): 499–532.
Fernald, L, P. Kariger, M. Hidrobo, and P. J. Gertler. 2012. "Socioeconomic Gradients in Child Development in Very Young Children: Evidence from India, Indonesia, Peru, and Senegal." Proceedings of the National Academy of Sciences. www.pnas.org/cgi/doi/10.1073/pnas.1121241109.
Ghuman, S., J. R. Behrman, J. B. Borja, S. Gultiano, and E. M. King. 2005. “Family Background, Service Providers, and Early Childhood Development in the Philippines: Proxies and Interactions.” Economic Development and Cultural Change 54(1): 129–64.
Grantham-McGregor, S., Y. Bun Cheung, S. Cueto, P. Glewwe, L. Richer, and B. Trupp. 2007. “Developmental Potential in the First Five Years for Children in Developing Countries. The Lancet 369(9555): 60–70.
Halpern, R., F. C. Barros, B. L. Horta, and C. Victoria. 1996. “Desenvolvimento neuropsicomotor aos 12 meses de idade em uma coorte de base populacional no Sul do Brasil: Diferenciais conforme peso ao nascer e renda familiar.” Saúde Pública 12(1): S73–S78.
Heckman, J. J. 2007. “The Technology, and Neuroscience of Human Capital Formation.” Proceedings of the National Academy of Sciences 104(33): 13250–55.
King, E., and J. R. Behrman. 2009. "Timing and Duration of Exposure in Evaluations of Social Programs." World Bank Research Observer 24(1): 55–82.
Kling, J. R., and J. B. Liebman. 2004. “Experimental Analysis of Neighborhood Effects on Youth.” Working Paper No. 483, Industrial Relations Section, Princeton University.
Liddell, C., and G. Rae. 2001. “Predicting Early Grade Retention: A Longitudinal Investigation of Primary School Progress in a Sample of Rural South African Children.” British Journal of Educational Psychology 71(3): 413–28.
Macours, K., N. Schady, and R. Vakis. 2012. “Cash Transfers, Behavioral Changes, and Cognitive Development in Early Childhood: Evidence from a Randomized Experiment.” American Economic Journal: Applied Economics 4(2): 247–73.
Martinez, S., S. Naudeau, and V. Pereira. 2012. “The Promise of Preschool in Africa:A Randomized Impact Evaluation of Early Childhood Development in Rural Mozambique.” World Bank and Save the Children, http://siteresources.worldbank.org/INTAFRICA/Resources/The_Promise_of_Preschool_in_Africa_ECD_REPORT.pdf.
Naudeau, S., S. Martinez, P. Premand, and D. Filmer. 2011. “Cognitive Development among Young Children in Low-Income Countries." In H. Alderman (ed.), No

25
Small Matter: The Impact of Poverty, Shocks, and Human Capital Investments in Early Childhood Development. Pp. 9–50. Washington, DC: World Bank.
Schady, N., J. Behrman, M. C. Araujo, R. Azuero, R. Bernal, D. Bravo, F. Lopez-Boo, K. Macours, D. Marshall, C. Paxson, and R. Vakis. 2012. “Wealth Gradients in Early Childhood Cognitive Development in Five Latin American Countries.” Processed. Interamerican Development Bank, Washington, DC.
Stith, A., K. Gorman, and N. Choudhury. 2003. “The Effects of Psychosocial Risk and Gender on School Attainment in Guatemala.” Applied Psychology 52(4): 614–29.
Walker, S. P., S.M. Chang, C.A. Powell, and S.M. Grantham-McGregor. 2005. “Effects of Early Childhood Psychosocial Stimulation and Nutritional Supplementation on Cognition and Education in Growth-Stunted Jamaican Children: Prospective Cohort Study.” The Lancet 369(9556): 1804–7.