impact factors – the basics - uksg · the e-resources management handbook jo cross impact factors...
TRANSCRIPT

The E-Resources Management Handbook Jo Cross Impact factors – the basics
1
What are impact factors?
At the simplest level, journal impact factors give the average number of citations to articles in a particularjournal; essentially, the average number of times that articles in a journal are referenced by other articles.Impact factors were conceptualized by Eugene Garfield and Irving H Sher in the 1960s as an aid toevaluating journals for inclusion in Current Contents® and the Science Citation Index® 1, 2.
An average citation measure was needed to account for the effects of the size and age of a journal onthe total number of citations it receives. Older and larger journals will generally receive more citationsbecause they have larger bodies of previously published articles available to be cited.
Calculating an impact factor requires a denominator (the total number of articles published) and anumerator (the total number of citations to those articles). A time period, or ‘window,’ needs to be definedfor both of these variables.
The publication window is the period during which the articles included in the calculation werepublished. The citation window is the period during which citations to these articles were counted.
Today, the term ‘impact factor’ most commonly refers to figures calculated and published by ThomsonReuters each year in the Science and Social Sciences Editions of the Journal Citation Reports (JCR). Thomsonhad acquired ISI and all its products in 1992 and merged with Reuters in 2008 to form Thomson Reuters.These figures give a two-year impact factor and use very specific publication and citation windows. Thecitation window here is the impact factor year, and the publication window refers to the two previousyears. Therefore, the 2007 JCR impact factors (released in 2008) were calculated as follows:
number of citations in 2007 to articles published in 2005 and 2006 in Journal X
number of articles published in 2005 and 2006 in Journal X
For example, the 2007 impact factor for Advances in Physics was calculated as follows:
Citations in 2007 to articles published in Advances in Physics in 2005 = 115Citations in 2007 to articles published in Advances in Physics in 2006 = 86Total citations received in 2007 to articles published in 2005 and 2006 = 201
Number of articles published in Advances in Physics in 2005 = 12Number of articles published in Advances in Physics in 2006 = 9Total number of articles published in 2005 and 2006 = 21
Impact factors – the basicsJO CROSS
Market Research Manager
Taylor & FrancisThe E-Resources Management Handbook – UKSG
This chapter is designed to be an introduction to impact factors and how they arecalculated. It goes on to look at some of the major issues that need to be consid-ered when evaluating journal impact factors.The chapter considers implicationsof the cause and effect of subject differences in impact factors and differentarticle types such as news items, editorials and review articles.The paper alsoconsiders the skewed distribution of citations to articles within a journal and therelationship between journal size and impact factor changes between years.

Impact factors – the basics Jo Cross The E-Resources Management Handbook
2
2007 impact factor =citations in 2007 to articles published in 2005 and 2006
number of articles published in 2005 and 2006
2007 impact factor for Advances in Physics =201
= 9.57121
For the rest of this article ‘impact factor’ will refer to the two-year JCR impact factor unless stated otherwise.The use of the JCR model has the following implications:
■ each article published is included in the denominator for two impact factor years (the two years afterthe year of publication). Thus, an article published in 2005 will be included in both the 2006 and 2007impact factors
■ citations received in the year of publication or in the third year after publication or later will not counttowards any impact factor calculation.
Impact factors have been adopted for use as measures of journal quality based on the premise that: “thevalue of information is determined by those who use it” 3, the idea being that the value of a journal can bemeasured by the number of times its use is formalized in the form of a citation. Thomson Reuters hassuggested that impact factors can be useful tools for the management of library journal collections. Thereare, however, several issues associated with the use of impact factors as measures of quality and it isimportant to understand these before utilizing impact factor data in any decision-making process. The restof this chapter will look in some depth at many of these issues.
Subject variation in impact factors
The average number of citations to articles during the two years after publication varies considerablyacross different subject fields. This leads to impact factors of very different magnitudes between fields, asillustrated in Figure 1. The impact factors plotted here are calculated by counting the number of citationsin the current year to articles published by all journals in the category in the two previous years thendividing this by the total number of these articles. Thus, these figures represent the average number oftimes an article in the field has been cited: the impact factor of the entire category.
Figure 1. Impact factors for 15 categories from the 2007 JCRs
JCR
cate
gory
Category aggregate impact factor

The E-Resources Management Handbook Jo Cross Impact factors – the basics
3
The 15 categories shown in Figure 1 are from a very wide range of fields from both the Science andSocial Sciences Editions of the JCR. However, even within a more closely-related group of subjectcategories, there can be high variation in impact factors. This is illustrated in Figure 2, which shows thecategory impact factors for nine sub-fields within physics.
What causes subject variation in impact factors?
Subject variations in impact factor are due to both different levels and patterns of citation activity betweenjournals in different fields. Figure 3 shows the general magnitude of citation levels after publication for sixsubject categories. As shown here, there are major differences in the number of citations to articles in each
Figure 2. Impact factors for nine physics categories from the 2007 JCR Science Edition
JCR
cate
gory
Category aggregate impact factor
Figure 3. Subject variation in citation levels after publication
of the different subject areas, with those in cell biology, for example, receiving many more citations at allpoints after publication than those in economics or maths.
One possible reason for higher citation levels in some fields is variation in the average number ofauthors per article. There is some evidence that highly-cited articles tend to have more authors4 and thatsubject fields with more authors per paper tend to have higher impact factors5. This is probably due to thetendency of authors to cite their own work and that of their research team.
Varying publication behaviours in different subject fields also contribute to differing levels of citations;for example, in many of the social sciences greater use is made of books as a method of dissemination thanin the hard sciences. This means that a relatively high proportion of references from journal articles inthese fields go to books6, reducing the total number of inter-journal citations. Equally, many of the citationsin these fields may come from references within books and these are mostly not captured by ThomsonReuters7,8. In engineering a similar effect occurs with many citations going to material published inconference proceedings rather than in traditional journals9.
Applied fields also differ from basic research fields in terms of the total number of citations. Journals inapplied fields are more likely to reference journals in related basic research fields than other appliedjournals. There is no comparable flow of citations back from the basic research journals. Thus, basicresearch fields tend to receive more citations than related applied fields and, therefore, have higher impactfactors. For example, journals in basic medicine fields generally have higher impact factors than those inclinical medicine fields10. We can also see from Figure 2 that the applied physics category has a relativelylow impact factor compared to most of the other physics categories.
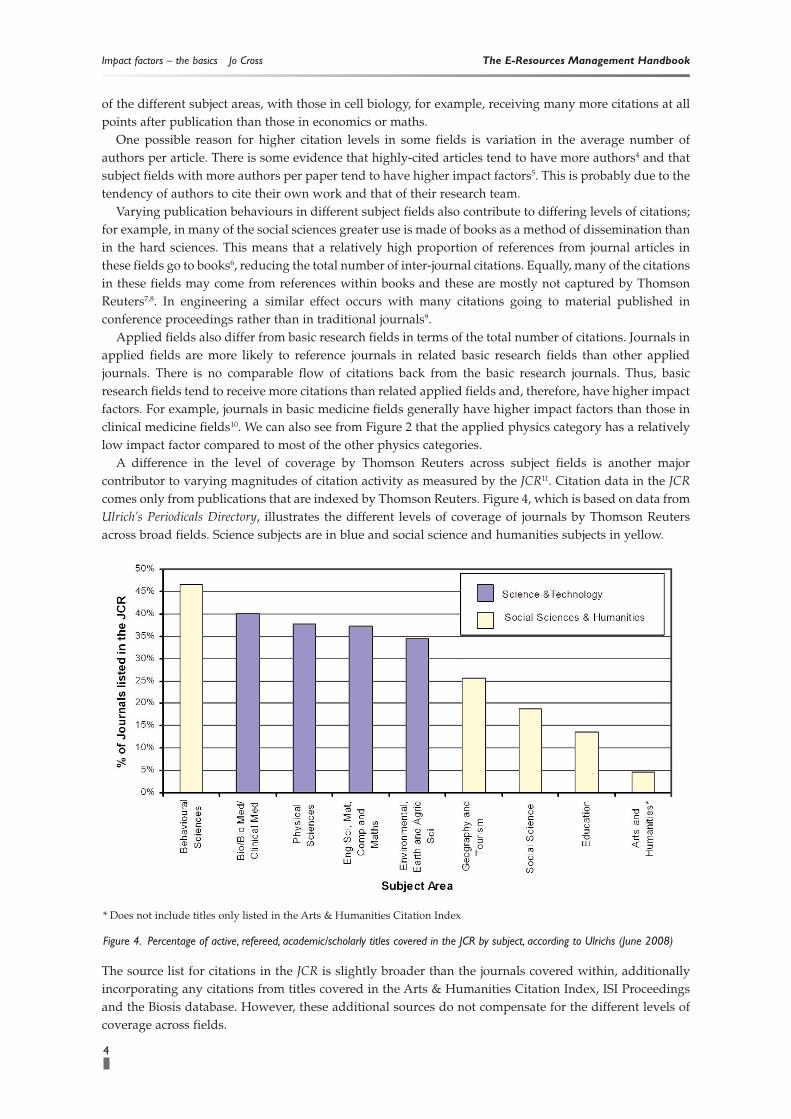
A difference in the level of coverage by Thomson Reuters across subject fields is another majorcontributor to varying magnitudes of citation activity as measured by the JCR11. Citation data in the JCRcomes only from publications that are indexed by Thomson Reuters. Figure 4, which is based on data fromUlrich’s Periodicals Directory, illustrates the different levels of coverage of journals by Thomson Reutersacross broad fields. Science subjects are in blue and social science and humanities subjects in yellow.
The source list for citations in the JCR is slightly broader than the journals covered within, additionallyincorporating any citations from titles covered in the Arts & Humanities Citation Index, ISI Proceedingsand the Biosis database. However, these additional sources do not compensate for the different levels ofcoverage across fields.
Impact factors – the basics Jo Cross The E-Resources Management Handbook
4
* Does not include titles only listed in the Arts & Humanities Citation Index
Figure 4. Percentage of active, refereed, academic/scholarly titles covered in the JCR by subject, according to Ulrichs (June 2008)
In subject fields with lower coverage, a higher proportion of citations from the field will not be capturedin the JCR data set and this will lead to lower recorded citation levels. Figure 4 illustrates generally lowcoverage in social science fields and this is likely to be a contributing factor towards lower recordedcitation levels and therefore lower impact factors in the social sciences JCR.
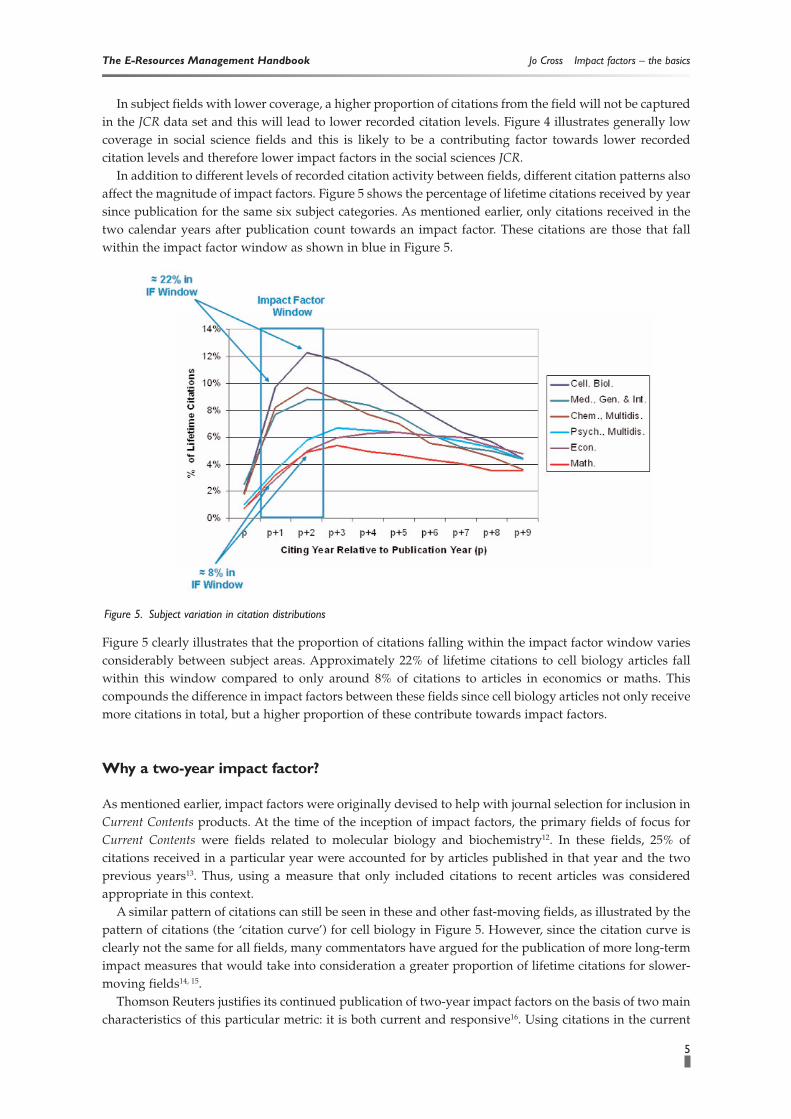
In addition to different levels of recorded citation activity between fields, different citation patterns alsoaffect the magnitude of impact factors. Figure 5 shows the percentage of lifetime citations received by yearsince publication for the same six subject categories. As mentioned earlier, only citations received in thetwo calendar years after publication count towards an impact factor. These citations are those that fallwithin the impact factor window as shown in blue in Figure 5.
Figure 5 clearly illustrates that the proportion of citations falling within the impact factor window variesconsiderably between subject areas. Approximately 22% of lifetime citations to cell biology articles fallwithin this window compared to only around 8% of citations to articles in economics or maths. Thiscompounds the difference in impact factors between these fields since cell biology articles not only receivemore citations in total, but a higher proportion of these contribute towards impact factors.
Why a two-year impact factor?
As mentioned earlier, impact factors were originally devised to help with journal selection for inclusion inCurrent Contents products. At the time of the inception of impact factors, the primary fields of focus forCurrent Contents were fields related to molecular biology and biochemistry12. In these fields, 25% ofcitations received in a particular year were accounted for by articles published in that year and the twoprevious years13. Thus, using a measure that only included citations to recent articles was consideredappropriate in this context.
A similar pattern of citations can still be seen in these and other fast-moving fields, as illustrated by thepattern of citations (the ‘citation curve’) for cell biology in Figure 5. However, since the citation curve isclearly not the same for all fields, many commentators have argued for the publication of more long-termimpact measures that would take into consideration a greater proportion of lifetime citations for slower-moving fields14, 15.
Thomson Reuters justifies its continued publication of two-year impact factors on the basis of two maincharacteristics of this particular metric: it is both current and responsive16. Using citations in the current
The E-Resources Management Handbook Jo Cross Impact factors – the basics
5
Figure 5. Subject variation in citation distributions

year (where ‘current year’ refers to the impact factor year rather than the year of JCR publication, whichis the year after) and articles in the two previous years ensures that JCR impact factors are highly sensitiveto recent changes in citation activity.
For example, a journal’s JCR impact factor will respond to papers or topical issues that receive anabnormally high number of citations, but will not be skewed for more than two years. Using a longerpublication window would dilute these effects but would include them for a longer period. ThomsonReuters considers this sensitivity to be one of the strengths of the JCR impact factor. However, it could alsobe considered a weakness since it means that several years of impact factors need to be considered togauge the general impact of a title.
Another advantage of the JCR impact factor is that it only requires three years’ worth of data (twopublication years and one citation year) to calculate. Alternative metrics that have been suggested, suchas five- or seven-year impact factors, would take over twice as long to produce. Considering theimportance that has been, rightly or wrongly, assigned to impact factors, this extended delay could behighly detrimental to new journals trying to establish themselves.
Currently, the two-year measure continues to be the only official impact factor published in the annualJCR. Thomson Reuters, however, does acknowledge that a longer-term impact measure may be moreappropriate in some fields and recent communications with Thomson Reuters’ staff suggest that a five-year measure may be included in a forthcoming update to the 2007 JCR.
In the meantime, a couple of ways in which a five-year measure can be calculated from data availablein the JCR have been suggested17,18. Extended impact measures for journals can also be calculated fromdata available in another Thomson Reuters product, the Journal Performance Indicators19. This productallows comparison to field-specific baselines.
Consequences of subject variations in impact factors
The high variation in average impact across different subject areas means that impact factors cannot beused to compare journals from different subject areas. This is why the journals covered by the JCR areclassified into fairly narrow subject categories. It is only at this level that journals should be rankedaccording to their impact factors.
Even within the JCR subject categories some journals will have a subject advantage over others, forexample, where a subject category contains both basic research and applied journals – practice-based andeducational journals often have particularly low impact factors compared to the basic research journalslisted in the same categories. There can also be a subject advantage in categories which aremultidisciplinary by nature, for example, social science journals such as the Journal of Sports Managementand Journal of the Philosophy of Sport in the sports sciences categories tend to rank lower than the majorityof the sports medicine titles in the same category. All these factors need to be considered when comparingjournal rankings within a subject category.
Subject variation in impact factors is also one of the reasons it is unwise to create an ‘average impactfactor’ for a publisher’s entire list of journals. Now that many publishers offer ‘bulk sales deals’ it can betempting to try and gauge the quality of such an offering by creating an average impact factor for thejournals included in the deal. However, if subject differences mean that the impact factors of journals fromdifferent fields cannot be compared, then it follows that the data should not be combined either. This sortof publisher-wide averaging of impact factors will always favour publishers with strong life sciencesprogrammes over those with stronger social science programmes. Since impact factors can vary evenbetween quite closely related fields, as shown in Figure 2, averaging impact factors across even a singlesubject package is unlikely to give a fair view of the quality of the package. The same is true of trying tocompare publishers on the basis of price per impact factor where journals from multiple JCR categoriesare included in the analysis, for example, the LISU report on ‘Trends in Scholarly Journal Publishing’,which combines such diverse categories as educational psychology and cell biology (which have 2007category aggregate impact factors of 1.154 and 5.603, respectively) into one analysis on biomedical titles20.
Impact factors – the basics Jo Cross The E-Resources Management Handbook
6

Is every published item counted?
Many journals publish non-substantive items such as news articles, editorials, letters to the editor andmeeting abstracts, often referred to as ‘non-source items’. These items are usually never cited and, so thatjournals publishing this material are not unduly penalized, they are not counted in the article total(denominator) for JCR impact factor calculations.
Although these ‘non-source items’ are rarely cited, there are exceptions and, interestingly, thesecitations do count towards the citation total (the numerator of the calculation). This discrepancy betweenwhat is counted in the two halves of the calculation arises due to the method used by the JCR division atThomson Reuters to count citations to a journal.
The system searches the reference lists of articles published in the impact factor year for journal titlesand publication years only. Citations are not matched to individual published items and for that reasonthe system does not differentiate between citations to source items and those to non-source items. So, forexample, in the reference below, the JCR would record a citation to the 2005 volume of ContemporaryPhysics but would not capture any more detailed information about the actual article that had been cited.
Other departments at Thomson Reuters do match citation data at the individual article level and thisinformation is used to compile products such as ISI Journal Performance Indicators (JPI) and Essential ScienceIndicators SM. The data used in the JCR, however, continues to be collected at the journal level.
The consequence of this discrepancy is that journals publishing a large number of ‘non-source items’(this is more common in some fields, such as medicine) or journals publishing particularly interesting‘non-source items’ can have artificially inflated JCR impact factors. For these journals, citations are beingcounted in the numerator to articles that are not counted in the denominator. These citations can beconsidered to be ‘free’ citations.
The number of non-source items published by particular journals can be found under the heading‘Journal Source Data’ in the JCR. The number of ‘other items’ here refers to the number of non-sourceitems. This does not, however, give an indication of the number of citations these articles have received.
Review articles
Review articles, i.e. articles that attempt to sum up the current state of research on a particular topic, aregenerally cited more often than primary research articles. This is because authors will often cite one reviewarticle rather than the many primary research articles it is based on. Therefore review journals, or journalsthat publish a significant amount of review content alongside their primary content, usually have higherimpact factors than other journals in their field. For example, analysing data from the 2007 JCR shows thatthe aggregate 2007 impact factor for science journals publishing over 75% review articles is over 2.5 timeshigher than the figure for the remaining journals.
Although the JCR lists journals from different subject areas separately to take account of subjectvariation in its impact factors, it does not list review journals separately from primary journals. Thereforereview journals and journals containing a high proportion of review content are often ranked amongst thehighest journals in their fields. For instance, the top three journals in the 2007 toxicology category arereview journals and the fourth ranked journal publishes over 25% review articles. The JCR also includesfigures on the number of review articles published by each journal that it covers in the ‘Journal SourceData’ section. It is important to consider the proportion of review content when comparing the impactfactors of different journals.
The variance in citation rates to different types of journals and journals with a different mix of articlesis another reason why it is unwise to calculate average impact factors across publisher lists. Publisherswith a large list of review journals will generally fare better in such comparisons.
The E-Resources Management Handbook Jo Cross Impact factors – the basics
7
BIER, M. (2005) Modelling processive motor proteins: moving on two legs in the microscopic realm.CONTEMPORARY PHYSICS 46: 4.

Skewed distribution of citations
Impact factors are designed to be “a measure of the frequency with which the ‘average article’ in a journal hasbeen cited in a particular year” 21. However, the distribution of citations to articles within a journal isgenerally highly skewed with a minority of articles receiving the majority of citations especially within thenarrow impact factor windows22,23,24.
This type of skew is clearly illustrated in Figure 6, which shows the distribution of citations in 2007 toarticles published in 2005 and 2006 for a journal with an impact factor (mean number of citations) of 4.651.In this case over 80% of articles have less than the mean number of citations, while over 40% have zerocitations within this window. Here the mean is particularly skewed by one article which received 73citations.
What this means is that the impact factor often does not actually give a good indication of the frequencywith which the ‘average article’ has been cited. There have been calls for Thomson Reuters to produce amedian-based average for journals along with the mean25 but this would not be possible without a changein the way the data is collected for the JCR. Data is currently collected at the journal level (see Is EveryPublished Item Counted?) above and therefore measures which rely on distribution data such as medianscannot be calculated from the current data set.
Journal size and impact factor variability
Impact factors can be highly variable from year to year, however, it is important not to read too much intosubtle changes in these figures, especially in smaller journals.
Impact factors can be thought of as the mean number of citations to a biased sample of articles from thepopulation of all articles in that field26. Statistically, smaller samples will have greater sampling errors thanlarger ones; that is, the mean values delivered by repeated sampling will be more variable. If we envisageimpact factors as repeated samples from the same population of articles, then we would expect the impactfactors of smaller journals to be more variable, year on year, than those of larger journals.
Figure 7 shows the median change in JCR impact factor (either up or down) between 2006 and 2007, forall journals in both JCR editions, grouped by journal size. This clearly illustrates that smaller journals havemore variable impact factors, on average, than larger ones.
Impact factors – the basics Jo Cross The E-Resources Management Handbook
8
Figure 6. Distribution of citations in 2007 to articles published in 2005 and 2006 for a journal with an impact factor of 4.651

Another way to look at this is to consider that a very small change in the total number of citations to ajournal that publishes relatively few articles a year will lead to quite a high percentage change in theimpact factor between years. This is especially true when we look at journals that have relatively lowimpact factors to start with. For example, it only takes two extra citations to a journal with an impact factorof 0.500 which publishes 20 articles a year (and so would have an impact factor denominator of 40) toincrease its score to 0.550, a 10% increase. Compare this to a much larger journal publishing 100 articles ayear with an impact factor of 4.000. This title would need to gain an extra 80 citations to see a 10% increaseto 4.400.
It is important to bear this caveat in mind when evaluating any changes in JCR impact factor betweentwo years. If a journal is very small, then a relatively large change in impact factor (or a consistent increaseor decrease over several years) is required to demonstrate that there has been an underlying change in thepopulation from which the journal draws its articles.
In addition to averaging impact factors across a list, it can be tempting to calculate the mean percentageincrease of a group of titles in an attempt to gauge the improvement of the list as a whole. However, thehigh variability in impact factor is one reason to avoid this approach. In the theoretical examples givenabove, both journals see an increase of 10% for very different changes in the actual number of citationsreceived between the two years. Both these changes would be given exactly the same weight in a simpleaverage of the percentage changes in impact factors across a list.
There is also a definite increase bias in such a calculation. Table 1 illustrates how increases are given amuch higher weight in mean percentage change calculations. Suppose that two theoretical journals bothpublish 20 articles per year, giving both titles an impact factor denominator of 40 (2 x 20), and that one titlegains six citations and the other loses six. The average absolute change in impact factor is zero but themean percentage change is +45% because the increase in citations leads to a 150% increase in impact factorcompared to only a 65% decrease for the loss of citations.
This is an extreme and hypothetical example, but the principle holds across all increases and decreases.It is worth bearing in mind that the highest possible percentage decrease for a journal is –100%, but there
The E-Resources Management Handbook Jo Cross Impact factors – the basics
9
Figure 7. Median change in impact factor between 2006 and 2007 by journal size
Citations IF year 1 Citations IF year 2 Absolute Change % Changeyear 1 year 2 in IF in IF
Journal A 4 0.100 10 0.250 +0.150 +150%
Journal B 10 0.250 4 0.001 –0.150 –65%
Average Change 0 +45%
Table 1. Illustration of the increase bias in mean percentage change calculations

is no limit to how high a percentage increase can be. In fact there are four journals in the 2007 JCR whichhave seen an impact factor increase of over 1000% compared to the 2006 figures.
What this all means is that simple mean percentage increases across a list can be highly skewed by smalljournals which have seen a high percentage change in impact factor due to only a small, and quite possiblyrandom, change in the number of citations received. This skew is even greater when the change is anincrease.
Further information
This chapter has covered some of the basic principles that should be considered when using the JCRimpact factors. It is not intended to be a completely comprehensive look at the myriad issues thatsurround the many different ways in which this ubiquitous measure is used. Those interested in theseissues may wish to follow some of the references.
Data sources/acknowledgements
Data and charts included with kind permission of Thomson Reuters and ProQuest LLC. Data sources forindividual charts are also as follows:
■ Figures 1,2,3,5 and 7 – Journal Citation Reports®. Copyright © 2008 Thomson Reuters■ Figure 4 – Ulrichsweb.com™. Copyright © 2008 ProQuest LLC. All rights reserved.■ Figure 6 – Web of Science®. Copyright © 2008 Thomson Reuters.
References
1. The Thomson Scientific impact factor, Thomson Reuters essay. This essay was originally published in the Current
Contents print editions June 20, 1994, when Thomson Scientific was known as The Institute for Scientific
Information® (ISI®):
http://thomsonreuters.com/business_units/scientific/free/essays/impactfactor/ (Accessed 5 January 2009)
2. Garfield, E, Long term Vs. short-term journal impact: does it matter? The Scientist, 1998, 2(3) 10–12.
http://www.garfield.library.upenn.edu/commentaries/tsv12(03)p10y19980202.pdf (Accessed 5 January 2009)
3. History of citation indexing, Thomson Reuters essay:
http://thomsonreuters.com/business_units/scientific/free/essays/history/ (Accessed 5 January 2009)
4. Aksnes, D W, Characteristics of highly cited papers, Research Evaluation, 2003, 12(3) 159–170.
5. Amin, M and Mabe M, Impact factors: use and abuse, Perspectives in Publishing, 2000, 1.
http://www.elsevier.com/framework_editors/pdfs/Perspectives1.pdf (Accessed 5 January 2009)
6. Garfield, E, On the literature of the social sciences and the usage and effectiveness of the Social Sciences Citation
Index. Current Contents, 1976, 34 5–10.
http://www.garfield.library.upenn.edu/essays/v2p550y1974-76.pdf (Accessed 5 January 2009)
7. Line, M B, Social science information – the poor relation. INSPEL 1999 33(3) 131–136.
http://www.ifla.org/VII/d2/inspel/99-3libm.pdf (Accessed 5 January 2009)
8. Harzing, A-W, & van der Wal, R, Google Scholar as a new source for citation analysis?, Ethics in Science and
Environmental Politics, 2008, 8 (1) 62–71.
http://www.harzing.com/download/gsdemo.pdf (Accessed 5 January 2009)
9. Harzing, A-W, & van der Wal, R, ref. 8
10. Seglen, P O, Why the impact factor of journals should not be used for evaluating research, BMJ, 1997, 314 497.
Impact factors – the basics Jo Cross The E-Resources Management Handbook
10

11. Althouse, B M et al, Differences in impact factor across fields and over time, Department of Economics, UCSB.
Departmental Working Papers (Paper 2008-4-23), 2008.
http://repositories.cdlib.org/ucsbecon/dwp/2008-4-23 (Accessed 5 January 2009)
12. Garfield, E, The use of journal impact factors and citation analysis for evaluation of science. Paper presented at
the 41st Annual Meeting of the Council of Biology Editors, Salt Lake City, UT, May 4, 1998 – April 17, 1998.
http://www.garfield.library.upenn.edu/papers/eval_of_science_CBE(Utah).html (Accessed 5 January 2009)
13. Garfield, E, The meaning of the impact factor, International Journal of Clinical and Health Psychology, 2003, 3(2)
363–369.
http://www.garfield.library.upenn.edu/papers/meaningofif2003.pdf (Accessed 5 January 2009)
14. Garfield, E, ref. 2
15. Garfield, E, ref. 12
16. Althouse, B M, ref. 11
17. The Thomson Scientific impact factor, Thomson Reuters essay, ref. 1
18. How to calculate a five-year impact factor- JCR Online Help Section:
http://admin-apps.isiknowledge.com/JCR/help/h_fiveyr_if.htm (Accessed 5 January 2009)
19. Pringle, J, Trends in the use of ISI citation databases for evaluation, Learned Publishing, 2008, 21 85–91.
http://dx.doi.org/10.1087/095315108X288901 (Accessed 5 January 2009)
20. White, S and Creaser, C, Trends in Scholarly Journal Prices 2000-2006, (LISU Occasional Paper No. 37), 2007
http://www.lboro.ac.uk/departments/ls/lisu/pages/publications/oup2.html (Accessed 5 January 2009)
21. The Thomson Scientific impact factor, Thomson Reuters essay, ref. 1
22. Seglen, P O, ref. 10
23. Editorial, Not-so-deep impact, Nature, 2005, 435, 1003–1004.
http://www.nature.com/nature/journal/v435/n7045/full/4351003b.html (Accessed 5 January 2009)
24. Alder, R, Ewing, J and Taylor, P, Citation statistics: A report from the International Mathematical Union (IMU) in
cooperation with the International Council of Industrial and Applied Mathematics (ICIAM) and the Institute of
Mathematical Statistics, 2008:
http://www.mathunion.org/fileadmin/IMU/Report/CitationStatistics.pdf (Accessed 5 January 2009)
25. Rossner, M, Van Epps, H and Hill, E, Show me the data, Journal of Cell Biology, 2007, 179(6), 1091–1092.
http://cb.rupress.org/cgi/doi/10.1083/jcb.200711140 (Accessed 5 January 2009)
26. Amin, M and Mabe, M, ref. 5
© Jo Cross
■ Jo CrossMarket Research ManagerTaylor & Francis4 Park Square Milton ParkAbingdonOX14 4RNE-mail: [email protected]
The E-Resources Management Handbook Jo Cross Impact factors – the basics
11

Biographical note
Jo graduated from Oxford University with a BA (Hons) in Experimental Psychology. She started her careerin academic journal publishing at Elsevier where she worked in various roles including author support,journal management (Editorial) and as a Publishing Information Manager. Jo moved to Taylor & Francisin 2004 to set up and run the Market Research Department.
Studying and analysing citation and impact factor data has been a large component of Jo’s role sinceshe became a Publishing Information Manager in 2002. In 2007 she ran a briefing session on Impact Factorsat the annual UKSG conference.
Impact factors – the basics Jo Cross The E-Resources Management Handbook
12
To view more chapters from The E-Resources Management Handbook, published by UKSG, click here:
http://www.uksg.org/serials/handbook.asp