impact ii™ brochure
TRANSCRIPT
Bru
ker
Dal
toni
cs is
con
tinua
lly im
prov
ing
its p
rodu
cts
and
rese
rves
the
rig
ht
to c
hang
e sp
ecifi
catio
ns w
ithou
t no
tice.
© B
DA
L 0
6-2
014,
182
94
33
Dynamic Source Configuration
Innovation with IntegrityUHR-TOF MS
Get the full picture the first time
impact II

Sensational Capabilities of impact II
Optimize your LC-MS methods without compromising performance: impact II delivers the full range of specified performance parameters simultaneously to solve your analytical challenges. The Ultra-High Resolution (UHR) QTOF technology pioneered by Bruker once again defines the standards of what can be achieved using accurate mass LC-MS/MS.
New innovations in time-of-flight instrumentation are now available in a robust and market-leading benchtop system.
Market Leading Sensitivity
Dual ion funnel IonBooster Source CaptiveSpray nanoBooster New collision cell with broad
mass transfer
Robust & Quantitative
Outstanding Hardware Performance
Enhanced dynamic range 50 Gbit/sec data sampling
technology 10 bit ADC technology New TOF with improved
resolving power
Deepest insight into your sample
Instant Expertise™ Software IDAS™
Intensity Dependent Acquisition Speed RT2™
RealTime Re-Think SmartFormula 3D™
Easy-to-use
Your Success with impact II
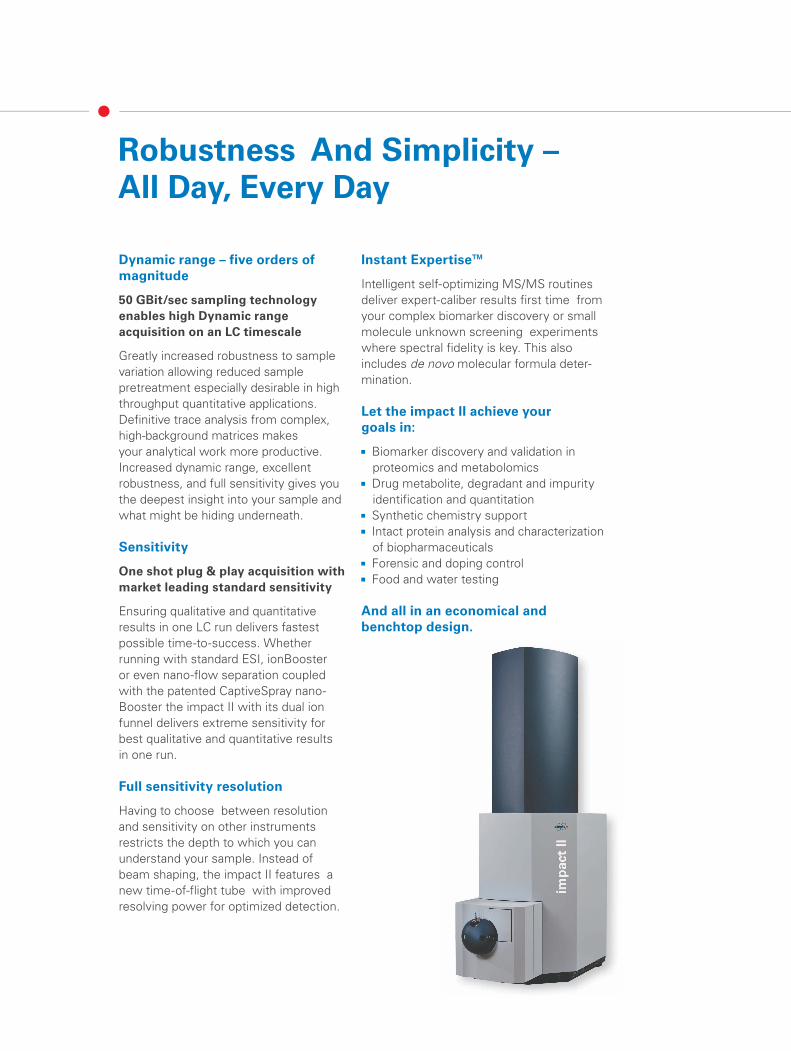
Instant Expertise™
Intelligent self-optimizing MS/MS routines deliver expert-caliber results first time from your complex biomarker discovery or small molecule unknown screening experiments where spectral fidelity is key. This also includes de novo molecular formula deter-mination.
Let the impact II achieve your goals in:
Biomarker discovery and validation in proteomics and metabolomics Drug metabolite, degradant and impurity
identification and quantitation Synthetic chemistry support Intact protein analysis and characterization
of biopharmaceuticals Forensic and doping control Food and water testing
And all in an economical and benchtop design.
Dynamic range – five orders of magnitude
50 GBit/sec sampling technology enables high Dynamic rangeacquisition on an LC timescale
Greatly increased robustness to sample variation allowing reduced sample pretreatment especially desirable in high throughput quantitative applications. Definitive trace analysis from complex, high-background matrices makes your analytical work more productive. Increased dynamic range, excellent robustness, and full sensitivity gives you the deepest insight into your sample and what might be hiding underneath.
Sensitivity
One shot plug & play acquisition with market leading standard sensitivity
Ensuring qualitative and quantitative results in one LC run delivers fastest possible time-to-success. Whether running with standard ESI, ionBooster or even nano-flow separation coupled with the patented CaptiveSpray nano-Booster the impact II with its dual ion funnel delivers extreme sensitivity for best qualitative and quantitative results in one run.
Full sensitivity resolution
Having to choose between resolution and sensitivity on other instruments restricts the depth to which you can understand your sample. Instead of beam shaping, the impact II features a new time-of-flight tube with improved resolving power for optimized detection.
Robustness And Simplicity – All Day, Every Day

More Dynamic Range, More Accuracy,More Confidence
VersatilitySensitive mass transfer from smallest fragment ions to monoclonal antibodies
Patented dual Ion-Funnel:Ruggedness and sensitivity
Choice of rugged and sensitive ion sources
39.0229
41.03790
500
1000
1500
2000
2500
Intens.
38 40 42 44 46 m/z2200 2400 2600 2800 3000 3200 3400 3600 3800 m/z
Low mass fragment ion of vanillic acid precursor at 0.1mDa Mass accuracy
Mass Spectrum obtained from intact Adalimumab which has a molecule weight of 148k Da
“The robustness, sensitivity and spectral accuracy of the impact QTOF-MS has accelerated the process to identify unknown compounds. This is an integral part of long-term goal to ‘sequence’ the Medicago truncatula metabolome”
Professor Lloyd W. Sumner, Analytical Biochemistry Plant Biology Division, The Samuel Roberts Noble Foundation Ardmore, OK, USA
Sensitivity
Deconvoluted mass: 148 kDa

In-spectrum dynamic range @ real LC speed – don’t miss low abundant peaks.
195.087608
219.106753
+MS, 1.0min #55
0.0
0.2
0.4
0.6
0.8
7x10Intens.
60 80 100 120 140 160 180 200 220 m/z
61.039693
+MS, 1.0min #55
0
10
20
30
40
50
Intens.
60.0 60.5 61.0 61.5 62.0 62.5 m/z
Caffeine 0.6ppmI = 9,230,400 counts
Urea 0.8 ppm I = 52 counts 1.7 x 10⁵
Much higher dynamic range in concentration reachable
TOF with improved Full Sensitivity Resolution (FSR)
New broad mass transfer Quadrupole CID cell with DC gradient
Market-leading high-dynamic range 10 bit detection system
2200 2400 2600 2800 3000 3200 3400 3600 3800 m/z
Robustness
Spectral accuracy

Productivity and….
Robust profi ling of large batches of complex biological samples
Simplicity: Fast and accurate acquisition of fragment spectra
Peak shapes in urine sample remain constant: Instrument robustness enables comprehensive metabolic profiling studies of large sample sets. Looking at a selected compound: Phenylalanine. SmartFormula provides the correct molecular formula based on accurate mass and isotopic pattern fit: C9H12N1O2. Fully reproducible isotopic fidelity for phenylalanine across 100 samples injected – unambiguous molecular formula generation also for higher m/z values all day, every day.
166.0863
167.0897
166 167 168 169 m/z
-0.2 ppm mass accuracy
True isotopic pattern
(mSigma = 4.4)
0,0
15,0
30,0
45,0
0 20 40 60 80 100
mSig
ma
Injection No.
mSi
gma
166.0863
167.0897
166 167 168 169 m/z
-0.2 ppm mass accuracy
True isotopic pattern
(mSigma = 4.4)
0,0
15,0
30,0
45,0
0 20 40 60 80 100
mSig
ma
Injection No.
mSi
gma
166.0863
167.0897
166 167 168 169 m/z
-0.2 ppm mass accuracy
True isotopic pattern
(mSigma = 4.4)
0,0
15,0
30,0
45,0
0 20 40 60 80 100
mSig
ma
Injection No.
mSi
gma
mSigma Value for phenylalanine in 100 urine samples measured
mSigma < 15 = unambiguous molecular formula generation even for higher m/z values
100 injections of human Urine sample
impact II enables up to 50 Hz instrument scan speed combined with Instant ExpertiseTM
software: All precursor ions fragmented in “one shot” acquisition of human urine sample spiked with vanillic acid.
200
400
600
800
m/z
2 4 6 8 10 Time [min]
MS/MS Spectrum acquiredSeveral thousand high quality MS/MS spectra ready for spectral library search
The low abundant target mass 169.0495 m/z of the vanillic acid precursor was fragmented successfully. Query in custom human metabolite MS/MS Library, provides correct identification. The library was generated in a different laboratory on a different impact QTOF instrument.
…Versatility for OMICS research
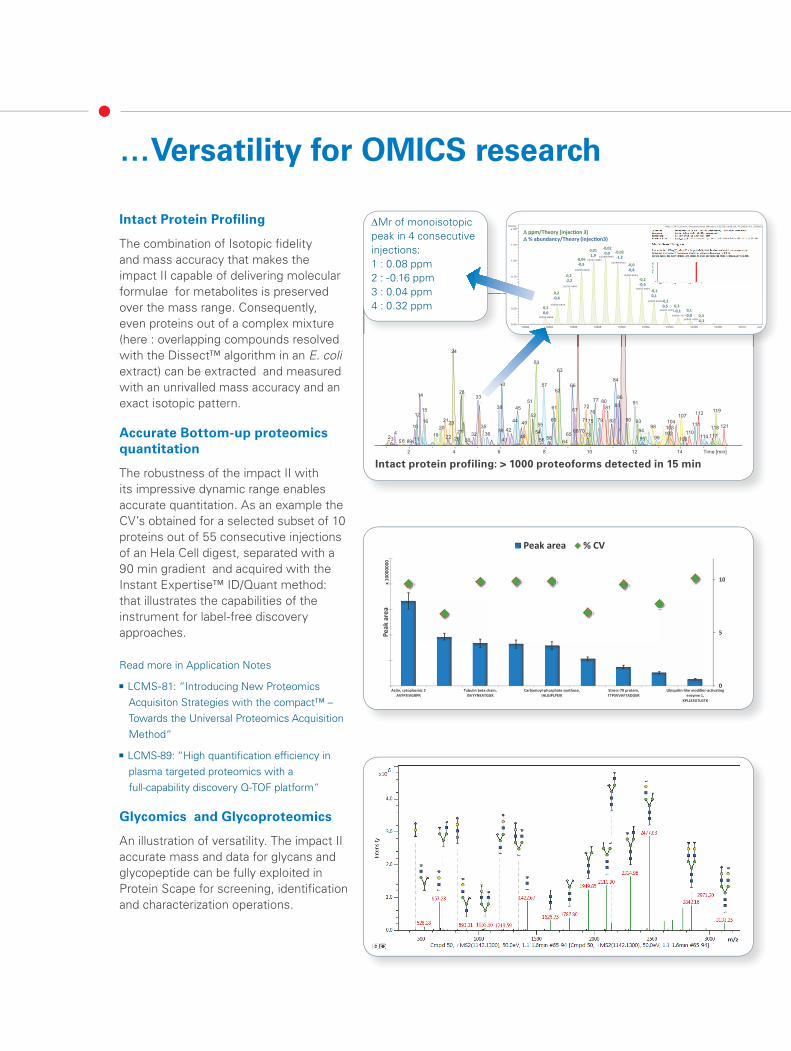
Intact Protein Profi ling
The combination of Isotopic fidelity and mass accuracy that makes the impact II capable of delivering molecular formulae for metabolites is preserved over the mass range. Consequently, even proteins out of a complex mixture (here : overlapping compounds resolved with the Dissect™ algorithm in an E. coli extract) can be extracted and measured with an unrivalled mass accuracy and an exact isotopic pattern.
Accurate Bottom-up proteomics quantitation
The robustness of the impact II with its impressive dynamic range enables accurate quantitation. As an example the CV’s obtained for a selected subset of 10 proteins out of 55 consecutive injections of an Hela Cell digest, separated with a 90 min gradient and acquired with the Instant Expertise™ ID/Quant method: that illustrates the capabilities of the instrument for label-free discovery approaches.
Read more in Application Notes
LCMS-81: “Introducing New Proteomics Acquisiton Strategies with the compact™ – Towards the Universal Proteomics Acquisition Method“
LCMS-89: “High quantification efficiency in plasma targeted proteomics with a full-capability discovery Q-TOF platform“
Glycomics and Glycoproteomics
An illustration of versatility. The impact II accurate mass and data for glycans and glycopeptide can be fully exploited in Protein Scape for screening, identification and characterization operations.
2934 87
89 1058347 78 10150 9719 43 92 1099626 74 12037 11331 11611559 10017131 46 1067
88
69
24
5363
8440 57 66
622814 33 8677 8051 91857238 81614515 67 11976 11212 52 1079060 71 7921 8244 75 9316 1044923 11155 12110 9835 11820 10342 9439 68 7027 54 1104 10236 6532 7318 11711448222 995825 95113 1085641306 985 64
2 4 6 8 10 12 14 Time [min]
10293.6804
10294.6825
10295.6845
10296.6848
10297.688110298.6903
10299.6927
10300.6953
10301.6964
10302.6996
10303.7001
10304.707710305.7083
+MS, 5.34-5.52min, Deconvoluted (MaxEnt, 512.09-1549.29, *0.0482143, 35000)
0.00
0.25
0.50
0.75
1.00
1.25
5x10Intens.
10292 10294 10296 10298 10300 10302 10304 10306 10308 10310 m/z
∆ ppm/Theory (injection 3)∆ % abundancy/Theory (injection3)
0,30,6
0,2-0,6
0,2-2,2
-0,06-0,5
0,011,9
-0,020,0 -0,02
-1,2
-0,0-0,8
-0,2-0,5
-0,10,1
-0,20,5 0,3
--0,10,3-0,1
0,10,0
∆Mr of monoisotopic peak in 4 consecutive injections:1 : 0.08 ppm2 : -0.16 ppm3 : 0.04 ppm4 : 0.32 ppm
0
5
10
Actin, cytoplasmic 2AVFPSIVGRPR
Tubulin beta chain,ISVYYNEATGGK
Carbamoyl-phosphate synthase,IALGIPLPEIK
Stress-70 protein,TTPSVVAFTADGER
Ubiquitin-like modifier-activatingenzyme 1,
KPLLESGTLGTK
Peak
are
ax
1000
0000
Peak area % CV
Intact protein profiling: > 1000 proteoforms detected in 15 min
Qualitative and Quantitative Drug Metabolism Characterization
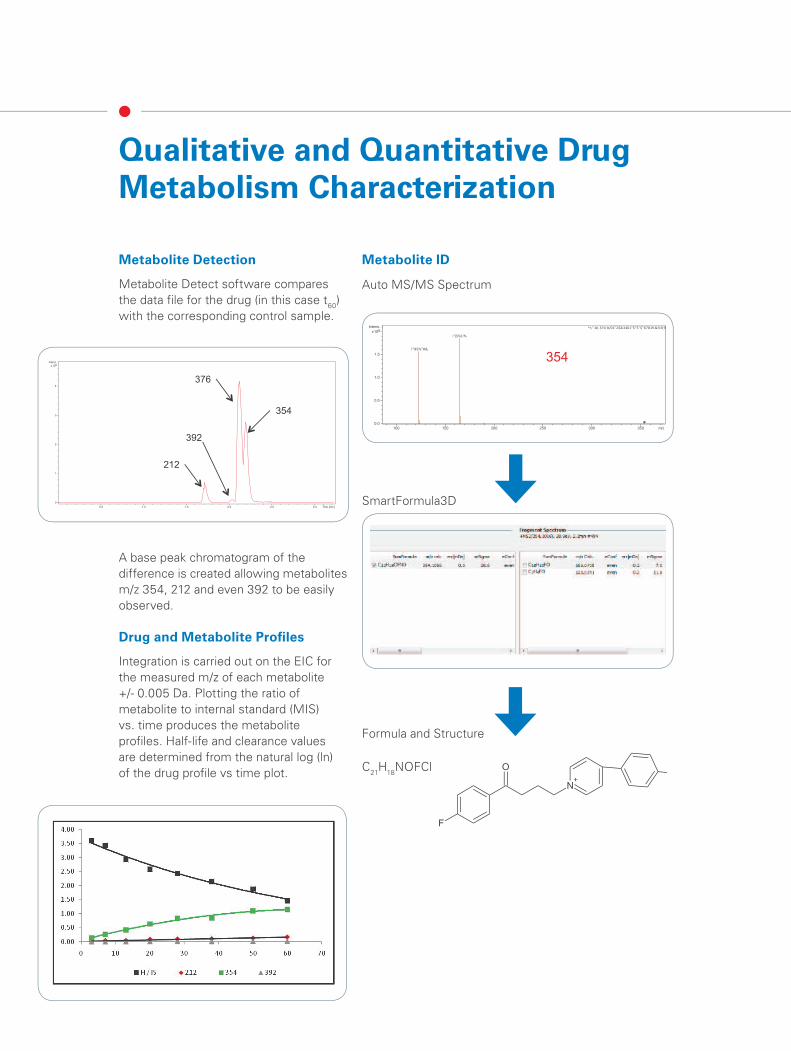
Metabolite Detection
Metabolite Detect software compares the data file for the drug (in this case t60) with the corresponding control sample.
A base peak chromatogram of the difference is created allowing metabolites m/z 354, 212 and even 392 to be easily observed. Drug and Metabolite Profi les
Integration is carried out on the EIC for the measured m/z of each metabolite +/- 0.005 Da. Plotting the ratio of metabolite to internal standard (MIS) vs. time produces the metabolite profiles. Half-life and clearance values are determined from the natural log (ln) of the drug profile vs time plot.
Metabolite ID
Auto MS/MS Spectrum
SmartFormula3D
Formula and Structure
C21H18NOFCl
0.5 1.0 1.5 2.0 2.5 3.0 Time [min]0
1
2
3
4
5x10Intens.
212
354
376
392
!"#$%"#&
!'($%)!%
*+,"-#(.$!%'#/01"2$&3401"$"5"$"67819.&%5(%"
0.0
0.5
1.0
1.5
5x10Intens.
100 150 200 250 300 350 m/z
354
F
O
N+
Cl

Your Partner in Biopharmaceutical Analysis
A powerful benchtop solution with comprehensive capabilities for biological therapeutics screening, characterization and confirmation
Rapidly and routinely acquire monoisotopic antibody subunit data, with resolved isotopes and superb mass accuracy. This yields greater confidence in sequence confirmation and easy detection of heterogeneities.
Acquire high coverage peptide maps and confidently detect and identify low-level sequence variants with increased MS/MS acquisition speed and wider dynamic range.
Effective screening and quantitation of released glycans and small molecule impurities due to broadband transmission and wide dynamic range.
Intact Mass Measurement of the mAB Adalimumab
2200 2400 2600 2800 3000 3200 3400 3600 3800 m/z
147400 147600 147800 148000 148200 148400 148600 148800 149000 m/z
Deconvoluted SpectrumMr (expected) = 148080.1
Spectrum of intact monoclonal antibody Adalimumab
∆Mr / Mr = 3 ppm
Peptide Maps
Annotated BPC
Multiple enzymes
Library matching
Intact Mass Analysis
Comparison with reference material
Glycoform ratio calculation
Subunit analysis
Comparison with reference material
Screening
impurities
released glycans
BioPharma Compass
24090 24100 24110 24120 24130 m/z
Mr (mono) = 24093.0826 DaTheoretical isotopes for Fc/2
∆M/M = -0.48 ppm
23400 23410 23420 23430 23440 m/z
Mr(mono) = 23397.5899 DaTheoretical isotopes for LC
∆M/M = -0.80 ppm
25450 25460 25470 25480 25490 m/z
Mr (mono) = 25442.5176 DaTheoretical isotopes for Fd
∆M/M = -0.19 ppm
24100 24110 24120 24130 m/z2
24090 24100 24110 24120 24130 m/z
Mr (mono) = 24093.0826 DaTheoretical isotopes for Fc/2
∆M/M = -0.48 ppm
23400 m/z
Mr(mono) = 23397.5899 DaTheoretical isotopes for LC
∆M/M = -0.80 ppm
25450 25460 25470 25480 25490 m/z
Mr (mono) = 25442.5176 DaTheoretical isotopes for Fd
∆M/M = -0.19 ppm
m/z
24090 24100 24110 24120 24130 m/z
Mr (mono) = 24093.0826 DaTheoretical isotopes for Fc/2
∆M/M = -0.48 ppm
23400 23410 23420 23430 23440 m/z
Mr(mono) = 23397.5899 DaTheoretical isotopes for LC
∆M/M = -0.80 ppm
25450 25460 25470 25480 25490 m/z
Mr (mono) = 25442.5176 DaTheoretical isotopes for Fd
∆M/M = -0.19 ppm
Subunit analysis

One-Shot Full Picture of the Sample ...
Full Sensitivity Resolution and high dynamic range are prerequisites to reach extreme low level of detection. High-resolution Extracted ion Chromatogram identifying pesticides with full scan MS and bbCID acquisition
Highest Confidence in Confirmation of Elemental Composition of Pesticides
Excellent Isotopic fidelity at very low concentration level
Direct injection of 100 μl water: All analytes from 70 to 900 m/z are detected at 10 ng/l
1st Isotope
2nd Isotope
3rd Isotope
+MS 50 ppt Dimethoate C5H12N1O3P1S2 m/z 228.9996 err 0.55 mDa
Pesticide screening at 10 ng/L in surface waters
10 ppt
in single LC-TOF run. All analytes across the mass range from 70 to 900 m/z are detected. The new HDC collision cell with un-compromised mass-transfer and sensitivity allows for trace level residue screening, confirmation and quantitation.

Example of Positive Amphetamine Finding at Trace Level
COTININECaffeine
O-DESMETHYLVENLAFAXINE VENLAFAXINE
METHADONE (13C)
METHADONE
EDDP (METHADONE METABOLITE)
EDDP (METHADONE METABOLITE) (13C)Caffeine (13C)
COTININE (13C)
ECGONINE METHYL ESTERECGONINE METHYL ESTER (13C)
1 2 3 4 5 6 7
O-DESMETHYLVENLAFAXINE (13C)
8 Time [min]
Amphetamine
Amphetamine (^13C)
Amphetamine Fragm 119
Amphetamine Fragm 91
3.8 4.0 4.2 4.4 4.6 Time [min]
... for Rapid Profiling and Screening of Unknowns
High resolution, accurate mass MS and bbCID MS/MS data acquisition enables rapid reaction to emerging challenges in food safety and doping even before reference standards are available Facilitates retrospective in-silico
analysis for post-hoc identification of true unknown contaminants Accurate mass screening databases for
Food Testing and Forensic Toxicology
Food/ Water/Forensic sample
UHPLC impact II
One shot qual/quant analysis with no method development MS, Total Ion CID, MSMS
Identification, confirmation, quantitation, ID of new compounds and reporting
Processing with high quality database
In silico retrospective analysis of new targets
“We use the Bruker impact QTOF with bbCID to attain enhanced sensitivity for drugs-of-abuse and designer drug screening in a forensic setting, covering critical low concentration compounds like THC acid, buprenorphine, LSD, and synthetic cannabinoids. The bbCID workflow has been carefully validated against spectral library comparison, and it has proven to deliver equal confidence, but with a much higher efficiency, significantly increasing our productivity. Our forensic screening method has now been accredited by the Finnish Accreditation Service”
Dr. Anna Pelander, Laboratory of Forensic Toxicology at the University of Helsinki
Example of Positive Amphetamine Finding at Trace Level
COTININECaffeine
O-DESMETHYLVENLAFAXINE VENLAFAXINE
METHADONE (13C)
METHADONE
EDDP (METHADONE METABOLITE)
EDDP (METHADONE METABOLITE) (13C)Caffeine (13C)
COTININE (13C)
ECGONINE METHYL ESTERECGONINE METHYL ESTER (13C)
1 2 3 4 5 6 7
O-DESMETHYLVENLAFAXINE (13C)
8 Time [min]
Amphetamine
Amphetamine (^13C)
Amphetamine Fragm 119
Amphetamine Fragm 91
3.8 4.0 4.2 4.4 4.6 Time [min]
Comprehensive forensic drug scree-ning with maximum confidence in the results with impact II. Accurate mass measurement of ‘diagnostic ions’, including the pseudo-molecular ion, adducts, isotopes as well as broad band CID (bbCID) fragment ions reduces or eliminates false positive findings, even in complex matrices such as serum. At trace levels, ‘buried in the grass’ at RT=4.3 minutes, diagnostic fragment ions m/z 119 and m/z 91 and the 13C isotope for amphetamine are observed. Amphetamine is truly detected as posi-tive finding from the screening result.
To facilitate comprehensive screening for hundreds of target compounds, the Bruker ToxScreener™ and PesticideScreener™ solutions are supported by high quality accurate mass databases, enabling users to readily process the data and obtain accurate, reliable scree-ning results.
Amphetamine

Bru
ker
Dal
toni
cs is
con
tinua
lly im
prov
ing
its p
rodu
cts
and
rese
rves
the
rig
ht
to c
hang
e sp
ecifi
catio
ns w
ithou
t no
tice.
© B
DA
L 0
6-2
014,
182
94
33
Bruker Daltonik GmbH
Bremen · GermanyPhone +49 (0)421-2205-0Fax +49 (0)[email protected]
Bruker Daltonics Inc.
Billerica, MA · USA Fremont, CA · USAPhone +1 (978) 663-3660 Phone +1 (510) 683-4300Fax +1 (978) 667-5993 Fax +1 (510) [email protected] [email protected]
www.bruker.com
For research use only. Not for use in diagnostic procedures.
Dynamic Source ConfigurationIn addition to ESI sources, Bruker life science MS systems support a wide range of source options from Bruker and third-party vendors, all switchable within seconds.
APCI with DIPAPPI CaptiveSpray nanoBooster
CaptiveSpray™ nanoBoosterCaptiveSpray nanoBooster is the proteomics ion source that brings your MS to the next performance level – The operation is as easy as electrospray can be. The nanoBooster enables Glycoanalysis, supercharging and pushes up ID rates.
ionBoosterThe ionBooster offers a 5–100x gain in sensitiv-ity for many compounds of interest in the fields of environmental analysis, food testing and therapeutic drug monitoring.
APCIAtmospheric Pressure Chemical Ionization is used in metabolomics as well as for drug or pes-ticide screening for less polar molecules where ESI fails to deliver reasonable quantities of ions.
APPIAtmospheric Pressure Photo Ionization is used for less polar or non-polar molecules that can not be ionized in either ESI or APCI.
DIPThe DirectProbe add-on for the Bruker APCI II and APPI II ion sources allows direct analysis of liquid and solid samples without tedious sample preparation.
GC-APCI IIThe GC-APCI II source with unique flexible, heated transfer line and calibrant delivery enables GC coupling to any Bruker TOF or QTOF, trap or FTMS system originally designed for LC coupling.
“We have been using the impact since almost a year for routine shotgun bottom up pro-teomics. In association with the CaptiveSpray nanoBooster, the instrument has provided an excellent level of sustainable performances, being capable of delivering untouched performances for over 6-8 weeks of 24/7 use. This is of tremendous importance for the success of our label-free measurement campaigns”Prof. Alain Van Dorsselaer, LSMBO, Strasbourg
GC-APCI II