impact of advt of fair and lovely on student … issue-11 full paper...fairness cream. now a number...
TRANSCRIPT

Rajashri Ramesh Chavan / Impact of Advt of Fair and Lovely on Student Customers in Satara
Contact Us : [email protected] ; submit paper : [email protected] download full paper : www.arseam.com 94
www.arseam.com
Impact Factor: 0.98
IMPACT OF ADVT OF FAIR AND LOVELY ON
STUDENT CUSTOMERS IN SATARA
Dr. Rajashri Ramesh Chavan Asst. Professor
Karmaveer Bhaurao Patil Institute of Management Studies and Research,
Varye, Satara.
ABSTRACT
Objectives: Fair and Lovely is a well-known brand of HUL, popular among the young generation in
cosmetics. The company regularly emphasizes on the advertisement to attract the customer and to
survive in changing competition. Earlier, it was a first popular established brand in cosmetics in
fairness cream. Now a number of brands Nivea, Fairever, Olay, Vicco, Himani, Ponds etc. are
competing with them. Therefore, there is need to assess the ad impact on the customers and to know
their perception towards the product.
Design/Methodology/Approach- The present research paper is field survey and based on primary
data as well as secondary data. Primary data collected through the instrument schedule and other
information availed from the internet. It was executed on 300 students at a college campus. Collected
data analyzed with simple statistical tools viz. percentage, mean and standard deviation and presented
with tabulation. Two hypotheses were set to test viz. H01: Gender and respondents’ opinion are not
significantly correlated. H 02: Gender and respondent’ perception towards the product features’
importance are not significantly correlated.
Findings- Majority respondents were below 25 age, female respondents have a more positive reaction
towards ad compare to male, female respondents are more like to purchase offered product in the
advertisement. Respondents’ television watching frequency is less than 2 hours in a week. Female
watching frequency is more compared to male respondents. Respondents felt almost all product
features important which are shown in the advertisement. Majority i.e. 76.67% opined that
advertisement appeal to them and there is no gender difference in their opinion. They showed their
interest to see the ad in near future. The null hypotheses are rejected and alternative hypotheses are
accepted as. Gender and respondents’ opinion are significantly correlated and gender and perception
towards the product features’ importance are significantly correlated.
Limitations: The responses collected during 2014-15, responses were nothing but the perception of
students, and it may change in future. The result which is obtained in selected area i.e. Satara may not
be similar in other metro towns and small cities.

International Journal of Marketing & Financial Management, Volume 3, Issue 11, Dec-2015,
pp 94-106 ISSN: 2348 –3954 (Online) ISSN: 2349 –2546 (Print), Impact factor: 0.98
Contact Us : [email protected] ; submit paper : [email protected] download full paper : www.arseam.com 95
Practical Implications- Paper offer the guidelines to the company to design the ad to tap the rural or
small town customer and to decide the frequency of ad to suffice the purpose of advertisement. So
that efforts would not be in vein since the customization is the need of today’s era.
Originality/Value- Paper comprises with students responses collected from management campus
where budding manager students are more conscious of their attire and presentation. In the era of
customization and competition, one should keep a close watch on the effects of marketing efforts.
Key Words- Advertisement, Impact, Students Perception, Fair and Lovely
Introduction
India’s cosmetics industry estimated at $950 million and is expected to grow to about $2.68 billion by
2020. Annual growth of the Indian beauty and cosmetics markets is estimated to remain in the range
of 15-20 % in the coming years, twice as fast as that of the US and European markets. Greater
awareness in India of the latest global beauty and cosmetics trends are prompting international players
to set up their shop in India. Demand for skin whitening products by men as well as women and
moisturizers are driving the trend. Over the last five years, cosmetics products have seen a growth of
60%. Companies like Pond’s and Fair & Lovely top the list. It observed that Indian rural market offers
huge opportunities to the marketers as it is in developing stage and account 80 per cent consumers.
The lifestyles of rural consumers have undergone wonderful changes due to growing incomes,
increasing literacy rate, exposure TV and interaction with the urban counterpart. Advertisements,
especially in television are targeted to a Youth. Youth are bombarded with powerful advertising
messages from various media, which are, designed to win their heart. Every business organization is
spending a huge amount for this. It is the common perception that many Indian women are partial
towards the fairer skin. Recently, noted dermatologists commented that people are now openly asking
for a solution to something that has been an obsession through the ages. Equating fairness with beauty
has turned out to be a key consumer insight in the case of the fairness creams industry. Hindustan
Unilever captures nearly 53% of the market share with Fair & Lovely. Fair & Lovely was first
developed and launched in the year 1976. The company has drawn particular scrutiny for its
promotions and advertisements featuring darker skinned women turning fairer on using the fairness
cream. Hindustan Unilever Limited currently spends about 5-10% of its total marketing budget on
digital.
Researcher gone through the various previous literatures and could notice the findings of research as
follows
Literature Review
(Lee, 1995) The paper investigates the role of consumers' attitude toward the brand advertising on the
accessibility and perceived appropriateness of the brand attributes in their perception of a brand
Rajashri Ramesh Chavan / Impact of Advt of Fair and Lovely on Student Customers in Satara
Contact Us : [email protected] ; submit paper : [email protected] download full paper : www.arseam.com 96
extension. The effect is examined either for a comparable extension (sneakers from denim clothing) or
for a moderately non-comparable extension (perfume/cologne from denim clothing). The result shows
that the accessibility of the brand attributes is observed in a similar pattern for both comparable and
moderately non-comparable extensions. Advertisement strongly influences consumers' overall attitude
toward a brand extension, with the effect being greater for a moderately non-comparable extension
than for a comparable extension.
(Soscia, 2009) Study find out that comparative advertising’s effect depends on consumers’ perceived
differentiation among the brands and consumers’ level of involvement with the specific product
category. Finding demonstrate that high-involvement consumer perceive low differentiation among
brands
(Speck, 1998)The study could find out that the perception of advertising clutter is highest in
television and direct mail while the highest level of advertising-related communication problems was
observed in television and magazines.
(Young, 1986) Results indicate that the effect of music on brand attitude depends on the type and
level of involvement. Music had a facilitative effect on brand attitude for subjects in the low
involvement condition and a distracting effect for those in the cognitive involvement condition; its
effect for those in the affective involvement condition was not clear.
(Weinberg, 1984) The study was undertaken to investigate the perception, attitude, and cognitive
response to the advertisement.
(Milesh, 2012) The study tries to measure the effect of some selected FMCG product's television
advertisements with commonly used negative emotional appeals on cognitive message processing
style of Indian housewives.
(Edwards, 2006) The study could find out that 14% to 24% felt that advertising orthodontists would
offer a lower quality of care than non-advertising orthodontists would. Newspaper, magazine, and
direct mail advertisements were viewed more favourably than radio, television, and billboard
advertisements.
(Chowdhury, 2006) Study find out that three extrinsic cues: brand image, perceived quality, and
perceived country of origin have a positive and significant influence on consumers' brand evaluation
of beautification brands. Only perceived price has shown no such influence on consumers’ brand
evaluation.
(Qurat-UJ-Ain Zafar) The study arrived at the conclusion that celebrity endorsements do have an
impact on customer’s perception and purchase intention.

International Journal of Marketing & Financial Management, Volume 3, Issue 11, Dec-2015,
pp 94-106 ISSN: 2348 –3954 (Online) ISSN: 2349 –2546 (Print), Impact factor: 0.98
Contact Us : [email protected] ; submit paper : [email protected] download full paper : www.arseam.com 97
(Kauser Hayat) Results show that celebrity endorsed advertising is very much eye-catching and
influential as compared to non-celebrity endorsements. Celebrity endorsed advertising attributes do
affect the purchase intention of consumers. It proves that consumer perception based advertisement &
celebrity endorsed advertising positively impact the purchase intention of the consumers.
(Lodhi, 2015) Study find out that advertisements are very useful in creating the awareness among the
people but they are failed to build strong perceptions in the mind of consumers. Also, highlight that
consumer awareness and consumer perceptions will motivate the consumer to buy a certain product if
there is a positive relationship present in between them.
After taking the review from previous literature researcher could find out that there is no any research
conducted to assess the student response towards advertisement of Fair and Lovely in Satara as Satara
is upcoming in rural market. Thus, efforts made to probe into the situation.
Research Methodology
Fair & Lovely was launched in the year 1976. It is going well with its high market share. It is
competing with the brands like Nivea, Fairever, Olay, Vicco, Himani, Ponds etc. Advertisements play
a very important role in improving the market share. Hindustan Unilever Limited currently spends
about 5-10% of its total marketing budget on digital. Therefore, there is a need to measure the
effectiveness of television advertisements on the student customer in Satara with respect to Fair &
Lovely of Hindustan Unilever Limited and to know the customer perception towards it.
To suffice the said purpose following objectives are set
1. To assess the ad impact on the customers
2. To know customers perception towards the product
Two hypotheses were set to test viz.
H01: Gender and respondents’ opinion are not significantly correlated
H 02 : Gender and respondent’ perception towards the product features’ importance are not
significantly correlated
The study is confined to television advertisements of Fair & Lovely of Hindustan Unilever Limited.
Survey conducted at some technical and professional college campus in Satara City. A structured
questionnaire was prepared to take the responses of total 300 samples comprises with girl and boy
students those are available on the college campus. Only Fair and Lovely users are considered as the
sample unit. Collected data analyzed with the help of simple statistical tools such as percentage, mean
and hypotheses tested with Pearson mean correlation. The period of study is 2014-2015
Data Analysis
Rajashri Ramesh Chavan / Impact of Advt of Fair and Lovely on Student Customers in Satara
Contact Us : [email protected] ; submit paper : [email protected] download full paper : www.arseam.com 98
The product Fair & Lovely is consumed by many users and majority of them treat this product of high
quality and important for the face. It is also found that majority of these users make its use for fairness
than other uses such as sunscreen, dark spots, face clean up, fragrance, etc. as shown in the
advertisement. After watching the advertisement and using the product almost half of the respondents
recommend it to others for usage.
Findings
Female respondent (56.67%) are more than male respondent 43.33%. Almost (98.33%) respondents
are below 25 age. Frequency to see the ad in a weekly in the range of once to five plus in both the
gender, not much gender difference in frequency. Majority respondent 76.67% felt advertisement
appeal to the customer and here also no gender difference in the opinion. Majority 80% respondents
agreed to have a positive reaction towards advertisement and female percentage is more than male
ones. Majority 73.33% respondent like to see the ad in future where the female percentage is more
than male ones. 72% respondent like to purchase a more offered product where the female percentage
is more than male ones. 58% respondent like to share ad to someone where female percentage found
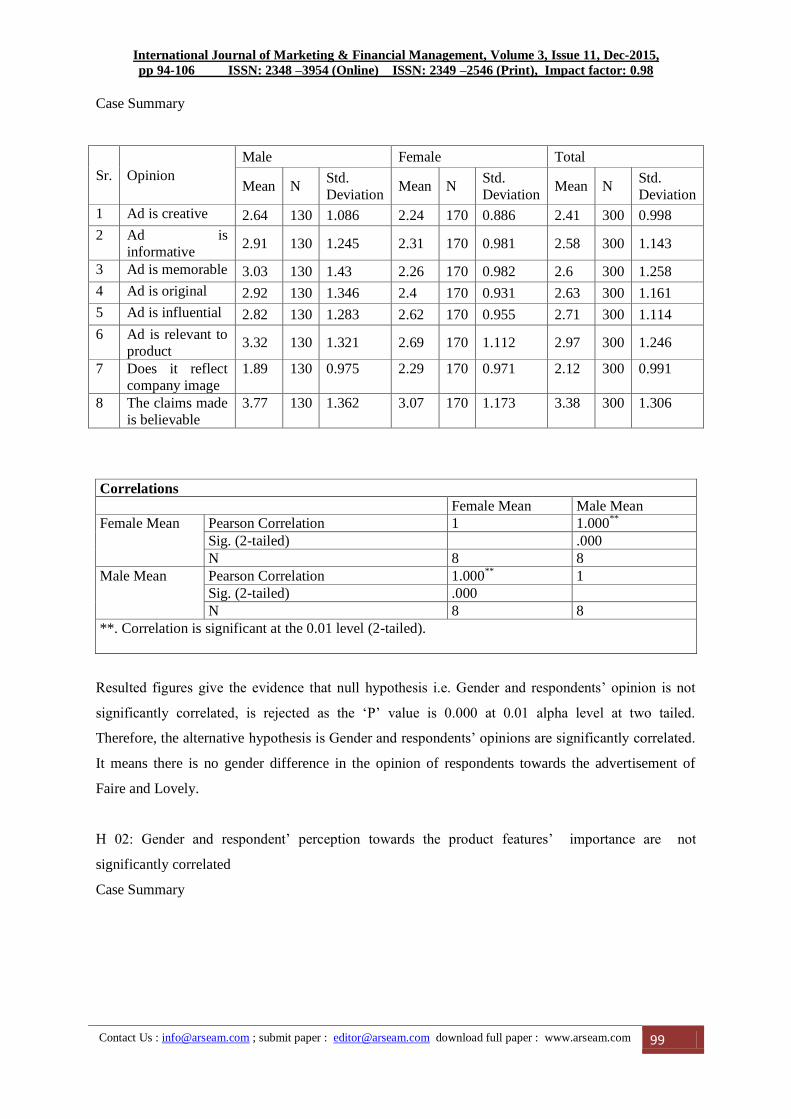
more compared to male. Respondents agree with given statement viz. The ad is creative, informative,
memorable, original, influential, relevant to the product, reflect company image etc as the mean score
is more than 2 and less than 3 with higher deviation. It reveals that respondents are not much
conscious to register their opinion towards the perception of the ad. However, they are agreed with the
statement that the claims made into ad are believable as the mean score is more than 3. There is no
gender difference in the opinion on the said statements.
Collected data does not give the strong opinion on ad message, no uniformity in the respondents
opinion towards given statement as just trying to sell the product, a product is of high quality, entice
people to try the product, cheaper than the competitors and brand awareness, a company trying to
expose itself. As the opinion lies from the 38% to 7.33% and not distinct gender difference in the
opinion. 41% respondents watching frequency is less than hour in a day followed by 34% samples
watching frequency is 1-2 hours. It reveals that majority of respondents watching frequency is less
than 2 hours. Female watching frequency is more than male ones. Respondents felt almost all product
features important as the mean score is more than 2 but less than 3. There is no gender difference in
the opinion. Male 44% respondents registered their perception, as the ad is memorable and creative
whereas 25.88% female felt creative and 11.76% think it is memorable. There is no uniformity in the
opinion between both the genders as well within the female respondents have the difference of
perception about the advertisement.
Hypotheses Testing
H01: Gender and respondents’ opinion are not significantly correlated
International Journal of Marketing & Financial Management, Volume 3, Issue 11, Dec-2015,
pp 94-106 ISSN: 2348 –3954 (Online) ISSN: 2349 –2546 (Print), Impact factor: 0.98
Contact Us : [email protected] ; submit paper : [email protected] download full paper : www.arseam.com 99
Case Summary
Sr. Opinion
Male Female Total
Mean N Std.
Deviation Mean N
Std.
Deviation Mean N
Std.
Deviation
1 Ad is creative 2.64 130 1.086 2.24 170 0.886 2.41 300 0.998
2 Ad is
informative 2.91 130 1.245 2.31 170 0.981 2.58 300 1.143
3 Ad is memorable 3.03 130 1.43 2.26 170 0.982 2.6 300 1.258
4 Ad is original 2.92 130 1.346 2.4 170 0.931 2.63 300 1.161
5 Ad is influential 2.82 130 1.283 2.62 170 0.955 2.71 300 1.114
6 Ad is relevant to
product 3.32 130 1.321 2.69 170 1.112 2.97 300 1.246
7 Does it reflect
company image
1.89 130 0.975 2.29 170 0.971 2.12 300 0.991
8 The claims made
is believable
3.77 130 1.362 3.07 170 1.173 3.38 300 1.306
Correlations
Female Mean Male Mean
Female Mean Pearson Correlation 1 1.000**
Sig. (2-tailed) .000
N 8 8
Male Mean Pearson Correlation 1.000**
1
Sig. (2-tailed) .000
N 8 8
**. Correlation is significant at the 0.01 level (2-tailed).
Resulted figures give the evidence that null hypothesis i.e. Gender and respondents’ opinion is not
significantly correlated, is rejected as the ‘P’ value is 0.000 at 0.01 alpha level at two tailed.
Therefore, the alternative hypothesis is Gender and respondents’ opinions are significantly correlated.
It means there is no gender difference in the opinion of respondents towards the advertisement of
Faire and Lovely.
H 02: Gender and respondent’ perception towards the product features’ importance are not
significantly correlated
Case Summary

Rajashri Ramesh Chavan / Impact of Advt of Fair and Lovely on Student Customers in Satara
Contact Us : [email protected] ; submit paper : [email protected] download full paper : www.arseam.com 100
Sr. Product
Features
Male Female Total
Mean N Std.
Deviation Mean N
Std.
Deviation Mean N
Std.
Deviation
1 Fairness 2.89 130 1.399 2.43 170 1.277 2.63 300 1.351
2 Dark
Spots 2.92 130 1.496 2.20 170 1.223 2.52 300 1.396
3 Pimples 2.67 130 1.507 2.15 170 1.278 2.38 300 1.405
4 Under Eye
treatment 3.17 130 1.458 2.33 170 1.315 2.70 300 1.439
5 Skin
Dullness 2.73 130 1.488 2.32 170 1.291 2.50 300 1.394
Correlations
Mean of male Mean of female
Mean of male Pearson Correlation 1 1.000**
Sig. (2-tailed) .000
N 5 5
Mean of female Pearson Correlation 1.000**
1
Sig. (2-tailed) .000
N 5 5
**. Correlation is significant at the 0.01 level (2-tailed).
Results shows that null hypotheses i.e. Gender and respondent’ perception towards the product
features’ importance are not significantly correlated, is rejected as the ‘P’ value is 0.000 at two tailed
with alpha level 0.01. Therefore, the alternative hypothesis is selected that gender and perception
towards the importance of features of product is significantly correlated. It means there is no gender
difference into the perception of respondents regarding importance of product (Fair and Lovely)
features.
Limitations and Scope for future work
The responses collected during 2014-15, responses were nothing but the perception of students, and it
may change in future. The result which is obtained in selected area Satara, may not generalize to other
areas and with other customers as sample selected were students.
There is future scope to investigate brand awareness and their brand perception towards the Fair and
Lovely, factors influence the positive perception, advertising clutter impact and to check a brand
endorsement influence on purchase intention. Also scope to work on to compare the ad impact of Fair
and Lovely with other school-going students.
Conclusion
The advertisements of Fair & Lovely have changed from time to time since its launching. Where
young generation presented in both genders. However, females are more preferred of Fair and
Lovely than males. The result of collected data reveals that there is no gender difference regarding the
International Journal of Marketing & Financial Management, Volume 3, Issue 11, Dec-2015,
pp 94-106 ISSN: 2348 –3954 (Online) ISSN: 2349 –2546 (Print), Impact factor: 0.98
Contact Us : [email protected] ; submit paper : [email protected] download full paper : www.arseam.com 101
ad message and perception towards the importance of features of the product. It indicates the
marketing efforts of Fair and Lovely, ad message is successful in creating the right perception among
the respondents, and there was no scope left for perceptual distortion about this fairness cream.
Therefore, researcher finds scope to sell this product to all and not to a specific female segment. Since
the male is also now becoming look caution that emerges male parlor in Satara.
Managerial Implications
Fairness is considered as a part of Personality Development by young generation irrespective of
gender, nature of qualification. Ad influences buyer but the frequency of watching of the ad makes the
difference in making of positive perception. Therefore, the marketer needs to take effort in holding the
attention of viewers and make them watch more frequently. The content of the ad should match the
target customer and environment of ad presentation should suit to the current young generation.
Therefore, there is a need to change the punch line 'Sirf cream nahi, fairness treatment hai', should
highlight on graceful, smart look and enrich personality also which can match to the current young
generation as today’s young generation is more rational, conscious about health and personality, does
not like to spend much and not dreamy they need solution to overcome their problem. So make the
sachet available similar like a shampoo price as one-time use and allow the customer for the
experience.

Rajashri Ramesh Chavan / Impact of Advt of Fair and Lovely on Student Customers in Satara
Contact Us : [email protected] ; submit paper : [email protected] download full paper : www.arseam.com 102
Annexure: 1
Table 1 Sample Distribution as per Gender
Table 2 Sample Distribution as per Age
Sr. Age Group Male % Female % Total %
1 Below 25 129 99.23 166 97.65 295.00 98.33
2 25-35 1 0.77 4 2.35 5.00 1.67
Total 130 100 170 100 300 100
Table 3 Frequency to seen ad on Television in a week
Sr. Times Male % Female % Total %
1 Once 4 3.08 4 2.35 8 2.67
2 Two 10 7.69 22 12.94 32 10.67
3 Three 22 16.92 24 14.12 46 15.33
4 Four 30 23.08 48 28.24 78 26.00
5 Five
Plus 64 49.23 72 42.35 136 45.33
Total 130 100.00 170 100.00 300 100.00
No single customer found that he has nver seen the ad
Table 4 Opinion on Advt Appeal
Sr. Opinion Male % Female % Total %
1 Yes 102 78.46 128 75.29 230 76.67
2 No 28 21.54 42 24.71 70 23.33
Total 130 100.00 170 100 300 100.00
Table 5 Positive Reaction towards advertisement
Sr. Opinion Male % Female % Total %
1 Yes 96 73.85 144 84.71 240 80
2 No 34 26.15 26 15.29 60 20
Total 130 100.00 170 100.00 300 100
Gender Frq %
Female 170 56.67
Male 130 43.33
Total 300 100.00

International Journal of Marketing & Financial Management, Volume 3, Issue 11, Dec-2015,
pp 94-106 ISSN: 2348 –3954 (Online) ISSN: 2349 –2546 (Print), Impact factor: 0.98
Contact Us : [email protected] ; submit paper : [email protected] download full paper : www.arseam.com 103
Table 6 Sample Customer Like to See the ad in Future
Sr. Opinion Male % Female % Total %
1 Yes 90 69.23 130 76.47 220 73.33
2 NO 40 30.77 40 23.53 80 26.67
Total 130 100.00 170 100.00 300 100.00
Table 7 Sample Customer More Likely to Purchase offered Product
Sr. Opinion Male % Female % Total %
1 Yes 86 66.15 130 76.47 216 72
2 No 44 33.85 40 23.53 84 28
Total 130 100.00 170 100.00 300 100
Table 8 Sample Customer Like to Share ad to Someone
Sr. Opinion Male % Female % Total %
1 Yes 62 47.69 112 65.88 174 58
2 No 68 52.31 58 34.12 126 42
Total 130 100.00 170 100.00 300 100
Table 9 Opinion of Sample on Fair & Lovely Ad
Sr. Statement Female Male Total
Mean S.D. Mean S.D. Mean S.D.
1 Is it creative 2.40 0.99 2.41 0.99 2.40 0.99
2 Is it informative 2.56 1.14 2.57 1.14 2.56 1.14
3 Is it memorable 2.59 1.25 2.60 1.25 2.59 1.25
4 Is it original 2.62 1.16 2.63 1.16 2.62 1.16
5 Is it influential 2.70 1.11 2.71 1.11 2.70 1.11
6 Is it relevant to
product
2.96 1.24 2.97 1.24 2.96 1.24
7 Does it reflect
company image
2.11 0.99 2.11 0.99 2.11 0.99
8 The claims made is
believable
3.36 1.31 3.37 1.30 3.36 1.31

Rajashri Ramesh Chavan / Impact of Advt of Fair and Lovely on Student Customers in Satara
Contact Us : [email protected] ; submit paper : [email protected] download full paper : www.arseam.com 104
Table 10 Samples Opinion on ad message
Sr. Opinion Male % Female % Total %
1 Just trying to sell the product 60 46.15 56 32.94 116 38.67
2 Product is of high quality 20 15.38 18 10.59 38 12.67
3 Entice people to try the
product 0 0.00 56 32.94 56 18.67
4 Cheaper than the competitors 16 12.31 6 3.53 22 7.33
5 Brand awareness, company
trying to expose itself 20 15.38 26 15.29 46 15.33
6 Other 14 10.77 8 4.71 22 7.33
Total 130 100.00 170 100.00 300 100.00
Table 11 Sample’s Telivision Watching Frequency in a Day
Sr. Watching Frequency Male % Female % Total %
1 None 12 9.23 6 3.53 18 6
2 Less than 1 hour 52 40.00 72 42.35 124 41.33
3 1-2 hours 50 38.46 52 30.59 102 34.00
4 3-4 hours 4 3.08 24 14.12 28 9.33
5 More than 4 hours 12 9.23 16 9.41 28 9.33
Total 130 100.00 170 100.00 300 100
Table 12 Sample Opinion on Importance of Product Features
Sr. Product Features Male Female Total
Mean SD Mean SD Mean SD
1 Fairness 2.63 1.35 2.63 1.35 2.63 1.35
2 Dark Spots 2.51 1.39 2.51 1.39 2.51 1.40
3 Pimples 2.37 1.40 2.37 1.40 2.37 1.41
4 Under Eye
treatment 2.69 1.44 2.69 1.44 2.69 1.44
5 Skin Dullness 2.50 1.39 2.50 1.39 2.50 1.39
Table 13 Perception of Samples towards Fair & Lovely ad
Sr. Opinion Male Female Total

International Journal of Marketing & Financial Management, Volume 3, Issue 11, Dec-2015,
pp 94-106 ISSN: 2348 –3954 (Online) ISSN: 2349 –2546 (Print), Impact factor: 0.98
Contact Us : [email protected] ; submit paper : [email protected] download full paper : www.arseam.com 105
No. Frequency % Frequency % Frequency %
1 Memorable 44 33.85 20 11.76 64 21.33
2 Emotional 20 15.38 4 2.35 24 8.00
3 Creative 52 40.00 44 25.88 96 32.00
4 Attention Getting 24 18.46 30 17.65 54 18.00
5 Genuine 24 18.46 10 5.88 34 11.33
6 Unique 48 36.92 24 14.12 62 20.67
7 Cheerful 32 24.62 32 18.82 64 21.33
8 Informative 22 16.92 26 15.29 48 16.00
9 Boring 30 23.08 20 11.76 50 16.67
10 Satisfying 30 23.08 36 21.18 66 22.00
11 Offensive 16 12.31 0 0.00 16 5.33
12 Natural 30 23.08 34 20.00 64 21.33
13 Energetic 22 16.92 12 7.06 34 11.33
14 Honest 28 21.54 16 9.41 44 14.67
15 Pleasant 22 16.92 24 14.12 46 15.33
16 Irritating 22 16.92 4 2.35 26 8.67
17 Other 28 21.54 6 3.53 34 11.33
References:
1. Bernadette Kamleither, A. K. (2013). How using versus showing interaction between
characters and products boosts product placementeffectiveness. International Journal of
Advertising , 32 (4), 633-653.
2. Chowdhury, N. P. (2006). Consumer Evaluations of Beautification Products: Effects of
Extrinsic Cues. Asian Acedemy of Management Journal , 11 (2), 89-104.
3. Deborah A.Toomey, A. L. (2013). Branded Product Placement and Pre-teenaged
Consumers:Influence on Brand Preference and Choice. Young Consumers , 14 (2), 180-192.
4. Edwards, D. T. (2006). Media Advertising Effects on Consumer Perception of Orthodontic
Treatment Quality. Angle Orthodontist , 78 (5).
5. Jha, Manish; Sirohi, Rajeev; Madan, Suman; Arora, Shilpi, Impact of Advertisement on
Consumer Buying Behaviour in Two Wheeler Segment, May 2011, Journal of Marketing &
Communication;May2011, Vol. 7 Issue 1, p18.
6. Kauser Hayat, M. G. The Impact of Consumer Perception Based Advertisment and Celebrity
Advertisment on Brand Acceptance: A Case Study of the Peshwar market. Journal of
Managerial Sciences , ViI (1).

Rajashri Ramesh Chavan / Impact of Advt of Fair and Lovely on Student Customers in Satara
Contact Us : [email protected] ; submit paper : [email protected] download full paper : www.arseam.com 106
7. Lee, T. (1995). Role of Attitude Towards Brand Advertising on Consumer Perception of a
Brand Extension. Advances in Consumer Research , 22, 116-122.
8. Lieve Doucé · Wim Janssens · Sara Leroi-Werelds · Sandra Streukens ,What to diffuse in a
gender-specific store? The effect of male and female perfumes on customer value and
behaviour, Journal of Consumer Behaviour (Journal of Consumer Behaviour), publisher
Wiley
9. Lodhi, S. F. (2015). Impact of Advertisement on Buying Behaviour of the Consumers: Study
of Cosmetic Industry in Karachi City. Intenational Journal of Management Sciences and
Business Research , 4 (10).
10. M. Geetha Bai, Role of Family and Purchase Decision of Two WheelerManagement
Prudence JournalVolume 3 Issue 1 Published: 2012
11. Metin Argan, A. (2007). Audience Attitude Towards Product Placement in Movies. The
Journal of American Academy of Business, Cambridge , 11 (1).
12. Milesh, J. (2012). A Study on Effect of Negative Emoitonal Appeals on Cognitive Message
Processing Style of Indian Housewives with Specific Focus on FMCG Products' Television
Advertisements. Asian Journal of Research in Business Economics and Management , 2 (3).
13. Prachi, S. (2013). An Analytical Study on Covert Advertising: Product Placement in Indian
Cinema. International Journal of Research and Development- A Management
Review(IJRDMR) , 2 (1), 77-84.
14. Qurat-UJ-Ain Zafar, M. R. Impact of Celebrity Advertisement on Customers' Brand
Perception and Purchase Intention. Asian Journal of Business and Management Sciences , 1
(11), 53-67.
15. Soscia, I. (2009). The Effect of Comparative Advertising on Consumer Perceptions:
Similarity or Differentiation?
16. Speck, M. T. (1998). Consumer Perception of Advertising Clutter and its impact across
various media. Journal od Advertising Research , 29.
17. T., E. D. (2006). The Effect of Media Advertising on Consumer Perception of Orthodontic
Treatment Quality. Cirginia Commonwealth Univeristy.
18. Weinberg, G. J. (1984). The Impact of comparative Advertising on Perception and Attitude:
Some Positive Findings. Journal of Consumer Research , 11 (2), 719-727.
19. Young, C. P. (1986). Consumer Response to Television Commercials: The Impact of
Involvement and Background Music on Brand Attitude Formation. Journal of Marketing
Research , 23 (1), 11-24.
20. http://www.indianmirror.com/indian-industries/2014/cosmetics-2014.html, dated 21/02/2016