impact of an educational strategy to increase …
TRANSCRIPT

IMPACT OF AN EDUCATIONAL STRATEGY TO INCREASE KNOWLEDGE,
ATTITUDES, AND CONSUMPTION PATTERNS OF FRUITS AND VEGETABLES
AMONG HIGH SCHOOL STUDENTS IN A RURAL MIDWESTERN COMMUNITY
A THESIS
SUBMITTED TO THE GRADUATE SCHOOL
IN PARTIAL FULLFILLMENT OF THE REQUIREMENTS
FOR THE DEGREE
MASTERS OF SCIENCE IN DIETETICS
BY
MONICA R. DURHAM
ADVISOR- CAROL A. FRIESEN, PHD, RD, CD
BALL STATE UNIVERSITY
MUNCIE, INDIANA
July 2011

ii
ABSTRACT
THESIS: Impact of an Educational Strategy to Increase Nutrition Knowledge,
Attitudes, and Consumption Patterns of Fruits and Vegetables among High
School Students in a Rural Midwestern Community
STUDENT: Monica R. Durham
DEGREE: Master of Science
COLLEGE: Applied Sciences and Technology
DATE: July 2011
PAGES: 148
The purpose of this quasi-experimental study was to determine the impact of five
50-minute experiential lessons developed by the researcher on high school students‟
knowledge about, attitude toward, and consumption of fruits and vegetables. Subjects in
this study included a convenience sample of 41 high school students enrolled in Family
and Consumer Sciences classes at Crothersville Junior/Senior High School in
Crothersville, Indiana, in the spring semester of 2011. A pretest was given to students in
the Adult Roles class (control; n=19) and the Nutrition and Wellness class (treatment;
n=22), after which students in the treatment group received five lessons containing
additional depth and laboratory experiences where students prepared and tasted various
fruits and vegetables. At the conclusion of the lessons, and nine weeks after the unit, the
posttest was given to the control and treatment groups. Results indicated the lessons
significantly increased students‟ knowledge compared to the control group (7.8 ± 1.5 vs.
4.6 ± 2.4, F=26.27; p = 0.000), and nine weeks after the curriculum test (6.9 ± 2.1 vs. 5.3
± 2.9; F=4.46, p=0.041), but had a modest impact on these high school students‟ attitudes
toward and consumption of fruits and vegetables.

iii
ACKNOWLEDGEMENTS
I owe many thanks my thesis chair, Dr. Carol Friesen, for her incredibly selfless
dedication, hard work, encouragement, and commitment to the success of this project and
to my success as a graduate student. Dr. Friesen has an insanely busy schedule, and
rather than taking time for herself, she took time to help me and guide me through this
project. She is the true definition of dedication and passion.
I would also like to thank my mother, Mrs. Kaye Durham, for taking the time to
use my lesson plans in her Nutrition and Wellness class, and follow through with all
projects and lab experiences included in the lesson plans.
I would like to thank Dr. Jay Kandiah, Marla Kurtz, and Dr. Nancy Thompson for
serving on my committee and providing insightful and value input during my research.
Also, thanks to Dr. E for taking time to analyze the data in my research project.
Lastly, I would like to thank my family and friends that have stood by me
throughout this project, never giving up on me, lending a shoulder for me to cry on, and
encouraging me day in and day out. I would not be the person I am today without them
and their support.

iv
TABLE OF CONTENTS
PAGE
ACKNOWLEDGEMENTS ............................................................................................... iii
TABLE OF CONTENTS ................................................................................................... iv
LIST OF APPENDICES .................................................................................................. viii
LIST OF TABLES ............................................................................................................. ix
LIST OF FIGURES .............................................................................................................x
CHAPTER 1: INTRODUCTION .......................................................................................1
Problem ....................................................................................................................2
Purpose .....................................................................................................................3
Research Questions ..................................................................................................3
Rationale ..................................................................................................................4
Assumptions .............................................................................................................4
Definitions................................................................................................................5
Summary ..................................................................................................................6
CHAPTER 2: REVIEW OF LITERATURE ......................................................................7
National and State Standards in Family and Consumer Sciences............................7
Fruit and Vegetable Consumption of High School Students ...................................8
Importance of Fruits and Vegetables to Health .....................................................13
Methods to Assess Fruit and Vegetable Intake ......................................................17
Programs to Increase Fruit and Vegetable Intake in Children ...............................18
Nutrition Education in School Curriculums ..........................................................22
Programs to Increase Fruits and Vegetables in High School Students .................26

v
TABLE OF CONTENTS, CONT.
PAGE
Summary ................................................................................................................32
CHAPTER 3: METHODOLOGY ....................................................................................33
Institutional Review Board ....................................................................................33
Sample....................................................................................................................33
Instruments .............................................................................................................34
Fruit and Vegetable Student Survey ..........................................................34
Lesson Plans...............................................................................................35
Letter of Permission ...............................................................................................37
Letter of Information..............................................................................................37
Methods .................................................................................................................38
Statistical Analysis .................................................................................................39
Summary ................................................................................................................40
CHAPTER 4: RESULTS ..................................................................................................41
Subjects ..................................................................................................................41
RQ #1: Nutrition Knowledge ................................................................................43
RQ #2: Attitudes Toward Fruits and Vegetables ..................................................46
RQ #3: Consumption of Fruits and Vegetables ....................................................51
Recommended Cups of Fruit per Day .......................................................51
Recommended Cups of Vegetables per Day .............................................52
Fruits Consumed per Day ..........................................................................53
Vegetables Consumed per Day ..................................................................54
vi
TABLE OF CONTENTS, CONT.
PAGE
Choose Fruits as a Snack ...........................................................................56
Choose Vegetables as a Snack ...................................................................56
Select New Fruit if Offered ........................................................................57
Select New Vegetable if Offered ...............................................................57
Tried a New Fruit or Vegetable Lately .....................................................58
Eat School Lunch Fruit ..............................................................................59
Eat School Lunch Vegetables ....................................................................60
Pack Fruit in Lunch ....................................................................................61
Pack Vegetables in Lunch ..........................................................................62
Summary ................................................................................................................63
CHAPTER 5: DISCUSSION ............................................................................................64
RQ #1: Nutrition Knowledge ................................................................................64
RQ #2: Attitudes Toward Fruits and Vegetables ..................................................67
RQ #3: Consumption of Fruits and Vegetables ....................................................69
Recommended Cups of Fruit and Vegetables per Day ..............................69
Fruits and Vegetables Consumed per Day .................................................70
Choose Fruits or Vegetables as a Snack ....................................................73
Select New Fruit or Vegetable if Offered ..................................................74
Tried a New Fruit or Vegetable Lately .....................................................74
Eat School Lunch Fruits and Vegetables ...................................................75
Pack a Fruit or Vegetable at Lunch............................................................76

vii
TABLE OF CONTENTS, CONT.
PAGE
Summary ................................................................................................................77
CHAPTER 6: CONCLUSION AND RECOMMENDATIONS ......................................79
Conclusion .............................................................................................................79
Limitations .............................................................................................................80
Recommendations for Future Research .................................................................81
REFERENCES ..................................................................................................................82

viii
LIST OF APPENDICES
PAGE
Appendix A: Institutional Review Board Documents ..........................................88
A-1: Letter from Ball State IRB................................................................89
A-2: CITI Completion Certificate .............................................................90
Appendix B: Fruit and Vegetable Student Survey ................................................91
B-1: Pretest Survey Instrument .................................................................91
B-2: Posttest Survey Instrument ...............................................................98
B-3: Follow-Up Survey Instrument ........................................................110
Appendix C: Lesson Plans ..................................................................................110
C-1: Lesson Plan 1 ..................................................................................111
C-2: Lesson Plan 2 ..................................................................................119
C-3: Lesson Plan 3 ..................................................................................122
C-4: Lesson Plan 4 ..................................................................................125
C-5: Lesson Plan 5 ..................................................................................131
Appendix D: Letter of Permission ......................................................................135
Appendix E: Letter of Information .....................................................................137

ix
LIST OF TABLES
PAGE
Table 1 Description of Subjects in the Control and Treatment Groups ..................42
Table 2 Comparison of the Mean Fruit and Vegetable Knowledge Score
Between Experimental and Control Groups at Pre-Test, Post-Test,
and Two-Month Follow-Up .......................................................................43
Table 3 Percent of Students in the Treatment Group who Answered the
Knowledge Questions Correctly at Pre- and Posttest (n=22). ...................45
Table 4 Mean Cups of Fruit Students Thought they Should Eat Each Day ...........52
Table 5 Mean Cups of Vegetables Students Thought they Should Eat Each
Day .............................................................................................................53
Table 6 Mean Number of Cups of Fruit Usually Eaten per Day ............................54
Table 7 Mean Number of Cups of Vegetables Usually Eaten per Day ..................55
Table 8 Percent of Student who Responded “Yes” to the Statement “If a new
fruit or vegetable was served with you lunch today, would you try
it?” ..............................................................................................................58
Table 9 Percent of Students who Responded “Yes” to the Statement “I have
tried a new fruit or vegetable lately.” .........................................................59

x
LIST OF FIGURES
PAGE
Figure 1 Mean Knowledge Scores Comparing the Pretest, Post Test, and
Two-Month Follow-Up for the Control and Treatment Groups ................44
Figure 2 Comparison of Pre-and Posttest Responses in the Treatment Group
to the Statement “I am afraid to eat a fruit I never had before” .................47
Figure 3 Comparison of Pre-and Posttest Responses in the Treatment Group
to the Statement “I will eat almost any fruit” ............................................47
Figure 4 Comparison of Pre-and Posttest Responses in the Treatment Group
to the Statement “I am afraid to eat a vegetable I have never tried
before”........................................................................................................48
Figure 5 Comparison of Pre-and Posttest Reponses in the Treatment Group
to the Statement “I will eat almost any vegetable” ....................................49
Figure 6 Comparison of Pre-and Posttest Responses in the Treatment Group
Indicating the Fruits and Vegetables Students “Like a lot” .......................49
Figure 7 Comparison of Pre-and Posttest Responses in the Treatment Group
Indicating Fruits and Vegetables Students had “never tried” ....................50

CHAPTER 1
INTRODUCTION
Consuming the recommended number of servings of fruits and vegetables has
important health benefits, including a reduced risk for heart disease and stroke,
hypertension, adult onset diabetes, obesity, some types of cancer, diverticulitis, cataract
formation and macular degeneration (Appel et al.,1997; He, Nowson Lucas, &
MacGregor, 2007; He, Nowson & MacGregor, 2006; Hung, Joshipura & Jiang, 2004).
Fruits and vegetables provide micronutrients, fiber, antioxidants, and phytochemicals that
are needed in a healthy diet. Current dietary guidelines recommend that individuals who
consume a 2000 calorie diet should consume four and one-half cups of fruits and
vegetables daily, with higher or lower amounts recommended (e.g., 2 ½ to 6 ½ cups or 5
to 13 servings) based on the individual‟s caloric level (MyPyramid.gov, 2011).
Analysis of two-day, 24-hour recall data from the 2003-2004 National Health and
Nutrition Examination Survey (NHANES) indicated fewer than one in ten Americans
meet their calorie-specific MyPyramid fruit or vegetable recommendations (Kimmons,
Gillespie, Seymour, Serdula & Blanck, 2009). NHANES and Youth Risk Behavior
Surveillance Survey (YRBSS) data consistently indicate most population groups,
including teenagers, are at nutrition risk due to their low consumption of fruits and
vegetables (CDC, 2010a). The 2007 YRBSS indicated only 21.4 percent of students had

2
eaten the recommended five or more servings of fruits and vegetables per day over the
seven days preceding the survey (DHHS-CDC, 2007). In 2009, only 22.3 percent of the
16,057 teenagers who completed the survey reported having eaten fruits and vegetables
five or more times per day (e.g., 100% fruit juices, fruit, green salad, potatoes [excluding
French fries, fried potatoes, or potato chips], carrots, or other vegetables) during the
seven days before the survey (CDC, 2010b).
Adolescents establish patterns of behavior and make lifestyle choices that affect
their future health during their transition from childhood to adulthood, often struggling
with behaviors such as physical activity and nutrition, which will affect their risk of
developing chronic diseases in adulthood (Hendricks, Murdaugh & Pender, 2006). As
such, identifying effective ways to increase adolescents‟ fruit and vegetable consumption
can serve as an important public health strategy for the reduction of risk for chronic
disease. However, few studies in the literature have been identified that focus
specifically on the development of effective strategies to increase fruit and vegetable
consumption for adolescents. To address this issue, Mao et al. (2010) suggested
intervention strategies for adolescents should aim at improving awareness of the health
benefits of fruit and vegetable intake and promoting confidence in their ability to
consume the recommended servings.
Problem
Students in middle and high school are faced with a plethora of food choices that
challenge their ability to consume a healthful diet (Ehrens & Weber, 2009). Although
consuming adequate fruits and vegetables is associated with a reduced risk for chronic

3
disease, YRBSS data indicate only one in five high school students eat the recommended
five or more servings of fruits and vegetables per day (DHHS-CDC, 2007). Creative,
effective ways to encourage high school students to increase their consumption of fruits
and vegetables are needed.
Purpose
The purpose of this quasi-experimental study was to determine the impact of five
50-minute nutrition lessons and cooking demonstrations/labs developed by this
researcher on high school students‟ knowledge, attitude, and food consumption behavior
of fruits and vegetables.
Research Questions
This study addressed the following research questions:
1) Will completion of a five-day experiential unit that emphasizes nutrition
knowledge and preparation of fruits and vegetables be associated with an
increased knowledge about fruits and vegetables:
a. Immediately upon completion of the unit?
b. Nine weeks after completion of the unit?
2) Will completion of a five-day experiential unit that emphasizes nutrition
knowledge and preparation of fruits and vegetables be associated with a more
positive attitude toward fruits and vegetables?

4
3) Will completion of a five-day experiential unit that emphasizes nutrition
knowledge and preparation of fruits and vegetables be associated with an
increased consumption of fruits and vegetables?
Rationale
Few American adolescents consume the daily recommended amount of fruits or
vegetables (DHHS-CDC, 2007). Increasing America's fruit and vegetable consumption
is an important public health strategy for weight management and reduction of risk for
chronic disease. Implementing a five-day, hands-on curriculum that emphasizes the
health benefits, preparation methods, and taste-testing of a variety of fruits and vegetables
in a high school Family and Consumer Sciences class might be an effective way to
increase the fruit and vegetable consumption of adolescents.
Assumptions
The researcher makes the following assumptions in the implementation of the
study and in the interpretation of the data:
1) The students will be truthful in their answers;
2) The students will be present for all five days of the intervention;
3) The survey questions will be an adequate proxy to measure the nutrition
knowledge, attitudes, and food consumption behaviors of adolescents;
4) Students in the control group have not previously taken the food and nutrition
course;
5) The classroom teacher will implement the lesson plans exactly as described.

5
Definitions
For the purpose of this study, the following definitions will be used:
1. Phytochemicals - also called phytonutrient. Any of various bioactive chemical
compounds found in plants that act as antioxidants; these compounds are
considered to be beneficial to human health (Dictionary.com, 2010).
2. Free radicals - molecules produced when your body breaks down food or by
environmental exposures such as tobacco smoke or radiation. Free radicals can
damage cells, and may play a role in heart disease, cancer and other diseases
(Dictionary.com, 2010).
3. Antioxidant - substances that may protect your cells against the effects of free
radicals. Antioxidant substances include beta-carotene, lutein, lycopene,
selenium, vitamin A, vitamin C, and vitamin E. Antioxidants are found in many
foods, including fruits and vegetables, nuts, grains, and some meats, poultry and
fish (MedlinePlus, 2010).
4. YRBSS (Youth Risk Behavior Surveillance Survey) - a nationwide survey led and
funded by the Centers for Disease Control and Prevention (CDC) that monitors
students‟ health risks and behaviors in the following six categories: 1) weight and
diet, 2) physical activity, 3) injury and violence, 4) tobacco use, 5) alcohol and
other drug use, and 6) sexual behaviors. The YRBSS is conducted every two
years. Data from individual students and schools are confidential. The CDC
analyzes the data and provides results to each participating state (IN.gov, 2010).
5. NHANES (National Healthy and Nutrition Examination Survey) - NHANES is
part of the federal government‟s ongoing nutrition surveillance system.

6
NHANES is designed to assess the health and nutritional status of a cross-section
of adults and children in the United States through interviews and physical
examinations (CDC, 2010).
6. High School - a school, especially in the United States, usually including grades
9-12 or 10-12 (Dictionary.com, 2010).
7. NASAFACS (National Association of State Administrators of Family and
Consumer Sciences Education) - The national standards for Family and Consumer
Sciences (FACS) that drive the FACS curriculum were developed by the
NASAFACS. The curriculum standards organize the subject matter and
processes of Family and Consumer Sciences Education, provide a strong and clear
conceptualization of the field, and establish a common direction for program
development and revision at the national, state, and local levels (NASAFACS,
2008).
Summary
An adequate consumption of fruits and vegetables is critical to promoting good
health. Fruits and vegetables contain essential vitamins, minerals, and fiber that may help
protect individuals from chronic diseases (USDA/DHHS, Dietary Guidelines for
Americans, 2010). The purpose of this study was to examine the impact of a series of
five nutrition lessons and cooking demonstrations/labs developed by this researcher on
high school students‟ knowledge, attitude, and food consumption behavior of fruits and
vegetables.

CHAPTER 2
REVIEW OF LITERATURE
The purpose of this quasi-experimental study was to determine the impact of five
50-minute nutrition lessons and cooking demonstrations/labs developed by this
researcher on high school students‟ knowledge, attitude, and food consumption behavior
of fruits and vegetables. This chapter will present a review of the literature that describes
the role of the National Association of State Administrators for Family and Consumer
Sciences Education in the development of national standards related to nutrition and
wellness, current fruit and vegetable consumption of high school students, the impact of
fruits and vegetables on health, methods to assess fruit and vegetable intake, and
programs that have been developed in an effort to increase the fruit and vegetable intake
among children and high school students, both in the school and the community.
National and State Standards in Family and Consumer Sciences
The National Association of State Administrators for Family and Consumer
Sciences Education (NASAFACS) was the first organization that developed national
standards for Family and Consumer Sciences. The NASAFACS provides the framework

8
for national, state, and local programs that prepare students for family life, work life, and
careers in Family and Consumer Sciences by empowering individuals and families across
the life span to manage the challenges of living and working in a diverse global society
(NASAFACS, 2008).
The national standards used in this study were selected from the nutrition and
wellness area of study. The state of Indiana has adopted these national standards to be
used in Family and Consumer Sciences classes (Department of Education, 2010). The
national standards include students‟ ability to:
14.1 Analyze factors that influence nutrition and wellness practices across the life
span;
14.2 Evaluate the nutritional needs of individuals and families in relation to health and
wellness across the life span;
14.3 Demonstrate ability to acquire, handle, and use foods to meet nutrition and
wellness needs of individuals and families across the life span;
14.4 Evaluate factors that affect food safety from production through consumption; and
14.5 Evaluate the influence of science and technology on food composition, safety, and
other issues.
Fruit and Vegetable Consumption of High School Students
Dietary Guidelines for Americans currently recommend the consumption of a
minimum of five servings of fruits and vegetables per day (USDA/DHHS, 2010;
MyPyramid.gov, 2011), yet studies show that most populations, including adolescents,

9
consistently do not reach this goal (Casagrande, Wang, Anderson, & Gary, 2007;
Kimmons et al., 2009; CDC, 2010b).
Kimmons et al. (2009) analyzed data from two, 24-hour dietary recalls from the
2003-2004 National Health and Nutrition Examination Survey (NHANES) to determine
the median fruit and vegetable consumption from all dietary sources among adolescent
and adult consumers, the percentage of adolescents and adults meeting individual
recommended intake levels based on caloric requirements, consumption levels among
various demographic groups, intake levels from subtypes of fruits and vegetables, and
primary contributors to fruit and vegetable intake. The study included dietary
contributions of fruits and vegetables from all dietary sources. Results indicated fewer
than one in ten Americans meet their specific MyPyramid fruit or vegetable
recommendations. The largest single contributor to overall fruit intake for both adults
and adolescents was “orange juice.” “Whole fruits” were the primary contributor to total
fruit intake for adults, while “fruit juices” were the primary contributor to total fruit
intake for adolescents. “Potatoes” dominated vegetable consumption, particularly among
adolescents. The consumption of fried potatoes increased the median vegetable intake of
adolescents from 0.72 cups to 1.21 cups per day. Dark green and orange vegetables and
legumes accounted for a small portion of vegetable intake, with few people meeting the
recommendations. Kimmons et al. (2009) noted that few American adolescents or adults
reported consuming the recommended amounts of fruits or vegetables. These authors
concluded that increasing the consumption of fruits and vegetables will require
multifaceted approaches that augment educational campaigns with policy and

10
environmental strategies aimed at the entire food system, from farm to plate, including
schools, worksites, and retail establishments.
Casagrande et al. (2007) analyzed 24-hour dietary recall data from NHANES III,
1988-1994 and NHANES 1999-2002 to identify trends in fruit and vegetable
consumption. In 1988-1994, an estimated 27 percent of adults met the USDA guideline
for fruit and 35 percent met the guideline for vegetables. In 1999-2002, 28 percent and
32 percent of adults met fruit and vegetable guidelines, respectively, indicating a stable
intake of fruit but a decrease in vegetable consumption over time. Only 11 percent of
adults met USDA guidelines for both fruits and vegetables in 1988-1994 and 1999-2002.
In both data sets, non-Hispanic blacks were less likely to meet USDA guidelines than
non-Hispanic whites. Individuals with higher incomes and more education were
significantly more likely to meet the guidelines in both data sets than were those with a
low income and less education. Despite the initiation of a national fruit and vegetable
campaign in 1991 (e.g., “5-A-Day”), this national data indicate that Americans‟ fruit and
vegetable consumption did not increase from 1988-1994 to 1999-2002 and only a small
proportion of individuals met the related dietary recommendations. The authors
concluded greater public health efforts and approaches are needed to promote healthy
eating in the United States.
The national Youth Risk Behavior Surveillance Survey (YRBSS) monitors six
categories of priority health-risk behaviors among youth and young adults, including
unhealthy diet behaviors. YRBSS provides representative data for students in grades 9
through 12 in both public and private schools throughout the United States. Of the
students taking the survey in 2007, only 21.4 percent reported they had eaten the

11
recommended five or more servings of fruits and vegetables per day over the seven days
preceding the survey. In 2009, 22.3 percent of the 16,057 teenagers who completed the
survey reported having eaten fruits and vegetables five or more times per day (e.g., 100%
fruit juices, fruit, green salad, potatoes [excluding French fries, fried potatoes, or potato
chips], carrots, or other vegetables) during the seven days before the survey (CDC,
2010b).
Kubik, Lytle, Hannan, Perry & Story (2003) examined the association between
the dietary behaviors of 598 seventh grade students in 165 schools based on the
availability of school vending machines, a la carte programs, and whether or not fried
potatoes were served at school lunch. Dietary behaviors were measured using a 24-hour
dietary recall. Results indicated a la carte availability (e.g., candy, chips, and cookies)
was inversely associated with fruit and the combined fruit and vegetable consumption.
The availability of snack vending machines was negatively correlated with fruit
consumption. Serving fried potatoes in the school lunch, however, was positively
associated with vegetable and the combined fruit and vegetable intake. The authors
concluded school-based programs that aim to promote healthy eating among youths
should target school-level environmental factors.
Krebs-Smith, Cook, Subar, Cleveland, Friday & Kahle (1996) conducted a study
to identify major ways fruits and vegetables are consumed by children to provide
estimates of their intakes compared with recommendations, and to estimate the
percentage of children meeting those recommendations. The authors examined three
days of dietary data from respondents in the 1989-1991 Continuing Survey of Food
Intakes by Individuals (CSFII). All foods reported in the survey were disaggregated into

12
their component ingredients; all fruit and vegetable ingredients were assigned specific
weights to correspond with a serving as defined by current dietary guidance materials;
and the number of servings of each fruit and vegetable was tallied. A total of 3,148
children and adolescents aged 2 to18 years participated in the study. Results indicated
that nearly one-quarter of all vegetables consumed by children and adolescents were
French fries. Their intakes of all fruits and of dark green and/or deep yellow vegetables
were very low compared with recommendations. Only one in five children consumed
five or more serving of fruits and vegetables per day. The authors concluded that
pediatricians should encourage children to increase their consumption of fruits and
vegetables, especially dark green and deep yellow vegetables.
Rasmussen, Krølner, Klepp, Lytle, Brug, Bere & Due (2006) conducted a review
of the literature to identify potential determinants of fruit and vegetable intake in children
and adolescents. Papers from Medline and PsycINFO were identified by using all
combinations of the search terms: “fruit(s) or vegetable(s)” and “children or adolescents.”
Quantitative research examining determinants of fruit and/or vegetable intake among
children and adolescents aged 6-18 years were included. The selection and review
process was conducted according to a four-step protocol resulting in information on
country, population, design, methodology, theoretical basis, instrument used for
measuring intake, statistical analysis, independent variables, and effect sizes. Ninety-
eight papers were identified. Convincing evidence is lacking for many presumed
determinants, mostly due to the paucity of studies. The evidence-based determinants
most strongly associated with an increased intake of fruits and vegetables include age,
gender, socio-economic position, preferences, parental intake, and home
13
availability/accessibility. Results indicated girls and younger children tend to have a
higher or more frequent intake than boys and older children. Socio-economic position,
preferences, parental intake, and home availability/accessibility were all consistently
positively associated with fruit and vegetable intake. The authors suggested there is a
need for internationally comparative, longitudinal, theory-based and multi-level studies
that examine both personal and environmental factors associated with fruit and vegetable
consumption.
Importance of Fruits and Vegetables to Health
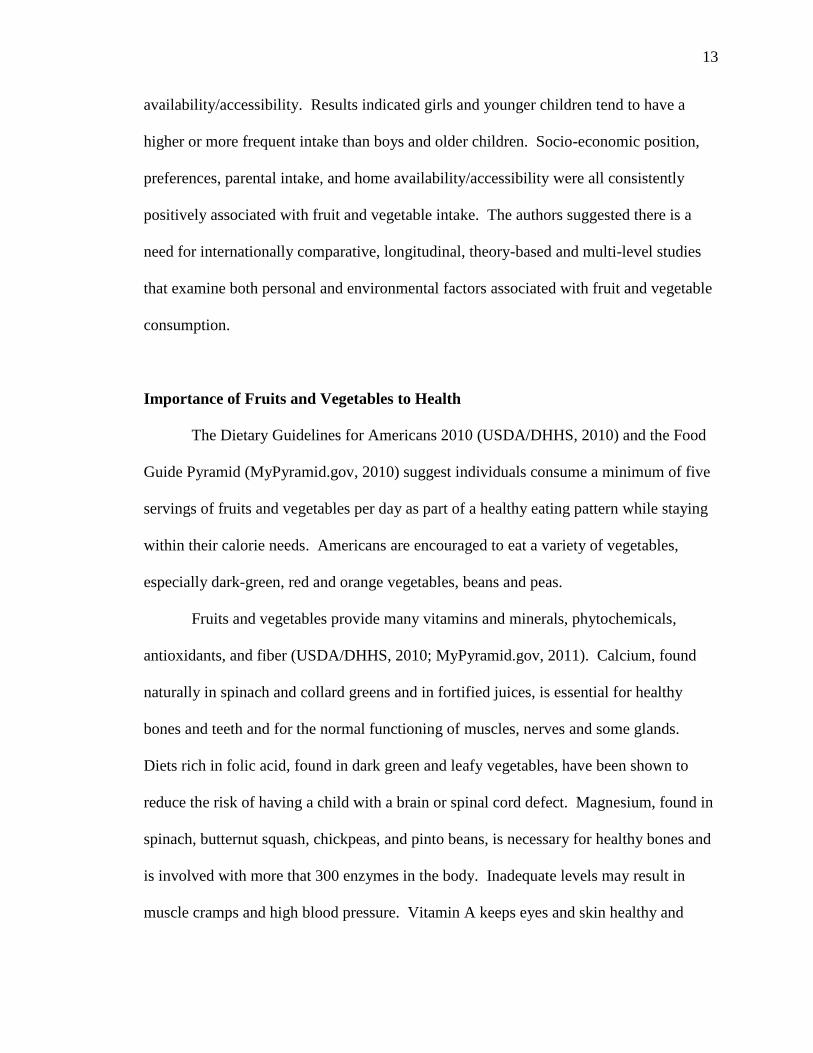
The Dietary Guidelines for Americans 2010 (USDA/DHHS, 2010) and the Food
Guide Pyramid (MyPyramid.gov, 2010) suggest individuals consume a minimum of five
servings of fruits and vegetables per day as part of a healthy eating pattern while staying
within their calorie needs. Americans are encouraged to eat a variety of vegetables,
especially dark-green, red and orange vegetables, beans and peas.
Fruits and vegetables provide many vitamins and minerals, phytochemicals,
antioxidants, and fiber (USDA/DHHS, 2010; MyPyramid.gov, 2011). Calcium, found
naturally in spinach and collard greens and in fortified juices, is essential for healthy
bones and teeth and for the normal functioning of muscles, nerves and some glands.
Diets rich in folic acid, found in dark green and leafy vegetables, have been shown to
reduce the risk of having a child with a brain or spinal cord defect. Magnesium, found in
spinach, butternut squash, chickpeas, and pinto beans, is necessary for healthy bones and
is involved with more that 300 enzymes in the body. Inadequate levels may result in
muscle cramps and high blood pressure. Vitamin A keeps eyes and skin healthy and

14
helps protect against infections. Diets rich in potassium help maintain a healthy blood
pressure. Vitamin C helps heal cuts and wounds and keeps teeth and gums healthy
(MyPyramid.gov, 2011).
Fruits and vegetables should be a part of a well-balanced and healthy eating plan.
Diets rich in fruits and vegetables may reduce the risk of some types of cancer and other
chronic diseases, so adding them to each meal is important. Substituting vegetables for
two ounces of cheese or two ounces of meat on your sandwich is a way to incorporate
more vegetables (MyPyramid.gov, 2011).
He, Nowson, Lucas & MacGregor (2007) assessed the relation between fruit and
vegetable intake and incidence of coronary heart disease (CHD) by carrying out a meta-
analysis of cohort studies. Studies were included if they reported relative risks and
corresponding 95% confidence intervals for coronary heart disease with respect to
frequency of fruit and vegetable intake. Twelve studies, consisting of 13 independent
cohorts, met the inclusion criteria. In total, data from 278,459 individuals with a median
follow-up of 11 years were analyzed. Compared with individuals who had less than three
servings/day of fruit and vegetables, the pooled RR of CHD for those who ate between
three and five servings/day was 0.93 (95% CI: 0.86-1.00, P=0.06) and 0.83 (0.77-0.89,
P<0.0001) for those who ate five or more servings per day. Subgroup analyses showed
that both fruits and vegetables had a significant protective effect on coronary heart
disease. This meta-analysis of prospective cohort studies demonstrated that increased
consumption of fruit and vegetables from less than three to more than five servings/day is
related to a 17 percent reduction in coronary heart disease risk, whereas an intake of
between three to five servings/day is associated with a smaller and borderline significant

15
reduction in coronary heart disease risk. The authors‟ results provide strong support for
the recommendations to consume more than 5 servings/day of fruits and vegetables.
There is compelling evidence that a diet rich in fruits and vegetables can lower the
risk of heart disease and stroke. The largest and longest study to date, done as part of the
Harvard-based Nurses‟ Health Study and Health Professionals Follow-up Study, included
almost 110,000 men and women whose health and dietary habits were followed for 14
years (Joshipura et al., 2001). Results indicated the higher the average daily intake of
fruits and vegetables, the lower the chance of developing cardiovascular disease.
Compared with those in the lowest category of fruit and vegetable intake (less than 1.5
servings a day), those who averaged 8 or more servings a day were 30 percent less likely
to have had a heart attack or stroke. Although all fruits and vegetables likely contribute
to this health benefit, green leafy vegetables, cruciferous vegetables, and citrus fruits
appear to make the most important contributions (Joshipura, et al., 2001).
Chainani-Wu, Epstein & Touger-Decker (2010) examined the relationship
between consumption of a diet high in fruits, vegetables and plant-based foods and the
reduction in the incidence of oral cancer. These authors found that dietary supplements,
including vitamins and minerals, have not been shown to be effective substitutes for a
diet high in fruits and vegetables. The authors suggest that, in addition to discussing
tobacco and alcohol use with patients, clinicians should provide dietary advice (e.g., to
increase consumption of a variety of fruits and vegetables) as part of their routine patient
education practice to prevent oral cancer.
Fung, Hu, Wu, Chiuve, Fuchs & Giovannucci (2010) assessed the association
between the Alternate Mediterranean Diet and the Dietary Approaches to Stop

16
Hypertension (DASH) diet scores and risk of colorectal cancer in middle-aged men and
women. A total of 87,256 women and 45,490 men without a history of cancer were
followed 26 or fewer years. The Alternate Mediterranean Diet and DASH scores were
calculated for each participant by using dietary information that was assessed seven or
fewer times during follow-up. The authors concluded that adherence to the DASH diet
(which involves higher intakes or whole grains, fruit, and vegetables; moderated amounts
of low-fat dairy; and lower amounts of red or processed meats, desserts, and sweetened
beverages) was associated with a lower risk of colorectal cancer.
Appel et al. (1997) assessed the effects of dietary patterns on blood pressure. The
authors enrolled 459 adults with systolic blood pressures of less than 160 mm Hg and
diastolic blood pressures of 80-95 mm Hg. For three weeks, the subjects were fed a
control diet that was low in fruits, vegetables, and dairy products, with a fat content
typical of the average diet in the United States. Subjects were then randomly assigned to
the control diet; a diet rich in fruits and vegetables; or a “combination” diet rich in fruits,
vegetables, and low fat-dairy products and with reduced saturated and total fat. Sodium
intake and body weight were maintained at constant levels. Subjects consumed their
assigned diet for eight weeks. Results indicated the “combination diet” reduced systolic
and diastolic blood pressure by 5.5 and 3.0 mm Hg more, respectively, than the control
diet, while the “fruits-and-vegetables diet” reduced systolic and diastolic blood pressure
by 2.8 and 1.1 mm Hg more, respectively, than the control diet. Among the 133 subjects
with hypertension, the combination diet reduced systolic and diastolic blood pressure by
11.4 and 5.5 mm Hg more, respectively, than the control diet; among the 326 subjects
without hypertension, the corresponding reductions were 3.5 mm Hg and 2.1 mm Hg.

17
The authors concluded that a diet rich in fruits, vegetables, and low-fat dairy foods and
with reduced saturated and total fat can substantially lower blood pressure.
Methods to Assess Fruit and Vegetable Intake
Several methods have been used to quantify an individual‟s usual fruit and
vegetable intake, including the food frequency questionnaire, 24-hour dietary recalls,
food records, and surveys. The pros and cons of each method will be described.
Noia and Contento (2009) tested the validity of the 5 A Day for Better Health
Program food frequency questionnaire (FFQ) for estimating fruit and vegetable
consumption using a sample of 156 African-American adolescents aged 10 to 14 years.
To determine validity, the correlation between 5 A Day FFQ fruit, juice, and vegetable
intake and 3-day intake measured by direct observation was assessed. Correlations were
calculated separately by food type (e.g., fruits, juices, and vegetables), gender and age to
determine whether the accuracy of youths‟ recordings differed based on these factors.
The ability of the 5 A Day FFQ to correctly classify youths according to intake level was
also examined. Results obtained from the 5 A Day FFQ intake were significantly
correlated with observed intake. Correlations were weaker by food type and did not
differ based on youths‟ gender or age. The mean 5 A Day FFQ intake was considerably
higher than the mean observed intake as a result of the overestimation of vegetable
intake. Sensitivity, specificity, and positive and negative values of the 5 A Day FFQ
were 67.1 percent, 68.6 percent, 63.5 percent, and 71.9 percent, respectively. These
findings suggest that the 5 A Day FFQ may be more useful as a screening tool for

18
identifying African-American adolescents most in need of intervention than for
estimating youths‟ actual mean intake in dietary intervention programs.
Rockett & Colditz (1997) reviewed nutritional assessment methods used in young
people to assess their fruit and vegetable intake. The authors provided an overview of the
methods used in these investigations, compared the available dietary assessment tools
(the dietary record, 24-hour dietary recall, and food frequency questionnaire), described
the development of a new food-frequency questionnaire (the Youth-Adolescent
Questionnaire), and reviewed new approaches to assessing fruit and vegetable intake.
The data emerging from reproducibility studies suggest that food-frequency
questionnaires provide enough accuracy in studies of adolescents to permit individual
diets to be related to subsequent health outcomes.
Programs to Increase Fruit and Vegetable Intake in Children
Garden-based nutrition education programs may offer a strategy for increasing
fruit and vegetable intake in children. Heim, Stang & Ireland (2009) designed a 12-week
pilot intervention to promote fruit and vegetable intake among 4th
through 6th
grade
children attending a YMCA summer camp. Children participated in garden-based
activities twice per week. Weekly education activities include fruit and vegetable snacks,
and family newsletters sent home to parents. The pilot intervention was evaluated using
a pre and post survey to determine participant satisfaction and the short-term impacts of
the program. The process evaluation focused on program satisfaction, whereas the short-
term impact evaluation assessed fruit and vegetable exposure, preference, self-efficacy,
asking behavior, and availability of fruits and vegetables in the home. Data from the

19
impact evaluation were compared from baseline to follow-up. Children reported high
levels of enjoyment in the intervention activities. Most children (97.8%) reported they
enjoyed taste-testing fruits and vegetables, preparing fruit and vegetable snacks (93.4%),
working in their garden (95.6%), and learning about fruit and vegetables (91.3%).
Impact data suggest that the garden intervention led to an increase in the number of fruits
and vegetables eaten, vegetable preferences, and fruit and vegetable asking behavior at
home. Results indicate garden-based nutrition education programs can increase fruit and
vegetable exposure and improve predictors of fruit and vegetable intake through
experiential learning activities. Participants in the “seed to table” experience of eating
may help promote healthful eating behaviors among youth. The authors recommended
that food and nutrition professionals should consider garden-based nutrition education
programs that connect children with healthful foods through fun, hands-on activities.
Schools are the most frequent target for intervention programs aimed at
preventing child obesity; however, the overall effectiveness of these programs has been
limited. It has therefore been recommended that interventions target multiple ecological
levels (community, family, school and individual) to have greater success in changing
risk behaviors for obesity. Gentile et al. (2009) examined the immediate and short-term,
sustained effects of the Switch program, which targeted three behaviors (decreasing
children‟s screen time, increasing fruit and vegetable consumption, and increasing
physical activity) at three ecological levels (the family, school, and community).
Participants included 1,323 children and their parents from ten schools in two states.
Schools were matched and randomly assigned to treatment and control. Measures of the
key behaviors and body mass index were collected at baseline, immediately post-

20
intervention, and six months post-intervention. The effect sizes of the differences
between treatment and control groups ranged between small (Cohen's d = 0.15 for body
mass index at six months post-intervention) to large (1.38; parent report of screen time at
six months post-intervention), controlling for baseline levels. There was a significant
difference in parent-reported screen time at post-intervention in the experimental group,
and this effect was maintained at six months post-intervention. The experimental group
also showed a significant increase in parent-reported fruit and vegetable consumption,
while child reported fruit and vegetable consumption was marginally significant. At the
six month follow-up, parent-reported screen time was significantly lower, and parent and
child-reported fruit and vegetable consumption was significantly increased. There were
no significant effects on pedometer measures of physical activity or body mass index in
the experimental group. The intervention effects were moderated by child sex, family
involvement, and child body mass index. The perception of change among the
experimental group was generally positive, with 23 percent to 62 percent indicating
positive changes in behavior. The results indicated that the Switch program yielded
small-to-modest treatment effects for promoting children‟s fruit and vegetable
consumption and minimizing screen time. The authors suggested the Switch program
offers promise for use in youth obesity prevention.
Fitzgerald & Spaccarotella (2009) reviewed common barriers to healthful eating
and physical activity by using an ecological framework. The authors categorized the
barriers into the four ecological model levels (e.g., intrapersonal, interpersonal,
community/institution, and macro/public policy), highlighting the need for multifaceted
approaches to overcome these barriers. The authors reported programs that increase

21
awareness, knowledge, skills, motivation, and confidence would be best suited for
overcoming intrapersonal barriers, while programs that emphasize the replacement of
screen time with more active pursuits and helping parents to establish strategies to control
the amount of screen time and the influences of advertisements would help overcome
interpersonal barriers. Community partnerships and policy level interventions, such as
parks, zoning, and development regulations, would be suitable to overcome
community/institution level barriers. The authors observed it is important for extension
educators to be aware of the food-related advertisement trends and regulations at the state
and national level in order to be able to help families more effectively overcome
macro/public level barriers. The authors concluded that the abundance of barriers
operating at various levels underscores the need for multifactorial approaches to promote
healthy lifestyle behaviors. Ecological models can be useful tools for extension
professionals to develop such interventions. Extension professionals are in a perfect
position, as subject experts, community members, and leaders, to apply similar
multifaceted approaches extending from individual solutions to public policy efforts in
promoting healthier lifestyles.
Perry et al. (1998) conducted a randomized school-based trial to increase fruit and
vegetable consumption among children using a multi-component approach. The
intervention, conducted in 20 elementary schools in St. Paul, MN, targeted a multiethnic
group of children who were enrolled in fourth grade in the spring of 1995 and in fifth
grade in the fall of 1995. The multi-faceted intervention consisted of behavioral curricula
in the classroom, parental involvement, school food service changes, and industry support
and involvement. Lunchroom observations and 24-hour food recalls were used to

22
measure food consumption. Parent telephone surveys and a health behavior
questionnaire measured psychosocial factors. Results indicated the intervention was
associated with increased lunchtime fruit consumption and combined fruit and vegetable
consumption, lunchtime vegetable consumption among girls, and daily fruit consumption,
as well as the proportion of total daily calories attributable to fruits and vegetables. The
authors concluded that this multi-component school-based program increased fruit and
vegetable consumption among children. Greater involvement of parents and more
attention to increasing vegetable consumption, especially among boys, remains a
challenge in future intervention research.
Nutrition Education in School Curriculums
Many factors have been identified that influence adolescent eating behavior,
including peer influences, nutrition knowledge and beliefs, mass media, and parental
dietary habits. Pirouznia (2001) examined the correlation of nutrition knowledge and
eating behavior in a sample of 532 students between the ages of 11 and 13 years who
were in grades six, seven or eight from Shawnee Middle School in Lima, Ohio. The
students were asked to complete the CANKAP (Comprehensive Assessment of Nutrition
Knowledge, Attitudes, and Practices) questionnaire which measured their nutrition
knowledge and eating behavior. Two versions of the CANKAP were created, one for
sixth graders and one for seventh/eighth graders. The sixth grade test contained 30
questions of which 20 were nutrition knowledge questions. The test for the seventh and
eighth grade students contained 35 questions, of which 30 were nutrition knowledge

23
questions. Each knowledge scale was determined to have a Cronbach‟s alpha reliability
coefficient of 0.70 or greater.
There was no difference in nutrition knowledge between sixth-grade boys (13.40)
and girls (13.96) (F = 1.03, P = 0.3). However, ANOVA indicated the mean nutrition
knowledge scores of seventh and eighth-grade girls (12.35) were significantly higher than
boys (10.86) (F =17.88, P < .001). There was no correlation between nutrition
knowledge and food choices for sixth-grade male or female students or for boys in the
seventh and eighth grades. There was, however, a significant correlation (P < .006)
between nutrition knowledge and food choices for girls in the seventh and eighth grades.
Pirouznia (2001) concluded that female adolescents are more selective in their food
choices than males. As a result of the insignificant relationship between nutrition
knowledge and eating behavior of sixth-grade students and males in seventh and eighth
grades, the author suggested corrective measures, such as implementing nutrition
education programs in elementary schools, as eating habits are more likely to be shaped
in younger ages, and organizing programs and activities in science and health classes to
motivate students to learn about nutrition, are indicated.
Gower, Moyer-Mileur, Wilkinson, Slater & Jordan (2010) tested the validity and
reliability of a computer nutrition knowledge survey that they used with elementary
school students to evaluated the impact of the “Fit Kids „r‟ Healthy Kids” nutrition
intervention. During survey development, twelve health educators, elementary school
teachers and registered dietitians assessed the survey for content validity. The target
population consisted of first through fourth grade students from Salt Lake City, UT,
metropolitan area schools. Participants were divided into reliability, intervention, and

24
control groups. The reliability group took the survey twice (2 weeks apart); the
intervention and control groups also took the survey twice, but at pre- and post-
intervention (4 weeks later). Only students from the intervention group participated in
four weekly nutrition classes. Reliability was assessed by Pearson‟s correlation
coefficient. Results demonstrated appropriate content validity, as indicated by expert
peer ratings. Test-retest reliability correlations were found to be significant for the
overall survey and for all subscales: food groups, healthful foods, and food functions.
Nutrition knowledge was assessed upon program completion using a paired samples t
test. Students from the intervention group demonstrated improvement in nutrition
knowledge, while scores for the control group remained unchanged. The difference in
total scores from pre- to post-intervention between the two groups was significant. These
results suggest that the computerized nutrition survey demonstrated content validity and
test-retest reliability for first- through fourth-grade elementary school children. Also, the
study results imply that the Fit Kids „r‟ Healthy Kids intervention promoted gains in
nutrition knowledge. Overall, the computer survey shows promise as an appealing
medium for assessing nutrition knowledge in children.
In response to the increased incidence of child overweight, a school-based
program, It’s All About Kids, was designed by the Tulsa Health Department, Tulsa Public
Schools, and community partners to improve food choices and increase physical activity
of students in first through fifth grade. The nutrition component consisted of six weekly
30-minute experiential, age-appropriate classroom lessons, including healthful-eating
food games, taste-testing foods, whole-grain bread baking, information on portion sizes,
and food demonstrations. Documenting and evaluating school-based intervention
25
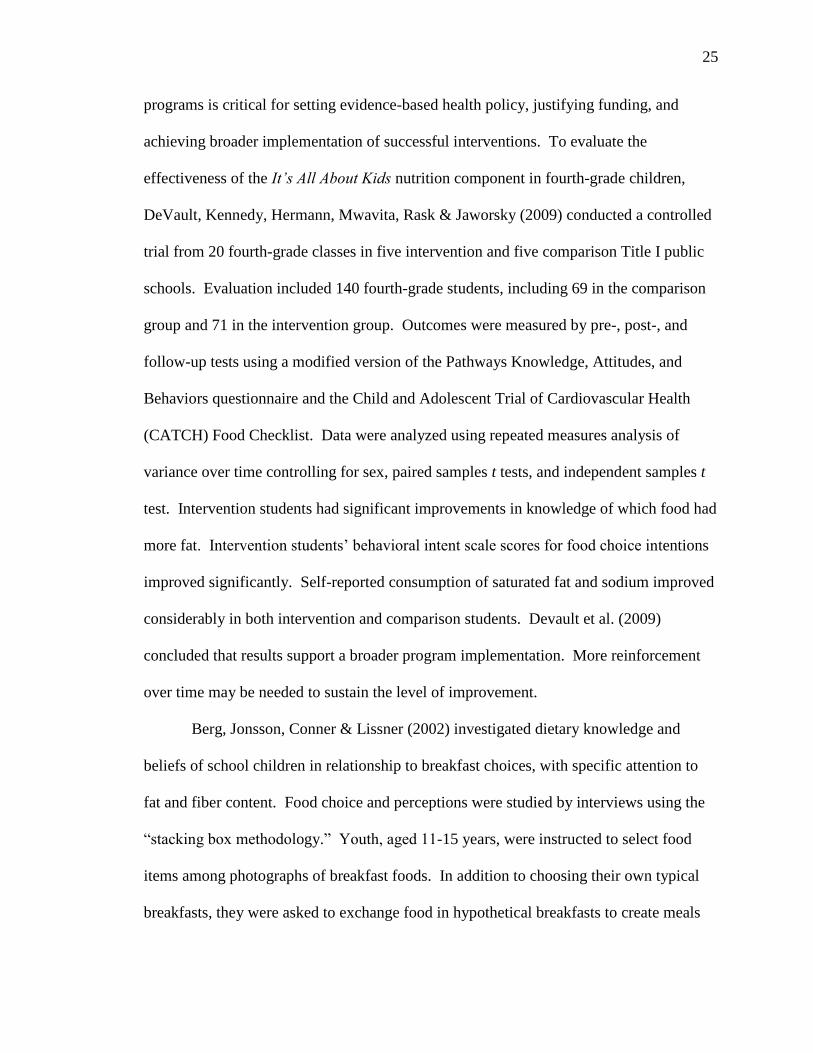
programs is critical for setting evidence-based health policy, justifying funding, and
achieving broader implementation of successful interventions. To evaluate the
effectiveness of the It’s All About Kids nutrition component in fourth-grade children,
DeVault, Kennedy, Hermann, Mwavita, Rask & Jaworsky (2009) conducted a controlled
trial from 20 fourth-grade classes in five intervention and five comparison Title I public
schools. Evaluation included 140 fourth-grade students, including 69 in the comparison
group and 71 in the intervention group. Outcomes were measured by pre-, post-, and
follow-up tests using a modified version of the Pathways Knowledge, Attitudes, and
Behaviors questionnaire and the Child and Adolescent Trial of Cardiovascular Health
(CATCH) Food Checklist. Data were analyzed using repeated measures analysis of
variance over time controlling for sex, paired samples t tests, and independent samples t
test. Intervention students had significant improvements in knowledge of which food had
more fat. Intervention students‟ behavioral intent scale scores for food choice intentions
improved significantly. Self-reported consumption of saturated fat and sodium improved
considerably in both intervention and comparison students. Devault et al. (2009)
concluded that results support a broader program implementation. More reinforcement
over time may be needed to sustain the level of improvement.
Berg, Jonsson, Conner & Lissner (2002) investigated dietary knowledge and
beliefs of school children in relationship to breakfast choices, with specific attention to
fat and fiber content. Food choice and perceptions were studied by interviews using the
“stacking box methodology.” Youth, aged 11-15 years, were instructed to select food
items among photographs of breakfast foods. In addition to choosing their own typical
breakfasts, they were asked to exchange food in hypothetical breakfasts to create meals
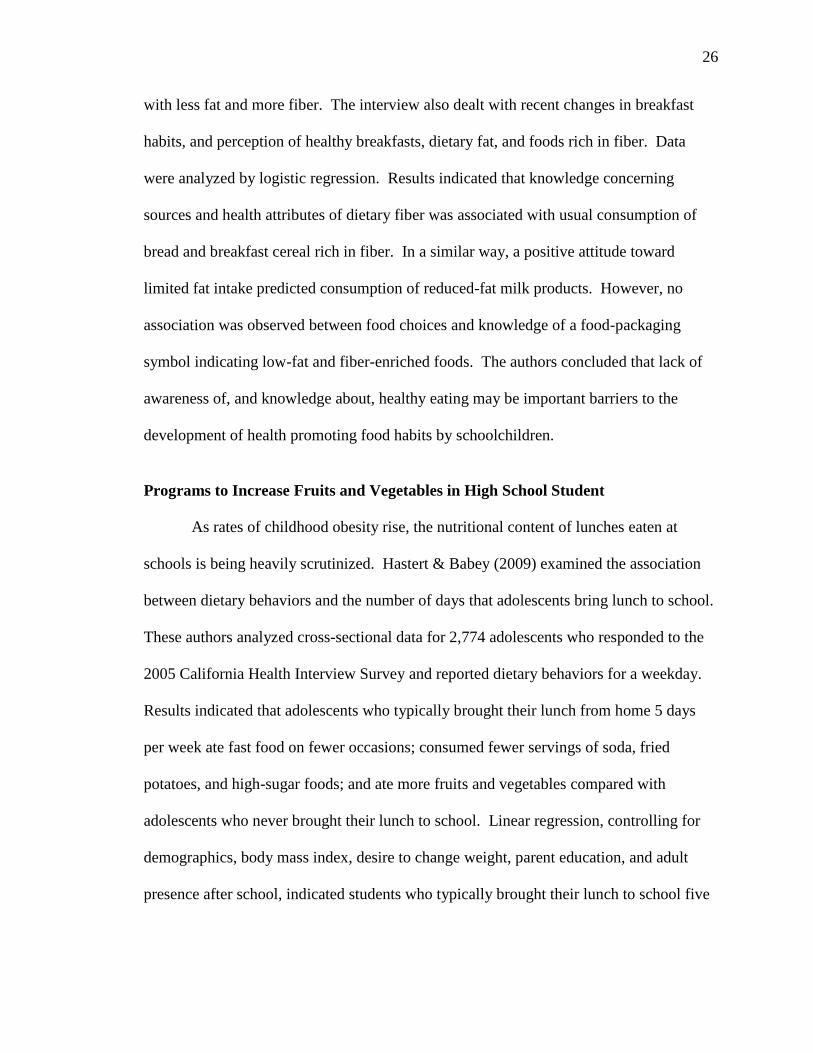
26
with less fat and more fiber. The interview also dealt with recent changes in breakfast
habits, and perception of healthy breakfasts, dietary fat, and foods rich in fiber. Data
were analyzed by logistic regression. Results indicated that knowledge concerning
sources and health attributes of dietary fiber was associated with usual consumption of
bread and breakfast cereal rich in fiber. In a similar way, a positive attitude toward
limited fat intake predicted consumption of reduced-fat milk products. However, no
association was observed between food choices and knowledge of a food-packaging
symbol indicating low-fat and fiber-enriched foods. The authors concluded that lack of
awareness of, and knowledge about, healthy eating may be important barriers to the
development of health promoting food habits by schoolchildren.
Programs to Increase Fruits and Vegetables in High School Student
As rates of childhood obesity rise, the nutritional content of lunches eaten at
schools is being heavily scrutinized. Hastert & Babey (2009) examined the association
between dietary behaviors and the number of days that adolescents bring lunch to school.
These authors analyzed cross-sectional data for 2,774 adolescents who responded to the
2005 California Health Interview Survey and reported dietary behaviors for a weekday.
Results indicated that adolescents who typically brought their lunch from home 5 days
per week ate fast food on fewer occasions; consumed fewer servings of soda, fried
potatoes, and high-sugar foods; and ate more fruits and vegetables compared with
adolescents who never brought their lunch to school. Linear regression, controlling for
demographics, body mass index, desire to change weight, parent education, and adult
presence after school, indicated students who typically brought their lunch to school five

27
days per week ate fast food 0.35 fewer times and consumed 0.35 fewer servings of soda,
0.10 fewer servings of fried potatoes, 0.25 fewer servings of high-sugar foods, and 0.95
more servings of fruits and vegetables per day compared with students who never
brought their lunch to school. These findings suggest that adolescents who bring lunch to
school from home have more positive dietary behaviors than do adolescents who get their
lunches from other sources. The authors concluded that improving the nutritional quality
of foods offered from other sources, such as the National School Lunch Program and
competitive foods, could help improve adolescent dietary behaviors.
Jan, Bellman, Barone, Jessen & Arnold (2009) assessed the preliminary results of
the effectiveness of Shape It Up, a school-based obesity prevention program developed
and implemented by the Ernest Mario School of Pharmacy at Rutgers University in
conjunction with Horizon Blue Cross Blue Shield of New Jersey. Program activities and
materials included an interactive workshop, an activity book and family guide, posters, a
website, and educational field days. The Shape It Up program not only delivered a
positive message about eating healthful food, but it also modeled fruit and vegetable
consumption during the interactive workshops and distributed fruits and vegetables as
prizes. During the 2004-2005 and 2005-2006 school years, Shape It Up was delivered to
89,736 children at 257 New Jersey elementary schools. Pre-intervention and post-
intervention surveys were administered to a convenience sample of 6,421 students at 49
participating schools. Attitudes were measured using a 6-point Likert-type graphic face
scale and analyzed for statistical significance of pre-intervention to post-intervention
change using paired t-tests. After exposure to the Shape It Up program, children reported
higher levels of knowledge and positive attitudes about healthy eating and exercise

28
compared with the baseline survey results. In a question to gauge satisfaction with the
program, 54.9 percent of children surveyed gave the program the highest possible rating,
and overall 91.7 percent selected one of the three response categories toward the positive
end of the six-point scale. Shape It Up appears to have had a positive impact on
children‟s knowledge and attitudes toward exercise and healthy eating. Additional
research employing a comparison group is needed to assess the program‟s impact.
Schools have the opportunity, through the National School Lunch Program and
Local School Wellness Policies, to have a significant impact on healthy eating behaviors.
An understanding of children‟s and adolescent‟s food preferences in relation to gender
and age will facilitate the successful creation of both healthy and financially viable
school menus. Caine-Bish & Scheule (2009) identified food preferences with respect to
gender of school-age children and adolescents in an Ohio school district. A survey was
administered to 1,818 third to twelfth grade students. Students filled out an anonymous
questionnaire about their preferences for 80 different foods using a five-point rating
scale. The students‟ data were grouped according to school level attended: elementary,
middle, and high school. An exploratory factor analysis was conducted to identify
“entrée” and “side dish” factors. Cronbach‟s alpha was used to measure each factor‟s
internal reliability. Differences in mean scores by gender and grade for each of the entrée
and side dish factors were identified using analysis of variance. Results showed that boys
preferred the meat, fish, and poultry foods over girls, whereas girls preferred fruits and
vegetables over boys. Furthermore, gender differences in preferences were demonstrated
with respect to school level. The authors concluded that food preferences differed
between genders and these gender differences varied among elementary, middle, and
29
high school students. Gender differences should be considered when providing food
choices to boys and girls at all ages.
Communication technology can help stimulate youth to become involved in
health promotion. DiSogra & Glanz (2000) reported on an innovative, Internet based
nutrition program that encouraged children to be advocates for policies that promote
eating more fruits and vegetables, the 5 A Day Virtual Classroom. Through this
program, students from across the United Sates discussed the recommendation of 5 A
Day, at the same time, in a classroom without walls. In September 1997, children were
asked, “If you were President Clinton, how would you get kids across the country to eat 5
A Day?” Based on content analysis of responses, they suggested strategies that
policymakers could use to encourage children to consume more fruits and vegetables.
Approximately 2,600 students participated; 635 entries and 910 suggestions were
received. The suggestion categories cited most often were mass media, economic issues,
and social influence. The most frequently mentioned specific ideas were to reward
children for eating fruits and vegetables and to use presidential authority. Some regional,
age, and gender patterns were found. Findings support the potential impact on health
education of the 5 A Day Virtual Classroom and of interventions based on
communications technology.
The United States Department of Agriculture implemented the Fresh Fruit and
Vegetable Pilot Program in 2006-2007. The purpose of the program was to increase fruit
and vegetable consumption outside of the lunchroom. One Houston-area high school that
was received funding provided baskets of fresh fruits and vegetables daily for each
classroom during this period. Davis, Weber Cullen, Watson, Konarik & Radcliffe (2009)

30
assessed the impact of this program on students‟ fruit and vegetable intake. At the end of
the program, fruit and vegetable intake surveys were distributed to students at the
intervention school and at a comparison high school. Completed, anonymous surveys
were received from 34 percent of the intervention group and 42 percent of the
comparison school students. The students were classified as to whether they met the
recommended daily intake of fruit, 100 percent fruit juice, and vegetables. The
probability of meeting the recommendations was assessed with logistic regression
analyses, controlling for sex, age, and ethnicity. Compared with the comparison control
school students, intervention school students were more likely to report eating fruit and
drinking 100 percent fruit juice at least two times per day and consuming total fruit, juice,
and vegetables five or more times per day in the preceding seven days. More
intervention school students than comparison school students reported eating fruit at least
one time per day. There were no group differences in vegetable intake. Results indicated
fresh fruit and vegetable distribution programs provide the opportunity for students to
taste a variety of fruits and vegetables and may improve consumption of these foods by
adolescents.
The consumption of fruits and vegetables has been shown by nutritionists to have
preventative effects with regard to cardiovascular disease and cancer. Recent promotions
in New Zealand have emphasized the need to eat „5+‟ a day for better health. Hill,
Casswell, Maskill, Jones & Wyllie (1998) examined the interaction between 20 New
Zealand teenagers and their parent responsible for food purchasing to identify factors
affecting teenagers‟ consumption of and attitudes towards fruit and vegetables, both at
home and as a snack away from home. Although the teenagers believed fruits and

31
vegetables were „good for you‟, their consumption was affected by the teenagers‟
perceptions of the desirability of different foods, and the degree of independence or
parental control in different eating situations. The authors suggested several possible
health promotion and marketing strategies to enhance fruit and vegetable consumption.
During the 2004-2005 school year, the Mississippi Department of Education
Child Nutrition Program initiated the Mississippi Fresh Fruit and Vegetable Pilot
Program (CDC, 2006). The program was designed to: 1) increase student access to fresh
fruits and vegetables; 2) increase the degree of student preference for fruits and
vegetables; and 3) increase fruit and vegetable consumption. The schools distributed
fresh fruits and vegetables during the school day and provided nutrition education
activities to promote and support consumption of fruits and vegetables. A pretest was
given in the fall and a posttest was given in the spring to evaluate the program. The
survey assessed changes in the following during the school year: 1) the variety of fruits
and vegetables ever eaten by students, 2) their attitudes toward fruits and vegetables, 3)
their willingness to try fruits and vegetables, 4) their degree of preference for a
familiarity with fruits and vegetables, and 5) their intentions to eat fruits and vegetables.
The researchers collected information from eighth grade and tenth grade students about
dietary intake for the previous 24 hours. Results indicated the variety of fruits and
vegetables “ever eaten” increased significantly among students in all three grades. Only
8th
grade students, however, had significant increases in positive attitudes toward eating
fruits and vegetables (e.g., they indicated they believed they could eat more fruit and that
they were willing to try new fruit). Degree of preference for fruit increased significantly
among eighth grade and tenth grade students. Degree of preference for vegetables

32
decreased significantly among fifth grade and eighth grade students. Intention to eat fruit
increased significantly among tenth grade students, but not among fifth grade or eighth
grade students. Student consumption of fruit in the school and overall increased
significantly by 0.34 and 0.61 servings per day, among the eighth grade and tenth grade
students who participated in dietary recall interviews. Student consumption of vegetables
in school decreased significantly, but consumption of vegetables overall did not change.
Summary
A review of the literature clearly indicates the majority of adolescents do not
consume adequate fruits and vegetables. Fruits and vegetables provide essential
nutrients. Diets low in fruits and vegetables have been associated with obesity and many
chronic diseases. Identifying age-appropriate ways to increase fruits and vegetables
among adolescents is warranted.

33
CHAPTER THREE
METHODOLOGY
The purpose of this quasi-experimental study was to determine the impact of five
50-minute nutrition lessons and cooking demonstrations/labs developed by this
researcher on high school students‟ knowledge, attitude, and food consumption behavior
of fruits and vegetables. This chapter will describe the methods used to conduct the
study.
Institutional Review Board
This study was approved by the Institutional Review Board at Ball State
University as an expedited study, effective September 24, 2010 through September 23,
2011 (Appendix A-1). The researcher conducting this analysis successfully completed
the Collaborative Institutional Training Initiative training (Appendix A-2).
Sample
Subjects in this study included a convenience sample of the 41 high school
students (grades 9-12) who had enrolled in one of two Family and Consumer Sciences
classes at Crothersville Junior/Senior High School in Crothersville, Indiana, in the spring

34
semester of 2011. The control group (n=19) consisted of those students enrolled in the
Adult Roles class; the experimental group (n=22) consisted of those students enrolled in
the Nutrition and Wellness class. Both classes were taught by the Family and Consumer
Sciences (FACS) teacher, Mrs. Kaye Durham, the mother of this researcher.
Instruments
An identical Fruit and Vegetable Student Survey was used as a pretest (Appendix
B-1), posttest (Appendix B-2), and follow-up test (Appendix B-3) to assess students‟
knowledge about, attitude toward, and consumption of fruits and vegetables. A series of
five lesson plans, developed by this researcher, was given to the experimental group
(Appendix C) during the second week of January 2011.
Fruit and Vegetable Student Survey
The Fruit and Vegetable Student Survey, used as a pretest, posttest, and follow-up
test, contained multiple-choice, true-false, and fill-in-the-blank questions. The only
difference between the three surveys was the cover sheet that indicated whether the test
was the pretest, posttest, or follow-up test. The survey was used to assess the control and
treatment groups‟ knowledge about, attitudes toward, and consumption patterns of fruits
and vegetables prior to the implementation of the lesson plans in the experimental group,
immediately after the lessons were completed, and nine weeks after the completion of the
lessons. The questions used in the survey were adopted from the Mississippi Fruit and
Vegetable Pilot Student Survey (CDC, 2006) and the Guide to Good Food (Guide to
Good Food, 2000).

35
The Fruit and Vegetable Student Survey was evaluated for face and content
validity by four registered dietitians and a licensed Family and Consumer Sciences
teacher-educator. The survey questions measured the students‟ knowledge about the
vitamins and minerals found in fruits and vegetables, standard serving sizes, the proper
way to store fruits and vegetables, the seasonality of fruits and vegetables, and methods
used to cook fruits and vegetables. The students‟ attitude toward fruits and vegetables
were measured by asking the students to indicate the types of fruits and vegetables they
would eat and how they would feel about eating specific fruits and vegetables. The
students‟ fruit and vegetable consumption patterns were assessed by asking how many
servings the student typically eats per day, how often they choose fruits and vegetables at
lunch, and what types of fruits and vegetables they have eaten.
Lesson Plans
Upon completion of the pre-test, the five lesson plans (Appendix C) were taught
to the experimental group (Nutrition and Wellness class) for five consecutive days by the
Crothersville Junior/Senior High School FACS teacher, Mrs. Kaye Durham. After
completing the lessons, the learner was expected to be able to: 1) state the benefits of
eating a variety of colorful fruits and vegetables; 2) define the term “phytochemical;” 3)
describe the benefits of phytochemicals found in fruits and vegetables; 4) state how many
servings of fruits and vegetables are recommended for teens; 5) describe the quantity of a
fruit or vegetable that is considered “a serving;” 6) prepare a variety of new recipes that
will incorporate more fruits and vegetables into the student‟s daily diet.

36
Lesson one (Appendix C-1) focused on the current Food Guide Pyramid
(MyPyramid) and, specifically, how fruits and vegetables fit in the Food Guide Pyramid,
including how many servings are recommended for various age groups, and the quantity
of a food that comprises an appropriate serving size. The students were exposed to the
official web site of MyPyramid, www.mypyramid.gov, and, in a group discussion,
reviewed the food guide pyramid and the different food groups. The instructor provided
each student with a handout displaying the food guide pyramid and gave the students a
worksheet to complete that focuses on the different colors of the food guide pyramid, the
different widths of the pyramid, and the different food groups of the pyramid, while they
navigated the Food Guide Pyramid website.
Lesson two (Appendix C-2) focused on the importance of eating a rainbow of
colors of fruits and vegetables and described the types of fruits and vegetables that fit into
different color categories. The lesson addressed how the students prepare the fruits and
vegetables they eat, and their favorite fruits and vegetables. At the conclusion of the
lesson, the students were offered a vegetable tray with dip that included cauliflower,
broccoli, baby carrots and cherry tomatoes.
Lesson three (Appendix C-3) described the benefits of the nutrients, fiber, and
phytochemicals in fruits and vegetables. The instructor displayed various types of fruits
and vegetables and asked the students what important vitamins and minerals are in each
of the fruits and/or vegetables. The instructor reviewed the daily number of servings the
students should be eating and what specific vitamins and minerals fruits and vegetables
supply for the body. The instructor also discussed fiber, its benefits, and why it is
important for the body. At the conclusion of the lesson, the instructor demonstrated a stir
37
fry recipe that included zucchini, snap peas, sweet red peppers and onions that the
students were able to taste-test.
The fourth lesson (Appendix C-4) taught students how to incorporate vegetables
into their daily diet. The instructor asked the students to give examples of how they
incorporate vegetables into their diet, writing those examples on the chalkboard. The
instructor then asked the class to brainstorm other examples of how to incorporate
vegetables into their diet. The students got into their appropriate labs and prepared a
vegetable pizza that included raw broccoli, cucumber, tomatoes and shredded carrots.
The fifth lesson (Appendix C-5) helped the students learn how to incorporate
more fruits into their daily diet. Students were asked to state their favorite fruits and
describe how they like them prepared. The instructor asked the students to give examples
of how they incorporate fruit into their diet, writing those examples on the chalkboard.
The instructor then asked the class to brainstorm other examples of how to incorporate
fruits into their diet. The students got into their appropriate labs and made a fruit
smoothie with various types of fruits (e.g., pineapple, strawberries and peaches).
Letter of Permission
A letter of permission to conduct the study was obtained from the principal of the
Crothersville Junior/Senior High School in Crothersville, Indiana (Appendix D). The
letter was obtained prior to conducting the study.
Letter of Information
A letter of information was sent home with the students (Appendix E). The letter
described the reason for the study, the risks of the study, and how the data will be

38
collected. The letter also informed parents about who was conducting the survey and
how to reach the researcher if they had questions or concerns.
Methods
Once permission was obtained from the principal of Crothersville Junior/Senior
High School (Appendix D), and a letter of information describing the procedures was
sent home to the parents of the students enrolled in the Adult Roles and the Nutrition and
Wellness classes (Appendix E), the classroom teacher gave the Fruit and Vegetable
Student Survey (Appendix B-1) to the 19 students in the Adult Roles class (control group)
and the 22 students in the Nutrition and Wellness class (treatment group) before the week
the five lessons were taught to the treatment group (e.g., Nutrition and Wellness class).
The Fruit and Vegetable Student Survey had a cover sheet that contained the student‟s
name and a random alpha-numeric code; the alpha-numeric code was also written on the
first page of the survey. The cover page was removed by the classroom teacher prior to
sharing the results with the researcher. All data was recorded by the researcher using the
alpha-numeric code, rendering the data anonymous to the researcher. The random
alphanumeric code for the control group started with a “C” and the alphanumeric code for
the experimental group started with an “E” to ensure the group membership did not get
mixed.
Once the pretest was given, the students enrolled in the Nutrition and Wellness
class in the spring semester of 2011 were given a series of five 50-minute lessons on
fruits and vegetables (Appendix C). The five lesson plans covered material that would
normally be taught in the Nutrition and Wellness class, but with additional depth and

39
more laboratory experiences where the students got to prepare and taste various fruits and
vegetables. Per school policy, if a student chose not to participate in the lesson plans,
he/she was sent to the principal‟s office to complete a homework assignment similar to
what was being taught (e.g., complete the MyPyramid worksheet and write a research
paper on the nutritional contribution of fruits and vegetables to the American diet). At
the conclusion of the lessons, the students in both the Adult Roles and the Nutrition and
Wellness classes were given the Fruit and Vegetable Student Survey as a posttest
(Appendix B-2). The posttest had a cover sheet that contained the student‟s name and the
same random alpha-numeric code that was on their pretest. The teacher matched each
student‟s pretest with their posttest, removed the cover sheet with the student‟s name, and
stapled the two tests together prior to sharing the results with the researcher for data entry
and analysis.
At the end of the nine week quarter, the instructor gave the same posttest to the
experimental and control group to assess their knowledge about, attitudes toward, and
behavior consumptions of fruits and vegetables (Appendix B-3). The results of the
follow-up survey were compared to the first posttest and to the baseline data to determine
retention of knowledge and identify any changes in attitudes toward or consumption of
fruits and vegetables.
Statistical Analysis
Data was analyzed using SPSS v.19.0 for Windows (SPSS, 2010). Descriptive
statistics and frequency counts were run on all variables. Frequency counts (number and
percent) were used to determine the overall prevalence of specific survey questions

40
among both experimental and control groups. Results of the knowledge questions were
summed to create a “knowledge score.” A change in the students‟ knowledge score
within groups (e.g., pretest vs. posttest) was measured using a paired t-test. Changes in
variables between groups (e.g., control vs. treatment) were analyzed using ANOVA. A
shift in the students‟ attitudes toward fruits and vegetables and their food consumption
behavior was analyzed by comparing the results of the matched pretest to the posttest
using Wilcoxon Signed Ranks test and crosstabs with Chi square for non-parametric data.
Statistical significance was set at p ≤ 0.05.
Summary
This quasi-experimental study assessed the knowledge, attitude, and behavior of
41 high school students toward fruits and vegetables. Lesson plans, created by the
researcher, were intended to teach the students‟ the importance of fruits and vegetables in
the diet, how many servings of fruits and vegetables to have each day, and how to
incorporate fruits and vegetables in their daily diet in an attempt to increase the students‟
consumption of fruits and vegetables. The impact of the lessons, both immediately upon
completion of the unit and nine weeks after the lessons, were measured using the Fruit
and Vegetable Student Survey in both a control and treatment group.

41
CHAPTER 4
RESULTS
The purpose of this quasi-experimental study was to determine the impact of five
50-minute nutrition lessons and cooking demonstrations/labs developed by this
researcher on high school students‟ knowledge, attitude, and food consumption behavior
of fruits and vegetables. This chapter will present the results obtained throughout the
implementation of the study.
Subjects
The subjects for this study consisted of a convenience sample of 41 students from
Crothersville Junior/Senior High School who were enrolled in Mrs. Kaye Durham‟s
Nutrition and Wellness (n=22) or Adult Roles (n=19) class spring semester of 2011
(Table 1). The treatment group consisted of the 22 students (13 male; 9 female), who
were enrolled in the Nutrition and Wellness class. The treatment group was a mix of
sophomores (n=6), juniors (n=10) and seniors (n=6). Subjects in the treatment group
ranged in age from 15 to 19 years, with a mean age of 16.6 ± 1.1 years.
The control group consisted of the 19 students enrolled in Mrs. Kaye Durham‟s
Adult Roles class. All of the students in the control group were sophomores and all 19
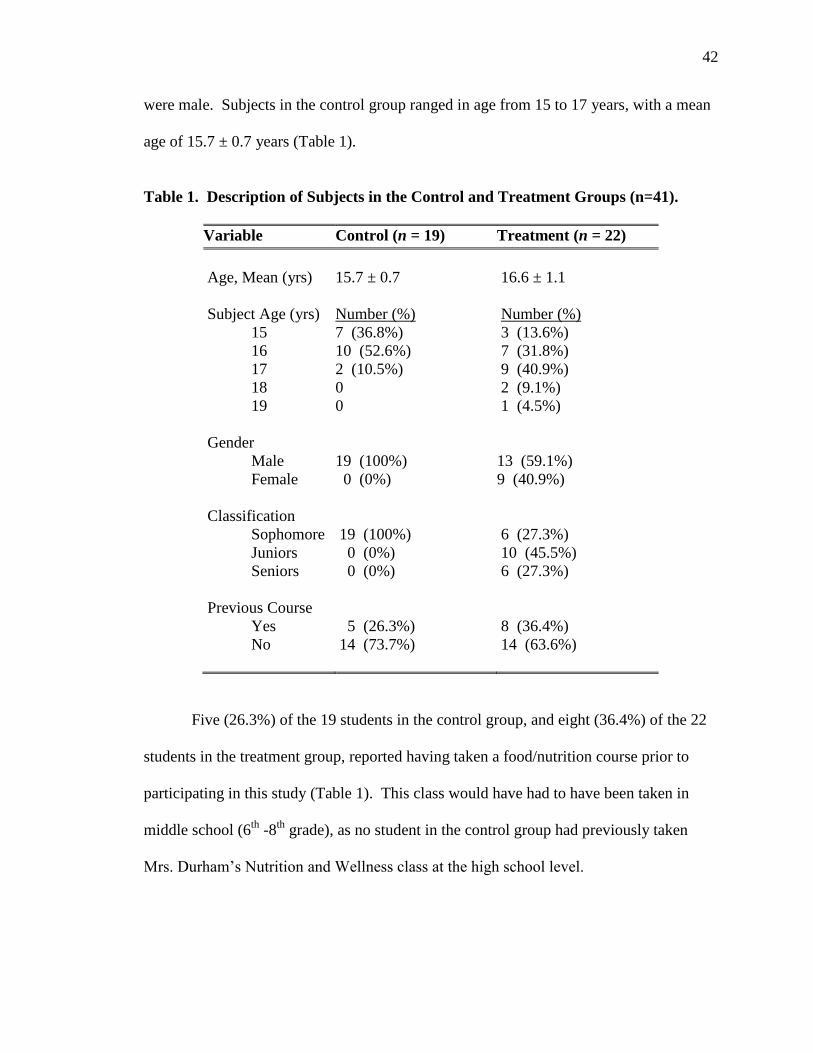
42
were male. Subjects in the control group ranged in age from 15 to 17 years, with a mean
age of 15.7 ± 0.7 years (Table 1).
Table 1. Description of Subjects in the Control and Treatment Groups (n=41).
Variable Control (n = 19) Treatment (n = 22)
Age, Mean (yrs)
Subject Age (yrs)
15
16
17
18
19
15.7 ± 0.7
Number (%)
7 (36.8%)
10 (52.6%)
2 (10.5%)
0
0
16.6 ± 1.1
Number (%)
3 (13.6%)
7 (31.8%)
9 (40.9%)
2 (9.1%)
1 (4.5%)
Gender
Male
Female
19 (100%)
0 (0%)
13 (59.1%)
9 (40.9%)
Classification
Sophomore
Juniors
Seniors
19 (100%)
0 (0%)
0 (0%)
6 (27.3%)
10 (45.5%)
6 (27.3%)
Previous Course
Yes
No
5 (26.3%)
14 (73.7%)
8 (36.4%)
14 (63.6%)
Five (26.3%) of the 19 students in the control group, and eight (36.4%) of the 22
students in the treatment group, reported having taken a food/nutrition course prior to
participating in this study (Table 1). This class would have had to have been taken in
middle school (6th
-8th
grade), as no student in the control group had previously taken
Mrs. Durham‟s Nutrition and Wellness class at the high school level.

43
RQ#1: Nutrition Knowledge
The first research question examined whether completion of a five-day
experiential unit that emphasizes nutrition knowledge and preparation methods of fruits
and vegetables would be associated with an increased knowledge about fruits and
vegetables, both at the completion of the unit and at a two month follow-up period.
At baseline, the control group (n=19) had a mean score of 5.16 ± 1.89 out of ten
possible points, while the treatment group (n=22) had a mean score of 5.50±1.43.
Analysis of variance (ANOVA) indicated there was no statistical difference between the
control and the treatment group at baseline (F=0.431; p = 0.515) (Table 2) (Figure 1).
After receiving the five nutrition education lessons, the mean score for the
treatment group rose significantly to 7.82 ± 1.50, while the score for the control group
declined, but non-significantly, to 4.63 ± 2.43. Results indicated a significant increase in
the overall nutrition knowledge score between pretest and posttest for the treatment group
(F=26.27; p = 0.000) (Table 2) (Figure 1). No differences in the posttest scores were
detected by gender (males: 7.7 ± 1.4; n=13 vs. females: 8.0 ± 1.7; n=9) (F=.215; p=.648).
Table 2. Comparison of the Mean Fruit and Vegetable Knowledge Score
Between Experimental and Control Groups at Pre-Test, Post-Test,
and Two-Month Follow-Up.
Treatment
(n=22)
Control
(n=19) F p
Pre
Post
5.50 ± 1.43
7.82 ± 1.50
5.16 ± 1.89
4.63 ± 2.43
0.431
26.27
.515
.000
Follow-Up 6.91 ± 2.07 5.26 ± 2.90 4.46 .041
Paired tpost/follow-up
p
1.92
.069
0.77
.454

44
Two months after completing the five nutrition education lessons, ANOVA
indicated a statistically significant difference between the control group and the treatment
group (6.71 ± 2.07 vs. 5.26 ± 2.90; paired-t = 4.46; p = .041). Within the treatment
group, a paired t-test indicated no significant difference between the post-test knowledge
score and the follow-up knowledge score, indicating the retention of knowledge learned
(7.82 ± 1.50 vs. 6.91 ± 2.07; t = 1.92, p = .069). Paired t-test also indicated the treatment
group scored significantly higher on the follow-up test than on the pretest (5.5 ± 1.4 vs.
6.9 ± 2.1; t=3.58, p=0.02). There was no change in the knowledge score for the control
group from post-test to the nine-week follow-up testing period (4.63 ± 2.43 to 5.26 ±
2.90; paired-t = 0.77; p=.454) (Table 2) (Figure 1).
Figure 1. Mean Knowledge Scores Comparing the Pretest, Post Test, and Two-
Month Follow Up for the Control and Treatment Groups

45
Only one question was correctly answered by all 22 students in the treatment
group on the pre-assessment (e.g., “Fruit is a good source of many vitamins and minerals;
Table 3). On the post assessment, every question was answered correctly by at least 77
percent of the students, with the exception of the two questions about fresh fruits being
available at times other than when it is “in season” (63.6% correct) and the role of
vegetable skin and pulp providing fiber to aid digestion (72.7 percent; Table 3).
Table 3. Percent of Students in the Treatment Group who Answered the
Knowledge Questions Correctly at Pre- and Posttest (n=22).
Question Pretest
(%)
Posttest
(%)
Fruits are only available when they are “in season.” (false)
45.5 63.6
Fruit is a good source of many vitamins and minerals. (true)
100.0 100.0
Most vegetables are low in calories. (true) 77.3 95.5
Vegetables cooked in a microware oven are less nutritious
than others. (false)
36.3 77.3
Which of these fruits is a good source of vitamin A?
(peaches)
18.2 86.4
For a 2000 calorie diet, how many cups of fruits and
vegetables, combined, should you eat every day? (4½ c.)
36.4 81.8
Vegetable skin and pulp provides ___ to aid digestion and
help keep you „regular‟ (fiber).
40.9 72.7
Some nutrients in vegetables are ___ ___ and dissolve in
the cooking liquid (water-soluble).
50.0 86.4
____ are an excellent source of vitamin C (Oranges)
86.4
95.5
About how many grams of fiber are recommended every
day (20-35 grams)
59.1 77.3

46
Cronbach‟s alpha was conducted on the post-test scores for the treatment group to
determine the test‟s reliability. Results indicated an internal consistency of 0.73,
indicating an acceptable level of reliability (e.g., a reliability coefficient of .70 or higher
is considered "acceptable" in most social science research situations). A test-retest
correlation conducted on the pre-test and post-test for the control group was r = 0.52.
RQ#2: Attitudes Toward Fruits and Vegetables
The second research question examined the impact of the five-day nutrition
education unit on the attitude of these high school students toward fruits and vegetables.
Several pre- and post-test questions were asked to determine the students attitude toward
fruits and vegetables.
The students were asked a series of questions that asked “How true are these
statements for you?” on the pretest and posttest in an effort to measure their attitude
toward fruits and vegetables. Wilcoxon Signed Ranks Test indicated no statistical
change in response to any of the six questions in the treatment group after completion of
the five day intervention.
The first attitude question asked if they were “afraid to eat a fruit I have never
tried before.” Almost half of the students (40.9%) reported this was “not true at all” on
both on the pretest and posttest, while 4.5 percent reported that was “absolutely true”
both on the pretest and posttest (Figure 2). Wilcoxon Signed Ranks Test indicated no
shift in attitude from pre-test to post-test after completion of the five-day intervention (Z
= .213; p=0.832).

47
I am afraid to eat a fruit I never had before
40.9
36.4
18.2
4.5
40.9
31.8
22.7
4.5
0
5
10
15
20
25
30
35
40
45
Not true at all Not really Sort of true Absolutely
Treatment- Pre
Treatment- Post
Figure 2. Comparison of Pre-and Posttest Responses in the Treatment Group to
the Statement “I am afraid to eat a fruit I never had before” (n=22).
A second question asked if the students would “eat almost any fruit.” Almost half
(40.9%) reported they would “Absolutely” eat any fruit on the pretest; the percent rose
insignificantly to 45.5 percent on the posttest. Almost one-fourth (22.7%) of the students
reported this was “not true at all” on the pretest; the number decreased insignificantly to
18.2 percent on the posttest (Figure 3). No statistical shift in attitude from pre-test to
post-test after completion of the five-day intervention was detected (Z=-.264; p=0.792).
I will eat almost any fruit
40.9
22.7
13.6
22.7
45.5
13.6
22.7
18.2
0
5
10
15
20
25
30
35
40
45
50
Absolutely Sort of true Not really Not true at all
Treatment- Pre
Treatment- Post
Figure 3. Comparison of Pre-and Posttest Responses in the Treatment Group to
the Statement “I will eat almost any fruit” (n=22).

48
A third question asked if the students “were afraid to eat a vegetable they had
never tried before.” Approximately one in ten students (13.6%) reported that was
absolutely true on the pretest; the percent increased insignificantly to 18.2 percent on the
posttest (Figure 4). Students appeared to have shifted their attitude from that of “not true
at all” at the pretest (27.3%) to “not really” (45.5%) on the posttest, indicating a trend
toward being more hesitant to try a new vegetable, although the change was not
statistically significant (Z=-.312; p=0.755).
I am afraid to eat a vegetable I have never had before
27.3
22.7
36.4
13.613.6
45.5
22.7
18.2
0
5
10
15
20
25
30
35
40
45
50
Not true at all Not really Sort of true Absolutely
Treatment- Pre
Treatment- Post
Figure 4. Comparison of Pre-and Posttest Responses in the Treatment Group to
the Statement “I am afraid to eat a vegetable I have never tried
before” (n=22).
A fourth question asked if the students “would eat almost any vegetable.” The
class was evenly divided in their response on the pretest, with 27.3 percent of the students
responding “absolutely,” “not really”, and “not true at all,” while 18.2 percent responded
“sort of true” (Figure 5). On the post-evaluation, little change was observed and no
statistically significant differences were detected (Z=-.046; p=0.963).

49
Figure 5. Comparison of Pre-and Posttest Responses in the Treatment Group to
the Statement “I will eat almost any vegetable” (n=22).
The students were asked to indicate how they felt about eating specific fruits and
vegetables. The most popular fruits that were “liked a lot” by more than half of the
students were pineapple (59% pretest; 64% posttest), peaches (50% pretest; 59% posttest)
and, unfortunately, French Fries (73% pretest; 86% posttest) (Figure 6)
Like A Lot
18.2
59.1
50
27.3 27.318.2
72.7
27.3
63.659.1
18.222.7
27.3
86.4
0
10
20
30
40
50
60
70
80
90
100
Pear Pineapple Peach Tangerine Caulif low er Zucchini French
fries
Pre
Post
Figure 6. Comparison of Pre- and Posttest Response in the Treatment Group
Indicating the Fruits and Vegetables Students “Like a Lot” (n=22).
I will eat almost any vegetable
27.3
18.2
27.3 27.3
22.7
27.3 27.3
22.7
0
5
10
15
20
25
30
Absolutely Sort of true Not really Not true at all
Treatment- Pre
Treatment- Post

50
The vegetables and fruits most disliked (e.g., students responded either “Don‟t
Like” or “Hate It!”) on the pretest were sweet red peppers (36.4%), tangerines (31.8%),
broccoli (31.8%), pears (27.3%), and cauliflower (22.7%). On the posttest, the percent of
students who reported they disliked (e.g., responded “Don‟t Like” or “Hate It”) pears
decreased from 27.3 percent to 18.2 percent and sweet red peppers from 36.4 percent to
22.7 percent. In addition, the number of students who reported they “hated” broccoli
decreased from 18.2 percent to 9.1 percent at posttest.
Students were asked to indicate which fruits and vegetables they had never tried
before. On the pretest, 13.6 percent said they never tried tangerines; this number
decreased to 9.1 percent at posttest. At pretest, 4.5 percent of the students had never tried
cauliflower; this number decreased to zero at posttest. Lastly, 18.2 percent of the
students reported they have never tried zucchini; this number decreased to 4.5 percent on
the posttest (Figure 7).
Never Tried
13.6
4.5
18.2
9.1
0
4.5
0
5
10
15
20
25
30
35
40
Tangerine Caulif low er Zucchini
Pre
Post
Figure 7. Comparison of Pre- and Posttest Response in the Treatment Group
Indicating Fruits and Vegetables Students had “Never Tried” (n=22).

51
RQ#3: Consumption of Fruits and Vegetables
The third research question examined the impact of the five-day nutrition
education unit on the students‟ self-reported consumption of fruits and vegetables at the
completion of the unit.
Recommended Cups of Fruit per Day
At the pretest, students in the treatment group (n=22) indicated they thought they
should eat 2.3 ± 1.0 cups of fruit per day, while the control group (n=19) reported they
thought they should be eating 2.8 ± 0.8 cups of fruit per day. Both of these values are
higher than the two cups that are recommended in the MyPyramid for a 2000 calorie diet.
ANOVA indicated there was no statistical difference between the treatment group and the
control group in the amount of fruit students thought they should eat at the pretest
(F=3.278; p =0.078) (Table 4).
At the posttest, students in the treatment group reported they should eat 2.1 ± 0.8
cups of fruit per day, while the control thought they should be eating 2.7 ± 0.8 cups of
fruit per day. ANOVA indicated this difference between the treatment group and the
control group at the posttest was statistically significant (F=4.832; p=0.034) (Table 4).
The treatment group as a whole responded more closely to the two cups that were taught
in the curriculum as the amount of fruit recommended in MyPyramid.
Although there was a reduction in the number of cups of fruit the treatment group
thought they should eat each day at posttest, a paired t-test of the treatment group only
indicated the reduction from 2.3 ± 1.0 cups to 2.1 ± 0.8 cups was not significant (t =
0.777, p = .466). Similarly, there was no change in the number of cups of fruit the

52
control group thought they should eat each day from pre-test to post-test (2.8 ± 0.8 cups
vs. 2.7 ± 0.8 cups; t = 1.14; p = .268) (Table 4).
Table 4. Mean Cups of Fruit Students Thought they Should Eat Each Day.
Treatment
(n=22)
Control
(n=19) F p
Pretest
Posttest
2.3 ± 1.0
2.1 ± 0.8
2.8 ± 0.8
2.7 ± 0.8
3.278
4.832
0.078
0.034
Difference -.182 -.158
Paired-t
p
.777
.446
1.143
.268
Recommended Cups of Vegetables per Day
At the pretest, students in the treatment group reported they should eat 2.1 ± 1.0
cups of vegetables per day, while the control group thought they should eat 2.7 ± 0.7 cups
of vegetables per day. These two values surrounded the actual value of 2.5 cups of
vegetables per day as recommended by the MyPyramid. Despite the mean difference,
ANOVA indicated there was no statistical difference between the treatment group and
control group at the pretest (F=4.384; p=0.043) (Table 5).
At the posttest, students in the treatment group indicated they should eat 2.2 ± 0.8
cups of vegetables per day, while the control group thought they should be eating 2.4 ±
0.9 cups of vegetables per day. ANOVA indicated there was no statistical difference
between the treatment group and the control group at posttest (F=0.500; p=0.484) (Table
5).
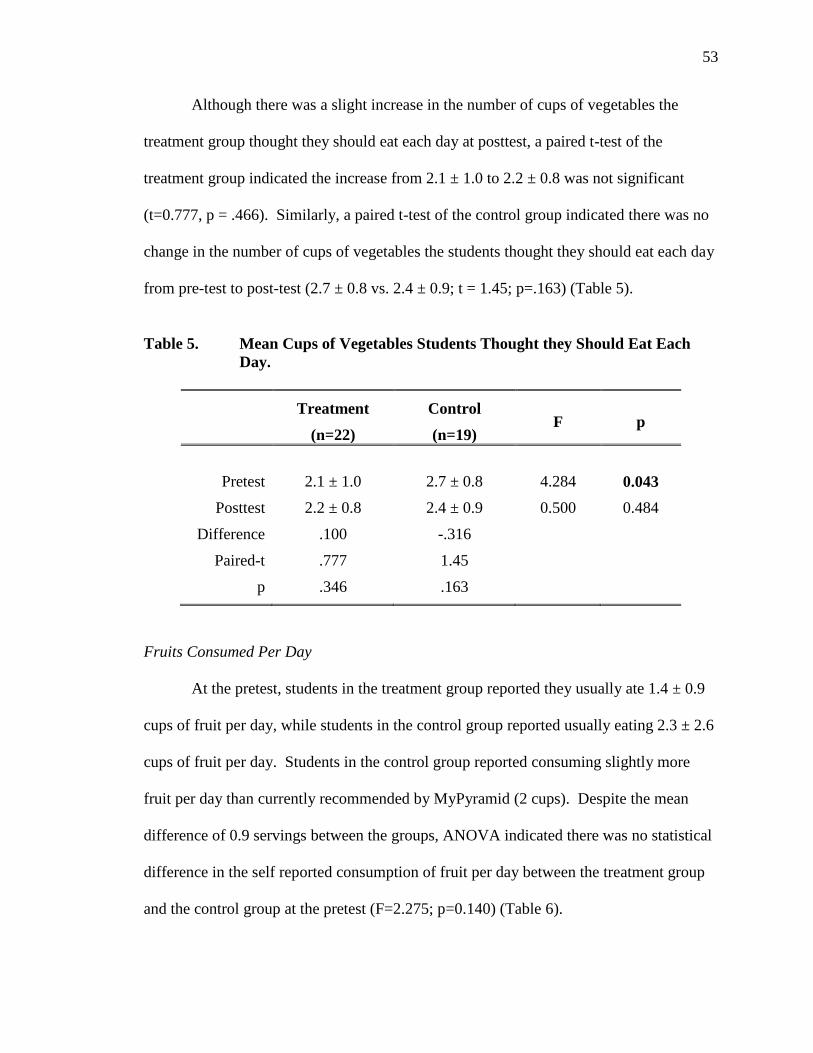
53
Although there was a slight increase in the number of cups of vegetables the
treatment group thought they should eat each day at posttest, a paired t-test of the
treatment group indicated the increase from 2.1 ± 1.0 to 2.2 ± 0.8 was not significant
(t=0.777, p = .466). Similarly, a paired t-test of the control group indicated there was no
change in the number of cups of vegetables the students thought they should eat each day
from pre-test to post-test (2.7 ± 0.8 vs. 2.4 ± 0.9; t = 1.45; p=.163) (Table 5).
Table 5. Mean Cups of Vegetables Students Thought they Should Eat Each
Day.
Treatment
(n=22)
Control
(n=19) F p
Pretest
Posttest
2.1 ± 1.0
2.2 ± 0.8
2.7 ± 0.8
2.4 ± 0.9
4.284
0.500
0.043
0.484
Difference .100 -.316
Paired-t
p
.777
.346
1.45
.163
Fruits Consumed Per Day
At the pretest, students in the treatment group reported they usually ate 1.4 ± 0.9
cups of fruit per day, while students in the control group reported usually eating 2.3 ± 2.6
cups of fruit per day. Students in the control group reported consuming slightly more
fruit per day than currently recommended by MyPyramid (2 cups). Despite the mean
difference of 0.9 servings between the groups, ANOVA indicated there was no statistical
difference in the self reported consumption of fruit per day between the treatment group
and the control group at the pretest (F=2.275; p=0.140) (Table 6).
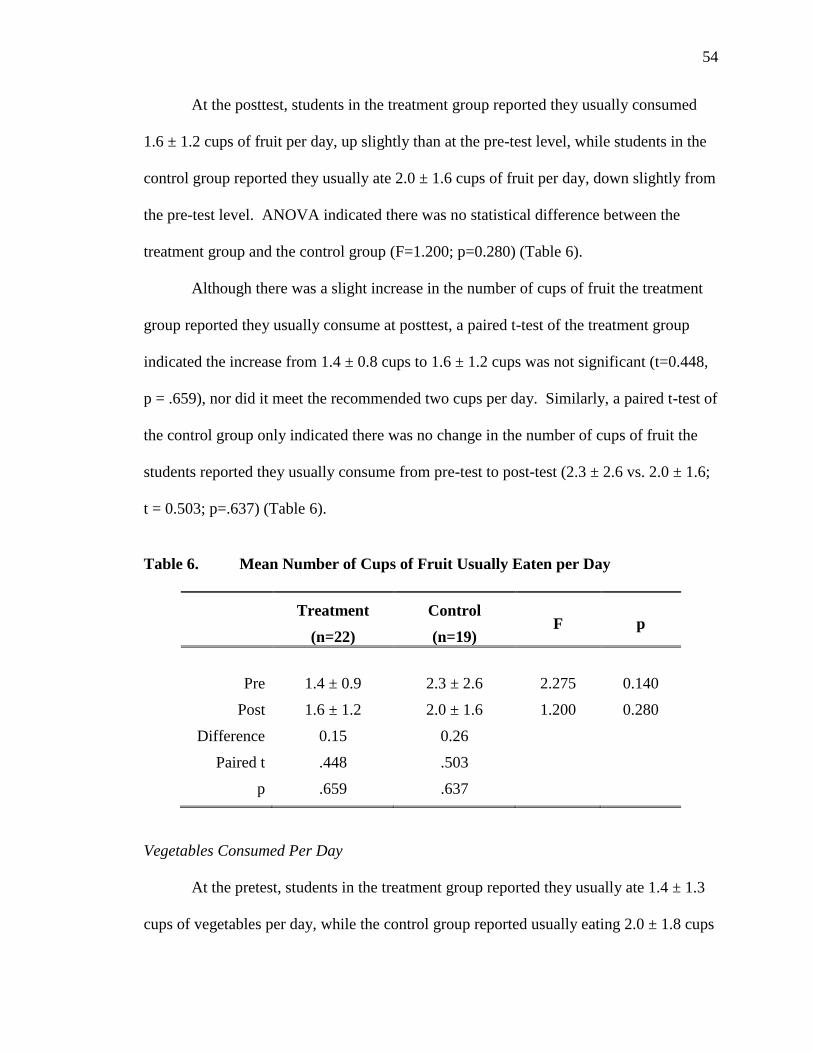
54
At the posttest, students in the treatment group reported they usually consumed
1.6 ± 1.2 cups of fruit per day, up slightly than at the pre-test level, while students in the
control group reported they usually ate 2.0 ± 1.6 cups of fruit per day, down slightly from
the pre-test level. ANOVA indicated there was no statistical difference between the
treatment group and the control group (F=1.200; p=0.280) (Table 6).
Although there was a slight increase in the number of cups of fruit the treatment
group reported they usually consume at posttest, a paired t-test of the treatment group
indicated the increase from 1.4 ± 0.8 cups to 1.6 ± 1.2 cups was not significant (t=0.448,
p = .659), nor did it meet the recommended two cups per day. Similarly, a paired t-test of
the control group only indicated there was no change in the number of cups of fruit the
students reported they usually consume from pre-test to post-test (2.3 ± 2.6 vs. 2.0 ± 1.6;
t = 0.503; p=.637) (Table 6).
Table 6. Mean Number of Cups of Fruit Usually Eaten per Day
Treatment
(n=22)
Control
(n=19) F p
Pre
Post
1.4 ± 0.9
1.6 ± 1.2
2.3 ± 2.6
2.0 ± 1.6
2.275
1.200
0.140
0.280
Difference
Paired t
p
0.15
.448
.659
0.26
.503
.637
Vegetables Consumed Per Day
At the pretest, students in the treatment group reported they usually ate 1.4 ± 1.3
cups of vegetables per day, while the control group reported usually eating 2.0 ± 1.8 cups

55
per day. ANOVA indicated there was no statistical difference between the treatment
group and the control group in the number of cups of vegetables the students usually ate
each day at the pretest (F=1.462; p=0.234) (Table 7).
At the posttest, students in the treatment group reported they usually ate 1.6 ± 1.4
cups of vegetables per day, while the control group reported usually eating 1.7 ± 1.2 cups
of vegetables per day. Neither of the groups came close to consuming the 2.5 cups
recommended by MyPyramid and emphasized in the five-day curriculum. ANOVA
indicated there was no statistical difference between the number of cups of vegetables
usually consumed by the treatment group and the control group at the posttest (F=0.194;
p=0.662) (Table 7).
Table 7. Mean Number of Cups of Vegetables Usually Eaten per Day.
Treatment
(n=22)
Control
(n=19) F p
Pre
Post
1.4 ± 1.3
1.6 ± 1.4
2.0 ± 1.8
1.7 ± 1.2
1.462
0.194
0.234
0.662
Difference
Paired t
p
0.18
.557
.584
0.32
.637
.532
Although there was a slight increase in the number of cups of vegetables the
treatment group reported they usually consume at posttest, a paired t-test indicated the
increase from 1.4 ± 1.3 cups to 1.6 ± 1.4 cups in the treatment group was not significant
(t=0.557, p = .584), nor did it meet the recommended two cups of vegetables per day.
56
Similarly, a paired t-test of the control group indicated there was no change in the number
of cups of vegetables the students reported they usually consume from pre-test to post-
test (2.0 ± 1.8 vs. 1.7 ± 1.2; t = 0.637; p=.532) (Table 7).
Choose Fruit as a Snack
At baseline, there was no difference between the control group and the treatment
group in response to the question “How often would you choose fruit as a snack instead
of chips or candy?” (F=0.331; p=0.568). The majority of students in both groups
responded “I would sometime” (Treatment Group: 59%; Control Group: 47%).
Approximately one-quarter of the students (27.3% treatment; 26.8% control) indicated
they would choose fruit as a snack “most of the time.” Only one student in each group
indicated they would “never” choose fruit as a snack. After receiving the five nutrition
education lessons, there was no change in the percent of students who reported they
would choose fruit as a snack instead of chips or candy in either the treatment or the
control groups (F=0.046; p=0.831).
Choose Vegetables as a Snack
At baseline, there was no difference between the control group and the treatment
group in response to the question “How often would you choose vegetables as a snack
instead of chips or candy?” (F=0.331; p=0.568), although the answers were much more
dispersed than they were for fruit. The majority of students in both groups responded “I
would sometime” (Treatment Group: 36%; Control Group: 47%). Twenty-three percent
of the students in the treatment group, and 16 percent of the students in the control group,
indicated they would choose vegetables as a snack instead of chips and candy “most of

57
the time.” In contrast to fruits, four students in each group indicated they would “never”
choose vegetables as a snack. After receiving the five nutrition education lessons, there
was no change in the percent of students who reported they would choose vegetables as a
snack instead of chips or candy in either the treatment or the control groups (F=0.217;
p=0.644).
Select New Fruit if Offered
At baseline, 41 percent of the students in the treatment group, and 37 percent of
the students in the control group, reported they would try a new fruit if it was served with
the school lunch. There was no statistical difference in the distribution at baseline (χ2 =
2.04, p = 0.360). After the completion of the five-day nutrition unit, the percent who
responded “yes” from the treatment group increased from 41 percent to 68 percent
(n=15), while the percent for the students in the control group remained the same (31.6%;
n=6) (Table 8). The chi square analysis indicated a trend toward statistical difference
between the groups at post assessment, with the treatment group indicating a greater
willingness to try a new fruit (χ2 = 5.73, p = 0.057).
Select New Vegetable if Offered
At baseline, only one-quarter (27%; n=6) of the treatment group, and ten percent
(n=2) of the control group, said they would try a new vegetable if it was served with
lunch (Table 8). The majority of students indicated their response as “maybe”
(Treatment: n=9, 41%; Control: n=12, 63%). There was no statistical difference in the
distribution at baseline (χ2 = 2.56, p = 0.279). After the five-day curriculum, one more
person in the treatment group (n=7; 32%) and two more students in the control group

58
(n=4; 21%) indicated they would try a new vegetable if it was served at lunch (Table 8).
Nonetheless, there was no statistical difference in the distribution at posttest (χ2 = 0.602;
p = 0.740)
Table 8. Percent of Students who Responded “Yes” to the Statement “If a new fruit
or vegetable was served with your lunch today, would you try it?”
Percent Who Responded “Yes”
Treatment
(n=22)
Control
(n=19)
Fruit
Pre
Post
% (N)
40.9 (9)
68.2 (15)
% (N)
36.8 (7)
31.6 (6)
Vegetable
Pre
Post
27.3 (6)
31.8 (7)
10.5 (2)
21.1 (4)
Tried a New Fruit or Vegetable Lately
At baseline, 27.3 percent of the treatment group (n=6), and 15.8 percent of the
control group (n=3), indicated they had tried a new fruit lately. There was no statistical
difference in the distribution at baseline (χ2 = .785, p = 0.376). At posttest, despite being
exposed to a variety of fruits during the nutrition education lessons, only 22.7 (n=5)
percent of the treatment group, and 15.8 percent of the control group (n=3), indicated
they had tried a new fruit lately (Table 9). These results are not statistically different
(χ2 = .312, p = 0.576).
At baseline, 13.6 percent (n=3) of the treatment group, and 15.8 percent (n=3) of
the control group, indicated they had tried a new vegetable lately. There was no
statistical difference in the percent of students who had tried a new vegetable between

59
groups at baseline (χ2 = 2.56, p = 0.279). At post-test, the number of students in the
treatment group who indicated they had tried a new vegetable increased to 22.7 percent
(n=5), while the percent in the control group remained the same (15.8%; n=3) (Table 9).
Nonetheless, despite the five-day nutrition curriculum that included several recipes that
highlighted vegetables, there was no statistical difference in the distribution of students
who had tried a new vegetable recently at the post-test period (χ2 = .312, p = 0.576).
Table 9. Percent of Students who Responded “Yes” to the Statement “I Have Tried
a New Fruit or Vegetable Lately.” (n=40).
Percent Tried New Fruit or Vegetable
Treatment
(n=22)
Control
(n=19)
Fruit
Pre
Post
% (N)
27.3 (6)
22.7 (5)
% (N)
15.8 (3)
15.8 (3)
Vegetable
Pre
Post
13.6 (3)
22.7 (5)
15.8 (3)
15.8 (3)
Eat School Lunch Fruit
At baseline, the majority of students in both the control and treatment groups
indicated they ate the fruit that was offered with the school lunch either “never” or only
“1-2 days per week” (Treatment: 68%; n=15; Control: 53%; n=10). Only four students in
both the control and treatment group indicated they would eat the fruit every day. There
was no statistical difference in the distribution at baseline (χ2 = 2.21, p = 0.529).

60
Analysis of the posttest data indicate the number of students in the treatment
group who indicated they ate the fruit offered with the school lunch either “never” or
only “1-2 days per week” increased from 68 percent at baseline to 77 percent (n=17).
The percent of students in the control group who would never or hardly ever eat the fruit
remained constant at 53 percent. There was no difference between the groups at the end
of the treatment period (χ2 = 3.35, p = 0.340).
Eat School Lunch Vegetables
At baseline, the majority of students in both the control and treatment groups
indicated they ate the vegetables that were offered with the school lunch either “never” or
only “1-2 days per week” (Treatment: 77%; n=17; Control: 53%; n=10). Only two
students in the treatment group (9%) and three students in the control group (16%)
indicated they would eat the vegetable offered every day. There was no statistical
difference in the distribution at baseline (χ2 = .820, p = 0.845).
Analysis of the posttest data indicate the number of students in the treatment
group who indicated they ate the vegetables offered with the school lunch either “never”
or only “1-2 days per week” decreased by one student, from 77 percent at baseline to 73
percent (n=16). The percent of students in the control group who would never or hardly
ever eat the vegetables offered with the school lunch remained constant at 53 percent.
There was no difference in the distribution pattern of the percent of students who ate the
vegetables provided with the school lunch between the groups at the end of the treatment
period (χ2 = 2.98, p = 0.395).

61
Pack Fruit in Lunch
At baseline, the majority of students in the treatment group (73%) indicated they
packed a fruit for lunch. Of these, 14 percent said they packed a fruit every day, 27
percent packed a fruit 3-4 days per week, and 32 percent said they packed a fruit 1-2 days
per week. A similar distribution was seen in the control group where 58 percent of the
students indicated they either packed a fruit with their lunch every day (21%), 3-4 days
per week (5%) or 1-2 days per week (32%). One quarter of the students in the treatment
group (27%), and almost half of the students in the control group (42%), indicated they
never pack a fruit with their lunch. There was no statistical difference between the
groups at the post-test evaluation (χ2 = 3.878, p = 0.275).
At the completion of the five-day nutrition lessons, the same percent (73%) of
students in the treatment group indicated they packed a fruit with their lunch. Of these, 9
percent said they packed a fruit every day, 32 percent said they packed a fruit 3-4 days
per week, and 32 percent said they packed a fruit 1-2 days per week. A similar
distribution was seen in the control group where 79 percent of the students indicated they
pack a fruit with their lunch. Of these, 21 percent said they packed a fruit with their
lunch every day, 21 percent packed a fruit 3-4 days per week, and 37 percent said they
packed a fruit 1-2 days per week. At the post-assessment period, 27 percent of the
students in the treatment and 21 percent of the students in the control group indicated
they never pack a fruit with their lunch. There was no statistical difference between the
groups at the post-test evaluation (χ2 = 1.67, p = 0.643).

62
Pack Vegetables in Lunch
At baseline, slightly more than half of the students in the treatment group (59%)
indicated they pack a vegetable with their lunch. Of these, 14 percent said they packed a
vegetable every day, 14 percent packed a vegetable 3-4 days per week, and 32 percent
said they packed a vegetable 1-2 days per week. A similar distribution was seen in the
control group where 53 percent of the students indicated they pack a vegetable with their
lunch. Of these, 21 percent said they packed a vegetable every day, 16 percent packed a
vegetable 3-4 days per week, and another 16 percent said they packed a vegetable 1-2
days per week. Forty-one percent of the students in the treatment group, and 32% of the
students in the control group, indicated they never pack a vegetable with their lunch.
There was no statistical difference in the distribution between the groups at baseline (χ2 =
1.53, p = 0.675).
At the completion of the five-day nutrition lessons, the responses were exactly the
same as during the pretest period. Specifically, 59 percent of the students in the
treatment group (59%) indicated they pack a vegetable with their lunch. Of these, 14
percent packed a vegetable every day, 14 percent packed a vegetable 3-4 days per week,
and 32 percent packed a vegetable 1-2 days per week. A similar distribution was seen in
the control group where slightly more students (68%) indicated they pack a vegetable
with their lunch. Of these 11 percent packed a vegetable every day, 26 percent packed a
vegetable 3-4 days per week, and 32 percent packed a vegetable 1-2 days per week.
Forty-one percent of the students in the treatment group, and 32 percent of the students in
the control group, indicated they never pack a vegetable with their lunch at the post-

63
assessment. There was no statistical difference in the distribution between the groups at
the post-assessment period (χ2 = 1.16, p = 0.762).
Summary
Overall, the results of this five-day intervention that focused on increasing
students‟ knowledge about, attitude toward, and consumption of fruits and vegetables are
disappointing. Although the intervention was associated with a statistically significant
increase in knowledge about fruits and vegetables at the end of the unit, with a retention
of the knowledge in the treatment group two months after the intervention, and
knowledge of the number of cups of fruit a person should eat each day, no statistically
significant changes were observed in the students‟ attitude toward, or consumption of,
fruits and vegetables. There was a statistical trend indicating a greater willingness of the
treatment group to try a new fruit (χ2 = 5.73, p = 0.057) and there was a decrease in the
percent of students in the treatment group who indicated they had tried cauliflower and
zucchini at the end of the intervention. No other statistically significant results were
observed either between or within the groups at the pre- and post-assessment periods.

64
CHAPTER 5
DISCUSSION
The purpose of this quasi-experimental study was to determine the impact of five
50-minute nutrition lessons and cooking demonstrations/labs developed by this
researcher on high school students‟ knowledge, attitude, and food consumption behavior
of fruits and vegetables. This section will discuss the results of the study in context with
the current literature.
RQ #1: Nutrition Knowledge
At baseline, the control group (n=19) had a mean score of 5.2 ± 1.9 out of ten
possible points (52% correct), while the treatment group (n=22) had a mean score of 5.5
± 1.4 (55% correct). Analysis of variance (ANOVA) indicated there was no statistical
difference between the control and the treatment group at baseline (F=0.431; p = 0.515).
After receiving the lessons, the mean score for the treatment group rose
significantly from 5.5 ± 1.4 to 7.8 ± 1.5 (78% correct), while the score for the control
group declined, but non-significantly, from 5.2 ± 1.9 to 4.6 ± 2.4 (46% correct), resulting
in a significant increase in the overall nutrition knowledge score between pretest and
posttest for the treatment group. No difference in knowledge was detected by gender.

65
Two months after completing the five nutrition education lessons, paired analysis
within groups indicated the mean score for the treatment group fell non-significantly
from 7.8 ± 1.5 to 6.9 ± 2.1, while the score for the control group increased slightly, but
insignificantly, from 4.6 ± 2.4 to 5.3 ± 2.90. ANOVA indicated there was a significant
difference in the overall fruit and vegetable knowledge score between the control and
treatment group two months after the intervention, indicating the students in the treatment
group retained the knowledge learned in the fruit and vegetable curriculum.
All of the students correctly answered the question “Fruit is a good source of
many vitamins and minerals” at both the pretest and posttest periods. On the post-
assessment, six of the ten questions were answered correctly by 82 percent or more of the
students. Of the four questions that were answered incorrectly by five or more of the
students on the posttest, two related to dietary fiber, one related to the nutritional value of
vegetables that are cooked in a microwave oven, and one related to the availability of
“fresh” fruits. These concepts (e.g., fiber, seasonality, retention of vitamins when
microwaving food) should be emphasized when the curriculum is implemented.
Pirouznia (2001) reported the overall mean score on the knowledge portion of the
CANKAP (Comprehensive Assessment of Nutrition Knowledge, Attitudes, and
Practices) questionnaire completed by sixth-grade students was 13.7 out of a possible
score of 20 points (68% correct), 11.8 out of a possible score of 25 points (47% correct)
for seventh graders, and 11.5 out of a possible score of 25 points (46% correct) for eighth
grade students. The high school students in the present study scored slightly higher on
the pretest (52% and 55% for the treatment and control groups, respectively) than the
middle school students in the CANKAP study. Pirouznia (2001) suggested corrective

66
measures, such as implementing nutrition education programs in elementary schools, as
eating habits are more likely to be shaped in younger ages, and organizing programs and
activities in science and health classes to motivate students to learn about nutrition are
indicated. The low score of the pretest in the present study (52% treatment group; 55%
control group) support the suggestion of Pirouznia (2001).
Upon completion of the “Fit Kids „r‟ Healthy Kids” nutrition knowledge survey,
students from the intervention group demonstrated an 8.3 percent improvement, while the
control group showed only a 0.1 percent increase (Gower et al., 2010). The results of the
present study also indicated an increase in nutrition knowledge in the treatment group
(from 53% correct at pretest to 78% at posttest) and no change in knowledge in the
control group (from 55% at pretest to 46% correct at posttest). It should be noted that the
small number of questions in the present study results in large swings in the survey‟s
percent correct.
Jan et al. (2009) reported higher levels of knowledge in the children after
exposure to the Shape It Up program. For the knowledge questions, the mean number of
correctly answered questions rose from 3.6 at baseline to 5.0 after exposure to the
intervention. After the number of questions answered correctly was converted to a
percent scale, the mean score increased from 59.4 at baseline to 82.6 at the completion of
the program. These results are similar to the results obtained in the present study. The
authors concluded that Shape It Up appeared to have had a positive impact on the
childrens‟ knowledge and attitudes toward exercise and healthy eating. The author
cautioned that additional research employing a comparison group is needed to assess the
program‟s impact. The present study employed a control group as suggested by Jan et al

67
(2009), which provides evidence that the curriculum implemented in this study was
responsible for the statistically significant improvement seen in the students‟ knowledge
compared to the control group.
RQ #2: Attitudes Toward Fruits and Vegetables
The students were asked a series of questions that asked “How true are these
statements for you?” on the pretest and posttest to measure their attitude toward fruits and
vegetables. Wilcoxon Signed Ranks Test indicated no statistical change in response to
any of the six questions in the treatment group after completion of the five-day
intervention.
Heim et al. (2009) reported nearly all of the children (97.8%) enjoyed taste-testing
different fruits and vegetables during their intervention. The children also reported they
liked to prepare fruit and vegetable snacks (93.4%). At baseline, more than two thirds of
the children had tried at least 75 percent of the 16 fruits and vegetables. At follow-up,
children reported a significant increase in the number of fruits and vegetables ever eaten.
The results of the present study support the results observed by Heim et al (2009) as the
students tried several new fruits and vegetables.
Gentile et al. (2009) examined the immediate and short-term, sustained effects of
the Switch program. Only 17 percent of the children met the recommended guidelines of
fruit and vegetable consumption. There were significant increases in parent-reported fruit
and vegetable consumption at post-intervention and six months post-intervention. The
increase for child-reported consumption was marginally significant at post-intervention
and was significant at six months post-intervention. Almost half of children and parents

68
reported that children ate more fruits and vegetables since beginning the program. The
perception of change among the experimental group was generally positive with 23
percent to 62 percent, indicating positive changes in behavior. The present study did not
query the parents to identify if they perceived their sons or daughters were consuming
additional fruits and vegetables. Results of the present study did not indicate a significant
increase in fruit and vegetable consumption at the end of the intervention or nine weeks
after the intervention was complete.
DeVault et al. (2009) found that children in both groups had increased Food
Choice Intention scores from pre- to posttest with intervention students‟ behavioral intent
scale scores for Food Choice Intentions improving significantly at posttest versus
comparison students‟ scores. The present study did not measure students‟ behavioral
intent. Future researchers should consider including this concept in their pre and post-
assessment instruments.
During the 2004-05 school year, the Mississippi Department of Education Child
Nutrition Program initiated the Mississippi Fresh Fruit and Vegetable Pilot Program. Of
the grades participating, program evaluation data indicated only eighth grade students had
significant increases in positive attitudes toward eating fruit and vegetables, in their
beliefs that they could eat more fruit, and in their willingness to try new fruit. Degree of
preference for fruit increased significantly among eighth grade and tenth grade students,
but decreased significantly among fifth grade students. Intention to eat fruit increased
significantly among tenth grade students, but not among fifth and eighth grade students
(CDC, 2006).

69
RQ #3: Consumption of Fruits and Vegetables
The third research question examined the impact of the five-day nutrition
education unit on the students‟ self-reported consumption of fruits and vegetables at the
completion of the unit. The treatment group in the present study was comprised of a mix
of males (n=13) and females (n=9). Analysis of the data indicated no statistically
significant difference between the control and treatment group, either before or after the
intervention.
Perry et al. (1998) found that there was a significant and favorable intervention
effect among girls for vegetable consumption at lunch, but not among boys. Pirouznia
(2001) found there was a significant difference between the eating behavior scores of
seventh and eighth-grade boys and girls. There was no correlation between nutrition
knowledge and food choices for sixth-grade male or female students or for boys in the
seventh and eighth grades. Caine-Bish & Scheule (2009) reported that boys
demonstrated a higher preference for ethnic foods, fish and casseroles, and beef, pork,
and barbeque than girls. Conversely, the starches and sweets factor was significantly
more preferred by the girls than the boys. Girls also showed a higher preference for fruits
and vegetables than boys.
Recommended Cups of Fruit and Vegetables per Day
At the pretest, students in the treatment group (n=22) indicated they thought they
should eat 2.3 ± 1.0 cups of fruit per day, while the control group (n=19) reported they
thought they should be eating 2.8 ± 0.8 cups of fruit per day. There was no difference
between the groups at the pretest. At the posttest, students in the treatment group

70
reported they should eat 2.1 ± 0.8 cups of fruit per day, while the control thought they
should be eating 2.7 ± 0.8 cups of fruit per day. There was no difference between the
groups at the posttest. It should be noted, however, that the change in the treatment
group was in the right direction, getting closer to the 2 cups of fruit per day
recommended in MyPyramid and emphasized in the five-day nutrition curriculum.
At the pretest, students in the treatment group thought they should eat 2.1 ± 1.0
cups of vegetables per day, while the control group thought they should eat 2.7 ± 0.7 cups
of vegetables per day. These results are not statistically different between groups at the
pretest. At the posttest students in the treatment group thought they should eat 2.2 ± 0.8
cups of vegetables per day, while the control group thought they should be eating 2.4 ±
0.9 cups of vegetables per day. Results indicated no statistical difference between the
groups at posttest. It should be noted, however, that the change in the treatment group
(e.g., increasing from 2.1 ± 1.0 to 2.2 ± 0.8) moved in the right direction and with a
smaller standard deviation, getting closer to the 2.5 cups of vegetables per day
recommended in MyPyramid and emphasized in the five-day nutrition curriculum.
Fruits and Vegetables Consumed per Day
At the pretest, students in the treatment group reported they usually ate 1.4 ± 0.9
cups of fruit per day, while the control group reported they usually ate 2.3 ± 2.6 cups of
fruit per day. There was no difference between the treatment group and the control group
at pretest. Students at the posttest, in the treatment group, reported they usually ate 1.6 ±
1.2 cups of fruit per day, while the control group reported they usually ate 2.0 ± 1.6 cups
per day. Again, results indicated no statistical difference between groups. Although

71
there was a slight increase in the number of cups of fruit the treatment group reported
usually consuming at posttest compared to pretest, the difference was not significant.
At the pretest, students in the treatment group reported they usually ate 1.4 ± 1.3
cups of vegetables per day, while the control group usually ate 2.0 ± 1.8 cups per day.
There was no statistical difference between the groups at pretest. At the posttest, students
in the treatment group reported they usually ate 1.6 ± 1.3 cups of vegetables per day
while the control group reported usually eating 1.7 ± 1.2 cups of vegetables per day.
There was no statistical difference between the treatment group and control group at the
posttest. Although there was a slight increase in the number of cups of vegetables the
treatment group reported usually consuming at posttest compared to the pretest, the
difference was not significant.
When the self-reported number of servings of fruits (1.6 ± 1.2 cups) and
vegetables (1.6 ± 1.3 cups) consumed by the treatment group were added together, the
resultant 3.2 cups daily are 1.3 cups short of current recommendations for a 2000 calorie
diet. When the number of servings of fruits (2.0 ± 1.6 cups) and vegetables (1.7 ± 1.2
cups) consumed by the control group were added together, the resultant 3.7 cups daily are
slightly less than one serving short of current recommendations for a 2000 calorie diet.
The results of the present study do indicate, however, that at post-assessment (3.2 cups),
the treatment group increased their consumption of fruits and vegetables by 0.4 cups over
their pretest (2.8 cups). In contrast, the control group reported a reduction in total fruit
and vegetable consumption from 4.3 cups (pre-assessment) to 3.7 cups (post-assessment).
Kimmons et al. (2009) noted that few American adolescents or adults reported
consuming the recommended amounts of fruits or vegetables. Adolescents consumed

72
more juice and less whole fruits than adults. Both adolescents and adults consumed
higher median quantities of vegetables than fruits, although the median vegetable intake
among adolescents was much less when fried potatoes were not included. The
percentage meeting recommendations for vegetable subtypes was lowest for dark green
vegetables, orange vegetables, and legumes but higher for starchy and other vegetables.
The results of the present study support the findings of Kimmons et al. (2009).
Krebs-Smith et al. (1996) found that young children of both sexes consumed
about one serving of fruit per day, although this tapered off to about a half serving for
those in their teenage years. Only one in five children consumed five or more servings of
fruits and vegetables per day. The students in the present study exceeded the fruit and
vegetable consumption observed by Krebs-Smith et al. (1996).
Casagrande et al. (2007) found that approximately 62 percent of adults did not
consume any whole fruit servings, 75 percent did not consume any fruit juice servings,
and approximately 25 percent of participants reported eating no daily vegetable servings.
Eleven percent of participants met USDA guidelines in fruit and vegetables servings.
Krebs-Smith et al. (1996) found that French-fried potatoes alone constituted about 23
percent of all vegetables consumed. Davis et al. (2009) reported almost 60 percent of the
students in their intervention group reported eating at least one fruit per day, compared
with only approximately 41 percent for the comparison school students. Results of the
present study indicated the high school students in Carothersvilee Junior/Senior High
School eat more fruits and vegetables than reported by Davis et al. (2009).
Among the eighth grade and tenth grade student who participated in the dietary
recall interviews on the Mississippi Fresh Fruit and Vegetable Pilot Program (CDC,

73
2006), student consumption of fruit in school and overall increased significantly by 0.34
and 0.61 servings per day, respectively. The results of the present study indicated an
increase of 0.4 cups of fruits and vegetables per day after completion of the five-day
curriculum, similar to that seen by the Mississippi students.
Choose Fruits or Vegetables as a Snack
At the pretest, there was no difference between the control group and the
treatment group in response to the question “how often would you choose fruit as a snack
instead of chips or candy?,” with the majority of the students responding “I would
sometimes,” and approximately one-quarter of the students indicated they would choose
fruit as a snack “most of the time.” There was no change, from pretest to posttest, in the
percent of students who reported they would choose fruit as a snack instead of chips or
candy in either the treatment or the control groups.
At the pretest, there was no difference between the control group and the
treatment group in response to the question “How often would you choose vegetables as a
snack instead of chips or candy?” The majority of the students answered “I would
sometime.” There was no change, from pretest to posttest, in the percent of students who
reported they would choose fruit as a snack instead of chips or candy in either the
treatment or control groups.
No comparative studies that examined the selection of fruits or vegetables in place
of candy or chips were identified in the literature. Future researchers are encouraged to
include this question as they assess the role of fruits and vegetables in the diets of
adolescents.

74
Select New Fruit or Vegetable if Offered
On the pretest, 41 percent of the students in the treatment group, and 37 percent of
the students in the control group, reported they would try a new fruit if it was served with
the school lunch. On the posttest, the percent who responded “yes” from the treatment
group increased significantly from 41 percent to 68 percent, while the percent for the
students in the control group remained the same.
On the pretest, the majority of the students in the control group and the treatment
group reported they would “maybe” try a new vegetable if it was served with their lunch.
There was no statistical difference in the distribution at baseline or at posttest.
Similarly, no comparative studies that examined the selection of a new fruit or
vegetable if it was offered with the school lunch were identified in the literature. Future
researchers are encouraged to include this question as they assess the role of fruits and
vegetables in the diets of adolescents, particularly in light of the newly proposed USDA
guidelines for school lunches that, at present (http://www.fns.usda.gov/cnd/), limit
starchy vegetables (e.g., potatoes) and include a greater emphasis on the inclusion of non-
starchy vegetables and fresh fruit.
Tried a New Fruit or Vegetable Lately
On the pretest, 27.3 percent of the treatment group and 15.8 percent of the control
group indicated they had tried a new fruit lately, while on the posttest, only 22.7 percent
of the treatment group, and 15.8 percent of the control group indicated they had tried a
new fruit lately. The results indicated there was no statistical difference.

75
On the pretest, 13.6 percent of the treatment group, and 15.8 percent of the control
group indicated they had tried a new vegetable lately, while on the posttest, the percent of
students that had tried a new vegetable recently had increased to 22.7 percent in the
treatment group, but remained the same in the control group. Results show there was no
statistical difference at pretest or posttest.
Approximately 27 percent of the students in the study by Davis et al. (2009)
reported trying a new fruit, but only five percent reported trying a new vegetable. Davis
et al. (2009) suggests future fresh fruit and vegetable programs could coordinate with
school foodservice so that the National School Lunch Program includes new vegetables
to increase students‟ exposure and preference. Despite not being statistically significant,
results of the present study indicate more students in the treatment (22.7%) had tried a
new vegetable at the post-assessment, providing modest evidence that the curriculum
aided the consumption of vegetables among participants.
Eat School Lunch Fruits and Vegetables
On the pretest, the majority of the students in both the control group and the
treatment groups indicated they ate the fruit that was offered with the school lunch either
“never” or only “1-2 days per week.” On the posttest, the number of students in the
treatment group who indicated they ate the fruit offered with the lunch either “never” or
only “1-2 days per week” increased from 68 percent to 77 percent. There was no
statistical difference between the groups at pretest or posttest.
On the pretest, the majority of the students in both the control and treatment
groups indicated they ate the vegetables that were offered with the school lunch either
76
“never” or only “1-2 days per week.” On the posttest, the number of students in the
treatment group who indicated they ate the vegetables offered with the school lunch
either “never” or only “1-2 days per week” decreased by one student, from 77 percent to
73 percent. Results show there was no statistical difference between groups at the pretest
or posttest.
Perry et al. (1998) conducted a randomized school-based trial to increase fruit and
vegetable consumption among children. Lunchroom observations and 24-hour food
recalls were used to measure food consumption. Results showed there was an increased
lunchtime fruit consumption and combined fruit and vegetable consumption, lunchtime
vegetable consumption among girls, and daily fruit consumption. The results of the
present study do not support the observation of Perry et al. (1998), perhaps because of the
small sample size in the present study.
Pack a Fruit or Vegetable at Lunch
On the pretest, the majority of the students in the treatment group indicated they
packed a fruit with the lunch either every day, 3-4 days per week, or 1-2 days per week.
A similar distribution was seen in the control group. One quarter of the students in the
treatment group and almost half of the students in the control group indicated they never
pack a fruit with their lunch.
The data shows, on the posttest, the majority of the students in the treatment
group indicated they pack a fruit with their lunch every day, 3-4 days per week or 1-2
days per week, as well. A similar distribution was seen in the control group on the
posttest. Twenty-seven percent of the students in the treatment group and 21 percent of
77
the students in the control group indicated they never pack a fruit with their lunch. There
was no statistical difference between the groups at the posttest or the pretest.
On the pretest and posttest, slightly more than half of the students in the treatment
group indicated they pack a vegetable with their lunch every day, 3-4 days per week, or
1-2 days per week. A similar distribution was seen in the control group on the pretest and
the posttest. On the pretest and posttest, 41 percent of the students in the treatment
group, and 32 percent of the students in the control group indicated they never pack a
vegetable with their lunch. There was no statistical difference between the groups at
pretest or posttest.
Hastert & Babey (2009) found that adolescents who typically brought their lunch
to school from home five days per week consumed fast food fewer times and consumed
fewer servings of soda, fried potatoes and high-sugar foods, and more fruit and
vegetables compared with adolescents who never brought their lunch to school. Students
who typically brought their lunch to school between 1 and 4 days per week also
consumed fast food significantly fewer times and consumed fewer daily servings of soda
and more daily servings of fruit and vegetables compared with students who never
brought their lunch to school. Results of the present study do support the results of
Hastert & Babey (2009), but it should be noted that the present study did not assess fast
food consumption or the consumption of soda and French fries.
Summary
The results of this study demonstrate a statistically significant increase in
knowledge about fruits and vegetables at the end of the five-day intervention, with a

78
retention of the knowledge in the treatment group two months after the intervention. The
results do not support a statistically significant relationship between a five-day
intervention and the subjects‟ attitude toward and consumption of fruits and vegetables.
The results of this study leave the researcher with more questions than answers regarding
the relationship between the intervention and the attitudes toward and consumption of
fruits and vegetables. This researcher suggests that the intervention might be too late to
help change behaviors in high school students, and therefore should be implemented in
elementary schools. At a minimum, the intervention should be implemented among a
larger sample using more than ten knowledge questions.

79
CHAPTER 6
CONCLUSION, LMIITATIONS AND RECOMMENDATIONS
The purpose of this quasi-experimental study was to determine the impact of five
50-minute nutrition lessons and cooking demonstrations/labs developed by this
researcher on high school students‟ knowledge, attitude, and food consumption behavior
of fruits and vegetables. This chapter will summarize the results of the study, state the
limitations of the study, and provide recommendations for future research.
Conclusion
Youth Behavior Risk Factor Surveillance System data (YRBSS) indicate
teenagers do not consume the recommended number of servings of fruits and vegetables
(CDC, 2010b). Establishing healthy eating habits at a young age can influence habits for
a lifetime. Thus, identifying ways to encourage the consumption of fruits and vegetables
by teenagers was warranted.
Results of this study indicated a five-day nutrition education unit that emphasized
basic knowledge and hands-on preparation and consumption of various fruits and
vegetables was successful in improving students‟ knowledge of fruits and vegetables.
Unfortunately, in this small group of subjects (n=22), the curriculum demonstrated
80
limited success in statistically influencing students‟ attitudes and consumption behaviors,
both upon completion of the unit and two months later. Increasing the sample size may
have resulted in enough subjects to increase the power to detect statistical differences,
both between groups (control and treatment) and within the treatment group. Researchers
are encouraged to continue to identify acceptable ways to increase students‟ consumption
of fruits and vegetables.
Limitations
The results of this study were limited by the following factors that constrain the
generalizability and utility of the findings:
1. A small, homogenous sample size (19 in the control group and 22 in the
experimental group) was used;
2. A convenience sample comprised of one foods class (experimental) and
one family relations class (control group), rather than a random sample,
was used;
3. The results were measured over a short period of time, perhaps not
allowing adequate time for behavior change to occur;
4. No other external factors that could influence a student‟s fruit and
vegetable intake (e.g., type of fruits and vegetables served in the cafeteria
during the intervention week; weather; income) were measured;
5. The fifty-minute time period limited the laboratory experiences for the
students, thus limiting the variety of fruits and vegetables they were able
to try; and

81
6. Budgetary constraints, time of year when the curriculum was implemented
(January), and higher prices in this small, rural community limited the
quantity of fruits and vegetables that were offered to the students.
Recommendations for Future Research
The researcher makes the following recommendations:
1) The curriculum should be re-tested with:
a) a larger population;
b) a younger population (e.g., middle school students rather than high school
students); and
c) a more diverse population (e.g., rural vs. urban, race/ethnicity)
2) The curriculum should be enhanced to include:
a) additional hands-on recipes appropriate for middle-school students, especially
those that emphasize fruits and vegetables not commonly consumed; and
b) a greater emphasis on the number of servings for fruits and vegetables needed
daily based on the Food Guide Pyramid.
3) The instruments used to assess knowledge, attitudes, and behavior needs to be re-
examined to:
a) increase the reliability of the exam;
b) measure behavioral intent of both students and parents;
c) reduce the options in an effort to make the statistical analysis less complex;
d) ensure the questions are adequately emphasized in the curriculum; and
e) include more nutrition knowledge questions.

82
REFERENCES
Appel, L.J., Moore, T.J., Obarzanek, E., Vollmer, W.M., Svetkey, L.P., Sacks, F.M.,
Bray, G.A., Vogt, T.M., Cutler, J.A., Windhauser, M.M., Lin, P., & Karanja, N.
(1997). A clinical trial of the effects of dietary patterns on blood pressure. The
New England Journal of Medicine, 336(16), 1117–24.
Berg, M.C., Jonsson, I., Conner, M.T., & Lissner, L. (2002). Relation between breakfast
food choices and knowledge of dietary fat and fiber among Swedish
schoolchildren. Society for Adolescent Medicine, 31(2), 199-207.
Bowen, D.J. & Beresford, S.A. (2002). Dietary interventions to prevent disease. Annual
Rev Public Health. 23:255-286.
Caine-Bish, N.L., & Scheule, B. (2009). Gender differences in food preferences of
school-aged children and adolescents. Journal of School Health, 79(11), 532-540.
Casagrande, S.S., Wang, Y., Anderson, C., & Gary, T.L. (2007). Have Americans
increased their fruit and vegetable intake? The trends between 1988 and 2002.
American Journal of Preventive Medicine, 32(4). doi:
10.1016/j.amepre.2006.12.002
Centers for Disease Control and Prevention. (2006). Evaluation of fruit and vegetable
distribution program-Mississippi, 2004-05 school year. Journal of American
Medical Association, 296(15), 1833-1834. doi: 10.1001/jama.296.15.1833
Centers for Disease Control and Prevention. (2009, June 5). How to use fruit and
vegetables to help manage your weight. Retrieved from
http://www.cdc.gov/healthyweight/healthy_eating/fruits_vegetables.html
Centers for Disease Control and Prevention. (2010b). Youth Online: High School YRBS.
Retrieved from
http://apps.nccd.cdc.gov/youthonline/App/Results.aspx?TT=&OUT=&SID=HS&
QID=QNFRVG&LID=&YID=&LID2=&YID2=&COL=&ROW1=&ROW2=&H
T=&LCT=&FS=&FR=&FG=&FSL=&FRL=&FGL=&PV=&TST=&C1=&C2=
&QP=G&DP=&VA=CI&CS=Y&SYID=&EYID=&SC=&SO=
Chainani-Wu, N., Epstein, J., & Touger-Decker, R. (2011). Diet and prevention of oral
cancer: strategies for clinical practice. J Am Dent Assoc., 142(2), 166-169.
Cullen, K.W., Baranowski, T., Baranowski, J., Hebert, D., & de Mor, C. (1999). Pilot
study of the validity and reliability of brief fruit, juice and vegetable screeners
among inner city African-American boys and 17 to 20 year old adults. Journal of
the American College of Nutrition, 18(5), 442-450.

83
Davis, E.M., Cullen, K.W., Watson, K.B., Konarick, M., & Radcliffe, J. (2009). A fresh
fruit and vegetable program improves high school students‟ consumption of fresh
produce. Journal of the American Dietetic Association, 109, 1227-1231. doi:
10.1016/j.jada.2009.04.017
Dennison, B.A., Rockwell, H.L., & Baker, S.L. (1998). Fruit and vegetable intake in
young children. Journal of the American College of Nutrition, 17(4), 371-378.
Department of Education. (2010). Standards- Indiana Standards and Resources-
Nutrition and Wellness, Family and Consumer Sciences. Retrieved September
2nd
, 2010 from
http://dc.doe.in.gov/Standards/AcademicStandards/StandardSearch.aspx
Department of Foods and Nutrition (May 2003). Nutrition for older adults‟ health:
Fruits and vegetables introduction. Noah Wellness. Athens, GA: UGA, the
Northeast Georgia Area Agency on Aging and USDA.
Department of Health and Human Services Centers for Disease control and Prevention.
(2007). YRBSS 2007 National youth risk behavior survey overview. Retrieved
from http://www.cdc.gov/yrbs
Department of Health and Human Services Centers for Disease Control and Prevention.
Fruits and veggies matter: Fruit and vegetable benefits: Color guide. Retrieved
from http://www.fruitsandveggiesmatter.gov/benefits/nutrient_guide.html
Department of Health and Human Services Centers for Disease Control and Prevention.
(2010). Fruits and veggies matter: Fruit and vegetable benefits. Retrieved from
http://www.fruitsandveggiesmatter.gov/benefits/index.html
DeVault, N., Kennedy, T., Hermann, J., Mwavita, M., Rask, P., & Jaworsky, A. (2009).
It‟s all about kids: preventing overweight in elementary school children in Tulsa,
OK. Journal of the American Dietetic Association, 109(4), 680-687. Doi:
10.1016/j.jada.2008.12.021
DiSogra, L., & Glanz, K. (2000). The 5 a day virtual classroom: An on-line strategy to
promote healthful eating. Journal of the American Dietetic Association, 100(3),
349-352.
Ehrens, K., & Weber, J.A. (2009). Making the healthful choice the easy choice for
students. Journal of the American Dietetic Association, 109(8), 1343-1345. doi:
10.1016/j.jada.2009.06.381
Fitzgerald, N., & Spaccarotella, K. (2009). Barriers to a Healthy Lifestyle: From
Individuals to Public Policy-An Ecological Perspective. Journal of Extension,
47(1), 1-8.

84
Food and agriculture of the United Nations. (2003, October). Increasing fruit and
vegetable consumption becomes a global priority. Retrieved from
http://www.fao.org/english/newsroom/focu/2003/fruitveg1.htm
Fung, T.T., Hu, F.B., Wu, K., Chiuve, S.E., Fuchs, C.S., & Giovannucci, E. (2010). The
Mediterranean and Dietary Approaches to Stop Hypertension (DASH) diets and
colorectal cancer. Am J Clin Nutr., 92(6), 1429-35.
Gentile, D.A., Welk, G., Eisenmann, J.C., Reimer, R.A., Walsh, D.A., Russell, D.W.,
Callahan, R., Walsh, M., Strickland, S., Fritz, K. (2009). Evaluation of a multiple
ecological level child obesity prevention program: Switch® what you do, view,
and chew. BMC Medicine, 7(49). doi: 10.1186/1741-7015-7-49
Gower, J.R., Moyer-Mileur, L.J., Wilkinson, R.D., Slater, H., & Jordan, K.C. (2010).
Validity and reliability of a nutrition knowledge survey for assessment in
elementary schoolchildren. Journal of the American Dietetic Association, 110(3),
452-456. Doi: 10.1016/j.jada.2009.11.017
Harvard School of Public Health. (2010). Vegetables and Fruits: Get Plenty Every Day-
What Should You Eat?- The Nutrition Source. Retrieved from
http://www.hsph.harvard.edu/nutritionsource/what-should-you-eat/vegetables-
full-story/index.html
Hastert, T.A., & Babey, S.H. (2009). School lunch and adolescent dietary behavior.
Preventing Chronic Disease, 6(4). Retrieved from
http://www.cdc.gov/pcd/issues/2009/oct/08_0182.htm
He, F.J., Nowson, C.A., Lucas, M. & MacGregor, G.A. (2007). Increased consumption of
fruit and vegetables is related to a reduced risk of coronary heart disease: meta-
analysis of cohort studies. Journal of Human Hypertension, 21, 717–728.
doi:10.1038/sj.jhh.1002212
He, F.J., Nowson, C.A., & MacGregor, G.A. (2006). Fruit and vegetable consumption
and stroke: meta-analysis of cohort studies. Lancet, 367:320–26.
Hendricks, C., Murdaugh, C. & Pender, N. (2006). The Adolescent Lifestyle Profile:
development and psychometric characteristics. Journal of the National Black
Nurses Association, 17(2):1-5.
Heim, S., Stang, J., & Ireland, M. (2009). A garden pilot project enhances fruit and
vegetable consumption among children. Journal of the American Dietetic
Association, 109, 1220-1226. doi: 10.1016/j.jada.2009.04.009
Hill, L., Casswell, S., Maskill, C., Jones, S., Wyllie, A. (1998). Fruit and vegetables as
adolescent food choices in New Zealand. Health Promotion International, 13(1),
55-65.

85
Hung, H.C., Joshipura, K.J., & Jiang, R. (2004). Fruit and vegetable intake and risk of
major chronic disease. J Natl Cancer Inst. 96:1577–84.
Iowa State University Extension. (2000, July). The health value of fruits and vegetables.
Retieved from http://www.extension.iastate.edu/publications/pm1855.pdf
Jan, S., Bellman, C., Barone, J., Jessen, L., & Arnold, M. (2009). Shape it up: A school-
based education program to promote healthy eating and exercise developed by a
health plan in collaboration with a cold of pharmacy. Journal of Managed Care
Pharmacy, 15(5), 403-413. Retrieved from www.amcp.org
Josphipura, K.J., Hu, F.B., Anson, J.E., Stampfer, M.J., Rimm, E.B., Speizer, F.E.,
Colditz, G., Ascherio, A., Rosner, B., Spiegelman, D., & Willett, W.C. (2001).
The effect of fruit and vegetable intake on risk for coronary heart disease. Annals
of Internal Medicine, 3(12), 1106-1114.
Kimmons, J., Gillespie, C, Seymour, J., Serdula, M., & Blanck, H.M. (2009). Fruit and
Vegetable Intake Among Adolescents and Adults in the United States:
Percentage Meeting Individualized Recommendations. Medscape J
Med.,11(1):26. Retrieved online at
http://www.medscape.com/viewarticle/586492_2.
Krebs-Smith, S.M., Cook, A., Subar, A.F., Cleveland, L., Friday, J., & Kahle, L. (1996).
Fruit and vegetable intakes of children and adolescents in the United States. Arch
Pediatr Adolesc Med, 150, 81-86. Retrieved from www.archpediatrics.com
Kubik, M.Y., Lytle, L.A., Hannan, P.J., Perry, C.L., Story, M. (2003). The association of
the school food environment with dietary behaviors of young adolescents.
American Journal of Public Health, 93(7), 1168-1173.
Largen, V.L., & Bence, D.L. (2000). Fruits. Guide to good food (pp. 323-338). Tinley
Park, Illinois: The Goodheart-Willcox Company, Inc.
Largen, V.L., & Bence, D.L. (2000). Vegetables. Guide to good food (pp.339-350).
Tinley Park, Illinois: The Goodheart-Willcox Company, Inc.
Lin, B.H., Reed, J., & Lucier, G. (2004, October). U.S. fruit and vegetable consumption-
who, what, where, and how much. Agriculture Information Bulletin, 792(2).
Mao,J., Xu, L.W., Qu, X.P., Yang, Q.F., Hu, H.Q. & Xu, D.M. (2010). Research on the
behavior of fruit and vegetable intake in adolescents with Transtheoretical Model,
Chinese Journal of Preventive Medicine, 44(5): 444-7.
86
MyPyramid.gov, United States Department of Agriculture. (2011, February 22). Food
groups- fruits. Why is it important to eat fruit? Retrieved from MyPyramid.gov
website: http://www.mypyramid.gov/pyramid/fruits_why_print.html
MyPyramid.gov, United States Department of Agriculture. (2011, February 22). Food
groups- vegetables. Why is it important to eat vegetables? Retrieved from
MyPyramid.gov website:
http://www.mypyramid.gov/pyramid/vegetables_why_print.html
Nanney, M. S., Haire-Joshu, D., Elliot, M., Hessler, K., & Brownson, R. C. (2005).
Evaluating changeability to improve fruit and vegetable intake among school aged
children. Nutrition Journal, 4(34). doi: 10.1186/1475-2891-4-34
National Association of State Administrators for Family and Consumer Sciences
Education. (2008). National Standards for Family and Consumer Sciences
Education. Retrieved September 8th
, 2010 from American Association of Family
and Consumer Sciences website:
http://www.doe.in.gov/octe/facs/NASAFACS/sc_nutrition.html
Noia, J.D., & Contento, I.R. (2009). Use of a brief food frequency questionnaire for
estimating daily number of servings of fruits and vegetables in a minority
adolescent population. Journal of the American Dietetic Association, 109(10),
1785-1789.
Perry, C.L., Bishop, D.B, Taylor, G., Murray, D.M, Mays, R.W., Dudovitz, B.S., Smyth,
M., & Story, M. (1998). Changing fruit and vegetable consumption among
children: The 5-a-day power plus program in St. Paul, Minnesota. American
Journal of Public Health, 88(4), 603-609.
Pirouznia, M. (2001). The association between nutrition knowledge and eating behavior
in male and female adolescents in the U.S. International Journal of Food
Sciences and Nutrition, 52, 127-132. Doi: 10.1080/09637480020027000
Pobocik, R.S., Haar, C.M., Dawson, E.E., Coleman, P., & Bakies, K. (2009). Curriculum
for junior high: Dairy food consumption self-efficacy. Journal of Family and
Consumer Sciences, 101(4), 20-26.
Pomerleau, J., Lock, K., Knai, C, & McKee, M. (2005). Interventions designed to
increase adult fruit and vegetable intake can be effective: a systematic review of
the literature. J Nutr. 135:2486-2495.
Produce for Better Health Foundation. (2007). Fruits and veggies more matters® Fresh,
frozen, canned, dried and 100% juice: All forms of fruits and vegetables matter!
Retrieved from http://www.fruitsandveggiesmorematters.org/?page_id=457

87
Produce for Better Health Foundation. (2007). Fruits and veggies more matters® Key
nutrients in fruits and vegetables. Retrieved from
http://www.fruitsandveggiesmorematters.org/?page_id=457
Rasmussen, M., Krølner, R., Klepp, K.I., Lytle, L., Brug, J., Bere, E., & Due, P. (2006).
Determinants of fruit and vegetable consumption among children and adolescents:
a review of the literature. Part I: quantitative studies. International Journal of
Behavioral Nutrition and Physical Activity, 3(22). doi: 10.1186/1479-5868-3-22
Rockett, H. RH., & Colditz, G.A., (1997). Assessing diets of children and adolescents.
The American Journal of Clinical Nutrition, 65(suppl), 1116S-1122S. Retrieved
from www.ajcn.org
Scott-Thomas, C. (2010, February 5). Study highlights hurdles to adolescent wholegrain
consumption. Retrieved February 11, 2010, from Food Navigator-USA.com
website: http://www.foodnavigator-usa.com/content/view/print/276723
U.S. Department of Agriculture and U.S. Department of Health and Human Services.
(USDA/DHHS). (2010). Dietary Guidelines for Americans, 2010. 7th Edition,
Washington, DC: U.S. Government Printing Office, Retrieved from:
http://www.cnpp.usda.gov/DGAs2010-PolicyDocument.htm.
World Health Organization. (2010). Promoting fruit and vegetable consumption around
the world. Retrieved January 15, 2010 from
http://www.who.int/dietphysicalactivity/fruit/en/print.html

88
APPENDIX A
Institutional Review Board Documents
A-1 Letter of Approval from BSU IRB
A-2 CITI Certificate of Completion

89
A-1 Letter of Approval from BSU IRB

90
A-2 CITI Certificate of Completion
Social & Behavioral Research - Basic/Refresher Curriculum Completion Report
Printed on 8/16/2010 Learner: Monica Durham Institution: Ball State University Social & Behavioral Research - Basic/Refresher: Choose this group to satisfy CITI training requirements for Investigators and staff involved primarily in Social/Behavioral Research with human subjects. Stage 1. Basic Course Passed on 05/03/10 (Ref # 4374245)
Required Modules Date
Completed Score
Belmont Report and CITI Course Introduction 05/01/10 3/3 (100%)
Students in Research - SBR 05/01/10 10/10 (100%)
History and Ethical Principles - SBR 05/03/10 4/4 (100%)
Defining Research with Human Subjects - SBR 05/03/10 5/5 (100%)
The Regulations and The Social and Behavioral Sciences - SBR
05/03/10 5/5 (100%)
Assessing Risk in Social and Behavioral Sciences - SBR 05/03/10 5/5 (100%)
Informed Consent - SBR 05/03/10 5/5 (100%)
Privacy and Confidentiality - SBR 05/03/10 2/3 (67%)
Research with Prisoners - SBR 05/03/10 4/4 (100%)
Research with Children - SBR 05/03/10 4/4 (100%)
Research in Public Elementary and Secondary Schools - SBR 05/03/10 4/4 (100%)
International Research - SBR 05/03/10 3/3 (100%)
Internet Research - SBR 05/03/10 4/4 (100%)
HIPAA and Human Subjects Research 05/03/10 2/2 (100%)
Workers as Research Subjects-A Vulnerable Population 05/03/10 4/4 (100%)
Conflicts of Interest in Research Involving Human Subjects 05/03/10 2/2 (100%)
Ball State University 05/03/10 no quiz
For this Completion Report to be valid, the learner listed above must be affiliated with a CITI participating institution. Falsified
information and unauthorized use of the CITI course site is unethical, and may be considered scientific misconduct by your
institution.
Paul Braunschweiger Ph.D., Professor, University of Miami; Director Office of Research Education, CITI Course Coordinator

91
APPENDIX B
Fruit and Vegetable Student Survey
B-1 Pre-Test Survey
B-2 Post-Test Survey
B-3 Follow-Up Survey

92
B-1 Pre-Test Survey

93

94
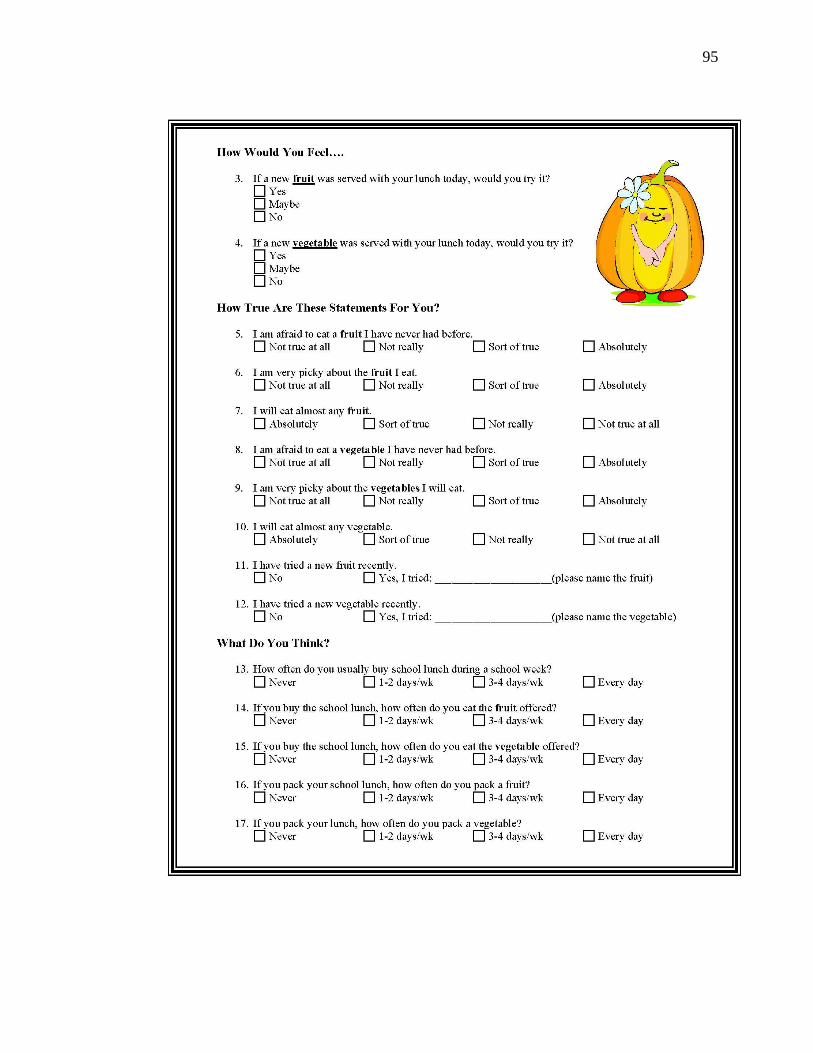
95

96

97

98
B-2 Post-Test Survey

99

100

101

102

103
104
B-3 Follow-Up Survey

105

106

107

108

109

110
APPENDIX C
Lesson Plans
C-1 Lesson 1, Day 1
C-2 Lesson 2, Day 2
C-3 Lesson 3, Day 3
C-4 Lesson 4, Day 4
C-5 Lesson 5, Day 5

111
C-1: Lesson 1

112

113

114

115
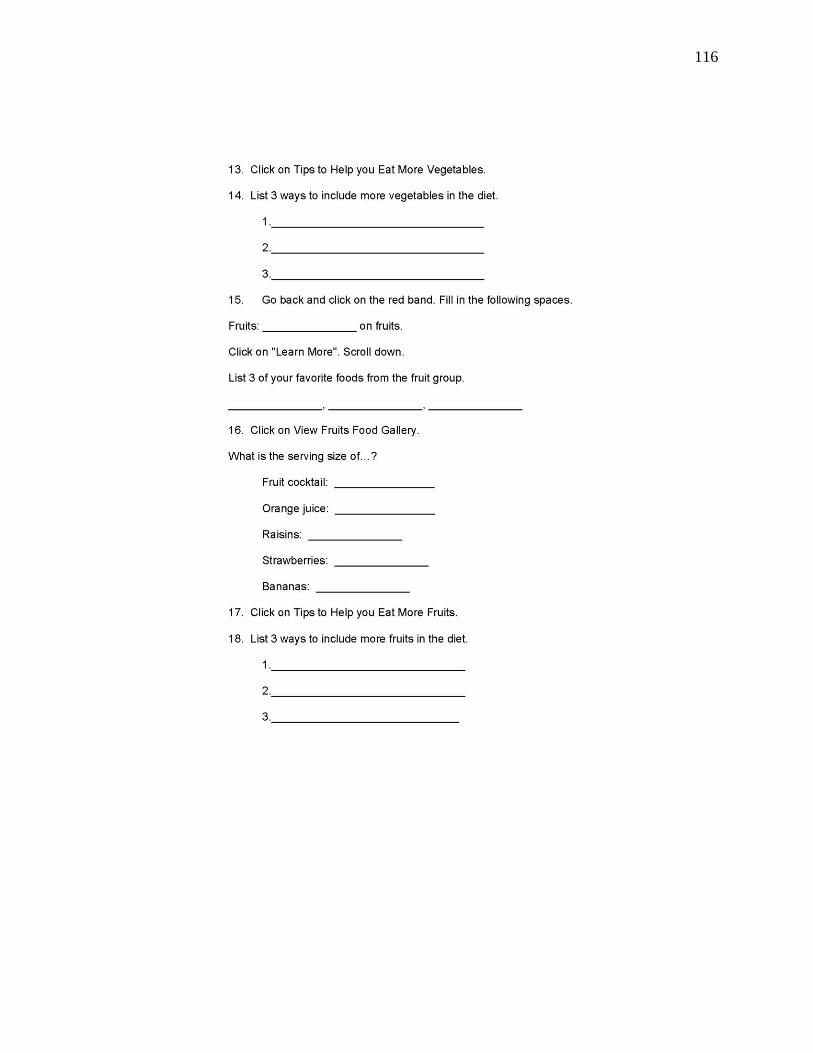
116

117

118
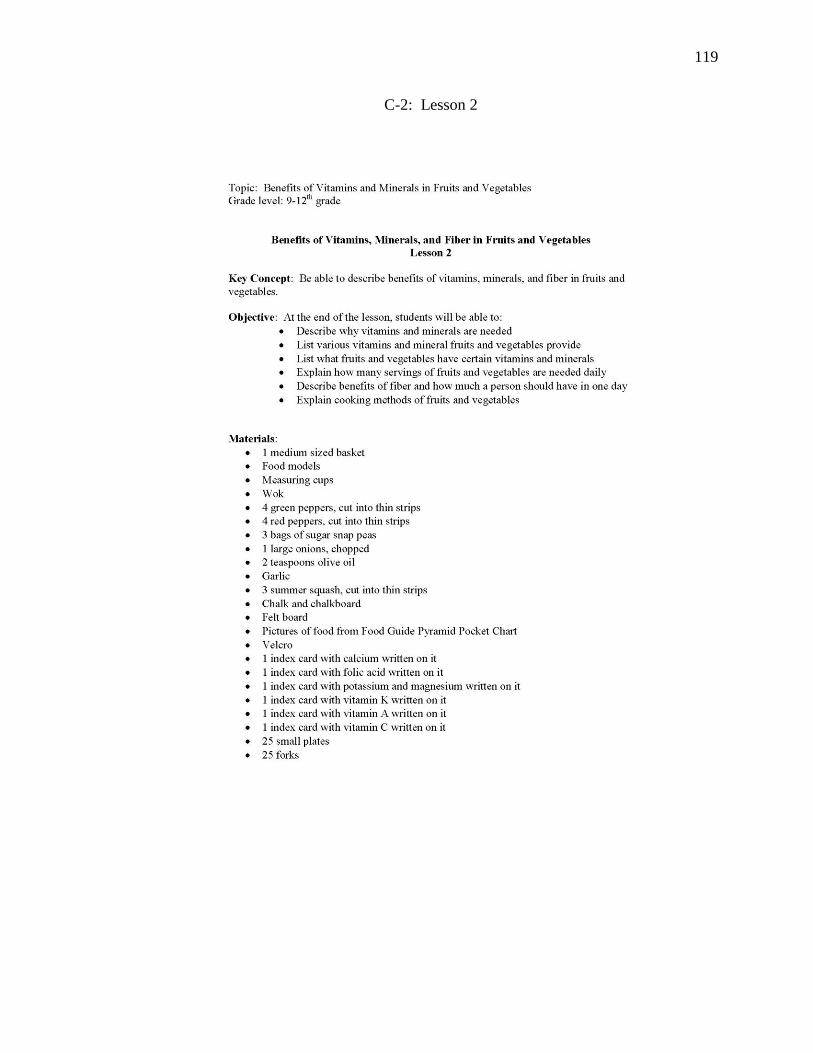
119
C-2: Lesson 2
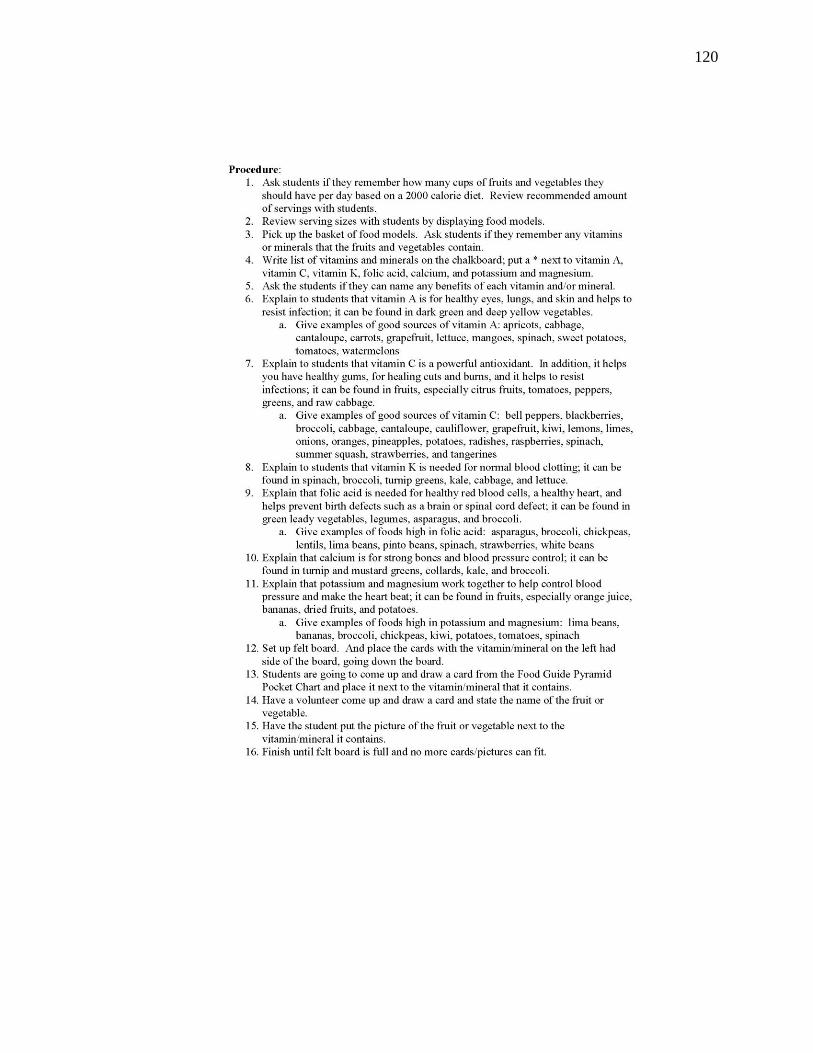
120
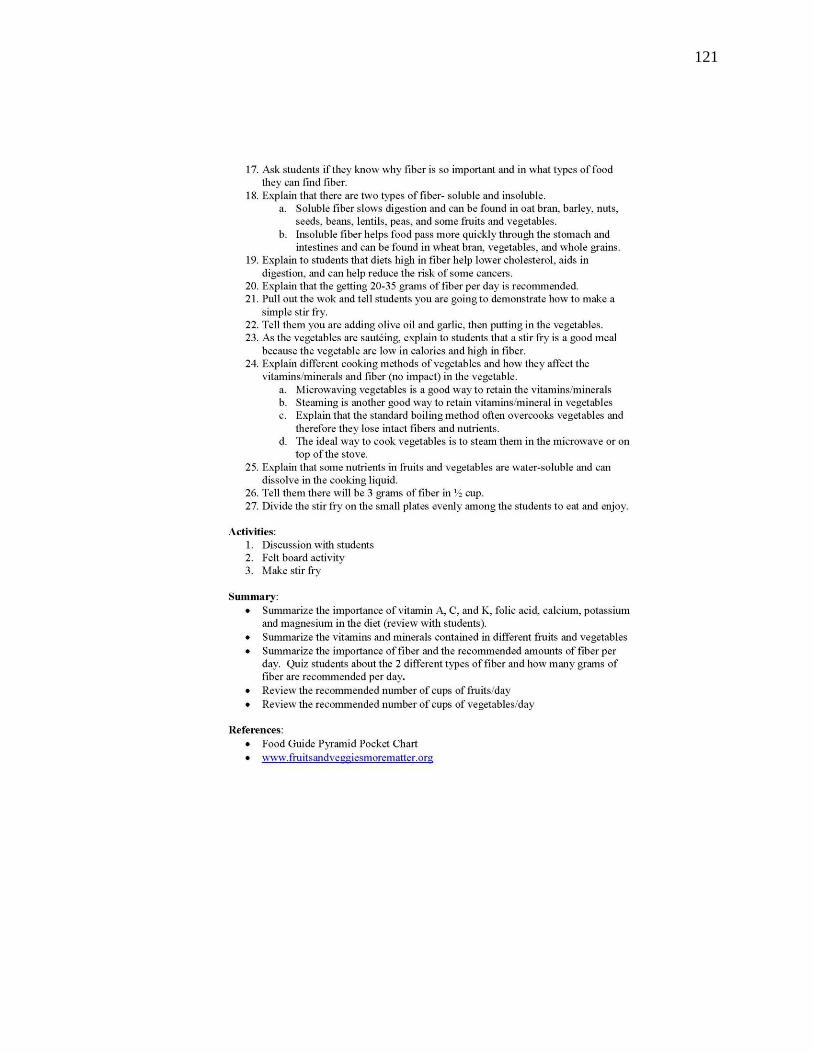
121

122
C-3: Lesson 3

123

124

125
C-4: Lesson 4

126

127

128

129

130

131
C-5: Lesson 5
132

133

134

135
APPENDIX D
Letter of Permission

136
APPENDIX D
Letter of Permission

137
APPENDIX E
Letter of Information
138
APPENDIX E
Letter of Information
January 2011 Dear Parents: Did you know that fewer than one in five high school students eat the recommended number of five servings of fruits and vegetables each day? My name is Monica Durham. I am completing my Masters of Science degree in Dietetics at Ball State University. In an effort to increase fruit and vegetable consumption among high school students, I have developed a series of five “hands-on” nutrition education lesson plans that focus on the health benefits of fruits and vegetables for my thesis project. These lessons have been reviewed by my thesis committee, including the Family and Consumer Sciences Teacher Educator at Ball State University, for their accuracy and their potential impact on high school students. Four of the five lessons include either a food demonstration or a lab where your son or daughter will be making a variety of fun foods using various fruits and vegetables. My mother, Mrs. Durham, will be teaching these five lessons to the students in her Nutrition and Wellness class this semester. To measure the impact of these lessons, Mrs. Durham will be giving a brief pretest to the students in both the Nutrition and Wellness class and in the Adult Roles class. Then, she will teach the lessons in the Nutrition and Wellness class. Upon completion of the five lessons, she will once again give a posttest to both classes to determine if the students who were exposed to the lessons increased their knowledge of, attitude toward, and consumption of fruits and vegetables. After matching the pre-tests and post-tests, Mrs. Durham will remove the sheet with your son or daughter’s name, so when I receive the results, they will be completely anonymous. Mrs. Durham has received permission from the principal to let me use the data from the pre and post-tests for my thesis. This letter is to inform you about this study. The lessons being taught will coincide with what is normally taught in the classroom, but with more depth and additional laboratory experience. If for some reason you do not want your child to participate in the testing, please let Mrs. Durham know and she will provide them with an alternate assignment that they can complete in the principal’s office. There are no foreseeable risks to your child. Your child’s participation is completely voluntary. There is no penalty for not participating. All data collected will be confidential; only group data will be reported in the thesis; all person-identifiable data will be coded with a random alpha-numeric code so that your child cannot be identified by the researcher. If you would like to talk to Mrs. Durham about this study, please contact her at the school. If you would like to talk to me about my thesis, you can reach me at (812) 358-4972 or at [email protected] for questions or concerns. You may also contact my major professor, Dr. Carol Friesen, at (317) 326-2994. For questions about your rights as a research subject, please contact the Director, Office of Research Compliance, Ball State University, Muncie, IN 47306, (765) 285-5070 or at [email protected]. Sincerely, Monica Durham, RD, CD Carol A. Friesen, PhD, RD, CD Graduate Student Associate Professor Ball State University Department of Family and Consumer Sciences Ball State University