impact of centerline no-slip on vortex tube …
TRANSCRIPT

IMPACT OF CENTERLINE NO-SLIP ON VORTEX TUBE PERFROMANCE
by
PARIKSHIT. B. PARDESHI
A thesis submitted to the
Graduate School–New Brunswick
Rutgers, The State University of New Jersey
In partial fulfillment of the requirements
For the degree of
Master of Science
Graduate Program in Mechanical and Aerospace Engineering
Written under the direction of
Dr. Michael. R. Muller
And approved by
New Brunswick, New Jersey
JANUARY, 2016
ii
ABSTRACT OF THE THESIS
IMPACT OF CENTERLINE NO-SLIP ON VORTEX TUBE PERFORMANCE
By PARIKSHIT. B. PARDESHI
Thesis Director:
DR. MICHAEL. R. MULLER
The Ranque-Hilsch vortex tube or simply the vortex tube is a device that separates a
high pressure gas into a low pressure hot stream and a low pressure cold stream
simultaneously without the need for a power supply. Although this device is largely
applied for cooling, especially spot cooling of electronic controls, machining operations
and such, there has been certain interest in exploring its phase separation ability.
This thesis presents results of an innovative method that is aimed towards improving
the phase separation and condensate collection application of the vortex tube. In this
study a centerline no-slip condition is introduced in the vortex tube by suspending
different inserts (rods and tubes) through it. The effects on the cooling capacity of the
vortex tube along with the effects on inlet, cold and hot mass flow rates are observed.
The experimental results indicate that even though the inserts negatively impact the
refrigeration effect at higher cold fractions, for lower cold ratios the method works
satisfactorily. There is a definite increase in cold mass flow rate due to centerline no-slip
with corresponding decrease in hot mass flow rates. The reasons for this phenomenon
are explored in the thesis. It was also concluded that as the outer diameter of the insert
iii
increases, the refrigeration effect decreases. A stainless steel rod of outer diameter 1/8”
turned out to be the optimum insert for the current study.
This study also aims at locating the centerline axial stagnation point by analyzing the
temperature profile along the centerline of the vortex tube.

iv
ACKNOWLEDGEMENT
I would like to take this opportunity to thank my advisor, Dr. Michael R. Muller,
without whom this thesis wouldn‟t have been possible. I am grateful to him for his
continuous guidance, support, patience and encouragement which got me through my
most frustrating moments during the research. I would like to thank my thesis committee
members, Dr. Javier Diez-Garias and Dr. Jerry Shan, for their participation. I would like
to extend my gratitude towards Mr. John Petrowski for his invaluable suggestions and
guidance through my research. I am grateful to Mr. Samuel Ramrajkar who helped me
learn, understand and apply the concepts of electrical engineering. I would like to thank
PhD student Mr. Chris Deppe for his patience and help finding things around the labs.
Further, I would like to mention my dear friends, Ms. Mary Gettings and Ms. Noopur
Gosavi, who had taken up the responsibility of keeping me strong throughout my stay at
Rutgers. Lastly, my special thanks goes to my family back in India who has sacrificed a
lot to fulfill my dream of pursuing masters in USA.

v
TABLE OF CONTENTS
Abstract………………………………………………………………….………..... ii
Acknowledgement….……………………………………………………………… iv
List of Tables…..………………………………………………...………………..... viii
List of Illustrations ……...….......…………………………………………………. ix
Nomenclature………………………………………………………………………. xi
1. Introduction………..………………………………………………………...... 1
1.1 Objectives………………………………….………………………………. 1
1.2 Motivation……………...…………………………………………………... 1
1.3 History and Overview of the VT………..…………………………………. 2
1.4 Structure of the VT……………...…………………………………………. 3
1.4.1 Types of VTs……...………………………………………………….. 3
1.4.2 Cross-section of a VT………..……………………………………….. 3
1. 5 Working of a VT……….………………………………………………….. 5
1.6 Literature Review…..……………………………………………………… 6
1.6.1 Thermo-physical Parameters………………………………………… 7
1.6.2 Geometrical Parameters……………………………………………… 8
1.6.3 Energy Separation……………………………………………………. 8
1.6.4 Stagnation Point……………………………………………………… 10
1.6.5 Phase Separation……………………………………………………... 10
1.6.6 Summary of Literature Review…………………….………………… 12
2. Experimental Setup and Non-Dimensionalization...………………..………. 13
2.1 Setup……………………………………………………………………….. 13

vi
2.2 Non-Dimensionalization of Thermo-physical Parameters…...……...…….. 15
2.2.1 Refrigeration Capacity (Q)…………..………………………………. 15
2.2.2 Mass Flow Rates…………………..…………………………………. 16
2.2.3 Frequency and amplitude of vibration……………....……………….. 16
3. Experimentation, Results and Discussion……………….…………………... 17
3.1 Centerline no-slip condition using fishing lines and wires………....……… 17
3.1.1 Nature of vibrations induced in the wire……………....……………. 18
3.2 Centerline no-slip condition using tubes and rods…………………………. 20
3.3 Error Measurement……...……………….……………………………….... 30
4. Conclusion and Future Work………………………………………………... 31
4.1 Conclusion...…………………………...…………………………………... 31
4.2 Future Work………………………………………………………………... 32
5. Appendix………………………………………………………………………. 33
5.1 Pre-setup……………………………………...……………………………. 33
5.1.1 Accommodations for inserts and leakage prevention………………... 33
5.1.2 Measurement of resistance output of thermistor……………………... 35
5.1.3 Suspension of the thermistor through the tube…………...………….. 36
5.2 Experimental Procedures…………………………………………………... 37
5.2.1 Experiment on vibrations…………………………………………….. 37
5.2.2 Measurement of impact of centerline no-slip condition on VT…….... 38
5.2.3 Experiment to measure the temperature profile along the centerline... 39
5.3 Instrumentation…………………………………………………………….. 40
6. References…………………………………………………………….……….. 44

vii
6.1 References for figures……………………………………………………… 44
6.2 References for literature review……………………………………………. 44

viii
LIST OF TABLES
Table 1. Instrumentation………………………………………………………… 40
ix
LIST OF ILLUSTRATIONS
Figure 1. (a) Counterflow VT and (b) Uniflow VT (NIT Rourkela)………...…... 3
Figure 2. Cross-section of a VT………………………………………………….. 3
Figure 3. Generator (Scienceforums)……………………………………………. 4
Figure 4. Working of a VT (ITW Vortec)……………………………………….. 5
Figure 5. Process Flow Diagram………………………………………………… 13
Figure 6. Experimental setup to measure the impact of centerline no-slip on VT. 14
Figure 7. Vibrational modes of the wire induced by vortices in the VT………… 18
Figure 8. Frequency and amplitude of vibrations in the wire..…………………... 19
Figure 9. Effect on Cooling Efficiency for inserts vs Cold Fraction,
(a) Pi/Pa = 1.34, (b) Pi/Pa = 2.02, (c) Pi/Pa = 2.7……………………...
21
Figure 10. Effect on Cold and Hot mass flow rates for 3/16” rod………………… 23
Figure 11. Location of stagnation point in the VT………………………………... 24
Figure 12. Location of Stagnation Point at 15 Psi (a) Choi and Riu [24] based on
wall temperature (b) Chang-Hyun Sohn et al.[23] based on surface
tracing method (c) Based on Cooling Efficiency…...………………...
25
Figure 13. Effect of centerline no-slip on the position of stagnation point……….. 26
Figure 14. Effect of centerline no-slip condition on the flow structure in the VT... 26
Figure 15. Secondary flow in the VT as shown by Ahlborn et al [18]……………. 27
Figure 16. Change in cold mass flow rate and change in dT vs change in cooling
capacity for 3/16”rod…………………………………………………...
28
Figure 17. Effect of centerline no-slip condition on the inlet mass ratio at various
inlet pressure ratios, (a) Cf = 0.3, (b) Cf = 0.5, (c) Cf = 0.7…………...
29
Figure 18. Histogram representing distribution of actual energy conserved around
the ideal energy conservation…………………………………………..
30
Figure 19. Leakage prevention through the hot exhaust valve……………………. 33
Figure 20. Leakage prevention through the air hoses……………………………... 34
Figure 21. Voltage divider circuit to measure resistance output from thermistors.. 35

x
Figure 22. Suspension of thermistor through a SS tube…………………………... 36
Figure 23. Measurement of vibrations induced in the wire……………………….. 37
Figure 24. Setup for measuring centerline temperature profile…………………… 38
Figure 25. Thermistor………………………………………………………………
40
Figure 26. Pressure Gauge…………………………………………………………
40
Figure 27. Vortex Tube…………………………………………………………….
40
Figure 28. Velmex Bislide Linear Stage…………………………………………...
41
Figure 29. Precision Turbine Flow meter with signal conditioner………………… 41
Figure 30. Signal Amplifier………………………………………………………..
42
Figure 31. Stroboscope…………………………………………………………….
42
Figure 32. Pressure Transducer…………………………………………………….
43
Figure 33. Data Acquisition Card………………………………………………….
43
xi
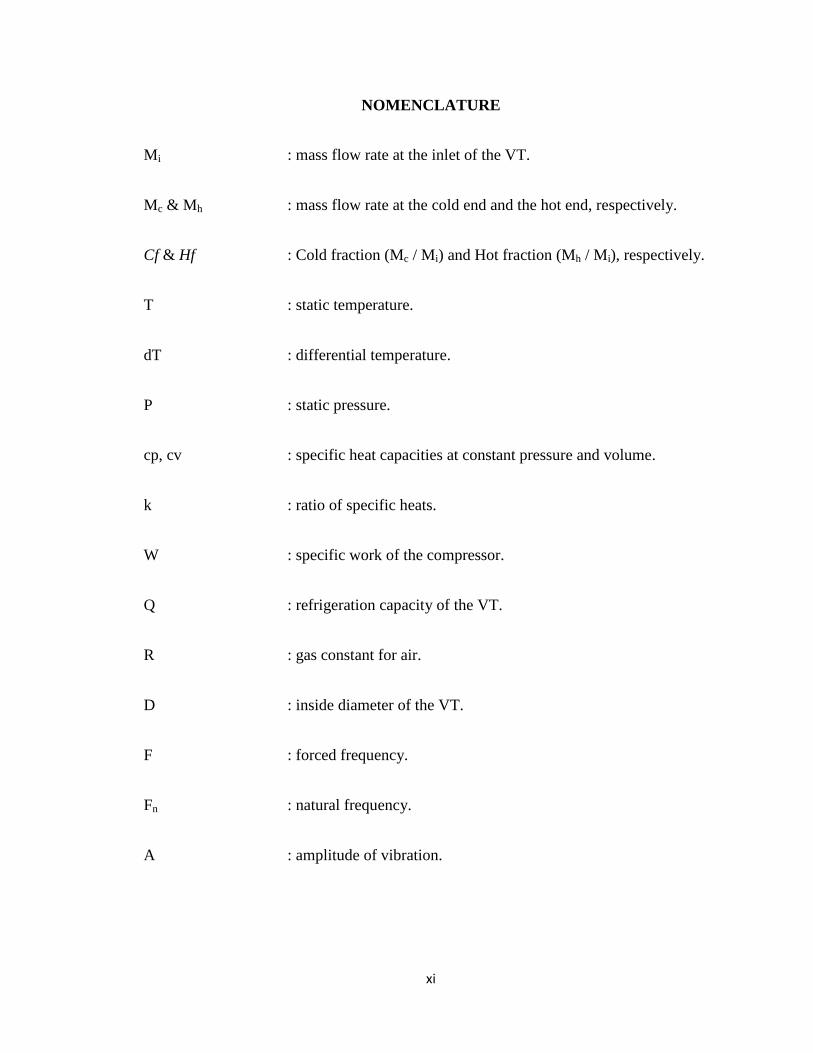
NOMENCLATURE
Mi : mass flow rate at the inlet of the VT.
Mc & Mh : mass flow rate at the cold end and the hot end, respectively.
Cf & Hf : Cold fraction (Mc / Mi) and Hot fraction (Mh / Mi), respectively.
T : static temperature.
dT : differential temperature.
P : static pressure.
cp, cv : specific heat capacities at constant pressure and volume.
k : ratio of specific heats.
W : specific work of the compressor.
Q : refrigeration capacity of the VT.
R : gas constant for air.
D : inside diameter of the VT.
F : forced frequency.
Fn : natural frequency.
A : amplitude of vibration.
1
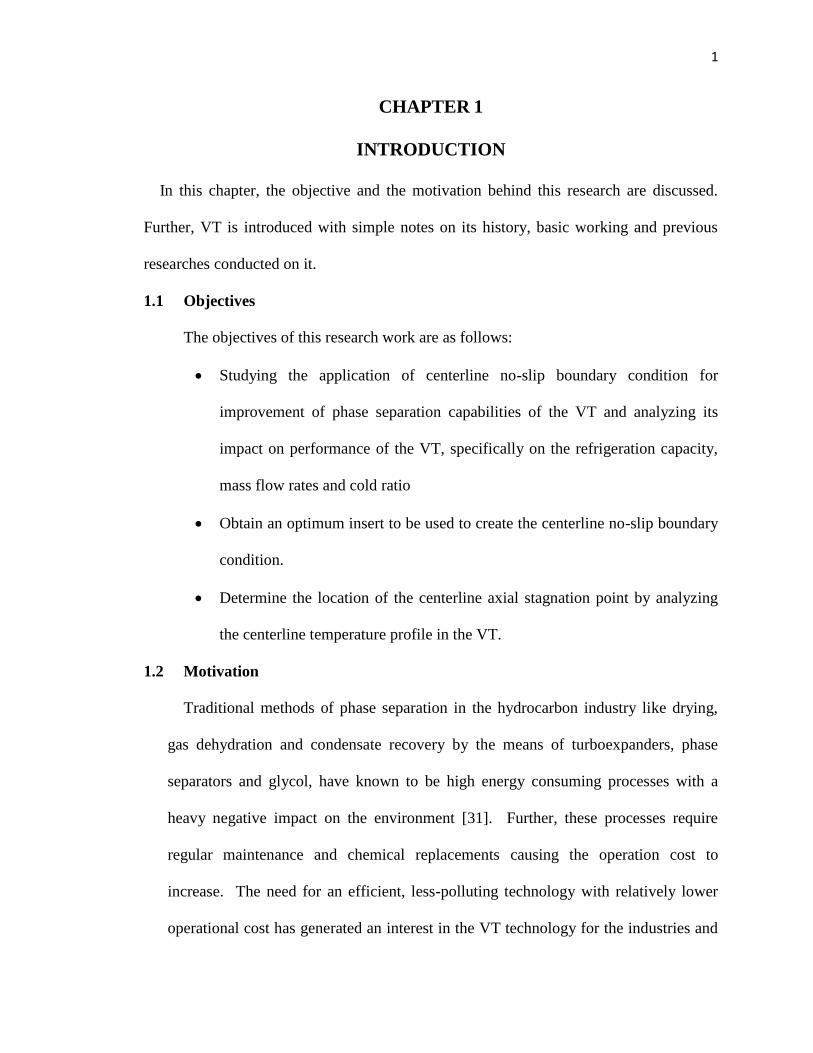
CHAPTER 1
INTRODUCTION
In this chapter, the objective and the motivation behind this research are discussed.
Further, VT is introduced with simple notes on its history, basic working and previous
researches conducted on it.
1.1 Objectives
The objectives of this research work are as follows:
Studying the application of centerline no-slip boundary condition for
improvement of phase separation capabilities of the VT and analyzing its
impact on performance of the VT, specifically on the refrigeration capacity,
mass flow rates and cold ratio
Obtain an optimum insert to be used to create the centerline no-slip boundary
condition.
Determine the location of the centerline axial stagnation point by analyzing
the centerline temperature profile in the VT.
1.2 Motivation
Traditional methods of phase separation in the hydrocarbon industry like drying,
gas dehydration and condensate recovery by the means of turboexpanders, phase
separators and glycol, have known to be high energy consuming processes with a
heavy negative impact on the environment [31]. Further, these processes require
regular maintenance and chemical replacements causing the operation cost to
increase. The need for an efficient, less-polluting technology with relatively lower
operational cost has generated an interest in the VT technology for the industries and

2
researchers alike. This thesis aims at facilitating an innovative way to use a VT for
phase separation and condensate collection and studies its impact on the VT
performance.
Further, researchers like Pourmahmoud et al. [14] showed that most part of the
energy separation occurs before the stagnation point. Consequently, they concluded
that the position of the stagnation point is an important criterion in improving the
energy separation and optimizing the length and other geometrical parameters of the
VT. This thesis also aims at locating the axial stagnation point by analyzing the
temperature profile along the centerline of the VT.
1.3 History and Overview of the VT
The VT was invented in 1930s by a French physicist Georges Ranque [1] and was
further improved by German physicist Rudolf Hilsch [2], hence the name Ranque-
Hilsch. It was first developed for industrial use in 1960s by Vortec [32]. Since then
it has been used in a wide variety of applications like cooling machining operations,
soldered parts, cooling of electronic components etc. The advantages of using a VT
are that it neither requires any energy input, except for the compressor, nor does it
have any moving parts therefore, providing a clean, long-term maintenance-free
operation. Other advantages include low cost, reliability, compactness and working
without refrigerants. One interesting feature of the VT is the varied range of cooling
capacity that can be controlled by supply pressure and a conical exhaust valve at the
hot end.
3
1.4 Structure of the VT
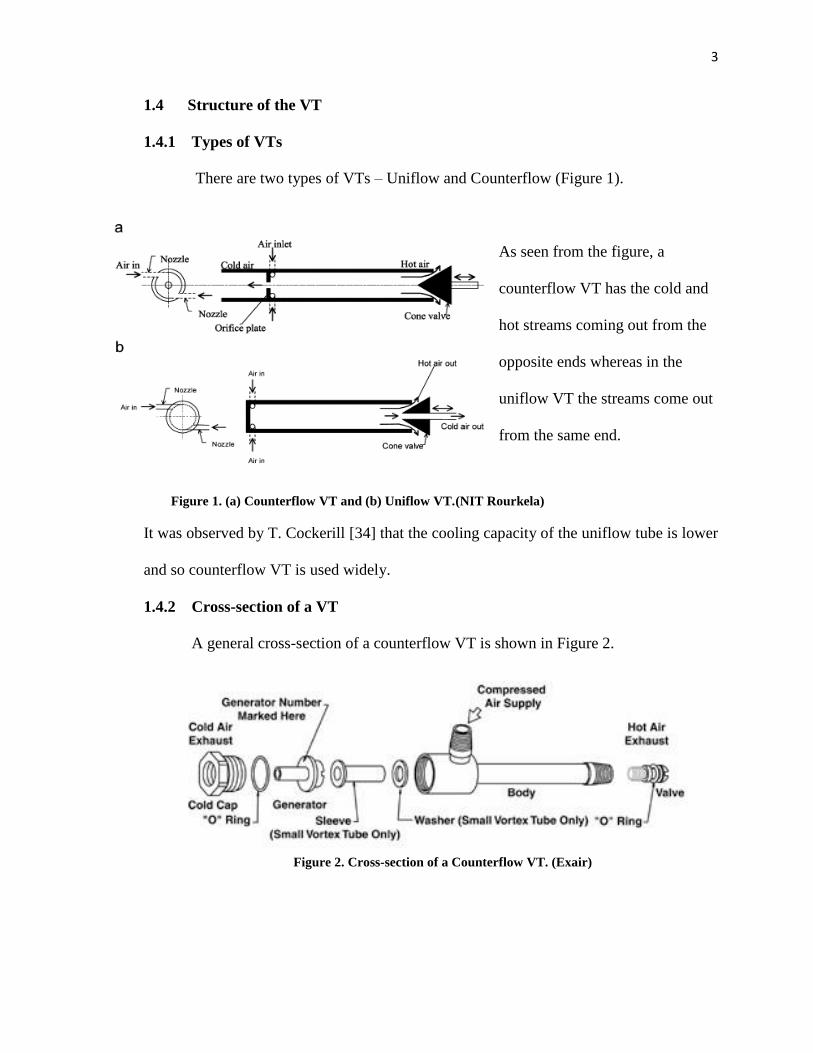
1.4.1 Types of VTs
There are two types of VTs – Uniflow and Counterflow (Figure 1).
As seen from the figure, a
counterflow VT has the cold and
hot streams coming out from the
opposite ends whereas in the
uniflow VT the streams come out
from the same end.
Figure 1. (a) Counterflow VT and (b) Uniflow VT.(NIT Rourkela)
It was observed by T. Cockerill [34] that the cooling capacity of the uniflow tube is lower
and so counterflow VT is used widely.
1.4.2 Cross-section of a VT
A general cross-section of a counterflow VT is shown in Figure 2.
Figure 2. Cross-section of a Counterflow VT. (Exair)

4
As seen from Figure 2, a vortex tube has following main parts –
Generator: It is situated right below the supply pipe and it forces the gas to
enter the body in a smooth tangential
motion in order to form a vortex. It is
interchangeable and it also regulates
the volume of compressed gas so that
flow rate and temperature ranges can
be controlled.
Figure 3. Generator (Scienceforums)
Body: The vortices travel along the body towards the exits.
Hot Exhaust Adjustment Valve: The position of this valve determines the
amount the air to be let through the hot exhaust. It acts as the main
differential temperature controller.
Sleeve: It provides a passage for the cold inner vortex to pass to the cold end
exhaust.
Cold Cap: It holds the generator in place and also acts as the cold end
exhaust.

5
1.5 Working of a VT
This thesis is based on experiments conducted using dry air as it is easily available
and most widely used.
Figure 4. Working of a VT. (ITW Vortec)
Referring to Figure 4, working of the VT can be broken down into following 8 steps:
1- Compressed Air Supply: Compressed air supplied from an external source
enters the VT through the inlet.
2- Generation of vortices: The stationary generator makes the air to enter in a
smooth tangential manner thus creating an outer vortex. At the stagnation
point the air from outer vortex forms a concentric inner vortex which moves
towards the cold exhaust.
3- Heating up of outer vortex: As the outer vortex moves along the length of
the body, it heats up by taking the energy from the inner vortex and due to
friction with the wall.
6
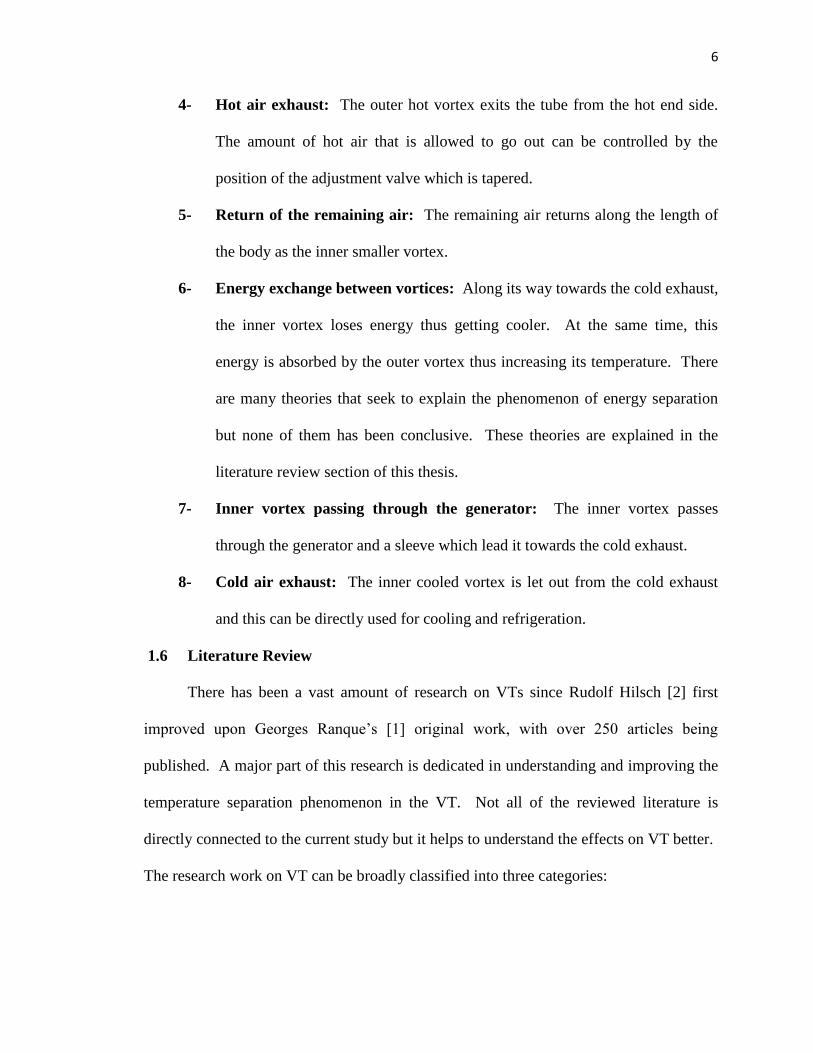
4- Hot air exhaust: The outer hot vortex exits the tube from the hot end side.
The amount of hot air that is allowed to go out can be controlled by the
position of the adjustment valve which is tapered.
5- Return of the remaining air: The remaining air returns along the length of
the body as the inner smaller vortex.
6- Energy exchange between vortices: Along its way towards the cold exhaust,
the inner vortex loses energy thus getting cooler. At the same time, this
energy is absorbed by the outer vortex thus increasing its temperature. There
are many theories that seek to explain the phenomenon of energy separation
but none of them has been conclusive. These theories are explained in the
literature review section of this thesis.
7- Inner vortex passing through the generator: The inner vortex passes
through the generator and a sleeve which lead it towards the cold exhaust.
8- Cold air exhaust: The inner cooled vortex is let out from the cold exhaust
and this can be directly used for cooling and refrigeration.
1.6 Literature Review
There has been a vast amount of research on VTs since Rudolf Hilsch [2] first
improved upon Georges Ranque‟s [1] original work, with over 250 articles being
published. A major part of this research is dedicated in understanding and improving the
temperature separation phenomenon in the VT. Not all of the reviewed literature is
directly connected to the current study but it helps to understand the effects on VT better.
The research work on VT can be broadly classified into three categories:

7
Experimental and theoretical effect of change in thermo-physical parameters like inlet
gas, temperature, pressure, etc.
Experimental and theoretical effect of change in geometrical parameters like length,
generator etc.
Energy models to understand the energy separation phenomenon in the VT.
1.6.1 Thermo-physical Parameters
Many researchers studied the effect of change in thermo-physical parameters on
the VT performance both experimentally and by means of numerical simulation.
Kargaran [3], and Orhan and Muzaffar [8] separately performed experimental studies by
varying the inlet pressure. It was concluded that the cold and hot temperature differences
increase dramatically with increase in the inlet pressure. Rajarshi Kar et al. [7] conducted
experimental studies and Pourmahmoud et al. [4] performed numerical simulations of the
effect of inlet gas temperature. Both researches concluded that increase in the inlet gas
temperature leads to an increase in both hot and cold temperature differences. Further,
Pourmahmoud recommended that since for high inlet temperatures the gas leaving out of
cold exit is too hot for cooling, the hot exit gas can be used for industrialized processes
which might need heating or pre-heating.
There has been a lot of research performed on the effect on VT performance for
various supply fluids. Pourmahmoud et al. [9] used NO2, CO2, O2, N2 and air to study the
effect on the performance of the VT using a CFD model. Their results show that NO2
works the best in terms of both cooling and heating capacities. Initial study on the
separation of mixtures in the VT was performed by Linderstorm-Lang [5]. Marshall [6]
used the Linderstrom-Lang VT to conclude there is a critical inlet Reynolds number for

8
maximum separation by this device. Gas mixtures used in these experiments were CO2 +
air, N2 + O2 etc.
1.6.2 Geometrical Parameters
Many researchers conducted studies on optimization of geometrical parameters in
order to achieve best VT performance. Investigations done by Nimbalkar and Muller
[10] concluded that the effect of cold end orifice diameter is negligible for cold fractions
less than 60%. Pourmahmoud [11] performed CFD simulations to measure the effect of
change in length on the position of the stagnation point and hence the performance of the
VT. Their study concluded that optimum length of the vortex tube depends upon
operating parameters and other geometrical factors such as inlet pressure, flow rate, the
diameter of the vortex tube etc. It further stated that increasing the length to diameter
ratio (L/D) beyond 9.3 has no effect on the performance of the VT. Kirmaci [12] used
the Taguchi methods, a set of statistical methods used to improve quality of manufactured
goods, t1o optimize the number of nozzles of the VT. These experiments were carried
out under different conditions of inlet pressure, nozzle number and fluid type. Wu et al.
[13] designed a new nozzle with equal gradient of Mach number and a new intake flow
passage of nozzles with equal flow velocity to reduce the energy loss due to friction.
This study concluded the new design to be better performing than the current designs of
VT manufacturers.
1.6.3 Energy Separation
Since the time Ranque [1] developed the VT, a lot of theories have been
investigated to understand the phenomenon of energy separation in the VT. Ranque [1]
himself attributed the energy separation to adiabatic expansion in the central region and

9
adiabatic compression in the peripheral region. Hilsch [2] used similar ideas to explain
the energy separation but introduced internal friction between the vortices which caused
the entire fluid to undergo solid body rotation. Further, Xue and Arjomandi [21] also
considered adiabatic expansion as a main factor for temperature separation in the VT.
Shultz-Grunow [15] believed that the energy separation is due to turbulent heat transfer
in the VT. Ahlborn et al. [16] hypothesized that the cooling and heating is linked to the
increase or decrease in the kinetic energy of the fluid. They state that the hot component
entering the VT slows down as it exits through the larger hole and this loss of kinetic
energy leads to gain in the temperature whereas, the inner vortex accelerates through the
small hole on the cold exit thus increasing its kinetic energy and decreasing the
temperature. Kurosaka [17] attributed the energy separation to the fundamental functions
of orderly disturbances and found a relationship between acoustic resonance frequencies
and the forced vortex motion frequency. The study proposed that the energy separation is
due to the damping of the acoustic streaming along the axis of the tube towards the hot
exhaust. Stephan et al. [22] proposed the formation of Görtler vortices on the inside wall
of the VT that drive the fluid motion. Görtler vortex is formed in a boundary layer flow
near a concave wall when the centrifugal action creates a pressure variation (instability)
across the boundary layer. Thus, the energy separation is due to the disturbance motion
of the Görtler vortex. Fulton [24] hypothesized that the energy separation is due to the
formation of free vortices near the wall and forced vortices at the center of the VT.
Many studies were performed to understand the flow structure in the VT. Ahlborn
and Groves [18] made a breakthrough by experimentally observing the presence of
secondary flow in the vortex tube using a pitot tube. It was determined that the return

10
flow at the center of the tube is larger than the cold mass flow exiting the VT. Therefore,
there must be a secondary circulation that moves the fluid from the back flow core to the
outer regions. This was further confirmed by Nimbalkar [10]. Liew et al. [19] measured
velocities inside the VT by means of Laser Doppler Anemometry and concluded the
turbulence to be isotropic in the core of the VT. Saidi and Yazdi [20] applied exergy
destruction model to explain the phenomenon of energy separation. This approach
included losses due to heat transfer and pressure drop.
1.6.4 Stagnation Point
It is well-known that stagnation point plays an important role in energy separation
in the VT. Therefore, many experimental as well as theoretical studies have been
conducted in order to locate the stagnation point. Chang-Hyun et al. [23] performed
surface tracing method by injecting dye on the VT wall and visualizing it. The study
indicated the location of stagnation point based on the abrupt change of trajectory on the
VT wall. It concluded that the stagnation point moves toward the vortex generator with
increase in cold flow ratio and inlet pressure which is same as the results obtained by
Nimbalkar [25]. Choi and Riu [24] stated that stagnation point lies where the outer wall
temperature of the VT is the highest. Further, this theory was confirmed by
Pourmahmoud et al. [14] by using CFD. Although there has been a lot of research on the
stagnation point, its actual location still remains elusive.
1.6.5 Phase separation
Even though there have been a lot of investigations on the ability of VT to
separate gas mixtures, the application of VT for phase separation remains largely
untouched. Saidi and Valipour [26] conducted experiments to check the effect of

11
moisture content on the VT performance. They injected water into the inlet flow and
measured cold and hot flow temperatures. The study concluded that the cold temperature
difference and efficiency decrease by increasing the moisture content of the air.
Khodorkov et al. [27] investigated the application of VT for cleaning, and drying gases
and separating mixtures. Stanescu et al. [28] discussed the potential for increasing the air
moisture removal by recovering wasted pressure energy. Saha et al. [29] discovered that
the number of nozzles does not affect the droplet separation in the VT. Further, it was
concluded that for water vapor, the cold side of the VT becomes oversaturated for cold-
fraction of 10-50%, therefore implying the application of VT for phase separation. Liew
et al. [30] numerically studied the droplet behavior in a VT. The studied showed that
negative radial flow near the inlet imparted radial drag on the droplets thus moving them
towards the axis of the VT. Further, when the centrifugal force overcomes the radial drag
force, the droplets move towards the wall. The study showed that the condensation
occurs in the first few centimeters of the vortex tube on the cold side. It was also noted
that adding a contaminant increases the phase separation efficiency of the VT as it helps
form larger droplets.
Apart from research in labs, various field studies have been performed in Germany
where VT was used as a phase separator. Grönner [31] of RWE Energy reported more
than 5 years of successful operation of the use of VT for gas dehydration. The study
concluded that VT was an economic, efficient and faster option against conventional
dehydration and reduced the negative impact on the environment.

12
1.6.6 Summary of Literature Review
Condensation in the VT occurs near the cold end side. Further, the fluid becomes
oversaturated for cold fractions of 10% - 50%.
There is evident advantage of using VT for drying and gas dehydration processes
in hydrocarbon industry.
The cooling efficiency of VT drops due to the presence of moisture.
Even though a heavy research has been performed to locate the stagnation point, it
still remains elusive.
It can be concluded that there is a need to explore and improve the phase separating
abilities of a VT in order to provide a clean, maintenance free and efficient option,
mainly in hydrocarbon industry. Further, a new approach is needed to understand and
pinpoint the location of stagnation point in the VT

13
CHAPTER 2
EXPERIMENTAL SETUP AND NON-DIMENSIONALIZATION
In Chapter 2, the experimental setup and process flow are explained. Further, non-
dimensionalization of the thermo-physical parameters is explained in detail.
2.1 Setup
Figure 5. Process flow diagram
Referring to Figure 5, compressed dry air is let into the plenum chamber after being
set to the desired value by using a pressure reduction valve. The pressure is measured

14
using a pressure transducer. From the plenum chamber, the air is then directed to the
inlet of the VT where it is split into a hot and a cold stream. These streams then
individually exhaust to the atmosphere. The VT is mounted on a linear stage in order to
move it vertically to measure the temperature profile along the centerline. A metallic
insert (SS tubes and rods) is inserted into the VT (to create centerline no-slip boundary
condition) and held between two fixtures. As seen from the figure, the hot stream had to
be directed downwards because of space constraints between the larger OD of the VT and
the linear stage. Turbine flow meters (with signal amplifiers) and thermistors are
introduced in the inlet, cold and hot lines each to measure the mass flow rates and
temperatures respectively. Electrical signals from the instruments are directed to a data
acquisition system and measured using DasyLab software. The VT used for this study
had L/D = 14.7. Detailed specifications of the instruments are presented in the Appendix
section.
Figure 6. Experimental setup to measure the impact of centerline no-slip on VT

15
2.2 Non-Dimensionalization of Thermo-physical parameters.
In order to ensure the repeatability of the experiments, parameters like temperature,
pressure, mass flow rate, frequency of vibration and length of the vortex tube had to be
non-dimensionalized. Each of the parameters is considered individually as follows.
2.2.1 Refrigeration Capacity (Q)
Throughout this thesis, the term „performance‟ of the VT is synonymous with the
cooling effect. Most of the researchers didn‟t non-dimensionalize differential
temperatures (Ti – Tc, Th – Ti & Th – Tc) or used inlet temperature (Ti) in order to do so.
The problem in using Ti as the base parameter, as correctly noted by S. Nimbalkar [10], is
that if the compressor is located at a remote location, then Ti does not change with inlet
pressure (Pi). Since, the experiments are carried out at different Pis and since the
differential temperatures are functions of Pi, it would be incorrect to use Ti as the base
parameter for non-dimensionalization. On the other hand, if the compressor was located
in-house, using Ti as the base parameter could be justified as it would change with Pi.
Therefore, it was decided to non-dimensionalize refrigeration capacity. Refrigeration
Capacity per unit mass can be defined as,
Q = cp x (Ti – Tc) J / kg……....................................……….1
where cp is the specific heat of air at constant pressure.
Specific work done by the compressor, to compress the air to the required pressure, is as
follows:
{(
)
} J / Kg ……………………...……….2
where k = 1.4, is the ratio of specific heats for air, R = 287 J / kg K, is the gas constant for
air.
16
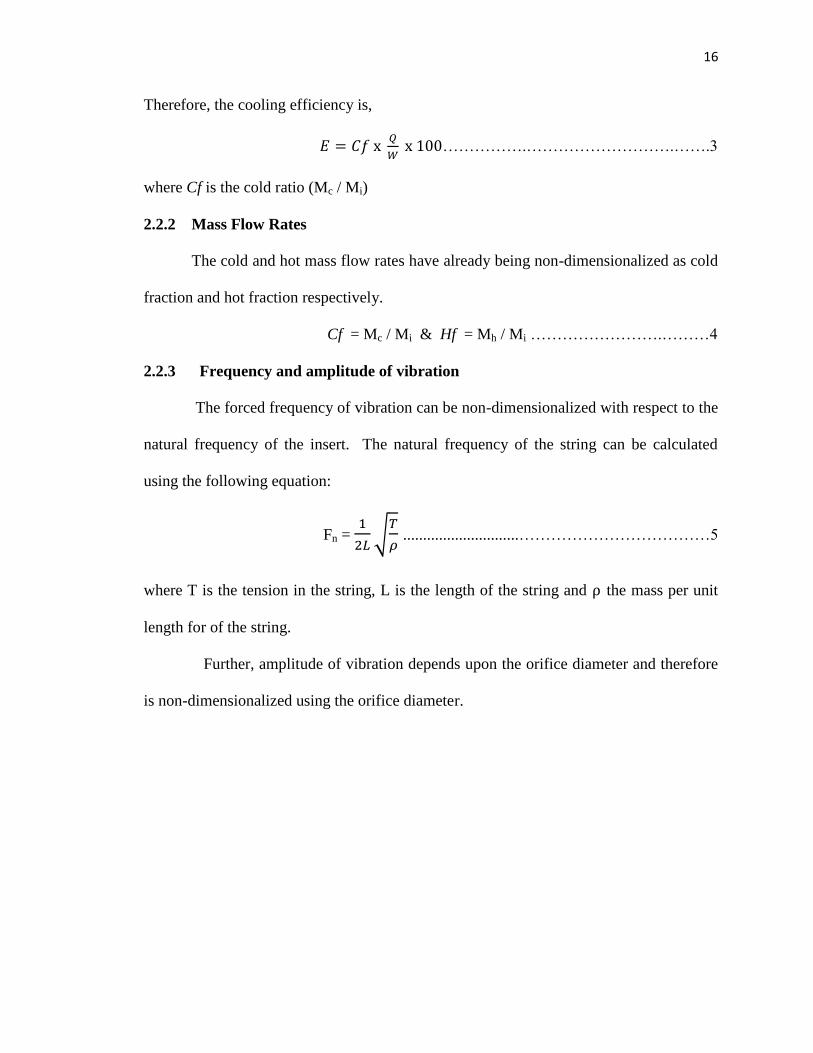
Therefore, the cooling efficiency is,
…………….……………………….…….3
where Cf is the cold ratio (Mc / Mi)
2.2.2 Mass Flow Rates
The cold and hot mass flow rates have already being non-dimensionalized as cold
fraction and hot fraction respectively.
Cf = Mc / Mi & Hf = Mh / Mi …………………….………4
2.2.3 Frequency and amplitude of vibration
The forced frequency of vibration can be non-dimensionalized with respect to the
natural frequency of the insert. The natural frequency of the string can be calculated
using the following equation:
Fn =
√
.............................………………………………5
where T is the tension in the string, L is the length of the string and the mass per unit
length for of the string.
Further, amplitude of vibration depends upon the orifice diameter and therefore
is non-dimensionalized using the orifice diameter.

17
CHAPTER 3
EXPERIMENTATION, RESULTS AND DISCUSSION
This chapter deals with details of the experiments, the presentation of the results
and discussion to obtain suitable conclusions. The detailed experimental procedures are
presented in the Appendix. In order to create a centerline no-slip condition in the VT, an
insert (metallic rods and tubes) is introduced into the VT. This disrupts the fluid
dynamics along the centerline and a boundary layer is created around the insert where the
fluid velocity is zero. It is expected that the liquid will condense and slide down along
the surface of the insert and can be collected outside the VT.
3.1 Centerline no-slip condition using fishing lines and wires.
Before starting the experimentation, it was well understood that the centerline no-
slip condition will affect the fluid dynamics in the VT, thus affecting its performance. It
was decided that in order to keep the disturbance to the minimal, the insert should be as
thin as possible. Therefore, the initial experiments were done using fishing lines and
electrical wire. The fishing lines used were of 15lbs, 20lbs 50lbs and 80lbs strength.
For this experiment the cold and hot side piping was dismantled. The inserts were
suspended in the VT and held between fixtures. A hole was drilled into the hot exhaust
valve, big enough for the insert to pass through it but small enough to prevent heavy air
leakage. The VT was then moved vertically in steps along the linear stage. The supply
pressure was increased in steps to observe the effects on the insert.
It was observed that the turbulence in the VT induced heavy vibrations in the fishing
lines over inlet pressure of 5 Psi, causing those to break. So, it was decided to use
commonly available 24 AWG electrical wires.

18
3.1.1 Nature of vibrations induced in the wire
As noted in Figure 7, the wire was held taut by means of a weight. The VT was
moved along vertically and the changes in the nature of vibrations were observed. The
VT was moved in small steps and the frequencies and amplitudes of vibrations were
measured at each point.
Figure 7. Vibrational modes of the wire induced by vortices in the VT
Using equation 5, the frequency of the wire is calculated as Fn = 21Hz, where L = 30 in
= length of the wire between the fixtures, T = 1.25 lbs = tension in the wire and ρ = 354µ

19
lb/ft = mass per unit length for 24AWG wire. Figure 8 represents the vibrational
frequency and amplitude profiles. Here the amplitude of vibration is non-
dimensionalized with respect to the diameter of the orifice.
Figure 8. Frequency and amplitude of vibrations in the wire.
As can be seen in Figure 7, the vibrations follow a typical wave formation as in a
string and as noted in Figure 8, the observed nature of vibrations can be categorized into
three zones depending upon the position of the VT. For Z < ≈ 0.5L the wire vibrates in
3rd mode at higher frequency but with lower amplitude, for ≈ 0.45L ≤ Z ≤ ≈ 0.5L the
wire goes through a transition from 3rd mode to 4th mode of vibration and vibrates with

20
highest amplitudes and, Z ≥ ≈ 0.55L where the wire vibrates in 4th mode at lowest
frequencies and with lowest amplitudes.
The occurrence of these modes depends upon the position of the VT with respect to
the location of nodes and also the length of the wire (L). As can be seen from the figure,
for Z < 0.5L, two nodes – Node 2 and Node 3 - are inside the VT and the amplitude is
curbed by the inner wall of the generator. As the VT moves closer to Z ≈ 0.5L, Node 2
moves out and therefore, the wire starts vibrating at higher amplitudes. The amplitude
keeps increasing until Z ≥ ≈ 0.55L beyond which the wire starts vibrating in 4th mode.
In the 4th mode it is observed that both frequency and amplitude of vibration are the
lowest. It is speculated that as the nodes move out of the VT the frequency of vibration is
dampened and therefore, it goes on decreasing as Z increases.
It is observed that in order to reduce the vibrations in the string, Z should be kept as
large as possible. Further, in order to increase the natural frequency and reduce the
amplitude, the load on the wire was increased but the wire snapped for W>1.25 lbs.
Another solution would be to hold on to the higher mode by physically pinning the nodes
on the wire so that it vibrates with lower amplitude and frequency.
3.2 Centerline no-slip condition using metal tubes and rods
In order to reduce the effect of vibration it was decided to use Stainless Steel rods
and tubes as those are sturdier. The tubes and rods were of the outer diameters 1/8”,
3/16” and 1/4" each. The performance is not compared with the original factory designed
data because a hole is drilled into the hot exhaust valve, thus compromising the design.
Therefore, a separate „no insertion / without insertion with plugged hole‟ condition was

21
introduced. Figure 9 represents the effect on cooling efficiency by the inserts versus the
cold fractions at different pressure ratios. (WO/I – without insert
and with plugged valve).
Figure 9. Effect on Cooling Efficiency for inserts vs Cold Fraction,
(a) Pi/Pa = 1.34, (b) Pi/Pa = 2.02, (c) Pi/Pa = 2.7
0
2
4
6
8
10
12
0 0.2 0.4 0.6 0.8 1
Co
olin
g Ef
fici
nec
y
Cold Ratio (Cf)
WO/I 1/8" T
1/8" R 3/16" T
3/16" R 1/4" T
1/4" R
Pi/Pa = 2.02
0
2
4
6
8
10
12
0 0.2 0.4 0.6 0.8 1
Co
olin
g Ef
fici
ency
Cold Ratio (Cf)
WO/I 1/8" T
1/8" R 3/16" T
3/16" R 1/4" T
1/4" R
Pi/Pa = 2.7
0
2
4
6
8
10
12
14
0 0.2 0.4 0.6 0.8 1
Co
olin
g Ef
fici
ency
Cold Ratio (Cf)
WO/I 1/8" T
1/8" R 3/16" T
3/16" R 1/4" T
1/4" R
Pi/Pa = 1.34
(a) (b)
(c)

22
From the figure it is observed that smaller the size of the insert lower is the impact on
cooling efficiency. It was expected that the inserts would reduce the temperature
separation in the VT as those would interfere with the fluid dynamics. It can be said that
bigger the insert, higher the interference with the mass flow and hence lower the
temperature separation efficiency.
During the experimentation it was observed that the tubes of sizes 1/8” and 3/16”
vibrated at pressure ratios >2.0 though with very low frequency and amplitude. The
centrifugal forces of the vortices become stronger as the pressure and mass flow rate
increase. Therefore, it is speculated that at higher pressures the turbulence becomes
strong enough to induce vibrations in the inserts.
At higher supply pressure, 3/16” sized inserts give similar performances as 1/8”
inserts. In order to explain this it is hypothesized that as the cold mass flow rate
increases, the diameter of the inner vortex increases. For current sized VT, at inlet
pressure ratio ≥ 2 this diameter becomes bigger than 3/16” and hence the inserts affect
the energy separation to similar extent. Further, the cooling efficiency is highest at cold
fraction of 60% – 70%, which is similar to the results obtained by Nimbalkar [25].

23
The following figure shows the variation in cold and hot end mass flow due to the
introduction of 3/16” insert. The scatter plots of the data at different inlet pressures with
the corresponding trend lines are shown and are compared with the original without-
insert condition.
Figure 10. Effect on the Cold and Hot mass flow rates for 3/16” rod
It is found that at any given inlet pressure the cold mass flow rates increase after the
introduction of inserts. This is evident particularly at lower cold fractions. Further, this
increase in cold mass flow rate diminishes as the cold fraction increases. Similarly, there
is a corresponding change in the hot mass flow rate where it decreases at lower cold
fractions and increases as the cold fraction increases. For conservation of mass, the sum
of cold fraction and hot fraction should be 1 at any given time. It can be observed that
this condition is not always fulfilled. This can be attributed to the fluctuations in the
supply line and error due to the instrumentation
In order to find the reason for these phenomena, the effects of the insert on the flow
structure inside the VT must be understood. Figure 11 shows that the stagnation point is
0
0.1
0.2
0.3
0.4
0.5
0.6
0.7
0.8
0.9
1
00.20.40.60.81
New
Ho
t Fr
acti
on
Original Hot Fraction
WO/I
Pi/Pa = 1.68
Pi/Pa = 2.36
Pi/Pa = 3.040
0.1
0.2
0.3
0.4
0.5
0.6
0.7
0.8
0.9
1
0 0.2 0.4 0.6 0.8 1
New
Co
ld F
ract
ion
Original Cold Fraction
WO/IPi/Pa = 1.68
Pi/Pa = 2.36Pi/Pa = 3.04

24
measured from the center of the inlet nozzle and is non-dimensionalized with respect to
the inner diameter of the VT.
Figure 11. Location of stagnation point in the VT
Figure 12 compares the location of stagnation point at 15 Psi based on the cooling
efficiency or centerline temperature separation method with that found by Choi and Riu
[24] as highest wall temperature and by Chang Hyung Sohn et al. [23] by surface tracing
method. In both of these studies, the location of stagnation point was measured from the
center of the inlet nozzle and non-dimensionalized using inner diameter of the VT.

25
Figure 12. Location of Stagnation Point at 15 Psi (a) Choi and Riu [24] based on wall temperature (b)
Chang-Hyun Sohn et al.[23] based on surface tracing method (c) Based on Cooling Efficiency
In VT stagnation point is the point where the energy separation starts therefore; at that
point the temperature separation or cooling efficiency is zero. From Figure 12, it is
speculated that the stagnation point moves towards the cold exit after the introduction of
inserts.
(a) (b)
(c)

26
Figure 13. Effect of centerline no-slip condition on the position of stagnation point
It is further speculated that the movement of stagnation point towards the cold exit
increases the drag on the mass flowing towards hot exit. As shown in Figure 14, this
mass flow, especially that close to the stagnation point, undergoes further pressure and
mometum drop while overcoming the drag and tends to move towards the nearest low
pressure point i.e. the cold exit.
Figure 14. Effect of centerline no-slip condition on the flow structure in the VT

27
Another probable explanation for the increase in cold mass flow rate can be the
reduction of secondary circulation. Ahlborn [18] and Nimbalkar [25] showed the
presence of secondary flow in the VT where the mass flow moving towards the cold exit
is larger than the mass flow actually coming out of the cold exit. So, the remaining starts
moving back as seen in Figure 15.
Figure 15. Secondary flow in the VT as shown by Ahlborn et al [18].
It is speculated that the insert cuts into the area of this secondary flow and reduces
recirculating mass therefore, leading to higher mass flow towards the cold exit.
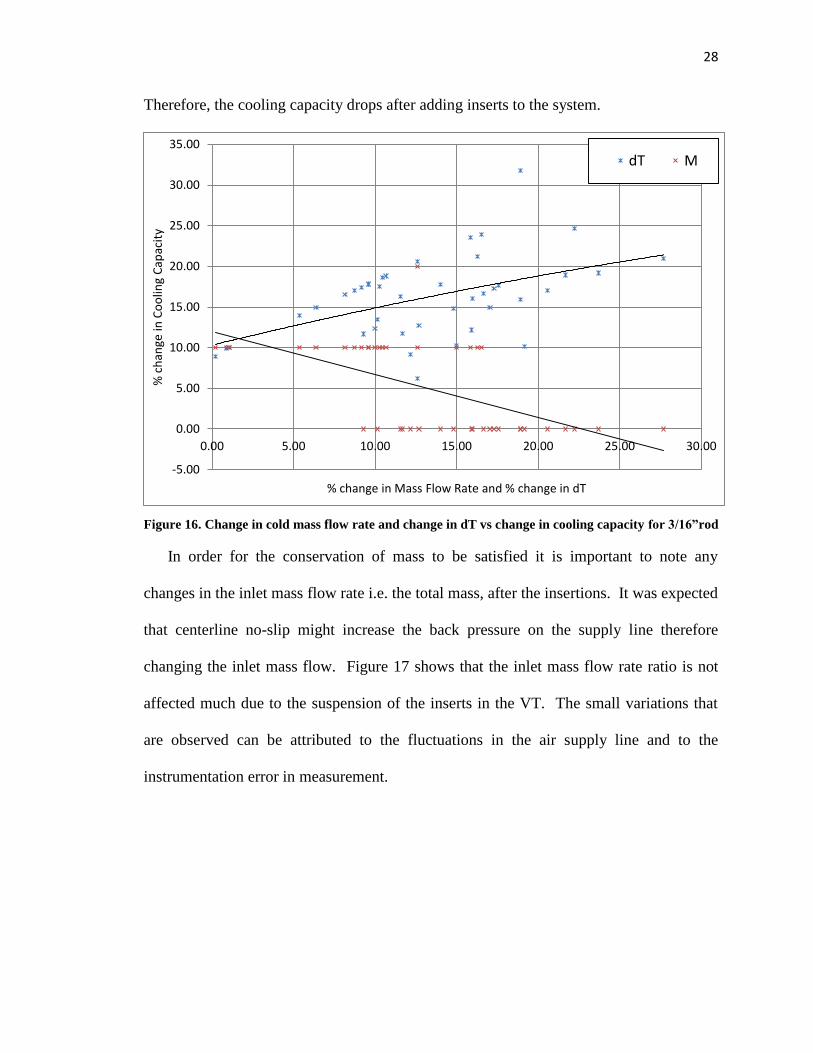
In order to characterize the VT as a phase separator reduction in cold temperature is
more valuable than the cold mass flow rate. Now, using equation 1, cooling capacity can
be defined with as:
Q = Mc x cp x dTc ..............................................................6
where, Mc is cold mass flow rate, cp is the specific heat of dry air and dTc is the drop in
cold-side temperature. It was observed that even though the centerline no-slip condition
increased the cold fraction, it reduced the drop in cold-side temperature. Figure 16 shows
that the change in cold temperature differential has a greater effect on the cooling
capacity than change in cold mass flow.
28
Therefore, the cooling capacity drops after adding inserts to the system.
Figure 16. Change in cold mass flow rate and change in dT vs change in cooling capacity for 3/16”rod
In order for the conservation of mass to be satisfied it is important to note any
changes in the inlet mass flow rate i.e. the total mass, after the insertions. It was expected
that centerline no-slip might increase the back pressure on the supply line therefore
changing the inlet mass flow. Figure 17 shows that the inlet mass flow rate ratio is not
affected much due to the suspension of the inserts in the VT. The small variations that
are observed can be attributed to the fluctuations in the air supply line and to the
instrumentation error in measurement.
-5.00
0.00
5.00
10.00
15.00
20.00
25.00
30.00
35.00
0.00 5.00 10.00 15.00 20.00 25.00 30.00
% c
han
ge in
Co
olin
g C
apac
ity
% change in Mass Flow Rate and % change in dT
dT M

29
Figure 17. Effect of centerline no-slip condition on the inlet mass ratio at various inlet pressure
ratios,
(a) Cf = 0.3, (b) Cf = 0.5, (c) Cf = 0.7
0
0.2
0.4
0.6
0.8
1
1.2
1 1.5 2 2.5 3 3.5
Mi (
new
) /
Mi (
old
)
Inlet Pressure Ratio (Pi / Pa)
WO / I3/16" R1/4" R
Cf = 0.5
(b)
0
0.2
0.4
0.6
0.8
1
1.2
1 1.5 2 2.5 3 3.5
Mi (
new
) /
Mi (
old
)
Inlet Pressure Ratio (Pi / Pa)
WO / I3/16" R1/4" RCf = 0.7
(c)
0
0.2
0.4
0.6
0.8
1
1.2
1 1.5 2 2.5 3 3.5
Mi (
new
) /
Mi (
old
)
Inlet Pressure Ratio (Pi / Pa)
WO / I3/16" R1/4" RCf = 0.3
(a)

30
3.3 Error measurement
The error analysis is done by analyzing conservation of energy in the system. For
an ideal system equation 7 must be satisfied.
Mi hi = Mc hc + Mh hh…………………………………………7
This kind of analysis gives the cumulative error due to instruments, heat loss due to
convection, frictional loss within the fluid and such.
The following histogram shows the distribution of actual energy conserved with respect
to the ideal energy conservation for various sets of measurements.
Figure 18. Histogram representing distribution of actual energy conserved around the ideal energy
conservation
Relative standard error in measurement can be calculated using the following equation
……..……8
RSE as calculated is ≈ 10%.
Therefore, these measurements are 90% accuracy.
0
5
10
15
20
25
30
35
Fre
qu
en
cy
Actual Energy Conserved / Ideal energy conservation
Frequency

31
CHAPTER 4
CONCLUSION AND FUTURE WORK
This chapter deals with the conclusion of the experiments and presents the scope of work
that can be done in the future to improve the results.
4.1 Conclusion
Curbing the vibrations of the inserts is important as these would tend to splatter
the condensate on the wall therefore, defeating the purpose of centerline no-slip
boundary condition. The nature of these vibrations depends upon the length and
type of the insert and the position of the VT along the length. In order to reduce
the frequency and amplitude the VT must be placed such that the inserts vibrate in
higher modes. Further, using inserts of higher mass and rigidity diminishes the
vibration effect.
To have least effect on the cooling capacity of the VT, outer diameter of the insert
should be kept as low as possible. An optimized size that will have negligible
vibration and will least affect the VT performance should be chosen. For this
current study, 1/8” rod turned out to be the best option. Further, in order to
explain similar performance effects due to 1/8” and 3/16” sized inserts at higher
cold fractions, it is hypothesized that the diameter of the inner vortex increases
with cold mass flow and at higher cold fractions it becomes bigger than the 3/16”
and so the inserts have similar effect on the temperature separation.
At any given supply pressure the cold mass flow rates increase on introduction of
the inserts, especially for lower cold fractions and there is corresponding decrease
in the hot mass flow rates. It is speculated that the centerline no-slip moves the
32
stagnation point towards the cold exit which in-turn increases the drag on the air
towards the hot exit. This air, especially closer to stagnation point, loses
momentum and pressure energy while overcoming this drag and moves towards
the cold exit. Further, the movement of the stagnation point also reduces the
temperature separation effect leading to higher cold side temperatures. Another
probable reason for the increased cold fraction is that the inserts reduce the effect
of recirculation and hence higher mass flows towards cold side.
Decrease in cold temperature differential due to the inserts has higher effect on
the cooling capacity than increase in cold mass flow rate. Therefore, the cooling
capacity decreases on introduction of inserts.
4.2 Future Work
There are several areas that can be improved in order to obtain better refrigeration
capacities and better condensation and collection.
Instead of using dry air, humid air or a combination of gas and liquid vapor can be
used to check the efficiency of this method.
The inserts used in this study were of standard commercially available stainless
steel sizes. A study can be performed to design an optimum size of the insert that
will affect the VT performance the least and improve the efficiency of condensate
collection. Further, the inserts can be specially coated to increase the chances of
condensate clinging and slipping along the surface.
The increase in cold mass flow rates should be further explored to pinpoint the
reason.

33
CHAPTER 5
APPENDIX
5.1 Pre-setup
5.1.1 Accommodations for inserts and leakage prevention
In order to accommodate the inserts, holes were drilled in the air hoses and the hot
exhaust valve. The threaded hole on the valve could be plugged in order to prevent
leakage during “Without Insert” condition. As seen in Figure 19,washers with inner
holes of diameter 1/8”, 3/16” and 1/4” were inserted in the valves (one for each insert
size) to accommodate the perfect size of the insert and prevent any leakage through the
gap.
Figure 19. Leakage prevention through the hot exhaust valve
34
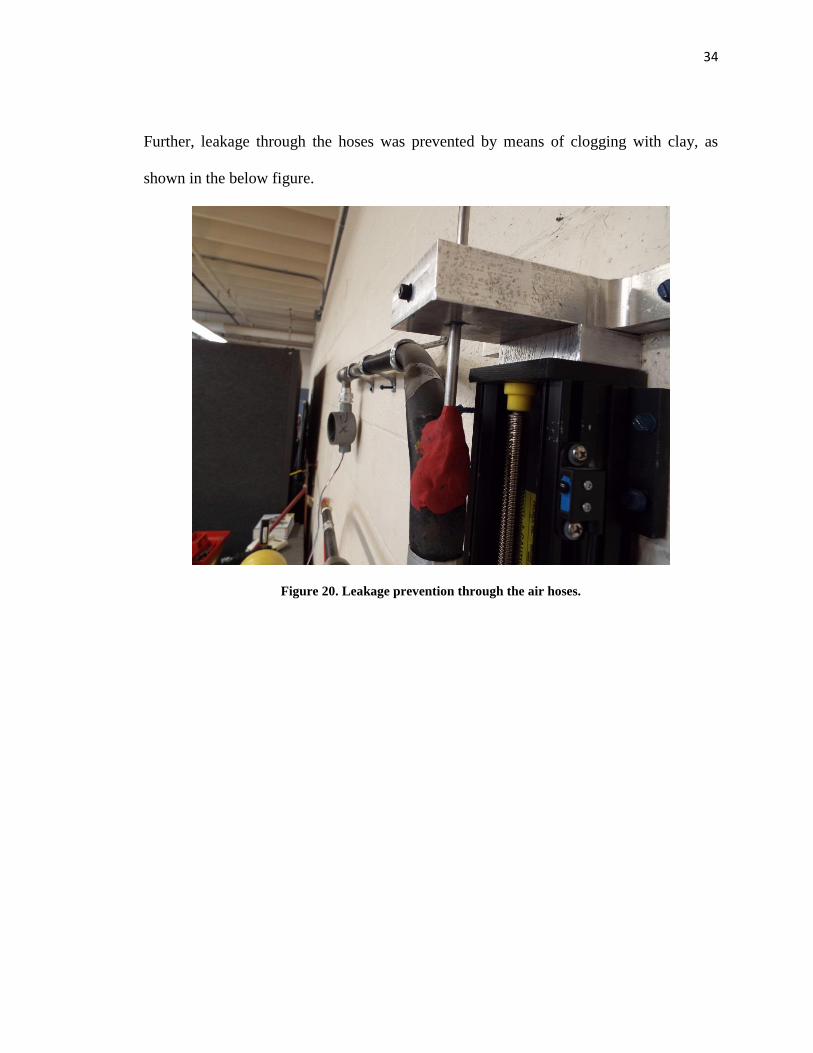
Further, leakage through the hoses was prevented by means of clogging with clay, as
shown in the below figure.
Figure 20. Leakage prevention through the air hoses.

35
5.1.2 Measurement of resistance output of thermistor
The output of thermistors is resistance (Ohms). The DAQ used in the experimentation
was incapable of measuring resistance directly. Hence, the resistance had to be converted
into voltage, by means of a voltage divider circuit, before feeding to the DAQ. Referring
to Figure 8, the other end of the green wire is connected to the +5V input on DAQ.
Figure 21. Voltage divider circuit to measure resistance output from thermistors
The measured voltage is reconverted into resistance by using the following equation:
( ) (
) ( )………………...………….….7
Further, the resistance was converted into temperature by using equation 8
( ) (
( )) (
( )) ……………………………….8
Where,
Resistance of the thermistor at 25 °C = R(25) = 5000 Ω.
Constants provided by Omega Engg
A = 1.285 x 10^(-3), B = 2.362 x 10^(-4), C = 9.285 x 10^(-8)

36
5.1.3 Suspension of thermistor through the tube
In order to measure the centerline temperature profile, the temperature probe had
to be suspended in the VT. Since there was a chance of the probe getting damaged due to
the heavy turbulence in the VT, it was suspended through a SS tube. Refer Figure 22.
Figure 22. Suspension of thermistor through a SS tube

37
5.2 Experimental Procedures
5.2.1 Experiment on vibrations
Referring to Figure 23, following steps were followed for the experimentation:
Step 1. The wire is suspended through the VT and held taut, by means of a weight,
between two fixtures, one each on top and bottom of the linear stage.
Step 2. Air is supplied at a set pressure and the frequency and amplitude of the wire are
measured.
Step 3. The VT is moved by a pre-determined distance along the linear stage and
measurements are taken again. This step is repeated till the entire length of the
wire between the fixture is covered.
Step 4. Supply pressure is increased and Steps 2 & 3 are carried out again.
Figure 23. Measurement of vibrations induced in the wire

38
5.2.2 Measurement of impact of centerline no-slip condition on VT
The experimental setup is shown in Figure 6..
Figure 6. Experimental setup to measure the impact of centerline no-slip on VT
Step 1. Air is supplied at a set pressure and the cold fraction is set by measuring the inlet
and cold outlet flow rates. The hot gas piping had to be disconnected from the
setup in order to control the cold fraction with the hot exhaust valve.
Step 2. Hot end piping is reconnected, mass flow rates are measured and the setup is left
to achieve thermal stability (approximately 10 minutes).
Step 3. Temperatures for inlet and cold and hot gas outlets are measured.
Step 4. Tube is inserted through the VT and Steps 2 and 3 are repeated.
Step 5. Rod is inserted after removing the tube and Steps 2 and 3 are repeated.
Step 6. Steps 1 – 5 are repeated for a new cold fraction.
Step 7. Steps 1 – 6 are repeated for higher supply pressure.
Step 8. All of the above steps are repeated for different sized inserts.
39
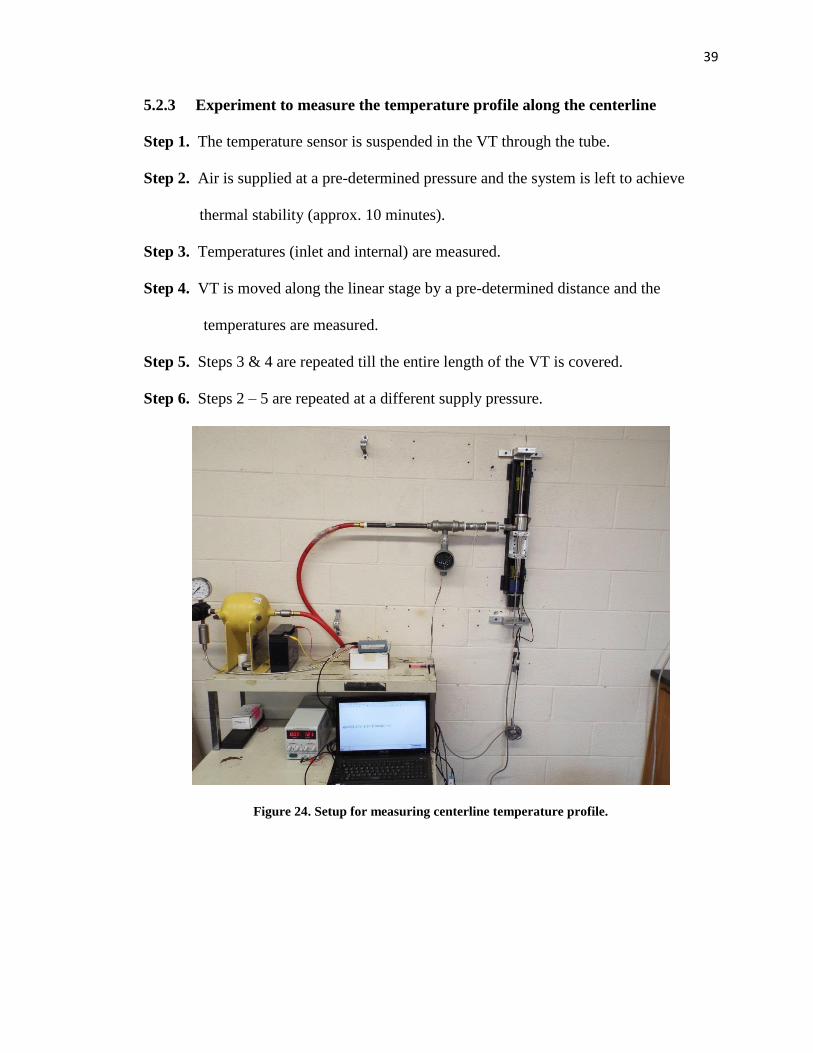
5.2.3 Experiment to measure the temperature profile along the centerline
Step 1. The temperature sensor is suspended in the VT through the tube.
Step 2. Air is supplied at a pre-determined pressure and the system is left to achieve
thermal stability (approx. 10 minutes).
Step 3. Temperatures (inlet and internal) are measured.
Step 4. VT is moved along the linear stage by a pre-determined distance and the
temperatures are measured.
Step 5. Steps 3 & 4 are repeated till the entire length of the VT is covered.
Step 6. Steps 2 – 5 are repeated at a different supply pressure.
Figure 24. Setup for measuring centerline temperature profile.

40
5.3 Instrumentation
Following table gives details about the instruments used in the study.
Thermistor
(Omega –
44007)
Figure 25. Thermistor
Interchangeability: ±0.2 °C.
Maximum T: 150 °C.
Time constant, Max: 1 sec in well
Pressure
Gauge
(Ashcroft)
Figure 26. Pressure Gauge
Range: Dual 0-100 psi & 0-700
kPa.
Dual: 3-1/2”
Pipe Size: 1/4”
Vortex Tube
(Exair –
3499)
Figure 27. Vortex Tube

41
Linear Stage
(Velmex –
MN10-0160-
M02-21)
Figure 28. Velmex Bislide Linear Stage
M: Cross Section.
N: Nut/Screw Drive.
10: Design in Inch.
0160: Travel. (16 inch)
M02: 2.00mm
Advance/turn.
21: NEMA 23 Mount &
Limit Switches.
Precision
Turbine
Flow Meters
(Omega –
930 series)
Figure 29.Precision Turbine Flow meter
with signal conditioner.
Accuracy: ±1.0% of reading
Repeatability: ±0.25%
Body: 304/316 stainless steel
Rotor: 17-4 PH SS
Bearings: 440C stainless steel
Output: 30 mV p-p sinewave
min.

42
Signal
Amplifier
(Omega –
FLSC 64)
Figure 30. Signal Amplifier
The FLSC-64 amplifies and conditions
low-amplitude signals such as those
developed by a magnetic pickup coil.
The amplitude of the square wave output
equals the input supply voltage of the
FLSC-64. A sensitivity adjustment
permits the FLSC-64 to discriminate
between an input signal and noise. It can
be directly mounted on the flow meter as
seen in Figure . Frequency of the square
wave generated by the flow meter will be
proportional to the flow rate of air
through the turbine flow-meter.
Stroboscope
(Genrad –
Strobotac
Type 1531)
Figure 31. Stroboscope
Calibration: Accurately
calibrated flash rates to 25,000
per minute.
Flash Rate (fpm): 110 to 25,000
in 3 ranges; speeds up to 250,000
rpm can be measured.
Accuracy: 1% of reading after
calibration on one range against
50-to-60 Hz line frequency

43
Pressure
Transducer
(GP50 – 211)
Figure 32. Pressure Transducer
Range: 0 -300 Psi.
Excitation voltage: 9.0 to 36 Vdc.
Output Signal: 0 to 5 Vdc
MOC: 17-4 PH SS.
Accuracy: ±0.5% FSO
Connection: 1/4”
Data
Acquisition
Card
(MCC DAQ
– USB –
1208HS)
Figure 33. Data Acquisition Card
8 single-ended/4 differential
analog inputs
13-bit resolution
1 MS/s sample rate
Single-ended ranges: ±10 V, ±5
V, ±2.5 V or 0 to 10 V
Differential ranges: ±20 V, ±10
V, or ±5 V
16 digital I/O lines
Two 32-bit counters
One 32-bit PWM timer output
USB-bus powered
Table 1. Instrumentation

44
CHAPTER 6
REFERENCES
6.1 References for figures
Figure 1. http://ethesis.nitrkl.ac.in/2069/1/final_thesis.pdf
Figure 2. http://www.exair.com/
Figure 3. https://www.youtube.com/watch?v=Q_y2FvH2DHE
Figure 4. http://www.scienceforums.net/topic/53028-ranque-hilsch-vortex-tube-and-
golden-spiral/
Figure 18. http://www.omega.com/pptst/44000_THERMIS_ELEMENTS.html
Figure 20. http://www.exair.com/
Figure 21. http://www.velmex.com/
Figure 22. http://www.omega.com/pptst/FTB930.html
Figure 23. http://www.omega.com/pptst/FLSC60.html
Figure 25. http://www.gp50.com/product/model-111-211-311-industrial-grade-pressure-
transmitter-automotive-testing/
Figure 26. http://www.mccdaq.com/usb-data-acquisition/USB-1208HS.aspx
6.2 References for literature review
[1] G.J. Ranque, “Expériences sur la détente giratoire avec production simultanée d‟un
échappement d‟air chaud et d‟un échappement froid”, J. Phys. Radium 4 (1933) 112.
[2] R. Hilsch, “The use of the expansion of gases in a centrifugal field as cooling
process”, Rev. Sci. Instrum. 18 (2) (1947) 108.
[3] Mahyar Kargaran, Mahmood Farzaneh-Gord, “An Experimental study on the effect
of pressure inlet gas on a counter-flow vortex tube”, Frontiers in Heat and Mass
Transfer (FHMT), 4, 013007 (2013).
[4] Nader Pourmahmoud, Masoud Rahimi, Seyyed Ehsan Rafiee, Amir Hassanzadeh, “A
numerical simulation of the effect of inlet gas temperature on the energy separation
in a vortex tube”, Journal of Engineering Science and Technology Vol. 9, No. 1
(2014) 81 – 96.
[5] C.U. Linderstrom-Lang. “A model of gas separation in Ranque-Hilsch vortex tubes”.
Z, Naturforschg., 22(a):835–837, April 1967.
[6] J. Marshall, “Effect of operating conditions, physical size and fluid characteristics on
the gas separation performance of a Linderstrom-Lang vortex tube”. Int. J. Heat
Mass Transfer, 20:227–231, 1977.

45
[7] Rajarshi Kar, Oindrila Gupta, Mukunda Kumar Das, “Studies on the Effect of Feed
Gas Temperature on Ranque-Hilsch Vortex Tube”, International Journal of Scientific
and Research Publications, Volume 2, Issue 11, November 2012, ISSN 2250-3153.
[8] Orhan A., Baki Muzzafer, 2006, “An Experimental Study on the Design Parameters
of a Counterflow Vortex Tube”, Energy 31, 2763-2772.
[9] Pourmahmoud, N, Rafiee, S.E, Rahimi M, and Hassanzadeh, A, “Numerical energy
separation analysis on the commercial Ranque-Hilsch vortex tube on basis of
application of different gases”, Scientia Iranica B, 20(5), 1528-1537.
[10] Sachin Nimbalkar, Michael R. Muller, “An experimental investigation of the
Optimum geometry for the cold end orifice of a vortex tube”, Applied Thermal
Engineering 29 (2009) 509-514.
[11] Pourmahmoud N, Bramo A R, “The effect of L/D ratio on the temperature
Separation in the counterflow vortex tube”, IJRRAS 6(1) January 2011.
[12] Volkan Kirmaci, “Optimization of counter flow Ranque-Hilsch vortex tube
performance using Taguchi method”, International Journal of Refrigeration, vol 32;
ppl487-1494 (2009).
[13] Y.T, Wu, Y. Ding, Y.B. Ji, C.F. Ma, M.C. Ge, “Modification and experimental
research on vortex tube:, International Journal of Refrigeration, 30 (2007) 1042-
1049.
[14] Pourmahmoud N, Esmaily R, Hassanzadeh A, “CFD investigation of vortex tube
length as a designing criterion”, International Journal of Heat and Technology,
Vol.33, No.1, 2015.
[15] Schultz-Grunow F 1951 “Turbulenter Wmnedurchgang im Zentrifugalfeld” Forsch
Ing. Wes. 17 65-76.
[16] Ahlborn, B., Keller, J.U., Staudt, R., Treitz, G., Rebhan, E. “Limits of temperature
separation in a vortex tube”, J. Phys. D.: Appl. Phys., 27:480-488, 1994.
[17] Kurosaka, M., Chu, J.Q. & Goodmann, J.R. “Ranque-Hilsch effect revisited:
Temperature separation effect traced to orderly spinning waves or vortex whistle”,
AIAA (82-0952) AIAA/ASME 3rd Joint Thermo-Physics of Fluids, Plasma and
Heat Transfer Conference, 1982.
[18] Ahlborn B, Groves S, “Secondary flow in a vortex tube”, Fluid Dynamics Research
21 (1997) 73-86.
[19] R Liew, J C H Zeegers, J G M Kuerten and W R Michalek, “Temperature, Pressure
and Velocity measurements on the Ranque-Hilsch Vortex Tube”, 6th European
Thermal Sciences Conference (Eurotherm 2012), Journal of Physics: Conference
Series 395 (2012) 012066.
[20] M.H. Saidi, M.R. Allaf Yazdi, “Exergy model of a vortex tube system with
experimental results”, Energy 24 (1999) 625-632.
[21] Y. Xue and M. Arjomandi, “Thermodynamic analysis of the energy separation in a
counter-flow vortec tubes”, 19th
Australian Fluid Mechanics Conference, 8-11
December 2014.
[22] K. Stephen, S. Lin, M. Durst, F. Huang and D. Seher, “An investigation of energy
separation in a vortex tube”, International Journal of Heat Mass Transfer, Vol. 26(3),
pp. 341-348, 1983.

46
[23] Chang Hyun-Sohn, Chang-Soo Kim, Ui-Hyun Jung and B.H.L Lakshmana Gowda,
“Experimental and Numerical studies in a vortex tube”, Journal of Mechanical
Science and Technology (KSME Int. J.), Vol. 20, No. 3, pp. 418-425, 2006.
[24] Choi B.C and Riu. K.J., 1996, “An Experimental Study for Cold End Orifice of
Vortex Tube”, Transaction of the KSME B in Korea, Vol.42, pp. 415-422.
[25] S. Nimbalkar, Michael R. Muller, “Quantitative observations on multiple flow
structures inside Ranque Hilsch vortex tube”,
https://rucore.libraries.rutgers.edu/rutgers-lib/25863/pdf/1.
[26] Saidi M.H., Valipour M.S., “Experimental modeling of vortex tube refrigerator”,
Applied Thermal Engineering 23 (2003) 1971-1980.
[27] Khodorkov I.L., Poshernov N.V. and Zhidkov M.A., “The vortex tube – a universal
device for heating, cooling, cleaning, and drying gases and separating gas mixtures”,
Chemical and Petroleum Engineering 39 (7-8) (2003) 409-415.
[28] Stanescu G, Cabral C., Santos M.C, “Experimental study on the vortex tube
potential to increase air moisture removal and carrying capability”, 15th
International
Conference on Experimental Mechanics, 2931.
[29] Saha D., Zeegers J.C.H, Kuerten J.G.M, “Condensation and droplet separation in
Ranque-Hilsch vortex tube”, 13th
International Conference on Multiphase Flow in
Industial Plants, Sestri Levante, Genova, Italy 2014.
[30] Liew R., Michalek W. R., Zeegers J.C.H., Kuerten J.G.M., “Droplet Behavior in a
Ranque-Hilsch vortex tube”, 13th
European Turbulence Conference (ETC13),
Journal of Physics: Conference Series 318 (2011) 052013.
[31] Grönner J., “Successful experience with vortex tube technology at the EPE Cavity
Storage of RWE Energy”, 23rd
World Gas Conference, Amsterdam 2006.
[32] https://www.vortec.com/c-11-vortex-tubes.aspx
[33] http://www.exair.com/
[34] T. Cockerill., Ranque-Hilsch vortex tube, Master thesis, University of Cambridge,
1995.