impact of climat on health
TRANSCRIPT

Center for Hydrometeorology and Remote Sensing, University of California, Irvine
Ensuring Water in a Changing WorldEnsuring Water in a Changing World
Association of State and Territorial Health Officials (ASTHO)webinar series on the human health effects of climate change.
April 29th, 2008
Climate Change & The Global Water Cycle: Recent Regional Experiences
Soroosh Sorooshian Center for Hydrometeorology and Remote Sensing
University of California Irvine

Center for Hydrometeorology and Remote Sensing, University of California, Irvine
University of California Irvine (UCI) and Arizona (UA)

Center for Hydrometeorology and Remote Sensing, University of California, Irvineand many more …
CHRS & Affiliates: A truly International Team

Center for Hydrometeorology and Remote Sensing, University of California, Irvine
A Unique Planet: Blue, Green and alive!

Center for Hydrometeorology and Remote Sensing, University of California, Irvine
Earth's atmosphere:78% nitrogen, 21% oxygen, and 1% other gases
Atmosphere of Earth vs. Mars and Venus

Center for Hydrometeorology and Remote Sensing, University of California, Irvine
Distribution of Freshwater

Center for Hydrometeorology and Remote Sensing, University of California, Irvine
Distribution of Fresh Water Use
90.8 33.4%
17.1%49.5%
460
7.0%6.0%
87.0%
36.47
18.6%
22.0%59.4%
117
60.0%17.0%
23.0%
467.34
45.2%
13.1%
41.7%
380
4.0% 3.0%
93.0% Agriculture
Industry
Domestic
Fresh Water Use(109 Cubic Meters)
Water Source
Water Use
USA China India
Russia Japan Brazil
92%6%
2%
70.3Iran

Center for Hydrometeorology and Remote Sensing, University of California, Irvine
Increasing Population: Number of Mega Cities
Global Urban population 1970: ~37%2010: ~53%
Projected Global Population: 8.3 Billion by 2025

Center for Hydrometeorology and Remote Sensing, University of California, Irvine
The Big Question as to Whether Our Planet Is Warming Up and The Hydrologic Cycle is
Intensifying, has been addressed by The Recent IPCC Report

Center for Hydrometeorology and Remote Sensing, University of California, Irvine
Evidence for reality of climate change: Glaciers MeltingEvidence for reality of climate change: Glaciers Melting
1909
2000
Muir Glacier, Alaska
1900 2003Alpine glacier, Austria
1900 2003Alpine glacier, AustriaToboggan Glacier Alaska
Provided By: Kevin Trenberth

Center for Hydrometeorology and Remote Sensing, University of California, IrvineSource: NASA GISS 2007
Global Temperature Anomalies: 2007
Tied (with 1998) for the second warmest year (2005 Warmest)

Center for Hydrometeorology and Remote Sensing, University of California, Irvine
Global Warming And Hydrologic Cycle Connection
Heating
Temperature Evaporation
Water Holding Capacity
Atmospheric Moisture
Source: Gi-Hyeon Park
Green House Effect
Consequence:Intensification of Hydrologic cycle

Center for Hydrometeorology and Remote Sensing, University of California, Irvine
Observed changes: Heavy Precipitation
From 1908-2002:
Total annual precipitation across the contiguous U.S. increased 7%
Heavy daily Precipitation events have increased by 20%
Rainfall associated with warmer climates are more due to extreme events compared to colder climates
Facts from Observations
10
0Confidence Index
Source: Tom Karl NCDC-NOAA 2007

Center for Hydrometeorology and Remote Sensing, University of California, Irvine
Record Floods: Among the worst Natural Disasters

Center for Hydrometeorology and Remote Sensing, University of California, Irvine
Record Floods: Among the worst Natural Disasters

Center for Hydrometeorology and Remote Sensing, University of California, Irvine
Los Angeles (1955)

Center for Hydrometeorology and Remote Sensing, University of California, Irvine
0
200
400
600
800
1000
1200
1400
Jun- 48 Jun- 52 Jun- 56 Jun- 60 Jun- 64 Jun- 68 Jun- 72 Jun- 76 Jun- 80 Jun- 84 Jun- 88 Jun- 92 Jun- 96 Jun- 00
Eve
nt to
tal p
reci
pita
tion
(mm
)
Eve
nt d
urat
ion
(day
s)
2
4
6
0
8
10
12
0
200
400
600
800
1000
1200
Total precipitation (mm) and duration (days) of extreme events in Texas
Normal annual precipitation in Texas is 650~750mmSource: J. Nielsen-Gammon et al., 2005
Extreme Precipitation events: Texas, USA (1948- 2001)

Center for Hydrometeorology and Remote Sensing, University of California, Irvine
American River Runoff Annual Maximum 1-Day Flow
0
25
50
75
100
125
150
175
200
225
250
1900 1905 1910 1915 1920 1925 1930 1935 1940 1945 1950 1955 1960 1965 1970 1975 1980 1985 1990 1995 2000 2005
Water Year
1,00
0 cf
s
Unimpaired Runoff at Fair Oaks
Changes in Peak Flows American River, California
Red Line = Construction of Folsom Dam From: J. Andrew DWR-DFM
Center for Hydrometeorology and Remote Sensing, University of California, Irvine
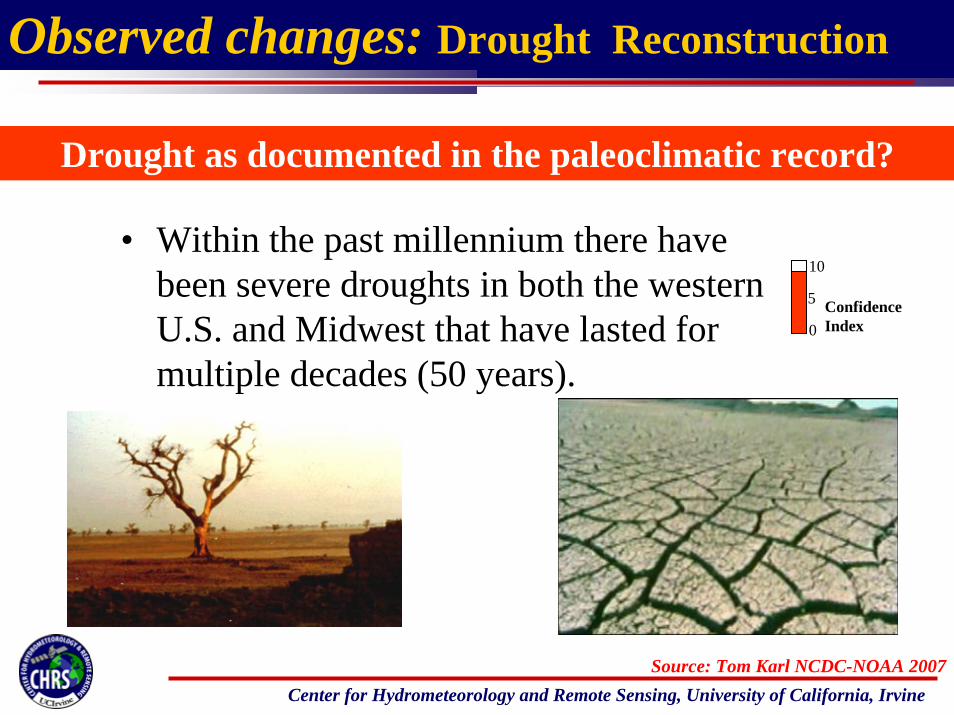
Observed changes: Drought Reconstruction
• Within the past millennium there have been severe droughts in both the western U.S. and Midwest that have lasted for multiple decades (50 years).
Drought as documented in the paleoclimatic record?
10
0
5 Confidence Index
Source: Tom Karl NCDC-NOAA 2007

Center for Hydrometeorology and Remote Sensing, University of California, Irvine
16th century “megadrought”1930’s dustbowl
>100 year “megadroughts”
2000-year Climate history of central U.S.
DustBowl
2000 yrs. ago Today
The US Breadbasket: The Mid-West
Source: Overpeck 2004

Center for Hydrometeorology and Remote Sensing, University of California, Irvine
Ensuring Water in a Changing WorldEnsuring Water in a Changing World
Challenge of predicting the future Climate:
While we Attempt to Improve Our Scientific Understanding of the Climate System, We Face Major Issues With Uncertainties in Information We Can Provide to “Users”
Challenge of predicting the future Climate:
While we Attempt to Improve Our Scientific Understanding of the Climate System, We Face Major Issues With Uncertainties in Information We Can Provide to “Users”

Center for Hydrometeorology and Remote Sensing, University of California, Irvine
Some Results at the Seasonal to Inter-annual and Longer time Scales:
Climate Predictions into the Future!

Center for Hydrometeorology and Remote Sensing, University of California, Irvine
Climate model Predictions about the future? globallyDJF Precipitation ChangesCM2 - Old model
CM3 - Updated model
Significant differences in regional outcomes!
Source: Hadley Center (Climate Change Projections)

Center for Hydrometeorology and Remote Sensing, University of California, Irvine
Model annual precipitation trends over 21st century
Hadley Center: Southwest dries out
What to tell water managers?
Canadian Center: Southwest extremely wet
Source: US National Assessment Report, 2000
What do climate models tell us about the future?

Center for Hydrometeorology and Remote Sensing, University of California, Irvine
Canadian Prairie drought 1999-2005
500 km
2001/02
Source: Ronald Stewart

Center for Hydrometeorology and Remote Sensing, University of California, Irvine
SEASONAL PREDICTIONS: Summer of 2005 - Canada
PREDICTION OBSERVATION
AboveNormal
BelowNormal
Source: Ronald Stewart
Center for Hydrometeorology and Remote Sensing, University of California, Irvine
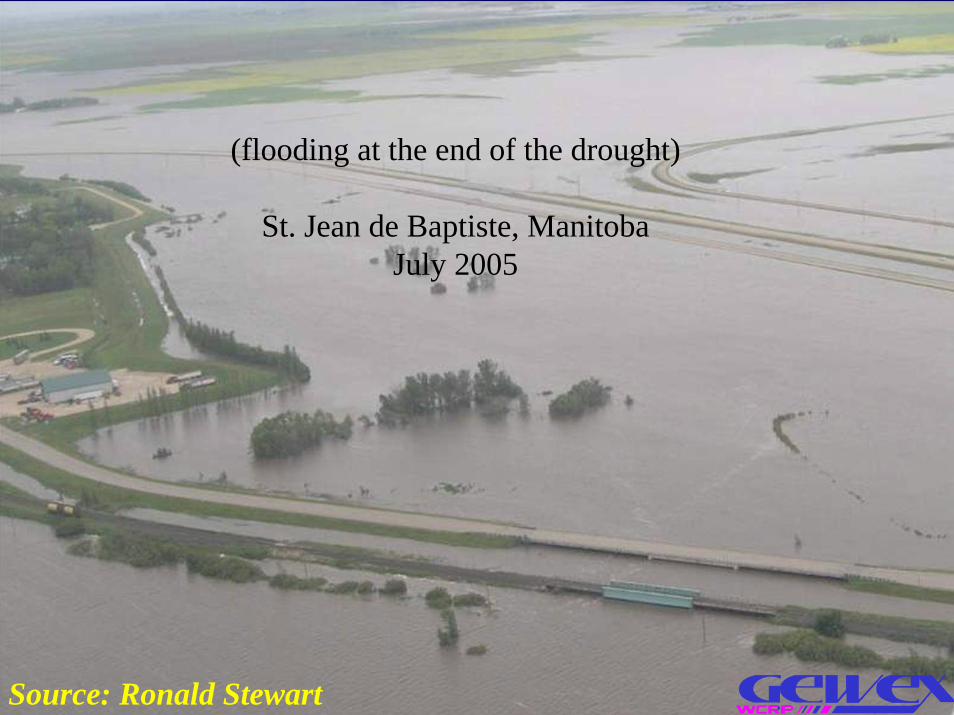
(flooding at the end of the drought)
St. Jean de Baptiste, ManitobaJuly 2005
Source: Ronald Stewart

Center for Hydrometeorology and Remote Sensing, University of California, Irvine
Recent Extreme Conditions in the U.S. Southwest
Lake Powell, Colorado River, USA
Normal Years
Sever Multi-year Drought through 2004
Source: J. Kane SRP 2004

Center for Hydrometeorology and Remote Sensing, University of California, Irvine
Eye-Catching Article in Science Magazine

Center for Hydrometeorology and Remote Sensing, University of California, Irvine
Observed changes: Drought
• U.S. droughts show pronounced multi-year to multi-decadal variability, but no convincing evidence for long-term trends toward more or fewer events.
Drought activity during the 20th and early 21st Century
10
0
5Confidence Index
Based on Palmer Drought IndexModerate to Extreme Drought
Source: Tom Karl NCDC-NOAA 2007

Center for Hydrometeorology and Remote Sensing, University of California, Irvine
Practices in Factoring in Climate and Extreme Events in
Water Resources:Engineering Approach:
Control, Store, Use & Deliver for Multi-Purposes

Center for Hydrometeorology and Remote Sensing, University of California, Irvine
Hoover Dam
Glen Canyon Dam
Central Arizona Project Aqueduct
A Century of Water Resources Development: Engineering success!

Center for Hydrometeorology and Remote Sensing, University of California, Irvine
Time of Construction = 1935Total Storage Capacity = 38.6 BCMAnnual Inflow = 15.4 BCMDrainage Area = 432,500 Km2
Time to fill =2.5 YearsPower Generation = 2,074 MW
Time of Construction = 1963Total Storage Capacity = 33.3 BCMAnnual Inflow = 15.4 BCMDrainage Area = 280,570 Km2
Time to fill = 2.24 YearsPower Generation = 1,356 MW
Hoover Dam
Glen Canyon Dam
Built-In Resiliency in water resources Systems!

Center for Hydrometeorology and Remote Sensing, University of California, Irvine
Colorado Basin400%
California Region100%
Storage Capacity/Streamflow Relationship
B. Imam, CHRS-UC Irvine

Center for Hydrometeorology and Remote Sensing, University of California, Irvine
“News From Space”
Satellite ObservationsSatellite Observations

Center for Hydrometeorology and Remote Sensing, University of California, Irvine
SatelliteHuman Eye
Ref
lect
ance
( % )
Visible Range
80
40
00.4 0.6 0.8 1.0 1.2 1.4 1.6 1.8 2.0 2.2 2.4 2.6
Wavelength (µm)
40
20
0Bare Soil
HealthyVegetation
40
20
0
StressedVegetation
40
20
0
FreshSnow
SeaWater
543210
0 2 4 6 8 10 12 14 16
Remote Sensing Systems (Spectral Signal)

Center for Hydrometeorology and Remote Sensing, University of California, Irvine
Current Meteorological and Earth Observing Satellites in Space

Center for Hydrometeorology and Remote Sensing, University of California, Irvine
Precipitation Observations: Which to trust??
Sources: R. Fulton, D.-J. Seo. and J. Breidenbach, AMS Short-Course on QPE/QPF, 2002

Center for Hydrometeorology and Remote Sensing, University of California, Irvine
Satellite Products: Promising future

Center for Hydrometeorology and Remote Sensing, University of California, Irvine
A Key Requirement!
Measurement of Rainfall is a Major Challenge

Center for Hydrometeorology and Remote Sensing, University of California, Irvine
Temporal Scale Importance: Daily Precip. at 2 stations
0
20
40
1 6 11 16 21 26
0
20
40
1 6 11 16 21 26
Frequency 6.7%Intensity 37.5 mm
Frequency 67%Intensity 3.75 mm
MonthlyAmount 75 mm
Amount 75 mm
localfloods
soil moisture replenishedvirtually no runoff
A
B
Source: K. Trenberth, NCARSource: K. Trenberth, NCAR

Center for Hydrometeorology and Remote Sensing, University of California, Irvine
Water Quality Concerns

Center for Hydrometeorology and Remote Sensing, University of California, Irvine
Available Resources

Center for Hydrometeorology and Remote Sensing, University of California, Irvine
Satellite Products: Promising future

Center for Hydrometeorology and Remote Sensing, University of California, Irvine
Satellite Products: Promising future

Center for Hydrometeorology and Remote Sensing, University of California, Irvine
Global Flood Archive for 2007
http://www.dartmouth.edu/~floods/

Center for Hydrometeorology and Remote Sensing, University of California, Irvine
U.S. Drought Monitor ( Multi Agency Effort)

Center for Hydrometeorology and Remote Sensing, University of California, Irvine
U.S. Drought Outlook ( Multi Agency Effort)

Center for Hydrometeorology and Remote Sensing, University of California, Irvine
AHPS Flood Forecast system (U.S.A)

Center for Hydrometeorology and Remote Sensing, University of California, Irvine
Monitoring of Global Fires from Space

Center for Hydrometeorology and Remote Sensing, University of California, Irvine
Thank You For ListeningThank You For Listening
The Rio Grande River, NM Photo: J. Sorooshian 2005