impact of coal properties and operational factors on mine
TRANSCRIPT

Black, D J and Aziz, N I, 2010. Impact of coal properties and operational factors on mine gas drainage, in Proceedings of the 10th Underground Coal Operator’s Conference COAL2010, University of Wollongong, (eds: N I Aziz and J A Nemcik), Wollongong, 11-12 February, pp 229-240
IMPACT OF COAL PROPERTIES AND OPERATIONAL FACTORS ON MINE GAS DRAINAGE
Dennis J. Black1,2
ABSTRACT: Many Australian underground coal mines have or are likely to encounter areas of increased gas content, which are difficult to drain. A number of factors have the potential to impact the overall efficiency and effectiveness of gas drainage from the mined coal seam. A mine based investigation was undertaken at an operating coal mine working in the gassy Bulli seam of Australia’s Illawarra coal measures. Gas production data from 279 inseam gas drainage boreholes was evaluated relative to a variety of coal properties and mine operational factors to determine the impact of each on gas production performance. Whilst the design of the boreholes and the drainage time had some impact on gas production it was the coal properties that had the most impact. Coal rank, ash content, gas content, seam thickness and gas composition were all found to impact gas production. In particular, total gas in place and degree of saturation had the most significant impact on coal seam gas production performance. Various recommendations are suggested.
and Naj I. Aziz1
INTRODUCTION Many Australian underground coal mines have, or are likely to encounter areas of increased gas content which are difficult to drain. Such conditions are quite common in mines working the Bulli seam and the impacts range from increased gas drainage drilling expenditure to coal production delays and in the extreme cases loss of coal reserves. This study, undertaken at a Bulli seam mine, is made possible through the availability of gas production data, recorded regularly throughout the production life of the underground to inseam (UIS) boreholes used to drain gas from the coal seam ahead of mining. Of the many hundred UIS boreholes drilled throughout the mine 279 were deemed appropriate for inclusion in this study. Boreholes that had obvious interaction with adjacent boreholes were excluded from the dataset along with boreholes reported to have experienced problems, such as borehole collapse, and those regularly reported to be full of water. Figure 1(A) shows the location of the boreholes relative to the mine workings. The UIS boreholes are drilled in a fan pattern from a dedicated drilling stub. The 279 boreholes included in this analysis were drilled from 34 separate drill stubs. The mine experienced increased difficulty in draining gas from the inbye ends of the panels, shown as the left side of the figure. The mine’s response to the poor drainage performance was to increase the drilling density, with the toe spacing between boreholes reducing from approximately 25 m at the start of the panels, to less than 12 m in the inbye zones. It was generally accepted at the mine that the poor gas drainage was the result of increasing CO2 seam gas composition. Using gas composition data derived from exploration core sample analysis a contour plot was prepared to illustrate the change in CH4 to CO2 ratio along the length of the panels. Figure 1(B) shows the change in gas composition from CH4 rich at the panel entry to CO2 rich at the inbye end of the panels.
Figure 1(A) – Location of boreholes and drill sites relative to existing and future planned mine workings
Figure 1(B) – Contour plot showing change in seam gas composition – CH4 to CO2 ratio
Table 1 lists the various operational factors and coal properties analysed to determine their respective impact on coal seam gas production performance. The variables have been divided into two groups based on the mine operator’s degree of control and ability to influence and control each to improve gas production performance. Within the bounds of the mine and equipment design constraints the mine operator has scope to vary the operational factors whereas the coal
1 Department of Civil, Mining and Environmental Engineering, University of Wollongong, Australia 2 Pacific Mining and Gas Management (PacificMGM), www.pacificmgm.com.au

Black, D J and Aziz, N I, 2010. Impact of coal properties and operational factors on mine gas drainage, in Proceedings of the 10th Underground Coal Operator’s Conference COAL2010, University of Wollongong, (eds: N I Aziz and J A Nemcik), Wollongong, 11-12 February, pp 229-240 properties are, for the most part, the result of coalification and subsequent geological changes and therefore not able to be altered by the mine operator.
Table 1 – Operational factors and coal properties included in the gas production analysis
OPERATIONAL FACTORS COAL PROPERTIES
Borehole length
Borehole diameter
Drilling density
Orientation to cleat
Orientation to stress
Apparent dip
Drainage time
Suction pressure
Carbon content
Volatile matter
Vitrinite reflectance
Inertinite/Vitrinite content
Mineral matter
Seam/Coal ash content
Inherent moisture content
Seam thickness
Gas content
Gas composition
Total gas in place
Degree of saturation
GAS PRODUCTION There is a steady decrease in the total volume and rate of gas production from UIS drilling along the length of the panels. Figure 2 show the average total gas production (m3) from boreholes drilled from each of the 34 drill stubs relative to the position of the stubs along the length of each panel. Both figures confirm a consistent decline in gas production with distance into the panels.
Figure 2 – Total drill stub gas production relative to panel drill stub location
Figure 3 shows the total gas production from each of the 279 boreholes which, in addition to the high degree of variability, highlight the significant number of boreholes that achieved low production, nearly 50% achieving less than 100 000 m3 total gas production. In order to account for the effects of initial gas emission rate the total gas volume produced within the first 50 days (D50) of the borehole productive life was also assessed. The gas produced at D50 was also found to decrease with distance into the panels.
Figure 3 – Total gas production relative to borehole location along panel
Review of borehole production records provided insight into factors contributing to the low production from many boreholes. Regular problems with UIS boreholes were reported which included; ‘borehole blocked’, ‘borehole full of
Black, D J and Aziz, N I, 2010. Impact of coal properties and operational factors on mine gas drainage, in Proceedings of the 10th Underground Coal Operator’s Conference COAL2010, University of Wollongong, (eds: N I Aziz and J A Nemcik), Wollongong, 11-12 February, pp 229-240 water’ and ‘no suction’. Separate investigation into gas drainage system performance at Bulli seam Collieries (Black, 2007) found sections of the gas drainage pipe network were adversely impacted by accumulations of water and coal fines. Such accumulations lead to blockages and generally increase system resistance, thereby reducing production capacity. UIS drilling was found to be a significant source of water and coal fines. Although water and fines management had been available at the collar of the borehole, it was found that, due to the design of the drilling pattern, some interaction existed between the boreholes, particularly within the initial ten metres where the boreholes are closely spaced. This interaction allowed drill fluid, along with coal fines, to flow into adjacent boreholes. If connected to the gas drainage system, water/fines would flow directly into the gas reticulation pipe network. Although it is necessary to maintain effective water drop-out systems throughout the gas reticulation pipe network, every effort should be directed toward maintaining boreholes free from accumulations and preventing water/fines entering the network. Where system health is regularly monitored and maintained it was considered reasonable to expect many, if not all, boreholes to produce above 100 000 m3 Given the estimated cost an installed UIS drainage borehole is in the order of $20 000 there is a potentially significant benefit available to the mine operator through increasing the gas production from every gas drainage borehole metre drilled. Improving drainage effectiveness (m3/$) also aids in avoiding potentially significant financial penalty associated with unnecessary drilling expense, production delays and potential loss of reserves, as well as greenhouse gas emission costs.
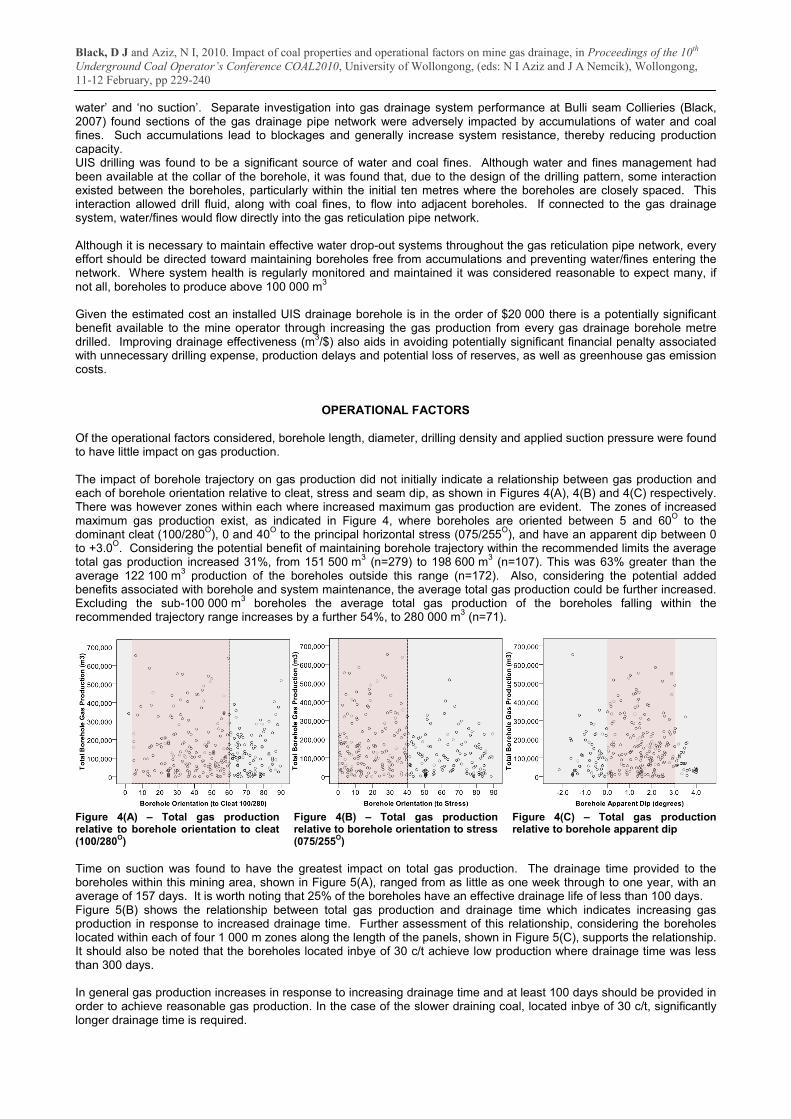
OPERATIONAL FACTORS Of the operational factors considered, borehole length, diameter, drilling density and applied suction pressure were found to have little impact on gas production. The impact of borehole trajectory on gas production did not initially indicate a relationship between gas production and each of borehole orientation relative to cleat, stress and seam dip, as shown in Figures 4(A), 4(B) and 4(C) respectively. There was however zones within each where increased maximum gas production are evident. The zones of increased maximum gas production exist, as indicated in Figure 4, where boreholes are oriented between 5 and 60O to the dominant cleat (100/280O), 0 and 40O to the principal horizontal stress (075/255O), and have an apparent dip between 0 to +3.0O. Considering the potential benefit of maintaining borehole trajectory within the recommended limits the average total gas production increased 31%, from 151 500 m3 (n=279) to 198 600 m3 (n=107). This was 63% greater than the average 122 100 m3 production of the boreholes outside this range (n=172). Also, considering the potential added benefits associated with borehole and system maintenance, the average total gas production could be further increased. Excluding the sub-100 000 m3 boreholes the average total gas production of the boreholes falling within the recommended trajectory range increases by a further 54%, to 280 000 m3 (n=71).
Figure 4(A) – Total gas production relative to borehole orientation to cleat (100/280O)
Figure 4(B) – Total gas production relative to borehole orientation to stress (075/255O)
Figure 4(C) – Total gas production relative to borehole apparent dip
Time on suction was found to have the greatest impact on total gas production. The drainage time provided to the boreholes within this mining area, shown in Figure 5(A), ranged from as little as one week through to one year, with an average of 157 days. It is worth noting that 25% of the boreholes have an effective drainage life of less than 100 days. Figure 5(B) shows the relationship between total gas production and drainage time which indicates increasing gas production in response to increased drainage time. Further assessment of this relationship, considering the boreholes located within each of four 1 000 m zones along the length of the panels, shown in Figure 5(C), supports the relationship. It should also be noted that the boreholes located inbye of 30 c/t achieve low production where drainage time was less than 300 days. In general gas production increases in response to increasing drainage time and at least 100 days should be provided in order to achieve reasonable gas production. In the case of the slower draining coal, located inbye of 30 c/t, significantly longer drainage time is required.

Black, D J and Aziz, N I, 2010. Impact of coal properties and operational factors on mine gas drainage, in Proceedings of the 10th Underground Coal Operator’s Conference COAL2010, University of Wollongong, (eds: N I Aziz and J A Nemcik), Wollongong, 11-12 February, pp 229-240 Therefore in addition to regular monitoring and maintenance of the gas drainage boreholes, and the overall gas drainage system, the mine operator has the ability to improve the effectiveness of the gas drainage program, thereby producing more gas per drilled metre, through controlling borehole trajectory to remain within the identified limits and increasing drainage time, particularly in the case of the slower drainage boreholes located inbye of 30 c/t.
Figure 5(A) – Histogram showing distribution of drainage time
Figure 5(B) – Total gas production relative to drainage time
Figure 5(C) – Total gas production relative to drainage time grouped based on drill site location
COAL PROPERTIES The rank of the coal within the Bulli seam at this mine is classified as medium volatile bituminous, with the indicators of carbon content, volatile matter and vitrinite reflectance ranging in value from 67.3 to 70.8% (69.0% average), 20.1 to 23.5% (21.7% average), and 1.26 to 1.32% (1.29% average) respectively. Figure 6(A) shows increasing gas production corresponding to increasing coal rank. However, the higher rank coal happened to be located at the outbye, most productive area of the mine. Further analysis of the data within the four 1 000 m zones, along the length of the panels, shown in Figure 6(B), adds support to a relationship, albeit weak, between gas production and coal rank.
Figure 6(A) – Total gas production relative to carbon content Figure 6(B) – Total gas production relative to carbon content
grouped based on drill site location Petrographic analysis of 90 coal samples, sourced from within the mining area, was used to determine the distribution of maceral type and mineral matter. The average inertinite content was found to be 55.4%, with the range extending from a low of 47.0%, at the panel entry, to a high of 61.5% at the inbye end of the panel. The mineral matter content was found to be variable throughout the mining area, averaging 3.3%, with a range of 2.4 to 4.6%. No relationship was found between total gas production and mineral matter content. From this analysis coal type is not considered to have a notable impact on gas production within this mining area. Ash analysis of 94 coal samples was conducted at an independent laboratory to determine raw ash, through density separation, and coal ash, through proximate analysis. The raw ash, herein referred to as seam ash, ranged from 10.5 to 14.0%, with an average of 12.2%. The coal ash content was found to range between 8.3 and 10.7%, with an average of 9.7%. In both cases there was evidence of decreasing total gas production in response to increasing ash content. Figure 7(A) shows the relationship between total gas production and coal ash content of the complete data set. Figure 7(B) shows the relationship between total gas production and coal ash content within each of the four cut-through zones along the panels.

Black, D J and Aziz, N I, 2010. Impact of coal properties and operational factors on mine gas drainage, in Proceedings of the 10th Underground Coal Operator’s Conference COAL2010, University of Wollongong, (eds: N I Aziz and J A Nemcik), Wollongong, 11-12 February, pp 229-240 Inherent moisture content data was available from proximate analysis testing on 91 coal samples sourced from within the mining area. The results were used to assess the impact of inherent moisture on the total gas production performance within the area. The average inherent moisture content was 0.9%, with a range of 0.8 to 1.0%. Within the data available no relationship was found to exist between total gas production and inherent moisture content. The average thickness of the Bulli seam within this mining area was found to be 2.6 m, with the range extending from 2.3 to 2.9 m. Figure 8(A) indicates increasing gas production associated with increasing coal seam thickness. However the thicker coal is located at the outbye part of the mining area which has a higher gas production rate. Figure 8(B), shows the gas production and seam thickness within each of four cut-through zones, further supporting the relationship between gas production and coal seam thickness.
Figure 7(A) – Total gas production relative to coal ash content
Figure 7(B) – Total gas production relative to coal ash content grouped based on drill site location
Figure 8(A) – Total gas production relative to coal seam thickness
Figure 8(B) – Total gas production relative to coal seam thickness grouped based on drill site location
Within the mining area the gas composition (CH4:CO2 ratio) spans a broad range, from a low of 13% to a high of 98%, whilst the gas content span a much narrower range, from a low of 7.5 m3/t to a high of 15.5 m3/t. The relationship between gas composition and gas content, Figures 9(A) and 9(B), show the panel entry to be CH4 rich with relatively high gas content, decreasing in both gas content and CH4 composition with distance into the panels.

Black, D J and Aziz, N I, 2010. Impact of coal properties and operational factors on mine gas drainage, in Proceedings of the 10th Underground Coal Operator’s Conference COAL2010, University of Wollongong, (eds: N I Aziz and J A Nemcik), Wollongong, 11-12 February, pp 229-240 Figure 9(A) – Gas content relative to gas composition Figure 9(B) – Gas content relative to gas composition
grouped based on drill site location Figure 10(A) indicates increasing gas production in response to increased gas content. However, as shown in Figure 10(B), the relationship between gas production and gas content, within each of the four cut-through zones, is not particularly strong suggesting other factors may be impacting gas production.
Figure 10(A) – Total gas production relative to gas content Figure 10(B) – Total gas production relative to gas content
grouped based on drill site location Figure 11(A) shows that as the methane gas composition decreases there was a fall in average gas production, with an increase in the number of boreholes achieving very low total gas production. Figure 11(B) shows gas production relative to composition of the coal seam gas within each of the four cut-through zones. The data suggest a relationship between the two variables, independent of location. Further assessment of the data, divided into three groups on the basis of gas composition, found that gas production was again positively impacted by time on suction and to a lesser extent by gas content. Therefore the data suggests that, within this mining area, gas composition has impact on gas production.
Figure 11(A) – Total gas production relative to gas composition
Figure 11(B) – Total gas production relative to gas composition grouped based on drill site location
Consideration was also given to the impact on gas production of total gas in place (GIP), which is the product of gas content, seam thickness, coal density (ρ=1.34) and area drilled, for each of the 34 drill patterns analysed within the mining area. Figure 12(A) shows the strong relationship that exists between total gas production and total GIP for each of the 34 drill sites. From the data shown it has been determined that on average 32% of the total GIP was removed from the coal through gas drainage. Figure 12(B) shows the distribution of gas production relative to GIP within each of the four cut-through zones. The positive relationship between total production and GIP is maintained in each zone along with evidence of the consistent decrease in total gas production with distance into the panels. Figure 12(C) shows the relationship between total production and GIP, grouped on the basis of gas composition. From the data presented, not only can it be seen that gas production increases in response to increasing GIP, within this mining area the more productive CH4 rich zones have much greater total GIP than the CO2 rich zones.

Black, D J and Aziz, N I, 2010. Impact of coal properties and operational factors on mine gas drainage, in Proceedings of the 10th Underground Coal Operator’s Conference COAL2010, University of Wollongong, (eds: N I Aziz and J A Nemcik), Wollongong, 11-12 February, pp 229-240
Figure 12(A) – Total gas production relative to GIP
Figure 12(B) – Total gas production relative to GIP grouped based on drill site location
Figure 12(C) – Total gas production relative to GIP grouped based on seam gas composition
DEGREE OF SATURATION A coal holding the maximum possible amount of gas at current reservoir pressure and temperature conditions is said to be ‘saturated’, whereas a coal holding less than the theoretical maximum is referred to as ‘undersaturated’. The most successful coalbed methane production occurs in fields that are close to fully saturated (Lamarre, 2007). Slightly undersaturated coals behave similar to saturated coals with only a short delay prior to first gas production followed by a steady, strong, rising gas production rate. Deeply undersaturated coals behave quite differently and require extensive dewatering prior to initiation of gas production. In deeply undersaturated coal the critical desorption pressure, which is the pressure at which consistent gas production can be expected, is significantly less than the initial reservoir pressure and requires extensive dewatering prior to initiation of gas production. The result of the long dewatering (depressurising) period is that the peak gas production rate can be significantly less than that of an equivalent saturated coal. Figure 13 shows a typical Bulli seam in situ gas condition and the relative saturation and difference in pressure reduction required to reach the respective critical desorption pressure for both CO2 and CH4 rich seam gas areas.
Figure 13 – Difference in saturation and pressure reduction required to reach the critical desorption point for a typical Bulli seam in situ gas condition in CO2 and CH4 rich areas
In a study of the economic impact of gas saturation on coals in the United States (Seidle and O’Connor, 2007) determined that as coal became less saturated, the gas production profile weakened exhibiting a longer dewatering time and lower peak production rate. Compared to a fully saturated coal, a coal that was 60% undersaturated required five times as long to reach the peak gas production rate and the magnitude was one sixth that of the saturated coal. Gas saturation is therefore an important coal property and its impact on gas production must be considered. The degree of saturation (DoS) used in this analysis represents the ratio of measured to saturated gas content (Equation 1). The measured gas content (Vmeas) is determined using the method described in Australian Standard AS3980:1999. The saturated gas content (Vsat) is calculated using the modified Langmuir equation (Equation 2), which requires prior knowledge of the Langmuir constants of volume (VL) and pressure (PL), determined during gas adsorption testing, and the initial reservoir pressure (Pi), determined through the use of pressure measuring devices, such as piezometers.

Black, D J and Aziz, N I, 2010. Impact of coal properties and operational factors on mine gas drainage, in Proceedings of the 10th Underground Coal Operator’s Conference COAL2010, University of Wollongong, (eds: N I Aziz and J A Nemcik), Wollongong, 11-12 February, pp 229-240
𝐷𝑜𝑆 = 𝑉𝑚𝑒𝑎𝑠𝑉𝑠𝑎𝑡
∙ 100 (%) ……………………………………………………………………………………………(1)
where: DoS = degree of saturation (%) Vmeas = measured gas content (m3/t) Vsat = saturated gas content (m3/t)
𝑉𝑠𝑎𝑡 = 𝑉𝐿 ∙𝑃𝑖
𝑃𝑖+𝑃𝐿 (𝑚3 𝑡⁄ ) ……………………………………………………………………………………....…(2)
where: Vsat = saturated gas content (m3/t) VL = Langmuir volume constant (m3/t) Pi = initial reservoir pressure (kPa) PL = Langmuir pressure constant (kPa)
The Langmuir equation can also be used to determine the critical desorption pressure (Pd) corresponding to a given measured gas content (Equation 3) and therefore the reservoir pressure reduction (Pi – Pd) required to reach the critical desorption point.
𝑃𝑑 = 𝑃𝐿 ∙𝑉𝑚𝑒𝑎𝑠
𝑉𝐿−𝑉𝑚𝑒𝑎𝑠 (𝑘𝑃𝑎) ………………………………………………………………………….……………..(3)
where: Pd = critical desorption pressure (kPa) PL = Langmuir pressure constant (kPa) VL = Langmuir volume constant (m3/t) Vmeas = measured gas content (m3/t)
Piezometers installed into the Bulli seam were used to record seam pressure changes in response to advancing mine working and gas drainage. Data was collected from 18 piezometers over an 11 month period from December 2006 to October 2007 and consolidated to provide a monthly average pressure response for each piezometer location. A contour plot was prepared to show the pressure distribution for each of the 11 months, providing valuable insight into hydrostatic pressure change and impact of both mine workings and gas drainage drilling. Figure 14(A) and 14(B) show the change in hydrostatic pressure over the seven month period, between February 2007 and September 2007, respectively. Of particular significance is the fact that the hydrostatic pressure within the coal seam at the time of roadway development is approximately 1 000 kPa and appears to reduce at a slower rate from the inbye parts of the mine. Using the previous example of CO2 rich coal with an in situ gas content of 10.5 m3/t the critical desorption point was 570 kPa. In this case, where the hydrostatic pressure does not fall below 1 000 kPa during the life of the gas drainage program the reservoir pressure is at least 430 kPa above the critical desorption pressure which impedes gas desorption. The fact that the reservoir pressure exceeds the critical desorption pressure validates the low gas production from the inbye part of the mining area and highlights the need for significantly increased drainage time in these deeply undersaturated areas.
Figure 14(A) – Seam pressure gradient (kPa) relative to advancing mine workings and gas drainage – Feb. 2007
Figure 14(B) – Seam pressure gradient (kPa) relative to advancing mine workings and gas drainage – Sep. 2007
From the hydrostatic pressure contours shown above, it can also be seen that within the drilling range of the UIS gas drainage boreholes the pressure is typically no greater than 2 500 kPa at the time of drilling. This result is consistent with the findings of Marshall et al. (1982), who recorded a maximum gas pressure of 2 670kPa at a distance of 40 m in a

Black, D J and Aziz, N I, 2010. Impact of coal properties and operational factors on mine gas drainage, in Proceedings of the 10th Underground Coal Operator’s Conference COAL2010, University of Wollongong, (eds: N I Aziz and J A Nemcik), Wollongong, 11-12 February, pp 229-240 UIS borehole drilled in the Bulli seam. The gas content measured prior to, or during UIS drilling, within each of three zones along the length of the panels, plotted at an initial reservoir pressure of 2.5 MPa, are shown in Figures 15(A), 15(B) and 15(C). The figures show the decrease in DoS from the slightly undersaturated outbye, CH4 rich zone, through to the deeply undersaturated inbye, CO2 rich zone.
Figure 15(A) – In situ gas condition in slightly undersaturated, CH4 rich outbye zone
Figure 15(B) – In situ gas condition in moderately undersaturated, mixed gas (CH4/CO2) middle zone
Figure 15(C) – In situ gas condition in deeply undersaturated, CO2 rich inbye zone
The relationship between DoS and total gas production from all UIS boreholes in each of the 34 drill sites is shown in Figure 16(A) which indicates a positive relationship. However, given the variable number of UIS boreholes drilled from each drill site, the relationship between total gas production and the unit gas production rate (m3/m), shown in Figure 16(B), was also considered. The results indicate a strong relationship between gas production and DoS.
Figure 16(A) – Total drill site gas production relative to DoS @ 2.5 MPa initial in situ reservoir pressure
Figure 16(B) – Average total UIS borehole gas production relative to DoS @ 2.5 MPa initial in situ reservoir pressure
CONCLUSIONS AND RECOMMENDATIONS This detailed analysis of the relationship between total gas production and various geological properties and operational factors has provided insight into the complex interactions that exist within this mining area. It was found that a significant portion of the UIS drilling effort yields little benefit. Of the 279 boreholes analysed, 124 (45%) achieved less than 100 000 m3 total gas production. A typical operational response to such low production is to drill additional boreholes, often allowing only a short drainage window. At an estimated cost of $20 000 for each installed UIS drainage borehole it makes good sense to improve the gas drainage effectiveness (m3/$) of every metre drilled. Improving drainage effectiveness also aids in avoiding potentially significant financial penalty associated with unnecessary drilling expense, production delays and potential loss of reserves, as well as greenhouse gas emission costs. Gas production was found to positively correlate with coal properties such as rank, ash content and total gas in place, which represents the combination of gas content and volume of coal being drained. However, degree of saturation was found to have the closest and most significant relationship to gas production. Of all the operating factors considered time on suction was shown to have the most significant impact on total gas production. The drainage time ranged from one week to one year with almost 25% of the 279 boreholes analysed having a drainage time of less than 100 days. It has been shown that potentially significant drainage time is required in order for the seam pressure to be reduced to the critical desorption point, particularly in the deeply undersaturated, CO2 rich zones. The nature of UIS drilling requires it to be in close proximity to mining activity which affords quite a short effective drainage window. Where the degree of saturation is less than 50% the drainage time required far exceeds the drainage

Black, D J and Aziz, N I, 2010. Impact of coal properties and operational factors on mine gas drainage, in Proceedings of the 10th Underground Coal Operator’s Conference COAL2010, University of Wollongong, (eds: N I Aziz and J A Nemcik), Wollongong, 11-12 February, pp 229-240 window available through the use of UIS drilling. In such areas supplementary surface-based gas drainage methods should be used and provided upward of five years drainage time rather than five months. Analysis of the factors able to be controlled by the mine operator demonstrated generally low impact on total gas production. However the results suggest that increased production may be achieved through maintaining UIS borehole orientation within an identified ‘optimum’ range. Increased gas production was achieved from boreholes oriented between 5 and 60O to the dominant cleat, 0 and 40O to the principal horizontal stress, and drilled up-dip at an apparent dip between 0 and +3.0O. The 107 boreholes within the assumed optimum range achieved 198 600 m3 average total gas production, 63% greater than the average production of the boreholes outside this range, and 31% greater than the average production of the total dataset. Analysis of applied suction pressure highlighted variability in suction pressure applied to the boreholes throughout their productive life. There was also evidence of a reduction in applied suction pressure with distance into the panel suggestive of increasing resistance. Separate studies attributed the increase in resistance to accumulations of water and coal fines within the boreholes and gas reticulation network. Although not analysed in this study, it is accepted that maintaining system health has a potentially significant impact on gas production capability through avoiding conditions such as, ‘borehole blocked’, ‘borehole full of water’ and ‘no suction’. In order to maintain the efficiency and overall production capacity the gas drainage system should be supported by effective design and ongoing maintenance. Through taking action to eliminate the poor producing boreholes, by way of increased drainage time and maintaining the health of the UIS boreholes and broader gas drainage system, significant gas production improvement can be expected. In this case, the average total gas production of the 155 boreholes whose gas production exceeded 100 000 m3 was 59% greater than the average production of the total dataset. Combining optimum borehole trajectory and increased drainage time with regular monitoring and ongoing maintenance of the UIS borehole and gas reticulation system would further increase the expected gas production. From the boreholes analysed in this study, 71 lie within the optimum trajectory range and achieved above 100 000 m3. The average total gas production achieved by these boreholes was 280 000 m3, 85% greater than the average production of the total dataset.
ACKNOWLEDGEMENTS The authors wish to acknowledge the assistance of Mr. M. Jurak and Miss K. Lennox in preparing the data used in this analysis. The support of the Australian Coal Association Research Program (ACARP), through project C18004, is also acknowledged and appreciated.
REFERENCES Black, D J, 2007, West Cliff gas drainage improvement to access gas CEZ zones – interim report, BHPB Illawarra Coal
Gas & Ventilation, Confidential Report, November 2007. Lamarre, R A, 2007, Downhole geomechanical analysis of critical desorption pressure and gas content for carbonaceous
reservoirs. SPE Annual Technical Workshop on Coalbed Methane, Society of Petroleum Engineers, Durango, Colorado, 27-29 March.
Marshall, P, Lama, R D and Tomlinson, E, 1982, Experiences on pre-drainage of gas at West Cliff colliery, Seam gas
drainage with particular reference to the working seam, Hargraves, A. J. (ed.), University of Wollongong, Wollongong, Australia, pp. 141-156.
Seidle, J P, and O’Connor, L S, 2007, The impact of undersaturation on coal gas economics, SPE Rocky Mountain Oil &
Gas Technology Symposium, Society of Petroleum Engineers, Denver, Colorado 16-18 April. (SPE-107731). Standards Association of Australia (1999) Guide to the determination of gas content of coal – direct desorption method.
Australian Standard AS3980:1999.